Deepwater Horizon Accident Investigation Report
192
Deepwater Horizon Accident Investigation Report September 8, 2010
-
Upload
istanbultek -
Category
Documents
-
view
0 -
download
0
Transcript of Deepwater Horizon Accident Investigation Report

Deepwater Horizon Accident Investigation Report
September 8, 2010
This is the report of an internal BP incident investigation team. The report does not represent
the views of any individual or entity other than the investigation team. The investigation team
has produced the report exclusively for and at the request of BP in accordance with its Terms of
Reference, and any decision to release the report publicly is the responsibility of BP. It has not been
prepared in response to any third party investigation, inquiry or litigation.
In preparing this report, the investigation team did not evaluate evidence against legal standards,
including but not limited to standards regarding causation, liability, intent and the admissibility of
evidence in court or other proceedings.
This report is based on the information available to the investigation team during the investigation;
availability of additional information might have led to other conclusions or altered the team’s
findings and conclusions.
At times, the evidence available to the investigation team was contradictory, unclear or
uncorroborated. The investigation team did not seek to make credibility determinations in such
cases. In evaluating the information available to it, the investigation team used its best judgment
but recognizes that others could reach different conclusions or ascribe different weight to
particular information.
In the course of the investigation, members of the team conducted interviews, and this report
draws upon the team members’ understanding of those interviews. The investigation team did
not record or produce verbatim transcripts of any interviews, nor did the team ask interviewees to
review or endorse the notes taken by the interview team members. There were at least two team
members present during each interview and, in utilizing information gathered from interviews, the
team has taken into account the presence or absence of corroborating or conflicting evidence from
other sources.
The report should be read as a whole, and individual passages should be viewed in the context of
the entire report. Discussion or analysis that is based, to any extent, on work carried out by third
parties—for example, on laboratory or consultant reports commissioned by the investigation team
(refer to the appendices of this report)—is subject to the same qualifications or limitations to which
that work was subject.
Graphics are occasionally used to depict information and scenarios; these may be simplified or
not to scale and are intended only as an aid to the reader in the context of the discussion that
they support.
Wherever appropriate, the report indicates the source or nature of the information on which
analysis has been based or conclusions have been reached. Where such references would be
overly repetitive or might otherwise confuse the presentation, evidentiary references have
been omitted.
Deepwater Horizon Accident Investigation Report
Table of Contents
3
Executive Summary .................................................................................................................... 9
Section 1. Scope of the Investigation ....................................................................................... 13
Section 2. The Macondo Well .................................................................................................. 15
Section 3. Chronology of the Accident ..................................................................................... 21
Section 4. Overview of Deepwater Horizon Accident Analyses ............................................... 31
Section 5. Deepwater Horizon Accident Analyses .................................................................. 49
Analysis 5A. Well Integrity Was Not Established or Failed ................................................. 51
Analysis 5B. Hydrocarbons Entered the Well Undetected and Well Control Was Lost ...... 79
Analysis 5C. Hydrocarbons Ignited on Deepwater Horizon ............................................. 109
Analysis 5D. The Blowout Preventer Did Not Seal the Well .............................................. 141
Section 6. Investigation Recommendations .......................................................................... 181
Section 7. Work that the Investigation Team was Unable to Conduct .................................... 189
Appendices ............................................................................................................................ 191
Table of Contents

4 Deepwater Horizon Accident Investigation Report
Figures and Tables
Figures
Executive Summary
Figure 1. Macondo Well .................................................................................................... 12
Section 2. The Macondo Well
Figure 1. Geographic Location of the Lease and Well ...................................................... 15
Figure 2. Geology, Original Well Design and Installed Depth ............................................ 16
Figure 3. Actual Casing Run .............................................................................................. 19
Section 4. Overview of Deepwater Horizon Accident Analyses
Figure 1. Barriers Breached and the Relationship of Barriers to the Critical Factors ......... 32
Figure 2. Shoe Track Barriers ............................................................................................. 37
Figure 3. Possible Movement of Spacer into the Kill Line ................................................. 40
Figure 4. Hydrocarbons Entering the Riser ....................................................................... 43
Figure 5. Mud Gas Separator ............................................................................................ 45
Section 5. Deepwater Horizon Accident Analyses
Analysis 5A. Well Integrity Was Not Established or Failed
Figure 1. Hydrocarbon Zones and Potential Flow Paths ............................................. 54
Figure 2. Planned Cement Slurry Placement .............................................................. 56
Figure 3. Planned Cement Fluid Locations ................................................................. 61
Figure 4. Shoe Track .................................................................................................... 69
Figure 5. Float Collar Conversion ................................................................................ 71
Figure 6. Long String, Liner and Liner with Tieback .................................................... 75
Analysis 5B. Hydrocarbons Entered the Well Undetected and Well Control Was Lost
Figure 1. Positive-pressure Test (Real-time Data) ........................................................ 83
Figure 2. Spacer Placement ........................................................................................ 84
Figure 3. Possible Movement of Spacer into Kill Line ................................................. 87
Figure 4. April 20, 2010, Negative-pressure Test (Real-time Data) .............................. 88
Figure 5. T ypical Driller’s Display Screen Showing Data Trending Capability and
Mudlogger’s Display Area (not Deepwater Horizon) .................................... 90
Figure 6. Typical Driller’s Cabin on an Offshore Rig Similar to Deepwater Horizon .... 90
Figure 7. Deepwater Horizon Driller’s Cabin circa 2001 .............................................. 91
Figure 8. Flow Indication Graph Showing Anomalies (Real-time Data) ....................... 93
Figure 9. Pressure Increase During the Sheen Test (Real-time Data) .......................... 95
Figure 10. Normal Versus Abnormal Flow Out Signature as Pumps
Shut Off (Real-time Data) ............................................................................ 95
Figure 11. Flow Path Before and After Routing the Spacer Overboard ......................... 96
Figure 12. Typical Video Camera Displays in the Driller’s Cabin
(not Deepwater Horizon) ............................................................................... 97
Figure 13. Mud Pump #2 Pressure Increase at 21:17 Hours (Real-time Data) .............. 98
Figures and Tables
Deepwater Horizon Accident Investigation Report
Figures and Tables
5
Figure 14. OLGA® Well Flow Modeling for Flow Condition with an Open
Annular Preventer ...................................................................................... 100
Figure 15. Investigation of Pressure Responses After Shutting Down
Pumps (Real-time Data) ...............................................................................101
Figure 16. Modeled Pressure Responses Resulting from Hydrostatic Changes
in the Wellbore ........................................................................................... 102
Figure 17. Interpretation of Well Control Response (Real-time Data) .......................... 105
Figure 18. OLGA® Well Flow Modeling Prediction of Cumulative Gain
Excluding Pumped Volumes 20:52 Hours–21:49 Hours .............................. 106
Analysis 5C. Hydrocarbons Ignited on Deepwater Horizon
Figure 1. OLGA® Well Flow Modeling Prediction of Fluid Outflow from the Riser ....113
Figure 2. Simplified Process Flow Diagram of Selected Deepwater Horizon
Surface Equipment .....................................................................................114
Figure 3. Simplified Drawing of the MGS ..................................................................115
Figure 4. OLGA® Well Flow Modeling Prediction of Backpressure and Flow
at the Diverter Packer .................................................................................117
Figure 5. Photograph of 6 in. Vacuum Breaker Line Gooseneck Vent ........................118
Figure 6. Photograph of Starboard Overboard Lines .................................................119
Figure 7. Deepwater Horizon Photograph Showing a Starboard Jet Flame .............. 120
Figure 8. Schematic of Postulated Hydrocarbon Release Locations ......................... 121
Figure 9. Vapor Dispersion at 100 Seconds .............................................................. 122
Figure 10. Vapor Dispersion at 240 Seconds .............................................................. 122
Figure 11. Relevant Surface Equipment Downstream of the IBOP at ~21:47 ............ 123
Figure 12. Drill Pipe Pressure Measured at Cement Pump PI and Mud Pump PI ...... 124
Figure 13. Mud Pump #2 Pressure Plot Showing Line Test During
Negative-pressure Test ............................................................................... 125
Figure 14. Mud Pump #2 Pressure Plot Showing Lift Pressure of PRV ...................... 126
Figure 15. Illustration of Wellbore and Position of Hydrocarbons
at 21:38 Hours if BOP Was Closed ............................................................ 127
Figure 16. Vapor Dispersion Case for Diverting to the Starboard Diverter ................. 128
Figure 17. Hazardous Area Classification—Main Deck ............................................... 130
Figure 18. CGD Locations—Drill Floor and Above ...................................................... 132
Figure 19. CGD Locations—Second Deck .................................................................. 133
Figure 20. CGD Locations—Main Deck ...................................................................... 134
Figure 21. Photograph of Aft Deck of Deepwater Horizon .......................................... 135
Figure 22. Vapor Dispersion Aft Deck—190 Seconds ................................................. 136
Figure 23. Second Deck Damage Vector Diagram ...................................................... 137
Analysis 5D. The Blowout Preventer Did Not Seal the Well
Figure 1. Drill Pipe Pressure—OLGA® Well Flow Modeling of Drill Pipe Pressure
for a Closing BOP Versus Recorded Data .................................................. 144
Figure 2. OLGA® Well Flow Modeling of Wellbore Pressure for
a Leaking and Sealing Annular Preventer ................................................... 145
Figure 3. Finite Element Analysis of an Annular Preventer ....................................... 147
Figure 4. Model Representation of Hydraulic Control for Annular Preventer ............ 148
6 Deepwater Horizon Accident Investigation Report
Figures and Tables
Figure 5. Hydraulic Analyses of an Annular Preventer .............................................. 149
Figure 6. Moon Pool Layout Showing the Location of Blue and Yellow MUX Reels .. 151
Figure 7. Typical Configuration of Flexible Hoses in the Moon Pool ......................... 152
Figure 8. Simplified Schematic of the AMF Control System ..................................... 153
Figure 9. Discharge Curve for a 27-volt AMF Battery Bank ....................................... 155
Figure 10. Shear Pressure Requirement for 5 1/2 in., 21.9 ppf, S-135 Drill Pipe .......... 157
Figure 11. Hydraulic Analyses of BSR Closure Response ........................................... 159
Figure 12. Radiograph Image of ST Lock in Closed Position Taken by ROV
After the Accident ...................................................................................... 161
Figure 13. Likely Status of BOP Rams Immediately After Autoshear Initiation .......... 163
Figure 14. Retrieved Riser Kink Section and Its Contents .......................................... 164
Figure 15. A Schematic of Drill Pipe Configuration Across the BOP Over Time ......... 165
Figure 16. (A) Photograph of Solenoid Valve 103 in the Yellow Pod
(B) Testing of Solenoid Coils ...................................................................... 168
Figure 17. Photograph of a 9-volt AMF Battery Pack ................................................... 168
Figure 18. ROV Video Stills of Leaking Hose Fitting on a Shuttle Valve in
the ST Lock Hydraulic Circuit ..................................................................... 170
Figure 19. Photographs of Deepwater Horizon BOP TCP and Event Logger ...............174
Figure 20. BOP Well Control Modes of Operation ...................................................... 176
Section 6. Investigation Recommendations
Figure 1. Barriers Breached and the Relationships of Barriers to the Critical Factors ..... 181
Tables
Section 5. Deepwater Horizon Accident Analyses
5A. Well Integrity Was Not Established or Failed
Table 1. Halliburton Cement Blend ............................................................................ 57
Table 2. Halliburton Cement Slurry Densities ............................................................ 57
5B. Hydrocarbons Entered the Well Undetected and Well Control Was Lost
Table 1. Information Available Based on Activities Being Conducted ........................ 94
Table 2. Final 9 Minutes Prior to the Explosion ........................................................ 103
5C. Hydrocarbons Ignited on Deepwater Horizon
Table 1. Timeline of Events Leading Up to the Deepwater Horizon Accident ..........111
Table 2. CGDs on Deepwater Horizon ..................................................................... 131

Deepwater Horizon Accident Investigation Report
Appendices
7
Appendix A. Transocean Deepwater Horizon Rig Incident Investigation
Into the Facts and Causation (April 23, 2010).................................................. 193
Appendix B. Acronyms, Abbreviations and Company Names ............................................. 195
Appendix C. Macondo Well Components of Interest ........................................................... 201
Appendix D. Sperry-Sun Real-time Data—Pits ................................................................... 203
Appendix E. Sperry-Sun Real-time Data—Surface Parameters ......................................... 205
Appendix F. Roles and Responsibilities for Macondo Well ................................................ 207
Appendix G. Analysis Determining the Likely Source of In-flow .......................................... 211
Appendix H. Description of the BOP Stack and Control System ........................................ 223
Appendix I. Deepwater Horizon Investigation Fault Trees ........................... (electronic media)
Appendix J. Halliburton Lab Results - #73909/2 .......................................... (electronic media)
Appendix K. Laboratory Analysis of Cementing Operations on the
Deepwater Horizon (from CSI Technologies) ............................ (electronic media)
Appendix L. Reserved
Appendix M. Summary Report Global Analysis of Macondo 9 7/8-in x 7-in
Production Casing 4992 ft Water Depth, GoM (For Macondo
Well Investigation) (from Stress Engineering) ......................... (electronic media)
Appendix N. Mississippi Canyon 252 No.1 (Macondo) Basis of
Design Review ......................................................................... (electronic media)
Appendix O. Industry Comparison Data on Long String Casing and Casing
Liners in the Macondo Well Area ............................................. (electronic media)
Appendix P. BP/Deepwater Horizon Rheliant Displacement Procedure
OSC-G 32306 (M-I SWACO) .................................................... (electronic media)
Appendix Q. Summary of the Effect of Spacer Fluid Composition and
Placement on Negative-pressure Test ...................................... (electronic media)
Appendix R. Fluid Compressibility Calculations ............................................ (electronic media)
Appendix S. First Surface Indications of Well Flow and Pit Gain .................. (electronic media)
Appendices
8 Deepwater Horizon Accident Investigation Report
Appendices
Appendix T. Comparison of Events with Relevant Transocean Well
Control Policies, Practices and Procedures .............................. (electronic media)
Appendix U. Riser Fluid Evacuation to Rig Floor ........................................... (electronic media)
Appendix V. BP Deepwater Horizon GOM Incident Investigation
Dispersion Analysis (from BakerRisk) ...................................... (electronic media)
Appendix W. Report–Dynamic Simulations Deepwater Horizon
Incident BP (from ae add energy) ............................................. (electronic media)
Appendix X. Deepwater Horizon Blue Pod AMF System Batteries .............. (electronic media)
Appendix Y. September 2009–Deepwater Horizon Follow-up Rig Audit ...... (electronic media)
Appendix Z. Hydraulic analyses of BOP control system (from Ultra Deep) .. (electronic media)
Appendix AA. Deepwater Horizon BOP Modifications Since Commissioning . (electronic media)

Deepwater Horizon Accident Investigation Report
Executive Summary
9
On the evening of April 20, 2010, a well control event allowed hydrocarbons to escape from the
Macondo well onto Transocean’s Deepwater Horizon, resulting in explosions and fire on the rig.
Eleven people lost their lives, and 17 others were injured. The fire, which was fed by hydrocarbons
from the well, continued for 36 hours until the rig sank. Hydrocarbons continued to flow from the
reservoir through the wellbore and the blowout preventer (BOP) for 87 days, causing a spill of
national significance.
BP Exploration & Production Inc. was the lease operator of Mississippi Canyon Block 252, which
contains the Macondo well. BP formed an investigation team that was charged with gathering
the facts surrounding the accident, analyzing available information to identify possible causes and
making recommendations to enable prevention of similar accidents in the future.
The BP investigation team began its work immediately in the aftermath of the accident, working
independently from other BP spill response activities and organizations. The ability to gather
information was limited by a scarcity of physical evidence and restricted access to potentially
relevant witnesses. The team had access to partial real-time data from the rig, documents from
various aspects of the Macondo well’s development and construction, witness interviews and
testimony from public hearings. The team used the information that was made available by other
companies, including Transocean, Halliburton and Cameron. Over the course of the investigation,
the team involved over 50 internal and external specialists from a variety of fields: safety,
operations, subsea, drilling, well control, cementing, well flow dynamic modeling, BOP systems
and process hazard analysis.
This report presents an analysis of the events leading up to the accident, eight key findings related
to the causal chain of events and recommendations to enable the prevention of a similar accident.
The investigation team worked separately from any investigation conducted by other companies
involved in the accident, and it did not review its analyses, conclusions or recommendations
with any other company or investigation team. Also, at the time this report was written, other
investigations, such as the U.S. Coast Guard and Bureau of Ocean Energy Management,
Regulation and Enforcement Joint Investigation and the President’s National Commission
were ongoing. While the understanding of this accident will continue to develop with time, the
information in this report can support learning and the prevention of a recurrence.
The accident on April 20, 2010, involved a well integrity failure, followed by a loss of hydrostatic
control of the well. This was followed by a failure to control the flow from the well with the BOP
equipment, which allowed the release and subsequent ignition of hydrocarbons. Ultimately, the
BOP emergency functions failed to seal the well after the initial explosions.
During the course of the investigation, the team used fault tree analysis to define and consider
various scenarios, failure modes and possible contributing factors.
Executive Summary
Execu
tive S
um
mary

10 Deepwater Horizon Accident Investigation Report
Executive Summary
Eight key findings related to the causes of the accident emerged. These findings are briefly
described below. An overview of the team’s analyses and key findings is provided in Section 4.
Overview of Deepwater Horizon Accident Analyses, while Section 5. Deepwater Horizon Accident
Analyses provides the detailed analyses. Refer to Figure 1. Macondo Well, for details of the well.
1 The annulus cement barrier did not isolate the hydrocarbons. The day before the accident,
cement had been pumped down the production casing and up into the wellbore annulus to
prevent hydrocarbons from entering the wellbore from the reservoir. The annulus cement that
was placed across the main hydrocarbon zone was a light, nitrified foam cement slurry. This
annulus cement probably experienced nitrogen breakout and migration, allowing hydrocarbons
to enter the wellbore annulus. The investigation team concluded that there were weaknesses in
cement design and testing, quality assurance and risk assessment.
2 The shoe track barriers did not isolate the hydrocarbons. Having entered the wellbore
annulus, hydrocarbons passed down the wellbore and entered the 9 7/8 in. x 7 in. production
casing through the shoe track, installed in the bottom of the casing. Flow entered into the
casing rather than the casing annulus. For this to happen, both barriers in the shoe track must
have failed to prevent hydrocarbon entry into the production casing. The first barrier was the
cement in the shoe track, and the second was the float collar, a device at the top of the shoe
track designed to prevent fluid ingress into the casing. The investigation team concluded that
hydrocarbon ingress was through the shoe track, rather than through a failure in the production
casing itself or up the wellbore annulus and through the casing hanger seal assembly. The
investigation team has identified potential failure modes that could explain how the shoe track
cement and the float collar allowed hydrocarbon ingress into the production casing.
3 The negative-pressure test was accepted although well integrity had not been established.
Prior to temporarily abandoning the well, a negative-pressure test was conducted to verify the
integrity of the mechanical barriers (the shoe track, production casing and casing hanger seal
assembly). The test involved replacing heavy drilling mud with lighter seawater to place the well
in a controlled underbalanced condition. In retrospect, pressure readings and volume bled at
the time of the negative-pressure test were indications of flow-path communication with the
reservoir, signifying that the integrity of these barriers had not been achieved. The Transocean rig
crew and BP well site leaders reached the incorrect view that the test was successful and that
well integrity had been established.
4 Influx was not recognized until hydrocarbons were in the riser. With the negative-pressure
test having been accepted, the well was returned to an overbalanced condition, preventing
further influx into the wellbore. Later, as part of normal operations to temporarily abandon
the well, heavy drilling mud was again replaced with seawater, underbalancing the well. Over
time, this allowed hydrocarbons to flow up through the production casing and passed the BOP.
Indications of influx with an increase in drill pipe pressure are discernable in real-time data from
approximately 40 minutes before the rig crew took action to control the well. The rig crew’s first
apparent well control actions occurred after hydrocarbons were rapidly flowing to the surface.
The rig crew did not recognize the influx and did not act to control the well until hydrocarbons
had passed through the BOP and into the riser.

Deepwater Horizon Accident Investigation Report
Executive Summary
11
5 Well control response actions failed to regain control of the well. The first well control
actions were to close the BOP and diverter, routing the fluids exiting the riser to the Deepwater
Horizon mud gas separator (MGS) system rather than to the overboard diverter line. If fluids had
been diverted overboard, rather than to the MGS, there may have been more time to respond,
and the consequences of the accident may have been reduced.
6 Diversion to the mud gas separator resulted in gas venting onto the rig. Once diverted to
the MGS, hydrocarbons were vented directly onto the rig through the 12 in. goosenecked vent
exiting the MGS, and other flow-lines also directed gas onto the rig. This increased the potential
for the gas to reach an ignition source. The design of the MGS system allowed diversion of
the riser contents to the MGS vessel although the well was in a high flow condition. This
overwhelmed the MGS system.
7 The fire and gas system did not prevent hydrocarbon ignition. Hydrocarbons migrated
beyond areas on Deepwater Horizon that were electrically classified to areas where the potential
for ignition was higher. The heating, ventilation and air conditioning system probably transferred
a gas-rich mixture into the engine rooms, causing at least one engine to overspeed, creating a
potential source of ignition.
8 The BOP emergency mode did not seal the well. Three methods for operating the BOP in the
emergency mode were unsuccessful in sealing the well.
� The explosions and fire very likely disabled the emergency disconnect sequence, the
primary emergency method available to the rig personnel, which was designed to seal the
wellbore and disconnect the marine riser from the well.
� The condition of critical components in the yellow and blue control pods on the BOP very
likely prevented activation of another emergency method of well control, the automatic
mode function (AMF), which was designed to seal the well without rig personnel
intervention upon loss of hydraulic pressure, electric power and communications from the
rig to the BOP control pods. An examination of the BOP control pods following the accident
revealed that there was a fault in a critical solenoid valve in the yellow control pod and that
the blue control pod AMF batteries had insufficient charge; these faults likely existed at the
time of the accident.
� Remotely operated vehicle intervention to initiate the autoshear function, another
emergency method of operating the BOP, likely resulted in closing the BOP’s blind shear
ram (BSR) 33 hours after the explosions, but the BSR failed to seal the well.
Through a review of rig audit findings and maintenance records, the investigation team found
indications of potential weaknesses in the testing regime and maintenance management system
for the BOP.
The team did not identify any single action or inaction that caused this accident. Rather, a complex
and interlinked series of mechanical failures, human judgments, engineering design, operational
implementation and team interfaces came together to allow the initiation and escalation of the
accident. Multiple companies, work teams and circumstances were involved over time.
Execu
tive S
um
mary

12 Deepwater Horizon Accident Investigation Report
Executive Summary
Figure 1. Macondo Well.
The investigation team developed a series of recommendations to address each of its key findings,
and these recommendations are presented in this report. (Refer to Section 6. Investigation
Recommendations.) The recommendations are intended to enable prevention of similar accidents
in the future, and in some cases, they address issues beyond the causal findings for this accident.
These recommendations cover contractor oversight and assurance, risk assessment, well
monitoring and well control practices, integrity testing practices and BOP system maintenance,
among other issues.
With this report, the investigation team considers the Terms of Reference of this investigation
fulfilled. (Refer to Appendix A. Transocean Deepwater Horizon Rig Incident Investigation Into
Facts and Causation [April 23, 2010].)
Additional physical evidence may become available following the recovery of subsea equipment.
Ongoing activities, investigations and hearings may also provide further insight. BP will consider
how best to examine and respond to further evidence and insights as they emerge.
It may also be appropriate for BP to consider further work to examine potential systemic issues
beyond the immediate cause and system cause scope of this investigation.
Finally, given the complex and interlinked nature of this accident, it may be appropriate to further
consider its broader industry implications.

Deepwater Horizon Accident Investigation Report
Section 1. Scope of the Investigation
13
Secti
on
1
Section 1. Scope of the Investigation
Scope
Within 24 hours of the accident aboard the Transocean Deepwater Horizon, BP Exploration
& Production Inc. requested that an accident investigation team be formed. Mark Bly, BP Group
Head of Safety and Operations, was assigned to lead the investigation team. The investigation
was conducted independently from BP teams managing the ongoing accident response and
regular operations.
The Terms of Reference for the investigation were issued on April 23, 2010. (Refer to Appendix A.
Transocean Deepwater Horizon Rig Incident Investigation Into the Facts and Causation
[April 23, 2010].) Under the Terms of Reference, the investigation team was to analyze the
sequence of pertinent events, the reasons for the initial release of hydrocarbons, the subsequent
explosions and fire, and the efforts to control the flow during and immediately after the accident.
The investigation team was asked to identify critical factors and their underlying causes in order to
make appropriate recommendations.
Over the course of the investigation, the team involved over 50 internal and external specialists
from a variety of fields: safety, operations, subsea, drilling, well control, cementing, wellbore
dynamic modeling, blowout preventer (BOP) systems and process hazard analysis.
The accident investigation focused on the events leading up to the explosions and fire on
April 20, 2010, and on attempts to activate the subsea BOP from April 21–May 5, 2010, using
subsea remotely operated vehicles (ROVs).
The investigation team did not examine other incident management activities, the sinking of the rig
or the spill response.
Investigation Process
To meet its Terms of Reference, the investigation team used BP’s investigation analysis process
in conjunction with fault tree analysis and a chronology. The intent was to identify critical factors
(events or conditions that, if eliminated, could have either prevented the accident or reduced
its severity) and to examine potential causal or contributory factors at the immediate cause
and system cause levels. Based on this work, the team developed recommendations to enable
prevention of similar accidents occurring.

14 Deepwater Horizon Accident Investigation Report
Section 1. Scope of the Investigation
The fault trees developed by the investigation team are included in Appendix I. Deepwater Horizon
Investigation Fault Trees. A fault tree depicts each critical factor and tracks possible causes and
sub-causes across the fault tree from left to right. These lines of inquiry were investigated with the
purpose of substantiating or ruling out each causal hypothesis, and the fault trees refer the reader
to the relevant sections of the report for the investigation team’s analysis and conclusions.
When developing recommendations, the investigation team addressed matters that were
identified in the investigation, whether or not they were considered contributory to the accident.
Sharing Insights
Through the course of the investigation, members of the investigation team briefed internal and
external parties so that information that was pertinent to the ongoing incident management
activities would be available to the response teams. Additionally, the investigation team shared
early insights into its analysis and the possible sequence of events with representatives of the
U.S. government. This report supersedes those early insights. The investigation team hopes that
the information and recommendations in this report will help enable prevention of similar accidents
in the future.

Deepwater Horizon Accident Investigation Report
Section 2. The Macondo Well
15
Secti
on
2
Section 2. The Macondo Well
Lease and Permits
On March 19, 2008, BP acquired the lease to Mississippi Canyon Block 252 in the Central Gulf of
Mexico (GoM) at Minerals Management Service (MMS) lease sale 206. The 10-year lease started on
June 1, 2008. BP (65%), Anadarko Petroleum (25%) and MOEX Offshore (10%) shared ownership
in the lease, with BP as the lease operator. The Macondo well is located in Mississippi Canyon
Block 252.
The MMS approved the exploration plan for the lease on April 6, 2009. MMS approved a revised
exploration plan on April 16, 2009.
An Application for Permit to Drill the Macondo well was approved by MMS on May 22, 2009.
In line with normal practice, several Applications for Permit to Modify were submitted by BP and
approved by MMS throughout the drilling program. These reflected necessary changes to the
Application for Permit to Drill because of the well conditions encountered.
The Macondo well is located approximately 48 miles from the nearest shoreline; 114 miles from
the shipping supply point of Port Fourchon, Louisiana; and 154 miles from the Houma, Louisiana,
helicopter base. (Refer to Figure 1.)
Figure 1. Geographic Location of the Lease and Well.
16 Deepwater Horizon Accident Investigation Report
Section 2. The Macondo Well
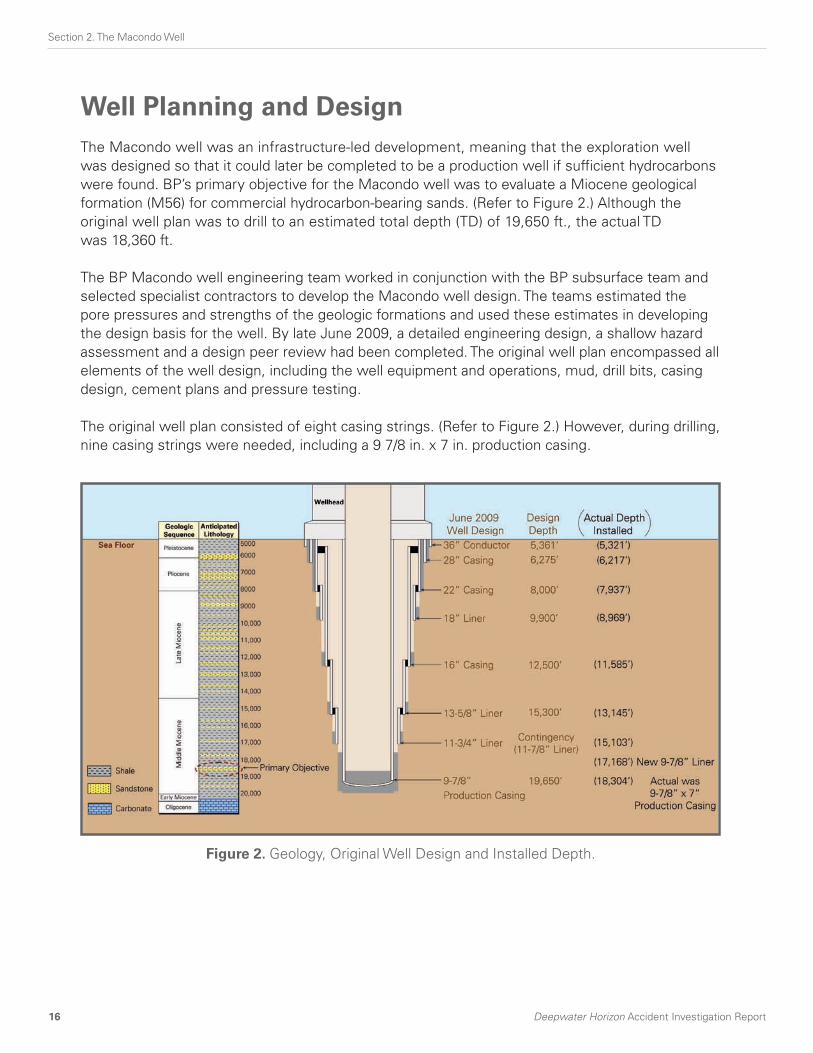
Well Planning and Design
The Macondo well was an infrastructure-led development, meaning that the exploration well
was designed so that it could later be completed to be a production well if sufficient hydrocarbons
were found. BP’s primary objective for the Macondo well was to evaluate a Miocene geological
formation (M56) for commercial hydrocarbon-bearing sands. (Refer to Figure 2.) Although the
original well plan was to drill to an estimated total depth (TD) of 19,650 ft., the actual TD
was 18,360 ft.
The BP Macondo well engineering team worked in conjunction with the BP subsurface team and
selected specialist contractors to develop the Macondo well design. The teams estimated the
pore pressures and strengths of the geologic formations and used these estimates in developing
the design basis for the well. By late June 2009, a detailed engineering design, a shallow hazard
assessment and a design peer review had been completed. The original well plan encompassed all
elements of the well design, including the well equipment and operations, mud, drill bits, casing
design, cement plans and pressure testing.
The original well plan consisted of eight casing strings. (Refer to Figure 2.) However, during drilling,
nine casing strings were needed, including a 9 7/8 in. x 7 in. production casing.
Figure 2. Geology, Original Well Design and Installed Depth.

Deepwater Horizon Accident Investigation Report
Section 2. The Macondo Well
17
Secti
on
2
Drilling Operations Summary
Initial drilling of the Macondo well began with Transocean’s semi-submersible Marianas on
October 6, 2009, and continued until November 8, 2009, when Marianas was secured and
evacuated for Hurricane Ida. Marianas was subsequently de-moored and removed due to
hurricane damage that required dock repairs. After the repairs, the rig went off contract.
Deepwater Horizon was owned and operated by Transocean and had been under contract to BP
in the GoM for approximately 9 years. During this time, it had drilled approximately 30 wells,
two-thirds of which were exploration wells. The rig was chosen to finish the Macondo well after
completing its previous project (the Kodiak appraisal well).
The MMS approved an Application for Revised New Well on January 14, 2010, and the Macondo
well plan was updated to reflect the replacement of Marianas with Deepwater Horizon.
On January 31, 2010, Deepwater Horizon arrived onsite. Drilling activities recommenced on
February 6, 2010.
As is typical of exploratory wells in the GoM, throughout the drilling process the well encountered
pore pressures and fracture gradients that differed from the design basis. This resulted in changes
to the mud weights and well casing setting depths as compared with the original design.
Deepwater Horizon drilled out the 18 in. liner, and a 16 1/2 in. x 20 in. hole section was drilled to
12,350 ft., with indications of increasing pore pressure. A lost circulation zone was encountered,
but this was remedied with lost circulation materials (LCM). The subsequent attempt to return to
the previous depth of 12,350 ft. was problematic. A 16 in. casing was installed at a depth of
11,585 ft., which was approximately 915 ft. shallower than originally planned.
After running and cementing the 16 in. casing, the drilling of the 14 3/4 in. x 16 in. hole section
commenced on March 7, 2010. On March 8, 2010, a well control event occurred that resulted in
the drill pipe becoming stuck. The drill pipe could not be freed, and the lower part of the wellbore
was abandoned. (Refer to Analysis 5B. Hydrocarbons Entered the Well Undetected and Well
Control Was Lost of this report.)
A revised casing design was prepared to address the high formation pressure that had led to the
well control event. A 9 7/8 in. drilling liner was added to reach the well’s primary objective
sands, and the production casing was changed from a 9 7/8 in. long string to a combination
9 7/8 in. x 7 in. long string. The MMS approved the revised well design.
The subsequent drilling bypassed the abandoned wellbore, and the 13 5/8 in. liner was run and
cemented in place at 13,145 ft. The contingency 11 7/8 in. liner was set at 15,103 ft., and the new
9 7/8 in. liner was set at 17,168 ft. (Refer to Figure 3.)
Drilling of the final 8 1/2 in. x 9 7/8 in. hole section started on April 2, 2010, and continued until
April 4, 2010, when the well encountered lost circulation at 18,260 ft. Lost circulation pills were
pumped to the bottom of the wellbore, and the mud weight was reduced from 14.3 ppg to
14.17 ppg. This solved the lost circulation problems. Full circulation was regained on April 7, 2010,
and on April 9, 2010, the well was drilled to a final depth of 18,360 ft.

18 Deepwater Horizon Accident Investigation Report
Section 2. The Macondo Well
Upon reaching final well depth, five days were spent logging the well to evaluate the reservoir
intervals. After the logging was complete, a cleanout trip was conducted to condition the wellbore
and verify that the open hole section was in good condition. Part of this procedure included
circulating bottoms up to verify that no gas was entrained in the mud. Upon achieving bottoms up,
no appreciable volumes of gas were recorded, indicating that the well was stable.
On April 16, 2010, the MMS approved the procedure for temporary abandonment of the well.
At the time of the accident, the 9 7/8 in. x 7 in. production casing had been run and cemented in
place at 18,304 ft., and pressure testing had been completed. (Refer to Figure 3.) The rig crew
was preparing for the final activities associated with temporary well abandonment when the
accident occurred.

Deepwater Horizon Accident Investigation Report
Section 2. The Macondo Well
19
Secti
on
2
Figure 3. Actual Casing Run.

20 Deepwater Horizon Accident Investigation Report

Deepwater Horizon Accident Investigation Report
Section 3. Chronology of the Accident
21
Se
cti
on
3
The chronology of events in the hours leading up to and including the Deepwater Horizon accident
are presented here as a factual timeline to allow a straightforward description of events as
they unfolded.
The major activity sets covered in this timeline include:
� Events Prior to April 19, 2010.
� Final Casing Run.
� Cement Job.
� Positive-pressure and Negative-pressure Tests.
� Well Monitoring and Simultaneous Operations.
� Well Control Response.
� Explosion and Fire.
� BOP Emergency Operations.
The investigation team consulted the following primary sources to construct this chronology
of events:
� Real-time data: real-time data transmissions from the Sperry-Sun logging system.
� OpenWells®: BP’s daily reporting system entitled OpenWells® Drilling Morning Report.
� Interviews: witness accounts collected by the investigation team.
� Marine Board Investigation (MBI) testimony: testimony given during the MBI hearings on
May 26–29 and July 19–23, 2010.
� Deepwater Horizon piping and instrumentation diagrams (P&IDs).
� Incident management team (IMT) reports: records from BP’s accident response effort.
� OLGA® well flow modeling: transient multiphase well flow simulations run by third party experts
on behalf of the investigation team.
� Unified Command: the unified command of the Deepwater Horizon accident response.
� Other sources as noted.
In the chronology, conclusions reached by the investigation team as a result of modeling or
calculations are shown in italics within brackets.
Section 3. Chronology of the Accident

22 Deepwater Horizon Accident Investigation Report
Section 3. Chronology of the Accident
Date Time Description Source
2009
October 6
Spudded Macondo well with Transocean’s
Marianas.OpenWells®
November 8–27
Pulled riser and evacuated Marianas for Hurricane
Ida. Marianas subsequently damaged and moved to
safe harbor for repairs.
OpenWells®
2010
January 31–
February 6
Transocean’s Deepwater Horizon on location to
replace Marianas.
Six days of pre-job maintenance and testing of
blowout preventer (BOP) followed.
Drilling activities recommenced on February 6.
OpenWells®
February 23–
March 13
Pilot valve leak of 1 gpm noticed on yellow pod of
BOP; leak reduced after switching to blue pod.OpenWells®
March 8Well control event at 13,305 ft. Pipe stuck; severed
pipe at 12,146 ft.OpenWells®
March 12–22
Contingency liner utilized, a new drilling liner was
added and production casing changed to a
9 7/8 in. x 7 in. long string.
Minerals Management Service (MMS) approved
changes.
Macondo well plan
MMS applications
April 5–6
Stripped drill pipe through upper annular preventer
from 17,146 ft. to 14,937 ft. while addressing
wellbore losses.
OpenWells®
April 9–14
Total depth of 18,360 ft. reached and data
collected for five days. Reservoir sands contained
hydrocarbons at pressures of approximately
11,850 psi.
OpenWells®
April 14
Halliburton OptiCem™ cement model review
concluded zonal isolation objectives could be
met using 9 7/8 in. x 7 in. long string as
production casing.
Halliburton
9 7/8 in. x 7 in.
Production Casing
Design Report
April 15
OptiCem™ model updated with open hole caliper
and survey data. Input included 21 centralizers and
70% standoff above the top centralizer.
Company emails
April 15Decision made to order 15 additional centralizers.
Order placed.Company emails
April 16 11:51Fifteen slip-on bow spring centralizers delivered to
rig by helicopter.OpenWells®
Events Prior to April 19, 2010

Deepwater Horizon Accident Investigation Report
Section 3. Chronology of the Accident
23
Se
cti
on
3
Date Time Description Source
April 19 13:30
Completed final (production) casing run to 18,304 ft.
(job took 37 hours). The shoe track included a
Weatherford float collar installed at the top and a
reamer shoe at the bottom.
OpenWells®
April 1914:30–
16:20
Nine attempts made to establish circulation.
Circulation established with 3,142 psi.
OpenWells®
Real-time data
April 1916:20–
19:30
Circulation pressure of 340 psi did not match
modeling results of 570 psi.OpenWells®
Date Time Description Source
April 19–2019:30–
00:36
Cement job pumped as planned with full fluid
returns observed. Bottom plug burst disk ruptured
at higher-than-planned pressure, 2,900 psi.
Cement job completed; bumped top wiper plug at
00:36 hours.
OpenWells®
Real-time data
April 20 00:40
Bled off 5 bbls of fluid to reduce drill pipe pressure
from 1,150 psi to 0 psi. No flow observed after
bleeding 5 bbls.
Real-time data
OpenWells®
April 2000:40–
07:00
Dril-Quip seal assembly installed in subsea
wellhead. Two pressure tests successfully
completed. Drill pipe pulled out of riser.
Real-time data
OpenWells®
Interviews
April 20 ~07:30
BP and service providers discussed running cement
bond log (CBL) during morning operations call.
Decision made, in accordance with pre-established
BP Macondo well team decision tree, not to run CBL.
Interviews
(continued)
Date Time Description Source
April 1612:48–
12:53
Mechanical integrity concerns regarding the bow
spring centralizers. Decision made not to run bow
spring centralizers.
Company emails
Interviews
April 18 20:58
Partial lab test results, a new OptiCem™ model
report (using seven inline centralizers) and
Halliburton’s cementing recommended procedure
for the Macondo well cement job were provided to
BP and Halliburton staff.
[Complete lab test results on planned slurry design
not provided to BP before job was pumped.]
Email from
Halliburton in-
house cementing
engineer to BP and
Halliburton staff
Final Casing Run
Cement Job

24 Deepwater Horizon Accident Investigation Report
Section 3. Chronology of the Accident
Date Time Description Source
April 2010:55–
12:00
Successful positive-pressure test of the production
casing.
Real-time data
Interviews
April 2012:00–
15:04
Drill pipe run in hole to 8,367 ft. Displacement procedure
reviewed in preparation for mud displacement and
negative-pressure test.
At 13:28 hours, Deepwater Horizon started offloading
mud to M/V Damon Bankston.
Mudlogger told assistant driller that pit levels could
not be monitored during offloading. Assistant driller
told mudlogger that notice would be provided when
offloading to M/V Damon Bankston ceased.
Real-time data
M/V Damon
Bankston log
Interviews
April 2015:04–
15:56
Seawater pumped into boost, choke and kill lines to
displace mud. 1,200 psi left trapped in the kill line (i.e.,
not bled off).
Real-time data
April 2015:56–
16:53
A total of 424 bbls of 16 ppg spacer followed by
30 bbls of freshwater pumped into well. Displacement
completed with 352 bbls of seawater, placing the spacer
12 ft. above the BOP.
[From ~16:00 hours–17:50 hours, trip tank was being
cleaned. Recorded flow data unreliable during this period.]
Real-time data
M-I SWACO
displacement
procedure
April 20 16:54
Upon shutting down pumps, drill pipe pressure was at
2,325 psi. Pressure in kill line remained at 1,200 psi.
An annular preventer was closed for the negative-
pressure test.
Real-time data
Interviews
April 2016:54–
16:56
Drill pipe pressure bled from 2,325 psi down to 1,220 psi
in order to equalize with the 1,200 psi on the kill line.Real-time data
April 2016:57–
16:59
Kill line opened and pressure decreased to 645 psi; drill
pipe pressure increased to 1,350 psi.
Attempt made to bleed system down to 0 psi. Drill
pipe pressure decreased to 273 psi. Kill line pressure
decreased to 0 psi. Kill line shut in.
Real-time data
Interviews
April 2016:59–
17:08
At 16:59 hours, drill pipe pressure increased from 273 psi
to 1,250 psi in 6 minutes.
Annular preventer closing pressure was increased from
1,500 psi to 1,900 psi to create a seal.
The riser was topped up with approximately 50 bbls of
mud from the trip tank to replace the volume bled off
through the drill pipe.
[Spacer fluid was then across the BOP.]
Real-time data
MBI testimony
Positive-pressure and Negative-pressure Tests

Deepwater Horizon Accident Investigation Report
Section 3. Chronology of the Accident
25
Se
cti
on
3
(continued)
Date Time Description Source
April 2017:08–
17:27Drill pipe pressure decreased from 1,250 psi to 1,205 psi. Real-time data
April 20 17:17Mud offloading from Deepwater Horizon mud pits to
M/V Damon Bankston ceased. Mudlogger not notified.
M/V Damon
Bankston log
Interviews
April 2017:27–
17:52
Drill pipe pressure reduced from 1,205 psi to 0 psi by
bleeding off 15 bbls to 23 bbls of fluid to the cement unit.
Rig crew and well site leader discussed negative-
pressure test procedure. Well site leader stated the
negative-pressure test needed to be done on the kill line
in accordance with the BP plan submitted to MMS.
Real-time data Interviews
April 2017:52–
18:00
Kill line opened to the cement unit.
Cementer bled off 3 bbls to 15 bbls of seawater.
A witness reported continuous flow from the kill line
that spurted and was still flowing when instructed to
shut in the line.
Real-time data
Interviews
April 2018:00–
18:35
Drill pipe pressure gradually increased to 1,400 psi
over 35 minutes. Build profile showed distinct pressure
fluctuations at fairly uniform intervals.
Real-time data
April 2018:35–
19:55
Discussion ensued about pressure anomalies and
negative-pressure test procedure.
Seawater pumped into the kill line to confirm it was full.
Opened kill line and bled 0.2 bbl to mini trip tank; flow
stopped. Kill line opened and monitored for 30 minutes
with no flow.
At 19:55 hours, the negative-pressure test was
concluded and considered a good test.
Real-time data Interviews
Well Monitoring and Simultaneous Operations
Date Time Description Source
April 20 20:00
Internal blowout preventer (IBOP) and annular
preventer opened and pumping of seawater
commenced down the drill pipe to displace mud and
spacer from the riser.
Real-time data
April 20 20:50 Pumps slowed for the spacer arriving at surface. Real-time data
April 20 ~20:52[Calculated that the well went underbalanced and
started to flow.]OLGA® model

26 Deepwater Horizon Accident Investigation Report
Section 3. Chronology of the Accident
(continued)
Date Time Description Source
April 2020:58-
21:08
Flow out from the well increased.
Trip tank was emptied into the flow-line at this time.
[Taking into account the emptying of the trip tank,
calculated a gain of approximately 39 bbls over
this period.]
Real-time data
Calculations
April 2021:01–
21:08
Drill pipe pressure increased from 1,250 psi to
1,350 psi at constant pump rate.Real-time data
April 20 21:08
Spacer observed at surface.
Pumps shut down to enable sheen test to
be conducted.
Real-time data Interviews
April 2021:08–
21:14
With pumps off, drill pipe pressure increased from
1,017 psi to 1,263 psi in 5 1/2 minutes.
Overboard dump line opened during sheen test;
Sperry-Sun flow meter bypassed.
Successful result from visual sheen test indicated that
fluids could be discharged overboard.
[OLGA® well flow modeling calculated that in-flow to
the well during this period was approximately
9 bbls/min.]
Real-time data
Interviews Deepwater
Horizon P&IDs
OLGA® model
April 2021:14–
21:31
Pumps restarted to continue displacement.
Displaced well fluids discharged overboard. Drill pipe pressure on continually increasing trend.
Real-time data
Interviews
April 20 21:17
Pump #2 started and pressure spiked to 6,000 psi.
[Inferred that the pump likely started against a closed
valve and the pressure lifted the relief valve.]
Real-time data
MBI testimony
April 20 21:18Pumps #2, #3 and #4 were shut down. Pump #1
stayed online (boost line).Real-time data
April 20~ 21:18–
21:20Toolpusher was called to rig floor. Interviews
April 20 ~21:20Assistant driller was called to either the pit room or
the pump room.
Interviews
MBI testimony
April 20 ~21:20
Senior toolpusher called toolpusher and asked how
the negative-pressure test had gone. Toolpusher
responded that the test result was “good,” and the
displacement was “going fine.”
MBI testimony
April 2021:20–
21:27
Pumps #3 and #4 restarted. Some pressure started to
build on pump #2, reaching 800 psi at 21:27 hours.Real-time data

Deepwater Horizon Accident Investigation Report
Section 3. Chronology of the Accident
27
Se
cti
on
3
(continued)
Date Time Description Source
April 2021:26–
21:30
Drill pipe pressure declined by 400 psi at constant
pump rate.Real-time data
April 20 21:30[Calculated that the spacer was fully displaced from
the riser.]
Real-time data
OLGA® model
Well Control Response
Date Time Description Source
April 20 21:31Pumps shut down; first pumps #3 and #4, then #1
(boost pump).Real-time data
April 2021:31–
21:34
Drill pipe pressure increased from 1,210 psi to
1,766 psi.
~21:33 hours, chief mate observed toolpusher and
driller discussing “differential pressure.” Toolpusher
told chief mate that cement job may be delayed.
Real-time data
MBI testimony
April 2021:36–
21:38
Over a 90-second period, drill pipe pressure
decreased from 1,782 psi to 714 psi and then
increased from 714 psi to 1,353 psi.
[Inferred to have been caused by opening and
closing a 4 in. valve on the standpipe manifold.]
Real-time data
OLGA® model
April 20 21:38[Calculated that at approximately 21:38,
hydrocarbons passed from well into riser.]OLGA® model
April 2021:38–
21:42
Drill pipe pressure held briefly, then decreased
steadily from 1,400 psi to 338 psi.Real-time data
April 20~ 21:40–
21:48
Chief electrician de-isolated pump #2.
Chief electrician observed four personnel (including
the assistant driller) completing repair of the
pressure relief valve on pump #2 at the time he left
the area (~21:48 hours).
MBI testimony

28 Deepwater Horizon Accident Investigation Report
Section 3. Chronology of the Accident
(continued)
Date Time Description Source
April 2021:40–
21:48
~21:40 hours—Mud overflowed the flow-line and
onto rig floor.
~21:41 hours—Mud shot up through derrick.
~21:41 hours—Diverter closed and flow routed to
mud gas separator (MGS); BOP activated (believed
to be lower annular preventer).
[Drill pipe pressure started increasing in response
to BOP activation.]
~21:42 hours—M/V Damon Bankston was advised
by Deepwater Horizon bridge to stand off 500 m
because of a problem with the well. The ship began
to move away.
~21:42 hours—Drill pipe pressure increased steadily
from 338 psi to 1,200 psi over 5-minute period.
~21:44 hours—Mud and water exited MGS vents;
mud rained down on rig and M/V Damon Bankston
as it pulled away from rig.
~21:44 hours—Toolpusher called well site leader
and stated they were “getting mud back” and
that they had “diverted to the mud gas separator”
and had either closed or were closing the annular
preventer.
~21:45 hours—Assistant driller called the senior
toolpusher to report that “The well is blowing
out . . . [the toolpusher] is shutting it in now.”
~21:46 hours—Gas hissing noise heard and
high-pressure gas discharged from MGS vents
towards deck.
~21:47 hours—First gas alarm sounded. Gas rapidly
dispersed, setting off other gas alarms.
~21:47 hours—Roaring noise heard and vibration felt.
~21:47 hours—Drill pipe pressure started rapidly
increasing from 1,200 psi to 5,730 psi.
[This is thought to have been the BOP sealing
around pipe. Possible activation of variable bore
rams [VBRs] at 21:46 hours.]
~21:48 hours—Main power generation
engines started going into overspeed (#3 and #6
were online).
Real-time data
Interviews
MBI testimony

Deepwater Horizon Accident Investigation Report
Section 3. Chronology of the Accident
29
Se
cti
on
3
Explosion and Fire
BOP Emergency Operations
Date Time Description Source
April 20 21:49
Rig power lost. Sperry-Sun real-time data
transmission lost.
First explosion occurred an estimated 5 seconds
after power loss.
Second explosion occurred an estimated
10 seconds after first explosion.
Real-time data
Interviews
MBI testimony
April 20 21:52:57 Mayday call made by Deepwater Horizon.M/V Damon
Bankston log
April 20~ 21:52–
21:57
Subsea supervisor attempted to activate
emergency disconnect sequence (EDS) for the BOP
at the panel on the bridge. Lights changed on panel,
but no flow was observed on the flow meter.
Lower marine riser package did not unlatch.
Deepwater Horizon master announced the
activation of the EDS at 21:56.
MBI testimony
Interviews
April 20~ 22:00–
23:22
Transfer of 115 personnel, including 17 injured, to
M/V Damon Bankston.
11 people were determined to be missing, and
search and rescue activities ensued.
U.S. Coast Guard arrived on-site at 23:22 hours.
MBI testimony
April 22 10:22 Deepwater Horizon sank. Unified Command
April 23 17:00 The search for the 11 missing people was suspended. Unified Command
Date Time Description Source
April 21–2218:00–
01:15
Remotely operated vehicle (ROV) operations
were initiated.
ROV attempted hot stab interventions to close
VBRs and blind shear rams (BSRs); ROV attempts
were ineffective.
IMT reports
April 22 ~02:45ROV simulated automatic mode function AMF in an
attempt to activate BSR. Well continued to flow.IMT reports
April 22 ~07:40
On the third attempt, ROV activated autoshear
function. (BSR thought to have closed.)
Well continued to flow.
IMT reports
April 25–May 5
Seventeen further attempts by ROVs using subsea
accumulators to close various BOP rams and
annular preventers. Well continued to flow.
IMT reports

30 Deepwater Horizon Accident Investigation Report

Deepwater Horizon Accident Investigation Report
Section 4. Overview of Deepwater Horizon Accident Analyses
31
Secti
on
4
Section 4. Overview of Deepwater Horizon Accident Analyses
Introduction
This section provides an overview of the detailed analyses undertaken by the investigation team.
The investigation team considers the findings and conclusions from the detailed analyses a strong
foundation for the recommendations in Section 6. Investigation Recommendations of this report.
A complex and interlinked series of mechanical failures, human judgments, engineering design,
operational implementation and team interactions came together to allow the initiation and
escalation of the Deepwater Horizon accident. Multiple companies, work teams and circumstances
were involved over time.
The investigation pursued four primary lines of inquiry, based on the initial review of the accident
events. For the accident and its aftermath to have occurred, the following critical factors had to
have been in place:
� Well integrity was not established or failed.
� Hydrocarbons entered the well undetected and well control was lost.
� Hydrocarbons ignited on Deepwater Horizon.
� The blowout preventer (BOP) did not seal the well.
The investigation of this complex accident became four linked investigations into the facts and
causes underlying these critical factors. (Refer to Section 5. Deepwater Horizon Accident Analyses
of this report.) Using fault tree analysis, various scenarios, failure modes and possible contributing
factors were considered. Eight key findings emerged:
1. The annulus cement barrier did not isolate the hydrocarbons.
2. The shoe track barriers did not isolate the hydrocarbons.
3. The negative-pressure test was accepted although well integrity had not been established.
4. Influx was not recognized until hydrocarbons were in the riser.
5. Well control response actions failed to regain control of the well.
6. Diversion to the mud gas separator resulted in gas venting onto the rig.
7. The fire and gas system did not prevent hydrocarbon ignition.
8. The BOP emergency mode did not seal the well.

32 Deepwater Horizon Accident Investigation Report
Section 4. Overview of Deepwater Horizon Accident Analyses
In Figure 1, the eight blocks represent the defensive physical or operational barriers that were
in place to eliminate or mitigate hazards. The holes represent failures or vulnerabilities in the
defensive barriers. The eight key findings are represented by the holes that lined up to enable the
accident to occur.
If any of the critical factors had been eliminated, the outcome of Deepwater Horizon events on
April 20, 2010, could have been either prevented or reduced in severity. Section 5. Deepwater
Horizon Accident Analyses of this report documents the investigation team’s analysis and
conclusions regarding each key finding or barrier breach.
Background
Deepwater Horizon, which was built in 2001, was a fifth generation, dynamically-positioned
semi-submersible drilling unit. The unit employed an automated drilling system and a
15,000 psi-rated BOP system and had operated in water depths (WD) greater than 9,000 ft.
The rig had drilled wells up to 35,055 ft. in the nine years it had been owned and operated by
Transocean under contract to BP in the deepwater Gulf of Mexico.
The Macondo well was an exploration well in Mississippi Canyon Block 252 in 4,992 ft. WD.
The well had been drilled to 18,360 ft. from its last casing point at 17,168 ft. The well penetrated
a hydrocarbon-bearing Miocene reservoir and was deemed a commercial discovery. The decision
was made to temporarily abandon the Macondo well and complete it as a production well in
the future.
BO
P E
me
rge
ncy
Op
era
tio
n
Pre
ssu
re
Inte
gri
ty T
esti
ng
We
ll M
on
ito
rin
g
We
ll C
on
tro
l R
esp
on
se
Hy
dro
ca
rbo
n S
urf
ace
Co
nta
inm
en
t
Fir
e a
nd
Ga
s S
yste
m
An
nu
lus C
em
en
t
Me
ch
an
ica
l B
arr
iers
Well Integrity
Was Not
Established or
Failed
Critical Factor Critical Factor Critical FactorCritical Factor
Hydrocarbons Entered the
Well Undetected and Well
Control Was Lost
Hydrocarbons
Ignited on
Deepwater
Horizon
Blowout Preventer
Did Not Seal the Well
FIRE
AND
SPILL
EXPLOSION
AND FIRE
Adapted from James Reason (Hampshire: Ashgate Publishing Limited, 1997).
Figure 1. Barriers Breached and the Relationship of Barriers to the Critical Factors.

Deepwater Horizon Accident Investigation Report
Section 4. Overview of Deepwater Horizon Accident Analyses
33
Secti
on
4
At the time of the accident, the final string of casing had been run into the well, and the cement
barrier had been put in place to isolate the hydrocarbon zones. Integrity tests had been conducted,
and the top 8,367 ft. of mud was being circulated out using seawater in preparation for temporary
abandonment of the well. The remaining steps were to set a cement plug in the casing and to
install a lockdown sleeve on the casing hanger seal assembly prior to disconnecting the BOP and
suspending the well.
For the purposes of this report, the BP Macondo well team refers to BP’s Houston-based wells
team that worked on the Macondo well, excluding BP’s cementing services provider (Halliburton)
and also excluding the BP well site leaders aboard Deepwater Horizon.
The rig crew describes Transocean’s rig crew leaders who were aboard Deepwater Horizon (senior
toolpusher, toolpushers, drillers and assistant drillers) collectively, or to the individuals in one or
more of these roles, and includes personnel acting at their direction. References to the BP well
site leaders are to the day and night well site leaders who were aboard Deepwater Horizon.
References to mudloggers are the Halliburton Sperry-Sun mudloggers who were aboard
Deepwater Horizon. M-I SWACO provided the mud engineers.
Key Finding 1. The annulus cement barrier did not isolate the hydrocarbons.
The annulus cement barrier failed to prevent hydrocarbons from migrating into the wellbore.
The investigation team’s analysis identified a probable technical explanation for the failure.
Interactions between BP and Halliburton and shortcomings in the planning, design, execution
and confirmation of the cement job reduced the prospects for a successful cement job.
A 9 7/8 in. liner was set in place at 17,168 ft. prior to drilling the production section of the well
to a total depth of 18,360 ft. This last hole section was difficult to drill due to a reduction in
fracture gradient at the bottom of the wellbore. This condition required selecting the correct
mud weight to maintain overbalance on the formation while avoiding fluid losses to the well.
Considering the narrow margin between pore pressure and fracture gradient, a number of
different options were evaluated prior to selecting the design for the production casing string,
cement formulation and placement plan.
The investigation team reviewed the decision to install a 9 7/8 in. x 7 in. long string production
casing rather than a 7 in. production liner, which would have been tied back to the wellhead
later, and concluded that both options provided a sound basis of design.
The investigation team found no indication that hydrocarbons entered the wellbore prior to or
during the cement job. To determine how the hydrocarbons entered the well after the
cement job, the investigation team assessed the cement slurry design, cement placement
and confirmation of the placement.

34 Deepwater Horizon Accident Investigation Report
Section 4. Overview of Deepwater Horizon Accident Analyses
Cement Slurry Design
Due to the narrow margin between pore pressure and fracture gradient, the accuracy of
cement placement was critical. Several design iterations were conducted by Halliburton using
the OptiCem™ wellbore simulation application to establish an acceptable slurry design and
placement plan. A complex design for the cement job with base oil spacer, cementing spacer,
lead (cap) cement, foam cement and tail cement, was recommended and implemented.
The Halliburton and the BP Macondo well team’s technical reviews of the cement slurry design
appeared to be focused primarily on achieving an acceptable equivalent circulating density
during cement placement to prevent lost returns. Other important aspects of the foam cement
design, such as foam stability, possible contamination effects and fluid loss potential did not
appear to have been critically assessed in the pre-job reviews.
The evidence reviewed suggests that the cement slurry was not fully tested prior to
the execution of the cement job. The investigation team was unable to confirm that a
comprehensive testing program was conducted. The test results reviewed by the investigation
team indicated that only limited cement testing such as thickening time, foam density,
mixability and ultrasonic compressive strength, was performed on the slurry used in the
Macondo well. The tests reviewed did not include fluid loss, free water, foam/spacer/mud
compatibility, static gel strength transition time, zero gel time or settlement.
To evaluate the effectiveness of the Halliburton cement slurry design that was used, the
investigation team requested a third party cementing lab, CSI Technologies, to conduct a series
of tests. To test the cement slurry design, a representative slurry was formulated to match, as
closely as possible, the actual slurry used for the Macondo well (the investigation team did not
have access to the actual Halliburton cement and additives that were used for the job).
The results of these tests indicated it was not possible to generate a stable nitrified foam
cement slurry with greater than 50% nitrogen (by volume) at the 1,000 psi injection pressure.
For the Macondo well, a mixture of 55% to 60% nitrogen (by volume) was required at
1,000 psi injection pressure to achieve the design mixture of 18% to 19% nitrogen (by volume)
foam cement at downhole pressure and downhole temperature conditions.
These third party test results suggest that the foam cement slurry used for the Macondo well
was likely unstable, resulting in nitrogen breakout.
The investigation team identified cement slurry design elements that could have contributed to
a failure of the cement barrier, including the following:
� The cement slurry yield point was extremely low for use in foam cementing, which could
have increased the potential for foam instability and nitrogen breakout.
� A small slurry volume, coupled with long displacement and the use of base oil spacer, could
have increased the potential for contamination and nitrogen breakout.
� A defoamer additive was used, which could have destabilized the foam cement slurry.
� Fluid loss control additives were not used for cementing across the hydrocarbon zone,
which could have allowed formation fluids to permeate the cement.

Deepwater Horizon Accident Investigation Report
Section 4. Overview of Deepwater Horizon Accident Analyses
35
Secti
on
4
Conclusion
Based on CSI Technologies’ lab results and analysis, the investigation team concludes that
the nitrified foam cement slurry used in the Macondo well probably would have experienced
nitrogen breakout, nitrogen migration and incorrect cement density, which would explain the
failure to achieve zonal isolation of hydrocarbons. Nitrogen breakout and migration would have
also contaminated the shoe cement and may have caused the shoe track cement barrier to fail.
Cement Placement
Effective cement placement is necessary for the isolation of permeable hydrocarbon zones.
The Macondo well cement placement plan was to place the top of cement (TOC) 500 ft. above
the shallowest identified hydrocarbon zone in compliance with Minerals Management Service
(MMS) regulations.
The 500 ft. TOC design was chosen to:
� Minimize annulus hydrostatic pressure during cement placement in order to avoid
lost returns.
� Avoid cementing into the next casing string and creating a sealed annulus. A sealed annulus
would have increased the risk of casing collapse or burst due to annular pressure build-up
during production.
When the placement model was run using 21 centralizers, the results indicated that the
possibility of channeling above the main hydrocarbon zones would be reduced. The 7 in.
casing string that had been purchased for the job was supplied with six inline centralizers.
An additional 15 slip-on centralizers were sourced from BP inventory and sent to Deepwater
Horizon. The BP Macondo well team erroneously believed that they had received the wrong
centralizers. They decided not to use the 15 centralizers due to a concern that these slip-on
centralizers could fail during the casing run and cause the casing to lodge across the BOP.
To mitigate the risk of channeling associated with using fewer centralizers, the six inline
centralizers were positioned across and above the primary hydrocarbon zones.
Conclusion
Although the decision not to use 21 centralizers increased the possibility of channeling above
the main hydrocarbon zones, the decision likely did not contribute to the cement's failure to
isolate the main hydrocarbon zones or to the failure of the shoe track cement.
Planning for Temporary Abandonment
The cement job was pumped with expected volumes and mud returns. The BP Macondo
well team used final lift pressure and returns to declare a successful cement placement.
After discussion with Macondo well contractors and consistent with a decision tree developed
by the team, the team decided that no further evaluation was needed at that time.

36 Deepwater Horizon Accident Investigation Report
Section 4. Overview of Deepwater Horizon Accident Analyses
BP’s Engineering Technical Practice (ETP) GP 10-60 Zonal Isolation Requirements During
Drilling Operations and Well Abandonment and Suspension specifies that TOC should be
1,000 ft. above any distinct permeable zones, and centralization should extend to 100 ft. above
such zones. If those conditions are not met, as in this case, TOC should be determined by a
“proven cement evaluation technique,” such as conducting a cement evaluation log, which
would typically be done during the completion phase of the well. The investigation team has
not seen evidence of a documented risk assessment regarding annulus barriers.
Conclusion
Evaluating lift pressure and lost returns did not constitute a ”proven cement evaluation
technique“ per Section 5 of ETP GP 10-60. By not conducting a formal risk assessment of the
annulus cement barriers per the ETP recommendations, it is the view of the investigation team
that the BP Macondo well team did not fully conform to the intent of ETP GP 10-60.
A formal risk assessment might have enabled the BP Macondo well team to identify further
mitigation options to address risks such as the possibility of channeling; this may have included
the running of a cement evaluation log.
Overarching Conclusion for Key Finding 1
Improved engineering rigor, cement testing and communication of risk by Halliburton could have
identified the low probability of the cement to achieve zonal isolation.
Improved technical assurance, risk management and management of change by the BP
Macondo well team could have raised awareness of the challenges of achieving zonal isolation
and led to additional mitigation steps.
Key Finding 2. The shoe track barriers did not isolate the hydrocarbons.
After the annulus cement did not effectively isolate the reservoir, a mechanical barrier failure
enabled hydrocarbon ingress to the wellbore. The investigation team considered three
possibilities for ingress:
� Ingress through the shoe track barriers.
� Ingress through the casing hanger seal assembly.
� Ingress through the production casing and components.
Available evidence and analysis conducted by the investigation team leads it to conclude that
initial flow into the well came through the shoe track barriers.

Deepwater Horizon Accident Investigation Report
Section 4. Overview of Deepwater Horizon Accident Analyses
37
Secti
on
4
The Shoe Track
The shoe track comprised a float collar with two
check valves, 7 in. casing and a ported reamer
shoe. (Refer to Figure 2.) If hydrocarbons breached
the annulus cement barrier, ingress to the casing
should have been prevented by the cement in the
shoe track and the check valves in the float collar.
The entrance of initial influx and flow through the
shoe was confirmed by extensive OLGA®
well flow modeling of wellbore flow dynamics and
comparison to pressures and flows observed in
the real-time data.
The investigation team identified the following
possible failure modes that may have contributed
to the shoe track cement’s failure to prevent
hydrocarbon ingress:
� Contamination of the shoe track cement by
nitrogen breakout from the nitrified foam cement.
(Refer to Key Finding 1.)
� Contamination of the shoe track cement by the
mud in the wellbore.
� Inadequate design of the shoe track cement.
� Swapping of the shoe track cement with the
mud in the rat hole (bottom of the hole).
� A combination of these factors.
Three possible failure modes for the float collar were identified:
� Damage caused by the high load conditions required to establish circulation.
� Failure of the float collar to convert due to insufficient flow rate.
� Failure of the check valves to seal.
At the time this report was written, the investigation team had not determined which of these
failure modes occurred.
Conclusion
Based on available evidence, hydrostatic pressure calculations, OLGA® well flow modeling and
analysis of data from the Macondo well static kill on August 4, 2010, hydrocarbons entered
the casing through the shoe track. Therefore, the shoe track cement and the float collar must
have failed to prevent this ingress. The investigation team has not established whether this
failure was attributable to the design of the cement, contamination of the cement by mud in the
wellbore, commingling of cement with nitrogen due to nitrogen breakout from the nitrified foam
cement slurry, swapping of the shoe track cement with the mud in the rathole (bottom of the
well) or some combination of these factors.
Figure 2. Shoe Track Barriers.

38 Deepwater Horizon Accident Investigation Report
Section 4. Overview of Deepwater Horizon Accident Analyses
The Casing Hanger Seal Assembly
The casing hanger seal assembly was run and installed according to the installation procedure,
and the positive-pressure test verified integrity of the seal. At the time of the accident, the seal
assembly was not yet mechanically locked to the wellhead housing.
In this scenario, engineering analysis identifies that it is possible for the seal assembly to
be uplifted if sufficient force is applied. Uplift forces approached (if the casing was
secured by cement), but did not reach, loads sufficient to unseat the seals during the
negative-pressure test. However, the analysis indicates that with sustained flow from the
reservoir, the temperature of the casing string would have risen, thereby adding the uplift force
resulting from thermal elongation of the pipe. In this case, it is plausible that the seal assembly
could have lifted and an additional flow path could have been established after the well had
been flowing for a sustained period.
Conclusion
The investigation team has concluded that initial flow into the wellbore was through the shoe
track, not through the casing hanger seal assembly. This supports the conclusion that the uplift
forces during the negative-pressure test did not unseat the seal assembly. With no locking
mechanism installed, thermal stresses caused by sustained hydrocarbon flow from the reservoir
through the shoe track may have subsequently opened a flow path through the seal assembly.
The Production Casing and Components
The production casing consisted of a casing hanger, a 9 7/8 in. production casing, a
9 7/8 in. x 7 in. crossover joint and a 7 in. production casing. The investigation team reviewed
manufacturing data, inspection reports, installation reports, casing-running operations and
positive-pressure integrity tests. A casing design review was conducted using the actual
wellbore conditions.
Conclusion
The investigation team concludes that the production casing and components met all the
required design conditions and that it is highly unlikely that a casing failure mode contributed to
the loss of well control.
Key Finding 3. The negative-pressure test was accepted although well integrity had not been established.
Approximately 10 1/2 hours after the completion of the cement job, the positive-pressure
integrity test commenced. Following successful completion of the positive-pressure test to
2,700 psi, the negative-pressure test was conducted.

Deepwater Horizon Accident Investigation Report
Section 4. Overview of Deepwater Horizon Accident Analyses
39
Secti
on
4
The objective of the negative-pressure test was to test the ability of the mechanical barriers
(shoe track, casing hanger seal assembly and production casing) to withstand the pressure
differentials that would occur during subsequent operations: the reduction of hydrostatic head
to seawater and disconnection of the BOP and riser.
The investigation team concludes that the negative-pressure test results indicated that well
integrity had not been established. This situation was not recognized at the time of the test,
therefore, remedial steps were not taken.
During the negative-pressure test, the well was placed in an underbalanced state when
hydrostatic pressure in the wellbore was reduced below reservoir pressure.
To prepare for this test, mud in the boost line, choke line, kill line, drill pipe and upper part of
the production casing was displaced to seawater. To provide separation between the mud and
the seawater in the casing, a spacer was pumped down the drill pipe ahead of the seawater.
With the heavier fluids in position, the annular preventer was shut to isolate the hydrostatic
head of the fluids in the riser from the well. At this time, the annular preventer did not seal
around the drill pipe, resulting in heavy spacer leaking down past the annular preventer.
After adjustment of the regulator hydraulic pressure for the annular preventer, an effective seal
was established. The residual pressure of 1,260 psi in the drill pipe was bled off from the well.
According to witness accounts, 15 bbls of fluid returns were taken. The investigation team's
analysis indicates that approximately 3.5 bbls should have been expected. This excess flow
from the drill pipe, with the well in an underbalanced condition, should have indicated to the
rig crew a communication flow path with the reservoir through failed barriers.
The BP Macondo well team provided broad operational guidelines for the negative-pressure
test. The rig crew and well site leader were expected to know how to perform the test.
The rig crew began the negative-pressure test by monitoring the drill pipe flow. According
to witness accounts, this was the rig crew’s preferred practice. However, the Application for
Permit to Modify (APM) to MMS for the Macondo well temporary abandonment stipulated that
the negative-pressure test should be conducted by monitoring the kill line. The well site leader
noticed the discrepancy and after a discussion with the rig crew, preparations for continuing
the negative-pressure test were made by bleeding the kill line. According to witness accounts,
between 3 bbls and 15 bbls of seawater flowed from the kill line, which was then shut in.
From 18:00 hours to 18:35 hours, the drill pipe pressure increased from approximately 50 psi
to 1,400 psi. To resume the negative-pressure test, the kill line was filled and then opened,
0.2 bbls flowed, and no further flow was observed from the kill line during a 30-minute period
of monitoring. The drill pipe pressure was constant at 1,400 psi.

40 Deepwater Horizon Accident Investigation Report
Section 4. Overview of Deepwater Horizon Accident Analyses
This pressure of 1,400 psi on the drill pipe was misinterpreted by the rig crew and the well site
leaders. According to witness accounts, the toolpusher proposed that the pressure on the
drill pipe was caused by a phenomenon referred to as ‘annular compression’ or ‘bladder
effect.’ The toolpusher and driller stated that they had previously observed this phenomenon.
After discussing this concept, the rig crew and the well site leaders accepted the explanation.
The investigation team could find no evidence that this pressure effect exists.
The investigation team has identified two possible reasons that flow did not exit the kill line:
� The kill line may have been plugged with solids from the spacer. (Refer to Figure 3.)
� The system may not have been lined up correctly; a valve may have been inadvertently
left closed.
Figure 3. Possible Movement of Spacer into the Kill Line.

Deepwater Horizon Accident Investigation Report
Section 4. Overview of Deepwater Horizon Accident Analyses
41
Secti
on
4
Conclusions
The investigation team concludes that the lack of flow from what was believed to be an open kill
line, coupled with the erroneous explanation for the 1,400 psi on the drill pipe, led the well site
leaders and the rig crew to the incorrect view that the negative-pressure test was successful
and that well integrity was established. The well site leaders and the rig crew maintained this
view despite the contradictory information of 1,400 psi on the drill pipe connected through the
wellbore to the non-flowing kill line with 0 psi.
The guidelines for the negative-pressure test, a critical activity, did not provide detailed steps
and did not specify expected bleed volumes or success/failure criteria. Therefore, effective
performance of the test placed a higher reliance on the competency and leadership skills of the
BP and Transocean rig leaders.
Key Finding 4. Influx was not recognized until hydrocarbons were in the riser.
A fundamental requirement for safe Drilling and Completions (D&C) operations is to maintain
control of the well and prevent influx of hydrocarbons. During all phases of these operations,
fluid returns, pressure and flow indicators should be continuously monitored to detect influx
into the well as soon as possible. On the Macondo well, the rig crew apparently did not
recognize significant indications of hydrocarbon influx during the displacement of the riser
to seawater.
Following the negative-pressure test, the annular preventer was opened, and the hydrostatic
head of fluid in the riser returned the well to an overbalanced state. The rig crew began
the displacement of the mud in the riser to seawater. As the mud was displaced from the
riser, the pressure at the bottom of the wellbore decreased. Analysis of OLGA® well flow
modeling indicates that the well became underbalanced again at approximately 20:52 hours,
and hydrocarbon influx resumed. The rate of influx would have gradually increased as the
well became more underbalanced with heavier fluids being displaced by lighter seawater
and hydrocarbons. Flow increase from the well was discernable in the real-time data after
approximately 20:58 hours.
The investigation team's analysis of fluid volumes shows an approximate gain of 39 bbls by
21:08 hours. No well control actions were taken at that time, indicating that this fluid gain was
not detected.
Simultaneous end-of-well activities were occurring and may have distracted the rig crew and
mudloggers from monitoring the well. These activities included preparing for the next operation
(setting a cement plug in the casing), bleeding off the riser tensioners and transferring mud to
the supply vessel M/V Damon Bankston.

42 Deepwater Horizon Accident Investigation Report
Section 4. Overview of Deepwater Horizon Accident Analyses
The investigation team did not find evidence that either the Transocean rig crew or the Sperry-Sun mudloggers monitored the pits from 13:28 hours (when the offloading to the supply vessel began) to 21:10 hours (when returns were routed overboard).
At 21:08 hours, the spacer reached the top of the riser, and the rig crew shut down pumping
operations to complete a sheen test prior to discharging the spacer to the sea. During the
sheen test, the rig crew configured the flow path to route the spacer overboard. This flow
path bypassed the mudlogger’s flow meter and the mud pits; therefore, fluid flow could no
longer be monitored at the mudlogger’s console. However, drill pipe pressure should have
been observable at the mudlogger’s console, and flow and drill pipe pressure should have been
observable at the driller’s console.
During the sheen test between 21:08 hours and 21:14 hours, the mud pumps were shut
down, and real-time data showed flow continuing and drill pipe pressure increasing by
246 psi. The rig crew apparently did not recognize these indications of flow, and displacement
was recommenced.
Analysis of OLGA® well flow modeling suggests that by 21:30 hours there would have been
approximately 300 bbls of hydrocarbon influx in the well.
At 21:31 hours, the mud pumps were shut down. Witness accounts indicated that a
conversation between the toolpusher and the driller took place on the rig floor regarding
‘differential pressure.’ Between 21:31 hours and 21:34 hours, the pressure on the drill pipe
increased by approximately 560 psi.
Analysis suggests that between 21:31 hours and 21:41 hours, with the pumps shut down,
the well was unloading at an average rate of approximately 60 bpm to 70 bpm. Analysis also
suggests that hydrocarbons did not enter the riser until approximately 21:38 hours. (Refer to
Figure 4.) The investigation team believes that the first well control action taken by the rig crew
was at 21:41 hours.
Conclusions
Analysis indicates that the first indications of flow from the well could be seen in the real-time
data after 20:58 hours. The rig crew and mudloggers either did not observe or did not recognize
indications of flow until after hydrocarbons entered the riser at approximately 21:38 hours. The
first well control response likely occurred at 21:41 hours.
The Transocean Well Control Handbook stated that the well was to be monitored at all times.
However, the policy did not specify how to monitor the well during in-flow testing, cleanup or
other end-of-well activities.

Deepwater Horizon Accident Investigation Report
Section 4. Overview of Deepwater Horizon Accident Analyses
43
Secti
on
4Figure 4. Hydrocarbons Entering the Riser.
Key Finding 5. Well control response actions failed to regain control of the well.
When well influx occurs, rapid response is critical. The rig crew needs effective procedures and
must effectively implement them to maintain control over deteriorating conditions in the well.
Key members of the rig crew need to be trained and demonstrate competency. Their actions
need to be correct and immediate, especially when control of the well has been lost and the
flow of hydrocarbons has escalated.

44 Deepwater Horizon Accident Investigation Report
Section 4. Overview of Deepwater Horizon Accident Analyses
Witness accounts and real-time data were combined with OLGA® well flow modeling to infer
which actions were taken by the rig crew prior to the explosion. Although it is uncertain what
the rig crew actions were, separate indications and analyses support the following events.
At approximately 21:40 hours, witness accounts indicated that mud flowed uncontrolled onto
the rig floor. Real-time data and further witness accounts suggest that the rig crew attempted
to control the well by closing an annular preventer in the BOP at approximately 21:41 hours.
This first action was too late to prevent the release of hydrocarbons, which were already in
the riser. Modeling suggests that the annular preventer did not fully seal around the drill pipe,
allowing hydrocarbons to continue entering the riser.
The rig crew diverted hydrocarbons coming through the riser to the mud gas separator (MGS),
which was quickly overwhelmed and failed to control the hydrocarbons exiting the riser.
The alternative option of diversion overboard through the 14 in. starboard diverter line did
not appear to have been chosen; this action would probably have vented the majority of the
gas safely overboard.
Real-time data indicated that at 21:47 hours, drill pipe pressure rose from 1,200 psi to
5,730 psi within one minute. This was likely caused by the closure of one or two variable bore
rams (VBRs), which sealed the annulus. At approximately 21:49 hours, rig power and real-time
data were lost. Witnesses recall an explosion on the rig, followed closely by a larger explosion.
After the explosions, fires continued on the rig.
The subsea supervisor attempted to activate the emergency disconnect sequence (EDS) some
time after the explosion. This would have sealed the well and disconnected the riser from the
BOP stack. There were no indications that the sequence activated.
Conclusions
No apparent well control actions were taken until hydrocarbons were in the riser. The actions
that were taken after that did not control the well.
An annular preventer was likely activated at 21:41 hours, and it closed around the drill
pipe. It failed to seal the annulus for approximately five minutes, allowing further flow of
hydrocarbons into the riser until the annulus was sealed at 21:47 hours, likely by the closure
of a VBR.
The diversion of fluids overboard, rather than to the MGS, may have given the rig crew more
time to respond and may have reduced the consequences of the accident.
Transocean’s shut-in protocols did not fully address how to respond in high flow emergency
situations after well control has been lost. Well control actions taken prior to the explosion
suggest the rig crew was not sufficiently prepared to manage an escalating well
control situation.

Deepwater Horizon Accident Investigation Report
Section 4. Overview of Deepwater Horizon Accident Analyses
45
Secti
on
4
Key Finding 6. Diversion to the mud gas separator resulted in gas venting onto the rig.
The MGS removes only small amounts of gas entrained in the mud. Once separated, the gas is
vented to the atmosphere at a safe location. When the rig crew diverted high flow to the MGS,
the system was overwhelmed.
When an annular preventer appeared to be activated at 21:41 hours, the well was flowing at a
high rate, and hydrocarbon fluids were above the BOP. As the hydrocarbon gas expanded, the
flow of gas, oil, mud and water to the surface continued at an increasing rate.
The investigation team concludes that, at approximately 21:41 hours, the rig crew diverted the
flow of hydrocarbons to the MGS. (Refer to Figure 5.) The MGS is a low-pressure system, and
its design limits would have been exceeded by the expanding and accelerating hydrocarbon
flow. The main 12 in. gas outlet vent from the MGS was goosenecked at its terminus on top of
the derrick, and it vented gas down onto the rig. Several other flow-lines coming from the MGS
vessel directed gas onto the rig and potentially into confined spaces under the deck.
Figure 5. Mud Gas Separator.

46 Deepwater Horizon Accident Investigation Report
Section 4. Overview of Deepwater Horizon Accident Analyses
The investigation team determined that large areas of the rig were enveloped in a flammable
mixture within minutes of gas arriving at the surface.
Conclusion
The design of the MGS system allowed the riser fluids to be diverted to the MGS vessel when
the well was in a high flow condition. When the MGS was selected, hydrocarbons were vented
directly onto the rig through the 12 in. goosenecked vent exiting the MGS, and other flow-lines
directed gas back onto the rig.
Key Finding 7. The fire and gas system did not prevent hydrocarbon ignition.
For operating environments where hazardous substances could be present, secondary levels
of protective systems are normally part of the design philosophy. On Deepwater Horizon,
the secondary levels of protective systems included a fire and gas system and the electrical
classification of certain areas of the rig.
The fire and gas system detects hydrocarbon gas and initiates warning alarms when acceptable
limits are exceeded. For some alarms, an automated function initiates when hydrocarbon gas is
detected beyond acceptable limits. This automated function primarily prevents gas ingress
to vulnerable locations through the heating, ventilation and air conditioning (HVAC) system.
When gas is detected, the fire and gas system closes the dampers and shuts off the
ventilation fans.
Areas on the rig are electrically classified, based on the probability of the presence of
hydrocarbons. Equipment in electrically classified areas must meet design code criteria that
reduce the possibility of providing an ignition source.
Because of the low probability of hydrocarbons being present before a well produces, only a
small area of Deepwater Horizon was electrically classified. The two main electrically classified
areas were within the rig floor and under the deck, where the mud returning from the well
could convey some residual hydrocarbons. If a flammable mixture migrated beyond these
areas, the potential for ignition would be higher.
Deepwater Horizon engine room HVAC fans and dampers were not designed to trip
automatically upon gas detection; manual activation was required. This design was probably
selected so that false gas-detection trips would not interrupt the power supply to the thrusters,
which keep the dynamically-positioned rig on station. The HVAC system likely transferred a
gas-rich mixture into the engine rooms, causing at least one engine to overspeed, creating a
potential source for ignition.
The information used to complete the analysis is based on pre-2001 documentation; therefore,
some of the equipment details and system designs may have changed. However, in the view
of the investigation team, it is unlikely that any such differences would significantly affect the
conclusions drawn.

Deepwater Horizon Accident Investigation Report
Section 4. Overview of Deepwater Horizon Accident Analyses
47
Secti
on
4
Conclusion
The fire and gas system did not prevent released hydrocarbons from reaching potential
ignition sources.
Key Finding 8. The BOP emergency mode did not seal the well.
None of the emergency methods available for operating the BOP were successful in isolating
the wellbore. The different methods available were not fully independent; therefore, single
failures could affect more than one emergency method of BOP operation. Ultimately, the only
way to isolate the well at the BOP was to close a single component, the blind shear ram (BSR);
that ram had to shear the drill pipe and seal the wellbore.
Emergency Disconnect Sequence
To isolate the well after the explosion, the subsea supervisor attempted to operate the EDS
that would close the BSR, sealing the wellbore, and disconnect the lower marine riser
package (LMRP). The EDS required a communication signal to be sent through one of two
multiplex (MUX) cables routed through the moon pool, which would have been affected by
the explosions and fire. Witness accounts indicated that an attempt was made to activate the
EDS approximately 7 minutes after the initial explosion. The LMRP did not disconnect, and
hydrocarbons continued to flow, indicating that the BSR did not seal.
Conclusion
The explosions and fire very likely damaged the MUX cables, disabling the EDS means of closing
the BSR.
Automatic Mode Function
The automatic mode function (AMF) of the BOP activates the BSR to shear the drill pipe and
seal the wellbore in the event of catastrophic failure of the marine riser. Two independent
control pods on the BOP initiate the AMF sequence to close the BSR if specific conditions
are met (i.e., when electrical power, communications and hydraulic power are all lost to both
control pods). According to witness accounts, during the attempt to activate the EDS, there
was a low accumulator alarm on the BOP control panel, indicating loss of hydraulic supply
pressure. The AMF conditions were very likely met upon the damage to the MUX cables and
loss of hydraulic supply pressure after the explosion.
The AMF requires at least one operational control pod to initiate and complete the sequence.
Both the blue and yellow control pods from Deepwater Horizon BOP were retrieved after the
accident, and their AMF functionality was tested. Insufficient charge was discovered on the
27-volt AMF battery bank in the blue pod, and a failed solenoid valve 103 was discovered in
the yellow pod. If these conditions existed at the time of the accident, neither pod would have
been capable of completing an AMF sequence.

48 Deepwater Horizon Accident Investigation Report
Section 4. Overview of Deepwater Horizon Accident Analyses
Conclusion
The AMF initiation conditions were very likely met soon after the first explosion, but the AMF
sequence very likely could not have been completed by either control pod, due to the failed
solenoid valve 103 in the yellow pod and an insufficient charge on the 27-volt AMF battery bank
in the blue pod.
Intervention by Remotely Operated Vehicle
The autoshear function is designed to activate the BSR upon inadvertent disconnection of the
LMRP. Evidence indicated that the BSR closed 33 hours after the explosion, when a remotely
operated vehicle (ROV) activated the autoshear function.
Though the BSR appeared to have been closed, the investigation team has not been able to
determine why it failed to seal the well. Potential causes examined by the investigation
team included:
� Seal failure due to the prevailing flow condition in the BOP.
� Insufficient hydraulic power to shear the drill pipe and seal the wellbore.
� Non-shearable pipe or debris across the BSR.
BOP Maintenance and Testing
A review of BOP maintenance and testing records provided by Transocean indicated
instances of an ineffective maintenance management system for Deepwater Horizon.
Examples were:
� In December 2007, the batteries in the blue pod were fully depleted when the BOP was
brought to the surface.
� There were no indications that the AMF and ROV intervention systems were tested at
the surface, as required by Transocean testing policy, prior to subsea deployment on the
Macondo well.
� Cameron reported that a non-original equipment manufacturer (non-OEM) part was found
on solenoid valve 103 during the yellow pod examination.
The diagnostic systems did not appear to have been utilized effectively in all cases to identify
and remedy defects in critical components. Solenoid valve coil faults and hydraulic system
leaks probably existed on the BOP prior to the accident.
Conclusion
The BOP maintenance records were not accurately reported in the maintenance management
system. The condition of critical components in the yellow and blue pods and the use of a
non-OEM part, which were discovered after the pods were recovered, suggest the lack of a
robust Transocean maintenance management system for Deepwater Horizon BOP.

Secti
on
5
Deepwater Horizon Accident Investigation Report 49
Section 5. Deepwater Horizon Accident Analyses
A
Section 5. Deepwater Horizon Accident Analyses
Introduction
The investigation process, including the identification of critical factors, was outlined in
Section 1. Scope of the Investigation of this report. The team examined potential causal or
contributory factors for each critical factor. The analyses, 5A–5D, contain key findings and
conclusions that are associated with the critical factors. The recommendations for all four critical
factors are set out in Section 6. Investigation Recommendations of this report.
The four critical factors and their associated key findings are:
Analysis 5A. Critical Factor: Well Integrity Was Not Established or Failed
Key Finding 1. The annulus cement barrier did not isolate the hydrocarbons.
Key Finding 2. The shoe track barriers did not isolate the hydrocarbons.
Analysis 5B. Critical Factor: Hydrocarbons Entered the Well Undetected and Well Control Was Lost
Key Finding 3. The negative-pressure test was accepted although well integrity had not been
established.
Key Finding 4. Influx was not recognized until hydrocarbons were in the riser.
Key Finding 5. Well control response actions failed to regain control of the well.
Analysis 5C. Critical Factor: Hydrocarbons Ignited on Deepwater Horizon
Key Finding 6. Diversion to the mud gas separator resulted in gas venting onto the rig.
Key Finding 7. The fire and gas system did not prevent hydrocarbon ignition.
Analysis 5D. Critical Factor: The Blowout Preventer Did Not Seal the Well
Key Finding 8. The BOP emergency mode did not seal the well.S
ecti
on
5

Secti
on
5
Deepwater Horizon Accident Investigation Report50
Section 5. Deepwater Horizon Accident Analyses
A
As noted in Section 4. Overview of Deepwater Horizon Accident Analyses of this report, the ‘BP
Macondo well team’ means BP’s Houston-based well team that worked on the Macondo well,
excluding BP’s cementing services provider (Halliburton) and also excluding the BP well site
leaders aboard Deepwater Horizon.
The rig crew means Transocean’s rig crew leaders aboard Deepwater Horizon (senior toolpusher,
toolpushers, drillers and assistant drillers) collectively, or to the individuals in one or more of these
roles, and includes personnel acting at their direction. References to the BP well site leaders are to
the day and night well site leaders aboard Deepwater Horizon.
References to mudloggers are to the Halliburton Sperry-Sun mudloggers aboard Deepwater Horizon.
References to cementers are to Halliburton’s cement operators aboard Deepwater Horizon.
M-I SWACO provided the mud engineers.

An
aly
sis
5A
Deepwater Horizon Accident Investigation Report 51
Analysis 5A. Well Integrity Was Not Established or Failed
Analysis 5A. Well Integrity Was Not Established or Failed
1 Introduction
The loss of well integrity was caused by a failure of the annulus cement barrier that allowed
hydrocarbons to flow into the wellbore annulus. Failure of one or more of the mechanical
barriers (i.e., the shoe track, the casing hanger seal assembly or the production casing and
components) allowed hydrocarbons to flow to the surface.
This analysis focuses on the design and installation of the annulus cement and
mechanical barriers.
Through the investigation team’s review and analysis of the available information, the team
determined the following key findings:
Key Finding 1. The annulus cement barrier did not isolate the hydrocarbons.
Key Finding 2. The shoe track barriers did not isolate the hydrocarbons.
52
Analysis 5A. Well Integrity Was Not Established or Failed
Deepwater Horizon Accident Investigation Report
Information regarding how well integrity was not established or failed was collected from:
� Sperry-Sun real-time data.
� OLGA® well flow modeling.
� Third party analysis of Halliburton’s cement design.
� Witness accounts from:
� Marine Board of Investigation hearings on May 26–29, July 19–23 and
August 23–27, 2010.
� Interviews conducted by the investigation team.
� A review of Halliburton and BP documents, such as operational procedures, post-job
reports, and daily reports.
� Data from the Macondo well static kill on August 4, 2010.
� Data in these appendices:
� Appendix C. Macondo Well Components of Interest.
� Appendix D. Sperry-Sun Real-time Data–Pits.
� Appendix E. Sperry-Sun Real-time Data–Surface Parameters.
� Appendix G. Analysis Determining the Likely Source of In-flow.
� Appendix J. Halliburton Lab Results - #73909/2 (electronic media).
� Appendix K. Laboratory Analysis of Cementing Operations on the Deepwater Horizon
(from CSI Technologies) (electronic media).
� Appendix M. Summary Report Global Analysis of Macondo 9 7/8-in x 7-in Production
Casing 4992 ft Water Depth, GoM (For Macondo Well Investigation) (from Stress
Engineering) (electronic media).
� Appendix N. Mississippi Canyon 252 No. 1 (Macondo) Basis of Design Review
(electronic media).
� Appendix O. Industry Comparison Data on Long String Casing and Casing Liners in the
Macondo Well Area (electronic media).
� Appendix W. Report–Dynamic Simulations Deepwater Horizon Incident BP (from ae add
energy) (electronic media).
Topics in this analysis include:
2 Annulus Cement Barrier
2.1 Cement Design
2.2 Future Cement Testing Recommendations
2.3 Cement Placement
2.4 Cement Channeling and Casing Centralization
2.5 Lost Circulation and Equivalent Circulating Density
2.6 Planning for Temporary Abandonment
2.7 Cement Design, Oversight, Communication and Evaluation
3 Mechanical Barriers
3.1 Shoe Track
3.2 Casing Hanger Seal Assembly
3.3 Production Casing and Components

An
aly
sis
5A
Deepwater Horizon Accident Investigation Report 53
Analysis 5A. Well Integrity Was Not Established or Failed
4 Design Decision (Long String versus Liner)
4.1 Zonal Isolation
4.2 Annular Pressure Build-up
4.3 Mechanical Barriers and Integrity
4.4 Total Lifetime Cost
5 Conclusions
5.1 Cement Design
5.2 Cement Design, Oversight, Communication and Evaluation
5.3 Planning for Temporary Abandonment
5.4 Cement in the Shoe Track
5.5 Overarching Conclusions
6 Recommendations

54
Analysis 5A. Well Integrity Was Not Established or Failed
Deepwater Horizon Accident Investigation Report
2 Annulus Cement Barrier
The annulus cement barrier failed to prevent hydrocarbons from entering the annulus after
cement placement. The investigation team assessed possible failure modes and paths that led to
hydrocarbon migration from the formation into the wellbore. (Refer to Figure 1.)
A combination of factors could have contributed to the loss of well integrity, if hydrocarbons
entered the wellbore before, during or after cement placement.
To evaluate whether hydrocarbons could have entered the wellbore before cement placement,
the investigation team conducted a detailed analysis of actual downhole mud density, fluid
volume pumped, and swab and surge pressures while running casing. A volumetric analysis
indicated that even if hydrocarbons were present in the wellbore, they would have been
circulated out of the well prior to the loss of well control. Data analysis gave no indication that
hydrocarbons entered the wellbore prior to cement placement.
Figure 1. Hydrocarbon Zones and Potential Flow Paths.

An
aly
sis
5A
Deepwater Horizon Accident Investigation Report 55
Analysis 5A. Well Integrity Was Not Established or Failed
The investigation team identified several possible failure modes that could have allowed
hydrocarbons to enter the annulus either during or after cement placement:
� Ineffective cement design.
� Ineffective cement placement.
� Cement channeling.
� Lost circulation and equivalent circulating density (ECD).
Each of these possible failure modes is discussed below.
2.1 Cement Design
Considering the narrow pore pressure and fracture gradient conditions in the Macondo
well, planning the cement job to achieve effective cement placement and zonal isolation
was a challenge for the BP and Halliburton personnel involved.
The BP Macondo well team’s goal was to obtain a cement slurry and placement
design that would make zonal isolation possible. To accomplish this, the team needed a
lightweight cement slurry that could be circulated in place without losing returns.
Halliburton recommended pumping nitrified foam cement slurry across the main pay
sands. Foamed slurries can be used for reducing the cement slurry density and to prevent
gas migration. The base cement slurry described in Table 1 was used for the cap, tail and
nitrified foam cement. (Refer to Table 1.) The total cement volume was approximately
62 bbls, 48 bbls of which was foamed.
Cement placement was conducted by pumping the sequence of base oil, spacer, bottom
wiper plug, cap cement, foamed cement, tail cement, top wiper plug and spacer.
One purpose of the spacers and cap cement was to isolate the nitrified foam cement slurry
from contaminants in the wellbore. If foamed cement is contaminated by synthetic oil-
based mud (SOBM), base oil or cement spacer, it can become unstable, resulting in nitrogen
breakout. Nitrogen breakout not only degrades the nitrified foam cement properties, but it
can also degrade the placement and properties of cap and tail cement.
The purpose of the nitrified foam cement was to isolate the formation, preventing
migration of hydrocarbons either upward to the open casing annulus or downward to the
shoe track.
The purpose of the tail cement was to fill the shoe track. This cement was intended to form
a barrier preventing flow into the casing in the event that the formation was not isolated.
(Refer to Figure 2.)

56
Analysis 5A. Well Integrity Was Not Established or Failed
Deepwater Horizon Accident Investigation Report
Figure 2. Planned Cement Slurry Placement.

An
aly
sis
5A
Deepwater Horizon Accident Investigation Report 57
Analysis 5A. Well Integrity Was Not Established or Failed
Slurry Composition
Table 1 lists Halliburton’s recommended
formulation of the base cement slurry for
Macondo well’s 9 7/8 in. x 7 in. production
casing. This base slurry was used for the
cap, tail and nitrified foam cement. Table 2
compares the densities of the base cement
and nitrified foam cement slurries.
Cement placement, as it was run, had the
following characteristics:
� Cement slurry containing no fluid
loss additives.
� 6.7 ppg base oil as a spacer to reduce
hydrostatic pressure.
� Defoamer additive in a foam
cement slurry.
� Use of a lightweight foam cement slurry
behind a heavy cap cement slurry.
� Small cement slurry volume (62 bbls).
� 55% to 60% foam quality (at surface
injection conditions).
� 18% to 19% foam quality (at downhole
conditions).
Slurry Testing on Halliburton Products
The cement components were stocked on
Deepwater Horizon. Halliburton shipped samples of those components to its laboratory in
advance of the date on which the components were used for the Macondo well.
Halliburton retained surplus samples from the testing program. However, the investigation
team was unable to acquire and test these actual cement samples from the rig due to a
court-ordered injunction on Halliburton to preserve this material. At the time this report was
written, Halliburton had declined the investigation team’s requests for equivalent samples
of the cement components used on the rig. The investigation team was, therefore, unable
to conduct any lab testing using Halliburton products. The only sources for data derived
from rig-sourced components are the lab test reports received from Halliburton. (Refer to
Appendix J. Halliburton Lab Results - #73909/2.)
94 lb/sack Lafarge Class H cement
0.07% Halliburton EZ-FLO™ (bulk flow enhancer)
0.25% D-AIRTM 3000 (defoamer)
1.88 lb/sack KCl (salt)
20% SSA-1 (silica flour)
15% SSA-2 (silica flour Common White-100 Mesh)
0.2% SA-541 (anti-settling additive)
0.11 gal/sack Zoneseal® 2000 (surfactant)
4.93 gal/sack fresh water
0.09 gal/sack SCR-100L (liquid retarder)
1 lb/bbl WellLife™ 734 (lost circulation additive
material; not shown on lab test page but added to
slurry pumped downhole)
Product Density (ppg)
Base cement slurry
(non-foamed)16.74
Nitrified foam cement
slurry14.5 (average)
Table 1. Halliburton Cement Blend.
Table 2. Halliburton Cement Slurry Densities.
58
Analysis 5A. Well Integrity Was Not Established or Failed
Deepwater Horizon Accident Investigation Report
Evaluation of Halliburton Lab Test Results
The investigation team reviewed Halliburton laboratory test results dated April 12, 2010,
and noted several discrepancies, as follows:
� Halliburton indicated in subsequent correspondence that this April 12, 2010, document
reported results of slurry tests conducted on April 18, 2010.
� The report did not include testing for fluid loss, free water, foam/spacer/mud
compatibility, static gel strength transition time, zero gel time or settlement. Testing for
these parameters is commonly provided.
� Some of the data provided appeared to pre-date the April 18, 2010, slurry testing.
At the time this report was written, the investigation team was unable to reconcile these
discrepancies with Halliburton.
After the accident, the investigation team contracted a third party cementing lab
(CSI Technologies) to evaluate Halliburton’s lab reports and to conduct tests on
representative cement products and additives. The purpose of this effort was to evaluate
the effectiveness of the Halliburton cement slurry design.
According to Halliburton’s OptiCem™ model, obtaining nitrified foam cement slurry with a
density of 14.5 ppg at downhole pressure and temperature in the Macondo well required
the average foam quality to be 18% to 19%. Foam quality represents the concentration of
nitrogen gas in the cement slurry, which is expressed as a percentage of gas volume to
total foamed slurry volume. To obtain this downhole density, a 55% to 60% foam quality
must be generated at an injection pressure of 1,000 psi. CSI Technologies evaluated
Halliburton’s lab test results dated April 12, 2010, to determine if the slurry properties
would meet design criteria for this application.
The investigation team and CSI Technologies identified several areas of concern:
� The Halliburton lab test dated April 12, 2010, should have used cement with an 18%
to 19% foam quality, which would have been consistent with the OptiCem™ model.
Instead, the lab test used cement slurry with a foam quality of 12.98%.
� One purpose of the Halliburton lab test was to evaluate the nitrified foam cement
slurry mixability and stability. The results of this testing indicated foam instability based
on the foamed cement weight of 15 ppg. The investigation team believes that those
results should have led Halliburton to conduct further testing and to continue working
on the slurry design.
� The lab test results dated April 12, 2010, indicated that fluid rheologies were extremely
low, with a yield point of approximately 2 lb/100 ft2 at 135˚F (57˚C). Yield point is the minimum pressure gradient needed to initiate flow. The yield point for cement slurries
used in foamed cement is typically greater than 5 lb/100 ft2. This low yield point could
have led to difficulties in foam stability.
� A defoamer additive was used in the cement slurry, as indicated in Table 1.
The investigation team understood from CSI Technologies that Halliburton standards
included a specific recommendation to avoid using dispersant or defoamer additives
with foam cement. Dispersants and defoamers could lead to foam stability problems.
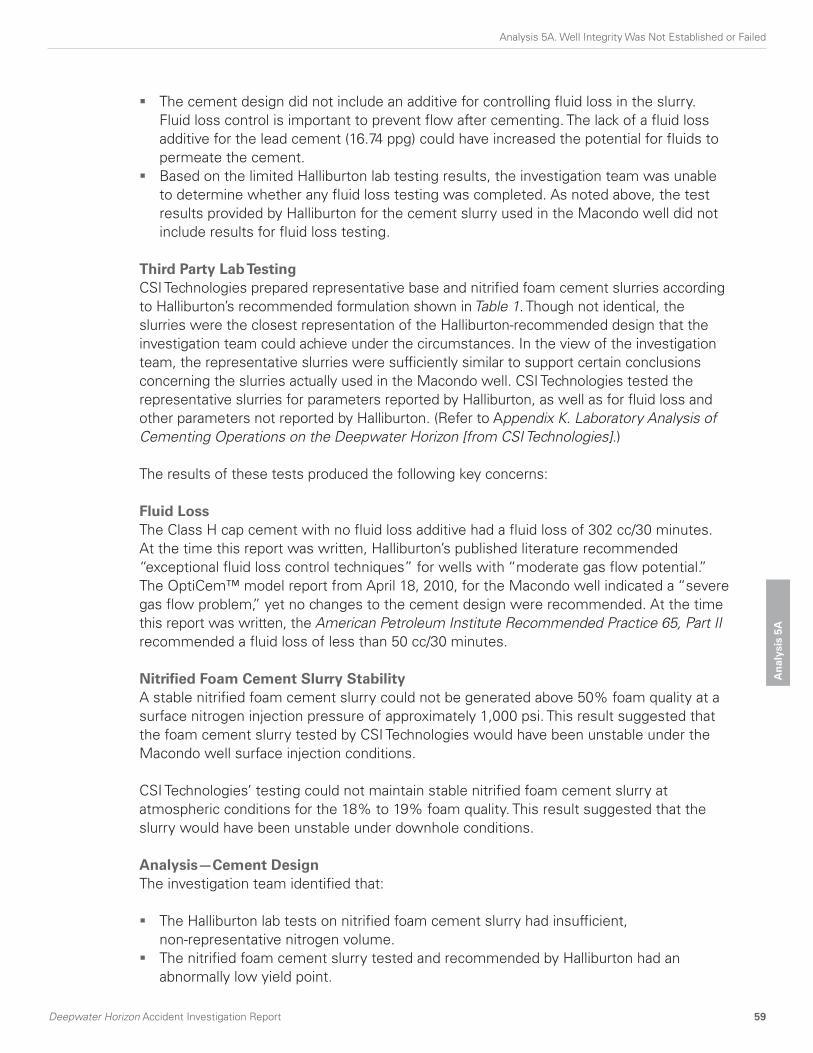
An
aly
sis
5A
Deepwater Horizon Accident Investigation Report 59
Analysis 5A. Well Integrity Was Not Established or Failed
� The cement design did not include an additive for controlling fluid loss in the slurry.
Fluid loss control is important to prevent flow after cementing. The lack of a fluid loss
additive for the lead cement (16.74 ppg) could have increased the potential for fluids to
permeate the cement.
� Based on the limited Halliburton lab testing results, the investigation team was unable
to determine whether any fluid loss testing was completed. As noted above, the test
results provided by Halliburton for the cement slurry used in the Macondo well did not
include results for fluid loss testing.
Third Party Lab Testing
CSI Technologies prepared representative base and nitrified foam cement slurries according
to Halliburton’s recommended formulation shown in Table 1. Though not identical, the
slurries were the closest representation of the Halliburton-recommended design that the
investigation team could achieve under the circumstances. In the view of the investigation
team, the representative slurries were sufficiently similar to support certain conclusions
concerning the slurries actually used in the Macondo well. CSI Technologies tested the
representative slurries for parameters reported by Halliburton, as well as for fluid loss and
other parameters not reported by Halliburton. (Refer to Appendix K. Laboratory Analysis of
Cementing Operations on the Deepwater Horizon [from CSI Technologies].)
The results of these tests produced the following key concerns:
Fluid Loss
The Class H cap cement with no fluid loss additive had a fluid loss of 302 cc/30 minutes.
At the time this report was written, Halliburton’s published literature recommended
“exceptional fluid loss control techniques” for wells with “moderate gas flow potential.”
The OptiCem™ model report from April 18, 2010, for the Macondo well indicated a “severe
gas flow problem,” yet no changes to the cement design were recommended. At the time
this report was written, the American Petroleum Institute Recommended Practice 65, Part II
recommended a fluid loss of less than 50 cc/30 minutes.
Nitrified Foam Cement Slurry Stability
A stable nitrified foam cement slurry could not be generated above 50% foam quality at a
surface nitrogen injection pressure of approximately 1,000 psi. This result suggested that
the foam cement slurry tested by CSI Technologies would have been unstable under the
Macondo well surface injection conditions.
CSI Technologies’ testing could not maintain stable nitrified foam cement slurry at
atmospheric conditions for the 18% to 19% foam quality. This result suggested that the
slurry would have been unstable under downhole conditions.
Analysis—Cement Design
The investigation team identified that:
� The Halliburton lab tests on nitrified foam cement slurry had insufficient,
non-representative nitrogen volume.
� The nitrified foam cement slurry tested and recommended by Halliburton had an
abnormally low yield point.
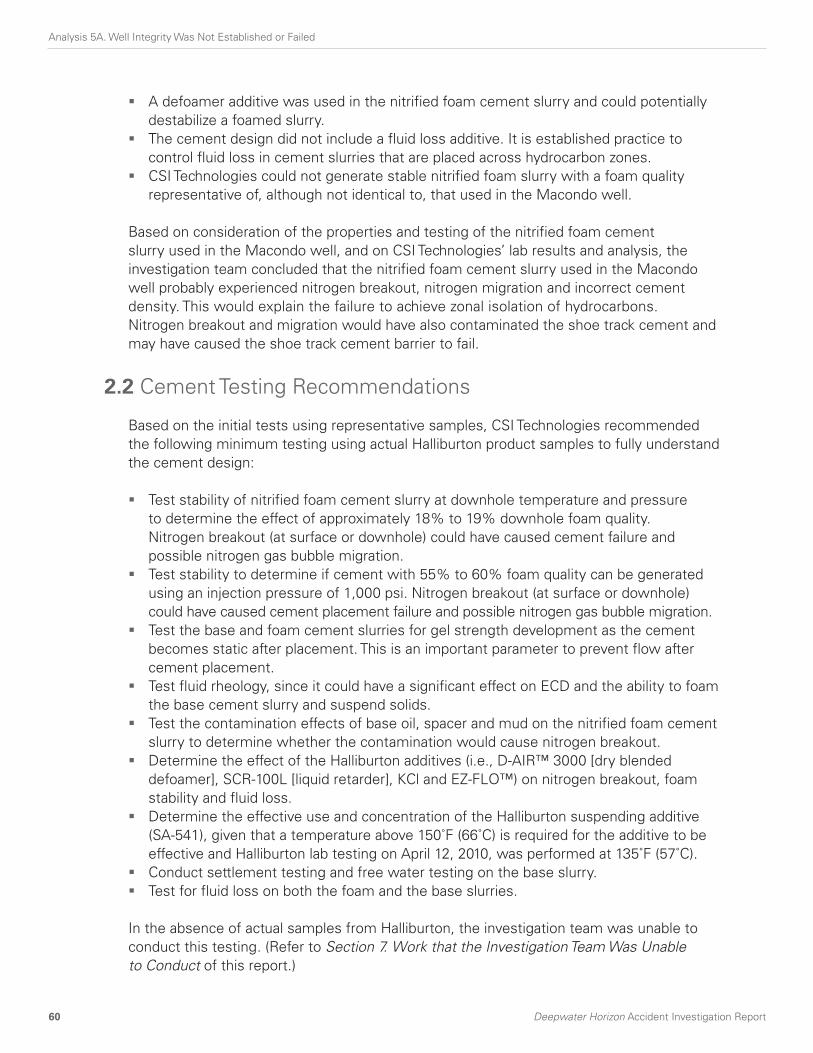
60
Analysis 5A. Well Integrity Was Not Established or Failed
Deepwater Horizon Accident Investigation Report
� A defoamer additive was used in the nitrified foam cement slurry and could potentially
destabilize a foamed slurry.
� The cement design did not include a fluid loss additive. It is established practice to
control fluid loss in cement slurries that are placed across hydrocarbon zones.
� CSI Technologies could not generate stable nitrified foam slurry with a foam quality
representative of, although not identical to, that used in the Macondo well.
Based on consideration of the properties and testing of the nitrified foam cement
slurry used in the Macondo well, and on CSI Technologies’ lab results and analysis, the
investigation team concluded that the nitrified foam cement slurry used in the Macondo
well probably experienced nitrogen breakout, nitrogen migration and incorrect cement
density. This would explain the failure to achieve zonal isolation of hydrocarbons.
Nitrogen breakout and migration would have also contaminated the shoe track cement and
may have caused the shoe track cement barrier to fail.
2.2 Cement Testing Recommendations
Based on the initial tests using representative samples, CSI Technologies recommended
the following minimum testing using actual Halliburton product samples to fully understand
the cement design:
� Test stability of nitrified foam cement slurry at downhole temperature and pressure
to determine the effect of approximately 18% to 19% downhole foam quality.
Nitrogen breakout (at surface or downhole) could have caused cement failure and
possible nitrogen gas bubble migration.
� Test stability to determine if cement with 55% to 60% foam quality can be generated
using an injection pressure of 1,000 psi. Nitrogen breakout (at surface or downhole)
could have caused cement placement failure and possible nitrogen gas bubble migration.
� Test the base and foam cement slurries for gel strength development as the cement
becomes static after placement. This is an important parameter to prevent flow after
cement placement.
� Test fluid rheology, since it could have a significant effect on ECD and the ability to foam
the base cement slurry and suspend solids.
� Test the contamination effects of base oil, spacer and mud on the nitrified foam cement
slurry to determine whether the contamination would cause nitrogen breakout.
� Determine the effect of the Halliburton additives (i.e., D-AIR™ 3000 [dry blended
defoamer], SCR-100L [liquid retarder], KCl and EZ-FLO™) on nitrogen breakout, foam
stability and fluid loss.
� Determine the effective use and concentration of the Halliburton suspending additive
(SA-541), given that a temperature above 150˚F (66˚C) is required for the additive to be effective and Halliburton lab testing on April 12, 2010, was performed at 135˚F (57˚C).
� Conduct settlement testing and free water testing on the base slurry.
� Test for fluid loss on both the foam and the base slurries.
In the absence of actual samples from Halliburton, the investigation team was unable to
conduct this testing. (Refer to Section 7. Work that the Investigation Team Was Unable
to Conduct of this report.)
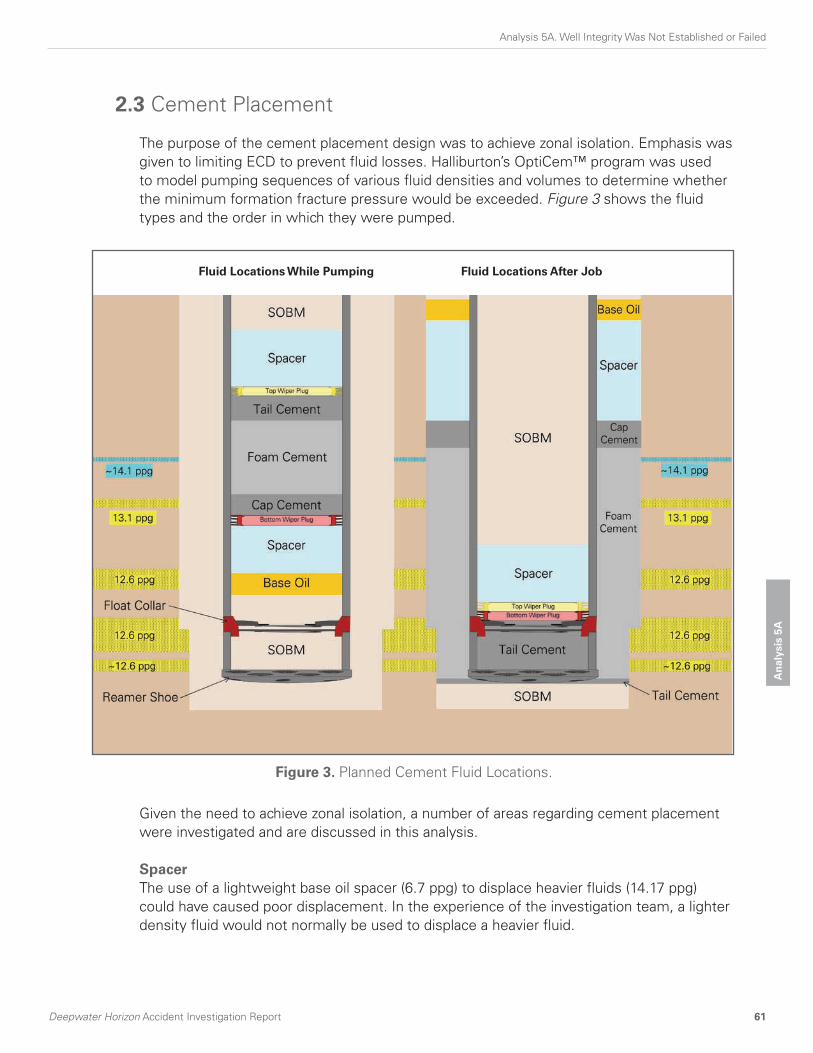
An
aly
sis
5A
Deepwater Horizon Accident Investigation Report 61
Analysis 5A. Well Integrity Was Not Established or Failed
2.3 Cement Placement
The purpose of the cement placement design was to achieve zonal isolation. Emphasis was
given to limiting ECD to prevent fluid losses. Halliburton’s OptiCem™ program was used
to model pumping sequences of various fluid densities and volumes to determine whether
the minimum formation fracture pressure would be exceeded. Figure 3 shows the fluid
types and the order in which they were pumped.
Given the need to achieve zonal isolation, a number of areas regarding cement placement
were investigated and are discussed in this analysis.
Spacer
The use of a lightweight base oil spacer (6.7 ppg) to displace heavier fluids (14.17 ppg)
could have caused poor displacement. In the experience of the investigation team, a lighter
density fluid would not normally be used to displace a heavier fluid.
Fluid Locations While Pumping Fluid Locations After Job
Figure 3. Planned Cement Fluid Locations.

62
Analysis 5A. Well Integrity Was Not Established or Failed
Deepwater Horizon Accident Investigation Report
Analysis—Spacer
Placing the base oil spacer before the cement spacer reduced the hydrostatic pressure in
the annulus, thus increasing the potential for flow up the annulus. However, there was no
evidence that the well was flowing immediately after cement placement. Available evidence,
hydrostatic pressure calculations, static kill data analysis and OLGA® well flow modeling
suggested that hydrocarbons flowed through the shoe track, rather than up the annulus.
(Refer to 3. Mechanical Barriers of this analysis.)
Displacement Efficiency
The use of lightweight nitrified foam cement slurry (14.5 ppg) behind heavier cap
cement slurry (16.74 ppg) could have resulted in the mixing of the two slurries or
poor displacement.
Analysis —Displacement Efficiency
The investigation team could not determine whether mixing or poor displacement of the
slurry occurred or contributed to the accident.
Equivalent Circulating and Static Density During Cement Placement
During cement placement, the ECD remained above reservoir pressure of the
hydrocarbon-bearing sands, therefore, no hydrocarbon in-flow could have occurred
during fluid circulation or cement placement.
Modeling suggested there was a brief period after the bottom wiper plug landed during
which the static density could have fallen below the highest known pressure in the
wellbore. However, real-time data (pit volumes and flow meters) indicated that circulation
was reduced but was not completely stopped. The investigation team did not find any
evidence of an influx of fluids into the wellbore during this brief time.
Analysis—Equivalent Circulating and Static Density During Cement Placement
The investigation team concluded that no hydrocarbon influx occurred during
cement placement.
2.4 Cement Channeling and Casing Centralization
In the days prior to April 20, 2010, Halliburton issued five OptiCem™ reports to BP during the
course of design iteration. The reports reflected a variety of input parameters, including the
number of centralizers, standoff percentages and the size of the open hole. Also relevant to
centralization was whether planned gauge hole or actual open hole caliper data was the input
used for the open hole size.
In terms of centralization, the inputs were as follows:
� April 14, 2010: 70% standoff value, rather than the number of centralizers, was used on
two reports (one with 12 bbls of base oil and one with 7 bbls of base oil); 100% vertical
wellbore was used for wellbore orientation; gauge hole was used to represent the size
of the open hole. CSI Technologies indicated that these three assumptions strongly
decreased the amount of channeling predicted by the simulation.

An
aly
sis
5A
Deepwater Horizon Accident Investigation Report 63
Analysis 5A. Well Integrity Was Not Established or Failed
� April 15, 2010, 15:30 hours: Ten centralizers were specified; 50% standoff value was
specified above the highest centralizer, which would be less accurate than allowing
the model to calculate standoff; limited survey data was used for wellbore orientation;
open hole caliper data was used for the size of the open hole.
� April 15, 2010, 18:12 hours: Twenty-one centralizers were specified; 70% standoff value
was specified above the highest centralizer, which would be less accurate than allowing
the model to calculate standoff; actual survey data was used for wellbore orientation;
open hole caliper data was used for the size of the open hole.
� April 18, 2010, 11:25 hours: Seven centralizers were specified; the program calculated
standoff value; actual survey data was used for wellbore orientation; open hole caliper
data was used for the size of the open hole. After replacing the assumptions with actual
data and the model-calculated standoff above the top centralizer, the model would be
expected to have predicted channeling more accurately.
The BP Macondo well team worked with the Halliburton in-house cementing engineer on
cement design and placement options. Following a discussion on April 14, 2010, it was
determined that cement placement would be possible with the long string. However, the
OptiCem™ modeling report conducted on April 15, 2010, at 15:30 hours, indicated that
using ten centralizers could potentially result in channeling. A second model was run using
21 centralizers, and this model predicted that channeling would not occur.
On April 14, 2010, four days before the casing was scheduled to run, only six inline
centralizers were available. The revised Macondo well plan, dated April 15, 2010, included
the installation of 21 centralizers on the casing. The BP Macondo well team located
15 additional slip-on centralizers, and they made arrangements that evening for the
centralizers to be sent to the rig from BP inventory.
When the additional 15 slip-on centralizers arrived at the rig on April 16, 2010, the BP
Macondo well team erroneously believed that they had received the wrong centralizers.
They were expecting centralizers with an integral stop collar. They were concerned that
adding 15 slip-on stop collars would introduce a greater risk of losing or damaging
the centralizers.
This concern was based on another BP Gulf of Mexico operation that had recently
experienced problems with slip-on stop collars and centralizers; the stop collars moved,
and the centralizers’ blades were broken off while running, which may have prevented the
casing from going to the bottom.
The BP Macondo well team discussed the issues, including the indication of possible
channeling from the April 15, 2010, 15:30 hours, OptiCem™ report. They weighed the risks
of possible channeling with six centralizers, versus debris and damage if they used the
additional 15 slip-on centralizers. The BP Macondo well team decided to run the casing
using six inline centralizers (placed across the main pay sands) to achieve zonal isolation.
The team discounted the risk of channeling that was predicted by the model as the
wellbore was nearly vertical above the main pay sands.

64
Analysis 5A. Well Integrity Was Not Established or Failed
Deepwater Horizon Accident Investigation Report
On April 18, 2010, at approximately 00:30 hours, the rig started running the 9 7/8 in. x 7 in.
long string. At approximately 20:58 hours the same day, the Halliburton in-house cementing
engineer sent an email to several BP and Halliburton personnel that contained partial
lab test results, a new OptiCem™ modeling report (using seven inline centralizers) and
Halliburton’s recommended cementing procedure for the Macondo well cement job.
The OptiCem™ model predicted a ”severe” gas flow potential, driven mainly by
the possibility of cement and spacer fluid channeling above a 13.97 ppg interval.
OptiCem™ software considers only the formation pressure and not the fluid content,
net pay thickness or permeability of an interval when computing gas flow potential.
The 13.97 ppg interval at 18,200 ft. was included in the OptiCem™ model report as the
reservoir zone. The investigation team was unable to clarify why this pressure (13.97 ppg)
was used in the model since available log data measured the main reservoir pressure to be
12.6 ppg at the equivalent depth. Use of the higher pressure would tend to increase the
predicted gas flow potential.
The same OptiCem™ report refers to a 14.01 ppg zone at 17,700 ft. (which, in fact, should
be 14.1 ppg: the actual pressure measured using the GeoTap® logging-while-drilling tool).
However, the report does not include a prediction of gas flow potential for this zone. In fact,
this zone would not be expected to present a possibility of gas flow or hydrocarbon ingress,
since the BP subsurface team for the Macondo well assigned this interval a value of zero
net pay. This was because they found the thin sand layers in the interval to be below log
resolution, and that attempts to obtain fluid samples were unsuccessful. The interpretation of
fluid content was deemed uncertain, but it was probably water (brine).
The cement job implemented on April 19, 2010, was performed according to the
April 18, 2010, recommended procedure.
Analysis—Cement Channeling and Casing Centralization
The investigation team could not determine why the variety of input parameters was used
or changed for the different OptiCemTM modeling runs. Wellbore survey data was available
after the well reached total depth on April 9, 2010. Open hole caliper data was collected
on April 10–11, 2010. In the opinion of the investigation team, once the wellbore survey
data and the open hole caliper data were available (with the program calculating standoff
above the top centralizers), both sets of data should have been used for all modeling runs
to accurately determine the requirements for cement channeling prevention. The model run
on April 18, 2010, was the most accurate prediction of cement channeling.
The investigation team determined through interviews that the decision to ship
15 additional centralizers was made as a result of the OptiCemTM modeling on
April 15, 2010. In the investigation team’s opinion, when concerns arose over what
were thought to be incorrect centralizers, the BP Macondo well team did not follow a
documented management of change (MOC) process and therefore did not identify that
they were in fact the correct centralizers. When the decision was made to proceed without
the additional centralizers, the BP Macondo well team did not ask for the OptiCem™ model
to be re-run.

An
aly
sis
5A
Deepwater Horizon Accident Investigation Report 65
Analysis 5A. Well Integrity Was Not Established or Failed
The decision not to use 21 centralizers increased the possibility of channeling above the
main hydrocarbon zones, but it likely did not contribute to the cement’s failure to isolate the
main hydrocarbon zones or to the failure of the shoe track cement.
2.5 Lost Circulation and Equivalent Circulating Density
Severe losses occurred near the bottom of the production section of the wellbore while
drilling. The ECD was recorded as high as 14.8 ppg prior to the losses. To control the
losses, the mud density was reduced, and a lost circulation pill was placed in the bottom
of the wellbore. This solved the lost circulation problems. After wireline logging, a cleanout
trip verified that the wellbore was in good condition. No problems with the wellbore were
encountered on the cleanout trip, and lost circulation did not recur.
Halliburton’s OptiCem™ cement placement modeling indicated that the ECD would slightly
exceed the fracture gradient toward the end of the job. This could have resulted in losses
during cement placement. Lost circulation material (Halliburton WellLife™ 734) was added
to the cement slurry as a precaution to prevent losses.
Analysis—Lost Circulation and ECD
The well was modeled using the minimum fracture gradient value. OptiCem™ modeling
indicated that if the ECD exceeded the minimum fracture gradient value and then losses
occurred, those losses would occur during the end of cement placement and would have
little impact on the isolation of the main pay sands. Analysis showed that no more than
3 bbls of fluid were lost during cement placement from the time that the bottom wiper
plug landed to the time the top wiper plug landed. The investigation team concludes that
this issue did not contribute to the accident.
2.6 Planning For Temporary Abandonment
The BP Macondo well team prepared a detailed decision tree for the temporary
abandonment of the well. The decision tree outlined steps to confirm the top of cement
(TOC); this was consistent with Minerals Management Services (MMS) regulations (Casing
and Cementing Requirements, 30 CFR Section 250, 428). This approach was based on the
evaluation of lift pressure and full returns during cement placement.
As a contingency, the BP Macondo well team decided to position a logging crew and tools
on the rig to run a cement evaluation log if fluid losses occurred during cement placement.
To facilitate running the cement evaluation log as deeply as possible, the cement job was
designed so that cement would not be placed above the top wiper plug.
On the Macondo well, 1,000 ft. of cement above the uppermost hydrocarbon-bearing
sand would have placed the cement inside the previous casing string, potentially creating
a trapped annulus and causing problems with annular pressure build-up (APB). BP’s
policy discourages creating a trapped annulus on subsea wells, unless it is required for
zonal isolation. The BP Macondo well team decided to place the TOC 500 ft. above the
uppermost hydrocarbon-bearing sand, per MMS regulations.

66
Analysis 5A. Well Integrity Was Not Established or Failed
Deepwater Horizon Accident Investigation Report
Under Section 5 of BP’s Engineering Technical Practice (ETP), GP 10-60 Zonal Isolation
Requirements During Drilling Operations and Well Abandonment and Suspension, if less
than 1,000 ft. of cement above a distinct permeable zone is planned, then TOC must be
determined by a “proven cement evaluation technique” such as a cement evaluation log.
In addition, the plan must include 100 ft. of centralized pipe to be placed above any distinct
permeable zone.
The information available to the BP well site leader and the Halliburton rig-based cement
operator indicated that cement placement was performed as planned with lift pressure
and no observed fluid losses. This post-job information was discussed during the morning
operations telephone call involving personnel from BP and its Macondo well contractors.
The BP Macondo well team decided not to run a cement evaluation log prior to temporary
abandonment, reportedly reflecting consensus among the various parties on the call. The
investigation team has not seen evidence of a documented review and risk assessment with
respect to well condition and duration of suspension, regarding the annulus cement barriers.
Analysis—Planning for Temporary Abandonment
In the investigation team’s opinion, evaluating lift pressure and lost returns did not
constitute a “proven cement evaluation technique” per Section 5 of the ETP GP 10-60.
This section does not specify when a proven cement evaluation technique shall be
employed, but typically a cement evaluation log would be run during the completion
phase of the well.
By not conducting a formal risk assessment of the annulus cement barriers per the ETP
recommendation, it is the investigation team’s view that the BP Macondo well team did not
fully conform to the intent of ETP GP 10-60. Such a risk assessment might have enabled
the BP Macondo well team to identify further mitigation options to address risks such as
the possibility of channeling; this may have included running a cement evaluation log.
2.7 Cement Design, Oversight, Communication and Evaluation
The investigation team considered the overarching organizational, decision-making and
contractor management aspects of the Macondo well cement design and placement.
This part of the analysis describes the investigation team’s factual findings and conclusions.
An overview of BP and Halliburton collaboration on the Macondo well follows:
� As the well operator, BP provided to Halliburton well data such as fracture gradient, open
hole caliper measurements, well survey measurements, downhole temperatures and
pore pressure. BP also provided casing design information and planned mud densities.
� As the cementing advisor and product and equipment provider, Halliburton used this
data to design a cement job that was intended to deliver zonal isolation for the well.
The design included the types of cement slurry, spacer types, necessary quantities of
cement and spacers, pump schedule and horsepower requirements. The Halliburton
in-house cementing engineer was co-located with the BP Macondo well team.

An
aly
sis
5A
Deepwater Horizon Accident Investigation Report 67
Analysis 5A. Well Integrity Was Not Established or Failed
� To complete the cement design, the Halliburton in-house cementing engineer used
the data and Halliburton’s planned cement job design as input to its OptiCem™ model.
The outputs from the model predicted some aspects of the effectiveness and risks of
cement placement in delivering zonal isolation and well integrity. These aspects included
the necessary TOC estimate, surface pressures, lift pressure, ECD, foam quality, fluid
velocities, potential for channeling, standoff predictions, mud removal, gas flow potential
and displacement efficiency.
� The cement placement design was an iterative process. In light of an OptiCem™
report, adjustments were made to the cement slurry design, spacer design, centralizer
placement and pump rates, and then another OptiCem™ report was issued. Reports were
provided to BP on the various dates mentioned throughout this analysis.
� In designing cement placement, the Halliburton in-house cementing engineer should
have considered other factors not predicted by the OptiCem™ report, such as foam
stability, fluid loss and compatibility of fluids.
� Halliburton conducted laboratory testing of the fluids (e.g., cement, mud, spacers) that
were planned for use in the job. Some lab testing results formed further inputs into
the OptiCem™ model; lab testing results were also relevant to other aspects of the
Halliburton design.
� Halliburton provided a cement job recommendation, the cement products and additives,
the pump equipment and the personnel to operate that equipment aboard the rig.
BP provided the casing string and other mechanical components of the well,
including centralizers.
� Once the decision was made to proceed with cement placement, the Halliburton
rig-based cement operator was responsible for mixing and pumping the slurry according
to design, recording real-time data from the Halliburton equipment and providing a
post-job report. The post-job report dated April 20, 2010, was provided to BP on
April 23, 2010.
Several key factors (such as small cement slurry volume [approximately 62 bbls], narrow
pore pressure/fracture gradient window and upper technical range for using nitrified foam
cement) highlight the difficulties in designing a reliable cement slurry.
The BP Macondo well team and the Halliburton in-house cementing engineer were aware
of the narrow pore pressure/fracture gradient window. This was evident by the number of
OptiCem™ model runs and meetings held to discuss ECD and channeling potential.
The investigation team found:
� The Halliburton lab testing results that the investigation team reviewed for the foamed
and base slurry designs did not include testing for fluid loss, stability, free water,
compatibility, static gel strength transition time, zero gel time or settlement. At the time
this report was written, although requested, Halliburton had not provided their applicable
policies to the investigation team; therefore, the investigation team was unable to
assess policy conformance.
� Halliburton lab test results indicated nitrified foam cement slurry tested at 12.98% foam
quality, despite the fact that the OptiCem™ report of April 18, 2010, predicted the use
of 18% to 19% foam quality. The results appeared to indicate foam instability in the
12.98% foam quality cement slurry.

68
Analysis 5A. Well Integrity Was Not Established or Failed
Deepwater Horizon Accident Investigation Report
� It did not appear that Halliburton conducted all relevant lab tests on the final cement
slurry prior to proceeding with cement placement. The investigation team saw no
evidence that the BP Macondo well team confirmed that all relevant lab test results had
been obtained and considered by the Halliburton in-house cementing engineer before
cement placement proceeded.
� The investigation team understands that when the BP Macondo well team decided
to proceed with six centralizers, they did not directly inform the Halliburton in-house
cementing engineer. The investigation team also understands that the Halliburton
in-house cementing engineer learned of that decision via the Halliburton rig-based
cement operator. The in-house cementing engineer’s subsequent re-run of the
OptiCem™ model and email communication of the results on April 18, 2010, are
discussed in Section 2.4 Cement Channeling and Casing Centralization of this analysis.
� The investigation team had no information as to the extent, if any, that Halliburton
supervised or provided technical support to the Halliburton in-house cementing engineer
on the Macondo well job. The investigation team was also unaware of any direct
engagement between Halliburton supervisory personnel and the BP Macondo well
team regarding the design of the Macondo well job.
Analysis—Cement Design, Oversight, Communication and Evaluation
Based on the information reviewed and the interviews conducted, the investigation
team’s opinion was that more thorough review and testing by Halliburton and stronger
quality assurance by the BP Macondo well team might have identified potential flaws and
weaknesses in the slurry design. In turn, this would have increased the awareness of risks
associated with this cement job and led to either a redesign or additional quality assurance
steps to confirm zonal isolation.
3 Mechanical Barriers
After the annulus cement barrier was breached, two possible flow paths existed. Each flow
path had additional barriers. One or more of the mechanical barriers must have failed allowing
hydrocarbons to flow to the surface.
One possible flow path was through the shoe track. The barriers within the shoe track included
the shoe track cement and double-valve float collar.
The second possible flow path was through the annulus area. In the annulus the mechanical
barriers were:
� The casing hanger seal assembly at the wellhead.
� The production casing and components.
The investigation team used the following approaches to assess which barriers failed:
� OLGA® well flow modeling to simulate flowing conditions against various flow paths.
Modeling hydrocarbon entry through the shoe track matched known real-time data and
witness accounts regarding flow out of the well; modeling hydrocarbon entry through
the annulus and seal assembly did not match that data. (Refer to Appendix G. Analysis
Determining the Likely Source of In-flow and Appendix W. Report–Dynamic Simulations
Deepwater Horizon Incident BP.)

An
aly
sis
5A
Deepwater Horizon Accident Investigation Report 69
Analysis 5A. Well Integrity Was Not Established or Failed
� Hydrostatic pressure calculations to determine that surface pressure increases could
only be matched with known pressures if the flow entry point occurred deep below
the wellhead. This was consistent with hydrocarbon entry through the shoe track or
through failed casing at a comparable depth in the wellbore; however, it was inconsistent
with hydrocarbon entry through the seal assembly. (Refer to Appendix G.)
� Evaluation of the pressure response and injected fluid volumes from the static kill
performed on August 4, 2010. This indicated that the flow path was through the shoe track.
Analysis—Mechanical Barriers
Examination of potential failure modes for each of the barriers pointed toward entry through
the shoe track rather than through the casing or the seal assembly; a plausible failure mode for
the seal assembly barrier was identified, but this entry pathway was not consistent with the
OLGA® well inflow modeling, hydrostatic pressure calculations and the static kill data analysis.
3.1 Shoe Track
The shoe track had three components: the
reamer shoe, the cement inside the casing
and the double-valve float collar. (Refer to
Figure 4.) The shoe track functions as an
aid to cementing during the placement
operation and then as a barrier to prevent
hydrocarbons from entering through the
bottom of the casing. If hydrocarbons
passed through the shoe track, two failures
in the shoe track must have occurred: one
involving the cement inside the shoe track
and the other involving the double-valve
float collar.
Cement in the Shoe Track
The shoe track cement (tail cement) was
16.74 ppg non-foamed slurry using the
Halliburton formulation shown in Table 1.
The purpose of the shoe track cement
was to fill an approximately 190 ft. section
of the casing (approximately 7 bbls) from
the top wiper plug through the reamer
shoe, thus preventing hydrocarbons from
reaching the float collar.
Analysis—Cement in the Shoe Track
Based on available evidence, hydrostatic
pressure calculations, OLGA® well flow
modeling and analysis of data from the Macondo well static kill on August 4, 2010,
hydrocarbons entered the casing through the shoe track. Therefore, the shoe track cement
and the float collar must have failed to prevent this ingress. The investigation team has not
Figure 4. Shoe Track.

70
Analysis 5A. Well Integrity Was Not Established or Failed
Deepwater Horizon Accident Investigation Report
established whether this failure was attributable to the design of the cement, contamination
of the cement by mud in the wellbore, commingling of cement with nitrogen due to
nitrogen breakout from the foam cement slurry, swapping of the shoe track cement with the
mud in the rathole (bottom of the well), or some combination of these factors.
CSI Technologies’ recommendations for future testing are relevant to all of these potential
failure modes. (Refer to 2.2 Future Cement Testing Recommendations of this analysis.)
Double-Valve Float Collar in the Shoe Track
The float collar, a check valve device manufactured by Weatherford, was installed to prevent
backflow or ingress of fluids into the casing. For hydrocarbons to flow into the casing from
the bottom of the wellbore, the hydrocarbons must have passed through this barrier.
The first issue concerned conversion of the float collar. After the casing was installed,
float collar conversion was attempted. (Refer to Figure 5.) The float collar was run with
two check valves that were held open by the auto-fill tube. The auto-fill tube allows mud
to flow into the casing, minimizing the surge forces placed on the formation to prevent
lost circulation. To convert the float collar, a ball seals in the auto-fill tube during circulation,
restricting flow by diverting mud through two small ports in the auto-fill tube.
Circulation through these ports creates a differential pressure in the float collar, forcing the
auto-fill tube out of the float collar, and allowing the check valves to close.
Based on information that Weatherford supplied to the investigation team, the float collar
conversion should have occurred with a differential pressure between 400 psi to 700 psi.
Using the Weatherford flow equation, this would have required a flow rate of 5 bpm to
7 bpm. When the conversion is completed, the two check valves can move into a closed
position, which should prevent flow up the casing. When circulation was attempted on
this well, either the float collar or the reamer shoe was plugged. The rig crew made nine
attempts to establish circulation by increasing pressure on the casing. Circulation was
finally established with 3,142 psi. It was not clear to the investigation team whether this
pressure converted the float collar, or if it simply cleared a plugged shoe. If the shoe was
plugged, the float collar conversion may not have occurred. Circulation rates throughout the
rest of cement placement and displacement did not exceed 4.3 bpm, which was below the
specified conversion flow rate.
The second issue concerned another event that may have affected the float collar.
This occurred when the Weatherford bottom wiper plug landed on the float collar.
This wiper plug separated the cement from the fluids ahead of the wiper plug to prevent
cement contamination. When the wiper plug landed on the float collar, pressure was
applied to rupture a burst disk in the wiper plug, which allowed circulation to continue.
This burst disk was designed to rupture between 900 psi and 1,100 psi. The burst disk did
not rupture until 2,900 psi was applied, and cement displacement continued.
At the time this report was written, lab tests were being conducted to determine whether
the rush of fluids converted the float collar when the bottom wiper plug’s burst disk
ruptured or when the plugged shoe was cleared. Preliminary model results indicate that
conversion most likely occurred in either case.
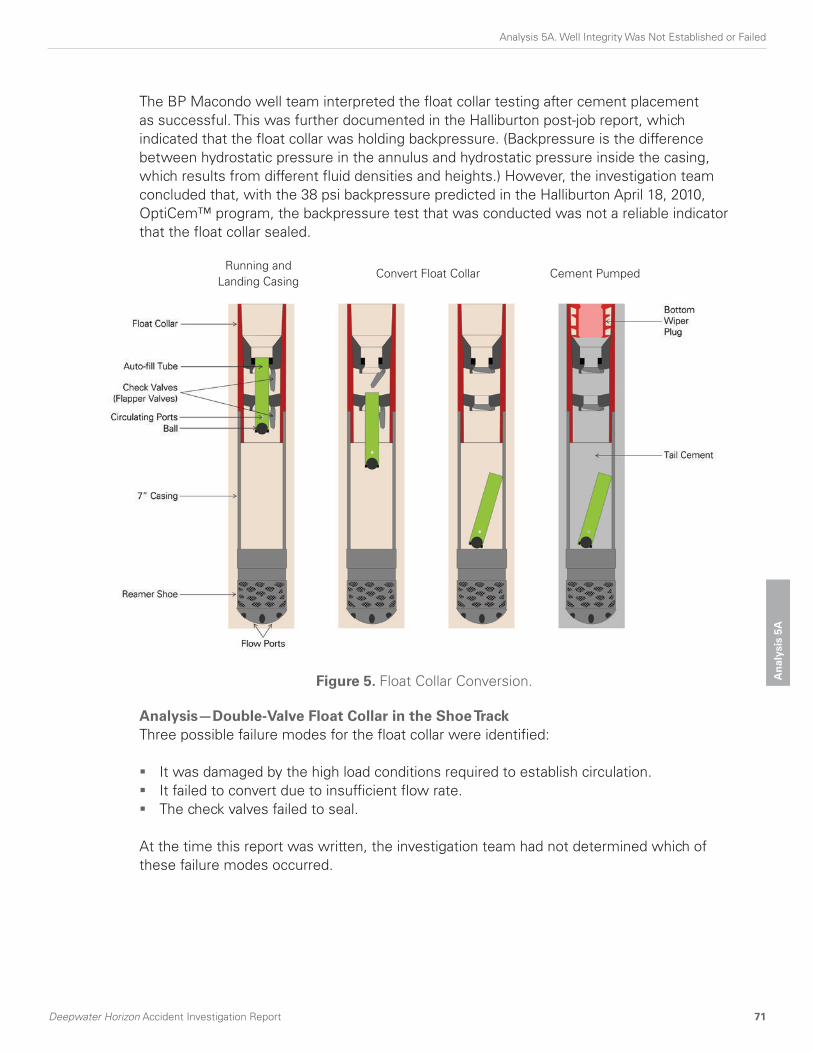
An
aly
sis
5A
Deepwater Horizon Accident Investigation Report 71
Analysis 5A. Well Integrity Was Not Established or Failed
The BP Macondo well team interpreted the float collar testing after cement placement
as successful. This was further documented in the Halliburton post-job report, which
indicated that the float collar was holding backpressure. (Backpressure is the difference
between hydrostatic pressure in the annulus and hydrostatic pressure inside the casing,
which results from different fluid densities and heights.) However, the investigation team
concluded that, with the 38 psi backpressure predicted in the Halliburton April 18, 2010,
OptiCem™ program, the backpressure test that was conducted was not a reliable indicator
that the float collar sealed.
Analysis—Double-Valve Float Collar in the Shoe Track
Three possible failure modes for the float collar were identified:
� It was damaged by the high load conditions required to establish circulation.
� It failed to convert due to insufficient flow rate.
� The check valves failed to seal.
At the time this report was written, the investigation team had not determined which of
these failure modes occurred.
Running and
Landing CasingConvert Float Collar Cement Pumped
Figure 5. Float Collar Conversion.

72
Analysis 5A. Well Integrity Was Not Established or Failed
Deepwater Horizon Accident Investigation Report
In the course of its work, the investigation team commissioned a third party testing lab to
undertake certain conversion modeling and tests of float collars having the same design as
the float collar installed in the Macondo well. Based on the testing and analysis performed
to date, no probable failure mode has been identified that would further the goals of the
Terms of Reference in providing an understanding of the causation of the accident (in
terms of learning how the Macondo well float collar came to allow hydrocarbon ingress).
However, the investigation team has concluded that continuation of the testing program
has the potential to provide useful insights about the performance of float collars in
deepwater wells, in general. Accordingly, when the testing lab reports the outcome of the
testing program, the results will be provided to BP.
Analysis—Shoe Track
Available evidence, hydrostatic pressure calculations, static kill data analysis and OLGA®
well flow modeling indicated that the hydrocarbon flow to the wellbore was through the
shoe track. The investigation team has not established specifically which shoe track cement
and float collar failure modes allowed hydrocarbon ingress.
3.2 Casing Hanger Seal Assembly
Subsea wellheads use a casing hanger system to suspend the casing in the high-pressure
housing located at the sea floor. A seal assembly (or pack off) located between the casing
hanger and the high-pressure housing is designed to prevent hydrocarbons that have
breached the annulus cement barrier from entering the wellbore.
Wellhead System Design
BP used Dril-Quip’s SS-15® BigBore™ II Subsea Wellhead System (18 3/4 in., 15,000 psi).
In this equipment, the seal assembly is locked to the casing hanger when the casing
is run. Until a lockdown sleeve locking the hanger seal assembly to the high-pressure
housing is installed, upward movement could occur. (Refer to Appendix C. Macondo Well
Components of Interest.)
Two options were available to prevent this movement:
� Use a seal assembly with an outer lock ring that locks the seal assembly to the
high-pressure housing at the time the casing hanger and seal assembly are run.
� Run a lockdown sleeve after running and cementing the casing.
The Macondo well plan indicated that a lockdown sleeve was to be run after the final
cement plug was set.
To install the lockdown sleeve, 100,000 lbs of weight was required on the running tool. This
required approximately 3,000 ft. of drill pipe to be run below the running tool. Allowing for
this length of drill pipe determined the final cement plug setting depth. In turn, the cement
plug setting depth 3,000 ft. below the wellhead influenced the differential pressure created
during the negative-pressure test.

An
aly
sis
5A
Deepwater Horizon Accident Investigation Report 73
Analysis 5A. Well Integrity Was Not Established or Failed
Analysis—Wellhead System Design
The investigation team reviewed engineering drawings, manufacturing data and installation
records to determine whether the casing hanger seal assembly was manufactured and
installed in accordance with Dril-Quip instructions. The investigation team found no
indications of improper assembly or installation.
Casing Hanger Lift Off Conditions and Flow Possibility
When the Dril-Quip seal assembly is locked only to the casing hanger (but not to the
high-pressure housing, as was the case in the Macondo well), the seal assembly with the
casing hanger can move upward if sufficient loads are applied. The seal assembly remains
stationary as long as the weight of the casing suspended by the hanger, plus frictional
forces for uncemented casing, are greater than the effective upward forces created from
temperature and pressure changes. Otherwise, the casing hanger and casing can lift off,
possibly rendering the seal ineffective.
Depending on conditions, lift off can produce different results. If the casing hanger, seal
assembly and production casing are at a neutral balance point, no weight is applied at
the load shoulder in the subsea wellhead. If the seal assembly is not damaged, internal
mechanical restrictions prevent flow.
However, if forces were to move the casing hanger and seal assembly approximately 6 in.
upward, the seal assembly would be positioned across an area of the subsea wellhead that
had a larger inner diameter. In this elevated position, the area around the seal assembly
would allow flow to occur.
Another possible seal assembly failure involves lift off caused by differential pressures,
elongation of the production casing or both.
The investigation team’s analysis of the design loads showed that the casing hanger seal
assembly and the casing string were close to initial lift off conditions from the load
shoulder during the negative-pressure test with the drill pipe stinger that was positioned at
8,367 ft. (Refer to Appendix M. Summary Report Global Analysis of Macondo 9 7/8-in x
7-in Production Casing 4992 ft Water Depth, GoM [For Macondo Well Investigation]).
Numerous conditions were included in the analysis, such as friction factors, the
internal volume of the casing’s displacement to seawater and cemented versus
non-cemented casing.
The results of two scenarios involving different conditions were:
� An analysis using worst-case conditions (non-cemented casing, no friction and fully
displaced to seawater above the drill pipe stinger) indicated that approximately 260 psi
of additional pressure in the annulus could initiate lift off.
� A more realistic analysis (using cement, friction factors and casing elongation due to
displacement changes in pressure) indicated that approximately 560 psi of additional
pressure in the annulus could initiate lift off. Moving the casing hanger seal assembly
6 in. upward and out of the wellhead sealing area required approximately 620 psi.

74
Analysis 5A. Well Integrity Was Not Established or Failed
Deepwater Horizon Accident Investigation Report
Any lift off could have compromised the effectiveness of the seal, since it was not
designed to be a dynamic seal. However, achieving sustained lift off would have been
difficult, given the pressure bleed-off that would have occurred each time the seal
assembly lifted off more than 6 in.
The investigation team did not conclusively rule out the possibility that lift off conditions
occurred. It is also probable that nitrogen breakout occurred, and in theory, nitrogen
migration up the annulus could then have created the necessary initial lift pressure.
A pressure analysis due to nitrogen migration was completed using open hole leak
off pressures (weakest to strongest) and 14.17 ppg mud in the annulus. A range of
approximately 400 psi to 1,000 psi could be obtained before leak off to the formation
would have occurred. Given that the leak off pressure could be higher than the initial lift off
pressure, this scenario was not eliminated.
The investigation team concluded that the initial flow into the wellbore was not through the
seal assembly. With no locking mechanism installed, thermal stresses caused by sustained
hydrocarbon flow from the reservoir through the shoe track may have subsequently
opened a flow path through the seal assembly.
Analysis—Casing Hanger Lift Off Conditions and Flow Possibility
The investigation team’s analysis indicated that uplift forces approached, but did not
attain, loads that were sufficient to unseat the seal assembly. However, a plausible load
case could have caused the casing hanger seal assembly to lift off. From casing analysis
and interviews, load cases for the production casing design were run to simulate normal
production conditions (pressure and temperature). The load condition generated by the
negative-pressure test was not recognized or evaluated as part of the production casing
design. The investigation team’s hydrostatic pressure calculations, static kill data analysis
and OLGA® well flow modeling indicated hydrocarbon influx through the shoe track.
This supports the conclusion that the uplift forces during the negative-pressure test
did not unseat the casing hanger seal assembly.
3.3 Production Casing and Components
The production casing consisted of a casing hanger, a 9 7/8 in. production casing, a
9 7/8 in. x 7 in. crossover joint, and a 7 in. production casing. Failure of any of these
components could have allowed hydrocarbons to enter the casing. The investigation
team reviewed manufacturing data, inspection reports, installation reports, casing-running
operations and positive-pressure integrity tests. In addition, a casing design review was
performed using actual wellbore conditions. The positive-pressure test to 2,700 psi confirmed
casing integrity. (Refer to Appendix N. Mississippi Canyon 252 No. 1 [Macondo] Basis of
Design Review.)
Analysis—Production Casing and Components
The investigation team concluded that the production casing and components met all
required design conditions and that it was highly unlikely that a casing failure mode
contributed to the loss of well control.

An
aly
sis
5A
Deepwater Horizon Accident Investigation Report 75
Analysis 5A. Well Integrity Was Not Established or Failed
4 Design Decision (Long String versus Liner)
The investigation team reviewed the decision to install a 9 7/8 in. x 7 in. long string versus
a 7 in. liner that would be tied back to the wellhead at a later date. (Refer to Figure 6.) Installing a
long string would prepare the well for later production. Installing a liner would require installation
of a tieback at a later date before production could start. During temporary abandonment, the top
of the long string would be sealed at the casing hanger in the wellhead, while the liner would be
sealed at the downhole liner hanger.
The investigation team considered the following four factors in the evaluation of the decision to
select a long string rather then a liner:
� Zonal Isolation – whether casing string configuration could support ECD requirements for
establishing zonal isolation.
� Annular Pressure Build-up – whether the string configuration would create a trapped annulus.
� Mechanical Barriers and Integrity – whether seal locations and installation would increase
the risk of seal failure.
� Total Lifetime Cost – total installed cost, factoring in mechanical risk considerations.
Long String Liner Liner with Tieback
Figure 6. Long String, Liner and Liner with Tieback.

76
Analysis 5A. Well Integrity Was Not Established or Failed
Deepwater Horizon Accident Investigation Report
4.1 Zonal Isolation
The BP Macondo well team and Halliburton’s cementing engineer evaluated numerous
OptiCem™ model runs comparing long string and liner cementing. The outputs were
predictions of mud displacement efficiency, wellbore pressures during cementing and final
cement column height.
Based on the modeling performed on April 14, 2010, Halliburton’s in-house cementing
engineer and the BP Macondo well team determined that cement placement for adequate
zonal isolation was possible with the long string.
The input files that Halliburton used for the modeling runs were not available to the
investigation team. The investigation team and CSI Technologies used a licensed version
of the OptiCem™ software to compare the long string and liner, using the best available
representative inputs. In both cases, the peak ECD values were comparable. Although the
liner was shorter than the long string, the liner hanger had a small bypass area that caused
a significant pressure increase, which contributed to the total ECD. In both cases, adequate
centralization would be required to prevent channeling, and the shoe track would be identical.
The maximum ECD slightly exceeded the minimum formation leak off in both cases.
From a cement placement evaluation standpoint, it appears that either the long string or the
liner could have achieved zonal isolation.
4.2 Annular Pressure Build-up
The investigation team considered the risk of APB. Heat transfer during production causes
fluid expansion in the annulus, with the risk of collapsing the production casing or tieback
string. APB can be exacerbated by a trapped annulus where fluids or pressure have no
place to bleed off. One APB mitigation in the Macondo well design was the burst and
collapse disks that were installed in the 16 in. casing. (Refer to Figure 3 in Section 2.
The Macondo Well.) These disks act as relief valves should annulus pressure exceed the
disk ratings. The most effective way to mitigate APB is to leave an open annulus as the
primary pressure relief mechanism. Therefore, in the investigation team’s opinion, a long
string with an open annulus was the lower risk option for APB.
4.3 Mechanical Barriers and Integrity
Both the long string and the liner have two annulus barriers. The first barrier is the
cement across the hydrocarbon zones, and the second is the mechanical seal at the top
of each string. The long string mechanical seal is the casing hanger seal assembly in the
wellhead. The liner seal is the liner top packer. When installed correctly, a liner tieback
provides additional barriers (cement and wellhead seal assembly). However, the tieback
string introduces a higher risk of mechanical integrity failure due to its difficult installation
requirements. It adds a leak path at the tieback junction and creates a trapped annulus that
increases APB risks.

An
aly
sis
5A
Deepwater Horizon Accident Investigation Report 77
Analysis 5A. Well Integrity Was Not Established or Failed
4.4 Total Lifetime Cost
Materials and rig time costs of the long string are higher than the initial cost of a liner.
Eventually, when the liner is tied back, its costs exceed those of the long string. The greater
mechanical integrity risk of the liner and the tieback were factored into the lifetime cost
analysis of using a long string versus using a liner.
Analysis—Design Decision (Long String versus Liner)
The investigation team determined that using a 9 7/8 in. x 7 in. long string production
casing was an acceptable decision and provided a sound basis of design. As discussed
in 3.3 Production Casing and Components of this analysis, the production casing and
components met all required design conditions. (Refer to Appendix N.) Industry data in
Mississippi Canyon Block 252 area also indicates that approximately 57% of the wells
used long strings while approximately 36% used liners or liners with tiebacks. (Refer to
Appendix O. Industry Comparison Data on Long String Casing and Casing Liners in the
Macondo Well Area.)
5 Conclusions
5.1 Cement Design
Based on CSI Technologies’ lab results and analysis, the investigation team concluded
that the nitrified foam cement slurry used in the Macondo well probably would have
experienced nitrogen breakout, nitrogen migration and incorrect cement density, which
would explain the failure to achieve zonal isolation of hydrocarbons. Nitrogen breakout and
migration would have also contaminated the shoe track cement and may have caused the
shoe track cement barrier to fail.
5.2 Cement Design, Oversight, Communication and Evaluation
The opinion of the investigation team regarding oversight, communication and evaluation
was as follows:
� Communication between BP and Halliburton personnel involved in the cement job was
not effective in relation to the challenges and associated risks with the slurry design
(i.e., stability of the foamed cement) and placement.
� The BP Macondo well team did not provide effective quality assurance on Halliburton’s
technical services.
� The BP Macondo well team did not give BP zonal isolation experts the opportunity to
perform sufficient quality assurance on the Halliburton and BP Macondo well team’s
cement design and procedures.
� The investigation team had no information as to the extent, if any, that Halliburton
supervised or provided technical support to the Halliburton in-house cementing engineer
on the Macondo well job. The investigation team was also unaware of any direct
engagement between Halliburton supervisory personnel and the BP Macondo well
team regarding the design of the Macondo well job.

78
Analysis 5A. Well Integrity Was Not Established or Failed
Deepwater Horizon Accident Investigation Report
5.3 Planning for Temporary Abandonment
In the investigation team’s opinion, evaluating lift pressure and lost returns did not
constitute a “proven cement evaluation technique” per Section 5 of ETP GP 10-60.
Section 5 does not specify when a proven cement evaluation technique shall be employed,
but typically a cement evaluation log would be run during the completion phase of the well.
By not conducting a formal risk assessment of the annulus cement barriers (per
ETP GP 10-60 recommendations), it is the investigation team’s view that the BP Macondo
well team did not fully conform to the intent of the ETP. Such a risk assessment might
have enabled the BP Macondo well team to identify further mitigation options to address
risks such as the possibility of channeling; this may have included the running of a cement
evaluation log.
5.4 Cement in the Shoe Track
Based on available evidence, hydrostatic pressure calculations, OLGA® well flow modeling
and analysis of data from the Macondo well static kill on August 4, 2010, hydrocarbons
entered the casing through the shoe track. Therefore, the shoe track cement and the float
collar barriers must have failed to prevent this ingress. The investigation team has not
established whether this failure was attributable to the design of the cement, contamination
of the cement by the mud in the wellbore, commingling of the cement with nitrogen due to
nitrogen breakout from the foam cement slurry, swapping of the shoe track cement with the
mud in the rathole (bottom of the well) or some combination of these factors.
5.5 Overarching Conclusions
Improved engineering rigor, cement testing and communication of risk by Halliburton could
have identified the low probability of the cement achieving zonal isolation.
Improved technical assurance, risk management and MOC by the BP Macondo well team
could have raised awareness of the challenges of achieving zonal isolation and led to
additional mitigation steps.
6 Recommendations
The investigation team has developed recommendations in response to the findings and
conclusions presented in Section 5. Deepwater Horizon Accident Analyses. (Refer to Section
6. Investigation Recommendations of this report.) These recommendations comprise two
categories: (1) those related to BP’s Drilling and Well Operations Practice (DWOP) and its
Operations Management System (OMS) implementation and (2) those related to BP’s
Contractor and Service Provider Oversight and Assurance.

Deepwater Horizon Accident Investigation Report 79
Analysis 5B. Hydrocarbons Entered the Well Undetected and Well Control Was Lost
An
aly
sis
5B
Analysis 5B. Hydrocarbons Entered the Well Undetected and Well Control Was Lost
1 Introduction
Analysis 5A. Well Integrity Was Not Established or Failed discussed three findings that are
pertinent to this analysis:
� The annulus cement barrier did not isolate the hydrocarbons (Key Finding 1).
� The shoe track barriers did not isolate the hydrocarbons (Key Finding 2).
� The available evidence points to hydrocarbons having entered the casing through the
shoe track.
Analysis 5B. provides details of how those findings relate to the subsequent operations on
Deepwater Horizon as the integrity of the well was tested and how the influx entered and
moved undetected up the wellbore into the riser, resulting in the catastrophic explosions, loss
of life and loss of the rig.
To test the integrity of the well, the rig crew conducted a positive-pressure test on the casing,
and then they conducted a negative-pressure test to confirm that the cement barrier and
mechanical barriers were capable of withstanding an underbalanced condition. Abnormal
pressures observed during the negative-pressure test were indicative of a failed or inconclusive
test; however, the test was deemed successful.
Subsequent displacement of the well to seawater put the well in an underbalanced condition,
allowing the well to flow. This flowing condition went unchecked until an estimated 8 minutes
before the first explosion, after flow had become severe.
From analysis of the information available to the investigation team, flow indications started
approximately 51 minutes before the blowout, although they were not detected until
hydrocarbons from the reservoir had risen above the blowout preventer (BOP) and into the riser.
This analysis considers operational matters and the policies and procedures applicable to
them. BP’s Drilling and Well Operations Practice provides for the preparation of a well control
interface/bridging document between BP and drilling contractors. At the time of the accident,
BP and Transocean did not have a formal joint well control bridging document defining the well
control activities for this well. The investigation team believes that Transocean’s well control
procedures had been considered to be in line with BP’s expectations. This analysis references
in particular the applicable Transocean well control procedures contained in the Transocean
Well Control Handbook, a copy of which was provided to the investigation team. (Refer to
Appendix T. Comparison of Events with Relevant Transocean Well Control Policies, Practices
and Procedures for relevant excerpts.)

80
Analysis 5B. Hydrocarbons Entered the Well Undetected and Well Control Was Lost
Deepwater Horizon Accident Investigation Report
Through the investigation team’s review and analysis of the available information, the team
determined the following key findings:
Key Finding 3. The negative-pressure test was accepted although well integrity had not
been established.
Key Finding 4. Influx was not recognized until hydrocarbons were in the riser.
Key Finding 5. Well control response actions failed to regain control of the well.
Information regarding how the rig crew may have missed indications of this influx and
the rig crew's ensuing response to the well control event was collected from:
� Sperry-Sun real-time data.
� OLGA® well flow modeling.
� Witness accounts from:
� Marine Board of Investigation hearings on May 26–29, July 19–23 and
August 23–27, 2010.
� Interviews conducted by the investigation team.
� A review of BP, Transocean and M-I SWACO documents, such as engineering standards,
policies and operational procedures.
� Data in these appendices:
� Appendix G. Analysis Determining the Likely Source of In-flow.
� Appendix P. BP/Deepwater Horizon Rheliant Displacement Procedure "Macondo"
OSC-G 32306 (M-I SWACO) (electronic media).
� Appendix Q. Summary of The Effect of Spacer Fluid Composition and Placement on
Negative-pressure Test (electronic media).
� Appendix R. Fluid Compressibility Calculations (electronic media).
� Appendix S. First Surface Indications of Well Flow and Pit Gain (electronic media).
� Appendix T. Comparison of Events with Relevant Transocean Well Control Policies,
Practices and Procedures (electronic media).
� Appendix U. Riser Fluid Evacuation to Rig Floor (electronic media).
Topics in this analysis include:
2 Operational Activities—Pressure Integrity Testing
2.1 Conducted the Positive-pressure Test
2.2 Displaced Mud to Seawater
2.3 Opened the Drill Pipe to Bleed Pressure
2.4 Conducted the Negative-pressure Test
2.5 Continued the Negative-pressure Test on the Kill Line
2.6 Interpreted the Negative-pressure Test

Deepwater Horizon Accident Investigation Report 81
Analysis 5B. Hydrocarbons Entered the Well Undetected and Well Control Was Lost
An
aly
sis
5B
3 Operational Activities—Monitoring the Well
3.1 Simultaneous Activities
3.2 Conducted the Sheen Test
3.3 Prepared to Discharge Fluid Overboard
3.4 Resumed Routine Activity Prior to Recognition of the Well Control Event
4 Loss of Well Control and the Resulting Response
4.1 Drill Pipe Pressure Fluctuations 21:31 Hours to 21:42 Hours
4.2 Well Control Response 21:40 Hours to 21:49 Hours
4.3 Modeling of Uncontrolled Flow
5 March 8, 2010, Macondo Well Control Event
6 Conclusions
6.1 Management of Negative-pressure Test
6.2 Monitoring the Well
6.3 Response to the Well Control Event
7 Recommendations

82
Analysis 5B. Hydrocarbons Entered the Well Undetected and Well Control Was Lost
Deepwater Horizon Accident Investigation Report
2 Operational Activities—Pressure Integrity Testing
Testing the Pressure Integrity of the Well
In accordance with Minerals Management Service (MMS) regulations and BP policy, pressure
tests were conducted to verify the integrity of the 9 7/8 in. x 7 in. production casing.
A positive-pressure test confirms that the casing and wellhead seal assembly are capable of
containing pressure inside the well. A negative-pressure test assesses the integrity of the
casing shoe track, the casing and the wellhead seal assembly to hold back formation pressure.
Removing the mud and replacing it with seawater simulates the temporarily abandoned
condition when the BOP and riser are removed.
Significance of the Negative-pressure Test
During the drilling process, one of the purposes of the mud is to create sufficient hydrostatic
pressure to prevent flow from the reservoir. At the end of the drilling process, cement is
placed between the casing and the reservoir to act as a barrier.
The Macondo well was designed to be temporarily abandoned and completed later as a
production well. To temporarily abandon this well, mud had to be removed to a depth of
8,367 ft. and replaced with seawater, and a temporary abandonment cement plug had to
be set in the 9 7/8 in. casing. These procedures were in accordance with common industry
practice and were necessary before the rig moved off the well. The negative-pressure test
simulated the hydrostatic condition of having seawater instead of mud in the riser, causing an
underbalance in the well.
2.1 Conducted the Positive-pressure Test
The positive-pressure test was conducted in two stages: a low-pressure test and a
high-pressure test. Note that the positive-pressure test was against the rubber cement
displacement wiper plug on top of the float collar and did not test the integrity of the
cement in the shoe track.
First, after closing the blind shear rams (BSRs) in the BOP, wellbore pressure was increased
through the kill line to 250 psi and held for 5 minutes. Second, after no leaks were
observed, wellbore pressure was increased to 2,700 psi and held for 30 minutes. The rig
crew determined that the test was successful after the observed pressure did not decline
more than the criteria specified by the MMS (no more than 10% decline in 30 minutes).
The investigation team’s review of the test data confirmed that the test was successful.
Figure 1 shows the successful pressure test.

Deepwater Horizon Accident Investigation Report 83
Analysis 5B. Hydrocarbons Entered the Well Undetected and Well Control Was Lost
An
aly
sis
5B
2.2 Displaced Mud to Seawater
After successfully conducting the positive-pressure test, the rig crew prepared for the
negative-pressure test by opening the BSRs and running the drill pipe into the well to a
depth of 8,367 ft. The boost, choke and kill lines were displaced to seawater. The rig crew
began displacing the synthetic oil-based mud (SOBM) from the well at the 8,367 ft. depth
in preparation for the negative-pressure test and placement of the cement plug. As part
of this procedure, a high-viscosity spacer was pumped ahead of the seawater to act as a
buffer between the heavier, more viscous mud and the lighter seawater.
A displacement procedure provided instructions specifying the sequence of events
required to position the spacer for the negative-pressure test. (Refer to Appendix P.
BP/Deepwater Horizon Rheliant Displacement Procedure “Macondo” OSC-G 32306.)
A review of real-time data showed that the rig crew pumped 424 bbls of spacer, followed
by 30 bbls of fresh water and 352 bbls of seawater.
The spacer was a high-viscosity, lost circulation fluid (a combination of FORM-A-SET™
and FORM-A-SQUEEZE) that remained in the pits after the drilling process. M-I SWACO
reviewed the spacer’s properties and, according to Marine Board of Investigation (MBI)
testimony, recommended it as a suitable material for the displacement. (Refer to
Appendix Q. Summary of The Effect of Spacer Fluid Composition and Placement on
Negative-pressure Test.)
Flo
w R
ate
(g
pm
)
0
500
1,000
1,500
2,000
2,500
3,000
10
:50
10
:55
11
:00
11
:05
11
:10
11
:15
11
:20
11
:25
11
:30
11
:35
11
:40
11
:45
11
:50
11
:55
12
:00
0
50
100
150
200
250
300
350
400P
ressu
re (
psi)
Time
Chk/Kill Pressure (psi)
Flow In (gpm)
2,700 psi test
250 psi test
Figure 1. Positive-pressure Test (Real-time Data).

84
Analysis 5B. Hydrocarbons Entered the Well Undetected and Well Control Was Lost
Deepwater Horizon Accident Investigation Report
Analysis
Based upon the available information, the investigation team determined the following:
� Pumping 352 bbls of seawater would have placed an unmixed seawater/spacer interface
12 ft. above the BOP. Any mixed interface greater than 12 ft. into the seawater would
have placed the spacer across the BOP, in the path of the kill line.
� During the initial attempted negative-pressure test on the drill pipe, the annular
preventer was closed, but it failed to seal on the drill pipe, resulting in approximately
50 bbls of spacer leaking past the annular preventer into the BOP during the bleed-off of
drill pipe pressure. The investigation team believes that the spacer or spacer/seawater
interface was across the BOP during the negative-pressure test procedure. (Refer to
2.3 Opened the Drill Pipe to Bleed Pressure of this analysis.) The bottom of the spacer,
therefore, was not above the upper annular preventer as intended. Figure 2 shows the
actual spacer placement before and after sealing the annular preventer.
� The presence of the spacer across the kill line inlet could have complicated
the interpretation of the negative-pressure test. (Refer to 2.5 Continued the
Negative-pressure Test on the Kill Line of this analysis for a discussion of the
anomalous pressure readings during the negative-pressure test.)
Actual Spacer Height Before
Annular Preventer Leak
Actual Spacer Height After
Sealing Annular Preventer
Figure 2. Spacer Placement.
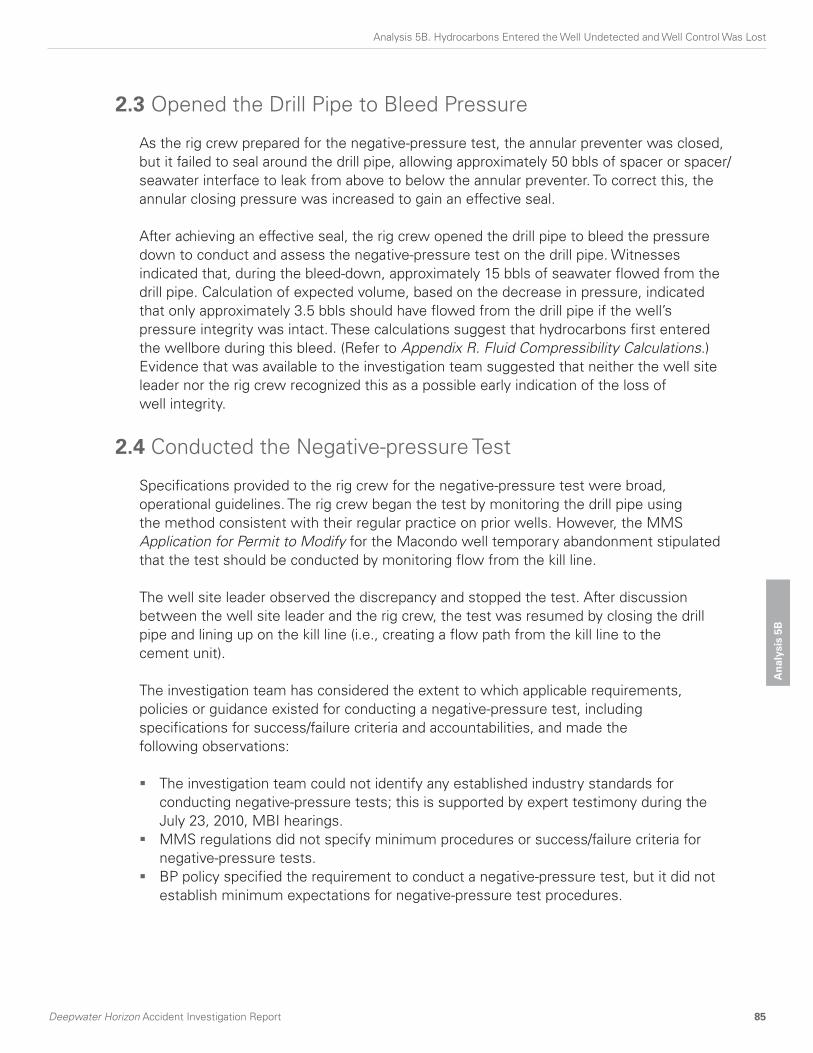
Deepwater Horizon Accident Investigation Report 85
Analysis 5B. Hydrocarbons Entered the Well Undetected and Well Control Was Lost
An
aly
sis
5B
2.3 Opened the Drill Pipe to Bleed Pressure
As the rig crew prepared for the negative-pressure test, the annular preventer was closed,
but it failed to seal around the drill pipe, allowing approximately 50 bbls of spacer or spacer/
seawater interface to leak from above to below the annular preventer. To correct this, the
annular closing pressure was increased to gain an effective seal.
After achieving an effective seal, the rig crew opened the drill pipe to bleed the pressure
down to conduct and assess the negative-pressure test on the drill pipe. Witnesses
indicated that, during the bleed-down, approximately 15 bbls of seawater flowed from the
drill pipe. Calculation of expected volume, based on the decrease in pressure, indicated
that only approximately 3.5 bbls should have flowed from the drill pipe if the well’s
pressure integrity was intact. These calculations suggest that hydrocarbons first entered
the wellbore during this bleed. (Refer to Appendix R. Fluid Compressibility Calculations.)
Evidence that was available to the investigation team suggested that neither the well site
leader nor the rig crew recognized this as a possible early indication of the loss of
well integrity.
2.4 Conducted the Negative-pressure Test
Specifications provided to the rig crew for the negative-pressure test were broad,
operational guidelines. The rig crew began the test by monitoring the drill pipe using
the method consistent with their regular practice on prior wells. However, the MMS
Application for Permit to Modify for the Macondo well temporary abandonment stipulated
that the test should be conducted by monitoring flow from the kill line.
The well site leader observed the discrepancy and stopped the test. After discussion
between the well site leader and the rig crew, the test was resumed by closing the drill
pipe and lining up on the kill line (i.e., creating a flow path from the kill line to the
cement unit).
The investigation team has considered the extent to which applicable requirements,
policies or guidance existed for conducting a negative-pressure test, including
specifications for success/failure criteria and accountabilities, and made the
following observations:
� The investigation team could not identify any established industry standards for
conducting negative-pressure tests; this is supported by expert testimony during the
July 23, 2010, MBI hearings.
� MMS regulations did not specify minimum procedures or success/failure criteria for
negative-pressure tests.
� BP policy specified the requirement to conduct a negative-pressure test, but it did not
establish minimum expectations for negative-pressure test procedures.

86
Analysis 5B. Hydrocarbons Entered the Well Undetected and Well Control Was Lost
Deepwater Horizon Accident Investigation Report
� Transocean documents that were available to the investigation team did not identify a
procedure containing detailed steps or minimum expectations for conducting a
negative-pressure test.
� Testimony from the Transocean offshore installation manager to the MBI on
May 27, 2010, explained his policy to conduct a negative-pressure test before displacing
seawater; however, the question of written procedures was not addressed during
that testimony.
2.5 Continued the Negative-pressure Test on the Kill Line
Anomalous bleed volumes and pressure responses occurred during the negative-pressure
test. These volumes and responses provided opportunities for the rig crew to identify an
integrity problem with the well.
Once the wellbore was lined up on the kill line, the kill valve was opened. No real-time data
on these bleed volumes was available, but the investigation team identified the following
indications of influx to the well:
� Two witnesses indicated that opening the kill line resulted in 3 bbls of seawater flowing
from the well, and one witness indicated that up to 15 bbls of seawater were recovered.
� A witness indicated that the seawater flow did not stop, and, in fact, it spurted before
finally being shut in.
� Pressure on the drill pipe began to increase while the kill line valve was closed. The drill
pipe pressure gradually increased and stabilized at 1,400 psi.
The kill line was closed, and a discussion among the well site leaders, toolpusher, driller
and others occurred regarding the flow from the kill line. They decided to resume the
negative-pressure test on the kill line by first verifying that the kill line was full of seawater,
and then by lining up the kill line to the mini trip tank. After pumping a small volume, the
rig crew confirmed that the kill line was full and then opened the kill line to the mini trip
tank. A small volume (0.2 bbls) of fluid flowed from the kill line and then stopped. The kill
line was then monitored for at least 30 minutes. The rig crew observed the 1,400 psi of
pressure on the drill pipe with no flow exiting the kill line. (Refer to 2.6 Interpreted the
Negative-pressure Test of this analysis.)
As previously discussed in 2.2 Displaced Mud to Seawater of this analysis, spacer material
was unintentionally placed across the kill line at the BOP. At least 3 bbls of highly viscous
fluid (occupying approximately 150 ft. in the kill line) could have been drawn into the kill line
during this part of the test. (Refer to Figure 3.)

Deepwater Horizon Accident Investigation Report 87
Analysis 5B. Hydrocarbons Entered the Well Undetected and Well Control Was Lost
An
aly
sis
5B
In this situation, where the drill pipe should have been in direct pressure communication
with the kill line and there was 1,400 psi on the drill pipe, flow should have exited the kill
line when the kill line was opened to the mini trip tank. However, the rig crew observed
no flow into the mini trip tank. The investigation team considered the following possible
reasons for the lack of flow:
� The kill line may have been plugged with solids from the spacer (a witness’s description
of fluids spurting from the kill line and then stopping supports this as a possibility).
However, during the preparation for the May 26, 2010, top kill operation, the kill line was
cut, and there was no evidence of a blockage in the line at the point where the line was
severed or when pumping operations were conducted.
� The system may not have been lined up correctly; a valve may have been left closed
when the rig crew directed flow from the kill line to the mini trip tank.
Figure 3. Possible Movement of Spacer into Kill Line.

88
Analysis 5B. Hydrocarbons Entered the Well Undetected and Well Control Was Lost
Deepwater Horizon Accident Investigation Report
2.6 Interpreted the Negative-pressure Test
A successful negative-pressure test is indicated by no flow from either the kill line or the
drill pipe; however, there was 1,400 psi on the drill pipe, an indication of communication
with the reservoir.
Figure 4 shows the real-time data that was recorded during the negative-pressure test and
provides data on pressure and flow.
0
200
400
600
800
1,000
1,200
1,400
1,600
1,800
2,000
16
:45
16
:50
16
:55
17
:00
17
:05
17
:10
17
:15
17
:20
17
:25
17
:30
17
:35
17
:40
17
:45
17
:50
17
:55
18
:00
18
:05
18
:10
18
:15
18
:20
18
:25
18
:30
18
:35
18
:40
18
:45
18
:50
18
:55
19
:00
19
:05
19
:10
19
:15
19
:20
19
:25
19
:30
19
:35
19
:40
19
:45
19
:50
19
:55
20
:00
20
:05
0
50
100
150
200
250
300
350
400
Drill Pipe Pressure - Standpipe (psi) Chk/Kill Pressure (psi)
Drill Pipe Pressure - Cement Unit (psi) Flow In - All Pumps (gpm)
Flow Out (gpm)
Pre
ssu
re (
psi)
an
d F
low
Ra
te (
gm
p)
Time
Spacer displacement complete; mud pumps stopped.
Annular preventer closed; attempt to bleed drill pipe
pressure to zero.
Drill pipe pressure decreases to only 273 psi;
annular preventer leaking.
Drill pipe pressure increases as annular preventer leaks;
hydraulic closing pressure increased to seal annulus.
Drill pipe pressure bled to zero for
negative-pressure test.
Decision made to conduct negative-pressure test via kill
line; kill line opened; 3 bbls to 15 bbls bled to cement unit.
Shut in kill line at cement unit, drill pipe pressure
starts to increase.
Drill pipe pressure slowly increases to 1,400 psi.
Fluid pumped into kill line to confirm full;
kill line opened to mini trip tank for monitoring.
Discussion ongoing about 'annular compression'
and 'bladder effect' while monitoring kill line;
drill pipe pressure static at 1,400 psi.
Negative-pressure test concluded, declared
a success; preparation made to
continue displacement.
1
2
3
4
5
6
7
8
9
10
11
1
2
3
4
5
6
7
8
9
10
11
Figure 4. April 20, 2010, Negative-pressure Test (Real-time Data).

Deepwater Horizon Accident Investigation Report 89
Analysis 5B. Hydrocarbons Entered the Well Undetected and Well Control Was Lost
An
aly
sis
5B
The rig crew discussed this 1,400 psi pressure abnormality. Witnesses indicated that the
toolpusher proposed that the high pressure on the drill pipe was caused by a phenomenon
referred to as ‘annular compression’ or ‘bladder effect.’ The toolpusher and the driller
reportedly stated that they had observed this phenomenon before. After discussing this
concept, the rig crew and the well site leader reportedly concluded that the explanation
was plausible. However, the investigation team could find no evidence that such a
phenomenon is possible, leaving the 1,400 psi unexplained unless it was caused by
pressure from the reservoir.
According to witnesses, the rig crew and well site leaders interpreted no flow coming from
the open kill line as a demonstration of well integrity. This indication of no flow from an
open kill line contributed to the incorrect conclusion that well integrity had been achieved.
The investigation team has found no evidence that the rig crew or well site leaders
consulted anyone outside their team about the pressure abnormality. Per the Transocean
Well Control Handbook (TWCH), Section 1, Subsection 2 (page 5 of 7) the rig crew was
required to consult the Transocean ‘manager.’ This consultation was intended to verify that
the manager was “satisfied that the integrity of the barriers involved . . . [had] been suitably
tested.” However, the handbook did not clearly define who the manager was for this
consultation. (Refer to Appendix T.)
The investigation team was unable to confirm whether the policy was adhered to in this
instance. According to MBI testimony taken May 26, 2010, the senior toolpusher was
not informed of the negative-pressure test result until approximately 21:20 hours or
approximately 1.5 hours after the conclusion of the test and after operations had restarted.
The rig crew and well site leaders believed that the negative-pressure test was successful,
even though well integrity had not been achieved. The negative-pressure test was an
opportunity to recognize that the well did not have integrity and to take appropriate action
to evaluate the well further.
3 Operational Activities—Monitoring the Well
After the negative-pressure test was concluded and the annular preventer was opened, the
hydrostatic head in the annulus returned the well to an overbalanced state, and the influx
of hydrocarbons did not occur again until the well was underbalanced with seawater at
approximately 20:52 hours.
According to the Transocean policy (provided to the investigation team) per the TWCH, Section
1, Subsection 3, Paragraph 6, Well Control Responsibilities, the driller was responsible for
monitoring and shutting in the well (closing the BOP) when flow was indicated. The mudlogger
provided additional monitoring support to the driller. Both had access to real-time data in their
respective cabins.

90
Analysis 5B. Hydrocarbons Entered the Well Undetected and Well Control Was Lost
Deepwater Horizon Accident Investigation Report
A reliable method to monitor a well is to trend the fluid volumes in the pits. Other parameters
for monitoring the well, such as pressure and flow, were available to both the driller and the
mudlogger. (Refer to Figures 5A, 5B and 6 for typical mudlogger and driller displays. Figure 7
shows Deepwater Horizon driller’s cabin.) Based on the information made available to the
investigation team, there were two independent systems for measuring flow: Transocean’s
flow meter for the driller and a Sperry-Sun flow meter for the mudlogger. Only the Sperry-Sun
real-time data was available to the investigation team.
Figure 6. Typical Driller’s Cabin on an Offshore Rig Similar to Deepwater Horizon.
Figure 5B. Typical Mudlogger’s Monitoring
Display Area (not Deepwater Horizon).
Figure 5A. Typical Driller’s Display Screen
Showing Data Trending (not Deepwater Horizon).
Figure 5. Typical Driller’s Display Screen Showing Data Trending Capability and
Mudlogger’s Display Area (not Deepwater Horizon).
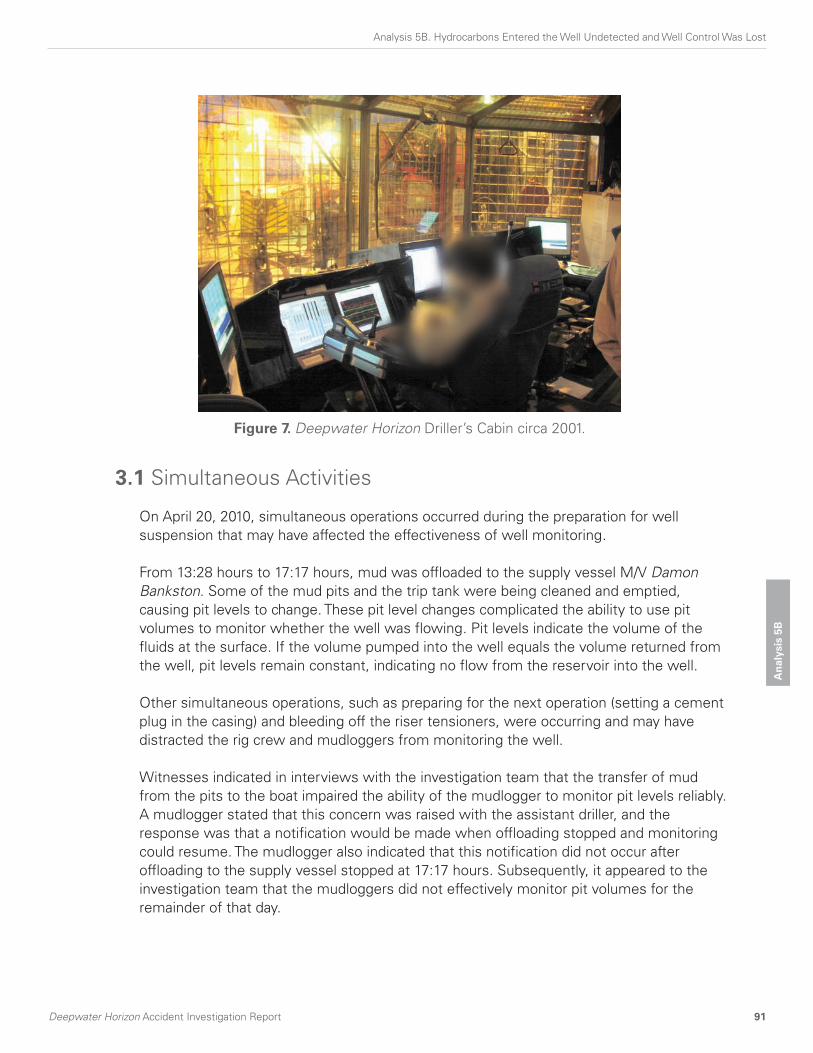
Deepwater Horizon Accident Investigation Report 91
Analysis 5B. Hydrocarbons Entered the Well Undetected and Well Control Was Lost
An
aly
sis
5B
3.1 Simultaneous Activities
On April 20, 2010, simultaneous operations occurred during the preparation for well
suspension that may have affected the effectiveness of well monitoring.
From 13:28 hours to 17:17 hours, mud was offloaded to the supply vessel M/V Damon
Bankston. Some of the mud pits and the trip tank were being cleaned and emptied,
causing pit levels to change. These pit level changes complicated the ability to use pit
volumes to monitor whether the well was flowing. Pit levels indicate the volume of the
fluids at the surface. If the volume pumped into the well equals the volume returned from
the well, pit levels remain constant, indicating no flow from the reservoir into the well.
Other simultaneous operations, such as preparing for the next operation (setting a cement
plug in the casing) and bleeding off the riser tensioners, were occurring and may have
distracted the rig crew and mudloggers from monitoring the well.
Witnesses indicated in interviews with the investigation team that the transfer of mud
from the pits to the boat impaired the ability of the mudlogger to monitor pit levels reliably.
A mudlogger stated that this concern was raised with the assistant driller, and the
response was that a notification would be made when offloading stopped and monitoring
could resume. The mudlogger also indicated that this notification did not occur after
offloading to the supply vessel stopped at 17:17 hours. Subsequently, it appeared to the
investigation team that the mudloggers did not effectively monitor pit volumes for the
remainder of that day.
Figure 7. Deepwater Horizon Driller’s Cabin circa 2001.

92
Analysis 5B. Hydrocarbons Entered the Well Undetected and Well Control Was Lost
Deepwater Horizon Accident Investigation Report
The TWCH stated that the well was to be monitored at all times. However, the policy did
not specifically address how the well was to be monitored during in-flow testing, cleanup
or other end-of-well activities. Based on the available information, the design of the mud
pits could have allowed isolation of one or more pits to enable monitoring of the well, while
using other pits for staging fluid before transfer to the supply vessel.
During displacement to seawater, a gain in the pits equivalent to the seawater volume
pumped would be observed. The well could be monitored by comparing the seawater
volume being pumped to the volume returning to the pits. Any discrepancy in these two
volumes could indicate a problem with the well.
The investigation team did not find evidence that the pits were configured to allow
monitoring while displacing the well to seawater. Furthermore, the investigation team
did not find evidence that either the Transocean rig crew or the Sperry-Sun mudloggers
monitored the pits from 13:28 hours (when the offloading to the supply vessel began) to
21:10 hours (when returns were routed overboard).
Analysis—First Occurrence of Flow from the Well
Based on the available information, the investigation team determined the following:
� The pumps were slowed at approximately 20:50 hours in anticipation of the returning
spacer. Although a decrease in flow would have been expected due to the decrease
in pump rate, real-time data indicated that flow out actually increased. This increase of
flow at the surface was partially caused by flow from the reservoir. The trip tank was
also likely emptied into the flow-line at this time. Emptying the trip tank could have
complicated the ability of the driller to observe the increased flow from the well.
� OLGA® well flow modeling indicated that hydrocarbons began to flow slowly into the
well from the reservoir at approximately 20:52 hours.
� Starting at approximately 21:01 hours, an abnormality with the well could have been
detected by monitoring the drill pipe pressure. Drill pipe pressure increased from
1,250 psi to 1,350 psi (at a constant pump rate), indicating flow from the well. Pressure
should have decreased at this time, not increased, due to the removal of 14.17 ppg
mud from the wellbore and replacement with 8.6 ppg seawater. This pressure increase
should have been an additional indication to the rig crew of an abnormal condition
with the well.
� Analysis showed that approximately 39 bbls of fluid gain from the reservoir occurred
over the 10-minute period from 20:58 hours to 21:08 hours. (Refer to Figure 8.)
This conclusion was based on an analysis of the real-time data by calculating flow out
minus flow in and by examining available pit data. (Refer to Appendix S. First Surface
Indications of Well Flow and Pit Gain.)
The first indication of flow likely would have been at 20:58 hours, but emptying of the trip
tank could have masked this flow indication in the real-time data. The pressure abnormality
starting at 21:01 hours would have been the first clear indication of flow visible to the rig
crew and mudloggers.

Deepwater Horizon Accident Investigation Report 93
Analysis 5B. Hydrocarbons Entered the Well Undetected and Well Control Was Lost
An
aly
sis
5B
3.2 Conducted the Sheen Test
At approximately 21:08 hours (41 minutes before the explosion), the rig crew shut off the
pumps to perform the sheen test.
The environmental permit required a sheen test after all of the SOBM was displaced from
the well. This test verified that no oil was present in the spacer fluid before discharging
it overboard. The well plan specified discharging the spacer if the spacer fluid passed the
sheen test. To perform this test, a sample of the spacer fluid was collected to confirm the
absence of a sheen on the surface of the liquid over a 5-minute period.
According to a witness interview, the rig crew opened the overboard dump valve on the
flow-line at approximately 21:10 hours in preparation for discharging the spacer, and the
sheen test began at the same time. Changing the configuration of the flow-line changed
the flow path of the returning fluids from the well. In the short amount of time that the
flow meter was sensing flow after shutting off the pumps (21:08 hours to 21:10 hours) and
before the rig crew opened the overboard dump valve, the Sperry-Sun flow meter indicated
flow from the well. When the overboard dump valve was opened, the Sperry-Sun flow
meter was not able to sense flow. However, a Transocean flow meter should have been
available to the driller. (Refer to Figure 11.) Table 1 shows the information available for flow,
pressure and volume measurements based on the activities being conducted.
0
200
400
600
800
1,000
1,200
1,400
1,600
1,800
2,000
20
:50
20
:55
21
:00
21
:05
21
:10
21
:15
0
50
100
150
200
250
300
350
400
Drill Pipe Pressure (psi)
Flow In - Pumps #3 & #4 (gpm)
Flow Out (gpm)
Trip Tank Volume (bbl)
Trip tank transfer added to flow in
Flow out exceeds flow in and continues after pumps shut down: 39 bbl gain
since 20:52
Pre
ssu
re (
psi)
an
d F
low
Rate
(g
pm
)
Time
Trip
Tan
k V
olu
me (
bb
l)
Pressure continues to rise
246 psi after pumps are
shut down
Drill pipe pressure increasing
with constant pump rate
End trip tank transfer
Flow diverted overboard/
Sperry-Sun flow meter
bypassed
Figure 8. Flow Indication Graph Showing Anomalies (Real-time Data).

94
Analysis 5B. Hydrocarbons Entered the Well Undetected and Well Control Was Lost
Deepwater Horizon Accident Investigation Report
Analysis
Based on the available information, the investigation team determined the following:
� An analysis of the real-time data indicated that, although the pumps were stopped, the
Sperry-Sun flow meter continued (at least momentarily) to sense flow discharged from
the well.
� The drill pipe pressure continued to increase from 1,017 psi at 21:08 hours to 1,263 psi
at 21:14 hours. (Refer to Figure 9.) Modeling indicated this pressure increase was caused
by 14.17 ppg mud rising above the stinger in the annulus. In addition, modeling suggested
that this pressure increase was indicative of flow through the shoe track at a rate of
approximately 9 bpm. (Refer to Appendix G. Analysis Determining the Likely Source of
In-flow for the detailed analysis.)
� The investigation team compared the flow out signature (i.e., the length of time it took
the flow meter sensor to indicate zero flow after shutting the pumps off) to a time when
the well was known to be stable. (Refer to Figure 10.) A distinctly different signature
was observed at that time, indicating that the well was flowing.
At this point, the rig crew’s actions were inconsistent with a team that was aware the well
was flowing.
Table 1. Information Available Based on Activities Being Conducted.
Time ActivityTransocean Flow Meter
Sperry-Sun Flow Meter
Drill Pipe Pressure
Available To Transocean & Sperry-Sun
PitVolume
20:50Displacing to
seawater O
20:58Displacing to
seawater
- Flow reading
affected while
emptying trip tank
- Flow reading
affected while
emptying trip tank
- Indicated
abnormal increase
(starting at 21:01)
O
21:08 Sheen test- Meter should have
indicated flow
- Indicated flow
briefly
- Abnormal
increase with
pumps off
O
21:10 Sheen test- Meter should have
indicated flowX - Meter bypassed
- Abnormal
increase with
pumps off
X - Pits
bypassed
21:14Displacing to
seawater
- Meter should have
indicated flowX - Meter bypassed
X - Pits
bypassed
21:31 Stop pumps- Meter should have
indicated flowX - Meter bypassed
- Increasing with
pumps off
X - Pits
bypassed
- Data available O - Option to monitor, but not evident if this was performed X - Data not available

Deepwater Horizon Accident Investigation Report 95
Analysis 5B. Hydrocarbons Entered the Well Undetected and Well Control Was Lost
An
aly
sis
5B
Drill pipe pressure increasing
with pumps off
800
900
1,000
1,100
1,200
1,300
1,400
1,500
1,600
1,700
21
:08
21
:09
21
:10
21
:11
21
:12
21
:13
21
:14
21
:15
0
200
400
600
800
1000
1200
Pre
ssu
re (
psi)
Time
Flo
w R
ate
(g
pm
)
Drill Pipe Pressure (psi)
Flow In - All Pumps (gpm)
Flow Out (gpm)
Figure 9. Pressure Increase During the Sheen Test (Real-time Data).
0
100
200
300
400
500
600
700
800
900
1,000
16
:45
16
:50
16
:55
17
:00
Flow In - All Pumps (gpm)
Flow Out (gpm)
0
100
200
300
400
500
600
700
800
900
1,000
21
:00
21
:05
21
:10
21
:15
Flow In - All Pumps (gpm)
Flow Out (gpm)
Normal flow out signature:
Flow out stops shortly after
pumps turned off Abnormal flow out signature:
Overboard line
opened/Sperry-Sun
flow meter bypassed
Flow out continues
after pumps turned off until
overboard line opened
Normal Flow Signature at 16:52
Flo
w R
ate
(g
pm
)
Flo
w R
ate
(g
pm
)
Abnormal Flow Signature at 21:08
Figure 10. Normal Versus Abnormal Flow Out Signature as Pumps Shut Off (Real-time Data).

96
Analysis 5B. Hydrocarbons Entered the Well Undetected and Well Control Was Lost
Deepwater Horizon Accident Investigation Report
Figure 11. Flow Path Before and After Routing the Spacer Overboard.
Sperry-Sun
Flow Meter
Transocean
Flow Meter
Connection
Points
Before AfterSperry-Sun
Flow Meter
Transocean
Flow Meter
Connection
Points
3.3 Prepared to Discharge Fluid Overboard
At 21:14 hours, after concluding that the sheen test was successful, the rig crew resumed
pumping to continue displacement of the well to seawater and to discharge the spacer
fluid overboard.
The driller should have been able to monitor flow from the well, even after routing the flow
overboard. Even though the Sperry-Sun flow meter was not sensing flow after 21:10 hours,
information available to the investigation team showed that separate Transocean flow
sensors would have been available to the driller. (Refer to Table 1 and Figure 11.)

Deepwater Horizon Accident Investigation Report 97
Analysis 5B. Hydrocarbons Entered the Well Undetected and Well Control Was Lost
An
aly
sis
5B
In addition, display screens should have provided visual indication to the driller (through
video cameras) until the flow path was changed to the overboard line. When the flow
path was diverted overboard, visual indication of flow on the display screen was no longer
available. (Refer to Figure 12 for an example of display screens that are available to the driller.)
3.4 Resumed Routine Activity Prior to Recognition of the Well
Control Event
After the rig crew resumed displacing the well to seawater following the sheen test, a
number of activities took place on the rig that were inconsistent with recognition of a well
control event.
Analysis
Based on the available information, the investigation team determined the following:
� An analysis of real-time data combined with MBI testimony suggested that the rig
crew was trying to bring mud pump #2 online at 21:17 hours (32 minutes before the
explosion). The pump was likely started against a closed valve, lifting the pressure relief
valve (PRV). (Refer to Figure 13.)
� Mud pumps #2, #3 and #4 were all shut down, and pump #1 continued to pump into
the boost line. Three minutes later, pumps #3 and #4 were put back online, and several
personnel were investigating the problem with pump #2. This was another operation
that potentially distracted the rig crew from monitoring the well.
Figure 12. Typical Video Camera Displays in the Driller’s Cabin (not Deepwater Horizon).

98
Analysis 5B. Hydrocarbons Entered the Well Undetected and Well Control Was Lost
Deepwater Horizon Accident Investigation Report
� At approximately this time, the toolpusher was called to the rig floor, possibly in regard
to bringing mud pump #2 online.
� At the May 28, 2010, MBI hearings, testimony indicated that the senior toolpusher
called the toolpusher at approximately 21:20 hours and asked about the results of the
negative-pressure test. He responded that the test result was “good.” He also advised
the senior toolpusher that the displacement was “going fine.”
� The assistant driller was called for support between 21:20 hours and 21:30 hours. The
chief electrician stated that he later observed the assistant driller working on the PRV
for mud pump #2.
� At 21:31 hours, approximately 18 minutes before the first explosion, the mud pumps
were shut down. Possible reasons for the pumps shutting down were that the rig
crew was:
� Troubleshooting mud pump #2.
� Responding to the return of the remainder of the spacer. Based on OLGA® well
flow modeling results, the spacer would have been fully displaced from the well at
approximately 21:30 hours.
� Responding to the decreasing drill pipe pressure.
� The chief mate testified at the MBI hearings on May 27, 2010, that he observed the
toolpusher and driller discussing ‘differential pressure’ on the well at approximately
21:33 hours.
� OLGA® well flow modeling indicated that hydrocarbons had been continuously flowing
into the well since 20:52 hours and that a 300 bbl gain had been taken by 21:31 hours.
During this time period, the rig crew’s actions did not appear to be consistent with a
team that was aware that the well was flowing.
� OLGA® well flow modeling also indicated that hydrocarbons entered the riser at
approximately 21:38 hours. As described in 4.2 Well Control Response 21:40 Hours
to 21:49 Hours of this analysis, the first well control response did not occur until
approximately 21:41 hours.
0
1,000
2,000
3,000
4,000
5,000
6,000
7,000
21:1
3
21:1
8
21:2
3
21:2
8
21:3
3
0
250
500
750
1,000
1,250
1,500
1,750
2,000
Pre
ssu
re (
psi)
Flo
w R
ate
(g
pm
)
Time
Drill Pipe Pressure (psi)Chk/Kill Pressure (psi)
Flow In - All Pumps (gpm)
Chk/Kill Pump (gpm)
Flow Out (gpm)
Boost pump only
Pressure increases on
kill line and pressure
relief valve opens on
pump #2
Figure 13. Mud Pump #2 Pressure Increase at 21:17 Hours (Real-time Data).

Deepwater Horizon Accident Investigation Report 99
Analysis 5B. Hydrocarbons Entered the Well Undetected and Well Control Was Lost
An
aly
sis
5B
4 Loss of Well Control and the Resulting Response
Transocean had policies and procedures that governed rig crew actions while monitoring the
well for flow and for responding to well control events. The policies and procedures specified
that the driller should monitor the well for flowing conditions and was responsible to shut in
the well at the first indication of flow.
The shut-in protocols specified how to respond to a relatively small influx into the well and how
to handle the possibility of gas in the riser. The instructions stated that the well was to be shut
in using an annular preventer first, and then a variable bore ram (VBR) was to be closed if there
were still indications of flow from the well. The protocols did not fully address how to respond
in an emergency situation (loss of well control).
The investigation team could not find instructions in the protocols document describing how
to handle continued flow (e.g., closing the BSRs and closing the internal blowout preventer
to seal the drill pipe). There was no mention in the protocols about whether or when the
emergency disconnect sequence should be activated in an emergency response (with the
exception of a station-keeping emergency).
Relevant excerpts from these policies and procedures are provided in Appendix T.
4.1 Drill Pipe Pressure Fluctuations 21:31 Hours to 21:42 Hours
After the rig crew shut down the mud pumps at 21:31 hours, the drill pipe pressure
increased in 3 minutes from 1,240 psi to 1,750 psi. There was a sudden pressure decrease
at 21:36 hours from 1,750 psi to approximately 750 psi, and then at 21:38 hours pressure
suddenly increased again from approximately 750 psi to 1,400 psi. The pressure then
dropped steadily from 1,400 psi at 21:39 hours to 338 psi at 21:42 hours.
Analysis
Based on the available information, the investigation team determined the following:
� As mentioned previously, at approximately 21:33 hours (approximately 21:30 hours
per MBI testimony), the chief mate observed the toolpusher and the driller discussing
‘differential pressure’ on the well. This coincided with the real-time data showing the drill
pipe pressure increasing at this time.
� The OLGA® well flow modeling predicted the pressure responses from 21:31 hours to
21:42 hours fairly accurately, with the exception of the sudden pressure changes
shown in the real-time data from 21:36 hours to 21:38 hours. (Refer to Figure 14 for
specific readings.)

100
Analysis 5B. Hydrocarbons Entered the Well Undetected and Well Control Was Lost
Deepwater Horizon Accident Investigation Report
� The sudden pressure changes between 21:36 hours and 21:38 hours were indicative
of a bleed-off at the surface. Modeling supported the bleeding of the drill pipe at the
surface through a 4 in. surface line as the likely action taken at this time because the
pressure response is immediate. (Refer to Figure 15.) A pressure transient caused by
a pressure drop deep within the well would have been indicated by a slower pressure
change on the real-time data.
Time
Dri
ll P
ipe
Pre
ssu
re (
psi)
Flo
w R
ate
(b
bl/
min
)
0
500
1,000
1,500
2,000
2,500
3,000
3,500
4,000
4,500
5,000
21:2
0
21:2
5
21:3
0
21:3
5
21:4
0
21:4
5
21:5
0
0
20
40
60
80
100
120
140
160
180
200
Recorded Drill Pipe Pressure (psi)
Modeled Drill Pipe Pressure for Fully Open BOP (psi)
Flow In - All Pumps (bbl/min)
Actual pressure
deviates from
modeled pressure
Figure 14. OLGA® Well Flow Modeling for Flow Condition with an Open Annular Preventer.
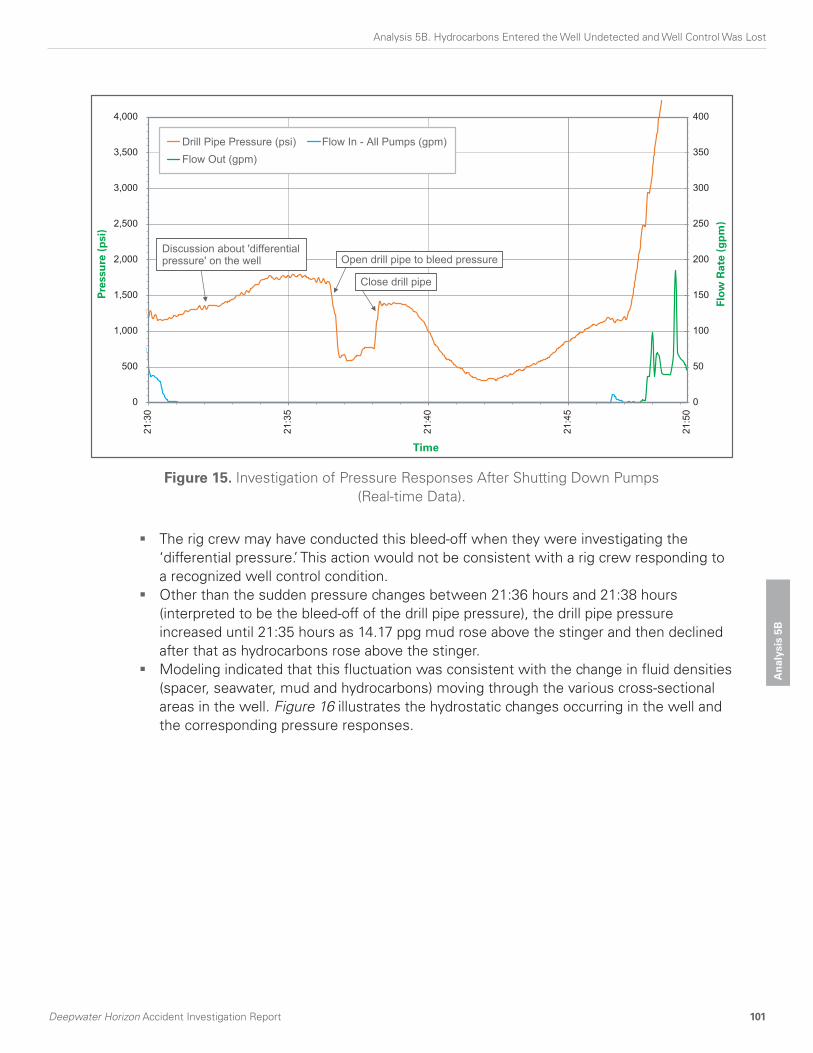
Deepwater Horizon Accident Investigation Report 101
Analysis 5B. Hydrocarbons Entered the Well Undetected and Well Control Was Lost
An
aly
sis
5B
� The rig crew may have conducted this bleed-off when they were investigating the
‘differential pressure.’ This action would not be consistent with a rig crew responding to
a recognized well control condition.
� Other than the sudden pressure changes between 21:36 hours and 21:38 hours
(interpreted to be the bleed-off of the drill pipe pressure), the drill pipe pressure
increased until 21:35 hours as 14.17 ppg mud rose above the stinger and then declined
after that as hydrocarbons rose above the stinger.
� Modeling indicated that this fluctuation was consistent with the change in fluid densities
(spacer, seawater, mud and hydrocarbons) moving through the various cross-sectional
areas in the well. Figure 16 illustrates the hydrostatic changes occurring in the well and
the corresponding pressure responses.
0
500
1,000
1,500
2,000
2,500
3,000
3,500
4,000
21
:30
21
:35
21
:40
21
:45
21
:50
0
50
100
150
200
250
300
350
400
Drill Pipe Pressure (psi) Flow In - All Pumps (gpm)
Flow Out (gpm)
Pre
ssu
re (
psi)
Flo
w R
ate
(g
pm
)
Time
Discussion about 'differential pressure' on the well Open drill pipe to bleed pressure
Close drill pipe
Figure 15. Investigation of Pressure Responses After Shutting Down Pumps
(Real-time Data).

102
Analysis 5B. Hydrocarbons Entered the Well Undetected and Well Control Was Lost
Deepwater Horizon Accident Investigation Report
Pre
ssu
re (
psi)
Time
Flo
w R
ate
(g
pm
)
0
500
1,000
1,500
2,000
2,500
3,000
21:2
5
21:3
0
21:3
5
21:4
0
21:4
5
21:5
0
0
200
400
600
800
1,000
1,200
1,400
1,600
Drill Pipe Presssure (psi)
Flow In - All Pumps (gpm)
Mud Flowing Around
Drill PipeInflux at Bottom of Drill Pipe Mud/Water Mix at Rig Floor
Figure 16. Modeled Pressure Responses Resulting from Hydrostatic Changes in the Wellbore.
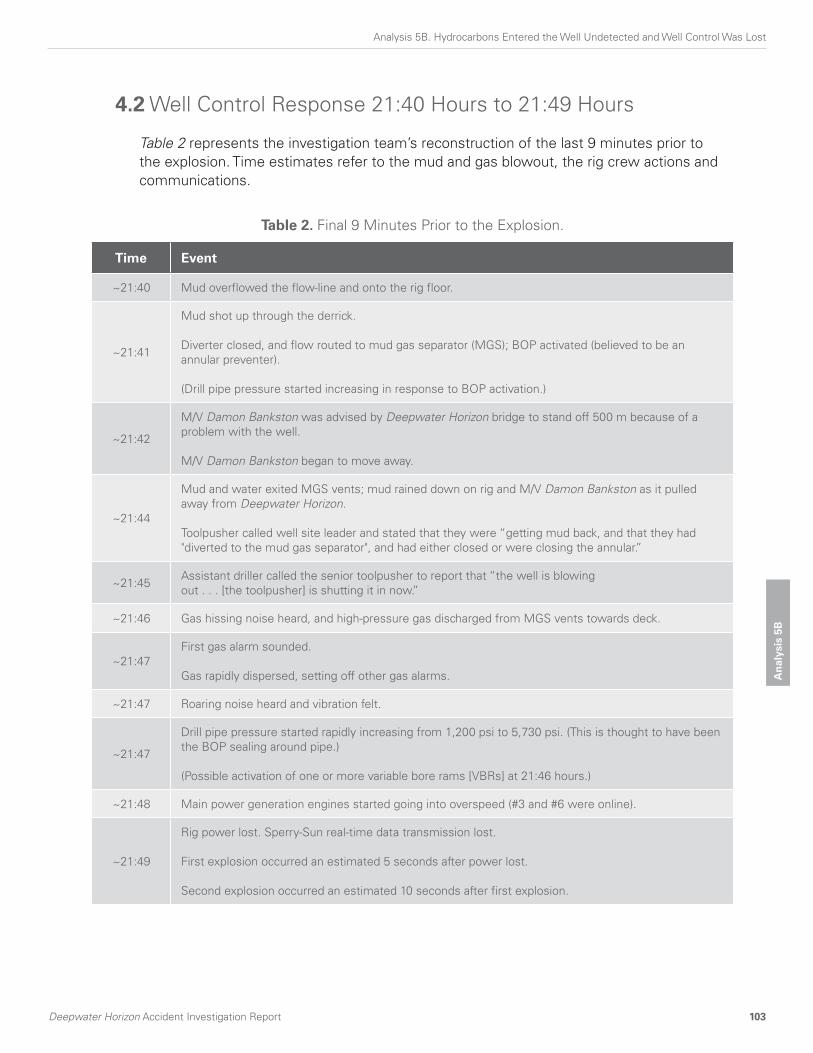
Deepwater Horizon Accident Investigation Report 103
Analysis 5B. Hydrocarbons Entered the Well Undetected and Well Control Was Lost
An
aly
sis
5B
4.2 Well Control Response 21:40 Hours to 21:49 Hours
Table 2 represents the investigation team’s reconstruction of the last 9 minutes prior to
the explosion. Time estimates refer to the mud and gas blowout, the rig crew actions and
communications.
Table 2. Final 9 Minutes Prior to the Explosion.
Time Event
~21:40 Mud overflowed the flow-line and onto the rig floor.
~21:41
Mud shot up through the derrick.
Diverter closed, and flow routed to mud gas separator (MGS); BOP activated (believed to be an
annular preventer).
(Drill pipe pressure started increasing in response to BOP activation.)
~21:42
M/V Damon Bankston was advised by Deepwater Horizon bridge to stand off 500 m because of a
problem with the well.
M/V Damon Bankston began to move away.
~21:44
Mud and water exited MGS vents; mud rained down on rig and M/V Damon Bankston as it pulled
away from Deepwater Horizon.
Toolpusher called well site leader and stated that they were “getting mud back, and that they had
"diverted to the mud gas separator", and had either closed or were closing the annular.”
~21:45Assistant driller called the senior toolpusher to report that “the well is blowing
out . . . [the toolpusher] is shutting it in now.”
~21:46 Gas hissing noise heard, and high-pressure gas discharged from MGS vents towards deck.
~21:47
First gas alarm sounded.
Gas rapidly dispersed, setting off other gas alarms.
~21:47 Roaring noise heard and vibration felt.
~21:47
Drill pipe pressure started rapidly increasing from 1,200 psi to 5,730 psi. (This is thought to have been
the BOP sealing around pipe.)
(Possible activation of one or more variable bore rams [VBRs] at 21:46 hours.)
~21:48 Main power generation engines started going into overspeed (#3 and #6 were online).
~21:49
Rig power lost. Sperry-Sun real-time data transmission lost.
First explosion occurred an estimated 5 seconds after power lost.
Second explosion occurred an estimated 10 seconds after first explosion.

104
Analysis 5B. Hydrocarbons Entered the Well Undetected and Well Control Was Lost
Deepwater Horizon Accident Investigation Report
At 21:42 hours, the drill pipe pressure increased from 338 psi and reached 1,200 psi at
21:46 hours before rapidly increasing to 5,730 psi at 21:49 hours. According to witnesses,
two phone calls were made from the rig floor at approximately 21:44 hours. The well site
leader was notified that the well was being shut in. The senior toolpusher was notified of
uncontrolled flow from the well. (Refer to Appendix U. Riser Fluid Evacuation to Rig Floor.)
Analysis
Based on the available information, the investigation team determined the following:
� Witnesses suggested that water and mud started to flow out of the riser onto the rig
floor at approximately 21:40 hours. Mud was then expelled through the rotary table
up through the derrick towards the crown block before flow was diverted to the MGS.
Witnesses reported that initially, mud and then gas were discharged from an elevated
point on the derrick. The two probable emission points were the 12 in. MGS vent and
the 6 in. MGS vacuum breaker line. Witness accounts and construction drawings
suggested that both lines were goosenecked; this directed flow back down onto the rig
floor. Therefore, the investigation team concluded that the rig crew closed the diverter,
and the flow was routed to the MGS.
� The TWCH allowed diversion to the MGS in certain well control situations. However, the
handbook stated that “at any time, if there is a rapid expansion of gas in the riser, the
diverter must be closed (if not already closed) and the flow diverted overboard.” (Refer
to Appendix T.)
� If the decision had been made to direct flow overboard rather than to the MGS, the
subsequent diversion of flow overboard may have provided the rig crew more time to
respond to the well control situation, and the consequences of the event would likely
have been reduced.
� The investigation team determined that an annular preventer closed at approximately
21:42 hours. According to OLGA® well flow modeling, if the annular preventer had not
been closed, the drill pipe pressure would have dropped to 0 psi by 21:43 hours as the
remainder of the mud was ejected from the wellbore. However, because the drill pipe
pressure only decreased to approximately 300 psi and then started to increase again,
activation of an annular preventer likely occurred at 21:41 hours and took approximately
45 seconds to close.
� The investigation team concluded that the rig crew likely activated an annular preventer
and the diverter at approximately 21:41 hours. This was the first action taken by the rig
crew to respond to the well control event.
� Analysis shows that to create the pressure increase observed on the drill pipe from
21:42 hours to 21:47 hours, the annular preventer was over 99% closed (but not fully
sealed) around the drill pipe. If the annular preventer was fully closed and sealed during this
time period, the pressure increase would have been more immediate. (Refer to Analysis
5D. The Blowout Preventer Did Not Seal the Well of this section for a detailed explanation.)
� One of two possible actions would have caused the rapid pressure increase to 5,730 psi
from 21:47 hours to 21:49 hours:
� The rig crew possibly first closed an annular preventer and then closed a VBR in
accordance with Transocean’s protocol for handling well control events.
� The rig crew possibly first closed an annular preventer and then increased its closing
pressure to create a seal.
(Refer to Figure 17 for a summarized interpretation of these responses.)
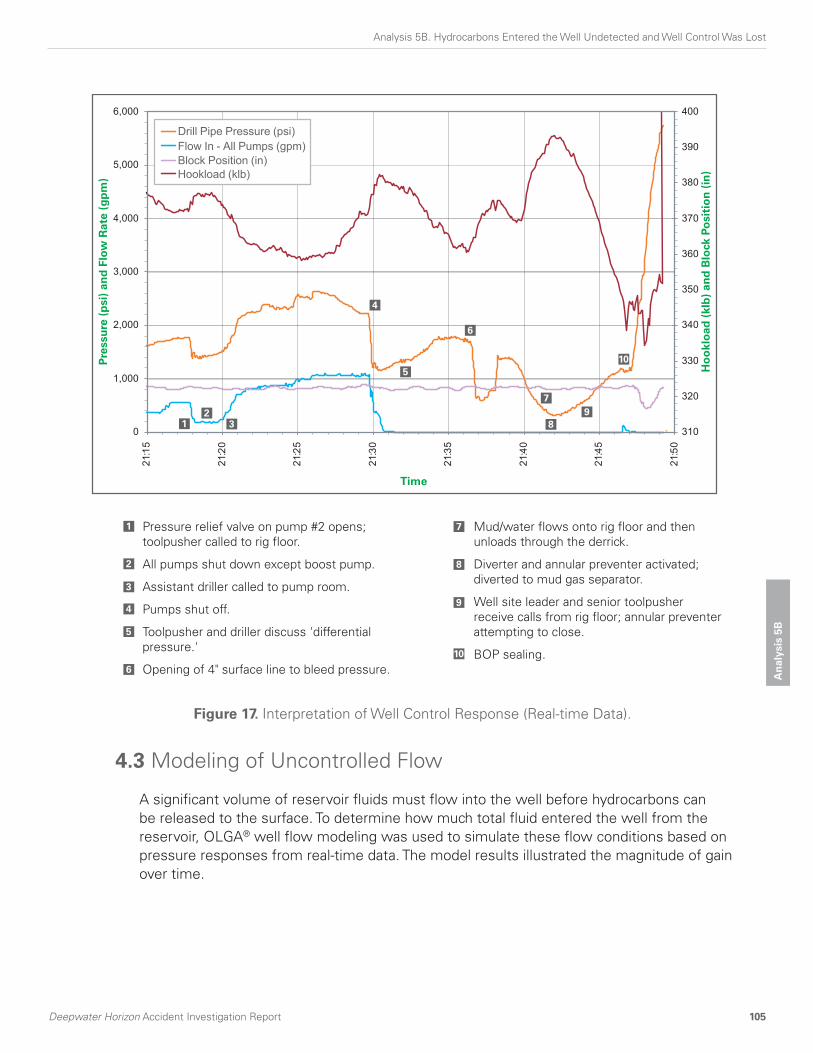
Deepwater Horizon Accident Investigation Report 105
Analysis 5B. Hydrocarbons Entered the Well Undetected and Well Control Was Lost
An
aly
sis
5B
4.3 Modeling of Uncontrolled Flow
A significant volume of reservoir fluids must flow into the well before hydrocarbons can
be released to the surface. To determine how much total fluid entered the well from the
reservoir, OLGA® well flow modeling was used to simulate these flow conditions based on
pressure responses from real-time data. The model results illustrated the magnitude of gain
over time.
0
1,000
2,000
3,000
4,000
5,000
6,000
21:1
5
21:2
0
21:2
5
21:3
0
21:3
5
21:4
0
21:4
5
21:5
0
310
320
330
340
350
360
370
380
390
400
Drill Pipe Pressure (psi)
Flow In - All Pumps (gpm)
Block Position (in)
Hookload (klb)
Pre
ssu
re (
psi)
an
d F
low
Rate
(g
pm
)
Ho
oklo
ad
(klb
) an
d B
lock P
osit
ion
(in
)
Time
Pressure relief valve on pump #2 opens; toolpusher called to rig floor.
All pumps shut down except boost pump.
Assistant driller called to pump room.
Pumps shut off.
Toolpusher and driller discuss 'differential
pressure.'
Opening of 4" surface line to bleed pressure.
Mud/water flows onto rig floor and then
unloads through the derrick.
Diverter and annular preventer activated; diverted to mud gas separator.
Well site leader and senior toolpusher
receive calls from rig floor; annular preventer attempting to close.
BOP sealing.
1
1
2
2
3
3
4
4
5
5
6
6
8
8
7
7
9
9
10
10
Figure 17. Interpretation of Well Control Response (Real-time Data).

106
Analysis 5B. Hydrocarbons Entered the Well Undetected and Well Control Was Lost
Deepwater Horizon Accident Investigation Report
The OLGA® well flow model was calibrated against the following key data points:
� A 39 bbl fluid gain based on retrospective analysis of pit volume gain derived from
real-time data from the time the well began flowing at 20:52 hours through 21:08 hours.
� The pressure increase of 246 psi between 21:08 hours and 21:14 hours with the
pumps off.
When the annular preventer was activated at approximately 21:41 hours, the model
estimated the influx volume to be approximately 1,000 bbls. By the time the explosion
occurred at approximately 21:49 hours, the model estimated the gain to be approximately
2,000 bbls. (Refer to Figure 18 for the cumulative gain over time.)
0
200
400
600
800
1,000
1,200
1,400
1,600
1,800
2,000
2,200
2,400
2,600
20:50 21:00 21:10 21:20 21:30 21:40 21:50 22:00
Time
Cu
mu
lati
ve G
ain
(b
bls
)
Loss of power
and explosion
at 21:49
Cumulative
gain at 21:30
~ 280 bbls
Annular preventer
activated. Cumulative
gain at 21:41 ~1,000 bbls
Well starts to flow when
well goes underbalanced
at 20:52
Figure 18. OLGA® Well Flow Modeling Prediction of Cumulative Gain Excluding
Pumped Volumes 20:52 Hours–21:49 Hours.

Deepwater Horizon Accident Investigation Report 107
Analysis 5B. Hydrocarbons Entered the Well Undetected and Well Control Was Lost
An
aly
sis
5B
5 March 8, 2010, Macondo Well Control Event
On March 8, 2010, while drilling the Macondo well, a kick (i.e., initiation of reservoir fluids into
the wellbore due to an underbalanced condition) occurred while drilling at a depth of 13,250 ft.
Certain key individuals who were present during the April 20, 2010, accident were also on tour
during the March 8, 2010, well control event. During the March 8, 2010, event, the influx from
the reservoir went unnoticed for approximately 33 minutes, and a total gain of 35 bbls to 40 bbls
was brought into the well before shutting in the well with the lower annular preventer. The hole
section was lost because the drill pipe became stuck.
In addition to the pit gain indication, the pressure-while-drilling response from the downhole
logging-while-drilling tools showed a distinct drop in equivalent circulating density from
12.41 ppg to 12.32 ppg, commencing within 2 minutes of drilling into the sand that caused
the kick.
The BP Macondo well team conducted an engineering analysis of the kick that indicated a
33-minute response time and that there were indications of flow. A ‘lessons learned’ document
containing the analysis and recommendations was distributed among the BP Gulf of Mexico
Drilling and Completions organization. The wells team leader indicated that Transocean and BP
leaders (aboard the rig) were given verbal feedback about the handling of the event.
In an interview with the investigation team, the wells team leader indicated that the response
time reported in the engineering analysis was deemed to be slow and needed improvement.
The investigation team found no evidence that Transocean took any documented, corrective
actions with the rig crew either to acknowledge or address the response time recorded in the
March 8, 2010, event. Transocean completed a Well Control Event Report as required by policy
stated in their well control handbook. This event report did not list findings and stated that
changes made to prevent reoccurrence of such an event were “still under review.”
6 Conclusions
Based on interviews, MBI testimony, modeling and review of data, the investigation team has
concluded the following regarding the April 20, 2010, accident:
6.1 Management of Negative-pressure Test
� The rig crew and well site leaders believed that the negative-pressure test was
successful, even though well integrity had not been achieved. The data from this test
provided an opportunity to recognize that the well did not have integrity and to take
action to evaluate the well further.
� The guidelines for the negative-pressure test, a critical activity, did not provide detailed
steps and did not specify expected bleed volume or success/failure criteria. Therefore,
effective performance of the test placed a higher reliance on competency and leadership
skills of the BP and Transocean rig leaders.

108
Analysis 5B. Hydrocarbons Entered the Well Undetected and Well Control Was Lost
Deepwater Horizon Accident Investigation Report
6.2 Monitoring the Well
� Simultaneous activities on the rig in preparation for the upcoming rig move may have
distracted the rig crew from adequately monitoring the well.
� The TWCH stated that the well was to be monitored at all times. However, the policy
did not specifically address how the well was to be monitored during in-flow testing,
cleanup or other end-of-well activities.
� The investigation team has found no evidence that the pits were configured to allow
effective monitoring while displacing the well to seawater.
� Approximately 39 bbls of fluid gain from the reservoir occurred over the 10-minute
period from 20:58 hours to 21:08 hours. The drill pipe pressure increased from 1,250 psi
to 1,350 psi with a constant pump rate. During the time the pumps were off for the
sheen test between 21:08 hours and 21:14 hours, drill pipe pressure increased from
1,017 psi to 1,263 psi, and modeling indicated the well was flowing 9 bpm at this time.
By 21:31 hours, an estimated 300 bbl gain had been taken, and the drill pipe pressure
increased after the pumps were stopped. The rig crew’s actions during this time did not
appear to be consistent with a team that was aware the well was flowing.
� OLGA® well flow modeling indicated that hydrocarbons began to flow slowly into
the well from the reservoir at approximately 20:52 hours. The indication of flow that
continued to increase was either not observed or not recognized until hydrocarbons
eventually entered the riser at approximately 21:38 hours. The first well control action
likely occurred at 21:41 hours.
6.3 Response to the Well Control Event
� No apparent well control actions were taken until hydrocarbons were in the riser. These
actions did not succeed in controlling the well. It is estimated that a 1,000 bbl gain had
been taken by the time the BOP was activated.
� Diversion of fluids overboard, rather than to the MGS, may have provided more time to
respond and the consequences of the event would likely have been reduced.
� The rig crew likely first closed an annular preventer and then closed a VBR in accordance
with Transocean’s protocol for handling well control events. The annulus was sealed just
before the explosion.
� Transocean’s shut-in protocols did not fully address how to respond in an emergency
situation (loss of well control). Actions taken prior to the explosion suggest the rig crew
was not sufficiently prepared to manage an escalating well control situation.
7 Recommendations
The investigation team has developed recommendations in response to the findings and
conclusions presented in Section 5. Deepwater Horizon Accident Analyses. (Refer to Section
6. Investigation Recommendations of this report.) These recommendations comprise two
categories: (1) those related to BP’s Drilling and Well Operations Practice (DWOP) and its
Operations Management System (OMS) implementation and (2) those related to BP’s
Contractor and Service Provider Oversight and Assurance.
Deepwater Horizon Accident Investigation Report 109
Analysis 5C. Hydrocarbons Ignited on Deepwater Horizon
An
aly
sis
5C
Analysis 5C. Hydrocarbons Ignited on Deepwater Horizon
1 Introduction
In Analysis 5B. Hydrocarbons Entered the Well Undetected and Well Control Was Lost of this
section, the investigation team analyzed the events and key issues leading up to the loss of
well control and the flow of hydrocarbons to the surface. This analysis focuses on the events
and key issues that resulted in the hydrocarbons being released onto the rig and igniting.
When hydrocarbons reached the surface of Deepwater Horizon, the protective systems did
not prevent the gas from reaching an ignition source and igniting. As a result, at least two
explosions occurred at approximately 21:49 hours on April 20, 2010.
To conclude how the release of hydrocarbons and dispersion of gas occurred, how
the hydrocarbons came to ignite and how an explosion may have been prevented, the
investigation team reviewed the design philosophy of some of the protective systems for
Deepwater Horizon. This design review included surface well control equipment, electrical
area classification, the fire and gas (F&G) system, and heating, ventilation and air conditioning
(HVAC) systems.
Through the investigation team’s review and analysis of the available information, the team
determined the following key findings:
Key Finding 6. Diversion to the mud gas separator resulted in gas venting onto the rig.
Key Finding 7. The fire and gas system did not prevent hydrocarbon ignition.

110
Analysis 5C. Hydrocarbons Ignited on Deepwater Horizon
Deepwater Horizon Accident Investigation Report
Information regarding the ignition of released hydrocarbons was collected from:
� Sperry-Sun real-time data.
� OLGA® well flow modeling.
� BakerRisk gas dispersion modeling.
� Witness accounts from:
� Marine Board of Investigation hearings on May 26–29, July 19–23 and
August 23–27, 2010.
� Interviews conducted by the investigation team.
� A review of Deepwater Horizon documentation, such as design schematics,
photographs and operations manuals.
� Data in these appendices:
� Appendix V. BP Deepwater Horizon GOM Incident Investigation Dispersion Analysis
(from BakerRisk) (electronic media).
� Appendix W. Report–Dynamic Simulations Deepwater Horizon Incident BP
(from ae add energy) (electronic media).
Topics in this analysis include:
2 Timeline of Events
3 Hydrocarbon Release Locations and Dispersion
3.1 Well Flow Modeling Assumptions and Calibration
3.2 Well Flow Modeling Results
3.3 Surface Equipment
3.3.1 Mud Gas Separator
3.3.2 Starboard Overboard Lines
3.4 Gas Dispersion Modeling
3.5 Sustaining the Flow Following the Closure of the BOP
3.6 Outcomes of Different Shut-in Scenarios
3.7 Hydrocarbon Release Locations Analysis
4 Potential Ignition Sources
4.1 Electrical Area Classification
4.2 Fire and Gas System
4.3 Ventilation System
4.3.1 Aft Main Deck
4.3.2 Engine Room
4.3.3 Mud Pump Room
4.3.4 Drill Floor
4.4 Blast Over-pressure
4.5 Potential Ignition Sources Analysis
5 Conclusions
5.1 Diverting to the MGS
5.2 Protective Systems
5.3 Sustaining the Flow Following the Closure of the BOP
6 Recommendations

Deepwater Horizon Accident Investigation Report 111
Analysis 5C. Hydrocarbons Ignited on Deepwater Horizon
An
aly
sis
5C
2 Timeline of Events
Witness accounts contained some contradictions regarding when key events leading up to
the accident occurred; therefore, the times stated in Table 1 are approximate. The loss of the
data feed from the real-time data recorder was used as an anchor point—the point when main
power was assumed to be lost on Deepwater Horizon.
3 Hydrocarbon Release Locations and Dispersion
Hydrocarbon gas was routed through the surface equipment and, as a consequence, it
dispersed across Deepwater Horizon. In reviewing how this failure mode occurred, the
investigation team used OLGA® well flow modeling to estimate flow rates and used
computational fluid dynamics (CFD) to model gas dispersion.
Table 1. Timeline of Events Leading Up to Deepwater Horizon Accident.
Time Witness Accounts
~21:40 hoursMud flowed across the rig floor and down the outside of the
riser to the sea
~21:41 hours Mud shot up to the crown block
~21:41 hoursDiverted flow to the mud gas separator (MGS) and activated
the blowout preventer (BOP)
~21:44 hours Mud flowed out of the MGS vent
~21:46 hours Gas vented to the atmosphere (very loud hissing)
~21:47 hours BOP sealed around the drill pipe
~21:47 hours Gas alarms activated on the fire and gas panel
~21:48 hours Engines started to overspeed
21:49:15 hours Power lost on Deepwater Horizon Anchor Point
21:49:20 hours First explosion
21:49:30 hours Second explosion

112
Analysis 5C. Hydrocarbons Ignited on Deepwater Horizon
Deepwater Horizon Accident Investigation Report
3.1 Well Flow Modeling Assumptions and Calibration
The flow regime that occurred during the release was characterized by changing flow rates
and multiple fluid types (seawater, mud, oil and gas) flowing simultaneously up through the
well from a bottom depth of 18,360 ft. to the surface.
Due to this complex and dynamic flow regime, the investigation team used an OLGA®
well flow model to simulate the flow through the wellbore to the surface. The model was
calibrated to match the recorded drill pipe pressure data, calculated flow rates from pit
volumes and the timing of the arrival of gas at the surface. The main variable used to create
a correlation between modeled outputs and actual real-time data recordings was the length
of reservoir sand open to flow (i.e., net pay). To achieve a reasonable predictive match,
approximately one-fifth of the total pay zone was used as a model input. The remainder
of the pay zone may have been isolated by cement, or the rate may have been limited by
downhole equipment restrictions.
In addition to the reservoir net pay assumption, a match with actual recorded data was
achieved with the model, assuming that an annular preventer closed around the drill
pipe at 21:42 hours without fully sealing and that the well sealed fully at approximately
21:47 hours. (Refer to Analysis 5D. The Blowout Preventer Did Not Seal the Well of this
section.) A match with actual recorded data was achieved, with all input assumptions being
within a realistic range. Tuning the model to match the real-time data produced results that
aligned with eyewitness accounts.
The calibrated model was used to estimate flow rates and pressures at the surface as the
fluids unloaded from the well. The results provided the data for the subsequent analysis in
the rest of Analysis 5C.
The range of uncertainty for these estimated flow rates is quite high due to the highly
dynamic environment being modeled. However, the investigation team believes that this
analysis and the description of the events provide insight into what may have occurred on
Deepwater Horizon.
3.2 Well Flow Modeling Results
Figure 1 shows the predicted flow rates of mud/water, gas and oil. At approximately
21:46 hours, the gas reached the surface, and over a 5-minute period the flow of gas
increased to more than 140 mmscfd. Simultaneously, the flow of mud and water to the
surface reduced from 140 bpm to 20 bpm. The modeled timeline of flow to the surface
aligns with eyewitness accounts described in Table 1.

Deepwater Horizon Accident Investigation Report 113
Analysis 5C. Hydrocarbons Ignited on Deepwater Horizon
An
aly
sis
5C
Based on the assumption that the BOP remained closed and sealed around the drill pipe,
Figure 1 shows that predicted flow tails off approaching 22:00 hours, though it is evident
from the actual event that this did not occur. (Refer to Appendix W. Report–Dynamic
Simulations Deepwater Horizon Incident BP.) The failure modes that may have allowed the
flow to continue are described in 3.5 Sustaining the Flow Following the Closure of the BOP
of this analysis.
3.3 Surface Equipment
Figure 2 is a simplified diagram of the equipment that was involved in the well control
event following the selection of the MGS. (Refer to Figure 2.)
Witness accounts support the view that the diverter was activated and the flow diverted to
the MGS at approximately 21:41 hours.
0
20
40
60
80
100
120
140
160
180
21:20 21:25 21:30 21:35 21:40 21:45 21:50 21:55 22:00 22:05 22:10
0
1,000
2,000
3,000
4,000
5,000
6,000
Actual Drill Pipe Pressure (psi)
Modeled Drill Pipe Pressure (psi)
Modeled Gas Flow Rate (mmscfd)
Modeled Oil Flow Rate (stb/min)
Modeled Mud+Water Flow Rate
(stb/min)
Time of Data Loss
(pressure and flow rate measure at the diverter)
Flo
w R
ate
(g
pm
)
Time
Flo
w R
ate
(b
pm
& m
mscfd
)
Pre
ssu
re (
psi)
Flow rates to zero/
BOP closed and
riser evacuated
Divert to MGS
and close BOP
Peak gas rate
(165 mmscfd)
Recorded data
ends/main
power loss
and explosion
Figure 1. OLGA® Well Flow Modeling Prediction of Fluid Outflow from the Riser.
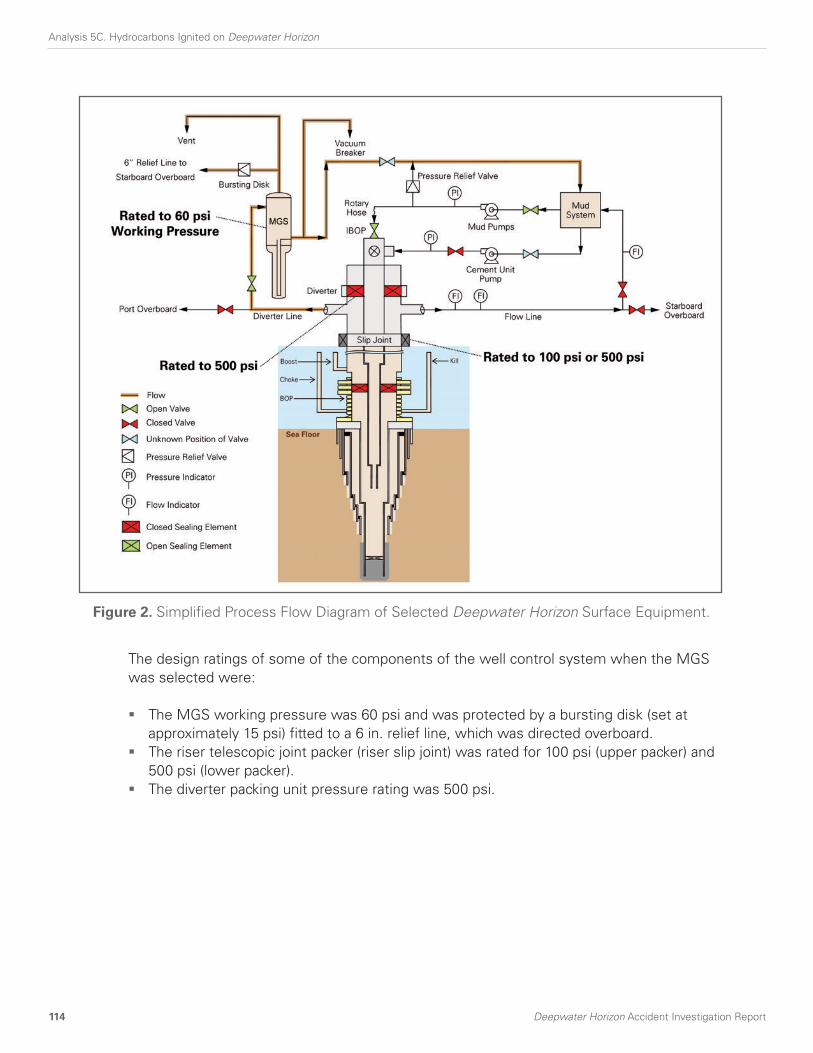
114
Analysis 5C. Hydrocarbons Ignited on Deepwater Horizon
Deepwater Horizon Accident Investigation Report
The design ratings of some of the components of the well control system when the MGS
was selected were:
� The MGS working pressure was 60 psi and was protected by a bursting disk (set at
approximately 15 psi) fitted to a 6 in. relief line, which was directed overboard.
� The riser telescopic joint packer (riser slip joint) was rated for 100 psi (upper packer) and
500 psi (lower packer).
� The diverter packing unit pressure rating was 500 psi.
Figure 2. Simplified Process Flow Diagram of Selected Deepwater Horizon Surface Equipment.

Deepwater Horizon Accident Investigation Report 115
Analysis 5C. Hydrocarbons Ignited on Deepwater Horizon
An
aly
sis
5C
3.3.1 Mud Gas Separator
Figure 3 is a simplified drawing of the main components of the MGS.
The main inlet and outlet connections to the MGS vessel were a:
� 14 in. inlet line from the riser diverter.
� 4 in. inlet line from the choke manifold.
� 12 in. outlet vent line terminating at the top of the derrick.
� 10 in. liquid outlet that could be lined up to either the gumbo box or the trip tanks.
� 6 in. relief line flowing overboard to the starboard side.
� 6 in. vacuum breaker terminating approximately one-third of the way up the derrick.
Figure 3. Simplified Drawing of the MGS.

116
Analysis 5C. Hydrocarbons Ignited on Deepwater Horizon
Deepwater Horizon Accident Investigation Report
Because the 12 in. MGS outlet vent and the 6 in. vacuum breaker vent were
goosenecked, they would have diverted flow back down toward the rig.
The MGS 10 in. liquid outlet was designed with a liquid seal, but the seal would have
been blown out by the pressure spike during the well blowout. If the valve on the MGS
10 in. liquid outlet to the gumbo box was open, gas would have flowed directly under
the deck. This 10 in. valve was manually operated and may not have been open at the
time of the accident.
The set pressure of the bursting disk was believed to have been 15 psi. The MGS
vessel working pressure was 60 psi. The bursting disk (designed on the basis of 18 ppg
mud) was sized to protect the bottom of the vessel from over-pressure in the event
that the vessel overfilled with liquid. During the well blowout, the liquid leg of the MGS
would have been subjected to the greatest pressure, due to the additional hydrostatic
head; therefore, it would have been the most likely part of the vessel to fail during the
well blowout.
The OLGA® well flow modeling results shown in Figure 1 indicate that gas and a
mixture of mud and water simultaneously flowed to the surface at high rates. (Refer to
Figure 1.) The model results have a reduced level of accuracy in such a highly dynamic
environment. However, because of gas expansion in the riser, it would not have been
unrealistic for rates greater than 100 bpm of fluid and 100 mmscfd of gas to occur
within 2 minutes of each other.
A simplified model of surface equipment was used to determine the backpressure at
the diverter packer. As shown in Figure 4, this pressure could have reached 145 psi.
At these pressures it was possible that some components of the MGS vessel such as
flange connections began to fail, but it was unlikely that the vessel itself ruptured.

Deepwater Horizon Accident Investigation Report 117
Analysis 5C. Hydrocarbons Ignited on Deepwater Horizon
An
aly
sis
5C
Based on these modeled pressures, it appears that some of the surface equipment
could have begun to fail and release hydrocarbons. (Refer to Figure 2.) The two most
vulnerable pieces of equipment were the MGS vessel, which was rated for 60 psi; and,
if selected in low-pressure mode, the riser slip joint seal, which was rated for 100 psi.
In addition to the MGS 12 in. vent, gas may also have vented onto the rig (Refer to
Figure 8.) from the following places:
� 6 in. MGS vacuum breaker line.
� 10 in. mud outlet line to the gumbo box under the deck.
� 6 in. MGS bursting disk relief line.
� Riser slip joint seal.
� MGS liquid leg, due to failure under pressure (lower likelihood).
� The riser diverter packer (lower likelihood).
0
20
40
60
80
100
120
140
160
180
21:20 21:25 21:30 21:35 21:40 21:45 21:50 21:55 22:00 22:05 22:10
0
20
40
60
80
100
120
140
160
Modeled Pressure (psi)
Modeled Gas Flow Rate (mmscfd)
Modeled Oil Flow Rate (bpm)
Modeled Mud+Water Flow Rate (bpm)
Time of Data Loss
(pressure and flow modeled at
the diverter)
Flo
wR
ate
(bp
m&
mm
scfd
)
Time
Pre
ssu
re(p
si)
Peak pressure
under diverter
packer (145 psi)
Figure 4. OLGA® Well Flow Modeling Prediction of Backpressure and
Flow at the Diverter Packer.
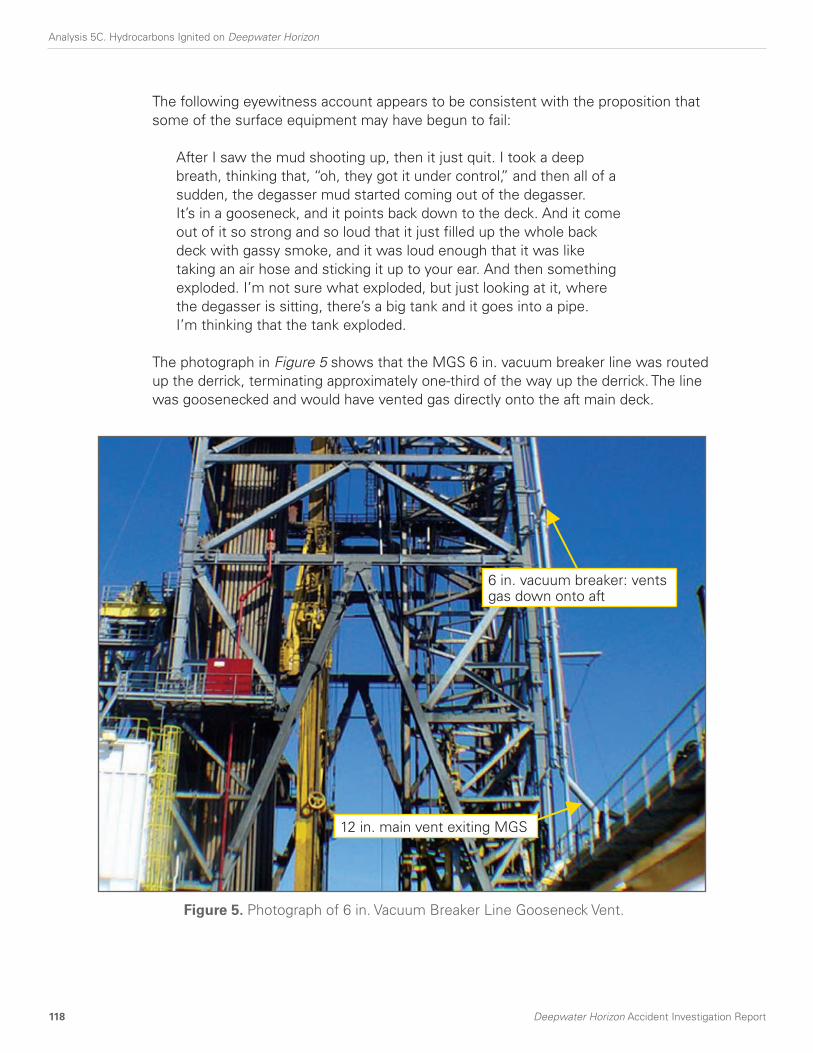
118
Analysis 5C. Hydrocarbons Ignited on Deepwater Horizon
Deepwater Horizon Accident Investigation Report
The following eyewitness account appears to be consistent with the proposition that
some of the surface equipment may have begun to fail:
After I saw the mud shooting up, then it just quit. I took a deep
breath, thinking that, “oh, they got it under control,” and then all of a
sudden, the degasser mud started coming out of the degasser.
It’s in a gooseneck, and it points back down to the deck. And it come
out of it so strong and so loud that it just filled up the whole back
deck with gassy smoke, and it was loud enough that it was like
taking an air hose and sticking it up to your ear. And then something
exploded. I’m not sure what exploded, but just looking at it, where
the degasser is sitting, there’s a big tank and it goes into a pipe.
I’m thinking that the tank exploded.
The photograph in Figure 5 shows that the MGS 6 in. vacuum breaker line was routed
up the derrick, terminating approximately one-third of the way up the derrick. The line
was goosenecked and would have vented gas directly onto the aft main deck.
Figure 5. Photograph of 6 in. Vacuum Breaker Line Gooseneck Vent.
6 in. vacuum breaker: vents gas down onto aft
12 in. main vent exiting MGS

Deepwater Horizon Accident Investigation Report 119
Analysis 5C. Hydrocarbons Ignited on Deepwater Horizon
An
aly
sis
5C
3.3.2 Starboard Overboard Lines
The photograph in Figure 6 shows that the 6 in. MGS relief line was routed along the
same path as the main 14 in. starboard diverter and terminated at the same location on
the starboard side of the rig.
The photograph in Figure 7 was one of the first taken of Deepwater Horizon during
the accident and clearly shows a jet flame coming from the starboard side of the rig.
The investigation team believes this was probably flow through the 6 in. MGS relief
line, which supports the theory that the MGS bursting disk was subjected to pressures
beyond its equipment design rating.
14 in. starboard diverter
6 in. MGS relief line
Figure 6. Photograph of Starboard Overboard Lines.

120
Analysis 5C. Hydrocarbons Ignited on Deepwater Horizon
Deepwater Horizon Accident Investigation Report
3.4 Gas Dispersion Modeling
For the gas dispersion modeling, the investigation team assumed that there was a potential
failure of low-pressure surface equipment. The design pressure rating of this equipment
could have been exceeded during the high simultaneous flow of gas and liquid.
An approximate three-dimensional model of Deepwater Horizon was developed using
FLACS CFD software. The estimated effects of rig geometry, wind and ventilation currents
on gas dispersion were built into the final model. For the gas dispersion modeling in this
analysis, the results of a single case are presented. However, several additional modeling
runs were completed to assess scenarios with different release locations. (Refer to
Appendix V. BP Deepwater Horizon GOM Incident Investigation Dispersion Analysis.)
The case presented in this analysis assumes that the 12 in. MGS vent and the 10 in.
MGS liquid outlet to the gumbo box, the riser slip joint seal, the MGS 6 in. bursting disk
and the 6 in. MGS vacuum breaker vent were all open flow paths. Figure 8 is a simplified
illustration of these open flow paths.
Other scenarios, such as a closed MGS liquid outlet and no equipment failures (all fluid
flowing out of the 12 in. MGS vent) or a catastrophic failure of the MGS vessel were
possible, but the investigation team believes that these other scenarios would not
substantially alter the net effect of the initial gas release.
Believed to be the 6 in. MGS
relief line
Figure 7. Deepwater Horizon Photograph Showing a Starboard Jet Flame.

Deepwater Horizon Accident Investigation Report 121
Analysis 5C. Hydrocarbons Ignited on Deepwater Horizon
An
aly
sis
5C
The graphics in Figure 9 and Figure 10 show the modeled outcomes of gas rapidly
dispersing across the drilling rig. Gas could have also migrated into enclosed spaces under
the deck through the mud system or through the HVAC supply fans for the engine rooms.
Witnesses in both the bridge control room and the engine control room described several
gas alarms going off in rapid succession.
According to one of the witnesses:
“Rig jolted, thought it was thrusters ramping/revving. Senior DPO
[Dynamic Positioning Officer] turned CCTV [closed circuit television
camera], and saw mud ejecting out of side of derrick. Combustible
gas detectors went off, drill floor shaker house first then all other
combustible gas detectors went off.”
Figure 8. Schematic of Postulated Hydrocarbon Release Locations.

122
Analysis 5C. Hydrocarbons Ignited on Deepwater Horizon
Deepwater Horizon Accident Investigation Report
Figure 9. Vapor Dispersion at 100 Seconds.
Cross-section view looking aft
through rig floor
Figure 10. Vapor Dispersion at 240 Seconds.
Cross-section view looking aft
through rig floor

Deepwater Horizon Accident Investigation Report 123
Analysis 5C. Hydrocarbons Ignited on Deepwater Horizon
An
aly
sis
5C
3.5 Sustaining the Flow Following the Closure of the BOP
The investigation team believes that the BOP was closed (but did not fully seal) around
the drill pipe at approximately 21:42 hours and that the BOP fully sealed around the drill
pipe at approximately 21:47 hours. The modeled outcomes in Figure 1 show that the flow
to the surface would have stopped by 22:05 hours following evacuation of the entrained
hydrocarbons within the riser. (Refer to Figure 1.) However, hydrocarbons continued to flow
after this time, which was evidenced by the high-intensity hydrocarbon fire that continued
to burn after the initial explosion.
It was important to clarify the position of the internal blowout preventer (IBOP) valve, as
this determines the number of potential flow paths to the surface if the BOP had closed
and sealed. The simplified process flow diagram in Figure 11 shows that there were two
pressure indicators (PIs), each of which was recorded via the real-time data system. One
PI measured drill pipe pressure from upstream of the IBOP, and one measured drill pipe
pressure from downstream of the IBOP.
Figure 11. Relevant Surface Equipment Downstream of the IBOP at ~21:47.
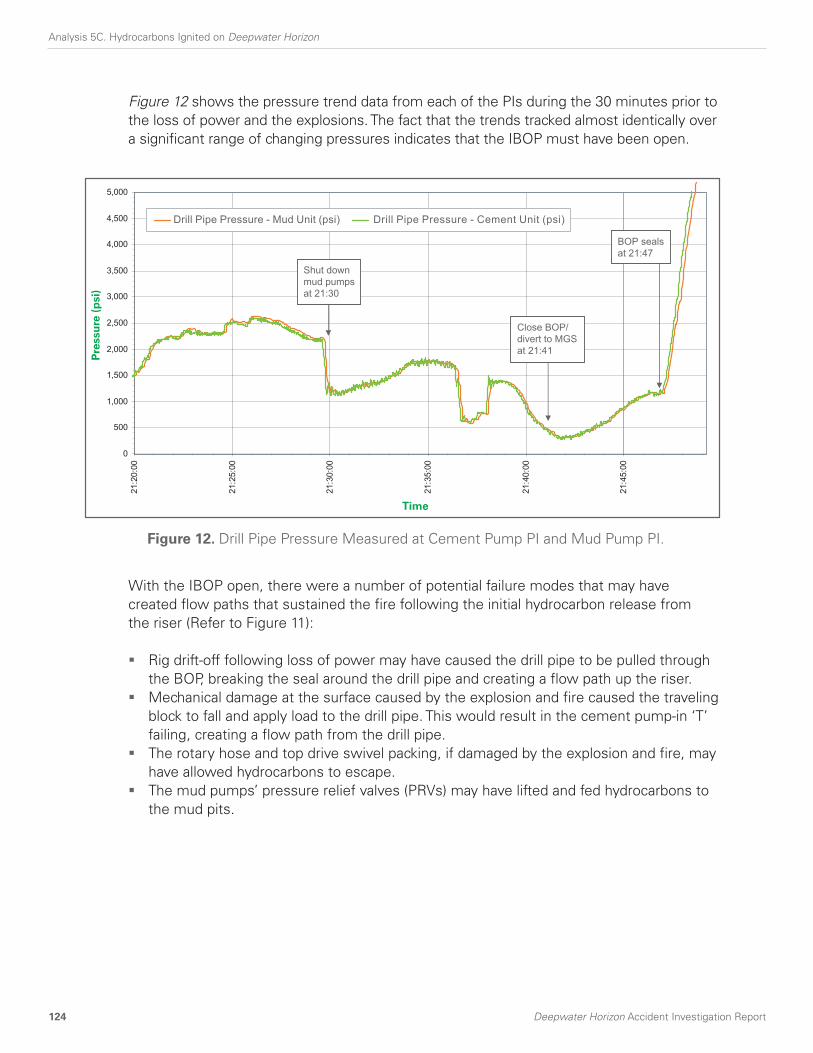
124
Analysis 5C. Hydrocarbons Ignited on Deepwater Horizon
Deepwater Horizon Accident Investigation Report
Figure 12 shows the pressure trend data from each of the PIs during the 30 minutes prior to
the loss of power and the explosions. The fact that the trends tracked almost identically over
a significant range of changing pressures indicates that the IBOP must have been open.
With the IBOP open, there were a number of potential failure modes that may have
created flow paths that sustained the fire following the initial hydrocarbon release from
the riser (Refer to Figure 11):
� Rig drift-off following loss of power may have caused the drill pipe to be pulled through
the BOP, breaking the seal around the drill pipe and creating a flow path up the riser.
� Mechanical damage at the surface caused by the explosion and fire caused the traveling
block to fall and apply load to the drill pipe. This would result in the cement pump-in ‘T’
failing, creating a flow path from the drill pipe.
� The rotary hose and top drive swivel packing, if damaged by the explosion and fire, may
have allowed hydrocarbons to escape.
� The mud pumps’ pressure relief valves (PRVs) may have lifted and fed hydrocarbons to
the mud pits.
0
500
1,000
1,500
2,000
2,500
3,000
3,500
4,000
4,500
5,000
21:2
0:0
0
21:2
5:0
0
21:3
0:0
0
21:3
5:0
0
21:4
0:0
0
21:4
5:0
0
Drill Pipe Pressure - Mud Unit (psi) Drill Pipe Pressure - Cement Unit (psi)
Time
Pre
ssu
re(p
si)
BOP seals
at 21:47
Close BOP/
divert to MGS
at 21:41
Shut down
mud pumps
at 21:30
Figure 12. Drill Pipe Pressure Measured at Cement Pump PI and Mud Pump PI.

Deepwater Horizon Accident Investigation Report 125
Analysis 5C. Hydrocarbons Ignited on Deepwater Horizon
An
aly
sis
5C
The investigation team concluded that several of these failure modes were plausible,
but has been unable to determine which was responsible for the continued flow of
hydrocarbons. A combination of these failure modes most likely occurred.
Regarding the last of these potential failure modes, analysis of the mud pump PRVs was
conducted to determine their likely set pressure (the investigation team was unable to
obtain this information directly from Transocean). The investigation team believes that the
setpoint for the high-pressure mud pumps’ PRVs was approximately 6,000 psi, based on
the two reference points from the real-time data pressure readings shown in Figure 13 and
Figure 14. These figures show that:
� Mud pump #2 was tested to 5,800 psi during the negative-pressure test procedure at
15:17 hours.
� While trying to start mud pump #2 at 21:17 hours, the pressure increased to 6,000 psi.
The investigation team believes that mud pump #2 was started against a closed discharge
valve at 21:17 hours and the PRV lifted.
0
500
1,000
1,500
2,000
2,500
3,000
3,500
4,000
4,500
5,000
5,500
6,000
15
:0
0
15
:0
4
15
:0
8
15
:1
2
15
:1
6
15
:2
0
15
:2
4
15
:2
8
15
:3
2
15
:3
6
15
:4
0
15
:4
4
15
:4
8
15
:5
2
15
:5
6
16
:0
0
16
:0
4
0
20
40
60
80
100
Pre
ssu
re(p
si)
TimeP
um
pR
ate
(sp
m)
Pump #2 pressure (5,800 psi) Pump #2 flow
Figure 13. Mud Pump #2 Pressure Plot Showing Line Test During Negative-pressure Test.

126
Analysis 5C. Hydrocarbons Ignited on Deepwater Horizon
Deepwater Horizon Accident Investigation Report
3.6 Outcomes of Different Shut-in Scenarios
The investigation team concluded that, if the BOP had closed and sealed around the drill
pipe at any time prior to 21:38 hours, and if the pressure integrity had been maintained
through the drill pipe to the mud pumps, the chance for hydrocarbons to enter the riser and
flow to the surface would have been reduced or eliminated.
Figure 15 shows a view of the different fluids across the wellbore at 21:38 hours, if the
BOP was closed, and illustrates that hydrocarbons would probably have been located
below the BOP at that time. In the figure, a sharp interface among different fluids is shown
for simplicity of illustration. In reality, there would have been varying degrees of
fluid mixing.
The simulations have been proven to be quite sensitive to the net pay assumption.
Therefore, the time of 21:38 hours, when hydrocarbons were assumed to be just below
the BOP, could be off by 1 or 2 minutes.
0
500
1,000
1,500
2,000
2,500
3,000
3,500
4,000
4,500
5,000
5,500
6,000
21
:10
21
:14
21
:18
21
:22
21
:26
0
5
10
15
20
Pre
ssu
re(p
si)
Time
Pu
mp
Rate
(sp
m)
Pump #2 pressure (6,000 psi)
lifts relief valve
Pump #2 flow
Figure 14. Mud Pump #2 Pressure Plot Showing Lift Pressure of PRV.

Deepwater Horizon Accident Investigation Report 127
Analysis 5C. Hydrocarbons Ignited on Deepwater Horizon
An
aly
sis
5C
Figure 15. Illustration of Wellbore and Position of Hydrocarbons
at 21:38 Hours if BOP Was Closed.

128
Analysis 5C. Hydrocarbons Ignited on Deepwater Horizon
Deepwater Horizon Accident Investigation Report
The investigation team has also concluded that if the well had been lined up to the
starboard diverter rather than the MGS, the majority of the gas would have been diverted
safely overboard. The pressure increase during the blowout may still have caused a failure
of the riser slip joint seals, which would have allowed gas onto the rig floor through the
moon pool. However, the majority of the gas would probably have vented through the
starboard diverter, reducing the likelihood of hydrocarbons reaching an ignition source and
may have reduced the consequences of the event.
Figure 16 shows the likely vapor dispersion pattern based on the orientation of the rig and
the prevailing wind conditions on the evening of the accident.
3.7 Hydrocarbon Release Locations Analysis
The OLGA® well flow modeling suggests that, if the BOP had been closed and sealed
around the drill pipe prior to 21:38 hours, hydrocarbons would probably not have entered
the riser.
During the process of shutting in the well at approximately 21:41 hours, the riser was
lined up to the MGS, and gas started exiting the 12 in. goosenecked vent, which directed
significant volumes of gas down onto the rig.
Figure 16. Vapor Dispersion Case for Diverting to the Starboard Diverter.

Deepwater Horizon Accident Investigation Report 129
Analysis 5C. Hydrocarbons Ignited on Deepwater Horizon
An
aly
sis
5C
The high simultaneous flow of fluids and gas overwhelmed the surface equipment and
caused a pressure increase beyond the design limits of some of the surface equipment.
The high pressure would have caused some low-pressure elements of the MGS design to
fail. Gas would have been driven through the MGS’s 6 in. vacuum breaker vent and, if open,
through the MGS’s 10 in. liquid outlet to the gumbo box. This flow path would have resulted
in gas flowing under the deck. It was also possible that the riser slip joint seals began to leak.
As a consequence, gas rapidly dispersed across Deepwater Horizon, enveloping large areas
of the drilling rig in a flammable gas mixture.
The subsequent fire and explosion or rising pressure may have caused further collateral
damage, creating a flow path for hydrocarbons through the drill pipe. The rig drift-off
following the loss of power may have caused the BOP seal around the drill pipe to fail,
creating a flow path through the riser to the surface.
If the rig crew had diverted to the 14 in. starboard diverter rather than the MGS, the
consequences of the event may have been reduced.
4 Potential Ignition Sources
The investigation team reviewed three areas of Deepwater Horizon design to assess potential
sources of ignition:
� Electrical area classification.
� Fire and gas system.
� Ventilation system.
In an attempt to identify a potential primary ignition source, blast propagation waves and fire
and blast damage patterns were also analyzed.
The information that was used to complete this analysis was primarily based on Deepwater
Horizon documentation dating from the initial construction of the rig for Vastar Resources, Inc.
The date of origin for these documents is pre-2001; therefore, some of the equipment details
or system designs could have changed. However, the investigation team believes that any such
differences would have been unlikely to affect significantly the conclusions drawn.
4.1 Electrical Area Classification
According to Deepwater Horizon Marine Operations Manual (MOM) from March 2001:
The spaces or areas on the ship are divided and identified as to the
probability or possibility of their containing an explosive gas/air mixture.
Most of the rig is unclassified, as there is little or no chance of such a
mixture existing except in extreme circumstances.

130
Analysis 5C. Hydrocarbons Ignited on Deepwater Horizon
Deepwater Horizon Accident Investigation Report
Electrical equipment that is installed in classified areas is specially designed and tested to
ensure it does not initiate an explosion.
A review of as-built design drawings indicated that electrically classified areas on
Deepwater Horizon included the drill floor and the areas above the drill floor adjacent to
and including the derrick. The area of the main deck immediately below the drill floor was
classified. Various vent intakes, vent outlets and diverter outlets were also classified.
The majority of the bow and aft main deck was not electrically classified.
The moon pool and mud pit rooms below the main deck were electrically classified.
The extent of electrically classified areas on Deepwater Horizon appeared to be consistent
with normal industry practices; however, for gas release events beyond the drill floor,
multiple ignition sources could have existed. (Refer to Figure 17.)
Figure 17. Hazardous Area Classification—Main Deck.

Deepwater Horizon Accident Investigation Report 131
Analysis 5C. Hydrocarbons Ignited on Deepwater Horizon
An
aly
sis
5C
4.2 Fire and Gas System
The investigation team reviewed the gas detection system for Deepwater Horizon
using information that was available at the time. The review covered the F&G system’s
functionality and the automated actions taken upon detection of combustible gas.
The investigation team did not review fire and toxic gas detection.
The MOM summarizes the gas detection system philosophy as follows:
The safety system includes a combustible and toxic (H2S) gas detection
system. The gas detection system is designed to detect and monitor the
presence of combustible gas in the areas required by the regulatory bodies.
According to the MOM, the Deepwater Horizon F&G system had 27 combustible gas
detectors (CGDs). The distribution of the CGDs throughout the upper hull is shown in Table 2.
A review of the cause and effect (C/E) matrix found in Volume 2, Appendix D of the MOM
indicated that all CGDs had automatic visual and audible alarms. The C/E matrix was
reviewed for automated actions (i.e., automated responses to combustible gas detection);
13 of the 27 CGDs had automated responses. Fourteen of the CGDs took no automated
action; they just had visual and audible alarms.
Zones having automated actions upon gas detection
include:
� Personnel accommodation areas and galley.
� Driller’s workstation and driller’s equipment room.
� Mud pump room.
� Aft main electrical rooms and air handling unit #5.
� Electrical, electronics, battery and transformer rooms.
� Welding shop, machine shop and associated areas.
The automated actions were intended to prevent gas
ingress through the HVAC system by closing fire
dampers and shutting down the ventilation fans in
selected fire zones.
The design of the gas detection system was apparently based on a single CGD at each
location. Such a system lacks the redundancy levels associated with a high-reliability
design. If a single CGD did not work, was inhibited or was out of commission, the
protective functions provided by that device would have been lost. Preliminary analysis of
available maintenance records and a recent third party condition assessment indicated that
gas detectors were adequately tested and maintained.
Area # CGD
Third Deck 0
Second Deck 5
Main Deck 13
Helideck 0
Drill Floor 9
Total 27
Table 2. CGDs on
Deepwater Horizon.

132
Analysis 5C. Hydrocarbons Ignited on Deepwater Horizon
Deepwater Horizon Accident Investigation Report
The physical locations of the CGDs are shown in Figure 18 (drill floor and above),
Figure 19 (second deck) and Figure 20 (main deck). These figures show the 13 CGDs that
had automated actions and the 14 CGDs that did not.
CGDs were located near the supply intakes for all the engine rooms, but these CGDs
did not have associated automated actions to prevent gas ingress to the engine rooms.
Therefore, the investigation team concluded that the HVAC system may have transferred
gas into the engine room enclosures.
The Safety System Design Philosophy for Deepwater Horizon states that “the duty driller or
toolpusher normally controls gas accidents from the driller’s workstation.” The investigation
team concluded that it was unlikely that the driller or the toolpusher shut down the HVAC
system to the engine rooms. This conclusion was supported by eyewitness testimony that
was related at the Marine Board of Investigation hearings. The eyewitnesses stated that
they heard the engines overspeed. The driller and the toolpusher would presumably have
been focusing their efforts on shutting in the well.
Automated Damper Closure and/or Fan Stop
Combustible Gas Detector
Figure 18. CGD Locations—Drill Floor and Above.

Deepwater Horizon Accident Investigation Report 133
Analysis 5C. Hydrocarbons Ignited on Deepwater Horizon
An
aly
sis
5C
Figure 19. CGD Locations—Second Deck.

134
Analysis 5C. Hydrocarbons Ignited on Deepwater Horizon
Deepwater Horizon Accident Investigation Report
4.3 Ventilation System
The investigation team reviewed the functionality and layout of the ventilation system
and the automated actions that would occur upon combustible gas detection. The review
focused on areas with the potential to disperse combustible gas through the ventilation
system: the aft main deck, the engine rooms, the mud pump rooms and the drill floor.
The fire dampers were designed to close automatically when power is removed.
Fusible links were also provided to ensure that dampers closed in the event of a fire.
All dampers were fail safe and required air to open; they were spring-returned to the
closed position.
Figure 20. CGD Locations—Main Deck.
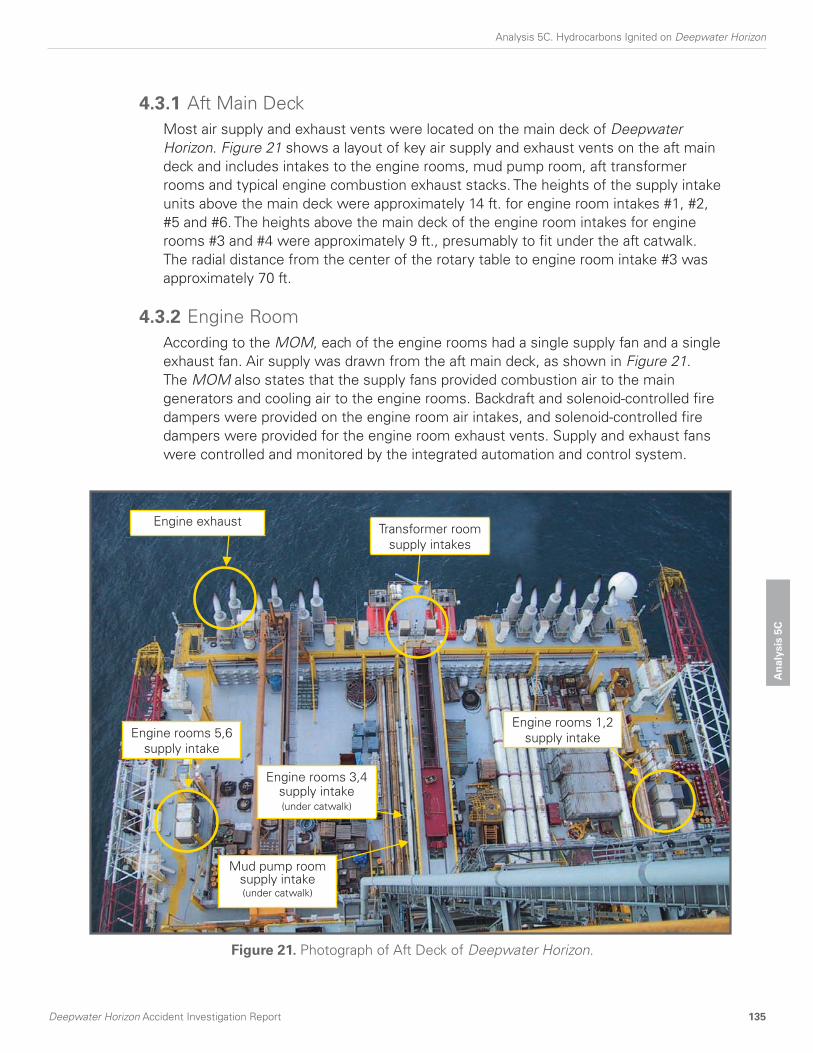
Deepwater Horizon Accident Investigation Report 135
Analysis 5C. Hydrocarbons Ignited on Deepwater Horizon
An
aly
sis
5C
4.3.1 Aft Main Deck
Most air supply and exhaust vents were located on the main deck of Deepwater
Horizon. Figure 21 shows a layout of key air supply and exhaust vents on the aft main
deck and includes intakes to the engine rooms, mud pump room, aft transformer
rooms and typical engine combustion exhaust stacks. The heights of the supply intake
units above the main deck were approximately 14 ft. for engine room intakes #1, #2,
#5 and #6. The heights above the main deck of the engine room intakes for engine
rooms #3 and #4 were approximately 9 ft., presumably to fit under the aft catwalk.
The radial distance from the center of the rotary table to engine room intake #3 was
approximately 70 ft.
4.3.2 Engine Room
According to the MOM, each of the engine rooms had a single supply fan and a single
exhaust fan. Air supply was drawn from the aft main deck, as shown in Figure 21.
The MOM also states that the supply fans provided combustion air to the main
generators and cooling air to the engine rooms. Backdraft and solenoid-controlled fire
dampers were provided on the engine room air intakes, and solenoid-controlled fire
dampers were provided for the engine room exhaust vents. Supply and exhaust fans
were controlled and monitored by the integrated automation and control system.
Engine rooms 3,4supply intake(under catwalk)
Engine exhaustTransformer room
supply intakes
Engine rooms 1,2
supply intakeEngine rooms 5,6
supply intake
Mud pump room supply intake(under catwalk)
Figure 21. Photograph of Aft Deck of Deepwater Horizon.

136
Analysis 5C. Hydrocarbons Ignited on Deepwater Horizon
Deepwater Horizon Accident Investigation Report
Although the F&G system visual and audible alarms were automatically triggered upon
gas detection, there were no automated actions to close the fire dampers or shut
down the engine room ventilation fans. Figure 22 shows the modeled vapor dispersion
cloud across the aft main deck 190 seconds after gas reached the surface. Gas would
probably have reached the engine room HVAC fans and been transferred into the
enclosures for engine rooms #3, #4, #5 and #6.
4.3.3 Mud Pump Room
The mud pump rooms on the second and third decks were supplied with air from the
main deck by two fans located under the aft catwalk. (Refer to Figure 21.) Exhaust
was provided by two fans that were also located on the aft deck. (Refer to Figure 21.)
According to the C/E matrix in the MOM, automated actions should have closed the fire
dampers and shut down the ventilation fans to the mud pump rooms upon high-level
gas detection. The relevant CGDs were located near the ventilation fan intake on the
main deck and in the mud pump room. (Refer to Figure 20 and Figure 19.)
Figure 22. Vapor Dispersion Aft Deck—190 Seconds.

Deepwater Horizon Accident Investigation Report 137
Analysis 5C. Hydrocarbons Ignited on Deepwater Horizon
An
aly
sis
5C
4.3.4 Drill Floor
The drill floor was an electrically classified area. Over-pressure ventilation was provided
to the driller’s workstation to declassify the enclosed area. A blower located on top of
the drawworks house provided the air supply. Upon detection of combustible gas, the
blower should have stopped, and the fire damper should have closed automatically.
(Refer to Figure 18.) According to the MOM, the “duty driller [is] prepared to manually
shut down all electrical equipment not rated for hazardous operation.”
4.4 Blast Over-pressure
A review of personnel injury locations (including fatalities) and facility damage accounts
suggested that one likely epicenter of the explosion was in the starboard aft quadrant;
this corresponded to the area of the rig containing engine rooms #3 and #6 (the running
engines) and the mud pump rooms. The initial vapor release probably reached the HVAC
intakes in this area. (Refer to Figure 22.)
The blast over-pressure that occurred at the second deck level created a pressure wave that
caused significant damage to the aft starboard side of the accommodations area, where
multiple personnel injuries occurred. This pressure wave also caused significant damage to the
engine control room on the second deck level at the aft end of the rig. (Refer to Figure 23.)
Figure 23. Second Deck Damage Vector Diagram.

138
Analysis 5C. Hydrocarbons Ignited on Deepwater Horizon
Deepwater Horizon Accident Investigation Report
4.5 Potential Ignition Sources Analysis
The vapor dispersion modeling shows a flammable mixture quickly enveloping large areas
of the rig, including some enclosed spaces below deck. The majority of the bow and aft
main deck and the decks below were not electrically classified. Therefore, for gas release
events beyond the drill floor, multiple ignition sources could have existed.
The HVAC system probably transferred flammable vapors into the engine room enclosures,
causing the engines to overspeed. This may have created a source of ignition.
Mechanical sources of ignition were also possible. The significant pressures that occurred
during the hydrocarbon release may have caused equipment failure, and the resulting
collateral damage could have caused a spark.
There was at least one major explosion at the second deck level, which created significant
over-pressure and caused structural damage.
5 Conclusions
5.1 Diverting to the MGS
The design of the MGS system allowed the rig crew to divert riser fluids to the MGS
vessel when the well was in a blowout condition. The decision to divert the well through
the MGS rather than the starboard diverter increased the potential for the gas to reach an
ignition source. (Refer to Figure 8.)
Diverting the well through the MGS also resulted in several consequences:
� The gooseneck design of both the MGS 12 in. vent line and the MGS 6 in. vacuum
breaker vented gas directly down onto the rig, rather than to a safe location.
� An additional path for gas flow, either directly onto the rig floor or under the deck, may
have existed if the 10 in. liquid outlet was lined up to the trip tanks or the gumbo box, as
the associated liquid seal would have been blown out.
� The rate of fluid flow caused system pressures to increase beyond design ratings, which
may have compromised surface equipment.
Modeling analysis suggests that if the rig crew had identified that the well was flowing
and had closed the BOP to seal around the drill pipe any time before approximately
21:38 hours, hydrocarbons would probably not have entered the riser.

Deepwater Horizon Accident Investigation Report 139
Analysis 5C. Hydrocarbons Ignited on Deepwater Horizon
An
aly
sis
5C
5.2 Protective Systems
The F&G system did not prevent released hydrocarbons from reaching potential
ignition sources.
A flammable mixture was likely transferred into the engine rooms because Deepwater
Horizon engine room HVAC fans were not designed to shut down automatically upon
gas detection. At least one engine went into overspeed and may have been a source
of ignition.
There was a high level of reliance upon manual/human intervention in the activation of
Deepwater Horizon safety systems, which included well control response. The reliability
of the systems was therefore limited by the capability of individuals to respond in a
stressed environment.
5.3 Sustaining the Flow Following the Closure of the BOP
The IBOP on the top drive was open, exposing equipment to increasing wellbore pressure.
The subsequent fire and explosion or rising pressure may have caused further collateral
damage, creating other flow paths for hydrocarbons.
Rig drift-off following the loss of power may have caused the BOP seal around the drill pipe
to fail, creating a flow path through the riser to the surface.
6 Recommendations
The investigation team has developed recommendations in response to the findings and
conclusions presented in Section 5. Deepwater Horizon Accident Analyses. (Refer to Section
6. Investigation Recommendations of this report.) These recommendations comprise two
categories: (1) those related to BP’s Drilling and Well Operations Practice (DWOP) and its
Operations Management System (OMS) implementation and (2) those related to BP’s
Contractor and Service Provider Oversight and Assurance.

140 Deepwater Horizon Accident Investigation Report

Deepwater Horizon Accident Investigation Report 141
Analysis 5D. The Blowout Preventer Did Not Seal the Well
1 Introduction
A critical factor in the causal chain of events that contributed to this accident was the failure of
the blowout preventer (BOP) to isolate the wellbore prior to and after the explosions and the
fire. For a description of the BOP and its control system, refer to Appendix H. Description of
the BOP Stack and Control System.
Analysis 5B. Hydrocarbons Entered the Well Undetected and Well Control Was Lost
established that the rig crew activated the BOP when the well was flowing, and hydrocarbons
had already entered the riser. Analysis 5C. Hydrocarbons Ignited on Deepwater Horizon
established that the surface facilities were overwhelmed with the volumes of fluids and gas,
which resulted in the explosions and fire. This analysis discusses the performance of the BOP
prior to and after the explosions and fire and provides information regarding BOP operations
from 21:41 hours on April 20, 2010, to May 5, 2010. At approximately 21:41 hours on
April 20, 2010, the rig crew began responding to surface indications of a flowing well by
attempting to close the BOP. On May 5, 2010, remotely operated vehicle (ROV) intervention
activities to close the BOP ceased.
This analysis also discusses the maintenance history, testing and known modifications
conducted on the BOP since its commissioning in 2001 and provides information regarding
the likely condition of the BOP at the time of the accident. The investigation team reviewed
available information and conducted various analyses to evaluate the performance of the BOP
system prior to and after the accident.
Through the investigation team’s review and analysis of the available information, the team
determined the following key finding:
Key Finding 8. The BOP emergency mode did not seal the well.
An
aly
sis
5D
Analysis 5D. The Blowout Preventer Did Not Seal The Well

142
Analysis 5D. The Blowout Preventer Did Not Seal the Well
Deepwater Horizon Accident Investigation Report
Information regarding the performance of the BOP system was collected from:
� Sperry-Sun real-time data.
� OLGA® well flow modeling.
� Hydraulic analysis of the BOP control system and finite element modeling of an annular
preventer response under pressure conditions.
� Recovered BOP control pods and failed riser and drill string components.
� The BP Gulf of Mexico incident management team.
� Witness accounts from:
� Marine Board of Investigation (MBI) hearings on May 26–29,
July 19–23 and August 23–27, 2010.
� Interviews conducted by the investigation team.
� A review of BP, Transocean and Cameron documents, such as engineering bulletins, Daily
Report Sheets, rig audits and BOP maintenance records.
� Data in these appendices:
� Appendix E. Sperry-Sun Real-time Data—Surface Parameters.
� Appendix H. Description of the BOP Stack and Control System.
� Appendix W. Report—Dynamic Simulations Deepwater Horizon Incident BP
(from ae add energy) (electronic media).
� Appendix X. Deepwater Horizon Blue Pod AMF System Batteries (electronic media).
� Appendix Y. September 2009—Deepwater Horizon Follow-up Rig Audit
(electronic media).
� Appendix Z. Hydraulic analyses of BOP control system (from Ultra Deep)
(electronic media).
� Appendix AA. Deepwater Horizon BOP Modifications Since Commissioning
(electronic media).
Topics in this analysis include:
2 Performance of the BOP System to Isolate the Wellbore Prior to the Accident
2.1 Sealing of the Annulus by the BOP
2.2 Inability of the Annular Preventer to Seal the Annulus
2.2.1 Prevailing Flow and Pressure Conditions
2.2.2 Insufficient Hydraulic Pressure
2.2.3 Failure of the Annular Preventer Elastomeric Element
3 Performance of the BOP System to Isolate the Wellbore After the Accident
3.1 High-pressure BSR and EDS Performance
3.2 Automatic Mode Function Performance
3.2.1 Solenoid Valve 103 Condition
3.2.2 AMF Battery Condition
3.3 ROV Hot Stab Intervention to Close the BSR
3.4 ROV Activation of the Autoshear
3.5 BSR Sealing Performance
3.5.1 Hydraulic Pressure Requirement to Shear Pipe
3.5.2 Hydraulic Pressure Availability
3.5.3 Condition of the BSR Sealing Element

Deepwater Horizon Accident Investigation Report 143
Analysis 5D. The Blowout Preventer Did Not Seal the Well
An
aly
sis
5D
4 Status of the BOP Rams and Drill Pipe Configuration at the Time of the Accident
4.1 Status of the BOP Rams After the Explosion
4.2 Status of the Drill Pipe Across the BOP After the Explosion
5 Condition of Deepwater Horizon BOP System Prior to the Accident
5.1 Maintenance
5.2 Leaks
5.3 Testing
5.4 Modifications
5.5 Monitoring and Diagnostic Capability
5.6 Overall Summary of BOP Condition Prior to the Accident
6 Modes of BOP Operation
7 Key Lines of Inquiry Going Forward
8 Conclusions
8.1 Prior to the Accident
8.2 After the Accident
8.3 Overall BOP Condition
9 Recommendations

144
Analysis 5D. The Blowout Preventer Did Not Seal the Well
Deepwater Horizon Accident Investigation Report
2 Performance of the BOP System to Isolate the Wellbore Prior to the Accident
The recorded surface data, from approximately 21:41 hours to 21:49 hours on April 20 (the
time at which Sperry-Sun real-time data stopped transmitting), is critical to understanding
the BOP operation prior to the explosions. The data suggests that the normal mode of BOP
operation sealed the annulus less than 2 minutes prior to the loss of data transmission just
before the explosions. (Refer to 6. Modes of BOP Operation of this analysis, which provides
a discussion of BOP normal and emergency modes of operation.) The BOP closed, but it
was slow to seal. Based on the evidence and analysis to date, it is not certain which BOP
components were operated to seal the annulus prior to the explosions. It is likely that a variable
bore ram (VBR) eventually sealed the annulus.
As established in Analysis 5B., the rig crew activated the BOP at approximately 21:41 hours.
Figure 1 shows the results from the OLGA® well flow modeling of the BOP as activated
at 21:41 hours and closing and sealing the annulus in 30 seconds (solid red curve).
(Refer to Appendix W. Report–Dynamic Simulations Deepwater Horizon Incident BP.)
However, the recorded drill pipe pressure (solid black curve) indicates that the annulus was
sealed approximately 5 minutes later than the OLGA® well flow modeling predictions. Further
OLGA® well flow modeling of the BOP closing in 30 seconds, but allowing leakage past the
annular preventer for 5 minutes before fully sealing the annulus, resulted in a drill pipe pressure
(dashed red curve) that closely followed the recorded pressure. This analysis indicates that the
BOP closed within the expected time, but it did not fully seal for another 5 minutes.
0
500
1,000
1,500
2,000
2,500
3,000
3,500
4,000
4,500
5,000
21:20 21:25 21:30 21:35 21:40 21:45 21:50
Time
0
20
40
60
80
100
120
140
160
180
200
Recorded Drill Pipe Pressure
Modeled Drill Pipe Pressure for Sealing BOP at ~21:41 Hours
Modeled Drill Pipe Pressure for Leaking and Then
Sealing BOP
Flow In - All pumps
Dri
llP
ipe
Pre
ssu
re(p
si)
Flo
wR
ate
(bb
l/m
in)
Annulus leaking
Annulus sealing
Figure 1. Drill Pipe Pressure—OLGA® Well Flow Modeling of Drill Pipe Pressure
for a Closing BOP Versus Recorded Data.

Deepwater Horizon Accident Investigation Report 145
Analysis 5D. The Blowout Preventer Did Not Seal the Well
An
aly
sis
5D
2.1 Sealing of the Annulus by the BOP
Witness accounts suggest that, approximately 7 minutes after the initial explosions,
the BOP control panel on the bridge of Deepwater Horizon indicated that only the lower
annular preventer was closed. None of the witness accounts to date refer to rig crew
action to close a VBR. However, based on other available evidence, the investigation team
considers it likely that the rig crew closed at least one VBR. (Refer to 4.1 Status of the BOP
Rams After the Explosion of this analysis.)
Examination of the blue pod, which was conducted by Transocean and Cameron when the
pod was retrieved after the accident, indicated that the regulated pressure on the lower
annular preventer was set to approximately 1,700 psi.
A witness testified to the MBI that the lower annular regulator pressure was reset to
1,500 psi shortly after 21:00 hours. Since the normal regulator pressure setting for both
annular preventers was 1,500 psi, it is likely that the lower annular preventer was closed,
and the regulator pressure was increased to 1,700 psi during attempts to seal the annulus.
Wellbore pressure simulation using OLGA® well flow modeling indicates a differential
pressure across the annular preventer of over 8,000 psi after the annulus was sealed.
(Refer to Figure 2.) Given that the lower annular preventer was rated at 5,000 psi working
pressure, it might not have held a differential pressure of over 8,000 psi. It is therefore less
likely that the lower annular preventer would have sealed the annulus.
0
1,000
2,000
3,000
4,000
5,000
6,000
7,000
8,000
9,000
21:20 21:25 21:3521:30 21:40 21:45 21:50 21:55 22:00
Pre
ssu
re (
psi)
Time
Modeled Wellbore Pressure Below BOP
Modeled Wellbore Pressure Above BOP
Annulus leaking
Annulus sealingAnnulus sealed
Figure 2. OLGA® Well Flow Modeling of Wellbore Pressure for a Leaking
and Sealing Annular Preventer.
146 Deepwater Horizon Accident Investigation Report
The annular preventer likely leaked for 5 minutes before the annulus was sealed. Given this
finding combined with the evidence suggesting that at least one VBR could have been
closed by the rig crew, it is likely that a VBR eventually sealed the annulus. (Refer to 4.1 of
this analysis.) However, events subsequent to the explosion and fire could have impaired
the integrity of the seal. (Refer to 4.2 Status of the Drill Pipe Across the BOP After the
Explosion of this analysis.)
2.2 Inability of the Annular Preventer to Seal the Annulus
Three factors could have potentially contributed to the inability of the annular preventer to
seal the annulus:
� Prevailing flow and pressure conditions preventing an annular preventer from fully
closing and sealing under available regulated hydraulic pressure settings.
� Insufficient hydraulic pressure resulting from rig crew action to initiate the closure
of multiple BOP functions in rapid succession, placing an excessive demand on the
hydraulic power supply system.
� Failure of the annular preventer elastomeric element.
2.2.1 Prevailing Flow and Pressure Conditions
Hydraulic analysis of the BOP control system supports the position that the flowing
conditions could have prevented an annular preventer from fully closing and sealing
around the drill pipe. The pressure-displacement characteristics of a closing and sealing
annular preventer were obtained by finite element analysis of the annular preventer for
various wellbore pressures. (Refer to Figure 3.) The pressure-displacement characteristics
were then input into the hydraulic analysis to determine the dynamic response of the
annular preventer.
Figure 4 shows a model representation of hydraulic control for an annular preventer.
(Refer to Figure 4.)
Figure 5 shows the dynamic response of an annular preventer at 5,000 ft. water depth
(WD) operating under 1,700 psi and 2,000 psi regulated closing pressures. (Refer to
Figure 5.) (Hydraulic pressures in this analysis are quoted in terms of differential pressure,
which is the difference between the hydraulic system pressure and the hydrostatic
pressure at the sea bed.) The wellbore pressure at the time of the closure of the annular
preventer was approximately 2,500 psi. To represent an annular preventer closing in a
flowing condition, the simulated pressure in the BOP was increased from 2,500 psi to the
shut-in pressure of approximately 8,000 psi as the annular preventer elastomeric element
was about to touch the drill pipe.
The dynamic response of the annular preventer operating under 1,700 psi regulated
pressure indicated that the annular preventer failed to seal due to rapid increase in
wellbore pressure as shown in Figure 5(A). Hydraulic analysis further indicates that an
annular preventer would seal around the pipe under a regulated pressure setting of
2,000 psi, as shown in Figure 5(B).
Analysis 5D. The Blowout Preventer Did Not Seal The Well

Deepwater Horizon Accident Investigation Report 147
Analysis 5D. The Blowout Preventer Did Not Seal the Well
An
aly
sis
5D
0
500,000
1,000,000
1,500,000
2,000,000
2,500,000
3,000,000
3,500,000
4,000,000
4,500,000
5,000,000
3.4E6
4.2E4
Pis
ton
Ste
m F
orc
e (
lb)
Piston Movement (in)
psi Differential Wellbore Pressure - FEA Data
psi Differential Wellbore Pressure - FEA Data
psi Differential Wellbore Pressure - FEA Data
psi Differential Wellbore Pressure - FEA Data
psi Differential Wellbore Pressure - FEA Data
psi Differential Wellbore Pressure - Trendline
psi Differential Wellbore Pressure - Trendline
psi Differential Wellbore Pressure - Trendline
psi Differential Wellbore Pressure - Trendline
psi Differential Wellbore Pressure - Trendline
1,000
2,000
3,000
4,000
0
1,000
2,000
3,000
4,000
0
B
Figure 3. Finite Element Analysis of an Annular Preventer.
(A) Model Representation of an Annular Preventer Closing Around a Drill Pipe.
(B) Analysis Output for Piston Stem Force Versus Movement at 5,000 ft. WD for Various
Wellbore Pressures.
A
Piston Stem

148
Analysis 5D. The Blowout Preventer Did Not Seal the Well
Deepwater Horizon Accident Investigation Report
2.2.2 Insufficient Hydraulic Pressure
Hydraulic analysis indicates that the closure of several BOP functions in rapid succession
would not have affected the performance of the annular preventers and VBRs because a
large hydraulic supply was continuously provided by the rigid conduit line.
2.2.3 Failure of the Annular Preventer Elastomeric Element
Another possible reason for the annular preventer’s slow sealing response could have
been the failure of the elastomeric elements to seal around the drill pipe. The lower
annular preventer was used during the negative-pressure test at a closing pressure
of 1,900 psi, indicating that at that point, the annular preventer elastomeric element
was capable of sealing around the drill pipe. However, the performance of the annular
elements under a flowing condition is not known. According to OLGA® well flow
modeling, the fluid velocity through a leaking annular preventer could have reached
levels that were orders of magnitude greater than drill pipe steel erosion velocity. Under
such circumstances, it is possible that the annular preventer may not have been able
to seal. As discussed in 4.2 of this analysis, the heavily eroded pipe section discovered
in the retrieved riser section could have been caused by high fluid velocity through a
leaking annular preventer. (Refer to Figure 15.)
Possible work to evaluate the performance of an annular preventer under a flowing
condition is included in Section 7. Work that the Investigation Team Was Unable to
Conduct of this report.
Y
X
SV1 Open Port
Open Hose
Close Hose
SV2 Close Port
Stripping Acc
Bore Pressure
Rest Area
Piston
Damper Actuator
Seal
Friction
Squeeze Curve
Squeeze Force
Upper Annular Preventer
Open Piston
Close Piston
Figure 4. Model Representation of Hydraulic Control for Annular Preventer.

Deepwater Horizon Accident Investigation Report 149
Analysis 5D. The Blowout Preventer Did Not Seal the Well
An
aly
sis
5D
3,700
3,800
3,900
4,000
4,100
4,200
4,300
0
1
2
3
4
5
6
7
8
0 10 20 30 40
Reg
ula
ted
Pre
ssu
re (
psi)
Time (sec)
Pis
ton
Str
oke (
in)
Regulated Piston Pressure
Piston Position
Annular elementtouching pipe
(Annular preventer fails to seal)
Annular preventer closing
A
3,700
3,800
3,900
4,000
4,100
4,200
4,300
0
1
2
3
4
5
6
7
8
0 10 20 30 40
Reg
ula
ted
Pre
ssu
re (
psi)
Time (sec)
Pis
ton
Str
oke (
in)
Regulated Piston Pressure
Piston Position
Annular element
touching pipe
Annular preventer closing
Annular rubber
in compression
Annular packer
in compression
Annular preventer seals
B
Figure 5. Hydraulic Analyses of an Annular Preventer.
(A) Regulated Pressure of 1,700 psi.
(B) Regulated Pressure of 2,000 psi.
(All pressures in the figure include hydrostatic head at the seabed.)

150
Analysis 5D. The Blowout Preventer Did Not Seal the Well
Deepwater Horizon Accident Investigation Report
3 Performance of the BOP System to Isolate the Wellbore After the Accident
The available data from 21:49 hours on April 20, 2010, through May 5, 2010, when ROV
intervention activities to close the BOP ended, indicates that the emergency methods of
BOP operation available to rig personnel were compromised due to damage caused by the
explosions and fire. Furthermore, the automatic mode function (AMF) system was very likely
inoperable due to the condition of critical components in the yellow and blue pods. It appears
that the blind shear ram (BSR) was fully or partially closed by the autoshear function when ROV
intervention initiated it, but it failed to seal the wellbore.
Based on the available data, the investigation team’s views on BOP performance can be
summarized as follows:
� The explosions and fire very likely damaged the multiplex (MUX) cables and hydraulic lines.
As a result, the high-pressure BSR closure and emergency disconnect sequence (EDS)
functions would have been left inoperable. These were the only two emergency methods
of BOP operation available to rig personnel. (Refer to 3.1 High-pressure BSR and EDS
Performance of this analysis.)
� The AMF conditions would have been satisfied soon after the explosion. Analysis of
the blue pod, which was retrieved to surface after the accident, indicated that the AMF
system was armed. However, it is very unlikely that an AMF could have been successfully
completed, considering the condition of the yellow pod (defective solenoid 103) and the
blue pod (low battery charge). (Refer to 3.2 Automatic Mode Function Performance of
this analysis.)
� Various attempts to close the BSR by ROV hot stab intervention failed to seal the wellbore.
(Refer to 3.3 ROV Hot Stab Intervention to Close the BSR of this analysis.)
� Non-destructive examination (NDE) of the BOP rams performed by ROVs after activation of
the autoshear indicated that the BSR was closed. (Refer to 4.1 of this analysis.)
� It appears that the high-pressure BSR was closed by ROV activation of the autoshear
function, but it failed to seal the wellbore. (Refer to 3.4 ROV Activation of the Autoshear of
this analysis.)
� The reason for failure of the BSR to seal the wellbore has not been established. (Refer to
3.5 BSR Sealing Performance of this analysis.)
3.1 High-pressure BSR and EDS Performance
There were two emergency methods available to rig personnel to activate the BSR from
the BOP control panels on the rig. (Refer to 6. of this analysis.) Rig personnel had the
option to press the high-pressure BSR close push button; however, there is no evidence
that this occurred. They also had the option to press the EDS push button, and there are
several witness accounts indicating that the subsea supervisor pressed the EDS push
button on the toolpusher’s control panel (TCP) after the initial explosions.

Deepwater Horizon Accident Investigation Report 151
Analysis 5D. The Blowout Preventer Did Not Seal the Well
An
aly
sis
5D
The subsea supervisor testified during the MBI hearings on May 26–29, 2010, that the
TCP had a low accumulator alarm indicating loss of hydraulic power. The witness testified,
“I hit the EDS button. Everything in the panel did like it was supposed to at the panel, but
it never left the panel. I had no hydraulics.” This account suggests that the EDS did not
initiate. Both methods, high-pressure BSR and EDS, would have required communication
with the BOP control pod through MUX cables.
The MUX reels were located in the moon pool area within the explosion and fire zone.
(Refer to Figure 6.) Since the MUX cables were not protected against explosions or fire,
it is very likely that the early explosion and fire damaged the MUX reel slip rings and the
cables to the extent that the communication line and electrical power required to initiate
the high-pressure BSR and EDS functions were no longer available.
3.2 Automatic Mode Function Performance
The AMF sequence is initiated when electrical power, communications and hydraulic
pressure are lost to both pods. To initiate an AMF, all three services must fail (i.e., after
damage to the MUX reels or cables and to the hydraulic conduit, caused by explosions
and fire). As indicated in 3.1 of this analysis, the MUX cables, which carry electrical power
and communications, were vulnerable to explosion and fire damage. Though the hydraulic
conduit flexible hose was less vulnerable to damage than the MUX cables, it was located
close to the MUX cables in the moon pool and could have been damaged by the explosions
and fire. (Refer to Figure 7.)
Typical MUX reelWell center and BOP in moon pool Yellow MUX reel
Blue MUX reel
Figure 6. Moon Pool Layout Showing the Location of Blue and Yellow MUX Reels.

152
Analysis 5D. The Blowout Preventer Did Not Seal the Well
Deepwater Horizon Accident Investigation Report
As described in 3.1 of this analysis, the TCP displayed a low accumulator alarm, indicating
a loss of surface hydraulic power at the time the EDS button was pressed. Combined with
the damage to the MUX cables, the conditions for the AMF sequence would very likely
have been met at the time of the explosions and fire or soon afterward.
However, the AMF very likely failed to activate the BSR. The examination and tests
conducted by Transocean and Cameron on the blue and yellow pods following their retrieval
after the accident found a faulty solenoid in the yellow pod and low charge batteries in the
blue pod. The investigation team has determined that these conditions very likely prevailed
at the time of the accident. If so, neither pod was capable of completing an AMF sequence
that would have closed the high-pressure BSR in the event of hydraulic and electrical power
supply and communications failure on the rig.
3.2.1 Solenoid Valve 103 Condition
During the yellow pod test performed by Transocean and Cameron after the accident,
both coils on solenoid valve 103 failed to energize, suggesting electrical coil faults.
The investigation team found no evidence that this failure occurred after the accident;
rather, the team concluded that this failure condition very likely existed prior to the
accident. (Refer to 5.1 Maintenance of this analysis.) A faulty solenoid valve 103 would
mean that the yellow pod could not have performed the AMF sequence, as no pilot
Marine Riser
Telescopic JointOuter Barrel
Telescopic JointPacker Housing
Upper
Lower
Cellar Deck
Drill Floor
To Hydraulic Power Unit
To Choke &Kill Manifold
To Choke &Kill Manifold
Diverter Line Sub StructureDiverter Packer
Diverter Housing
Telescopic Joint Inner Barrel
Mud BoostDrape Hose
To MudBoost Pump
Kill LineDrape Hose
15K WP
Kill
MudBoost
BlueMUX Cable
YellowMUX Cable
Choke LineDrape Hose
15K WP
ChokeRigid
Conduit
Drill String
HydraulicConduit
Flexible Hosefrom HPU
Figure 7. Typical Configuration of Flexible Hoses in the Moon Pool.
(Hydraulic conduit flexible hose is shown in green).

Deepwater Horizon Accident Investigation Report 153
Analysis 5D. The Blowout Preventer Did Not Seal the Well
An
aly
sis
5D
signal could have been sent to the pilot-operated control valve to activate the
high-pressure BSR close function. As described in 5.5 Monitoring and Diagnostic
Capability of this analysis, the rig’s BOP control diagnostic system should have been
capable of remotely detecting the faulty solenoid valve and recording it on the system
event logger.
3.2.2 AMF Battery Condition
Figure 8 shows a simplified schematic of the AMF system. There were two 9-volt battery
packs and a 27-volt battery bank (made up of 3 packs of 9-volt batteries connected in
series) in each pod. These batteries were not rechargeable. The 9-volt AMF battery packs
were used to power the AMF card processors. When the AMF was enabled, these
batteries provided continuous power to the AMF cards. The 27-volt battery bank was
used to provide power to the 24-volt rated AMF card relays, the pressure sensors and the
solenoid valves that were used in the AMF sequence, including solenoid valve 103.
AMF Controller
SEM A
SEM B
Solenoid
Driver Board
Solenoid
Driver Board
LMRP
AMF Controller
27-volt
Battery Bank
Failed
9-voltBattery Pack A
STM
Pressure
Transducer
Module
Pressure
Transducer
Module
TX TX
STM
TX TX
Blue Pod SEM Enclosure
Blue Pod
9-volt Battery Pack
B Failed
AMF Controller
SEM A
SEM B
Solenoid
Driver Board
Solenoid
Driver Board
AMF Controller
27-volt
Battery Bank
Low Voltage
9-volt
Battery Pack A
Yellow Pod SEM Enclosure
Yellow Pod
9-volt
Battery Pack B
BOP
Solenoid Valve 103B
Stinger Stinger
Solenoid Valve 103Y
Failed
High-pressure Blind Shear Close
Pilot SupplyPilot Supply
Shuttle Value
Figure 8. Simplified Schematic of the AMF Control System.

154
Analysis 5D. The Blowout Preventer Did Not Seal the Well
Deepwater Horizon Accident Investigation Report
The batteries would power the sensors only when the AMF card detected a loss of
electrical power and communications. If the AMF card subsequently determined that
the hydraulic fluid supply had failed by comparing the measurements from the two
pressure sensors, the AMF card would have switched the 27-volt battery bank to
operate the solenoid valves. Upon completion of the AMF sequence, the AMF card
would have been powered down, and the 9-volt battery packs and the 27-volt battery
bank would have been isolated, preventing further discharge.
The examination of the control pods by Transocean and Cameron when the pods were
retrieved after the accident (yellow pod on May 5–7, 2010, and the blue pod on
July 3–5, 2010) revealed potential problems with AMF batteries in both pods. The more
significant problem was found in the blue pod, where only 0.142 volts remained in the
subsea electronic module (SEM) B 9-volt battery packs and 7.61 volts remained in the
27-volt battery bank.
Following the findings from the examination of the control pods, the investigation
team conducted a number of tests on a representative Cameron AMF card. The tests
established that a minimum of 14.9 volts was required to energize the relays on the
AMF card. The tests also established that under 3,000 psi supply pressure, a typical
Cameron solenoid valve requires between 15.8 volts and 20 volts to energize. Based on
these tests, the investigation team concluded that the charge on the AMF batteries in
the blue pod at the time the pods were examined by Transocean and Cameron would
have been insufficient to successfully complete an AMF sequence.
In 2004, Cameron, the BOP manufacturer, issued an engineering bulletin, EB 891D,
recommending that battery banks be replaced after one year of operation or when the
number of actuations exceeds 33 for that year, whichever comes first. The discharge
curve for a 27-volt battery bank indicates that after 33 actuations, the battery bank
would have expended only 20% of its expected life, as measured in ampere hours (Ah).
The measured charge of 7.61 volts on the 27-volt battery bank was past the expected
annual usage and was beyond the design life of the battery bank. (Refer to Figure 9 and
Appendix X. Deepwater Horizon Blue Pod AMF System Batteries.)
If the AMF sequence had been successfully completed, the AMF pod would have been
powered down isolating the 27-volt battery bank and stopping further battery discharge
under load. Under such circumstances, the 27-volt battery bank would have had to have
been in a charged condition at the time of the examination.
The investigation team considers that it is very likely that the charge at the time of the
accident would have been insufficient to activate the AMF.
The available maintenance records from 2001 to 2010 indicate that during this
period, the AMF batteries were changed at a frequency less than the manufacturer’s
recommendation. The BOP control diagnostic functionality did not include measuring
the charge on the AMF batteries. Transocean maintenance records for AMF batteries
are discussed in 5.1 of this analysis.

Deepwater Horizon Accident Investigation Report 155
Analysis 5D. The Blowout Preventer Did Not Seal the Well
An
aly
sis
5D
3.3 ROV Hot Stab Intervention to Close the BSR
Several attempts were made to close the BSR by ROV hot stab intervention after the
accident. The investigation team has concluded that it was unlikely that these efforts closed
the BSR.
These attempts are summarized below:
� In the initial ROV intervention period, several ROV hot stab attempts to close the BSR
were made, but none were effective, as no pressure was developed at the ROV hot stab
port. These attempts were unsuccessful because of ROV pump failure and because the
available ROV pumps, with their low flow rate output, were not able to operate shuttle
valves or overcome a leak that was subsequently discovered in the hydraulic system.
(Refer to the third bullet below.)
� After these attempts failed, an ROV cut the autoshear rod to initiate the high-pressure
BSR close function. In the 3-hour period between the cutting of the autoshear rod and
the sinking of the rig, an additional ROV hot stab attempt was made to close the BSR,
but the ROV was unable to build pressure in the BOP hydraulic system.
� After the rig sank, ROV hot stab intervention revealed a leaking fitting in the ST lock
close hydraulic circuit. After this leak was repaired, another attempt was made to close
the BSR. The resulting sudden pressure increase indicated that the BSR was already
closed, supporting the proposition that the autoshear function had already closed
the BSR.
0
0 10 20 30 40 50
5
10
15
20
25
30B
att
ery
Vo
ltag
e (
v)
Battery Capacity (Ah)
Estimated battery
usage for 33 AMF
actuations (8.3 Ah)
Battery capacity (42 Ah)
As found yellow pod
AMF battery voltage
(18.4 volts)Average pull-in voltage
Range of pull-in voltages
for Cameron solenoid
valve
As found blue pod
AMF battery voltage
(7.61 volts)
Figure 9. Discharge Curve for a 27-volt AMF Battery Bank.
Source: SAFT LM33550 Battery Data Sheet (Data is scaled from a C/120 discharge rate at 68oF [20oC])

156
Analysis 5D. The Blowout Preventer Did Not Seal the Well
Deepwater Horizon Accident Investigation Report
� In the period leading up to May 5, 2010, several more attempts were made to close
the lower (test) and middle pipe rams and the annular preventers using hydraulic fluid
supplied from seabed-deployed accumulator banks. During these attempts, several
issues emerged, including the discovery of an additional hydraulic system leak and
incorrect hydraulic plumbing from the ROV intervention panel to the pipe rams, which
was likely the result of BOP modifications. These issues delayed ROV intervention.
(Refer to 5.2 Leaks and 5.4 Modifications of this analysis.)
3.4 ROV Activation of the Autoshear
In an effort to actuate and open the autoshear valve, the autoshear rod was cut at
approximately 07:40 hours on April 21, 2010. Incident management team (IMT) responders,
who were monitoring ROV operations when the autoshear was activated, reported that
movement was observed on the BOP stack. This movement was consistent with stack
accumulators discharging. A short time later, a leak on the ST lock hydraulic circuit, which
was downstream of one of the BSR bonnet sequence valves, was observed, indicating that
the lock circuit and the BSR were closed.
The investigation team has concluded that, based on the available evidence, the autoshear
function was armed, and the high-pressure BSR close function appears to have been
activated by the ROV cutting the autoshear rod.
3.5 BSR Sealing Performance
Potential causes for the failure of the BSR to seal include:
� The presence of a non-shearable pipe across the BSR.
� Insufficient hydraulic power to shear drill pipe and seal the wellbore.
� Seal failure due to the prevailing flow condition in the BOP.
The investigation team has not been able to determine the reason for the failure of the
BSR to seal.
3.5.1 Hydraulic Pressure Requirement to Shear Pipe
The retrieved riser kink section contained one section of 5 1/2 in. drill pipe at the upper
end and two sections at the lower end, indicating the possible presence of more than
one section of pipe in the BOP. However, further examination of the content of the riser
kink indicated that there was likely one section of drill pipe across the BOP when the
autoshear function was activated. (Refer to 4.2 of this analysis.)
The pipe inventory records for Deepwater Horizon indicate that the 5 1/2 in. drill pipe
was ordered as 21.9 ppf, S-135 per American Petroleum Institute (API) Specification
5D., which specifies a nominal minimum wall thickness of 0.361 in. for new pipe and
a yield strength range of 135 ksi to 165 ksi. The manufacturing records for the pipe
joint identified in the kinked riser joint indicate that the pipe was manufactured with
a minimum wall thickness of 0.381 in. The wall thickness of the drill pipe sections in

Deepwater Horizon Accident Investigation Report 157
Analysis 5D. The Blowout Preventer Did Not Seal the Well
An
aly
sis
5D
the retrieved kinked riser joint ranged from 0.360 in. to 0.417 in. One of the pieces of
pipe was identified with serial number NJ07690. The pipe manufacturing records show
that the yield strength for this joint of pipe was between 138 ksi and 152 ksi. The pipe
sections in the riser kink were within the API specification for 5 1/2 in., 21.9 ppf, S-135
drill pipe.
Based on Cameron’s shearing formula (EB 702D, Revision B9, dated January 21, 2008),
the hydraulic pressure required to shear 5 1/2 in., 21.9 ppf, S-135 pipe at the surface is
estimated as 2,840 psi. Cameron’s shearing formula is plotted in Figure 10 for varying
wellbore pressures for a BOP at the surface (dashed black line) and a BOP at
5,000 ft. WD (solid black line). Shearing pressure is represented with respect to
hydrostatic pressure at the sea bed. This formula takes into account the statistical
variance in pipe wall thickness, material yield strength and ductility. A qualification
test of Deepwater Horizon BOP BSRs was conducted at the surface in April 2000,
when a joint of 5 1/2 in., 21.9 ppf, S-135 drill pipe was successfully sheared at a
shearing pressure of 2,900 psi, which is slightly greater than the pressure predicted by
Cameron’s shearing formula.
0
0 1,000 2,000 3,000 4,000 5,000 6,000 7,000 8,000 9,000 10,000
5,000
4,500
4,000
3,500
3,000
2,500
2,000
1,500
1,000
500
Dif
fere
nti
al
Sh
ea
rin
gP
ressu
reP
S-P
H(p
si)
Wellbore Pressure PW (psi)
PS = Shearing Pressure
PW = Wellbore Pressure
PH = Hydrostatic Pressure at Seabed
Cameron shearing pressure -
BOP at sea bed (5,000 ft. WD)
Cameron shearing pressure -
BOP at surfaceApril 2000
qualification test
(2,900 psi)Design hydraulic pressure (4,000 psi)
Available hydraulic pressure with
leak in ST Lock (3,382 psi)
Figure 10. Shear Pressure Requirement for 5 1/2 in., 21.9 ppf, S-135 Drill Pipe.

158
Analysis 5D. The Blowout Preventer Did Not Seal the Well
Deepwater Horizon Accident Investigation Report
Since the well was flowing at the time of the autoshear operation, the wellbore
pressure as the pipe was being sheared is unknown. The shearing operation would have
resulted in restricted flow conditions across the BSR through a cross-sectional area
larger than the one assumed for the leaking annular preventer in Figure 2.
It is not expected, therefore, that the increase in wellbore pressure would have been
greater than 3,000 psi. Figure 10 shows that at 4,000 psi design hydraulic pressure, the
BSR should have been capable of shearing the 5 1/2 in. pipe. This assumes that there
was no reduction in the available hydraulic pressure due to leaks or loss of BOP stack
accumulator nitrogen pre-charge pressure.
3.5.2 Hydraulic Pressure Availability
The BOP stack accumulators were capable of delivering 4,000 psi pressure, well above
what was required to shear the 5 1/2 in. drill pipe.
However, there are three possible factors that could have reduced the available
pressure in the accumulators:
� Leak in the ST lock hydraulic circuit.
� Leaking check valve in the BOP stack accumulator isolation circuit.
� Insufficient nitrogen pre-charge pressure in the BOP stack accumulators.
Leak in the ST Lock Hydraulic Circuit
During the post-accident ROV intervention, a leak was discovered in the high-pressure
BSR close/ST lock circuit. (Refer to 5.2 of this analysis for further discussion of all
leaks of which BP is aware.) A detailed hydraulic analysis of the BOP control system
indicated that the existence of a leak similar in magnitude to the one discovered would
not have reduced the hydraulic pressure available to the BSR below the manufacturer-
recommended pressure required for shearing the drill pipe and then sealing
the wellbore.
Figure 11 shows the responses of the BSR with and without a leak in the ST lock
hydraulic circuit. The analysis assumes a pipe shearing pressure derived using
Cameron’s formula for 5 1/2 in., 21.9 ppf, S-135 pipe at a wellbore pressure of
3,000 psi. Figure 11(B) illustrates that without a leak, there was sufficient pressure to
shear and seal the drill pipe. In comparing Figure 11(A) and Figure 11(B), the impact of
a leak is seen to increase the time it takes to build up hydraulic pressure in the actuator
to be able to shear the pipe (12.5 seconds versus 10.5 seconds). However, even with
the presence of the leak, sufficient hydraulic pressure was achieved to complete the
shearing operation. With the leak, the overall shearing operation would have taken
17 seconds to complete, whereas without a leak, shearing operations would have
finished in 14 seconds.
The impact of the second leak on the BSR ST-lock circuit, potentially within an ST-lock
sequence valve, could not be fully investigated without access to the BOP. (Refer to 5.2
of this analysis for further discussion of all leaks of which BP is aware.)

Deepwater Horizon Accident Investigation Report 159
Analysis 5D. The Blowout Preventer Did Not Seal the Well
An
aly
sis
5D
Figure 11. Hydraulic Analyses of BSR Closure Response (at a Wellbore Pressure of 3,000 psi
and 5,000 ft. WD) (A) With and (B) Without a Leak in the ST Lock Hydraulic Circuit.
(All pressures include hydrostatic head at the sea bed.)
Time (sec)
Hyd
rau
lic P
ressu
re (
psi)
0 2 4 6 8 10 12 14 16 18 20 22
2,000
2,500
3,000
3,500
4,000
4,500
5,000
5,500
6,000
6,500
Close Actuator Pressure (psi)
Open Actuator Pressure (psi)
Shearing pipeDecreasing pressure
due to leak
Squeezing pipe
A
Time (sec)
Hyd
rau
lic P
ressu
re (
psi)
2,000
2,500
3,000
3,500
4,000
4,500
5,000
5,500
6,000
6,500
100 2 4 6 8 12 14 16 18 20 22
Close Actuator Pressure (psi)
Open Actuator Pressure (psi)Shearing pipe
Squeezing pipe
B
160
Analysis 5D. The Blowout Preventer Did Not Seal the Well
Deepwater Horizon Accident Investigation Report
Leaking Check Valve
There were two check valves in the BOP stack accumulator hydraulic circuit:
a pilot-operated check valve on the accumulator dump circuit, which allowed discharge
of the accumulators to seawater, and a check valve in the accumulator supply line from
the control pods. Under normal conditions, if either of these check valves leaked, there
would have been little impact on the accumulator pressure because the accumulators
were expected to be continuously charged from the surface through the rigid conduit.
Due to the likely loss of the hydraulic conduit hose soon after the explosion, as
discussed in 3.2 of this analysis, there was a period of approximately 30 hours during
which the accumulators could not be charged. Any leak in these check valves during this
period would have resulted in the loss of available hydraulic pressure. The check valves
had the potential to be a single-point failure.
Based on analysis of stack accumulator charge volumes between pod retrieval and
re-installation after the accident, the investigation team concluded that there was a leak
in the stack accumulator circuit and that the leak could not have exceeded 0.32 gal/hour.
(Refer to 5.2 of this analysis.)
Hydraulic analysis of the BOP stack accumulator system indicates that it would have
taken a substantial leak of 3 gal/hour for 30 hours to cause a drop in the accumulator
pressure below the required shearing pressure. It is therefore unlikely that a leaking
check valve in the BOP stack accumulator hydraulic circuit could have been the cause
of BSR failure to shear and seal. Examination of the status of these check valves upon
retrieval of the BOP stack could provide further information.
Insufficient Accumulator Pre-charge
The status of nitrogen pre-charge in the BOP stack accumulators that powered the
AMF and autoshear is unknown. Pre-charge was measured at the surface prior to the
deployment of the BOP. After the BOP was deployed on the sea bed, the only way to
measure the pre-charge would have been by bleeding and recharging the accumulators
and measuring the volumes required to reach an accumulator pressure of 5,000 psi.
This is not a common practice.
Hydraulic analysis of the BOP control system indicates that a reduction from eight
to three accumulators due to loss of pre-charge would have dropped the available
hydraulic power provided by the BOP stack accumulators below the pressure required
to shear a 5 1/2 in., 21.9 ppf, S-135 pipe. Examination of the BOP stack upon its retrieval
should provide further information on the status of nitrogen pre-charge pressure in
the accumulators.
3.5.3 Condition of the BSR Sealing Element
The BSR sealing element performed satisfactorily during the 2,700 psi casing test
on the morning of the accident. (Refer to Analysis 5B. of this report.) However, the
potential degradation of the BSR elastomeric sealing element under the flow and
pressure conditions that were present while closing the rams remains unknown.

Deepwater Horizon Accident Investigation Report 161
Analysis 5D. The Blowout Preventer Did Not Seal the Well
An
aly
sis
5D
4 Status of the BOP Rams and Drill Pipe Configuration at the Time of the Accident
4.1 Status of the BOP Rams After the Explosion
During the ROV intervention that occurred after the sinking of the rig and after the
autoshear was activated, the IMT performed NDE on the pipe ram ST lock cylinders using
radiographic (i.e., X-ray) and gamma ray density techniques to determine the position of
the locks. The radiographic technique was only applied to one of the BSR ST lock cylinders.
The resulting report states that the BSR ST lock was in the locked position, indicating
that particular ram was closed. (Refer to Figure 12.) The less definitive gamma ray density
technique was used to examine the position of the locks on the other pipe rams, and the
results were less conclusive. The report stated that all BSR and VBR ST locks were in the
lock position, except for one of the upper VBR ST locks. The position of that particular ST
lock could not be determined by the gamma ray technique.
Radiographic image of east
BSR ST Lock
ROV peforming NDE of ST Lock
Diagram of ST Lock
Radiographic image of east BSR
ST Lock overlaid with tracing of
locking wedge
Figure 12. Radiograph Image of ST Lock in Closed Position Taken by ROV
After the Accident.

162
Analysis 5D. The Blowout Preventer Did Not Seal the Well
Deepwater Horizon Accident Investigation Report
Pressure measurements taken across the BOP rams in preparation for well kill operations
after the NDEs indicated the following:
� A pressure drop across the bottom of the upper VBR and the top of the casing
shear rams.
� A pressure drop across the middle VBR.
These measurements could be further indications that the middle and upper VBRs were
almost closed but were not sealing. The status of the BSR cannot be concluded definitively
from the pressure drop measurement, as the measurement was within the error range of
the two pressure transducers being used.
During the ROV hot stab intervention, which occurred after the autoshear was activated,
attempts were made to close the BSR and the middle VBR. The sudden initial increase in
hydraulic pressure observed during these operations could indicate that the BSR and the
middle VBR were already closed.
In preparation for well kill operations, the upper VBR was closed via the yellow pod and a
temporary hydraulic supply line. According to the Cameron Daily Report Sheet, only
1.5 gallons of hydraulic fluid were measured, indicating that the VBR was already closed
(28 gallons is normally required to close a VBR). Only the rig crew could have closed
the upper VBR, as there was no ROV intervention performed on this VBR prior to the
preparations for the well kill operations. It is likely, therefore, that this VBR was closed by
the rig crew. However, there is a possibility that the rams could have moved towards the
closed position because of the wellbore pressure dropping below hydrostatic pressure at
the sea bed, when the well was in a flowing condition after the accident.
Based on these findings, the investigation team concluded that the upper, and possibly the
middle, VBRs were likely closed by the rig crew.
Figure 13 shows the likely status of the BOP rams immediately after the initiation
of autoshear.

Deepwater Horizon Accident Investigation Report 163
Analysis 5D. The Blowout Preventer Did Not Seal the Well
An
aly
sis
5DFigure 13. Likely Status of BOP Rams Immediately After Autoshear Initiation.
4.2 Status of the Drill Pipe Across the BOP After the Explosion
When the riser kink section was cut and brought to the surface, it contained one section of
5 1/2 in. drill pipe at the upper end and two 5 1/2 in. sections at the lower end, indicating
the possible presence of more than one section of pipe in the BOP. Geometric analysis was
undertaken to determine the status of the drill pipe in the riser and across the BOP. The
analysis of the riser kink section’s content and the in situ examination of the BOP resulted
in additional information that suggests there was likely only one section of drill pipe across
the BOP when the autoshear was activated.
Figure 14 shows the riser kink section and its contents after it was retrieved. Figure 15 shows
the configuration of the drill pipe across the BOP at various times during the accident, based
on the examination of the retrieved riser kink section.

164
Analysis 5D. The Blowout Preventer Did Not Seal the Well
Deepwater Horizon Accident Investigation Report
The right-hand pipe section had a jagged, broken end with extensive wall thickness
reduction. This appeared to have been caused by localized erosion on the outer drill pipe
wall, which was not present on the adjacent inner wall of the riser.
The investigation team determined that this erosion may have occurred when the section
of pipe was in the BOP, where it experienced extremely high flow velocities during
the leaking of a ram or annular preventer, indicating that this section of drill pipe was
continuous through the BOP. The approximately 22 in. long erosion zone could suggest that
the erosion event took place in an annular preventer.
Assuming the erosion took place at the lower annular preventer, the right-hand pipe must
have moved by approximately 25 ft. This could have happened as the rig drifted off location
after power was lost. (Refer to time period [B] in Figure 15.) The metocean records indicate
that the current velocity at sea level at the time of the accident could have been above
0.69 ft./sec. The investigation team did not have access to the vessel’s hydrodynamic
characteristics in order to perform a drift-off analysis of the rig. However, it is likely that a
current of this magnitude would have caused the vessel to drift off after the power was lost
at approximately 21:49 hours.
Point at which riser was cut below kink
Severe erosion at top of Tool Joint “A”
Riser lower end cut showing two sections of pipe inside
Tool Joint “A” and pipe break inside riser
Upperend
47.3 ft.
ToolJoint "C"
ToolJoint "A"
Riserkink
Cut belowriser kink
Lowerend
Lefthandpipe
Righthandpipe
2 ft.
8 ft.
11 ft.
Pipebreak
31 ft.
Riser cut
Riser kink
Left-hand pipe Right-hand pipe
Figure 14. Retrieved Riser Kink Section and Its Contents.

Deepwater Horizon Accident Investigation Report 165
For the drill pipe to have moved upward by 25 ft., the next tool joint down the drill string
(Tool Joint “B” in Figure 15 with an outside diameter of 7 in.), would have had to pass
through the middle and upper VBRs. This could indicate that the ST locks were not operated
when the rig crew likely attempted to close the VBRs, and the rams allowed the pipe to
move upward through the BOP.
The drill pipe likely broke off at the eroded section while moving upward through the
BOP. There are eyewitness accounts stating that the top drive fell onto the rig floor (by
approximately 26 ft.), possibly due to the failure of the draw works during rig evacuation.
The drill pipe likely had already failed at the eroded section by this time, as it was being
pulled upwards due to increasing vessel offset. It is therefore inconclusive whether
downward movement of the top drive would have imposed any load on the closed VBR.
The investigation team has concluded that the left-hand pipe in the riser kink section is
likely the portion of the drill pipe (from above the eroded point), which broke off and fell
down the riser when the top drive fell onto the rig floor or as the rig sank and the riser
collapsed. The spacing of the drill pipe tool joints in the riser kink section (Refer to Tool
Joints “A” and “C” in Figure 14) relative to the end of the broken pipe suggests that the
lower end of the left-hand drill pipe was approximately at the upper annular preventer
elevation and did not extend further into the BOP. (Refer to time period [C] in Figure 14.)
Figure 15. A Schematic of Drill Pipe Configuration Across the BOP Over Time.
An
aly
sis
5D
Analysis 5D. The Blowout Preventer Did Not Seal The Well

166
Analysis 5D. The Blowout Preventer Did Not Seal the Well
Deepwater Horizon Accident Investigation Report
A plausible reason for the broken pipe not penetrating further into the BOP could be due
to the angle at the riser flex joint caused by vessel offset.
The in situ examination of the BOP stack revealed the presence of three pieces of pipe in
the bore above the upper annular preventer (refer to time period [D] in Figure 15):
� Pipe piece 1 was a loose piece of pipe approximately 11 ft. in length located above the
top of the annular preventer, which was closed prior to the cutting of the riser kink.
The top of this pipe had a teardrop shape similar to the end of the left-hand pipe
shown in Figure 14 and was likely the continuation of the broken left-hand pipe.
� Pipe piece 2 had its upper end approximately 9 ft. above the upper annular packer
and extended down through the upper annular preventer. This appears to be the
right-hand pipe in Figure 14, which was likely present across the BSR at the time of the
activation of the autoshear. This piece of pipe had a circular cross-section at the top end,
which appeared to have been cut when the diamond wire saw was initially used in an
unsuccessful attempt to remove the riser kink.
� Pipe piece 3 was approximately 9 in. long and was resting on the top of the upper
annular preventer. It had a circular cross-section at one end and a squashed cross-
section at the other end, similar to the end of the right-hand pipe in Figure 14. This piece
of pipe was likely severed from pipe piece 2 when the hydraulic shears were used in the
second (successful) attempt to cut off the riser kink.
The relative positions of the upper ends of pipe pieces 1 and 2, together with the length
of pipe piece 3, would suggest that pipe piece 2 had moved downward by approximately
1 ft. when the riser kink was cut, coming to rest when Tool Joint “B” reached the upper VBR
(believed to be closed—refer to Figure 15). The downward movement of the right-hand pipe
in turn suggests that the pipe could have moved through the BSR, possibly due to erosion
damage to the pipe and/or the BSR shearing blade, after the activation of the autoshear.
Based on the above analysis, the investigation team determined that there was likely one
pipe across the BSR at the time of the activation of the autoshear.
5 Condition of Deepwater Horizon BOP System Prior to the Accident
To establish the overall condition of Deepwater Horizon BOP system prior to the accident, the
investigation team’s lines of inquiry focused on the following topics:
� BOP maintenance since 2004.
� BOP control system leaks reported during the Macondo well drilling operations and those
discovered during ROV intervention after the accident.
� BOP testing history since Deepwater Horizon mobilization to the Macondo well location at
the end of January 2010.
� BOP modifications made from the time of Deepwater Horizon commissioning in 2001.
Additional data gained from the examination of retrieved BOP control pods has also
been included.

Deepwater Horizon Accident Investigation Report 167
Analysis 5D. The Blowout Preventer Did Not Seal the Well
An
aly
sis
5D
5.1 Maintenance
In September 2009, a BP rig audit team conducted an audit of Deepwater Horizon. This audit
included the maintenance management system for the BOP. One finding was, “Overdue
maintenance in excess of 30 days was considered excessive, totaling 390 jobs and
3,545 man hours. Many of the overdue routines were high priority.” This audit, which the
team performed at the end of the rig out-of-service period for 10-year maintenance and
inspection, identified 31 findings that were related to the well control system maintenance.
Of these, six findings related to BOP maintenance; all findings were outstanding as of
December 2009. (Refer to Appendix Y. September 2009—Deepwater Horizon Follow-up
Rig Audit.)
The following maintenance-related audit findings were associated with the BOP:
� The subsea maintenance personnel recorded well control-related equipment maintenance
manually on separate spreadsheets and in the daily logbook, instead of in the Transocean
maintenance management system (RMS-II). This practice made it difficult to track
BOP maintenance.
� The lower (test), middle and upper BOP ram bonnets had not been recertified since
2000. The original equipment manufacturer (OEM) and API-recommended recertification
period is 5 years.
� The maintenance records did not substantiate that Transocean was in conformance with
its 5-year replacement policy for the replacement of high-pressure hoses.
The investigation team reviewed Deepwater Horizon BOP maintenance records (provided by
Transocean), which indicated instances of an ineffective maintenance management system.
The following maintenance-related issues were identified as having the potential to
adversely impact the performance of the BOP system:
� BOP maintenance records were not accurately reported in the maintenance
management system. Examples of these inaccuracies include:
� Records of work being performed on the BOP when the BOP was installed subsea
and not accessible.
� Not recording complete tracking of specific individual components.
� Transocean battery maintenance records from 2001 to 2010 indicate that during this
9-year period, the batteries were changed with less than the recommended frequency
of once per year. In November 2007, the subsea daily activity report recorded that “all
batteries are dead” in the blue pod when the BOP was retrieved to the surface.
Examination of the retrieved yellow and blue control pods after the accident identified the
following conditions in some key components:
� Solenoid valve 103 in the yellow pod, which was required to operate the high-pressure
BSR close function, was found to be defective. (Refer to Figure 16.) This solenoid valve
also had a non-OEM electrical connector installed.
� Solenoid valve 3A in the yellow pod, which was required to increase the upper annular
preventer regulator pressure, was also found to be defective.

168
Analysis 5D. The Blowout Preventer Did Not Seal the Well
Deepwater Horizon Accident Investigation Report
� The 27-volt AMF battery bank in the yellow pod (made up of three packs of 9-volt
batteries), which was required to operate the AMF, had a charge of 18.41 volts. (Refer to
Figure 17.) The battery bank discharge curve indicates that the battery bank voltage was
already in rapid decline. (Refer to Figure 9.) While this charge was low, it was sufficient to
complete the AMF sequence multiple times during tests conducted at the surface. During
the August 23-27, 2010, MBI hearings, a subsea superintendent stated that the battery
bank voltages were measured incorrectly (i.e., the 18.41-volt measurement) and that, prior
to re-installing the yellow pod after it was retrieved, the voltages were rechecked and a
battery bank voltage of 27 volts was measured.
� The investigation team considers that even if the yellow pod batteries had sufficient
charge, the status of the solenoid valve 103 would have prohibited the closure of the
BSR from the yellow pod.
A B
Figure 16. (A) Photograph of Solenoid Valve 103 in the Yellow Pod. (B) Testing of Solenoid Coils.
Figure 17. Photograph of a 9-volt AMF Battery Pack.
(Not from Deepwater Horizon BOP pod.)

Deepwater Horizon Accident Investigation Report 169
Analysis 5D. The Blowout Preventer Did Not Seal the Well
An
aly
sis
5D
� The 27-volt AMF battery bank in the blue pod, which was required to operate the AMF,
was reported to have a charge of 7.61 volts, which was too low to complete the AMF
sequence. The investigation team could not determine from the available maintenance
records exactly when the batteries were last replaced.
� The charge on the 9-volt AMF battery pack for SEM B in the blue pod, which was
required to power the SEM B AMF system, was reportedly measured to be at
0.142 volts (i.e., almost fully discharged).
Although these deficiencies were discovered after the accident, they were very likely
present at the time of the accident because the BOP control pods located on the lower
marine riser package (LMRP) were not affected by the explosions and fire at the surface or
by the flow in the wellbore.
The investigation team was unable to perform a complete review of the maintenance history
of the BOP prior to its deployment on the Macondo well. Although requested, Transocean
did not supply all daily maintenance records for the maintenance period between the BOP’s
retrieval from the previous well and deployment on the Macondo well.
5.2 Leaks
The investigation team is aware of six leaks in the BOP hydraulic control system. The first
one was reported on the OpenWells® Drilling Morning Report for February 23, 2010.
Three more leaks were discovered during ROV intervention attempts after the accident.
The fifth leak was discovered in the BOP stack accumulator system after the yellow control
pod was re-installed during preparation for well kill operations. A sixth leak was mentioned
by a senior subsea supervisor during the August 23–27, 2010, MBI hearings.
The February 23, 2010, OpenWells® Drilling Morning Report includes the notation that “Pilot
leak on BOPs on yellow pod at 1 gpm. Switched to blue pod and leak slowed—put valve
function in block—checked out OK—will put BOP stack functions in block when drill pipe is
above stack to confirm leak is on stack.”
A review of available information showed that this leak was not reported on any Transocean
International Association of Drilling Contractors (IADC) Daily Report, nor was it reported on
the ROV Daily Dive Report. A number of MBI witnesses confirmed the presence of this
leak and specified the location to be on the test VBR open circuit shuttle valve. This leak
would not have been expected to impact BOP well control performance.
The second and third leaks, which were discovered during ROV intervention, were
identified for further investigation to determine if they could have adversely affected the
performance of the BOP system:
� A leak at a hose fitting at the close side of the upper annular surge bottle supplying
pressure to the annular preventer operating piston.

170
Analysis 5D. The Blowout Preventer Did Not Seal the Well
Deepwater Horizon Accident Investigation Report
� A leak at a hose fitting at a shuttle valve in the BOP ram ST lock close hydraulic circuit,
which was in the same hydraulic circuit as the high-pressure BSR close function.
ROV hot stab intervention using ROV pumps could not build any measurable pressure
on the ROV gauge against this leak. The ROV pump rate was estimated at 4 gpm to
8 gpm. Figure 18 shows an ROV photo of the leak.
Hydraulic analysis of the BOP control system indicated that a leak in an annular preventer
control circuit would unlikely have affected its response time and sealing capability, due to
the large hydraulic supply that was continuously provided by the rigid conduit line.
Furthermore, it is unlikely that a leak in the ST lock circuit would have reduced the available
hydraulic power provided by the BOP stack accumulators below that required for the BSR
to shear 5 1/2 in., 21.9 ppf, S-135 drill pipe and seal the wellbore when operated in AMF
and autoshear emergency modes. (Refer to Appendix Z. Hydraulic analyses of BOP
control system.)
The fourth leak, also observed during ROV intervention, was on the ST lock circuit
downstream of one of the BSR bonnet sequence valves. If the leak observed was in the
ST lock sequence valve, it could have pressurized the closed side of the ST lock cylinder
prematurely, thereby exerting a lateral force on the ram tail rod. This could have impeded
the performance of the BSR. Examination of the BOP stack (when retrieved) should reveal
further information on the condition of the BSR ST lock sequence valves.
The fifth leak in the BOP hydraulic control system was discovered after the yellow control
pod was recovered for modification and then re-installed 7 days later in preparation for well
kill operations. It was found that 54 gallons of hydraulic fluid were required to recharge the
BOP stack accumulators to the maximum pressure of 5,000 psi.
Shuttle valve hose fitting leaked green-dyed fluid Close up of hose fitting that leaked
Figure 18. ROV Video Stills of Leaking Hose Fitting
on a Shuttle Valve in the ST Lock Hydraulic Circuit.
(Green-dyed water around this location indicates the severity of the leak.)

Deepwater Horizon Accident Investigation Report 171
Analysis 5D. The Blowout Preventer Did Not Seal the Well
An
aly
sis
5D
Assuming that the accumulators had been at maximum pressure prior to unlatching and
recovering the control pod, a 54-gallon fluid loss would suggest that there were leaks in
the BOP stack accumulator hydraulic system. A worst-case scenario would have been a
single leak (equating to 0.3 gal/hour) in the pilot-operated check valve in the accumulator
isolation circuit. If such a leak was present during the 30-hour period between the loss of
the hydraulic conduit line and the ROV activation of the autoshear, it would have reduced
the available hydraulic pressure in the BOP stack accumulators.
Hydraulic analysis of the BOP stack accumulator system indicated that a leak of this
magnitude would not have reduced the available hydraulic pressure to shear the drill pipe
and seal the wellbore.
The sixth leak mentioned in the MBI hearings was apparently in the lower annular preventer
open circuit. This leak was detected by the flow meter on the BOP control panel. It appears
to have been investigated by an ROV, but the source was not found. The investigation team
has not determined whether this leak had any impact on BOP performance.
5.3 Testing
A review of the OpenWells® Drilling Morning Report, Transocean Daily IADC Reports and
the Subsea Daily Activity Summary Report provided by Transocean indicated that the
function and pressure testing performed while the BOP was installed on the Macondo well
appeared to conform with:
� Regulations (Refer to 30 CFR 250.).
� Industry standards (Refer to API RP 53.).
� BP standards (Refer to Engineering Technical Practices [ETPs] GP 10-10 Well Control and
GP 10-45 Working with Pressure.).
� Transocean operating policy (Refer to Transocean Well Control Handbook
HQS-OPS-HB-01.).
These standards include surface tests prior to deployment, tests upon initial deployment
and subsequent weekly (function) and bi-weekly (pressure) tests. None of these testing
requirements include testing the high-pressure BSR close function.
The Transocean operating policy that was available to the investigation team required that
all BOP emergency back-up systems (defined as EDS, AMF, autoshear, ROV intervention
and any other control systems such as acoustic, if available) be tested on the surface prior
to subsea deployment of the BOP. The daily reports reviewed did not indicate that the
AMF and the ROV intervention functions were tested on the surface prior to the BOP’s
deployment on the Macondo well. If so, this was not consistent with Transocean
operating policy.
Two recent between-wells BOP surface maintenance and testing plans supplied
by Transocean did not include testing the AMF and ROV intervention systems.
Additionally, the investigation team reviewed 8 years of Deepwater Horizon Subsea
and Electronic Technician Daily Activity Summary Reports. None of these reports indicated
that there had been any function testing for the AMF or ROV intervention systems.

172
Analysis 5D. The Blowout Preventer Did Not Seal the Well
Deepwater Horizon Accident Investigation Report
The weekly function tests should have detected the leaks in the BOP hydraulic control
system that were discovered during ROV intervention. A rig condition assessment
performed by ModuSpec on behalf of Transocean on April 1–14, 2010, recorded a small
leak during annular preventer function testing. The report also stated that the subsea
engineer believed that the hose/fitting on the annular preventer surge bottle was leaking.
This suggests that at least one leak was detected, and that the subsea engineer was
aware of it.
The investigation team could not determine why there was no mention of leaks in any of
the Transocean IADC or ROV Dive Daily Reports.
5.4 Modifications
Based on available records from Transocean as well as information that was generated
after the accident, 19 known modifications have been identified in the BOP and its
control system. (Refer to Appendix AA. Deepwater Horizon BOP Modifications Since
Commissioning for an itemized list of these modifications.)
The investigation team identified the following modifications as having the potential to
adversely affect the performance of the BOP system:
� A modification to remove the retrievable feature of the control pods. This modification
would require retrieval of the riser and the LMRP to repair or maintain control pods
(e.g., ability to change batteries or repair solenoid valves), resulting in additional
rig downtime.
� Modifications to the configuration of the LMRP accumulators in 2004, which introduced
a pilot-operated valve isolating these accumulators upon the loss of hydraulic power
and increasing the control system’s dependency on the control pod pilot accumulators.
The investigation team has concluded that this modification had no causal link to
the accident.
� Undocumented modifications were discovered during ROV intervention. The pipe ram
hot stab receptacle was connected to the test (lower) VBR and not to the middle VBR,
as was assumed. The IMT was aware that the lower VBR was converted to a test ram.
The pipe ram labeled on the ROV panel was assumed to refer to the middle VBR and not
to the test (lower) VBR. These modifications were not documented on the BOP stack
flow schematics, and they impacted the effectiveness of ROV intervention.
BP had requested two modifications:
� A change-out of the lower annular preventer from a 10,000 psi-rated (closed on 5 1/2 in.
drill pipe) to a 5,000 psi-rated stripping element.
� Modification of the lower VBR to a test VBR. The modification resulted in the VBR only
holding pressure acting from above. This reduced the number of available VBRs to seal
the wellbore from three to two.
Although these two modifications changed the functionality of the BOP, the investigation
team has concluded that the modifications likely did not contribute to the failure of the BOP
to isolate the wellbore prior to and after the accident.

Deepwater Horizon Accident Investigation Report 173
Analysis 5D. The Blowout Preventer Did Not Seal the Well
An
aly
sis
5D
5.5 Monitoring and Diagnostic Capability
Diagnostics of the BOP control system were available to the rig crew and subsea personnel
through an alarm indication system and an event logger. (Refer to Figure 19.) The alarm
system was integrated into the driller’s control panel and into the TCP. The event logger
was located in the subsea workshop, and it may never be recovered.
The control panels displayed alarms in two ways: through the alarm display and through
an array of dedicated alarm lights. The alarm display provided alarm tables that were
programmed into the programmable logic controller (PLC), based on the importance of the
component being monitored. It displayed alarm notifications for low accumulator pressure,
PLC system failure, pod SEM mismatch, coil fault in the active pod, hydraulic pressure unit
not available, low pilot pressure and a number of other parameters. The dedicated alarm
lights displayed the most critical fault alarms selected and pre-programmed from the PLC
alarm tables.
The event logger captured information related to hydraulic system pressures and electrical
components in the control pods. It also allowed the user to interrogate each individual SEM
in the control pods. By selecting each SEM, the status and values of all the subsea solenoid
coils, pressure and temperature transducers, inclinometers and SEM water monitors
(humidity inside the SEM) could be viewed. The event logger also recorded all the BOP
functions that were operated from the control panels.
There were three flow meters in the hydraulic control system (one at the surface and
one in each pod) indicating hydraulic fluid flow when a BOP function was operated.
Three digital displays on the control panels provided readings from the flow meters.
A leak in the hydraulic system could have been detected during BOP function testing
by selectively operating each function in turn.
The control system was capable of identifying the coil defects in solenoid valves 103 and
3A in the yellow pod and logging them in the event logger. A failure mode effects and
criticality analysis (FMECA) performed as part of a BOP assurance analysis of Deepwater
Horizon BOP stack identified this failure mode. As stated in the FMECA report, when this
failure is detected, the mitigation is “Switch to alternate pod, secure well and pull LMRP.”
The charge level of the batteries for the AMF sequence could not have been monitored on
the surface while the BOP was deployed subsea. If the battery voltage was not checked on
the surface prior to the BOP deployment, there would have been no means of determining
the charge on the batteries once the BOP was deployed.

174
Analysis 5D. The Blowout Preventer Did Not Seal the Well
Deepwater Horizon Accident Investigation Report
Deepwater Horizon
BOP Control Panel (Left-hand side)
Deepwater Horizon
BOP Control Panel (Right-hand side)
BOP Control Event Logger
3
1
4
5
6
7
1. Autoshear Arm/Disarm.
2. AMF Enable/Disable.
3. High-pressure shear button.
4. Three flow meters.
5. EDS button.
6. Lower and upper annular
preventer open/close
indication lights.
7. High-pressure casing shear.
8. Lower (test), middle and
upper rams.
9. BOP regulator control buttons.
10. Dedicated alarm lights.
11. Alarm display.
8
9
10
112
Figure 19. Photographs of Deepwater Horizon BOP TCP and Event Logger.

Deepwater Horizon Accident Investigation Report 175
Analysis 5D. The Blowout Preventer Did Not Seal the Well
An
aly
sis
5D
5.6 Overall Summary of BOP Condition Prior to the Accident
The lines of inquiry in this analysis indicate that there were conditions in the BOP system
that could have impaired its performance prior to and after the accident. The investigation
team concluded that most of these conditions (e.g., hydraulic system leaks, solenoid valve
coil faults) should have been detected by the BOP diagnostic capability that was available to
the rig crew and subsea personnel by the routine BOP testing and maintenance program.
6 Modes of BOP Operation
In the normal mode of BOP system operation, the annulus between the drill pipe and the
BOP is sealed by closing an annular preventer, a VBR or both. The rig crew initiates this
function from a control panel on the rig using separate function buttons for each of the annular
preventers or VBRs. The well pressure is then contained by the pressure capacity of the
annular preventer and/or VBR and the pressure capacity of the surface system at the top of
the drill pipe.
The emergency mode of BOP operation involves the operation of the BSR function to shear
the drill pipe and seal the wellbore.
There were six possible methods of closing the BSR in emergency mode that pertain to this
accident (refer to Figure 20):
� High-pressure BSR function (crew-initiated): initiated by rig personnel from a control
panel on the rig that closes the BSR with high-pressure (4,000 psi design) hydraulic fluid.
This function required at least one operational control pod and an associated MUX cable.
All three sets of accumulators provided hydraulic power for this function. There is no
evidence to suggest that the rig crew initiated this emergency function.
� EDS function (crew-initiated): initiated by rig personnel from a control panel on the rig.
EDS was primarily designed to mitigate the risk of losing containment as a result of the
dynamic positioning system not being able to keep the rig on station. This function also
requires at least one operational control pod and associated MUX cable. The sequence
activates the high-pressure BSR. All three sets of accumulators provided hydraulic power
for this activation of the high-pressure BSR. Witness accounts indicated that the subsea
supervisor initiated this function from the TCP, but it would have been unsuccessful because
the MUX cables had already been rendered inoperable due to the explosions and fire.
� AMF: an automatic means of closing the high-pressure BSR when electrical power,
electronic communication and hydraulic pressure are all lost. AMF is designed to mitigate
the risk caused as a result of catastrophic failure of the riser with the resultant reduction
of hydrostatic head of mud in the riser to seawater hydrostatic head. This function had
to be manually armed by rig personnel from the BOP control panel and required at least
one operational control pod. The accumulators on the BOP stack were the only source of
hydraulic power for this function. The investigation team concluded that the AMF very likely
did not function due to the condition of critical components in the control pods.

176
Analysis 5D. The Blowout Preventer Did Not Seal the Well
Deepwater Horizon Accident Investigation Report
� ROV-initiated AMF: a simulation of AMF conditions to close the high-pressure BSR by
using an ROV to cut power/communication and hydraulic lines at the LMRP. This was
attempted hours before the rig sank, but the investigation team concluded that the AMF
very likely did not function due to the condition of critical components in the control pods.
� ROV-initiated autoshear: a simulation of the autoshear condition to close the
high-pressure BSR by using an ROV to cut through the autoshear activation rod.
Autoshear is designed to mitigate the risk of loss of containment as a result of an
inadvertent disconnect of the LMRP from the BOP stack. The accumulators on the BOP
stack were the only source of hydraulic power for this function. This ROV-initiated autoshear
was attempted hours before the rig sank, and the investigation team concluded that the
autoshear appeared to close the high-pressure BSR, but failed to seal the wellbore.
� ROV-initiated BSR: closure of the BSR by ROV hot stab using an ROV seawater pump
or utilizing a separate hydraulic power supply provided by a bank of accumulators on the
sea bed. This function required sufficient hydraulic power available from the ROV pump
or bank of accumulators. Various attempts were made to close the BSR by ROV hot stab
intervention prior to and after the rig sank, but all failed to seal the wellbore.
The rig crew attempted the normal mode of BOP system operation (using an annular preventer
and possibly a VBR) prior to the accident. The emergency mode of well control shown in
Figure 20 relates to the period after the accident, but only the ROV hot stab intervention
continued after the rig sank.
The effectiveness of the emergency system methods of operation available to rig personnel to
isolate the wellbore was lost due to damage resulting from the explosions.
Emergency Mode of Well ControlNormal Modeof Well Control
Hazard
Control the
well using
Annular/VBR
Close High-pressure BSR
Initiate
EDSAMF
ROV
AMFROV
(Auto shear)
ROV(Hot stab)
ExplosionSpill
Rig Sinks
WellControlEvent
Figure 20. BOP Well Control Modes of Operation.

Deepwater Horizon Accident Investigation Report 177
Analysis 5D. The Blowout Preventer Did Not Seal the Well
An
aly
sis
5D
The normal and emergency modes of BOP system operation do not provide fully-independent
means of closing the BOP. For example:
� The six emergency methods provide different means of closing a single BSR, which must
seal to isolate the wellbore.
� With the exception of the autoshear and ROV hot stab, all normal and emergency methods
rely on an operational control pod.
� The normal mode of BOP operation and the emergency methods available to rig personnel
(close VBR/annular preventers in normal mode, close high-pressure BSR and EDS in
emergency mode) require the same communication, electrical and hydraulic components.
This interdependency of BOP operating modes means that single failures could have affected
multiple modes of BOP operation.
7 Key Lines of Inquiry Going Forward
The investigation team conducted this investigation with limited access to physical evidence
and personnel with pertinent data on the condition of the BOP and its performance.
The investigation has relied on the limited data that was available to the team, such as
extensive modeling of wellbore and BOP behavior and physical examination of recovered
control pods and riser kink section.
The investigation team concluded that the BOP response to seal the annulus prior to the
accident was slow, that the AMF could not function due to the condition of critical components
in the control pods and that the BSR failed to seal the wellbore after likely being initiated by the
autoshear. (Refer to Section 7. Work that the Investigation Team Was Unable to Conduct of
this report.)
8 Conclusions
8.1 Prior to the Accident
Findings relating to BOP performance prior to the accident:
� The annulus was sealed, likely by the closure of a VBR, less than 2 minutes before the
explosions, after hydrocarbons had already entered the riser.
� The overall response of the BOP system to seal the annulus was slow from the time it
was first activated at 21:41 hours, possibly due to the high flow conditions across the
BOP and/or insufficient annular preventer regulated pressure.

178
Analysis 5D. The Blowout Preventer Did Not Seal the Well
Deepwater Horizon Accident Investigation Report
8.2 After the Accident
Findings relating to post-accident BOP performance include:
� The explosions and fire very likely damaged the MUX cables, disabling the two
emergency methods of BOP operation available to rig personnel: the high-pressure BSR
operation and EDS capability. The MUX cables/reels were located in the moon pool and
had little or no resistance to explosion and fire.
� The AMF initiation conditions (failure of MUX cables and hydraulic lines) would have
been met soon after the first explosion. However, it is unlikely that the AMF sequence
could have been completed by either control pod, due to the failed solenoid valve 103 in
the yellow pod and an insufficient charge on the 27-volt AMF battery bank in the blue pod.
� The ROV actuation of the autoshear function appeared to close the BSR but failed to
seal the wellbore.
8.3 Overall BOP Condition
Findings relating to the condition of the BOP prior to the accident:
� Maintenance: The BOP maintenance records were not accurately reported in the
maintenance management system, which was also identified by the BP audit performed
in September 2009. The conditions of critical components in the yellow and blue
pods and the use of a non-OEM part, which was discovered after the pods were
recovered and examined after the accident, highlight the lack of a robust maintenance
management system for the BOP.
� Leaks: Six leaks were identified in the BOP hydraulic system. The investigation team has
not been able to determine whether these leaks affected the ability of the BSR to shear
pipe and seal the wellbore.
� Testing: The reported pressure and function testing of the BOP while it was on the
wellhead appeared to have been in conformance with regulatory, industry, BP and
Transocean standards. However, there were no indications that the AMF and ROV
intervention systems were tested at the surface, as was required by Transocean policy,
prior to subsea deployment on the Macondo well. Also, the existing standards did not
require regular function testing of the high-pressure BSR.
� Modifications: Since it was manufactured in 1999, a number of modifications
were made to the BOP hydraulic system that had unintended consequences on
its performance. With the exception of the two modifications requested by BP, BP
was not informed of these modifications prior to their being made. The Transocean
management of change process did not identify any failure modes or effects related to
the modifications or post-modification verification testing requirements.
� Diagnostics: Deepwater Horizon BOP diagnostic practices did not cover all critical
components of the control system (e.g., AMF batteries). Furthermore, the available
diagnostics system appeared not to have been utilized effectively to detect control
system defects (e.g., faulty solenoid coil, leaks).

Deepwater Horizon Accident Investigation Report 179
Analysis 5D. The Blowout Preventer Did Not Seal the Well
An
aly
sis
5D
9 Recommendations
The investigation team has developed recommendations in response to the findings and
conclusions presented in Section 5. Deepwater Horizon Accident Analyses. (Refer to Section
6. Investigation Recommendations of this report.) These recommendations comprise two
categories: (1) those related to BP’s Drilling and Well Operations Practice (DWOP) and its
Operations Management System (OMS) implementation and (2) those related to BP’s
Contractor and Service Provider Oversight and Assurance.

180 Deepwater Horizon Accident Investigation Report

Deepwater Horizon Accident Investigation Report
Section 6. Investigation Recommendations
181
Secti
on
6
As this was a BP internal investigation, the recommendations in this section relate to BP, its
contractors and its service providers. Some recommendations concern matters that the team
viewed as inconclusive with respect to causing or contributing to the accident. It should not be
inferred that by making such recommendations, the team viewed those matters as causal or
contributing factors in this accident.
The investigation team developed a series of recommendations based on eight key findings.
These recommendations cover two broad areas:
� Drilling and Well Operations Practice (DWOP) and Operating Management System
(OMS) implementation.
� Contractor and service provider oversight and assurance.
The purpose of these recommendations is to enable prevention of similar accidents occurring in
the future by strengthening the defensive physical or operational barriers needed to eliminate or
mitigate hazards. (Refer to Figure 1.) The recommendations are intended to provide a basis for the
consideration of actions that can be implemented by both BP and by the contractor community
that provides critical services and products to BP’s exploration and production operations.
Section 6. Investigation Recommendations
BO
P E
me
rge
ncy
Op
era
tio
n
Pre
ssu
re
Inte
gri
ty T
esti
ng
We
ll M
on
ito
rin
g
We
ll C
on
tro
l R
esp
on
se
Hy
dro
ca
rbo
n S
urf
ace
Co
nta
inm
en
t
Fir
e a
nd
Ga
s S
yste
m
An
nu
lus C
em
en
t
Me
ch
an
ica
l B
arr
iers
Well Integrity
Was Not
Established or
Failed
Critical Factor Critical Factor Critical FactorCritical Factor
Hydrocarbons Entered the
Well Undetected and Well
Control Was Lost
Hydrocarbons
Ignited on
Deepwater
Horizon
Blowout Preventer
Did Not Seal the Well
FIRE
AND
SPILL
EXPLOSION
AND FIRE
Figure 1. Barriers Breached and the Relationships of Barriers to the Critical Factors.
Adapted from James Reason (Hampshire: Ashgate Publishing Limited, 1997).

182 Deepwater Horizon Accident Investigation Report
Section 6. Investigation Recommendations
Others in the industry may benefit from consideration of these recommendations as well.
Full implementation of the recommendations would involve a long-term commitment and a
prioritized action plan with due dates and accountabilities for each element of the plan, with
each of the actions tracked to completion. Some of the recommendations are dependent on the
cooperation of entities outside BP.
DWOP and OMS Implementation
1 Procedures and Engineering Technical Practices
1.1 Update and clarify current practices to ensure that a clear and comprehensive set
of cementing guidelines and associated Engineering Technical Practices (ETPs) are
available as controlled standards. The practices should include, as a minimum:
� Clearly defined mandatory practices.
� Recommended practices and operational guidance.
� Definitions of critical cement jobs.
� Description of the technical authority’s (TA’s) role in oversight and decision making.
1.2 Review and update ETP GP 10-10 Well Control, clarifying requirements for subsea
blowout preventer (BOP) configuration:
� Establish minimum requirements for ram types, numbers and capability.
� Establish minimum requirements for emergency well control activation systems.
� Conduct a gap assessment of the BP-operated and BP-contracted rig fleet and put
corrective actions in place to assure conformance.
1.3 Update the relevant technical practices to incorporate the following design
requirements:
� BPA-D-003 Tubular Design Manual: Consider load conditions for negative-pressure
tests in the casing design assessment for subsea wells.
� DWOP : Standardize the installation of the locking mechanism of the casing hanger
seal assembly to the high-pressure housing for subsea wellheads.
1.4 Review and update ETP GP 10-45 Working with Pressure to include negative-pressure
testing; this practice should provide as a minimum:
� The purpose of the test.
� A definition of the barriers to be tested.
� Identification and evaluation of the consequences of failure.
� A contingency plan of action in the event that failures occur.
� A requirement for detailed procedures which should include as an example:
� The configuration of test lines and correct valve positions.
� All operational steps and decision points.
� A description of the roles and accountabilities for the personnel involved.
� Clearly defined success/failure criteria for the test.
� Authorization instructions if results are outside the defined success criteria.
� Assurance that contractor procedures are consistent with ETP GP 10-45.

Deepwater Horizon Accident Investigation Report
Section 6. Investigation Recommendations
183
Secti
on
6
1.5 Clarify and strengthen standards for well control and well integrity incident reporting
and investigation. Ensure that all incidents are rigorously investigated and that close out
of corrective actions are completed effectively.
1.6 Propose to the American Petroleum Institute the development of a recommended
practice for design and testing of foam cement slurries in high-pressure,
high-temperature applications.
1.7 Review and assess the consistency, rigor and effectiveness of the current risk
management and management of change (MOC) processes practiced by Drilling and
Completions (D&C) by:
� Implementing an action plan to address areas that should be strengthened to
conform with OMS expectations.
� Defining minimum requirements of D&C functional teams to deliver consistent and
effective application of MOC and risk mitigation from planning through execution.
� Assessing high-consequence drilling activities as a priority, starting with the Gulf of
Mexico Exploration and Appraisal drilling team.
2 Capability and Competency
2.1 Reassess and strengthen the current TA’s role in the areas of cementing and zonal
isolation. Ensure adequate TA coverage to support all the D&C global operations. As a
minimum, a TA should:
� Review and approve all critical zonal isolation engineering plans and procedures.
� Provide assurance of contractors for all services related to zonal isolation
engineering and technical services, including engineering competency, service
quality and adherence to relevant standards.
2.2 Enhance D&C competency programs to deepen the capabilities of personnel in key
operational and leadership positions and augment existing knowledge and proficiency
in managing deepwater drilling and wells operations by:
� Defining the key roles to be included in the enhanced competency programs.
� Defining critical leadership and technical competencies.
� Creating a ‘Deepwater Drilling Leadership Development Program.’ The program
would build proficiency and deepen capabilities through advanced training and the
practical application of skills.
� Developing a certification process to assure and maintain proficiency.
Conduct periodic assessments of competency that include testing of knowledge
and demonstrations of the practical application of skills.

184 Deepwater Horizon Accident Investigation Report
Section 6. Investigation Recommendations
2.3 Develop an advanced deepwater well control training program that supplements
current industry and regulatory training. Training outcomes would be the development
of greater response capability and a deeper understanding of the unique well control
conditions that exist in deepwater drilling. This program should:
� Embed lessons learned from Deepwater Horizon accident.
� Require mandatory attendance and successful completion of the program for all
BP and drilling contractor staff who are directly involved in deepwater operations,
specifically supervisory and engineering staff, both onshore and offshore.
� Where appropriate, seek opportunities to engage the broader drilling industry to
widen and share learning.
2.4 Establish BP’s in-house expertise in the areas of subsea BOPs and BOP control
systems through the creation of a central expert team, including a defined segment
engineering technical authority (SETA) role to provide independent assurance of the
integrity of drilling contractors’ BOPs and BOP control systems. A formalized set of
authorities and accountabilities for the SETA role should be defined.
2.5 Request that the International Association of Drilling Contractors review and consider
the need to develop a program for formal subsea engineering certification of personnel
who are responsible for the maintenance and modification of deepwater BOPs and
control systems.
3 Audit and Verification
3.1 Strengthen BP’s rig audit process to improve the closure and verification of audit
findings and actions across BP-owned and BP-contracted drilling rigs.
4 Process Safety Performance Management
4.1 Establish D&C leading and lagging indicators for well integrity, well control and rig
safety critical equipment, to include but not be limited to:
� Dispensations from DWOP.
� Loss of containment (e.g., activation of BOP in response to a well control incident).
� Overdue scheduled critical maintenance on BOP systems.
4.2 Require drilling contractors to implement an auditable integrity monitoring system to
continuously assess and improve the integrity performance of well control equipment
against a set of established leading and lagging indicators.

Deepwater Horizon Accident Investigation Report
Section 6. Investigation Recommendations
185
Secti
on
6
Contractor and Service Provider Oversight and Assurance
5 Cementing Services Assurance
5.1 Conduct an immediate review of the quality of the services provided by all cementing
service providers. Confirm that adequate oversight and controls are in place within the
service provider’s organization and BP regarding:
� Compliance with applicable service provider, BP and industry standards.
� Competency of engineering and supervisory personnel.
� Effective identification, communication and mitigation of risk associated with
providers’ services.
6 Well Control Practices
6.1 Assess and confirm that essential well control and well monitoring practices, such as
well monitoring and shut-in procedures, are clearly defined and rigorously applied on all
BP-owned and BP-contracted offshore rigs (consider extending to selected onshore rigs
such as those for high-pressure, high-temperature, extended reach drilling [ERD] and
sour service applications). These practices should be:
� Defined and codified as BP minimum standards for demonstrated practice
and proficiency.
� Formally bridged into contractor rig site well control policies and procedures, with a
self-verification and reporting process.
� Reinforced by regular audit by BP well site leaders.
7 Rig Process Safety
7.1 Require hazard and operability (HAZOP) reviews of the surface gas and drilling fluid
systems for all BP-owned and BP-contracted drilling rigs. Include a HAZOP review as
an explicit check for rig acceptance and rig audit. Phase 1 should address offshore rigs.
Phase 2 should address selected onshore rigs such as those for high-pressure,
high-temperature, ERD and sour services applications.
7.2 Include in the HAZOP reviews a study of all surface system hydrocarbon vents,
reviewing suitability of location and design.

186 Deepwater Horizon Accident Investigation Report
Section 6. Investigation Recommendations
8 BOP Design and Assurance
8.1 Establish minimum levels of redundancy and reliability for BP’s BOP systems.
Require drilling contractors to implement an auditable risk management process to
ensure that their BOP systems are operated above these minimum levels.
8.2 Strengthen BP’s minimum requirements for drilling contractors’ BOP testing, including
emergency systems. Require drilling contractors to:
� Demonstrate that their testing protocols meet or exceed BP’s minimum
requirements.
� Perform self-audits and report conformance with their own protocols.
8.3 Strengthen BP’s minimum requirements for drilling contractors’ BOP maintenance
management systems. Require drilling contractors to:
� Demonstrate that their maintenance management systems meet or exceed BP’s
minimum requirements.
� Perform self-audits and report results to confirm conformance with their own
management systems.
8.4 Define BP’s minimum requirements for drilling contractors’ MOCs for subsea BOPs.
Require drilling contractors to:
� Demonstrate that their MOC systems meet or exceed BP’s minimum requirements.
� Perform self-audits and report results to confirm conformance with their own
MOC processes.
8.5 Develop a clear plan for ROV intervention (independent of the rig-based ROV) as part
of the emergency BOP operations in each of BP’s operating regions, including all
emergency options for shearing pipe and sealing the wellbore.
8.6 Require drilling contractors to implement a qualification process to verify that shearing
performance capability of BSRs is compatible with the inherent variations in wall
thickness, material strength and toughness of the rig drill pipe inventory.
8.7 Include testing and verification of conformance with Recommendations 8.1 through 8.6
in the rig audit process.

Deepwater Horizon Accident Investigation Report
Section 6. Investigation Recommendations
187
Secti
on
6
Although the investigation team has taken a broad approach to making recommendations within
the intent of its Terms of Reference, the team believes that as the findings in this report are
considered and discussed, they may give rise to broader systemic responses or recommendations
associated with possible broader industry issues. These issues might include industry working
practices; training and competency assessment; and interfaces among operators, drilling
contractors and service providers.

188 Deepwater Horizon Accident Investigation Report

Deepwater Horizon Accident Investigation Report
Section 7. Work that the Investigation Team Was Unable to Conduct
189
Se
cti
on
7
Section 7. Work that the Investigation Team Was Unable to Conduct
The investigation team considers its work to have provided a robust basis for its conclusions
and recommendations. This section describes in outline three additional areas of work that the
investigation team would have conducted if it had been able to do so. Other investigations or
inquiries may have the opportunity to conduct this work. One of these areas of work relates to
cement slurry testing; the others relate to blowout preventer (BOP) status and operation.
Cement
Due to the unavailability of Halliburton cement additives and products, the investigation team
was unable to undertake testing of cement slurries containing those additives and products.
As described in Analysis 5A. Well Integrity Was Not Established or Failed, the investigation team
arranged instead for testing of slurries based on the Halliburton formulation using representative
cement products and additives.
The testing program that the investigation team would have conducted on cement slurries
containing Halliburton cement additives and products includes:
� Test nitrified cement slurry at downhole temperature and pressure.
� Test to determine if cement with 55% to 60% quality foam can be generated using an injection
pressure of 1,000 psi.
� Test base and foam cement slurries for gel strength development.
� Test fluid rheology.
� Test contamination effects of base oil, spacer and mud on the nitrified foamed cement slurry.
� Determine the effect of Halliburton additives (defoamer, liquid retarder, KCl and EZ-FLOTM) on
nitrogen breakout and stability.
� Determine the effective use and concentration of Halliburton’s SA-541 suspending additive.
� Conduct settlement testing and free water testing on the base slurry.
� Test for fluid loss on the foam and the base slurry.
This area of work is associated with Analysis 5A. Well Integrity Was Not Established or Failed.
Refer to 2.2 Cement Testing Recommendations.
190 Deepwater Horizon Accident Investigation Report
Section 7. Work that the Investigation Team Was Unable to Conduct
Deepwater Horizon BOP
At the time this report was written, the investigation team had not had physical access to the
Deepwater Horizon BOP. Without access to the BOP or others' evaluation of the BOP, the
investigation team was unable to conduct the following examinations and tests:
� Examine the BOP stack to confirm the status of variable bore rams (VBRs) and blind shear
rams (BSRs).
� Determine configuration and material properties for any drill pipe section(s) crossing the
BOP stack.
� Determine the as-existing configuration of the BOP hydraulic control system to confirm the
results of the hydraulic analysis.
� Examine the BOP stack to ascertain nitrogen pre-charge pressures in the BOP
accumulator bottles.
� Determine the conditions of the two check valves in the stack accumulator hydraulic circuit and
the BSR ST lock sequence valves.
� Examine and test the blue pod automatic mode function batteries to determine their condition
and establish their date of manufacture.
At the time this report was written, the investigation team did not have access to the yellow pod
solenoid valve 103 and was unable to evaluate the reasons for its failure.
This area of work is associated with Analysis 5D. The Blowout Preventer Did Not Seal the Well.
Representative Cameron BOP
At the time this report was written, the investigation team had been unable to obtain access for
testing of a representative Cameron BOP system. Accordingly, the investigation team was unable
to conduct the following:
� Full-scale testing to determine the response time of annular preventers and VBRs under
wellbore pressure conditions.
� Full-scale testing of the BSR operated by the BOP stack accumulators, with a representative
leak in the ST lock hydraulic circuit, and test its ability to shear the pipe that was present across
the BSR.
� Conduct testing of the annular preventer elastomeric sealing element under a representative flow
condition to determine its erosion characteristics.
This area of work is associated with Analysis 5D. The Blowout Preventer Did Not Seal the Well.

Deepwater Horizon Accident Investigation Report
Appendices
191
Ap
pe
nd
ice
s
Appendices
Appendix A. Transocean Deepwater Horizon Rig Incident Investigation Into the Facts and
Causation (April 23, 2010)
Appendix B. Acronyms, Abbreviations and Company Names
Appendix C. Macondo Well Components of Interest
Appendix D. Sperry-Sun Real-time Data—Pits
Appendix E. Sperry-Sun Real-time Data—Surface Parameters
Appendix F. Roles and Responsibilities for Macondo Well
Appendix G. Analysis Determining the Likely Source of In-flow
Appendix H. Description of the BOP Stack and Control System

192 Deepwater Horizon Accident Investigation Report