
Microbial food web structure in the Arabian Sea: a US JGOFS study
21
* Corresponding author. Fax: # 1-804-684-7293. E-mail address: duck@vims.edu (H.W. Ducklow). Deep-Sea Research II 48 (2001) 1303}1323 Heterotrophic bacterioplankton in the Arabian Sea: Basinwide response to year-round high primary productivity H.W. Ducklow*, D.C. Smith, L. Campbell, M.R. Landry, H.L. Quinby, G.F. Steward, F. Azam The College of William and Mary School of Marine Science, PO. Box 1346, Gloucester Point, VA 23062, USA University of Rhode Island Graduate School of Oceanography, Narragansett, RI 02882, USA Department of Oceanography, Texas A&M University, College Station, TX 77843, USA Department of Oceanography, University of Hawaii, Honolulu, HI 96822, USA Monterey Bay Aquarium Research Institute, Moss Landing, CA 95039, USA Scripps Institution of Oceanography, La Jolla, CA 92093, USA Received 17 December 1998; received in revised form 22 October 1999; accepted 19 November 1999 Abstract Heterotrophic bacterial abundance and productivity were measured during "ve and four cruises, respec- tively, in the northwest Arabian Sea as part of the US JGOFS Process Study, which provided a new view of seasonal bacterial dynamics in that part of the basin in#uenced by monsoonal forcing. In this paper, surface layer data are used to address two questions concerning the in#uence of the monsoon cycle on bacterial dynamics: (1) Is there a bacterial bloom in the SW Monsoon? and (2) Is bacterial production low during the oligotrophic Spring Intermonsoon? An extensive comparison of epi#uorescence microscopy and #ow cytometry, unprecedented at this scale, detected essentially the same heterotrophic bacterial populations and distributions, with some between-cruise di!erences. Use of the two methods allowed us to extend our observations in space and time. Bacterial productivity, both in the surface layer and integrated over the euphotic zone, was elevated less than 2-fold during the Southwest Monsoon. Levels of bacterial abundance and production were low during the Northeast Monsoon, then increased in March during the Spring Intermonsoon. There was some stimulation of abundance or production inshore in response to coastal upwelling. In general, the basin was enriched in bacterial biomass '510 cells l throughout the year, relative to other tropical regimes, presumably in response to overall high PP and DOC levels. Seasonally uniform DOC levels may be regulated in part by intense bacterial utilization rates, but also re#ect seasonal consistency in PP. 2001 Elsevier Science Ltd. All rights reserved. 0967-0645/01/$ - see front matter 2001 Elsevier Science Ltd. All rights reserved. PII: S 0 9 6 7 - 0 6 4 5 ( 0 0 ) 0 0 1 4 0 - 5
-
Upload
independent -
Category
Documents
-
view
1 -
download
0
Transcript of Microbial food web structure in the Arabian Sea: a US JGOFS study
*Corresponding author. Fax: #1-804-684-7293.E-mail address: [email protected] (H.W. Ducklow).
Deep-Sea Research II 48 (2001) 1303}1323
Heterotrophic bacterioplankton in the Arabian Sea:Basinwide response to year-round high primary productivity
H.W. Ducklow��*, D.C. Smith�, L. Campbell�, M.R. Landry�, H.L. Quinby�,G.F. Steward�, F. Azam�
�The College of William and Mary School of Marine Science, PO. Box 1346, Gloucester Point, VA 23062, USA�University of Rhode Island Graduate School of Oceanography, Narragansett, RI 02882, USA
�Department of Oceanography, Texas A&M University, College Station, TX 77843, USA�Department of Oceanography, University of Hawaii, Honolulu, HI 96822, USA
�Monterey Bay Aquarium Research Institute, Moss Landing, CA 95039, USA�Scripps Institution of Oceanography, La Jolla, CA 92093, USA
Received 17 December 1998; received in revised form 22 October 1999; accepted 19 November 1999
Abstract
Heterotrophic bacterial abundance and productivity were measured during "ve and four cruises, respec-tively, in the northwest Arabian Sea as part of the US JGOFS Process Study, which provided a new view ofseasonal bacterial dynamics in that part of the basin in#uenced by monsoonal forcing. In this paper, surfacelayer data are used to address two questions concerning the in#uence of the monsoon cycle on bacterialdynamics: (1) Is there a bacterial bloom in the SWMonsoon? and (2) Is bacterial production low during theoligotrophic Spring Intermonsoon? An extensive comparison of epi#uorescence microscopy and #owcytometry, unprecedented at this scale, detected essentially the same heterotrophic bacterial populations anddistributions, with some between-cruise di!erences. Use of the two methods allowed us to extend ourobservations in space and time. Bacterial productivity, both in the surface layer and integrated over theeuphotic zone, was elevated less than 2-fold during the Southwest Monsoon. Levels of bacterial abundanceand production were low during the Northeast Monsoon, then increased in March during the SpringIntermonsoon. There was some stimulation of abundance or production inshore in response to coastalupwelling. In general, the basin was enriched in bacterial biomass '5�10� cells l�� throughout the year,relative to other tropical regimes, presumably in response to overall high PP and DOC levels. Seasonallyuniform DOC levels may be regulated in part by intense bacterial utilization rates, but also re#ect seasonalconsistency in PP. � 2001 Elsevier Science Ltd. All rights reserved.
0967-0645/01/$ - see front matter � 2001 Elsevier Science Ltd. All rights reserved.PII: S 0 9 6 7 - 0 6 4 5 ( 0 0 ) 0 0 1 4 0 - 5
1. Introduction
The Arabian Sea is unique among the world's major ocean basins. It is a relatively small oceanbasin, closed to the north, which restricts circulation and exchange, leading to an extensive volumeof hypoxic water beneath the seasonal pycnocline (Olson et al., 1993). Moreover, the basinexperiences extreme wind forcing from seasonally reversing monsoonal winds (Smith et al., 1991).The Southwest (SW) Monsoon (June}September) drives coastal upwelling, which relaxes in thefollowing Fall Intermonsoon season (October}November), leading to alternating mesotrophic andoligotrophic phases in the euphotic zone. Based on CZCS data, the Arabian Sea appears to havethe highest seasonal variability in surface chlorophyll (Yoder et al., 1993) and primary productivity(PP, Brock et al., 1993, 1994) of any tropical oceanic basin. For example, Brock et al.'s (1993, 1994)model suggested a seasonal range in PP of(300}'2500mgCm��d�� (25}210mMol Cm��d��)north of 103 North. The small size and predictable, enhanced seasonality of the Arabian Seamade it an interesting and useful place in which to examine the responses of planktoncommunities and the biogeochemical system to changes in physical forcing and carbon inputs(Smith et al., 1991).In this regard, the Arabian Sea is also a useful region for investigating the responses
and regulation of bacterioplankton. We originally hypothesized that bacterial activitywould vary in response to extreme primary production variations forced by the monsoonalcycle. Thus, we wanted to know if high primary production rates driven by coastal upwellingduring the SW Monsoon caused a notable bacterial response. Further, we did not knowpreviously if bacterial properties declined during the intermonsoonal seasons (oligotrophicphases).A more thorough examination of the general relationship between bacteria, physics and
phytoplankton required a comprehensive and extensive expedition to the northern Arabian Sea. Inparticular, there was a need to sample during the SWMonsoon. The opportunity to examine thesequestions is now possible with data from the JGOFSArabian Sea Process Study (Smith et al., 1991,van Weering et al., 1997; Burkill, 1999). JGOFS' observations commenced with the Dutchexpeditions during May 1992}February 1993 in the Somali upwelling region and surroundingcoastal ocean, during the SW and Northeast (NE, December}February) Monsoons. The BritishARABESQUE Expedition occupied stations in the northern Arabian Sea in August}December,1994. Both expeditions sampled during the SW Monsoon. Bacterial measurements were madeduring both expeditions (Goosen et al., 1997; Wiebinga et al., 1997; Pomroy and Joint, 1998).German JGOFS and US JGOFS again occupied the basin in 1995. As a result, we can now attempta more complete examination of the seasonal course of bacterial and primary production. Wemade observations of heterotrophic bacterial stocks and production during the NE Monsoon(January and December), the Spring Intermonsoon (March) and the SW Monsoon (July andAugust). Campbell et al. (1998) have compared stocks and vertical and horizontal variations ofpicoplankton, including heterotrophic bacteria, on the same cruises. In this paper, we presentobservations on the geographic distribution of bacterial abundance and production to illustratethe spatial and temporal patterns of bacterial responses to the seasonal changes in physical forcing,nutrients and phytoplankton. Furthermore, we make use of two complementary data sets onbacterial abundance obtained by both #ow cytometric and epi#uorescence microscopicestimates.
1304 H.W. Ducklow et al. / Deep-Sea Research II 48 (2001) 1303}1323

2. Materials and methods
TheUS JGOFSArabian Sea Expedition was conducted from January to December 1995 aboardR/V T. G. Thompson. The "ve Process Cruises considered here (TN043, TN045, TN049, TN050,TN054) each occupied the stations shown on the map in Fig. 1. The stations were arranged alongnorthern (N) and southern (S) transect lines extending from near the Omani coast into theoligotrophic tropical Indian Ocean near 103N, 653E. Stations S11 and S13 were close (within10nm) to Stations 4 and 5 occupied by the R. R. S. Darwin in September 1986 (Ducklow, 1993); andStations S1}13 were located near R. R. S. Darwin's cruise track A1}10 of Sept.}Dec. 1994 (Pomroyand Joint, 1998). The cruise track consisted of short ((6 h) CTD stations with limited hydro-graphic sampling and medium (6}12h), and long (1}2 d) experimental stations at which the fullsuite of JGOFS measurements were made, including in situ primary production. Core hydro-graphic data (e.g., T, S, O
�, CO
�, nutrients, Chl a) were collected at all stations, whereas
bacterial rate measurements and microscopic abundance measurements were made only atmedium and long stations. Flow cytometric determinations of bacterial abundance were made atall stations during TN050 and TN054, but not on TN043 and TN045 (cf. Station dots in Figs. 1 and4). All samples discussed here were collected from a CTD-Rosette "tted with 24, 10-l modi"edNiskin-type bottles (Morrison et al., 1998). Most data reported in this paper were drawn fromsurface bottles closed just below the surface (ca. 1m). Selected data are presented from deepersamples in the water column. Water samples were not prescreened prior to processing describedbelow.Hydrographic properties were sampled and analyzed as described in Morrison et al. (1998).
Chlorophyll awas determined using HPLC as described in Goericke and Repeta (1993) and Latasaet al. (1996). Mixed layer depths were estimated using the ��
�'0.125 criterion (Gardner et al.,
1999) and obtained from the US JGOFS database.Bacterial abundance and biovolume were determined microscopically, following JGOFS Proto-
cols (Knap et al., 1996). Samples were preserved with particle-free (0.2�m "ltered) 25% glutaral-dehyde (2% "nal conc.) and stored in a refrigerator until slide preparation. All slides were preparedwithin 48 h of collection. A volume of each sample su$cient to deposit 15}30 cells within the24�24�m "eld of view of the video camera at 1250X (see below) was "ltered onto a prestained,0.2�m pore size black polycarbonate "lter (Poretics Corp.) in an all-glass "ltration assembly.Backing "lters (0.45�m, mixed ester) were used under the Poretics "lters to ensure even distribu-tion of cells. Samples were stained with 0.005% acridine orange after Hobbie et al. (1977) andmounted on microscope slides using Resolve � Immersion Oil and stored at !203C in slideboxes. Bacterial abundances and biovolumes were estimated for the March and July cruises usinga Zeiss Axiophot epi#uorescencemicroscope, equipped with a solid state video camera (Photomet-rics CH250 CCD) and ImagePro image analysis system in Ducklow's laboratory (Bjornsen, 1986;Ducklow et al., 1995). We used blue excitation (450}490nm) from a 200W mercury lamp, witha 510 nm beam splitter and a 520 nm emission "lter. Su$cient video images were acquired on eachslide to yield about 300}600 measurements of individual cells. Apparent cell volume was derivedusing an algorithm derived from image analysis estimates of cell axes, area and perimeter, whichavoids large error resulting from cubing linear dimensions (Ducklow et al., 1995). One slide wasmade and analyzed per sample for most experiments. Between-operator estimates of totalbiovolume (abundance times mean cell volume) vary by 5}10%. For the January and December
H.W. Ducklow et al. / Deep-Sea Research II 48 (2001) 1303}1323 1305
cruises, samples were enumerated visually on an Olympus BH2 epi#uorescence microscope inAzam's laboratory. Biovolumes were not determined for these cruises.Water samples for #ow-cytometric (FCM) analyses of microbial populations were preserved in
3-ml cryogenic tubes with paraformaldehyde ("nal concentration 1%) and frozen in liquid nitro-gen. FCM samples were thawed and stained with Hoechst 33342 (0.8�gml�� "nal concentration)for 30min before analysis of picoplankton populations (Monger and Landry, 1993). Subsamples of100�l were enumerated on a Coulter EPICS 753 #ow cytometer equipped with dual argon lasers,MSDS II automatic sampling, and Cicero CYTOMATION software. The lasers were alignedcolinearly with the "rst laser tuned to the UV range to excite Hoechst-stained DNA. The blue#uorescence from the DNA stain distinguished cells from nonliving particulate matter. The secondlaser was tuned to 488 nm at 1.3W to excite the pigments of autotrophic cells. This con"gurationallowed heterotrophic bacterial cells to be readily distinguished from co-occurring phototrophicbacteria (Prochlorococcus spp.) in the same size range (measured as forward and right-angle lightscattering properties). All FCM samples were spiked with a standard mixture of PolysciencesFluoresbrite YG 0.57- and 0.98-�m visible beads and 0.46-�m UV beads to normalize cellularproperties between runs.Bacterial production rates were estimated from determinations of the rates of incorporation of
methyl-�H-thymidine (TdR; speci"c activity '80Cimmol��) and 2,3-�H-leucine (Leu; speci"cactivity'140Cimmol��; both from New England Nuclear) using the microcentrifugation proto-col (Smith and Azam, 1992). All surface samples were incubated within 13C of the in situtemperature in the dark in refrigerated circulator baths. In this method 1.7-ml samples areincubated in 2-ml polypropylene screw-capped centrifuge tubes held in the bath in #oating racks.Surface samples were incubated for 0.5}2h depending on anticipated incorporation rates. Incorpo-ration was linear over this period (data not shown, but see Ducklow, 1993; Wiebinga et al., 1997)Triplicate subsamples and zero-time blanks were run for all samples. All samples were extractedtwice in cold 5% trichloroacetic acid and rinsed with 80% ethanol by sequential decanting,washing and recentrifugation before liquid scintillation counting in Packard Ultima Gold] cock-tail. All LSC counting was completed on board the ship in a Beckman LS 6000 instrument.Analytical precision for triplicate incubations (standard deviation/mean) for TdR and Leu incorpo-ration averaged 0.22 and 0.20, respectively (n"843).Bacterial abundance was determined by both methods on all cruises except the SW Monsoon
cruises. There were no cytometric determinations of heterotrophic bacterial abundance made onthe July cruise and no epi#uorescence determinations on the August cruise. In addition nobacterial activity measurements were included on the August cruise. Thymidine and leucineincorporation rate determinations were limited to the South Transect on the July cruise, as a resultof problems shipping radioisotopes through Oman Customs prior to the cruise.All data were contoured in Surfer 6.01 (Golden Software, Golden, CO). Data were gridded using
a Kriging algorithm, set to search all data points in a 153 latitude by 143 longitude array with 0.23spacing, a linear variogram and no anisotropy, as in standard topographic applications. For mosthydrographic data all stations were sampled (Figs. 1and 2), but for the bacterial data fewer stationswere sampled which resulted in sparser coverage (Figs. 4}7). To test the e!ects of sparser dataarrays on gridding results, we compared a temperature data set gridded with all stations to thesame one gridded and contoured after removing stations so the map resembled a typical bacterialdata set (cf. Figs. 2 and 4). The mean residuals between estimated temperature at the grid point
1306 H.W. Ducklow et al. / Deep-Sea Research II 48 (2001) 1303}1323

Fig. 1. CTD (small solid circles) and longer rate process stations (large open and closed circles) occupied during the USJGOFS Arabian Sea Expedition, January}December, 1995. Large solid circles show stations where in situ primaryproduction was measured. Bacterial production and microscopy were sampled at all large circles.
nearest each station and the observed temperature were computed for the complete and subsam-pled maps. The contour map for the incomplete station array and the full array were very similarand the means of the residuals did not di!er signi"cantly (p'0.05).
3. Results
3.1. Seasonal evolution of surface hydrographic properties
Hydrography, winds and biological properties of the study area have been presented in otherrecent papers from the various JGOFS Expeditions (Morrison et al., 1998). Here we provide a briefsurvey of some principal observations by our colleagues drawn from the US JGOFS database toprovide a context in which to view the seasonal and geographic patterns of bacterial properties.The sampling grid consisted of two transect lines extending from near the Oman coast about1500km into the center of the basin (Fig. 1). This station arrangement provided a large-scale viewof surface properties as they vary onshore-o!shore and north to south on a seasonal basis (Fig. 2).Surface temperatures were nearly uniform across the region during the late NE Monsoon in
H.W. Ducklow et al. / Deep-Sea Research II 48 (2001) 1303}1323 1307
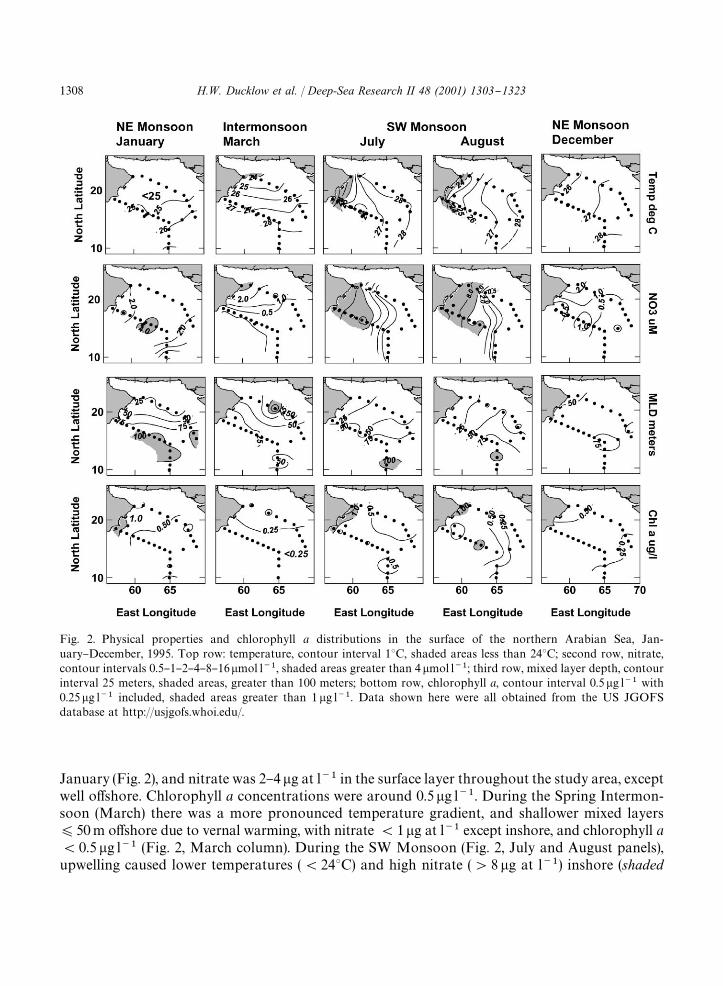
Fig. 2. Physical properties and chlorophyll a distributions in the surface of the northern Arabian Sea, Jan-uary}December, 1995. Top row: temperature, contour interval 13C, shaded areas less than 243C; second row, nitrate,contour intervals 0.5}1}2}4}8}16�mol l��, shaded areas greater than 4�mol l��; third row, mixed layer depth, contourinterval 25 meters, shaded areas, greater than 100 meters; bottom row, chlorophyll a, contour interval 0.5�g l�� with0.25�g l�� included, shaded areas greater than 1�g l��. Data shown here were all obtained from the US JGOFSdatabase at http://usjgofs.whoi.edu/.
January (Fig. 2), and nitrate was 2}4�g at l�� in the surface layer throughout the study area, exceptwell o!shore. Chlorophyll a concentrations were around 0.5�g l��. During the Spring Intermon-soon (March) there was a more pronounced temperature gradient, and shallower mixed layers)50m o!shore due to vernal warming, with nitrate(1�g at l�� except inshore, and chlorophyll a(0.5�g l�� (Fig. 2, March column). During the SW Monsoon (Fig. 2, July and August panels),upwelling caused lower temperatures ((243C) and high nitrate ('8�g at l��) inshore (shaded
1308 H.W. Ducklow et al. / Deep-Sea Research II 48 (2001) 1303}1323

areas), with more pronounced mixed layer gradients and higher chlorophyll a ('1 �g l��)con"ned to the low temperature, upwelling region. Although nitrate '4 �g at l�� extended intothe central basin throughout the SW Monsoon cruises in July}early September, correspondingareas of higher chlorophyll a were not observed. During the following early phase of the next NEMonsoon (Fig. 2, December column), surface distributions were again similar to those observed theprevious January, with perhaps shallower mixed layers. Mixed-layer depths ranged from(25 to'75m, with some areas '100m. Surface chlorophyll a was seldom ' 2 �g l��, or (0.2�gl��during the entire study period. This lack of a wide range of chlorophyll a levels in the surfacewas a surprising observation, inconsistent with expectations about pronounced oligotrophic tomesotrophic shifts driven by the monsoonal cycle. Otherwise, hydrographic observations generallyadhered to our expectations for the annual cycle in the region.
3.2. Comparison of bacterial abundance estimates
We obtained simultaneous estimates of heterotrophic bacterial abundance using two indepen-dent methods on the January, March and December cruises, when samples for both epi#uorescencemicroscopy and #ow cytometry were collected at most stations in the upper 200m (Figs. 3 and 4).The estimates were signi"cantly correlated in all three months, but the relationship varied. TheModel II regression slope was 0.99 in January (95% CI: 0.85}1.15, n"142) but the relationshipwas poor above an abundance of ca. 5�10� cells l��. The relationship between estimates was moreconsistent across the observed range of abundance in March and December (r�"0.72, 0.85,respectively), but slopes di!ered from 1 (March and December 95% CI: 0.51}0.65, n"116 and1.27}1.43, n"157, respectively). Thus inMarch and December, the two methods detected di!erentportions of the heterotrophic bacterial assemblage (Fig. 3), probably owing to changing character-istics of the populations, and di!erential detection of these changes by each method. The 95% CIfor the Model II regression slope for all data combined from all cruises was 0.98}1.12 (r�"0.689,n"421), suggesting that over all stations, depths and cruises the two methods were detectingcomparable populations of heterotrophic bacteria. The >-intercept was not signi"cantly di!erentfrom zero (p(0.05). The relatively poor r� might be the result of analytical variability of the twotechniques, which is about $15% for each method (Knap et al., 1996; Campbell et al., 1998).
3.3. Spatial distributions of bacterial properties: abundance
Microscopic and #ow cytometric determinations of bacterial abundance showed generallysimilar distribution patterns and a consistent picture of the seasonal evolution of surface bacteriallevels (Fig. 4), at least to the level of resolution presented here (5�10� cells l��, or about 25% ofpeak abundances, see Fig. 3). There were some regional and local scale di!erences as pointed outbelow and as shown in Fig. 4. In January, during the late NEMonsoon, abundances were between5 and 10�10� cells l�� by both methods, uniformly distributed across the study area, with no on-to o!shore gradient (Fig. 4, top two rows). Surface abundances increased by a factor of 2 during theSpring Intermonsoon in March, with more noticeable di!erences between the two methods. Therewas still no strong evidence for onshore enhancement of abundance at this time. Rather, bothmethods showed a local maximum centered on stations S4}S7, in a strongly strati"ed region withshallow mixed layers(25m (Fig. 2) and low nitrate. The hot spot seen in the microscope counts,
H.W. Ducklow et al. / Deep-Sea Research II 48 (2001) 1303}1323 1309

Fig. 3. Relationships between epi#uorescent microscopic and #ow cytometric determinations of heterotrophic bacterialabundance. All data points represent samples from the same Niskin bottles. Open circles, all data in upper 200m (limit ofsampling for cytometry). Solid symbols: surface data used in contour plots. There were no cytometric samples taken onthe July cruise, and no microscopic samples on the August cruise. TheModel II regressions (heavy solid lines) for the dataare: January, >"0.99X !0.11�10�, r�"0.564, n"144; March, >"0.68X#0.84�10�, r�"0.72, n"118;December, >"1.33X!2.38�10�, r�"0.85, n"161. The correlation coe$cients for the surface data are: January,0.20; March, 0.45, December, 0.89. Heavy dashed lines in March and December plots are Model II regressions formicroscopic counts minus cyto#uorometric prochlorophyte counts (see text). Light dashed lines are 1 : 1.
and mirrored in the distribution of leucine incorporation (Fig. 6) also had the highest observedlevels of prochlorophyte abundance detected during the entire year. The #ow cytometric observa-tions suggested higher bacterial abundance extending from SW to NE, crossing from shallow todeeper mixed layers. The SW Monsoon was sampled during its mid- (July) and late (Aug. } Sept.)phases. Unfortunately, only one method for bacterial abundance could be employed on each ofthese two cruises. Bacterial abundance was high during the SW Monsoon, with a large region'15�10� cells l�� in August (Fig. 4). In both July and August, peak abundances'10�10� cellsl�� covered the regions with high nitrate (cf. Fig. 2), but spread well beyond the nitrate-enrichedarea. There was little apparent spatial coincidence with the core of the low temperature (upwelling)"elds or with mixed layer depth. The only consistent onshore enhancement of bacterial abundancewas observed by both analyses in December, during the early NE Monsoon (Fig. 4, right-handpanels), and most of the o!shore region again had lower abundance(10�10� cells l��, as in theprevious January.
1310 H.W. Ducklow et al. / Deep-Sea Research II 48 (2001) 1303}1323

Fig. 4. Bacterial abundance distributions in the northern Arabian Sea surface, January}December, 1995, comparingdeterminations made by epi#uorescence microscopy (top row) and #ow cytometry (second row). The third row showsaveraged contours using surface determinations by both methods. Only samples from stations where both analyses wereperformed were contoured in the combined December plot. The bottom row shows contours for microscopic countsminus cyto#uorometric prochlorophyte counts. The contour interval is 5�10� cells/l. Shaded regions have abundancegreater than 10� cells/l.
3.4. Cellular biovolume
Mean cell volumes were determined for all water column samples on the March and July cruisesonly. Cells were small, even for marine bacterioplankton, averaging 0.033�m� cell�� (SD, 0.009,n"654, mean equivalent spherical diameter, 0.4�m) for the two cruises. In contrast, cells in theEquatorial Paci"c averaged 0.04}0.05�m� cell�� in the upper 50m (Ducklow et al., 1995). InMarch, there was a distinct o!shore maximum in cell volume with the largest cells'0.030}0.035
H.W. Ducklow et al. / Deep-Sea Research II 48 (2001) 1303}1323 1311

Fig. 5. Distribution of bacterial cell volume in the surface of the northern Arabian Sea surface. Measurements were onlymade on the March and July, 1995 cruises from image analyzed epi#uorescence microscopy. Top panel, meancell volume, contour interval 0.005�m� per cell, shaded areas greater than 0.035�m�. Bottom panel, totalbacterial biovolume (abundance times mean cell volume), contour interval, 10��m�/l, shaded areas greater than4�10��m�/l.
at the outer extent of the two transects (Fig. 5). In July cell volumes were more uniformwith slightlylarger cells in the north, generally in a region with mixed layers (50m (Fig. 2). Total bacterialbiovolumes (abundance times mean cell volume) ranged from 1}8�10��m� l�� in March,re#ecting the abundance distribution, but were uniformly low in July, when the gradients in volumeopposed the abundance gradient (Fig. 5). Our cell volume estimates are considerably less than the0.11�m� value cited byWiebinga et al. (1997), but the same as the 0.02}0.04�m� found in our studyarea a year earlier by Pomroy and Joint (1998).
3.5. Bacterial production and growth rates
�H-thymidine and �H-leucine incorporation rates were determined to estimate bacterial produc-tion throughout the water column at the rate process stations (large open and closed circles inFig. 1) in January, March, July (south transect only) and December. Rates in the surface reported
1312 H.W. Ducklow et al. / Deep-Sea Research II 48 (2001) 1303}1323

Table 1Rates of �H-thymidine and �H-leucine incorporation in the surface layer of the Arabian Sea. Each entry gives the mean(SD) and range in pmol l��h��
Month �H-Thymidine �H-Leucine Ratio (Leu : TdR)
January (n"15) 4.1 (2.3) 54 (45) 13.4 (6.2)1.4}8.7 19}202 5}28
March (n"14) 5.1 (6.0) 46 (23) 12.4 (7.6)2}26 18}106 2}26
July (n"10) 6.2 (3.4) 91 (46) 15.3 (5.9)4}16 6}169 2}23
December (n"15) 1.8 (3.0) 45 (25) 59 (35)0.2}11 15}118 6}142
here varied greatly, with standard deviations of the same order as the means for all cruises (Table 1).Rates were not determined along the northern transect in July, but southern transect resultssuggest a maximum in leucine incorporation during the SW Monsoon (Table 1). Otherwise, rateswere generally uniform during the year (Fig. 6). Leucine incorporation showed inshore maxima inJanuary and December during the NE Monsoon. Thymidine incorporation was maximal in thenortherly part of the study area in March, mirroring the distributions of temperature, nitrate andchlorophyll a (cf. Figs. 2 and 6). The cell-speci"c leucine incorporation rates, an index of biomassturnover rates, were similar in space and time to the incorporation rates, because of the greaterdynamic range of the rates, compared to abundance measurements (Fig. 6). Leucine : thymidineincorporation rates, a rough indicator of cellular resource allocation (Shiah and Ducklow, 1997),were similar in January}July but di!ered conspicuously in December when thymidine incorpora-tion was low (Table 1). The observed ranges of incorporation rates and ratios were similar to thosereported by Wiebinga et al. (1997) and Pomroy and Joint (1998).
3.6. Subsurface maxima
In order to gain further insight into the geographic distributions of bacterial properties inthe Arabian Sea, we examined the distribution and vertical location in the water column ofsubsurface bacterial abundance maxima (Figs. 4 and 7). Maxima were identi"ed simply by locatingthe greatest abundance in the upper 200m in each vertical pro"le determined by epi#uorescencemicroscopy. The distribution of subsurface maxima closely mirrored the surface distributions, butof course with higher abundances at each station location (Fig. 7). The depth of the subsurfacemaximum layer was uniformly shoaler onshore in January, with inshore maxima at or near thesurface ((10m) (Fig. 7, left column). The maxima were deeper in March during the SpringIntermonsoon when the region was more strongly strati"ed, and shallower during the SWMonsoon in July. Maxima were also shallow in December. In general, bacterial maxima wereshallower, and had slightly lower amplitudes (ratio of mean maximum values to mean surface
H.W. Ducklow et al. / Deep-Sea Research II 48 (2001) 1303}1323 1313

Fig. 6. Distribution of �H-leucine incorporation rates (top panel, contour interval, 25 pMh��, gray areas'75); leucineincorporation per cell (second row, interval, 2�10��pMh�� cell��, gray areas'10); �H-thymidine incorporation rates(third row, contour intervals, 4 pMh��, gray areas '8); leucine : thymidine incorporation ratio (bottom row, contourintervals, 5, gray areas '15).
values) than subsurface chlorophyll a maxima (Table 2). Bacterial subsurface maxima were notpronounced (amplitudes (1.3), but except for March, neither were the subsurface chlorophyll amaxima (Gundersen et al., 1998). Thus these maps re#ect the general concentration of bacterial
1314 H.W. Ducklow et al. / Deep-Sea Research II 48 (2001) 1303}1323
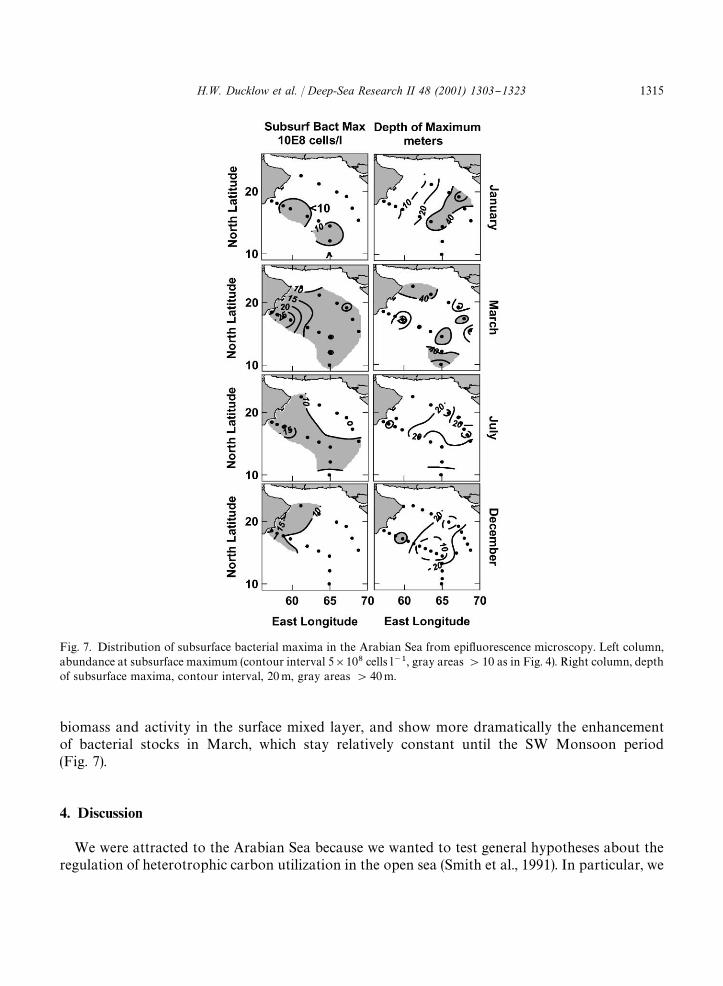
Fig. 7. Distribution of subsurface bacterial maxima in the Arabian Sea from epi#uorescence microscopy. Left column,abundance at subsurface maximum (contour interval 5�10� cells l��, gray areas'10 as in Fig. 4). Right column, depthof subsurface maxima, contour interval, 20m, gray areas '40m.
biomass and activity in the surface mixed layer, and show more dramatically the enhancementof bacterial stocks in March, which stay relatively constant until the SW Monsoon period(Fig. 7).
4. Discussion
We were attracted to the Arabian Sea because we wanted to test general hypotheses about theregulation of heterotrophic carbon utilization in the open sea (Smith et al., 1991). In particular, we
H.W. Ducklow et al. / Deep-Sea Research II 48 (2001) 1303}1323 1315

Table 2Subsurface bacterial and chlorophyll a maxima in the Arabian Sea, showing means of surface and subsurface propertiesat all stations sampled. The ratio of the value at the subsurface maximum to the surface value gives a measure of theamplitude of the subsurface maximum, if any existed. A value of 1 indicated maximum value at the surface. Bacterialabundance data from epi#uorescence microscopy except August (FCM)
Month Surface properties Subsurface properties
Number ofstations
Bact Chl� Bact max BactDepth
BactMax/Surf
Chlmax
ChlDepth
ChlMax/Surf
10� cells/l �g/l 10� cells/l m ratio �g/l m ratio
January (n"15) 7.6 0.51 8.7 23.9 1.15 0.59 21.3 1.27March (n"15) 13.2 0.19 16.0 29.9 1.28 0.54 46.5 3.32July (n"15) 8.3 0.65 10.5 26.5 1.29 0.77 31.2 1.24August (n"26) 13.5 0.53 14.5 25.9 1.07 0.70 36.7 1.32December (n"15) 8.9 0.35 10.0 22.8 1.14 0.47 39.8 1.44
�HPLC Chl data obtained from the US JGOFS Database at http://usjgofs.whoi.edu/. Data originated by R. Bidigareand R. Goericke.
suggested that the anticipated strong response of the primary production system to coastalupwelling during the SWMonsoon would be a major in#uence on bacterial dynamics in the region(Azam et al., 1994), lasting perhaps through the following Fall Intermonsoon. Until recently therewere few data sets to test this hypothesis. Chepurnova (1984) reported abundances from phasecontrast microscopy of ca. 10�}10� cells l�� and derived biomass values of 20}70�gC l�� forcyclonic eddies in the central Arabian Sea, 10}153N, 60}703E,. The "rst modern investigation ofbacterioplankton dynamics in the Indian Ocean was by Sorokin (1985), but it did not address thenorthwestern region most strongly in#uenced by monsoon wind forcing. Karrasch and Hoppe(1991) observed ca. 2�10� cells l�� and production rates of 0.5}6�gC l��d�� (derived from TdRincorporation rates 0.2}2pMhr��) near 183N, 653E during the late Spring Intermonsoon (AprilandMay), 1987. These rates suggest the region was more oligotrophic than during our March 1995cruise. Later Ducklow (1993) investigated bacterial ecology on a single cruise during the early FallIntermonsoon in September}October, 1986, "nding generally high levels of bacterial biomass andproduction for the open sea. Now, after four major JGOFS expeditions to the region we are ina better position to look critically at the seasonal patterns of bacterial dynamics, and possiblemechanisms regulating them. We focus on the surface layer, where the bacterial populations arehighest and most productive (Ducklow, 1993; Wiebinga et al., 1997; Pomroy and Joint, 1998;Campbell et al., 1998), to provide an overview of the geographical organization of seasonalbacterial dynamics.
4.1. Analysis of bacterial abundance
Campbell et al. (1998) provide the "rst regional scale view of bacterioplankton stocks using #owcytometry. Flow cytometry (FCM) o!ers several advantages over microscopy for oceanographic
1316 H.W. Ducklow et al. / Deep-Sea Research II 48 (2001) 1303}1323

investigation: ease of sampling, faster sample processing and simultaneous sensing of diverse cellpopulations (Campbell et al., 1994). On the other hand, epi#uorescence microscopy providesground truth for the FCM lasers, advantages of direct visual examination of samples, and coupledwith image analysis, better resolution of cell volumes in the (0.1�m� size range. We show here(Fig. 3) that the two methods detected comparable numbers of heterotrophic bacteria and providedessentially the same view of seasonal and spatial variation and pattern (but cf. Fig. 4, Marchpanels). We noted cruise-speci"c and possibly approach-speci"c di!erences in March and Decem-ber with slopes of 0.68 and 1.33, respectively, even though over all cruises, the two methodsprovided statistically indistinguishable results. Nonetheless, the between-cruise variability in-dicated that we cannot resolve subregional scale features in the bacterial distribution withcertainty. For example, Fig. 4 shows several local bacterial maxima seen by one method but notthe other. When the two methods di!er greatly, as for example at Station S7 in December, thecomposite view will be weighted toward the higher value (Fig. 4, third row). In this paper weconcentrate on the larger-scale, "rst-order features of seasonal changes and distributions that weredetected consistently by the two approaches.One major di!erence between the two approaches is in detecting prochlorophyte cells. These
small autotrophs have the same size and cell morphology as heterotrophic bacteria, so acridineorange-stained cells will generally be counted as bacteria (Campbell et al., 1994). Their auto#uores-cence fades rapidly, preventing visual detection under the microscope, although they are capturedin video microscopy. Inclusion of prochlorophyte counts as heterotrophic bacteria would providean upward bias to the epi#uorescence data, relative to the FCM analyses. To explore this bias, wesubtracted the cytometric counts of prochlorophytes from the epi#uorescence counts of bacteria.The hot spot near S4-7 in March, where FCM prochlorophyte counts were especially high is likelydue to this e!ect in part (cf. March maps for uncorrected and corrected microscopic counts inFig. 4). For the March data set, subtraction of prochlorophytes from the microscope counts raisedthe slope of the regression line slightly but signi"cantly (p(0.05; see short dashed line on plot, nosigni"cant change in r�). For the other months, when the original slopes were'1, correction of themicroscope counts did not signi"cantly alter the relationships. This analysis suggests that proch-lorophyte interference was not a major cause of monthly or cruise-speci"c di!erences betweenmicroscope and FCM determinations, although the relationship was di!erent in March. Contourplots of the corrected microscope data (Fig. 4, bottom row) show that although the magnitude ofthe estimates is reduced slightly, the areal distributions were not changed. Considering bothmethods together (Fig. 4, third row) gives the least biased, most representative version of the data.
4.2. Previous JGOFS research
Wiebinga et al. (1997) studied bacterial dynamics during the 1992}93 SW and NEMonsoons inthe Gulf of Aden and the Somali Current. They found peak volumetric thymidine and leucineincorporation rates, and peak cell densities similar to those we observed, and concluded thatbacterial production was supported by local primary production sources in both seasons. Their"ndings thus showed little need of our hypothesis (Ducklow, 1993; Azam et al., 1994) about thesupport of bacterial production by stored, semilabile DOC following monsoonal bloom periods.They found that bacterial properties were similar during the NE and SW Monsoons, with nobacterial bloom during the SW Monsoon. In drawing their conclusion about the relationship
H.W. Ducklow et al. / Deep-Sea Research II 48 (2001) 1303}1323 1317

between bacterial and primary production, Wiebinga et al. (1997) employed a rather high carbonper cell factor of 34 fgC, and also assumed a high growth e$ciency of 50%. Conclusions aboutbacterial carbon #uxes remain critically dependent on largely unsupported assumptions aboutconversion factors and conversion e$ciencies (Ducklow and Carlson, 1992). Employing a lowere$ciency, but also a more central value for carbon per cell (20 fgC; Lee and Fuhrman, 1987) wouldgenerally preserve Wiebinga et al.'s (1997) overall conclusions that bacterial production wasgenerally met by local sources of nutrition during the two monsoons.Pomroy and Joint (1998) investigated bacterial carbon dynamics during the late SW Monsoon
and following Fall Intermonsoon in 1994 in the same study area as US JGOFS, thus providingobservations for a direct look at bacterial carbon demand relative to primary production duringand following a monsoon-induced bloom. Like the observations presented here (Figs. 4 and 7) andthose presented earlier by Ducklow (1993) and Wiebinga et al. (1997). Pomroy and Joint (1998)observed that bacterial abundance was generally high (ca. 0.8�10� cells l��) in the region north of103N during both seasons, consistent with our SW and NEMonsoon observations. Like Wiebingaet al. (1997), Pomroy and Joint (1998) did not observe a large pulse of bacterial production duringthe SWMonsoon. They presented several scenarios employing various combinations of conversionfactors, and found that bacterial production was 10}30% of local primary production in bothseasons. Pomroy and Joint (1998) observed that bacterial production and stocks did not changefollowing the SW Monsoon. Both Wiebinga et al. (1997) and Pomroy and Joint (1998) found thatlevels of bacterial productivity and stocks were sustained following the peak in primary produc-tion. Further, both studies indicated that bacterial production was relatively low (10}20% of�C-PP) during the SW Monsoon, thus potentially allowing carbon storage for consumptionduring subsequent periods of lower productivity. Pomroy and Joint (1998) did "nd that theircarbon demand estimates were greater than measurements of DOC release from phytoplanktonmade at the same stations, but noted that other DOC sources could make up the shortfall.
4.3. Was there a bacterial bloom during the SW Monsoon?
Wiebinga et al. (1997) showed similar levels of BP : PP during the NE and SWMonsoons in theSomali Current region, and Pomroy and Joint (1998) showed no great di!erences between the SWMonsoon and following Fall Intermonsoon in the northern Arabian Sea. Our own data suggestthat bacterial abundance was high in the surface layer during the SW Monsoon, but not higherthan during the Spring Intermonsoon (March, Figs. 4 and 7, and cf. Campbell et al., 1998). Incontrast, bacterial stocks (i.e., cells m��) in the euphotic zone were highest during March (Table 3)and more uniform the rest of the year. High rates of bacterial productivity were found in di!erentseasons, depending on which precursor (leucine or thymidine) was used (Fig. 6). Due to problemswith isotope shipments, we were not able to provide a full areal picture for July, but data from thefull southern transect indicate higher rates of incorporation in the surface layer in July (Table 1).Bacterial production in the euphotic zone derived from leucine incorporation rates, and also theratio of BP/PP was highest in March and July (Table 3). Thus, in our data set, bacterial productionshowed just a small ((2-fold) increase during the SW Monsoon, and stocks did not change,consistent with the observations by Wiebinga et al. (1997) and Pomroy and Joint (1998). Ourobservations do not preclude a further response following the SW Monsoon, as suggested byDucklow (1993) but none of the data sets cited here were taken from the proper season to address
1318 H.W. Ducklow et al. / Deep-Sea Research II 48 (2001) 1303}1323

Table 3Mean euphotic zone bacterial biomass (epi#uorescence microscopy) and production� (mMolCm��d��) in the ArabianSea, January}December, 1995
Cruise cells/m� BP/m� EZ� BP/PP PP�
Jan (n"6) 3.75�10�� 15.6 90 0.18 88.7Mar (n"8) 6.17�10�� 21.8 95 0.26 83.8Jul (n"9) 4.11�10�� 29.4 59 0.24 121.4Dec (n"6) 3.77�10�� 12.5 60 0.15 83.0
�Bacterial production derived from �H-leucine incorporation using 3 kgCmol Leu�� (Simon and Azam, 1989).�Euphotic zone depth (meters).�Mean of primary production at stations where BP was also measured.
the issue de"nitively. The data in our study suggest no bacterial bloom occurred during the SWMonsoon.
4.4. Did stored DOC support high bacterial production following the NE Monsoon?
Bacterial abundance rose sharply in March, following the NE Monsoon (Fig. 4), then declinedslightly in the SWMonsoon (Table 3). BP increased by ca. 50% from January to March, and thenby 30% until July (Table 3). The leucine : thymidine incorporation ratio was generally uniform at10}15 from January through July (Fig. 6, July data for S transect not shown), suggesting roughlybalanced growth throughout the "rst half of the year (Chin-Leo and Kirchman, 1990). Theseobservations suggest that bacterial growth increased during the Spring Intermonsoon, whileprimary production stayed constant (Table 4).Interestingly, US JGOFS observed relatively high levels of PP during all seasons, with just
a small increase (40%) during the SWMonsoon (Table 4; Marra et al., 1998 and see cover image ofSmith (1999). This is not entirely a novel "nding. For example, Banse and English's (1993)reanalysis of CZCS "elds showed that surface pigment was as high during the Spring Intermon-soon in March and April as in the preceding NE Monsoon or even higher in some parts of ourstudy area (their regions 3 and 4 near our stations N4-7 and S7-11). There was a weak tendency forPP to be higher near the coast, but o!shore transport of upwelled nutrients seemed to homogenizethe PP "eld across the region (Banse, 1987). In our study, DOC (Table 4) was uniformly high (ca.80�M) in the surface layer throughout the study area between January and July, with just a slightdecline in the latter half of the year. These values are somewhat higher than observed in theSargasso and Ross Seas (Carlson et al., 1994; 1998), and the constancy of relatively high concentra-tions is remarkable. There was little seasonality in PP and DOC, as well as bacteria, in 1995.Overall, these observations suggest that high bacterial stocks and production in the (oligotrophic)Spring Intermonsoonwere not enhanced by utilization of DOC stored from the previous monsoon.Rather, a longer term growth process commencing during the NE Monsoon was sustained duringthe Spring Intermonsoon as a result of continued high primary production. Slightly higher PP inJuly and August was not su$cient to trigger a notable bacterial bloom at that time.
H.W. Ducklow et al. / Deep-Sea Research II 48 (2001) 1303}1323 1319

Table 4Mean primary productivity and euphotic zone chlorophyll a at main process stations, and surface DOC concentrationsin the Arabian Sea, 1995
Month Primary productivity� Euphotic zone Chl Surface DOCmMolCm��d�� mgm�� �Mol l��
mean SD mean SD mean SD
January 88.7 20.2 26 4 81 10March 85.7 15.4 25 6 82 3July 121.9 29.7 25 7 82 7August 83.0 35.2 32 9 74 3December 83.0 16.2 24 5 78 5
�Data in this Table were obtained from the US JGOFS Database at http://usjgofs.whoi.edu/. PP and Chl dataoriginated by R. Barber and J. Marra. DOC data from D. Hansell and E. Peltzer.
5. Conclusion
A synthesis of these observations, including those made later (December) than previous studies,indicates an attenuated seasonal pattern qualitatively similar to that seen in subtropical, temperateand even polar regimes (Ducklow and Carlson, 1992): a winter minimum followed by a spring-summer increase of bacteria (Table 3). There is no evidence in our study, nor in previousinvestigations, of a strong ('2-fold) response of the bacterioplankton to the NE and SWMonsoons. We do "nd evidence for increases of bacterial stocks and production during the periodfollowing the NE Monsoon. Otherwise, bacterial stocks and production are high and roughlyuniform in space and time, supported by year-round high levels of primary production and excessDOC (i.e., enhanced surface layer concentrations of labile and/or semilabile DOC above thedeepwater values; Carlson and Ducklow, 1995). Intense grazing on picoplankton (Brown et al.,1999) combined with high DOM supply could poise bacterial abundance at uniformly high levelsthroughout the year, while maintaining the small cell sizes (ca. 0.033�m� cell��) we observed. Highstocks of bacteria and high BP during the Spring Intermonsoon could be sustained on local PPwhich is higher than we originally anticipated for this period.
Acknowledgements
This research was supported by NSF OCE grants 9312695 to Azam, 9311246 to Landry andCampbell, 9612509 to Campbell and 9500601 to Ducklow.We are very grateful to German JGOFScolleagues Hans-Georg Hoppe and Soren Ullrich, Institut fuK r Meereskunde, Kiel, for the very kindloan of �H-thymidine and �H-leucine transferred to us from R/VMeteor at sea near 103N, 653E onJuly 28. Their kindness, and the permission of research vessel o$cers to transfer radioisotopes via
1320 H.W. Ducklow et al. / Deep-Sea Research II 48 (2001) 1303}1323
Zodiac during the SW Monsoon allowed us to obtain valuable data on bacterial activity duringthis important season near the core of the upwelling system. Gary Schultz and Matt Church(VIMS) assisted with bacterial sampling in March and July. Flynn Cunningham assisted withepi#uorescence microscopy performed at VIMS. Susan Brown, John Constantinou, Hector Nolla,and Hongbin Liu assisted with "eld sampling and FCM analyses. Finally, we cannot adequatelyexpress our thanks to our friends and colleagues Captain Glenn Gomes and the o$cers and crew ofR.V. T. G. Thompson for dedicated support during a long and arduous campaign for an entire year,far from home.This paper is contribution no. 531 from the US JGOFS Program.
References
Azam, F., Steward, G.F., Smith, D.C., Ducklow, H.W., 1994. Signi"cance of bacteria in the carbon #uxes of the ArabianSea. Proceedings of the Indian Academy of Sciences. Earth and Planetary Sciences 103, 341}351.
Banse, K., 1987. Seasonality of phytoplankton chlorophyll a in the central and northern Arabian Sea. Deep-Sea ResearchI 34, 713}723.
Banse, K., English, D.C., 1993. Revision of satellite-based phytoplankton pigment data from the Arabian Sea during theNortheast Monsoon. Marine Research 2, 83}103.
Bjornsen, P.K., 1986. Automatic determination of bacterioplankton biomass by image analysis. Applied EnvironmentalMicrobiology 51, 1199}1204.
Brock, J., Sathyendranath, S., Platt, T., 1993. Modeling the seasonality of subsurface light and primary production in theArabian Sea. Marine Ecology Progress Series 101, 209}221.
Brock, J., Sathyendranath, S., Platt, T., 1994. A model study of seasonal mixed-layer primary production in the ArabianSea. Proceedings of the Indian Academy of Sciences. Earth and Planetary Sciences 103, 163}176.
Brown, S.L., Landry, M.R., Barber, R.T., Campbell, L., Garrison, D.L., Gowing, M.M., 1999. Picophytoplanktondynamics and production in the Arabian Sea during the 1995 Southwest Monsoon. Deep-Sea Research II 46,1745}1768.
Burkill, P.H., 1999. ARABESQUE: An Overview. Deep-Sea Research II 46, 529}548.Campbell, L., Landry, M.R., Constantinou, J., Nolla, H.A., Brown, S.L., Liu, H., Caron, D.A., 1998. Response ofmicrobial community structure to environmental forcing in the Arabian Sea. Deep-Sea Research II 45,2301}2326.
Campbell, L., Nolla, H.A., Vaulot, D., 1994. The importance of Prochlorococcus to community structure in the centralNorth Paci"c Ocean. Limnology and Oceanography 39, 954}961.
Carlson, C.A., Ducklow, H.W., 1994. Annual #ux of dissolved organic carbon from the euphotic zone in the northwesternSargasso Sea. Nature 371, 405}408.
Carlson, C.A., Ducklow, H.W., 1995. Dissolved organic carbon in the upper ocean of the central equatorial Paci"cOcean, 1992: daily and "nescale vertical variations. Deep-Sea Research II 42, 639}656.
Carlson, C.A., Ducklow, H.W., Smith, W.O., Hansell, D.A., 1998. Carbon dynamics during spring blooms in the Ross Seapolynya and the Sargasso Sea: contrasts in dissolved and particulate organic carbon partitioning. Limnology andOceanography 43, 375}386.
Chepurnova, E.A., 1984. Bacterioplankton distribution in the euphotic zone of the northwest Indian Ocean froma mesoscale survey. Oceanology 24, 507}512.
Chin-Leo, G., Kirchman, D.L., 1990. Unbalanced growth in natural assemblages of marine bacterioplankton. MarineEcology Progress Series 63, 1}8.
Ducklow, H.W., 1993. Bacterioplankton distributions and production in the Northwestern Indian Ocean and Gulf ofOman, September, 1986. Deep-Sea Research 40, 753}771.
Ducklow, H.W., Carlson, C.A., 1992. Oceanic bacterial productivity. Advances in Microbial Ecology 12,113}181.
H.W. Ducklow et al. / Deep-Sea Research II 48 (2001) 1303}1323 1321
Ducklow, H.W., Quinby, H.L., Carlson, C.A., 1995. Bacterioplankton dynamics in the equatorial Paci"c during the 1992El Nino. Deep-Sea Research II 42, 621}638.
Gardner, W.D., Gundersen, J.S., Richardson, M.J., Walsh, I.D., 1999. The role of diel changes in mixed-layerdepth on carbon and chlorophyll distributions in the Arabian Sea. Deep-Sea Research II 46,1833}1859.
Goericke, R., Repeta, D.J., 1993. Chlorophylls a and b and divinyl chlorophylls a and b in the open Subtropical NorthAtlantic Ocean. Marine Ecology Progress Series 101, 307}313.
Goosen, N., van Rijswijk, K.P., de Bie, M., Peene, J., Kromkamp, J., 1997. Bacterioplankton abundance and productionand nanozooplankton abundance in Kenyan coastal waters (Western Indian Ocean). Deep-Sea Research II 44,1235}1250.
Gundersen, J.S., Gardner, W.D., Richardson, M.J., Walsh, I.D., 1998. E!ects of monsoons on the seasonal and spatialdistributions of POC and chlorophyll in the Arabian Sea. Deep-Sea Research II 45, 2103}2132.
Hobbie, J.E., Daley, R.J., Jasper, S., 1977. Use of Nuclepore "lters for counting bacteria by #uorescence microscopy.Applied Environmental Microbiology 33, 1225}1228.
Karrasch, B., Hoppe, H.G., 1991. Vertical distribution and activity of bacteria in the Central Arabian Sea. KielMeeresforsch. (Sonderh. ) 8, 74}80.
Knap, A., Michaels, A., Close, A., Ducklow, H., Dickson, A., (Eds.), 1996. Protocols for the Joint Global Ocean FluxStudy (JGOFS) Core Measurements. JGOFS Report No. 19, vi#170 pp. Reprint of the IOC Manuals and GuidesNo. 29, UNESCO 1994.
Latasa, M., Bidigare, R.R., Ondrusek, M.E., 1996. HPLC analysis of algal pigments: a comparison exerciseamong laboratories and recommendations for improved analytical performance. Marine Chemistry 51,315}324.
Lee, S., Fuhrman, J.A., 1987. Relationships between biovolume and biomass of naturally-derived marine bacterioplan-kton. Applied Environmental Microbiology 52, 1298}1303.
Marra, J., Dickey, T.D., Ho, C., Kinkade, C.S., Sigurdson, D.E., Weller, R.A., Barber, R.T., 1998. Variability inprimary production as observed from moored sensors in the central Arabian Sea in 1995. Deep-Sea Research II 45,2253}2268.
Monger, B.C., Landry, M.R., 1993. Flow cytometric analysis of marine bacteria with Hoechst 33342. Applied Environ-mental Microbiology 59, 905}911.
Morrison, J., Codispoti, L.A., Gaurin, S., Jones, B., Manghanani, V., Zheng, Z., 1998. Seasonal variations of hy-drographic and nutrient "elds during the US JGOFS Arabian Sea Process Study. Deep-Sea Research II 45,2053}2102.
Olson, D.B., Hitchcock, G.L., Fine, R.A., Warren, B.A., 1993. Maintenance of the low-oxygen layer in the central ArabianSea. Deep-Sea Research II 40, 673}685.
Pomroy, A., Joint, I., 1998. Bacterioplankton activity in the surface waters of the Arabian Sea during and after the 1994SW Monsoon. Deep-Sea Research II 46, 767}794.
Shiah, F.-K., Ducklow, H.W., 1997. Biochemical adaptations of bacterioplankton to changing environmental conditions:responses of leucine and thymidine incorporation to temperature and chlorophyll variations. Aquatic MicrobialEcology 13, 151}159.
Simon, M., Azam, F., 1989. Protein content and protein synthesis rates of planktonic marine bacteria. Marine EcologyProgress Series 51, 201}213.
Smith, D.C., Azam, F., 1992. A simple, economical method for measuring bacterial protein synthesis rates in seawaterusing 3H-leucine. Marine Microbial Food Webs 6, 107}114.
Smith, S.L., 25 Others, 1991. Arabian Sea Process Study. US Joint Global Ocean Flux Study Planning Report Number12. Woods Hole: US JGOFS Planning O$ce. xi#168 pp.
Smith, S.L., (Ed.), 1999. The 1994}1996 Arabian Sea Expedition: Oceanic Response to Monsoonal Forcing, Part 2.Deep-Sea Research II 46, 1531}1964.
Sorokin, Y.I., Kopylev, A.I., Mamaeva, N.V., 1985. Abundance and dynamics of the microplankton in the central tropicalIndian Ocean. Marine Ecology Progress Series 24, 27}41.
VanWeering, T.C.E., Helder,W., Schalk, P., 1997. The Netherlands Indian Ocean Expedition 1992}1993, "rst results andan introduction. Deep-Sea Research II 44, 1177}1193.
1322 H.W. Ducklow et al. / Deep-Sea Research II 48 (2001) 1303}1323

Wiebinga, C.J., Veldhuis, M.J.W., De Baar, H.J.W., 1997. Abundance and productivity of bacterioplankton in relation toseasonal upwelling in the northwest Indian Ocean. Deep-Sea Research I 44, 451}476.
Yoder, J.A., McClain, C.R., Feldman, G.C., Esaias, W.E., 1993. Annual cycles of phytoplankton chlorophyll concentra-tions in the global ocean: a satellite view. Global Biogeochemical Cycles 7, 181}193.
H.W. Ducklow et al. / Deep-Sea Research II 48 (2001) 1303}1323 1323