Microbial identification by mass cataloging
16
BioMed Central Page 1 of 16 (page number not for citation purposes) BMC Bioinformatics Open Access Research article Microbial identification by mass cataloging Zhengdong Zhang †1,2 , George W Jackson †3,4 , George E Fox 1,3 and Richard C Willson* 1,3 Address: 1 Department of Biology and Biochemistry, University of Houston, 4800 Calhoun Avenue, Houston, TX 77204-5001, USA, 2 Department of Molecular Biophysics and Biochemistry, Yale University, New Haven, CT 06520, USA, 3 Department of Chemical Engineering, University of Houston, 4800 Calhoun Avenue, Houston, TX 77204-4004, USA and 4 BioTex, Inc., 8058 El Rio St., Houston, TX 77054, USA Email: Zhengdong Zhang - [email protected]; George W Jackson - [email protected]; George E Fox - [email protected]; Richard C Willson* - [email protected] * Corresponding author †Equal contributors Abstract Background: The public availability of over 180,000 bacterial 16S ribosomal RNA (rRNA) sequences has facilitated microbial identification and classification using hybridization and other molecular approaches. In their usual format, such assays are based on the presence of unique subsequences in the target RNA and require a prior knowledge of what organisms are likely to be in a sample. They are thus limited in generality when analyzing an unknown sample. Herein, we demonstrate the utility of catalogs of masses to characterize the bacterial 16S rRNA(s) in any sample. Sample nucleic acids are digested with a nuclease of known specificity and the products characterized using mass spectrometry. The resulting catalogs of masses can subsequently be compared to the masses known to occur in previously-sequenced 16S rRNAs allowing organism identification. Alternatively, if the organism is not in the existing database, it will still be possible to determine its genetic affinity relative to the known organisms. Results: Ribonuclease T 1 and ribonuclease A digestion patterns were calculated for 1,921 complete 16S rRNAs. Oligoribonucleotides generated by RNase T 1 of length 9 and longer produce sufficient diversity of masses to be informative. In addition, individual fragments or combinations thereof can be used to recognize the presence of specific organisms in a complex sample. In this regard, 140 strains out of 1,921 organisms (7.3%) could be identified by the presence of a unique RNase T 1 -generated oligoribonucleotide mass. Combinations of just two and three oligoribonucleotide masses allowed 54% and 72% of the specific strains to be identified, respectively. An initial algorithm for recovering likely organisms present in complex samples is also described. Conclusion: The use of catalogs of compositions (masses) of characteristic oligoribonucleotides for microbial identification appears extremely promising. RNase T 1 is more useful than ribonuclease A in generating characteristic masses, though RNase A produces oligomers which are more readily distinguished due to the large mass difference between A and G. Identification of multiple species in mixtures is also feasible. Practical applicability of the method depends on high performance mass spectrometric determination, and/or use of methods that increase the one dalton (Da) mass difference between uracil and cytosine. Published: 08 March 2006 BMC Bioinformatics 2006, 7:117 doi:10.1186/1471-2105-7-117 Received: 18 October 2005 Accepted: 08 March 2006 This article is available from: http://www.biomedcentral.com/1471-2105/7/117 © 2006 Zhang et al; licensee BioMed Central Ltd. This is an Open Access article distributed under the terms of the Creative Commons Attribution License (http://creativecommons.org/licenses/by/2.0 ), which permits unrestricted use, distribution, and reproduction in any medium, provided the original work is properly cited.
Transcript of Microbial identification by mass cataloging

BioMed CentralBMC Bioinformatics
ss
Open AcceResearch articleMicrobial identification by mass catalogingZhengdong Zhang†1,2, George W Jackson†3,4, George E Fox1,3 and Richard C Willson*1,3Address: 1Department of Biology and Biochemistry, University of Houston, 4800 Calhoun Avenue, Houston, TX 77204-5001, USA, 2Department of Molecular Biophysics and Biochemistry, Yale University, New Haven, CT 06520, USA, 3Department of Chemical Engineering, University of Houston, 4800 Calhoun Avenue, Houston, TX 77204-4004, USA and 4BioTex, Inc., 8058 El Rio St., Houston, TX 77054, USA
Email: Zhengdong Zhang - [email protected]; George W Jackson - [email protected]; George E Fox - [email protected]; Richard C Willson* - [email protected]
* Corresponding author †Equal contributors
AbstractBackground: The public availability of over 180,000 bacterial 16S ribosomal RNA (rRNA)sequences has facilitated microbial identification and classification using hybridization and othermolecular approaches. In their usual format, such assays are based on the presence of uniquesubsequences in the target RNA and require a prior knowledge of what organisms are likely to bein a sample. They are thus limited in generality when analyzing an unknown sample.
Herein, we demonstrate the utility of catalogs of masses to characterize the bacterial 16S rRNA(s)in any sample. Sample nucleic acids are digested with a nuclease of known specificity and theproducts characterized using mass spectrometry. The resulting catalogs of masses can subsequentlybe compared to the masses known to occur in previously-sequenced 16S rRNAs allowing organismidentification. Alternatively, if the organism is not in the existing database, it will still be possible todetermine its genetic affinity relative to the known organisms.
Results: Ribonuclease T1 and ribonuclease A digestion patterns were calculated for 1,921complete 16S rRNAs. Oligoribonucleotides generated by RNase T1 of length 9 and longer producesufficient diversity of masses to be informative. In addition, individual fragments or combinationsthereof can be used to recognize the presence of specific organisms in a complex sample. In thisregard, 140 strains out of 1,921 organisms (7.3%) could be identified by the presence of a uniqueRNase T1-generated oligoribonucleotide mass. Combinations of just two and threeoligoribonucleotide masses allowed 54% and 72% of the specific strains to be identified,respectively. An initial algorithm for recovering likely organisms present in complex samples is alsodescribed.
Conclusion: The use of catalogs of compositions (masses) of characteristic oligoribonucleotidesfor microbial identification appears extremely promising. RNase T1 is more useful than ribonucleaseA in generating characteristic masses, though RNase A produces oligomers which are more readilydistinguished due to the large mass difference between A and G. Identification of multiple speciesin mixtures is also feasible. Practical applicability of the method depends on high performance massspectrometric determination, and/or use of methods that increase the one dalton (Da) massdifference between uracil and cytosine.
Published: 08 March 2006
BMC Bioinformatics 2006, 7:117 doi:10.1186/1471-2105-7-117
Received: 18 October 2005Accepted: 08 March 2006
This article is available from: http://www.biomedcentral.com/1471-2105/7/117
© 2006 Zhang et al; licensee BioMed Central Ltd.This is an Open Access article distributed under the terms of the Creative Commons Attribution License (http://creativecommons.org/licenses/by/2.0), which permits unrestricted use, distribution, and reproduction in any medium, provided the original work is properly cited.
Page 1 of 16(page number not for citation purposes)

BMC Bioinformatics 2006, 7:117 http://www.biomedcentral.com/1471-2105/7/117
BackgroundIn light of growing concern over increasing microbialresistance to antibiotics, bioterrorism, and the continuousemergence and re-emergence of infectious diseases [1,2],several government agencies have identified the develop-ment of new diagnostics as a key to maintaining thehealth of the U.S. population and the world as a whole [3-6]. Infectious diseases account for 26 percent of total glo-bal mortality [7] and are the third leading cause of deathin the United States [8,9]. In addition to microbial identi-fication for clinical response, diagnostics are also neededfor a wide range of applications including food and watersafety, bioreactor analysis and sterility assurance, andenvironmental microbiology. In some instances, e.g. along-term space mission, bioterror incident, or emergingdisease, it may be impossible to anticipate what the prob-lem organism(s) will be.
To this day, determinative bacteriology often relies on cul-ture-based methods involving time-consuming isolation,cultivation, and characterization of phenotypic traits ofthe culture. While in a few cases a rapid identification canbe made using phenotypic methods, the phylogenetic res-olution of such methods is usually quite low. Characteri-zation of cells based on morphology, staining, andmetabolic traits is often not discriminatory and can takedays to weeks for unambiguous identification [10,11].Some recent advances have been made using in vivophage-based detection mechanisms, however these sys-tems require precise culturing conditions that can affecttheir accuracy, and increased culture time opens the win-dow for contamination or selection [12]. Perhaps mostimportantly, many pathogens are extremely fastidious oreven uncultivable under laboratory conditions, so thatculture-based methods are not applicable. Finally, suchmethods are labor-intensive, not amenable to automa-tion, and require extensive "hands-on" time and interpre-tation by the trained microbiologist. In the "post-genome" era, molecular methods are rapidly supplantingphenotypic characterization.
Although a variety of approaches are in use, most currentmicrobial diagnostic research is focused on molecularmethods such as comparative sequencing of PCR-ampli-fied 16S ribosomal RNA genes (rDNA), hybridizationwith labeled probes or molecular beacons, phylogeneticmicroarrays, and reverse transcription of rRNA and ampli-fication (RT-PCR) used in conjunction with hybridizationprobes or sequencing [13-15]. Methods utilizing 16SrRNA are especially common because this molecule isnow widely used in the assignment of bacteria to specifictaxonomic groups, and partial or full sequences are avail-able from over 180,000 strains (as of RDP release 9.32,72,540 sequences are of length 1200 nt or more). Meth-ods that rely on hybridization are effective at leveraging
genomic information, but they typically face the signifi-cant drawback of requiring construction of one or moreprobes based on a priori knowledge of the genus or speciesthat needs to be detected.
Complete or partial genomic sequencing requires no suchpreliminary knowledge, but sequencing is time-consum-ing and labor-intensive. Several commercial kits are avail-able for microbial identification using complete 16SrDNA sequencing by standard PCR (with universally con-served primers) amplification of the 16S rDNA gene fol-lowed by chain-termination sequencing [16,17].However, read lengths are currently limited to about 500bases, so that full coverage of the approximately 1,542-nucleotide 16S rDNA gene, requires separate sequencingof the products of three PCR reactions.
In summary, a variety of molecular methods have beendeveloped for microbial identification. However, they aretypically limited in their generality by their requirementfor a priori knowledge of a putative characteristicsequence. Methods of full sequence determination aremore general, but are labor-intensive and not readily ame-nable to mixtures or quantitative comparisons. Bothsequencing and hybridization require a means for radioi-sotope- or fluorescence-labeling.
Sequence cataloging versus sequence comparisonBefore the development of modern DNA sequencingmethods, oligoribonucleotide cataloging was successfullyused to compare 16S rRNA sequences and determine rela-tionships between bacteria [18]. The essence of themethod was to fragment the RNA with ribonucleases, iso-late the resulting small digestion products, and individu-ally sequence each of them [19-22]. RNase T1 and RNaseA cleave 16S rRNA specifically on the 3'-side of G residuesand pyrimidine residues (C and U), respectively. Experi-mental fragmentation of the RNA with RNase T1 proved tobe especially informative, reliable, and reproducible. Theextent of similarity between organisms could be deducedby comparing the RNase T1 catalogs [23]. It was empiri-cally found that when comparing two catalogs, identitiesbetween oligoribonucleotides of length six and longerwere far more likely to be the result of sequence homologythan random chance [19,24]. Thus, sequences of allsmaller oligoribonucleotides were ignored in the compar-isons. Like actual sequences, such catalogs are additive toa database as they are generated. In addition, any newly-determined sequence can be deconstructed to a mass cat-alog and included in a comparison. It is appropriate topoint out that conceptually similar approaches are wellaccepted and have been used quite successfully in the fieldof proteomics – that is, partial enzymatic digestion andcomparison to a database of predicted masses [25-28].
Page 2 of 16(page number not for citation purposes)

BMC Bioinformatics 2006, 7:117 http://www.biomedcentral.com/1471-2105/7/117
Mass spectrometry for sequence characterizationDue to the aforementioned challenges, a number of meth-ods for sequence characterization using mass spectromet-ric analysis have been proposed as alternatives tohybridization or full sequencing [29-33]. MALDI-TOF(matrix-assisted laser desorption ionization time-of-flight) mass spectrometry is a method of choice for meas-uring the masses of oligoribonucleotides, especially mix-tures thereof. The MALDI ionization process results fromabsorption of laser excitation light by an aromatic organicacid and transfer of that energy to the co-crystallized ana-lyte. Once ionized, the desorbed plume of matrix and ana-lyte is accelerated in a vacuum through a long flight tubeto a "time-of-flight" detector. The time of flight is propor-tional (subject to correction factors) to the square root ofthe mass-to-charge ratio. Because "soft-ionization" tech-niques such as MALDI provide a direct means of measur-ing one of the fundamental properties of biomolecules,they have recently been widely used for novel analyticalassays. Mass spectrometric characterization of nucleicacids has been used in a variety of applications includinganalysis of single nucleotide polymorphisms (SNPs), anddideoxy sequencing [34,35]. When MALDI of nucleicacids first became practicable, it was quickly seen as a pos-sible substitute for nucleic acid sequencers due to therapidity of the separation versus capillary or gel electro-phoresis. This led to most groups treating the MALDI-TOFmass spectrometer as a chain-termination (Sanger con-cept) sequencer. That is, nested di-deoxy chain terminatedfragments were separated in the mass spectrometer andthe sequence directly read from the spectrum. At present,however, the maximum read length using such anapproach is ~56 nucleotides [31].
Compositional characterizationBecause of this limitation on read-length, a compromisebetween information loss and speed (provided by rapidmass spectrometry) has been reached. For discriminationof organisms based upon compositional informationalone, either extremely accurate mass measurement of alarge sequence region is necessary, or less precise measure-ment of multiple informative fragments is required. Forexample, Ecker et al. have employed electrospray ioniza-tion (ESI) mass spectrometry in conjunction with Fouriertransform ion cyclotron resonance (FTICR) to successfullytype strains of Group A streptococci and were able to dis-tinguish them from commensal organisms [36,37]. PCRproducts are obtainable for a broad range of organismsusing universally conserved primers and mismatch-toler-ant reaction conditions. The PCR products (80–140 bp)are then analyzed for their total base compositions, i.e.AwCxGyTz. Unfortunately, the very high resolutionrequired for unambiguous compositional assignment (± 1ppm) of such a large molecule requires elaborate instru-mentation which is out of reach for many laboratories. In
contrast, the more common approach has been to gener-ate base-specific fragments of single-stranded DNA orRNA. That is, a single-stranded sequence is cleaved afterevery occurrence of a particular base generating multiplefragments of smaller mass.
Herein we examine the possibility of using mass spec-trometry to generate catalogs of rRNA fragment composi-tions (masses) as a tool for rapid microbial identification.MALDI generates singly-charged ions and is widelyregarded as the mass spectrometric technology mostapplicable to analyzing the types of mixtures generated bynucleic acid fragmentation. In fact, the experimental feasi-bility of using a fragmentation strategy in combinationwith MALDI has already been established. Hahner et al.have described endoribonuclease digestion for the gener-ation of RNase T1 fragments and MALDI characterization[38]. Hartmer et al. modified the approach and applied itto discovery of SNPs and identification of bacteria using16S rRNA regions [39]. Von Wintzingerode et al. showedMALDI of base-specific fragmentation patterns of 16SrDNA amplicons to be a viable method for microbialidentification and compared experimental to predictedmasses for Bordetella species [40]. More recently Lefmannet al. have used base-specific cleavage to discriminatemycobacteria [41].
To our knowledge, no systematic calculations have beenperformed to assess the absolute identifying power orphylogenetic classifying utility of MALDI-MS whenapplied to RNase T1 or RNase A-generated fragments froma large 16S rRNA sequence dataset.
Hypothesis and underlying issuesWe hypothesized that there is sufficient discriminatorypower in base-specific rRNA fragment compositions alonefor identification of known and previously-unknownorganisms. Moreover, the simultaneous presence of justone to three characteristic compositions may be used forunambiguous identification of many organisms, even in acomplex mixture. In order to investigate the occurrence ofidentifying compositions in a large dataset, we performedcomputational, base-specific fragmentations of a largenumber of 16S rRNA sequences and investigated the iden-tifying power of the fragments as distributed among theorganisms. Using these results, we developed a programfor simulation of MALDI-TOF mass spectrometric identi-fication of organisms selected from the oligoribonucle-otide fragment libraries.
Preliminary issues involving genetic alphabet, informa-tion degeneracy, isotopes, and instrument resolution wereconsidered. With regard to alphabet, obvious considera-tions are whether DNA or RNA will be used and whetherthe fragments observed will be single or double-stranded.
Page 3 of 16(page number not for citation purposes)

BMC Bioinformatics 2006, 7:117 http://www.biomedcentral.com/1471-2105/7/117
In nature, mass-modified nucleotides are occasionallypresent in both DNA and RNA. However, post-transcrip-tionally modified nucleotides in ribosomal RNA are few.Large fragments containing them are rare, and they aretypically universal to large groupings of bacteria. Wetherefore know what specific modification-producedmasses to discount [42]. Finally, they are absent from invitro runoff and amplification products. Thus, it is onlynecessary to consider the usual four-letter alphabets (A, C,G, and T, or A, C, G, and U).
Compared to the traditional catalogs of oligoribonucle-otide sequences, a catalog of fragment masses suffers fromdegeneracy due to the fact that multiple distinct permutedsequences generated by RNase digestion, e.g. AUCCG andUACCG, have the same composition and hence the samemass. This many-to-one relationship results in a loss ofinformation potentially useful for microbial identifica-tion. For RNA targets, this problem is exacerbated by thesmall (one dalton) mass difference between C and U, rais-ing the question of whether it is possible to distinguishRNase T1 oligomers differing only in the number of C'sand U's.
Unequivocal determination of oligoribonucleotide com-position based on mass alone is obviously dependent onthe resolution and accuracy of the mass spectrometer.Koomen et al. have published an extensive review of therequirements for accurately determining oligonucleotidecompositions from measured mass [43]. They determinedthat theoretically, all monoisotopic compositions of DNAup to 13 mers could be accurately assigned at 5 ppm massaccuracy or better. Operating in reflectron mode, employ-ing proper sample preparation techniques, and includinginternal calibration standards, they were able to obtain 6ppm or better accuracy on samples ranging from 5 to 13mers. An accuracy of 6 ppm, for example, would allowassignment to within 0.0234 Da at 3900 Da, allowing dis-crimination of a U to C difference in composition in a50%-purine oligoribonucleotide of length ca. 13. MALDI-TOF mass spectrometry operated in linear mode with noadded internal standards is a lower resolution, lower accu-racy technique, typically yielding resolution of m/∆m of500 – 1000 and accuracy of 0.05 – 0.1% (500 – 1000ppm) [43]. To illustrate, at an accuracy of 1000 ppm on5000 Da (roughly the mass of a single-stranded 16-mer) acompositional assignment may be in error by 5 Da. Thissuggests that, though any substitution involving a purineis readily detectable, up to five substitutions of U for C orvice-versa might be indistinguishable within this hypo-thetical 16-mer. To address this issue experimentally,studies relying on 16S rRNA RNase T1 fragments willeither need to be done at the highest accuracy and resolu-tion routinely attainable or an alternative protocol will beneeded wherein the mass distinction between C and U is
enhanced. Alternatively, a statistical approach based onthe simultaneous observation of multiple mass-fragmentsobserved in combination may be able to unambiguouslyidentify a microorganism even if the C/U distinction isnot readily made. Oligoribonucleotides generated byRNase A will internally contain only G and A, which arereadily distinguished and hence would not present aproblem.
A core question that faced the original RNase T1 fragmentcataloging approach was the oligoribonucleotide lengthat which a match between two organisms reflected actualsequence similarity as opposed to a chance occurrence.The number of fragments that exist for any length, n,increases as 4n. RNase T1 oligoribonucleotide digestionproducts, however, always contain a single G at the 3' endof the sequence and no internal Gs. Hence, the number ofpossible products is 3(n-1), which for length six is 243products (in contrast to 46 = 4096 possible 6-mers). Thisis significantly larger than the number of 6-mers gener-ated by digestion of any single 16S rRNA and hence anidentical match of 6-mers (or any longer fragments)between two 16S rRNAs is likely to reflect actual sequenceidentity rather than chance. This result was borne out bysubsequent examination of complete sequences. How-ever, the number of different mass compositions is signif-icantly less than the number of unique sequences. It isdetermined by the number of 4 elements chosen n at atime with replacement:
where ! denotes factorial [44]. For instance, the number ofunique compositions for the complete set of possible 10mers is 13!/(10! × 3!) or 286, which is much less than the410 = 1,048,576 unique sequences. Because an RNase T1oligoribonucleotide will always end in G, the number ofpossible compositions of length n can be expressed as:
where n is still the full length of the oligoribonucleotide.RNase A fragments will end in either U or C and containonly preceding internal A's or G's. The number of possiblecompositions (not sequences) in this case can beexpressed as:
ResultsMass cataloging of bacterial 16S RNA oligoribonucleotides16S rRNA sequences from 7,322 bacterial organisms wereobtained from RDP Release 7.1; 1,921 16S rRNA
44 1 3
3
3 choose n with replacement( )
( )!
! !
(=+ −
= + = +n
nn
n
n ))( )( ),
n n+ + ( )2 1
61
( )!
( )! !
( ),
n
n
n n+−
= + ( )1
1 2
1
22
21
2 3n
nn
!( )!−
= ( )
Page 4 of 16(page number not for citation purposes)

BMC Bioinformatics 2006, 7:117 http://www.biomedcentral.com/1471-2105/7/117
sequences met the selection criteria for length and quality(see Methods) and were used to generate endoribonucle-ase digestion products.
Table 1 gives summary statistics of complete endoribonu-clease digestions of the 1,921 selected 16S rRNAs. SinceRNase T1 cuts 16S rRNA less frequently than RNase A, asmaller number of oligoribonucleotides with a greateraverage length are generated. These longer oligoribonucle-
Table 1: Comparison between RNase T1 and RNase A 16S rRNA catalogs. See Supplementary Table for more details.
Enzyme Attributes of the oligoribonucleotide catalog†
Length Range Total Oligos Distinct Oligos Distinct Masses Avg. Oligo Seqs per 16S
Avg. Masses per 16S
Without isotopes:RNase T1 1 – 54 898,494 8,601 858 128 77RNase A 1 – 21 1,225,481 1,994 227 81 50
With isotopes (see Methods):RNase T1 1 – 54 898,494 8,601 2,404 128 159RNase A 1 – 21 1,225,481 1,994 644 81 88
† The columns are:Length Range: the minimum and maximum length of oligoribonucleotides in catalogs.Total Oligos: the number of all oligoribonucleotides generated by complete RNase digestion.Distinct Oligos: the number of different oligoribonucleotide sequences in the catalogs.Distinct Masses: the number of different oligoribonucleotide masses in the catalogs.Avg. Oligos per 16S: the average number of different oligoribonucleotide sequences generated by every 16S rRNA RNase digestion.Avg. Masses per 16S: the average number of different oligoribonucleotide masses generated by every 16S rRNA RNase digestion.
Population distributions of 16S rRNA RNase digestion products of different lengthsFigure 1Population distributions of 16S rRNA RNase digestion products of different lengths. Oligoribonucleotides were generated by RNase T1 and RNase A digestion of 16S rRNA from 1,921 organisms. Numbers of RNase T1 and RNase A frag-ments are shown in white and gray, respectively.
0
100
200
300
400
500
600
1 2 3 4 5 6 7 8 9 10 11 12 13 14 15 16 17 18 19 20 21
Oligoribonucleotide length
Olig
oribonucle
otide c
ount
(x10
3) RNase T1
RNase A
Page 5 of 16(page number not for citation purposes)

BMC Bioinformatics 2006, 7:117 http://www.biomedcentral.com/1471-2105/7/117
otides have more unique sequences and accordinglypotentially unique masses. As a result, a mass catalog gen-erated with RNase T1 digestion is more informative andthus more useful for bacterial identification than anRNase A catalog. Isotopic distributions of fragmentmasses were also calculated. In this calculation only iso-topes of carbon and oxygen were considered and onlypeaks of more than 50% maximum relative intensity werecataloged (see Methods, pg 32). Table 1 also shows, asexpected, that inclusion of isotopic elements increases thenumber of masses in the catalogs without changing thenumber of distinct oligoribonucleotide alphabetic com-positions.
In terms of distinct sequences, the oligoribonucleotidepopulation distributions of digestion products of differ-ent lengths (Figure 1) are similar for the two enzymes. Thetotal number of digestion products produced is at maxi-mum for mononucleotides (many copies of each mono-nucleotide are produced) and a gradual decrease isobserved as length increases. Less than 1% of the oligori-bonucleotides produced by RNase T1 contain more than12 bases, and less than 1% of RNase A-generated oligori-bonucleotides are longer than 8-mers. Although the oli-goribonucleotide mass distributions of digestion products
of different lengths are also similar for the two enzymes,they are markedly different from both the sequence pop-ulation distributions (Figure 1) and the predicted numberof possible compositions. Referring to Figure 2, in themass catalogs resulting from RNase T1 or RNase A diges-tion of a typical 16S rRNA sequence, the number of dis-tinct oligoribonucleotide masses initially increases as theoligoribonucleotide length increases, peaks around 14-mers, and then gradually decreases as the length increasesfurther. In contrast, the overall trend of the mass countsbased on theoretical composition is to increase with theoligoribonucleotide length.
At small oligonucleotide lengths, the number of predictedRNase (both A and T1) generated oligoribonucleotidesderived from the average organism greatly exceeds thenumber of possible compositions for that oligoribonucle-otide length, such that nearly all catalogs will be similar,and nearly complete. As can be seen from SupplementaryTable 1, Sections III and IV [see Additional file 1], whichtake into account all isotopes above a 50% maximumintensity (see Methods), the 6-mers represent an impor-tant "cross-over" point for RNase T1 digestion. (Column F,sections I and II tabulate possible monoisotopic masses,while column F, sections III and IV tabulate the number
Comparison of numbers of unique polyisotopic oligoribonucleotide masses actually occurring in digests of 16S rRNA versus possible massesFigure 2Comparison of numbers of unique polyisotopic oligoribonucleotide masses actually occurring in digests of 16S rRNA versus possible masses. The number of unique polyisotopic oligoribonucleotide masses in the actual RNase T1 and A catalogs are presented. The unique polyisotopic oligoribonucleotide masses in the theoretical sets are calculated from all pos-sible RNase T1 and RNase A oligos and with consideration for the natural isotopic distribution. Only carbon and oxygen iso-topes and the resultant oligoribonucleotide masses above a 50% maximum relative intensity are considered. The counts of RNase T1-generated oligoribonucleotide more than 26 nt long are not shown.
0
50
100
150
200
250
300
0 5 10 15 20 25 30
Oligoribonucleotide length
Uniq
ue m
ass c
ount
Actual 16S rRNA RNase T1 catalog
Theoretical RNase T1 oligo set
Actual 16S rRNA RNase A catalog
Theoretical RNase A oligo set
Page 6 of 16(page number not for citation purposes)

BMC Bioinformatics 2006, 7:117 http://www.biomedcentral.com/1471-2105/7/117
of all possible distinct isotopic masses). On average, therewill be less 6-mer (or larger) oligoribonucleotidesobserved in a 16S rRNA digest than there are possiblecompositions. Specifically, in a RNase T1 digest of an aver-age organism's 16S rRNA, one would observe 19 6-merswhile there are 42 possible isotopic masses, and the pres-ence of particular oligoribonucleotide masses is thereforeinformative. For RNase A digestion, the turning point alsooccurs at 6-mers with 15 observed and 24 different possi-ble isotopic masses. Longer fragments are even more dis-tinguishing (Supplementary Table 1, column G) [seeAdditional file 1]. For example, the 9-mers representanother magnitude in discrimination with only one in tenpredicted to occur. That is, it is an order of magnitudemore likely that a matching-composition 9-mer sharedbetween two organisms represents true underlyingsequence identity than random chance. The 1-in-100level, at which one would expect to observe less than 1%of possible compositions from the average organism,occurs for 12-mers in both the RNase A and the RNase T1catalog. Detection of these and longer oligoribonucle-otides is therefore highly informative.
The identifying power of the method is greatly enhancedby considering conjunctions of multiple detections, e.g.the odds of observing both a specific 11-mer and a specific12-mer composition in a single digest. Referring to Sup-plemental Table 1, section III (which takes into accountisotopic distribution) [see Additional file 1], for RNase T1generated 11- and 12-mers, this should be approximately0.018 × 0.007 or 1 in 7,936, which is more than the totalnumber of organisms under consideration (1,921). Thisillustrates the oligonucleotide lengths which give usefuldiscrimination even under the degeneracy that resultsfrom measuring composition (mass) instead of sequence.We have therefore identified a critical informative oligor-ibonucleotide length, the "1-in-10 level", reached atlength 9 for both RNase T1 and RNase A. Shorter oligori-bonucleotides are so commonly produced as to be rela-tively uninformative, and so only masses exceedingapproximately 3,000 Da need to be considered. Further-more, as shown in Figure 1, very few oligoribonucleotideslonger than 20-mers will result from a complete digestion.Therefore, the mass-range of interest is from 3,000 to6,000 Da. This mass-range is in stark contrast to otherapproaches that require unambiguous determination of
Table 2: Examples of organisms that can be identified by the observation of one, two, or three RNase T1-generated 16S rRNA masses.
I II III
Camplyobacter helveticus NCTC 12470
Y - -
Chlamydophila pneumoniae, str. TW-183
N Y -
Chlamydia muridarum N Y -Chlamydia suis, str. S45 N Y -Chlamydia trachomatis, str. HAR-13 N Y -Clostridium botulinum
str. KYT0-F N Y -str. NCA 213 B ATCC 7949 N Y -str. 2023 ATCC 17851 N Y -str. Eklund 202 F ATCC 23387 N N Ystr. Eklund 17B ATCC 25765 N Y -Langeland NCTC 10281 N Y -NCTC 7272 N Y -NCTC 7273 N N Ystr. 468 toxin type C N Y -
Escherichia coli N Y -Francisella tularensis Y - -Mycobacterium tuberculosis N N YMycobacterium tuberculosis, str. H37/Rv
N Y -
Staphylococcus sciuri ATCC 20345 N Y -Vibrio chelerae, str. 1094 ATCC 14035
N Y -
Vibrio proteolyticus N Y -
A 'Y' in column I indicates that a uniquely identifying RNase T1 oligoribonucleotide composition was found that was not present in any of the other 1,920 organisms sampled. A 'Y' in Column II or III indicates that two or three masses respectively were found that when taken together are uniquely identifying. An "N" indicates that the calculation did not yield a one, two, or three peak signature. "-" indicates that further determinations were not necessary.
Page 7 of 16(page number not for citation purposes)

BMC Bioinformatics 2006, 7:117 http://www.biomedcentral.com/1471-2105/7/117
the masses of much large nucleic acids (PCR products oreven restriction digest products)
In accordance with earlier results of oligoribonucleotidesequence cataloging [20,22], catalogs of all the massesabove these thresholds that are produced by digestion ofa particular 16S rRNA will cumulatively define essentiallyany organism. Since the masses of interest can be deter-mined either experimentally for an unknown organism orby analysis of a known 16S rRNA sequence, such mass cat-alogs can be used to determine the genetic affinity (that is,phylogenetic position based on well established 16SrRNA sequence similarity) of any unknown organismwithin the context of all known 16S rRNA sequences.Such mass catalogs would primarily be constructed usingpure or nearly pure cultures, but they would also be usefulin identifying organisms in mixtures.
Recognition of target organisms by characteristic peaksIn many practical applications, the problem will be todetermine whether a particular organism or group oforganisms is present in a complex sample. In this case,rather than seeking all the masses in the spectrum thattogether characterize the organism of concern, the betterapproach may be to seek specific masses that are essen-tially unique to that organism or a particular phylogeneticgroups of organisms. Since different molecular masses ofthe 16S rRNA fragments correspond to different peaks inthe spectrum, every bacterium potentially has a signaturepeak or set of signature peaks by which it can be uniquelyidentified. Even if the mass-range of interest is broadenedto include all 6-mers and above, as we provide motivationhere, the range of ~1,800 to 6,000 Da (6- to 20-mers) isrelatively narrow and well within the necessary capabili-ties of current instrumentation for discrimination of alarge number of organisms.
RNase T1 and RNase A digestions of prokaryotic 16SrRNAs are not equally informative for characteristic-peakidentification. For example, 140 (7.3%) of the 1,921prokaryotes under consideration can be uniquely identi-fied by a single RNase T1-generated oligoribonucleotidemass while only 27 (1.4%) can be identified by uniquemasses generated by the RNase A. The superiority ofRNase T1 catalog stems from the higher specificity ofRNase T1. Similarly, significantly more bacteria can beuniquely identified by using multiple molecular weightsof the RNase T1-generated oligoribonucleotides together:1,027 (53.5%) by double peaks and 1392 (72%) by triplepeaks. Table 2 shows a representative sampling of theorganisms that may be identified by the observation ofjust one to three characteristic masses generated by RNaseT1 digestion. For example, Camplyobacter helveticus NCTC12470 and Francisella tularensis can be uniquely distin-guished by at least one RNase T1 oligoribonucleotide from
the other 1,920 organisms sampled, and thus in theorymore oligoribonucleotides are not needed to identifythem. Mycobacterium tuberculosis does not have an RNaseT1 oligoribonucleotide or a combination of two of themthat can be used to uniquely distinguish it from other1,920 organisms sampled. However, a unique combina-tion of three RNase T1 oligoribonucleotides can be usedfor unambiguous identification.
Identification of dominant bacteria in mixtures – effects of mass resolutionAlthough environmental samples contain numerousorganisms, in many cases there are likely to be only amodest number of organisms that are dominant and met-abolically-active enough to contribute a large fraction ofthe rRNA present. A mass spectrum of a total 16S rRNAsample isolated from such an environment will oftenyield a modest number of dominant peaks standing outfrom a large number of background peaks when digestedwith a ribonuclease. While direct mass spectrometric anal-ysis of the total RNA of such a sample might yield quanti-tative information (at least in relative terms) aboutmetabolic activity, the sensitivity of current MALDI instru-ments generally requires pre-amplification by PCR. Mostcommonly this has been followed by transcriptional run-off (and thereby further amplification) by phage polymer-ases (e.g. T7, SP6, or T3) and a return to the manipulationof RNA. Universally conserved primers would beemployed to amplify the total rDNA population. In the-ory, so long as little bias is introduced by the PCR, thefinal RNA concentrations should reflect the originalgenomic DNA population in the mixture. This, however,may not be reflective of the metabolic activity (number ofribosomes) of the population. One solution would be toemploy "linear" RNA amplification commonly used ingene-expression microarray protocols [45]. The practicalconsiderations of DNA or RNA amplification may there-fore represent an important difference in systemsdesigned for identification (detectors) versus metabolicmonitoring. Regardless of amplification steps, withoutadditional sample preparation (see Discussion) or organ-ism-specific PCR (recall the limitations of organism-spe-cific hybridization probing), most observed spectra willbe derived from more than one organism.
Computer simulations with different input sequenceswere used to test the effectiveness of mass cataloging inrecovering the identity of the dominant species in suchmixed samples. The assumption here is that the 16S rRNAsequences of these major organisms or their close relativeswill already be in the 16S rRNA sequence database, whichnow exceeds 180,000 strains [46].
First, 16S rRNA sequences of four organisms – Acidiphil-ium sp. strain C-1 (Acdp. spC1), Mycoplasma sturni, strain
Page 8 of 16(page number not for citation purposes)
BMC Bioinformatics 2006, 7:117 http://www.biomedcentral.com/1471-2105/7/117
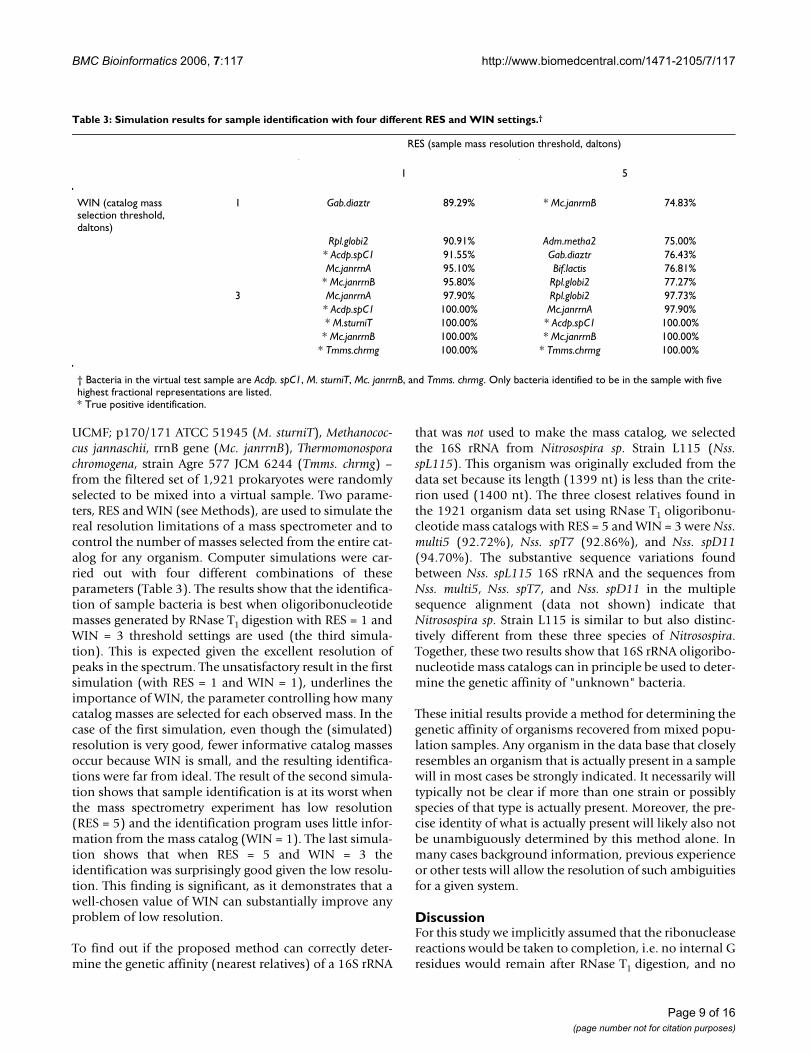
UCMF; p170/171 ATCC 51945 (M. sturniT), Methanococ-cus jannaschii, rrnB gene (Mc. janrrnB), Thermomonosporachromogena, strain Agre 577 JCM 6244 (Tmms. chrmg) –from the filtered set of 1,921 prokaryotes were randomlyselected to be mixed into a virtual sample. Two parame-ters, RES and WIN (see Methods), are used to simulate thereal resolution limitations of a mass spectrometer and tocontrol the number of masses selected from the entire cat-alog for any organism. Computer simulations were car-ried out with four different combinations of theseparameters (Table 3). The results show that the identifica-tion of sample bacteria is best when oligoribonucleotidemasses generated by RNase T1 digestion with RES = 1 andWIN = 3 threshold settings are used (the third simula-tion). This is expected given the excellent resolution ofpeaks in the spectrum. The unsatisfactory result in the firstsimulation (with RES = 1 and WIN = 1), underlines theimportance of WIN, the parameter controlling how manycatalog masses are selected for each observed mass. In thecase of the first simulation, even though the (simulated)resolution is very good, fewer informative catalog massesoccur because WIN is small, and the resulting identifica-tions were far from ideal. The result of the second simula-tion shows that sample identification is at its worst whenthe mass spectrometry experiment has low resolution(RES = 5) and the identification program uses little infor-mation from the mass catalog (WIN = 1). The last simula-tion shows that when RES = 5 and WIN = 3 theidentification was surprisingly good given the low resolu-tion. This finding is significant, as it demonstrates that awell-chosen value of WIN can substantially improve anyproblem of low resolution.
To find out if the proposed method can correctly deter-mine the genetic affinity (nearest relatives) of a 16S rRNA
that was not used to make the mass catalog, we selectedthe 16S rRNA from Nitrosospira sp. Strain L115 (Nss.spL115). This organism was originally excluded from thedata set because its length (1399 nt) is less than the crite-rion used (1400 nt). The three closest relatives found inthe 1921 organism data set using RNase T1 oligoribonu-cleotide mass catalogs with RES = 5 and WIN = 3 were Nss.multi5 (92.72%), Nss. spT7 (92.86%), and Nss. spD11(94.70%). The substantive sequence variations foundbetween Nss. spL115 16S rRNA and the sequences fromNss. multi5, Nss. spT7, and Nss. spD11 in the multiplesequence alignment (data not shown) indicate thatNitrosospira sp. Strain L115 is similar to but also distinc-tively different from these three species of Nitrosospira.Together, these two results show that 16S rRNA oligoribo-nucleotide mass catalogs can in principle be used to deter-mine the genetic affinity of "unknown" bacteria.
These initial results provide a method for determining thegenetic affinity of organisms recovered from mixed popu-lation samples. Any organism in the data base that closelyresembles an organism that is actually present in a samplewill in most cases be strongly indicated. It necessarily willtypically not be clear if more than one strain or possiblyspecies of that type is actually present. Moreover, the pre-cise identity of what is actually present will likely also notbe unambiguously determined by this method alone. Inmany cases background information, previous experienceor other tests will allow the resolution of such ambiguitiesfor a given system.
DiscussionFor this study we implicitly assumed that the ribonucleasereactions would be taken to completion, i.e. no internal Gresidues would remain after RNase T1 digestion, and no
Table 3: Simulation results for sample identification with four different RES and WIN settings.†
RES (sample mass resolution threshold, daltons)
1 5
WIN (catalog mass selection threshold, daltons)
1 Gab.diaztr 89.29% * Mc.janrrnB 74.83%
Rpl.globi2 90.91% Adm.metha2 75.00%* Acdp.spC1 91.55% Gab.diaztr 76.43%Mc.janrrnA 95.10% Bif.lactis 76.81%
* Mc.janrrnB 95.80% Rpl.globi2 77.27%3 Mc.janrrnA 97.90% Rpl.globi2 97.73%
* Acdp.spC1 100.00% Mc.janrrnA 97.90%* M.sturniT 100.00% * Acdp.spC1 100.00%* Mc.janrrnB 100.00% * Mc.janrrnB 100.00%
* Tmms.chrmg 100.00% * Tmms.chrmg 100.00%
† Bacteria in the virtual test sample are Acdp. spC1, M. sturniT, Mc. janrrnB, and Tmms. chrmg. Only bacteria identified to be in the sample with five highest fractional representations are listed.* True positive identification.
Page 9 of 16(page number not for citation purposes)

BMC Bioinformatics 2006, 7:117 http://www.biomedcentral.com/1471-2105/7/117
internal pyrimidines remain after RNase A treatment. Inprinciple, ribosomal RNA structure might protect certainregions from complete ribonuclease digestion withoutdenaturation, but in practice incomplete digestion wasnever a problem with the original experimental 16S rRNAcataloging procedure. If incomplete digestion were aproblem it might be readily dealt with by increasedenzyme concentration, reaction times, and addition ofmild denaturants and/or heat to improve the yield of thecomplete products.
Although approximately 1% of bases in the naturallyoccurring 16S rRNA are known to be post-transcription-ally modified [47] and therefore have unexpected masses,the possible presence of such modified nucleotides wasnot considered here, for two reasons. First, it is knownthat very few modifications occur in the larger RNase frag-ments (length 9 or more). In addition, since the fragmentsthat contain the modifications and the modification itselfare typically highly conserved, it would be straightforwardto identify them and make the needed mass adjustment.Also, because in vitro transcription is likely be used to gen-erate sufficient 16S rRNA to meet the sensitivity limits ofcontemporary MALDI instruments the actual samples willnot contain the biological modifications.
Although it has already been shown that sufficient ribos-omal RNA can be isolated for direct enzymatic manipula-tion and detection in a MALDI instrument [48], the utilityof mass spectrometry in characterizing 16S rRNA wouldbe greatly improved if one could more readily distinguishcytosine and uracil, which have very similar masses. Thishas typically been accomplished by first converting themixture of 16S rRNAs in a sample to DNA templates byamplification and then using T7 runoff transcription tosynthesize a larger quantity of a highly purified RNA witha nonstandard mass-modifying base [39,49]. If the mass-modification is at the 2' position, e.g. deoxyuracil insteadof uracil, it increases the stability of the fragments pro-duced and makes cleavage with RNase A monospecific.This would result in many additional and valuable uniquemasses of length 9 or more in the RNase A catalog. Incor-poration of 2'-modified bases is accomplished through acommercially available mutant RNA polymerase (R&DNApolymerase, Epicenter) that can incorporate various non-canonical 2'-ribonucleotides composed of rNMPs (ribo-nucleotide-monophosphates), dNMPs (deoxyribonucle-otide-monophosphates), modified 2'-NMPs or of mixeddNMP/rNMP or 2'-modified-NMP/rNMP compositions[50,51].
While this approach is certainly beneficial, the ideal base-specific fragments would have no remaining internalribose moieties such that the final products would be sta-ble against further non-specific cleavage or hydrolysis. In
our hands, substituting more than one dNTP or 2'-modi-fied NTP substrate for the natural rNTPs in the transcrip-tion reaction has so far resulted in insufficient yield toobtain a good MALDI-TOF signal to noise ratio or fulllength transcripts are not obtained, complicating the spec-tra. Another solution might be to employ a mutant DNApolymerase capable of incorporation of a single RNA base[52-54]. Finally, run-off transcription using amino-allyl U(aaU) is well known and has been used by us and othersfor incorporation of a reactive site for fluorescent labeling.Because the aminoallyl group is not a "bulky" modifica-tion (∆m = 55.08 Da), aaUTP can be completely substi-tuted for standard UTP in a transcription reaction withfull-length product still being obtained. The standard frag-ments in a RNase T1-digest of natural E. coli 16S rRNA hadnearest mass neighbors of 0.985 Da (the U/C difference inmass) while the amino-allyl modified fragments hadnearest neighbors of 8.013 Da apart. That is, the mass-modification has the effect of expanding the mass spec-trum. Before modification, the E. coli masses of interestranged from 1938.17 – 4502.72 Da, and after aaU substi-tution the corresponding oligoribonucleotides hadmasses in the range 1993.25 – 5349.42 Da. Thus, whileabsolute mass did not increase greatly (which would be adetriment to resolution) nearest-neighboring peaks aredistanced from one another by over 8 Da. Our simula-tions using amino-allyl U mass modification effectivelyresult in resolution at three residues instead of two as iscurrently the case with RNase T1 and naturally occurringbases. Alternative strategies of making the C/U distinctionsuch as the use 2'-methyl C and RNase A, for example,would result in the same level of alphabetic resolution.
If two cleavage reactions are used at the same time theeffect is to drastically reduce the information content aseach fragment produced in one reaction is further cleavedby the second. Two cleavage reactions could conceivablybe performed in parallel and the results merged. We haveeffectively simulated that by exploring separate results forRNAse T1, RNAse A and the amino-allyl U incorporationfor enhanced C/U distinction. So instead of examining thenumber of organisms that can be identified by using 1, 2,3 masses etc. from a single digestion one could insteadchoose masses from a larger catalog of masses. The mainadvantage would be the availability of a larger number ofdiscriminating masses to choose from.
Since PCR and T7 transcription may fail to amplify 16SrRNA completely, we investigated the minimum length oftruncated 16S rRNA that can still be identified by thismass spectrometry approach. For this purpose, 16S rRNAof Nitrosospira sp. Strain L115 was truncated from its 5' endand 3' end separately, 10 nt a time up to 89 times – thus,the shortest truncated 16S rRNA is 509 nt long with 890nt lost from either end. Identification of each truncated
Page 10 of 16(page number not for citation purposes)

BMC Bioinformatics 2006, 7:117 http://www.biomedcentral.com/1471-2105/7/117
Page 11 of 16(page number not for citation purposes)
Identification rank and representation of truncated 16S rRNA from Nss. spL115 with 16S sequence truncated from the 5'-endFigure 3Identification rank and representation of truncated 16S rRNA from Nss. spL115 with 16S sequence truncated from the 5'-end. 16S rRNA of Nitrosospira sp. Strain L115 was truncated from its 5' end 10 nt a time for 89 times. Identifica-tion of each truncated 16S rRNA was simulated, with RES = 5, WIN = 3, and isotopic masses in RNase T1 catalog. The solid line is the identification rank, with the primary y-axis on the left. Rank 0 means one of the three Nitrosospira (Nss. multi5, Nss. spT7, and Nss. spD11) in the catalog is ranked as the highest-fractional representation bacterium in the sample. Rank -1 means one of the three Nitrosospira in the catalog is ranked as the second most represented bacterium in the sample, and so on. The dashed line is the fractional representation of the highest ranked Nitrosospira in the catalog, with the secondary y-axis on the right.
0 20 40 60 80
−14
−12
−10
−8
−6
−4
−2
0
5’−terminal truncation (x10 bp)
Iden
tific
atio
n ra
nk
4050
6070
8090
100
Fra
ctio
nal r
epre
sent
atio
n (%
)

BMC Bioinformatics 2006, 7:117 http://www.biomedcentral.com/1471-2105/7/117
16S rRNA was subsequently simulated. The results (Figure3 and 4) show that after 880 nt were truncated from the5'-end (519 nt left), or up to 700 nt truncated from the 3'-end (699 nt left), the proper close relatives could still beidentified, although with a fractional representation (50–60%). In both cases, the representation decreased linearlyas the truncation increased. The linearity of the decreasereflects the uniform distribution of characteristic oligori-bonucleotides in 16S rRNAs.
Von Wintzingerode et al. [40] have previously argued thatbase-specific fragments from full-length 16S rDNA (orrRNA) would "crowd" real spectra making them too diffi-cult to interpret. If this in fact proves to be the case, it isfortunate that several highly-conserved regions in 16Sexist that will allow the 16S sequence to be divided intoseveral amplicons, each representing approximately onethird of the sequence [55]. Indeed, if PCR is used as dis-cussed above, appropriate selection of several primers canyield full-length coverage of the 16S rDNA sequence formost organisms [36,56]. This divide-and-conquerapproach would also improve the analysis, as matchingmasses when two catalogs are compared will be known tobe generated from equivalent variable subregions of 16SrDNA (PCR amplicon lying between two universally con-served sequences). In addition, analysis of smaller subre-gions of 16S may reduce the critical informative length toeight, thereby increasing the information obtained. Thus,the calculations described here for whole 16S rRNA mol-ecules can only be more favorable if variable subregionsinstead of whole molecules are actually used to generatemass catalogs. Given that some nucleic acid amplificationstrategy would likely be employed and because MALDIacquisition is so rapid, there would be little time penaltyassociated with dividing the experiment into the analysisof fragments derived from several different PCR ampli-cons. Clearly it should be possible and beneficial to iden-tify the most "mass-distinctive" sequence regions of 16Sand we have developed preliminary tools for doing so. Wealso believe it is equally important to identify sequenceregions which are "universally" amplifiable, so that broadorganism coverage can be attained in the same assay.Exactly how to deal with the organism-multiplexed spec-tra that might result is an experimental issue outside thescope of this paper, however, the problem of mixtures inmass spectrometry has been approached [57,58] and pro-tocols are also feasible for "sorting by dilution" as we dis-cuss below.
The effort described above to understand the potentialutility of a mass cataloging approach in the analysis of amixed sample with multiple unknown dominant speciessuggests that the approach is in fact very promising. Atfirst sight, one might be disappointed by the modestnumber of strains that can be recognized by a single peak.
However, it is imperative to understand that 16S rRNA hasits greatest resolving power at the genus and higher levelsof genetic relation. Comparison of 16S rRNA sequences isdefinitely not the method of choice for distinguishing vir-ulent and avirulent strains, etc. It is, however, the primarymethod to determine the genetic affinity of an unknownorganism. It is always effective to the genus level and inmost cases can distinguish species. However, when multi-ple strains of essentially the same species are examinedthere frequently is little or no variation in the underlyingRNA sequence itself [59,60]. Hence, mass catalogs of twostrains of the same species will frequently be identical andno single mass or set of masses would distinguish them.As more and more sequences are added to the databasesthere will inevitably be multiple strains of essentiallyevery species. The solution to this problem will be to pre-process the data in order to identify all the strains in thedatabase whose 16S rRNA sequences are effectively iden-tical (e.g. within fifteen sequence changes in a two-waycomparison) as a species cluster. The mass approachwould then be considered successful when assignment toone of these species clusters is possible. Since no such pre-processing was used here and many species clusters werelikely present, the results given are essentially a worst-casescenario.
The assumption here is also that most observed spectrawill be due to a complex organism mixture. Approachessuch as "dilution-to-extinction", however, have beendescribed in which replicate spectra are usually due to asingle organism in the mixture [36]. The essence of themethod is to dilute the total genomic DNA prior to inputin the initial PCR step such that, on average, each PCR hasa single molecular template. Replicate, "organism-pure"spectra are then observed, and relative organism abun-dances may be reported. In consideration of the completefragment pattern of, say, 6-mers and above, a wide varietyof statistical techniques may be appropriate for analysis ofthe acquired spectra including principle component anal-ysis, pattern recognition algorithms, correlations, convo-lutions, or transforms, and we have promising initialresults on using novel spectral comparison metrics for thispurpose. Conceptually, the approach described here relieson comparing observed mass-spectra to pre-calculated vir-tual spectra much resembling barcodes. Because time-of-flight spectra are inherently digitized, pre-processing andcomparison to virtual mass spectra would be automated.It may become convenient to give the calculated, barcode-like spectra some finite and practical peak-width. Calcu-lated fragment patterns could then be correlated throughthe observed spectra and a confidence index for the pres-ence of each organism could be derived. In such anapproach, closely related organisms are likely to give sim-ilar correlation coefficients or confidence indices with cal-culated spectra, so an iterative return to the mass spectrum
Page 12 of 16(page number not for citation purposes)

BMC Bioinformatics 2006, 7:117 http://www.biomedcentral.com/1471-2105/7/117
Page 13 of 16(page number not for citation purposes)
Identification rank and representation of truncated 16S rRNA from Nss. spL115 with 16S sequence truncated from the 3'-endFigure 4Identification rank and representation of truncated 16S rRNA from Nss. spL115 with 16S sequence truncated from the 3'-end. 16S rRNA of Nitrosospira sp. Strain L115 was truncated from its 3' end 10 nt a time for 89 times. As in Figure 3, identification of each truncated 16S rRNA was simulated with RES = 5, WIN = 3, and isotopic masses in RNase T1 catalog. Axes are identical to those in Figure 3.
0 20 40 60 80
−14
−12
−10
−8
−6
−4
−2
0
3’−terminal truncation (x10 bp)
Iden
tific
atio
n ra
nk
4050
6070
8090
100
Fra
ctio
nal r
epre
sent
atio
n (%
)

BMC Bioinformatics 2006, 7:117 http://www.biomedcentral.com/1471-2105/7/117
or a closer inspection of a particular mass range may bewarranted.
ConclusionA computational assessment of the feasibility of usingmass spectrometry of fragmented rRNAs to determine thegenetic affinity of unknown bacteria in monocultures andmixtures was undertaken. Mass catalogs of RNase-gener-ated fragments of 16S rRNA were shown to be extremelypromising for this purpose. When full-length sequencesdigested with RNase T1 were considered, it was found thatessentially all fragments of length ten or more will beinformative. The approach would be able to take advan-tage of the natural amplification associated with rRNAand will be ideal in situations such as long-duration spaceflight where reliance on sequencing would be unrealistic.Although not yet fully explored, it appears that theapproach will be effective with mixtures as well. It is alsoclear that enhancements such as improvement in the dis-tinction between cytosine and uracil and the possible useof subregions of the RNA may further improve perform-ance.
Methods16S rRNA sequence dataset selection16S rRNA sequences from 7,322 prokaryotic organismswere obtained from RDP Release 7.1 [46]. Thesesequences are of varying quality – some were fully deter-mined in terms of both the length and every position ofthe sequence while others are either partially determinedand/or contain undetermined positions. Any sequencehaving less than 1,400 nucleotides (full length 16S is typ-ically 1,542 nucleotides) or undetermined nucleotideswas filtered out resulting in a set of 1,921 high-quality 16SrRNA sequences.
In silico endoribonuclease digestionThe sequences of the oligoribonucleotides that would beproduced by RNase T1 or RNase A digestion of the 1,921rRNA sequences were generated by a computer program.During the in silico digestion process, for each 16S rRNAthe set of oligoribonucleotides produced was tabulatedand analyzed. The length, frequency of occurrence, andisotopic mass of each fragment was cataloged. To circum-vent the problem caused by similar molecular masses ofuracil and cytosine, it was sometimes assumed that 5-(3-aminoallyl)-uracil was used instead (∆m = 55.08 Da).Post-transcriptionally modified nucleotides were not con-sidered. Due to their rarity, oligoribonucleotides gener-ated from the 5' and 3' ends of 16S rRNAs were excludedfrom further consideration. Only the relative abundancesof carbon and oxygen isotopes were used to calculate theisotopic mass distribution of each oligoribonucleotide.This simplification gives a satisfactory approximationwith the advantage of significantly reducing computa-
tional complexity and run times. Only the resulting iso-topic masses of more than 50% of the maximum signalintensity were retained. In general, this resulted in themonoisotopic mass and at least one to two "daughter"masses being retained in the catalog. Two auxiliary datastructures, which map each 16S rRNA to the set of oligor-ibonucleotide masses that it can generate and each oligor-ibonucleotide mass to the set of 16S rRNAs that it can begenerated from, respectively, were also derived from theoligoribonucleotide catalog to facilitate downstream anal-ysis.
Determination of unique singlet, doublet, and triplet mass identifiersTo tabulate the minimum number of characteristic massesnecessary to distinguish an organism (see Table 2), massesthat were found exclusively in a single organism wererecorded. For signature doublets and triplets, exhaustiveintersections were taken of the sets of all of the possibleorganisms that might have contributed each mass. As asimplified example, consider that after digestion of 20sequences (organisms) only 7 masses, m1 through m7were present in the RNase T1-generated library. For each ofthe 7 masses in the library, a set of organisms, set Athrough set G contributing that RNase T1 fragment wasrecorded. To identify a unique doublet exclusively"owned" by an organism, all pairwise intersections of theorganism sets, AnB, AnC, ..., BnC, BnD, ... FnG, was taken.These two-fragment organism lists were, naturally, shorterthan the lists of organisms containing single fragments,reflecting the greater identifying specificity of mass-dou-blets. When a pairwise intersection contained only oneorganism, the mass-doublet was recorded as a uniqueidentifier. Similarly, unique mass-triplets were identifiedby taking all of the triple intersections AnBnC, AnBnD, ...,EnFnG to produce reduced lists of all organisms contain-ing all three of those fragments. Once an intersectionyielded a set containing only one organism, the corre-sponding masses and the organism were recorded. It isnoteworthy that there may exist other unique doublets ortriplets for a given organism, but only the first onesencountered (working in increasing mass order) wererecorded in the present work, tending to favor the lower-mass fragments. The trivial cases of a singlet unique to aparticular organism, paired with any other masses to forma unique doublet or triplet, were ignored. The algorithmcan also identify quartets and higher order intersections,albeit at a rapidly increasing computational cost.
Simulated Identification of sample bacteriaTo simulate the identification of sample bacteria by 16SrRNA fragment mass spectrometry, several 16S rRNAsequences were selected to make a virtual sample. Thesample 16S rRNAs were then treated in silico with RNaseT1 to generate a pool of different oligoribonucleotides.
Page 14 of 16(page number not for citation purposes)

BMC Bioinformatics 2006, 7:117 http://www.biomedcentral.com/1471-2105/7/117
(RNase A was not used for sample bacteria identification.)This pool of oligoribonucleotide sequences is in turnmapped into a collection of isotopic oligoribonucleotidemasses. Conversely, each individual oligoribonucleotidemass may be attributed to a number of bacteria.
To simulate the resolution limitation of mass spectrome-try in reality, on the simulated spectrometry chart masspeaks that are closer to each other than a preset resolutionthreshold (RES, ~1–5 Da) are merged into one peak thatcenters at the averaged masses of componential peaks.After merging, to select nearby catalog masses for eachsample mass a second window threshold (WIN, ~1–3 Da)is used. If the absolute difference between the samplemass and a catalog mass is less than this threshold, thenthat catalog mass is selected. The fraction representationof bacterium i in the selected catalog mass distribution is
, where is the number of peaks on
the mass spectrometry chart that can be attributed to the
bacterium i and is the number of peaks that bac-
terium i can generate.
The sample agent identification program gives a list of allthe bacteria and their corresponding fractional representa-tions in the sample spectrum. In addition, the programallowed user-defined adjustment of the instrumental(MALDI-TOF) resolution to determine the discriminatorypower of the approach using spectra ranging from ideal-ized, atomic peaks to spectra having finite, practical peakwidths.
Authors' contributionsZZ wrote the programs for generating the results describedhere, carried out initial and new analyses of the data, cre-ated the initial draft manuscript, and revised the manu-script prior to its submission. GWJ conceived of theapproach for quickly determining the unique mass-dou-blets and triplets, collected relevant literature, andexpanded and revised the manuscript. GEF oversaw thedesign of the programs, introduced the idea of criticallength, and prepared the final manuscript. RCW con-ceived the study, and participated in its design and coor-dination and helped to draft the manuscript. All authorsread and approved the final manuscript.
Additional material
AcknowledgementsThe work reported here was supported in part by grants from NASA (Cooperative agreement NCC 9–58 and successor grant NNJ04HF43G) to GEF and RCW and the Institute of Space Systems Operations to GEF.
References1. Angulo FJ, Nargund VN, Chiller TC: Evidence of an association
between use of anti-microbial agents in food animals andanti-microbial resistance among bacteria isolated fromhumans and the human health consequences of such resist-ance. J Vet Med B Infect Dis Vet Public Health 2004, 51(8-9):374-379.
2. Protecting our nation in an era of globalization - CDC's Glo-bal Infectious disease strategy. [http://www.cdc.gov/globalidplan/6-partnerships.htm]
3. National antimicrobial resistance monitoring system:enteric bacteria CDC's emerging infections program. [http://www.cdc.gov/narms/]
4. NIAID strategic plan for biodefense research. NIH publicationNo 03-5306 2002.
5. NIAID biodefense research agenda for CDC category Aagents. [http://www3.niaid.nih.gov/biodefense/research/biotresearchagenda.pdf]
6. Center for Biologics Evaluation and Research page on coun-tering bioterrorism [http://www.fda.gov/cber/cntrbio/cntrbio.htm]
7. The World Health Organization: Communicable diseases 2002:global defence against the infectious desease threat. 2003.
8. Arias E, Anderson RN, Kung HC, Murphy SL, Kochanek KD: Deaths:final data for 2001. Natl Vital Stat Rep 2003, 52(3):1-115.
9. Justification narrative for fiscal year 2005 President's budgetfor NIAID [http://www.niaid.nih.gov/facts/facts.htm]
10. Ghoshal U, Prasad KN, Singh M, Tiwari DP, Ayyagari A: A compar-ative evaluation of phenotypic and molecular methods forthe detection of oxacillin resistance in coagulase-negativestaphylococci. J Infect Chemother 2004, 10(2):86-89.
11. Ellepola AN, Hurst SF, Elie CM, Morrison CJ: Rapid and unequivo-cal differentiation of Candida dubliniensis from other Cand-ida species using species-specific DNA probes: comparisonwith phenotypic identification methods. Oral Microbiol Immunol2003, 18(6):379-388.
12. Willis RC: Improved molecular techniques help researchersdiagnose microbial conditions. Modern Drug Discovery 2004.
13. Ivnitski D, O'Neil DJ, Gattuso A, Schlicht R, Calidonna M, Fisher R:Nucleic acid approaches for detection and identification ofbiological warfare and infectious disease agents. Biotechniques2003, 35(4):862-869.
14. Approved products. U.S. Food and Drug Administration,Center for Biologic Evaluation and Research [http://www.fda.gov/cber/]
15. Walker P, Subasinghe R: DNA-based Molecular DiagnosticTechniques: research needs for standardization and valida-tion of the detection of aquatic animal pathogens and dis-eases. In Fisheries Technical Paper, United Nations Food and AgriculturalOrganization Volume 395. Edited by: Organization UNFA. FisheriesDivision; 1999.
16. Applied Biosystems I: MicroSeq 16S rRNA Gene Kit. .17. Applied Biosystems I: MicroSeq Full Gene 16S rDNA Bacterial
Identification Kit. .Additional File 1
FN
Ni
ichart
icata
=log
Nichart
Nicatalog
"Statistics of the 16S rRNA Oligoribonucleotide Catalogs", Includes all data for RNase digestions of sequences under consideration including: Average Number of Oligo of a given length per 16S, and Average Number of Oligo per 16S per Number of Possible Masses. These data are presented for both RNase A and RNase T1 digestion with and without isotopic dis-tribution taken into consideration (see text).Click here for file[http://www.biomedcentral.com/content/supplementary/1471-2105-7-117-S1.doc]
Page 15 of 16(page number not for citation purposes)

BMC Bioinformatics 2006, 7:117 http://www.biomedcentral.com/1471-2105/7/117
18. Fox GE, Pechman KR, Woese CR: Comparative cataloguing of16S ribosomal RNA: molecular approach to prokaryotic sys-tematics. International Journal of Systemic Bacteriology 1977, 27:44-57.
19. Sogin SJ, Sogin ML, Woese CR: Phylogenetic measurement inprocaryotes by primary structural characterization. J Mol Evol1971, 1(1):173-184.
20. Woese CR, Fox GE, Zablen L, Uchida T, Bonen L, Pechman K, LewisBJ, Stahl D: Conservation of primary structure in 16S ribos-omal RNA. Nature 1975, 254(5495):83-86.
21. Fox GE, Stackebrandt E, Hespell RB, Gibson J, Maniloff J, Dyer TA,Wolfe RS, Balch WE, Tanner RS, Magrum LJ, Zablen LB, BlakemoreR, Gupta R, Bonen L, Lewis BJ, Stahl DA, Luehrsen KR, Chen KN,Woese CR: The phylogeny of prokaryotes. Science 1980,209(4455):457-463.
22. Uchida T, Bonen L, Schaup HW, Lewis BJ, Zablen L, Woese C: Theuse of ribonuclease U2 in RNA sequence determination.Some corrections in the catalog of oligomers produced byribonuclease T1 digestion of Escherichia coli 16S ribosomalRNA. J Mol Evol 1974, 3(1):63-77.
23. Woese CR, Fox GE: Phylogenetic structure of the prokaryoticdomain: the primary kingdoms. Proc Natl Acad Sci U S A 1977,74(11):5088-5090.
24. Pechman KJ, Woese CR: Characterization of the primary struc-tural homology between the 16s ribosomal RNAs ofEscherichia coli and Bacillus megaterium by oligomer cata-loging. J Mol Evol 1972, 1(3):230-240.
25. Eng JK, McCormack AL, Yates JRIII: An Approach to CorrelateTandem Mass Spectral Data of Peptides with Amino AcidSequences in a Protein Database. J Am Soc Mass Spectrom 1994,5:976-989.
26. Aebersold R, Mann M: Mass spectrometry-based proteomics.Nature 2003, 422:198-207.
27. Perkins DN, Pappin DJC, Creasy DM, Cottrell JS: Probability-basedprotein identification by searching sequence databases usingmass spectrometry data. Electrophoresis 1999, 20:3551-3567.
28. Gygi SP, Rist B, Gerber SA, Turecek F, Gelb MH, Aebersold R: Quan-titative analysis of complex protein mixtures using isotope-coded affinity tags. Nature Biotechnology 1999, 17:994-997.
29. Crain PF, McCloskey JA: Applications of mass spectrometry tothe characterization of oligonucleotides and nucleic acids.Curr Opin Biotechnol 1998, 9(1):25-34.
30. Roskey MT, Juhasz P, Smirnov IP, Takach EJ, Martin SA, Haff LA: DNAsequencing by delayed extraction-matrix-assisted laser des-orption/ionization time of flight mass spectrometry. Proc NatlAcad Sci U S A 1996, 93(10):4724-4729.
31. Kwon Y, Tang K, Cantor C, Koster H, Kang C: DNA sequencingand genotyping by transcriptional synthesis of chain-termi-nated RNA ladders and MALDI-TOF mass spectrometry.Nucleic Acids Res 2001, 29(3):E11.
32. Koster: DNA diagnostic (sic) based on mass spectrometry.United States patent 5,605,798 and continuations 1997.
33. Koster: DNA diagnostics based on mass spectrometry. UnitedStates patent 6,043,031 and continuations 2000.
34. Krebs S, Medugorac I, Seichter D, Forster M: RNaseCut: a MALDImass spectrometry-based method for SNP discovery. NucleicAcids Res 2003, 31(7):e37.
35. Spottke B, Gross J, Galla HJ, Hillenkamp F: Reverse Sangersequencing of RNA by MALDI-TOF mass spectrometry aftersolid phase purification. Nucleic Acids Res 2004, 32(12):e97.
36. Ecker DJ, Sampath R, Blyn LB, Eshoo MW, Ivy C, Ecker JA, Libby B,Samant V, Sannes-Lowery KA, Melton RE, Russell K, Freed N, Bar-rozo C, Wu J, Rudnick K, Desai A, Moradi E, Knize DJ, Robbins DW,Hannis JC, Harrell PM, Massire C, Hall TA, Jiang Y, Ranken R, DraderJJ, White N, McNeil JA, Crooke ST, Hofstadler SA: Rapid identifi-cation and strain-typing of respiratory pathogens for epi-demic surveillance. Proc Natl Acad Sci U S A 2005,102(22):8012-8017.
37. Hofstadler SA, Sampath R, Blyn LB, Eshoo MW, Hall TA, Jiang Y,Drader JJ, Hannis JC, Sannes-Lowery KA, Cummins LL: TIGER: theuniversal biosensor. International Journal of Mass Spectrometry 2005,242(1):23-41.
38. Hahner S, Ludemann HC, Kirpekar F, Nordhoff E, Roepstorff P, GallaHJ, Hillenkamp F: Matrix-assisted laser desorption/ionizationmass spectrometry (MALDI) of endonuclease digests ofRNA. Nucleic Acids Res 1997, 25(10):1957-1964.
39. Hartmer R, Storm N, Boecker S, Rodi CP, Hillenkamp F, Jurinke C,van den Boom D: RNase T1 mediated base-specific cleavageand MALDI-TOF MS for high-throughput comparativesequence analysis. Nucleic Acids Res 2003, 31(9):e47.
40. von Wintzingerode F, Bocker S, Schlotelburg C, Chiu NH, Storm N,Jurinke C, Cantor CR, Gobel UB, van den Boom D: Base-specificfragmentation of amplified 16S rRNA genes analyzed bymass spectrometry: a tool for rapid bacterial identification.Proc Natl Acad Sci U S A 2002, 99(10):7039-7044.
41. Lefmann M, Honisch C, Bocker S, Storm N, von Wintzingerode F,Schlotelburg C, Moter A, van den Boom D, Gobel UB: Novel massspectrometry-based tool for genotypic identification ofmycobacteria. J Clin Microbiol 2004, 42(1):339-346.
42. McCloskey JA, Rozenski J: The Small Subunit rRNA Modifica-tion Database. Nucleic Acids Res 2005, 33(Databaseissue):D135-8.
43. Koomen JM, Russell WK, Tichy SE, Russell DH: Accurate massmeasurement of DNA oligonucleotide ions using high-reso-lution time-of-flight mass spectrometry. J Mass Spectrom 2002,37(4):357-371.
44. Null AP, Muddiman DC: Perspectives on the use of electrosprayionization Fourier transform ion cyclotron resonance massspectrometry for short tandem repeat genotyping in thepost-genome era. J Mass Spectrom 2001, 36(6):589-606.
45. Van Gelder RN, von Zastrow ME, Yool A, Dement WC, Barchas JD,Eberwine JH: Amplified RNA synthesized from limited quanti-ties of heterogeneous cDNA. Proc Natl Acad Sci U S A 1990,87(5):1663-1667.
46. Cole JR, Chai B, Farris RJ, Wang Q, Kulam SA, McGarrell DM, GarrityGM, Tiedje JM: The Ribosomal Database Project (RDP-II):sequences and tools for high-throughput rRNA analysis.Nucleic Acids Res 2005, 33(Database issue):D294-6.
47. Rozenski J, Crain PF, McCloskey JA: The RNA Modification Data-base: 1999 update. Nucleic Acids Res 1999, 27(1):196-197.
48. Kirpekar F, Douthwaite S, Roepstorff P: Mapping posttranscrip-tional modifications in 5S ribosomal RNA by MALDI massspectrometry. RNA 2000, 6(2):296-306.
49. Stanssens P, Zabeau M, Meersseman G, Remes G, Gansemans Y,Storm N, Hartmer R, Honisch C, Rodi CP, Bocker S, van den BoomD: High-throughput MALDI-TOF discovery of genomicsequence polymorphisms. Genome Res 2004, 14(1):126-133.
50. Sousa R, Padilla R: A mutant T7 RNA polymerase as a DNApolymerase. Embo J 1995, 14(18):4609-4621.
51. Padilla R, Sousa R: Efficient synthesis of nucleic acids heavilymodified with non-canonical ribose 2'-groups using a mutantT7 RNA polymerase (RNAP). Nucleic Acids Res 1999,27(6):1561-1563.
52. DeLucia AM, Grindley ND, Joyce CM: An error-prone family YDNA polymerase (DinB homolog from Sulfolobus solfatari-cus) uses a 'steric gate' residue for discrimination againstribonucleotides. Nucleic Acids Res 2003, 31(14):4129-4137.
53. Gao G, Orlova M, Georgiadis MM, Hendrickson WA, Goff SP: Con-ferring RNA polymerase activity to a DNA polymerase: asingle residue in reverse transcriptase controls substrateselection. Proc Natl Acad Sci U S A 1997, 94(2):407-411.
54. Astatke M, Ng K, Grindley ND, Joyce CM: A single side chain pre-vents Escherichia coli DNA polymerase I (Klenow fragment)from incorporating ribonucleotides. Proc Natl Acad Sci U S A1998, 95(7):3402-3407.
55. Lane DJ, Pace B, Olsen GJ, Stahl DA, Sogin ML, Pace NR: Rapiddetermination of 16S ribosomal RNA sequences for phyloge-netic analyses. Proc Natl Acad Sci U S A 1985, 82(20):6955-6959.
56. Weisburg WG, Barns SM, Pelletier DA, Lane DJ: 16S ribosomalDNA amplification for phylogenetic study. J Bacteriol 1991,173(2):697-703.
57. Ehrich M, Bo¨cker S, van den Boom D: Multiplexed discovery ofsequence polymorphisms using base-specific cleavage andMALDI-TOF MS. Nucleic Acids Research 2005, 33(4 e38):.
58. Peng J, Gygi SP: Proteomics: the move to mixtures. J Mass Spec-trom 2001, 36:1083-1091.
59. Woese CR, Stackebrandt E, Macke TJ, Fox GE: A phylogenetic def-inition of the major eubacterial taxa. Syst Appl Microbiol 1985,6:143-151.
60. Fox GE, Wisotzkey JD, Jurtshuk PJ: How close is close: 16S rRNAsequence identity may not be sufficient to guarantee speciesidentity. Int J Syst Bacteriol 1992, 42(1):166-170.
Page 16 of 16(page number not for citation purposes)
http://www.ncbi.nlm.nih.gov/entrez/query.fcgi?cmd=Retrieve&db=PubMed&dopt=Abstract&list_uids=5006250
http://www.ncbi.nlm.nih.gov/entrez/query.fcgi?cmd=Retrieve&db=PubMed&dopt=Abstract&list_uids=5006250
http://www.ncbi.nlm.nih.gov/entrez/query.fcgi?cmd=Retrieve&db=PubMed&dopt=Abstract&list_uids=1089909
http://www.ncbi.nlm.nih.gov/entrez/query.fcgi?cmd=Retrieve&db=PubMed&dopt=Abstract&list_uids=1089909
http://www.ncbi.nlm.nih.gov/entrez/query.fcgi?cmd=Retrieve&db=PubMed&dopt=Abstract&list_uids=6771870
http://www.ncbi.nlm.nih.gov/entrez/query.fcgi?cmd=Retrieve&db=PubMed&dopt=Abstract&list_uids=4597768
http://www.ncbi.nlm.nih.gov/entrez/query.fcgi?cmd=Retrieve&db=PubMed&dopt=Abstract&list_uids=4597768
http://www.ncbi.nlm.nih.gov/entrez/query.fcgi?cmd=Retrieve&db=PubMed&dopt=Abstract&list_uids=4597768
http://www.ncbi.nlm.nih.gov/entrez/query.fcgi?cmd=Retrieve&db=PubMed&dopt=Abstract&list_uids=4219625
http://www.ncbi.nlm.nih.gov/entrez/query.fcgi?cmd=Retrieve&db=PubMed&dopt=Abstract&list_uids=4219625
http://www.ncbi.nlm.nih.gov/entrez/query.fcgi?cmd=Retrieve&db=PubMed&dopt=Abstract&list_uids=4219625
http://www.ncbi.nlm.nih.gov/entrez/query.fcgi?cmd=Retrieve&db=PubMed&dopt=Abstract&list_uids=9503584
http://www.ncbi.nlm.nih.gov/entrez/query.fcgi?cmd=Retrieve&db=PubMed&dopt=Abstract&list_uids=9503584
http://www.ncbi.nlm.nih.gov/entrez/query.fcgi?cmd=Retrieve&db=PubMed&dopt=Abstract&list_uids=8643470
http://www.ncbi.nlm.nih.gov/entrez/query.fcgi?cmd=Retrieve&db=PubMed&dopt=Abstract&list_uids=8643470
http://www.ncbi.nlm.nih.gov/entrez/query.fcgi?cmd=Retrieve&db=PubMed&dopt=Abstract&list_uids=8643470
http://www.ncbi.nlm.nih.gov/entrez/query.fcgi?cmd=Retrieve&db=PubMed&dopt=Abstract&list_uids=9115363
http://www.ncbi.nlm.nih.gov/entrez/query.fcgi?cmd=Retrieve&db=PubMed&dopt=Abstract&list_uids=9115363
http://www.ncbi.nlm.nih.gov/entrez/query.fcgi?cmd=Retrieve&db=PubMed&dopt=Abstract&list_uids=9115363
http://www.ncbi.nlm.nih.gov/entrez/query.fcgi?cmd=Retrieve&db=PubMed&dopt=Abstract&list_uids=1689846
http://www.ncbi.nlm.nih.gov/entrez/query.fcgi?cmd=Retrieve&db=PubMed&dopt=Abstract&list_uids=1689846
http://www.ncbi.nlm.nih.gov/entrez/query.fcgi?cmd=Retrieve&db=PubMed&dopt=Abstract&list_uids=9847178
http://www.ncbi.nlm.nih.gov/entrez/query.fcgi?cmd=Retrieve&db=PubMed&dopt=Abstract&list_uids=9847178
http://www.ncbi.nlm.nih.gov/entrez/query.fcgi?cmd=Retrieve&db=PubMed&dopt=Abstract&list_uids=7556104
http://www.ncbi.nlm.nih.gov/entrez/query.fcgi?cmd=Retrieve&db=PubMed&dopt=Abstract&list_uids=7556104
http://www.ncbi.nlm.nih.gov/entrez/query.fcgi?cmd=Retrieve&db=PubMed&dopt=Abstract&list_uids=9012795
http://www.ncbi.nlm.nih.gov/entrez/query.fcgi?cmd=Retrieve&db=PubMed&dopt=Abstract&list_uids=9012795
http://www.ncbi.nlm.nih.gov/entrez/query.fcgi?cmd=Retrieve&db=PubMed&dopt=Abstract&list_uids=9012795
http://www.ncbi.nlm.nih.gov/entrez/query.fcgi?cmd=Retrieve&db=PubMed&dopt=Abstract&list_uids=9520378
http://www.ncbi.nlm.nih.gov/entrez/query.fcgi?cmd=Retrieve&db=PubMed&dopt=Abstract&list_uids=9520378
http://www.ncbi.nlm.nih.gov/entrez/query.fcgi?cmd=Retrieve&db=PubMed&dopt=Abstract&list_uids=9520378
http://www.ncbi.nlm.nih.gov/entrez/query.fcgi?cmd=Retrieve&db=PubMed&dopt=Abstract&list_uids=2413450
http://www.ncbi.nlm.nih.gov/entrez/query.fcgi?cmd=Retrieve&db=PubMed&dopt=Abstract&list_uids=2413450
http://www.ncbi.nlm.nih.gov/entrez/query.fcgi?cmd=Retrieve&db=PubMed&dopt=Abstract&list_uids=2413450
http://www.ncbi.nlm.nih.gov/entrez/query.fcgi?cmd=Retrieve&db=PubMed&dopt=Abstract&list_uids=1987160
http://www.ncbi.nlm.nih.gov/entrez/query.fcgi?cmd=Retrieve&db=PubMed&dopt=Abstract&list_uids=1987160
http://www.ncbi.nlm.nih.gov/entrez/query.fcgi?cmd=Retrieve&db=PubMed&dopt=Abstract&list_uids=1371061