Automatic mining of cognitive metadata using fuzzy inference
Upload
khangminh22Category
view
1download
0
Cataloging and Metadata Practices Survey Report
A report by the Survey Working Group of the Data Standards and the VRA Core Oversight
Committees of the Visual Resources Association (VRA).
December 20, 2017
Survey Working Group Members:
Chair: Zoe Waldron, New York Public Library
Greg Reser, University of California, San Diego
Margaret N. Webster, Cornell University (retired)
Layna White, San Francisco Museum of Art
Susan Jane Williams, Independent Cataloging and Consulting Services
Lynda White, Survey Consultant (University of Virginia Library, retired)
2
Executive summary:
Current practices:
Catalogers fill a variety of roles and titles; they were most likely to identify themselves as
specialists in cataloging and metadata. The majority of cataloging work is being done by library cataloging staff. The majority of respondents (58 percent) perform cataloging work in higher education.
When surveyed ten years ago (the VRA 2007 Professional Status Survey), 83 percent said they worked in academia. (This was a broader survey which may have included non-cataloging positions, but still points to changing employment patterns).
More respondents are employed in museums and archives than there were a decade ago in comparison with the 2007 survey.
While the majority of respondents spend most of their time on “images of works they don’t own,” i.e. images for teaching and learning; they are cataloging a wide array of material types.
More respondents are using home-grown systems (which include in-house programmed, Access, and Filemaker), for creation of metadata. Excel is an almost universal tool used during the workflow as well.
Most respondents are not embedding descriptive metadata in digital images, but 42 percent would like to do this.
Survey respondents are using a broad array of data standards. While use of data content standards is almost universal, the majority of respondents
prefer in-house guidelines, followed by CCO, RDA, AACR2 and DCRMG equally, and DACS.
For data schemas, respondents are using Dublin Core most frequently followed by in-house, Marc 21, VRA Core 4, and EAD.
Data content, data schema, and data value standards that are used vary according to the kinds of materials respondents catalog.
Respondents are heavily engaged in data manipulation with most converting data to other formats to allow sharing and repurposing.
Demand for the respondents’ services increased in all areas measured in the survey; demands for collaborative, cross-departmental projects increased the most.
The majority of respondents are either involved in, or interested in getting involved in, linked data or generating XML. There is less involvement and interest in migrating to RDF. (Note: this may indicate a lack of understanding about the role of RDF as a framework for Linked Open Data. Putting link references in data is only a first step.)
Almost half of the respondents are not now storing vocabulary acronyms, refids (record IDs) or URI links for controlled vocabulary terms in their data, but a quarter of them indicated the desire to begin doing so.
The majority of respondents are not downloading and storing (databasing) open content from the Web.
The majority of respondents believe they will need new skills in all the areas listed in the survey.

3
VRA Core Use and Satisfaction: Overall use of VRA Core has declined since the 2011 VRA Core survey; this is probably
an indirect result of visual resource collections and/or workers migrating to libraries where other standards prevail.
Sixty-two percent of respondents said they are not using any version of the VRA Core data standard. The 2011 VRA Core survey found that 39 percent of respondents were not using any version of the Core.
VRA Core 4 was the top choice of data schema (24 out of 70, or 34 percent) for people who catalog images of works they do not own, e.g., the Mona Lisa or the Eiffel Tower. For all other types of materials, VRA Core 4 was used much less often.
The majority of users think VRA Core is relatively easy (71 percent) or easy (14 percent) to use and teach. Half of the users, though, cited concepts they found challenging to understand or teach.
4
Introduction:
The Cataloging and Metadata Practices survey was administered by the Survey Working Group
on behalf of the Visual Resources Association’s (VRA) Data Standards and VRA Core
Oversight Committees. These committees are merging in 2018; in the remainder of this
document only the Data Standards Committee will be mentioned. The survey was fielded
between February 22, 2017 and April 7, 2017. It was prominently promoted on the VRA listserv,
and a link was sent to a variety of listservs that are used by catalogers and metadata
practitioners. These included ARLIS-L, ARLIS-CPDG, MCN, SAA Metadata and Digital Objects
Roundtable, METADATA LIBRARIANS, BIBFRAME, TMS Users, DPLA Hubs, AMIA-L,
ALCTS/LITA Metadata Interest Group, and MARC.
Survey data was collected from 157 respondents whose work involves cataloging and metadata
practice. Respondents were invited to take the survey whether or not they were current users of
the VRA Core 4.0 data standard. Multiple respondents from the same institution were allowed to
take the survey. Survey questions were about the work of the respondent or work being done in
their departmental unit; they were not about specific collections with which they work.
The purpose of the survey was to:
1. Understand the scope of cataloging and metadata practice of visual resources
professionals;
2. Evaluate the use of, and satisfaction with, the VRA Core 4.0 data standard, with
six questions out of a total of 29 concerning its use; and
3. Determine how the VRA can best support the needs of cataloging and metadata
professionals.
The results will inform this broad community about current prevalent practices in cataloging and
metadata creation; support the Data Standards Committee in the ongoing development and
maintenance of the VRA Core data standard; and lastly, guide the VRA in meeting current and
projected needs through educational outreach and the development of practical tools for
catalogers and metadata specialists.
Some of the survey results were measured against data from the VRA’s 2015-16 and 2007
Professional Status Surveys and the VRA Core Survey of 2011. This survey is intended to serve
as a benchmark against which to measure continuing changes and developments in cataloging
and metadata practice as captured in future surveys.
5
The survey:
Q1: Are you a (check all that apply)
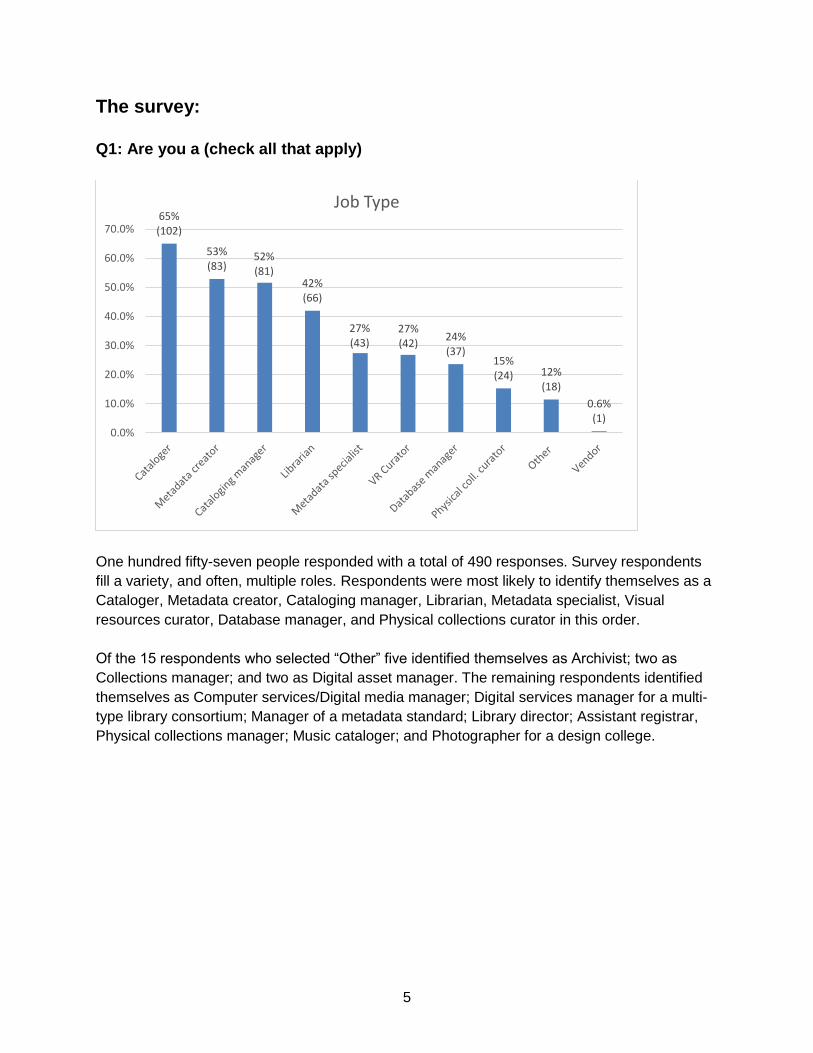
One hundred fifty-seven people responded with a total of 490 responses. Survey respondents
fill a variety, and often, multiple roles. Respondents were most likely to identify themselves as a
Cataloger, Metadata creator, Cataloging manager, Librarian, Metadata specialist, Visual
resources curator, Database manager, and Physical collections curator in this order.
Of the 15 respondents who selected “Other” five identified themselves as Archivist; two as
Collections manager; and two as Digital asset manager. The remaining respondents identified
themselves as Computer services/Digital media manager; Digital services manager for a multi-
type library consortium; Manager of a metadata standard; Library director; Assistant registrar,
Physical collections manager; Music cataloger; and Photographer for a design college.
65% (102)
53% (83)
52% (81)
42% (66)
27% (43)
27% (42)
24% (37)
15% (24) 12%
(18)
0.6% (1)
0.0%
10.0%
20.0%
30.0%
40.0%
50.0%
60.0%
70.0%
Job Type

6
Q2: What type of organization or business do you work for?
Respondents were asked to select one of 12 options. Of the 157 responses, the majority (58
percent) indicated they worked in Academia. This was followed by Museum (15 percent),
Archive (non-Academic) (10 percent), and Public Library (5 percent).
The eight respondents who selected “Other,” indicated that they worked for a: a non-profit
organization; an intergovernmental organization; a private research library; a research library; a
research institute; the government; and a consortium/systems headquarters, respectively. One
respondent works as a freelance cataloger and consultant.
The 58 percent of respondents employed in academia corresponds fairly closely with the
findings of 2015-2016 VRA Professional Status survey which found 59 percent employed in this
sector. The 2007 VRA Professional Status Survey found a much higher 83 percent of
respondents employed in higher education. Thus, employment in higher education has
decreased significantly over the past ten years.
Employment in museums was 9, 29, and 15 percent respectively as shown in the 2007, 2015-
16, and 2017 surveys respectively. Thus museum employment has increased over the past 10
years. Employment in archives increased also, going from one to ten percent between 2007 and
2017.
Note that the VRA Professional Status Surveys of 2007 and 2015-2016 were broader surveys
than this one because they were not limited to cataloging and metadata positions but
58% (91)
15% (24) 10%
(15) 5% (8)
5% (8)
4% (6)
1% (2)
1% (2)
0.6% (1) 0 0 0
0.0%
10.0%
20.0%
30.0%
40.0%
50.0%
60.0%
70.0%
Organization Type

7
comprehensively targeted the visual resources profession. While the direct comparisons shown
in the table below may not be totally accurate, the results still point to changing employment
patterns.
Shown above is a data comparison of the 2017 cataloging and metadata survey (fielded within and
outside the VRA) with the VRA’s two previous professional development surveys (2015-16 and 2007),
which applied to VRA members only.1
1 Sources: Visual Resources Association 2007 Professional Status Survey. A Report Prepared by the VRA Ad Hoc
Professional Status Survey Committee. July 2008, p 5; and Visual Resources Association 2015-16 Professional Status Task Force Report on Professional Status, p.11. http://vraweb.org/wp-content/uploads/2013/02/2015-16-VRA-Report-on-Professional-Status.pdf.
Employment Sector 2007 2015-16 2017
Higher Education 83% 59% 58%
Museums 9% 29% 15%
Archives 1% n/a 10%
Business 5% n/a 4%
8
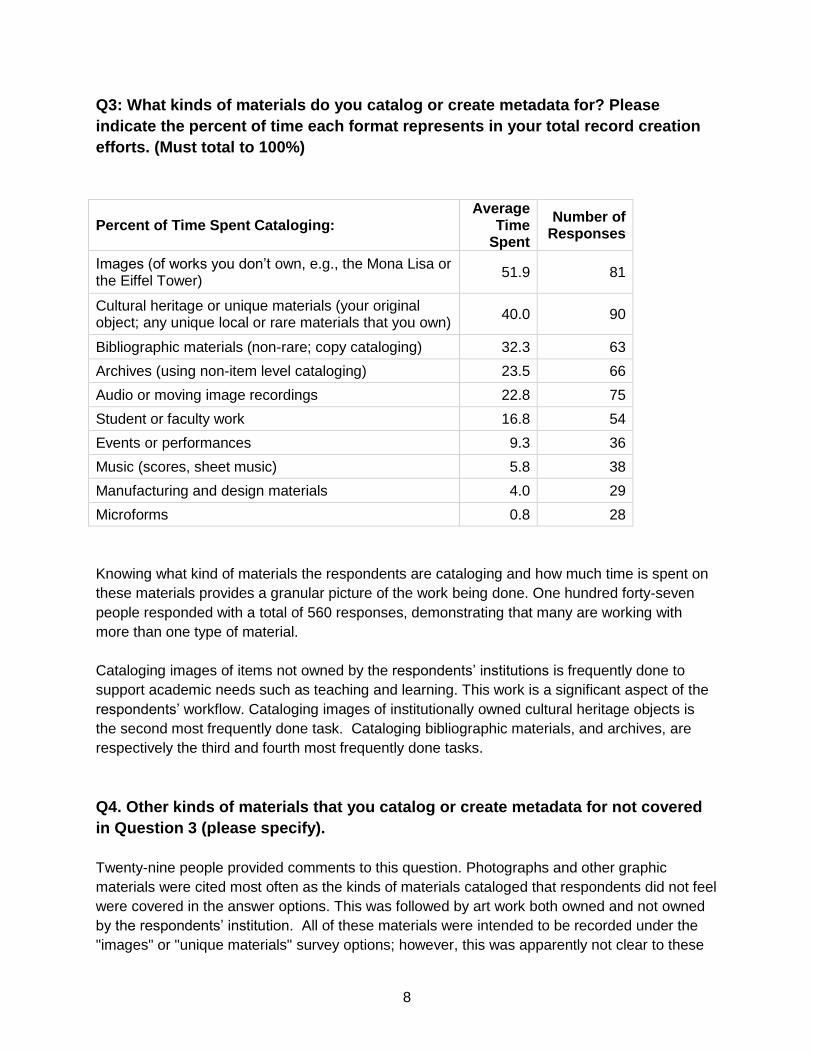
Q3: What kinds of materials do you catalog or create metadata for? Please
indicate the percent of time each format represents in your total record creation
efforts. (Must total to 100%)
Percent of Time Spent Cataloging: Average
Time Spent
Number of Responses
Images (of works you don’t own, e.g., the Mona Lisa or the Eiffel Tower)
51.9 81
Cultural heritage or unique materials (your original object; any unique local or rare materials that you own)
40.0 90
Bibliographic materials (non-rare; copy cataloging) 32.3 63
Archives (using non-item level cataloging) 23.5 66
Audio or moving image recordings 22.8 75
Student or faculty work 16.8 54
Events or performances 9.3 36
Music (scores, sheet music) 5.8 38
Manufacturing and design materials 4.0 29
Microforms 0.8 28
Knowing what kind of materials the respondents are cataloging and how much time is spent on
these materials provides a granular picture of the work being done. One hundred forty-seven
people responded with a total of 560 responses, demonstrating that many are working with
more than one type of material.
Cataloging images of items not owned by the respondents’ institutions is frequently done to
support academic needs such as teaching and learning. This work is a significant aspect of the
respondents’ workflow. Cataloging images of institutionally owned cultural heritage objects is
the second most frequently done task. Cataloging bibliographic materials, and archives, are
respectively the third and fourth most frequently done tasks.
Q4. Other kinds of materials that you catalog or create metadata for not covered
in Question 3 (please specify).
Twenty-nine people provided comments to this question. Photographs and other graphic
materials were cited most often as the kinds of materials cataloged that respondents did not feel
were covered in the answer options. This was followed by art work both owned and not owned
by the respondents’ institution. All of these materials were intended to be recorded under the
"images" or "unique materials" survey options; however, this was apparently not clear to these

9
respondents. Other materials cited were musical instruments; equipment (e.g. Chromebooks,
headphones); biology; herbarium and wildlife specimens; audio recordings; and electronic
books. Respondents also said they are cataloging digital files, digitized items, digital objects for
teaching, complex digital objects, data sets, and faculty citations within a harvest tool.
Respondents are working with a wide variety of materials. These include images for teaching
and learning, cultural heritage materials, photographs and other graphic materials, bibliographic
materials, archives, audio and moving image recordings, equipment, and digital objects.
Q5. Who creates catalog records or metadata within your unit? (Check all that
apply.)
The 153 people who responded reported that the majority of cataloging work was done by
library cataloging staff. This data suggests a few possibilities including that more visual
resources curators now have library degrees and that more visual resources collections are now
part of libraries (as opposed to administratively belonging to academic departments). A
plausible assumption is that the category "VR professional staff" reflects collections still
managed outside of library administration, whether or not the respondent has a library degree.
Respondents selected student employees, visual resources professional staff, and museum
curators as the next most frequent creators of catalog records within their units. Crowdsourcing,
while used, was an infrequent choice.
65% (99)
41% (66)
35% (53)
26% (40)
15% (23)
15% (23) 9%
(13) 11% (16)
2% (3)
0.0%
10.0%
20.0%
30.0%
40.0%
50.0%
60.0%
70.0%
Metadata Creators

10
Respondents who selected “Other” said; “myself” with no further identification (2); and archivist
(3). The 336 total responses indicate that catalog records and metadata are being created by
multiple types of staff in the work units of many respondents.

11
Q6. What other work related to cataloging or metadata creation is done within
your unit? (Check all that apply.)
The precise categories were: Assess, revise, or enhance legacy metadata; Database design,
development, and management; Database user training or training development; Produce
documentation for cataloging or metadata; Project development or consulting on cataloging or
metadata creation; Review or approve cataloging or metadata records and Rights status
assignment. This question sought to discover the broad range of work related to cataloging
being done in respondents’ units. One hundred fifty people responded with 733 total responses.
The data demonstrates that survey respondents’ units are widely engaged with a variety of work
that supports cataloging practice as shown above.
Respondents who selected “Other” cited inventory; preservation/conservation and scanning;
managing/promoting a metadata standard; automated quality control of vendor supplied records
for electronic books; standards adherence oversight, integrated library system cooperative
management; product development; create descriptive, administrative and preservation
metadata; data access policy; collection development; project management; digitization, and
enhancement/correction of images as the kinds of work being done in their unit.
84% (126)
83% (124)
81% (122)
64% (96)
61% (91)
59% (89)
49% (74)
7% (11)
0.0%
10.0%
20.0%
30.0%
40.0%
50.0%
60.0%
70.0%
80.0%
90.0%
Other Metadata Work
12
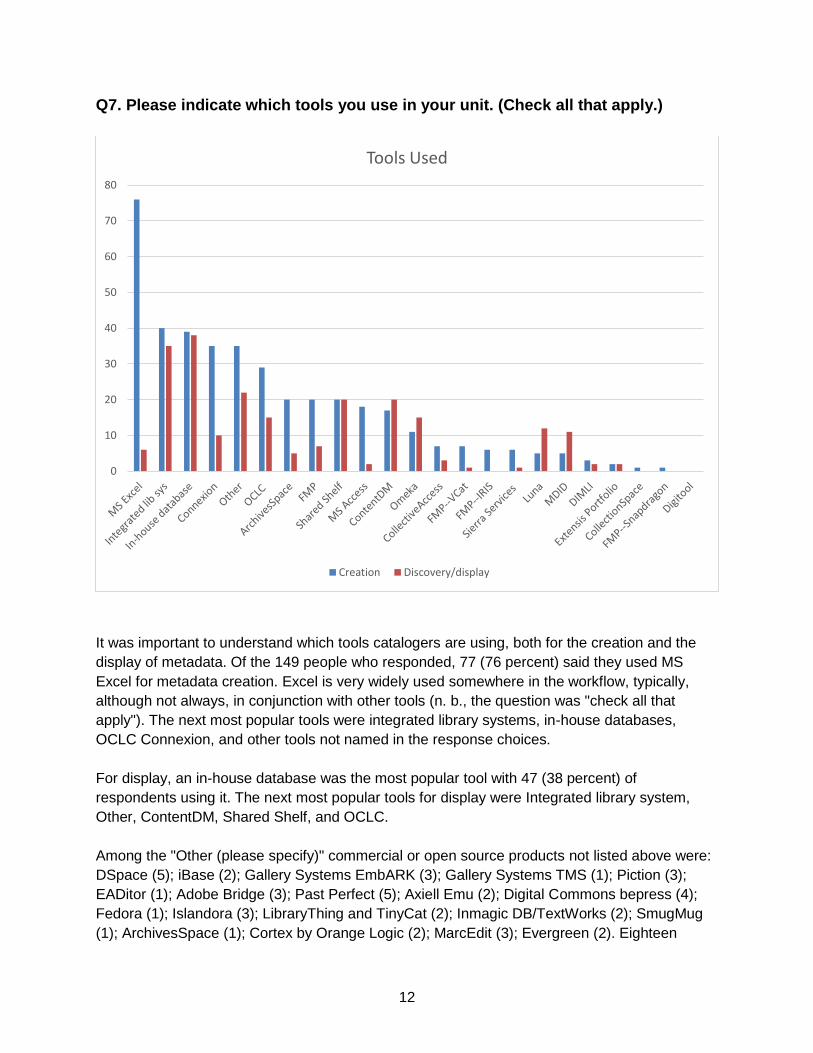
Q7. Please indicate which tools you use in your unit. (Check all that apply.)
It was important to understand which tools catalogers are using, both for the creation and the
display of metadata. Of the 149 people who responded, 77 (76 percent) said they used MS
Excel for metadata creation. Excel is very widely used somewhere in the workflow, typically,
although not always, in conjunction with other tools (n. b., the question was "check all that
apply"). The next most popular tools were integrated library systems, in-house databases,
OCLC Connexion, and other tools not named in the response choices.
For display, an in-house database was the most popular tool with 47 (38 percent) of
respondents using it. The next most popular tools for display were Integrated library system,
Other, ContentDM, Shared Shelf, and OCLC.
Among the "Other (please specify)" commercial or open source products not listed above were:
DSpace (5); iBase (2); Gallery Systems EmbARK (3); Gallery Systems TMS (1); Piction (3);
EADitor (1); Adobe Bridge (3); Past Perfect (5); Axiell Emu (2); Digital Commons bepress (4);
Fedora (1); Islandora (3); LibraryThing and TinyCat (2); Inmagic DB/TextWorks (2); SmugMug
(1); ArchivesSpace (1); Cortex by Orange Logic (2); MarcEdit (3); Evergreen (2). Eighteen
0
10
20
30
40
50
60
70
80
Tools Used
Creation Discovery/display
13
respondents also gave the company or name of the ILS (integrated library system) product they
use (Exlibris, III, Aleph, Voyager, Sirsi, etc.)
One respondent is using a university-based consortium (FADIS). In addition two respondents
commented they used a blog to capture information which was then transferred to a database.
By far, most respondents are using home-grown systems, including in-house programming and
adaptations of Access, Filemaker (and FMP variants such as IRIS and VCat).
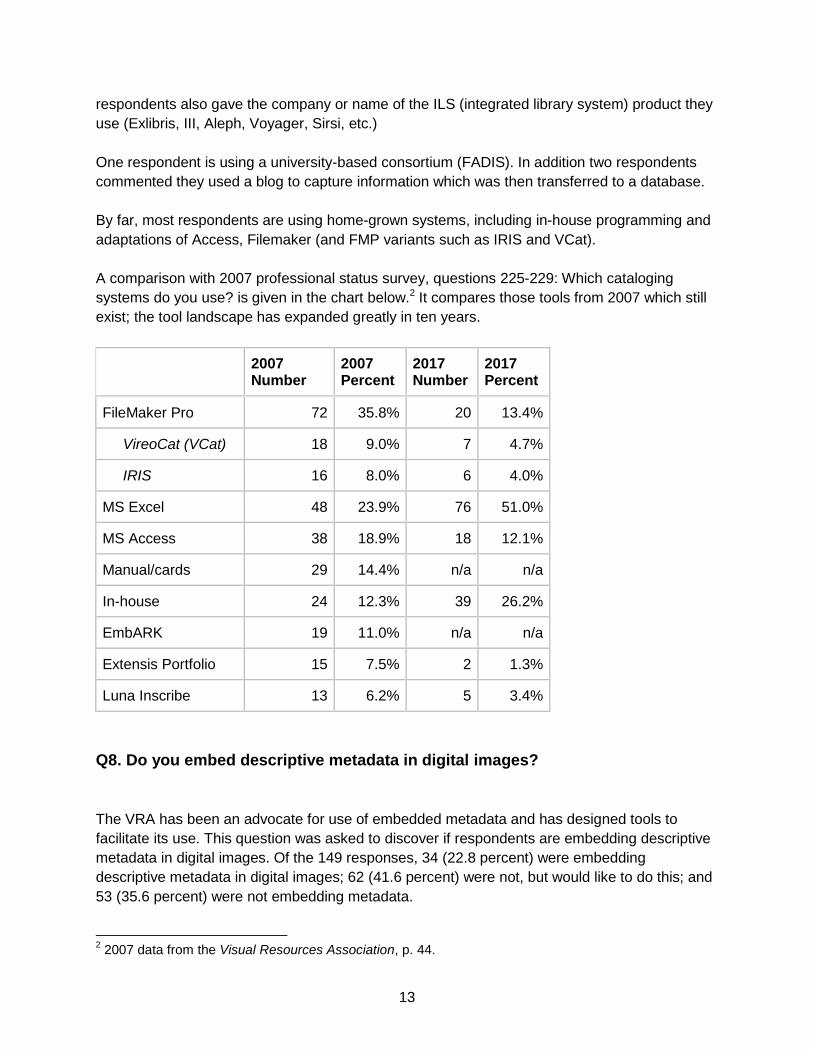
A comparison with 2007 professional status survey, questions 225-229: Which cataloging
systems do you use? is given in the chart below.2 It compares those tools from 2007 which still
exist; the tool landscape has expanded greatly in ten years.
2007 Number
2007 Percent
2017 Number
2017 Percent
FileMaker Pro 72 35.8% 20 13.4%
VireoCat (VCat) 18 9.0% 7 4.7%
IRIS 16 8.0% 6 4.0%
MS Excel 48 23.9% 76 51.0%
MS Access 38 18.9% 18 12.1%
Manual/cards 29 14.4% n/a n/a
In-house 24 12.3% 39 26.2%
EmbARK 19 11.0% n/a n/a
Extensis Portfolio 15 7.5% 2 1.3%
Luna Inscribe 13 6.2% 5 3.4%
Q8. Do you embed descriptive metadata in digital images?
The VRA has been an advocate for use of embedded metadata and has designed tools to
facilitate its use. This question was asked to discover if respondents are embedding descriptive
metadata in digital images. Of the 149 responses, 34 (22.8 percent) were embedding
descriptive metadata in digital images; 62 (41.6 percent) were not, but would like to do this; and
53 (35.6 percent) were not embedding metadata.
2 2007 data from the Visual Resources Association, p. 44.
14
Q9. If yes, which tools do you use? (Check all that apply.)
IPTC metadata panel in any product
VRA metadata plugins for Adobe Bridge
Other (please specify)
This question was asked to determine which tools respondents were using to embed metadata.
Of the 36 respondents who answered the question, 22 (61.1 percent) were using the IPTC
metadata panel in any product; 15 (41.7 percent) were using VRA metadata plugins for Adobe
Bridge; and 10 (27.8 percent) stated they were using another tool. These other tools include
other custom scripts in Adobe Bridge, commercial DAMS software, in-house DAMs, and open-
source command line tools, each with two respondents.
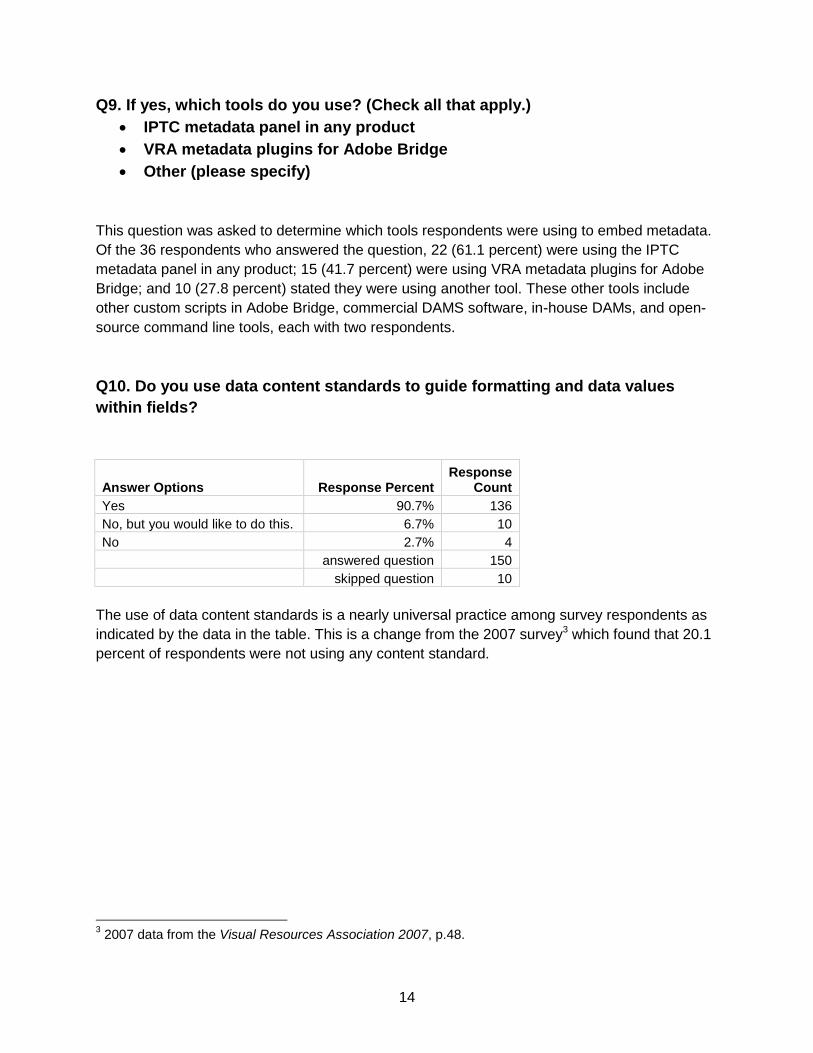
Q10. Do you use data content standards to guide formatting and data values
within fields?
Answer Options Response Percent Response
Count
Yes 90.7% 136
No, but you would like to do this. 6.7% 10
No 2.7% 4
answered question 150
skipped question 10
The use of data content standards is a nearly universal practice among survey respondents as
indicated by the data in the table. This is a change from the 2007 survey3 which found that 20.1
percent of respondents were not using any content standard.
3 2007 data from the Visual Resources Association 2007, p.48.
15
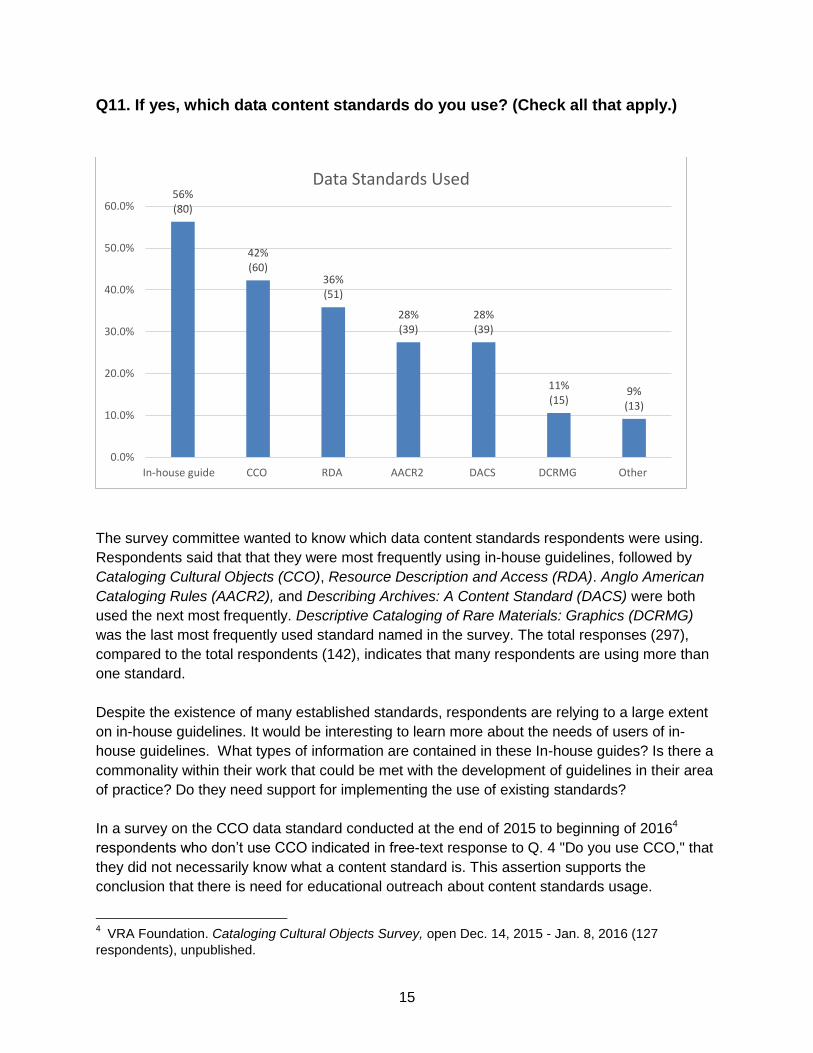
Q11. If yes, which data content standards do you use? (Check all that apply.)
The survey committee wanted to know which data content standards respondents were using.
Respondents said that that they were most frequently using in-house guidelines, followed by
Cataloging Cultural Objects (CCO), Resource Description and Access (RDA). Anglo American
Cataloging Rules (AACR2), and Describing Archives: A Content Standard (DACS) were both
used the next most frequently. Descriptive Cataloging of Rare Materials: Graphics (DCRMG)
was the last most frequently used standard named in the survey. The total responses (297),
compared to the total respondents (142), indicates that many respondents are using more than
one standard.
Despite the existence of many established standards, respondents are relying to a large extent
on in-house guidelines. It would be interesting to learn more about the needs of users of in-
house guidelines. What types of information are contained in these In-house guides? Is there a
commonality within their work that could be met with the development of guidelines in their area
of practice? Do they need support for implementing the use of existing standards?
In a survey on the CCO data standard conducted at the end of 2015 to beginning of 20164
respondents who don’t use CCO indicated in free-text response to Q. 4 "Do you use CCO," that
they did not necessarily know what a content standard is. This assertion supports the
conclusion that there is need for educational outreach about content standards usage.
4 VRA Foundation. Cataloging Cultural Objects Survey, open Dec. 14, 2015 - Jan. 8, 2016 (127
respondents), unpublished.
56% (80)
42% (60)
36% (51)
28% (39)
28% (39)
11% (15)
9% (13)
0.0%
10.0%
20.0%
30.0%
40.0%
50.0%
60.0%
In-house guide CCO RDA AACR2 DACS DCRMG Other
Data Standards Used

16
A data comparison with the 2007 VRA Professional Status Survey,5 shown in the chart below,
reveals a drop in usage of CCO from 69 to 42.3 percent, and points to increase in the use of the
standards RDA and AACR2 which are prevalent in libraries. The increase in usage of these
standards could reflect that, as shown in Q.5, more cataloging work is being done by library
cataloging staff than by other professionals.
Data standard 2007 (Percent)
2017 (Percent)
In-house guidelines n/a 56.3
CCO 69.0 42.3
RDA n/a 35.9
AACR2 36 27.5
DACS n/a 27.4
DCRMG n/a 10.6
Other n/a 9.2
None 35 n/a
The chart shown above shows a comparison with 2007 Professional Status survey, Q 233 (Which data
content standards do you use?). The only options in 2007 were: CCO, AACR2 and "none."
5 2007 data from the Visual Resources Association 2007, p. 48.
17
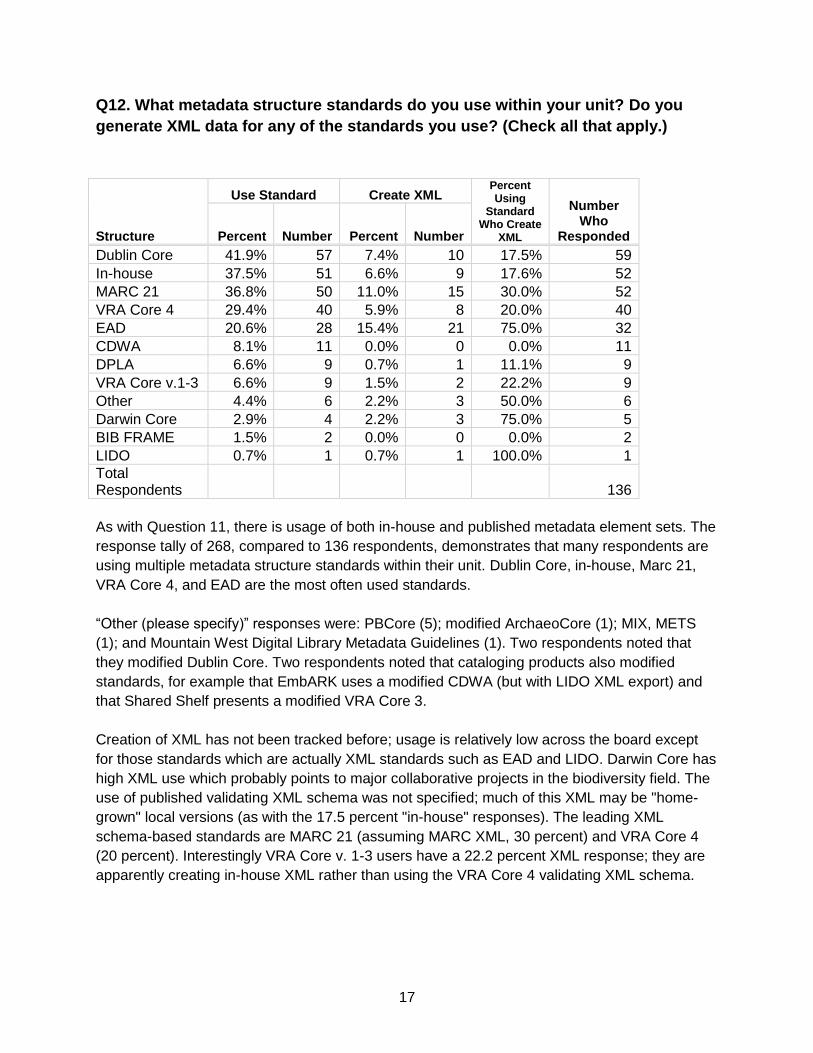
Q12. What metadata structure standards do you use within your unit? Do you
generate XML data for any of the standards you use? (Check all that apply.)
Use Standard Create XML Percent Using
Standard Who Create
XML
Number Who
Responded Structure Percent Number Percent Number
Dublin Core 41.9% 57 7.4% 10 17.5% 59
In-house 37.5% 51 6.6% 9 17.6% 52
MARC 21 36.8% 50 11.0% 15 30.0% 52
VRA Core 4 29.4% 40 5.9% 8 20.0% 40
EAD 20.6% 28 15.4% 21 75.0% 32
CDWA 8.1% 11 0.0% 0 0.0% 11
DPLA 6.6% 9 0.7% 1 11.1% 9
VRA Core v.1-3 6.6% 9 1.5% 2 22.2% 9
Other 4.4% 6 2.2% 3 50.0% 6
Darwin Core 2.9% 4 2.2% 3 75.0% 5
BIB FRAME 1.5% 2 0.0% 0 0.0% 2
LIDO 0.7% 1 0.7% 1 100.0% 1
Total Respondents 136
As with Question 11, there is usage of both in-house and published metadata element sets. The
response tally of 268, compared to 136 respondents, demonstrates that many respondents are
using multiple metadata structure standards within their unit. Dublin Core, in-house, Marc 21,
VRA Core 4, and EAD are the most often used standards.
“Other (please specify)” responses were: PBCore (5); modified ArchaeoCore (1); MIX, METS
(1); and Mountain West Digital Library Metadata Guidelines (1). Two respondents noted that
they modified Dublin Core. Two respondents noted that cataloging products also modified
standards, for example that EmbARK uses a modified CDWA (but with LIDO XML export) and
that Shared Shelf presents a modified VRA Core 3.
Creation of XML has not been tracked before; usage is relatively low across the board except
for those standards which are actually XML standards such as EAD and LIDO. Darwin Core has
high XML use which probably points to major collaborative projects in the biodiversity field. The
use of published validating XML schema was not specified; much of this XML may be "home-
grown" local versions (as with the 17.5 percent "in-house" responses). The leading XML
schema-based standards are MARC 21 (assuming MARC XML, 30 percent) and VRA Core 4
(20 percent). Interestingly VRA Core v. 1-3 users have a 22.2 percent XML response; they are
apparently creating in-house XML rather than using the VRA Core 4 validating XML schema.

18
A comparison with 2007 Professional Status Survey Q. 230 (Which structural metadata
standards do you use?) shows an increased use of the Dublin Core and MARC, and decreased
use of the VRA Core.6
2007 Number
2007 Percent
2017 Number
2017 Percent
VRA Core 1-2 141 68.1% n/a n/a
In-house 98 47.3% 51 37.5%
VRA Core-3 84 40.6% 9 6.6%
VRA Core-4 80 38.6% 40 29.4%
Dublin Core 42 20.3% 57 41.9%
MARC 29 14.0% 50 36.8%
CDWA 10 4.8% 11 8.1%
CDWA-lite 7 3.4% n/a n/a
Total 207 136
With such a wide variety of standards being used, an analysis was made to see if the type of
materials cataloged has an influence on which metadata structure standards are being used.
Focusing on what respondents mostly catalog (over 49 percent of the time), it was found that
VRA Core 4 was the top choice (24 out of 70, or 34 percent) for people who catalog images of
works they do not own, e.g., the Mona Lisa or the Eiffel Tower. For all other types of materials,
VRA Core 4 was much less popular.
For those who catalog images of unique materials from their own institutions, VRA Core 4 was
the 6th most popular (7 out of 72) schema. Catalogers of images of unique materials prefer an
in-house schema, an in-house content standard, and the Getty Research Institution’s AAT
vocabulary. VRA Core’s popularity in other categories is as follows:
Archives - 11th (1 out of 32)
Audio/video - 5th (2 out of 20)
Bibliographic - 8th (1 of 48)
Events - 7th (1 out of 8)
Student or faculty work- 5th (1 of 5).
The data also showed that users of the VRA Core prefer the CCO content standard and the
Getty controlled vocabularies.
Further analysis on data standards usage as relates to the VRA Core is given questions 19-24.
6 2007 data from the Visual Resources Association 2007, p.45.

19
Q13. What data value standards (controlled vocabularies) do you use within your
unit? (Check all that apply.)
The choices are: AAT (Art and Architecture Thesaurus); LCSH (Library of Congress Subject
Headings); LCNAF (Library of Congress Name Authority File); ULAN (Union List of Artist
Names); TGN (Thesaurus of Geographic Names); TGM (Thesaurus of Graphic Materials);
LCGFT (Library of Congress Genre and Form Terms); VIAF (Virtual International Authority File);
CONA (Cultural Objects Name Authority) and Iconclass (a classification system for
iconography).
The data for this question shows that the respondents are extensively using both Library of
Congress (LCSH, LCNAF, TGM, and LCGFT) and Getty Research Institution (AAT, ULAN,
TGN, CONA) vocabularies. The total responses of 605 as compared to 141 respondents,
indicates that respondents are frequently using multiple data value standards in their work or in
their unit.
Twenty percent or 28 respondents are using vocabularies not listed on the survey, including in-
house vocabularies (13 specified in comments), used alone or in conjunction with published
vocabularies. “Other (please specify)” responses include: GRI (Global Reporting Initiative
Standards); PBCore (2); Nomenclature 3.0 for Museum Cataloging; FAST (Faceted Application
of Subject Terminology) headings (3); Australian Thesaurus of Education Descriptors; bepress
73% (103)
72% (101)
62% (87)
53% (75)
48% (67)
28% (40)
26% (37) 23%
(33) 20% (28)
14% (20)
8% (11)
2% (3)
0.0%
10.0%
20.0%
30.0%
40.0%
50.0%
60.0%
70.0%
80.0%
AAT LCSH LCNAF ULAN TGN TGM LCGFT VIAF Other CONA Iconclass None
Data Value Standards Used
20
Digital Commons Three-Tier Taxonomy of Academic Disciplines
https://www.bepress.com/reference_guide_dc/disciplines/; GSAFD; GTAA
(Gemeenschappelijke Thesaurus Audiovisuele Archieven = Dutch Common Thesaurus
Audiovisual Archives); uBio; ITIS; DCMI; AFS; Geonames; Internet Media Types; ISO 639-2;
MARC Languages; and Wikidata.
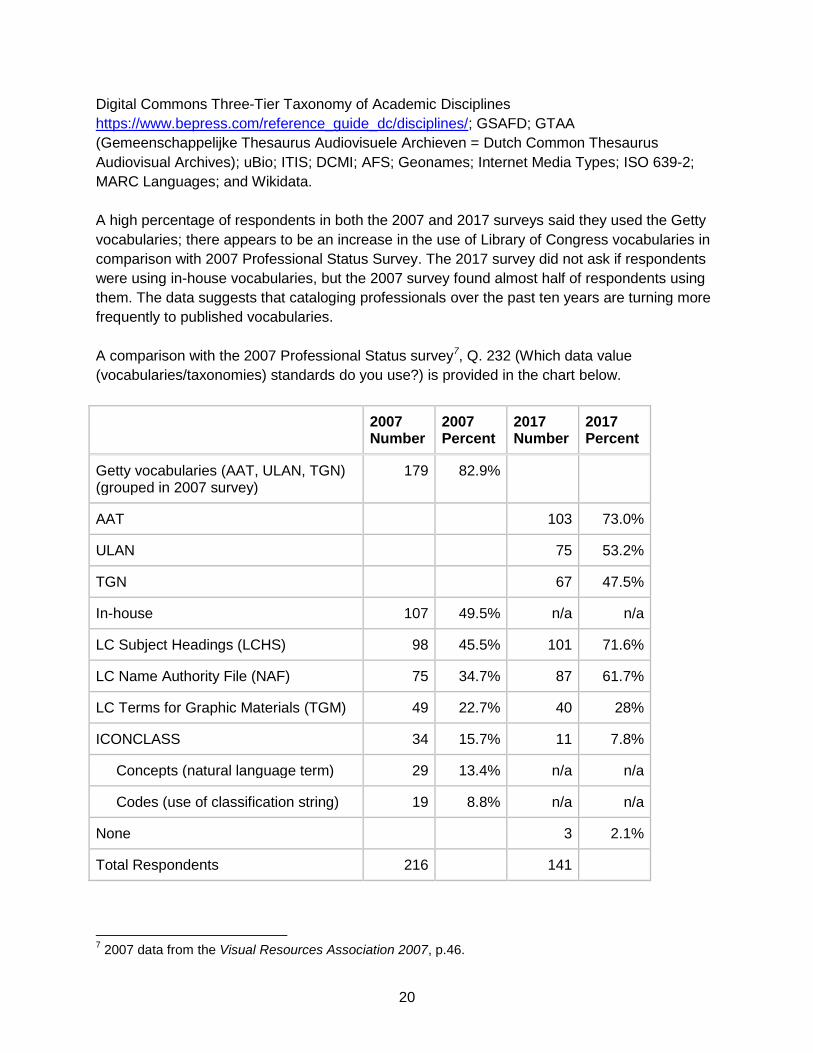
A high percentage of respondents in both the 2007 and 2017 surveys said they used the Getty
vocabularies; there appears to be an increase in the use of Library of Congress vocabularies in
comparison with 2007 Professional Status Survey. The 2017 survey did not ask if respondents
were using in-house vocabularies, but the 2007 survey found almost half of respondents using
them. The data suggests that cataloging professionals over the past ten years are turning more
frequently to published vocabularies.
A comparison with the 2007 Professional Status survey7, Q. 232 (Which data value
(vocabularies/taxonomies) standards do you use?) is provided in the chart below.
2007 Number
2007 Percent
2017 Number
2017 Percent
Getty vocabularies (AAT, ULAN, TGN) (grouped in 2007 survey)
179 82.9%
AAT 103 73.0%
ULAN 75 53.2%
TGN 67 47.5%
In-house 107 49.5% n/a n/a
LC Subject Headings (LCHS) 98 45.5% 101 71.6%
LC Name Authority File (NAF) 75 34.7% 87 61.7%
LC Terms for Graphic Materials (TGM) 49 22.7% 40 28%
ICONCLASS 34 15.7% 11 7.8%
Concepts (natural language term) 29 13.4% n/a n/a
Codes (use of classification string) 19 8.8% n/a n/a
None 3 2.1%
Total Respondents 216 141
7 2007 data from the Visual Resources Association 2007, p.46.
21
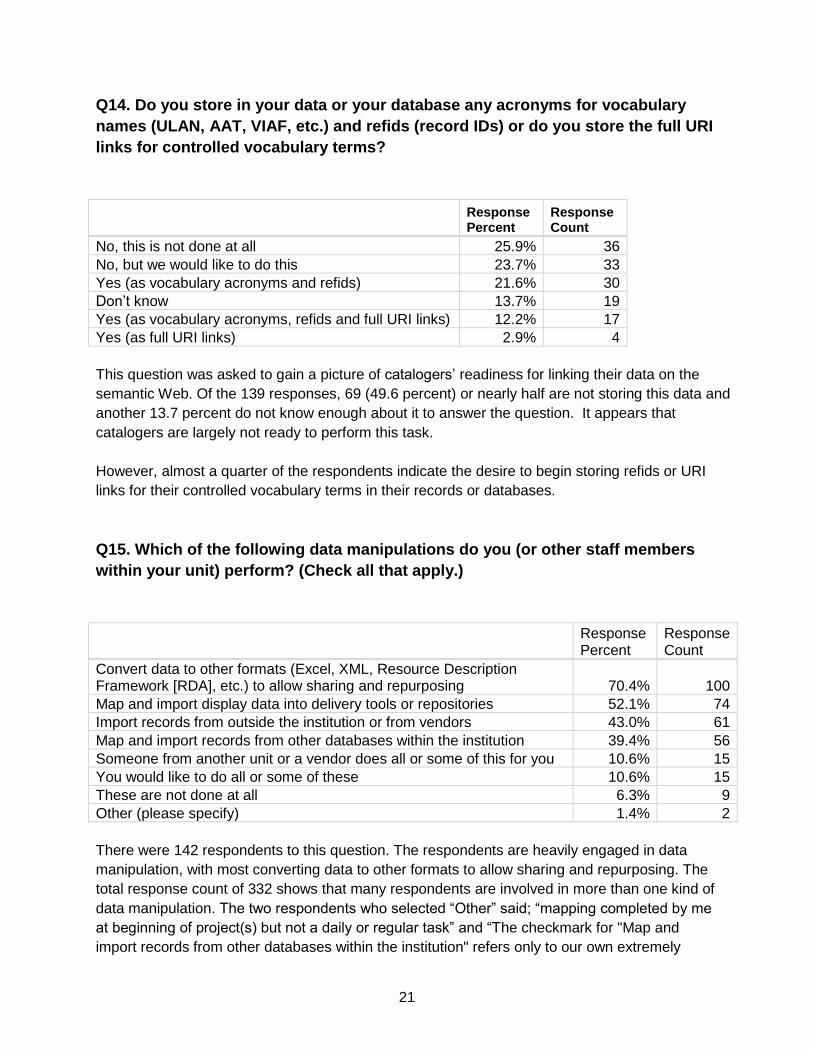
Q14. Do you store in your data or your database any acronyms for vocabulary
names (ULAN, AAT, VIAF, etc.) and refids (record IDs) or do you store the full URI
links for controlled vocabulary terms?
Response Percent
Response Count
No, this is not done at all 25.9% 36
No, but we would like to do this 23.7% 33
Yes (as vocabulary acronyms and refids) 21.6% 30
Don’t know 13.7% 19
Yes (as vocabulary acronyms, refids and full URI links) 12.2% 17
Yes (as full URI links) 2.9% 4
This question was asked to gain a picture of catalogers’ readiness for linking their data on the
semantic Web. Of the 139 responses, 69 (49.6 percent) or nearly half are not storing this data and
another 13.7 percent do not know enough about it to answer the question. It appears that
catalogers are largely not ready to perform this task.
However, almost a quarter of the respondents indicate the desire to begin storing refids or URI
links for their controlled vocabulary terms in their records or databases.
Q15. Which of the following data manipulations do you (or other staff members
within your unit) perform? (Check all that apply.)
Response Percent
Response Count
Convert data to other formats (Excel, XML, Resource Description Framework [RDA], etc.) to allow sharing and repurposing 70.4% 100
Map and import display data into delivery tools or repositories 52.1% 74
Import records from outside the institution or from vendors 43.0% 61
Map and import records from other databases within the institution 39.4% 56
Someone from another unit or a vendor does all or some of this for you 10.6% 15
You would like to do all or some of these 10.6% 15
These are not done at all 6.3% 9
Other (please specify) 1.4% 2
There were 142 respondents to this question. The respondents are heavily engaged in data
manipulation, with most converting data to other formats to allow sharing and repurposing. The
total response count of 332 shows that many respondents are involved in more than one kind of
data manipulation. The two respondents who selected “Other” said; “mapping completed by me
at beginning of project(s) but not a daily or regular task” and “The checkmark for "Map and
import records from other databases within the institution" refers only to our own extremely
22
infrequent migrations between collection systems, not to other institutional databases.” The
10.6% response to "would like to do this" indicates a possible pool for training.
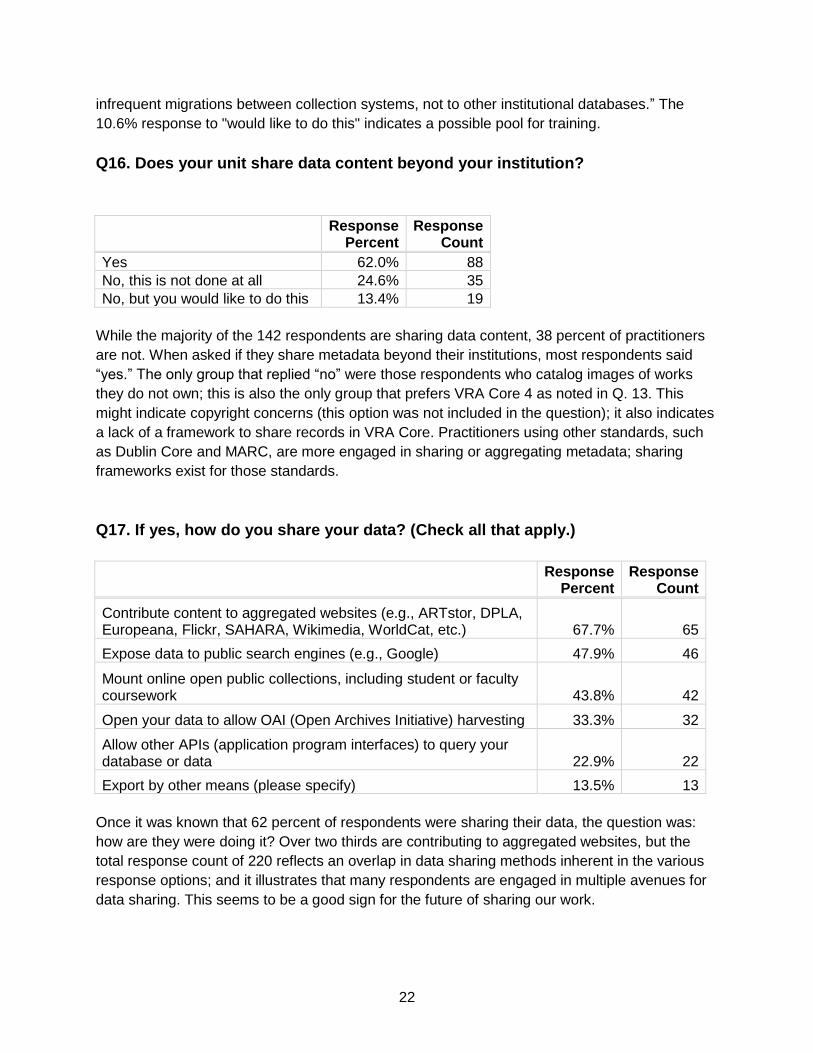
Q16. Does your unit share data content beyond your institution?
Response Percent
Response Count
Yes 62.0% 88
No, this is not done at all 24.6% 35
No, but you would like to do this 13.4% 19
While the majority of the 142 respondents are sharing data content, 38 percent of practitioners
are not. When asked if they share metadata beyond their institutions, most respondents said
“yes.” The only group that replied “no” were those respondents who catalog images of works
they do not own; this is also the only group that prefers VRA Core 4 as noted in Q. 13. This
might indicate copyright concerns (this option was not included in the question); it also indicates
a lack of a framework to share records in VRA Core. Practitioners using other standards, such
as Dublin Core and MARC, are more engaged in sharing or aggregating metadata; sharing
frameworks exist for those standards.
Q17. If yes, how do you share your data? (Check all that apply.)
Response Percent
Response Count
Contribute content to aggregated websites (e.g., ARTstor, DPLA, Europeana, Flickr, SAHARA, Wikimedia, WorldCat, etc.) 67.7% 65
Expose data to public search engines (e.g., Google) 47.9% 46
Mount online open public collections, including student or faculty coursework 43.8% 42
Open your data to allow OAI (Open Archives Initiative) harvesting 33.3% 32
Allow other APIs (application program interfaces) to query your database or data 22.9% 22
Export by other means (please specify) 13.5% 13
Once it was known that 62 percent of respondents were sharing their data, the question was:
how are they were doing it? Over two thirds are contributing to aggregated websites, but the
total response count of 220 reflects an overlap in data sharing methods inherent in the various
response options; and it illustrates that many respondents are engaged in multiple avenues for
data sharing. This seems to be a good sign for the future of sharing our work.

23
Those who exported by other means included 6 respondents who perform some manual sharing
with other collaborators or aggregators including simple Excel docs. Two respondents have
public demo collections but with image protections. Other responses include: SneakerNet;
JSON exported to HathiTrust; and Z39.50 consortial or public catalogs (2). One respondent
elaborated on a one-click download of object metadata in LIDO XML, plus caption and (public
domain) image from an online collection; many museum systems have this sort of capability,
which would fall under the "mount online public collections" category.
Q18. Does your unit currently download open content images from the Web?
(Check all that apply.)
Response Percent
Response Count
No 70.4% 100
Yes (keeping them in your database and/or discovery and display tools) 19.0% 27
Yes (using them outside your database and/or discovery tools) 12.7% 18
Yes (looking for an alternative to storing them in your database or discovery tools) 3.5% 5
This question was a follow-up to Q 17, since museums (and aggregators) are now sharing high
quality images. It was an attempt to see if these resources were being used or stored in local
systems. Most catalogers (70.4 percent) do not currently download open content images from
the Web. Of those who do, not many are looking for alternatives to storing them locally. It will be
fruitful to measure these responses against future studies in this area.

24
Q19. Which version of the VRA Core data standard do you use?
Of the 139 responses, most respondents (61.9 percent or nearly two thirds) are not using any
version of the VRA Core. A “don’t use it response” appears to be a significant increase since a
similar question was asked in the 2011 VRA Core survey. That survey found 39.4 percent of
respondents not using any version of VRA Core.8
Respondents who are using the VRA Core are mostly using the current version (4.0; published
in 2007). The 2011 survey found more VRA Core users using version 3.0 or earlier versions.9
As shown in the analysis for Q.12, the VRA Core was used by respondents the fourth most
frequently. The VRA Core 4 was the top choice (24 out of 70, or 34 percent) for people who
catalog images of works they do not own, e.g., the Mona Lisa or the Eiffel Tower. For all other
types of materials, VRA Core 4 was used much less. For example, five comments to Q.12
mention PBCore as a structure used for moving images.
This indicates that outreach to, and participation with, other standards and communities of
practice would be beneficial.
8 The VRA Core Survey Analysis. Report dated September 1, 2011, pp.3-4.
http://core.vraweb.org/pdfs/VRACoreSurveyAnalysis.pdf 9 The VRA Core Survey Analysis, pp. 4-5.
62% (86)
31% (43)
5% (7) 1%
(2) 0.7% (1)
0.0%
10.0%
20.0%
30.0%
40.0%
50.0%
60.0%
70.0%
Do not use VRACore
VRA Core 4.0 VRA Core 3.0 VRA Core 1.0 VRA Core 2.0
Version of VRA Core Used
25
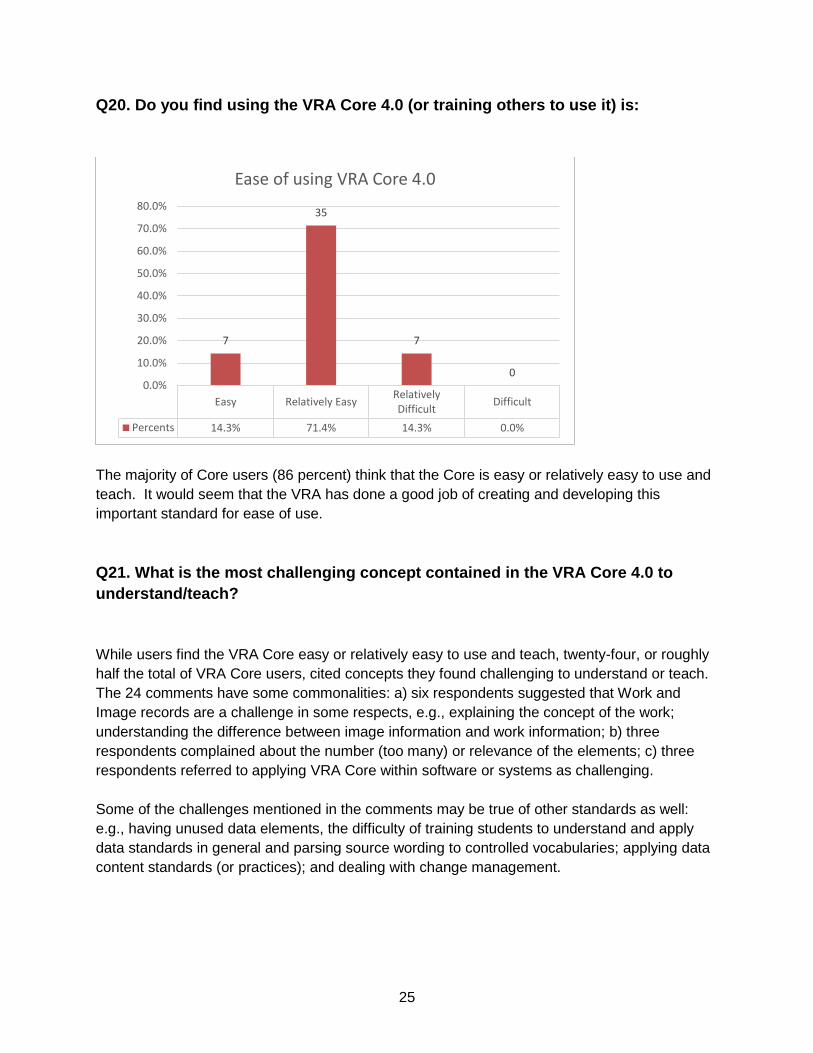
Q20. Do you find using the VRA Core 4.0 (or training others to use it) is:
The majority of Core users (86 percent) think that the Core is easy or relatively easy to use and
teach. It would seem that the VRA has done a good job of creating and developing this
important standard for ease of use.
Q21. What is the most challenging concept contained in the VRA Core 4.0 to
understand/teach?
While users find the VRA Core easy or relatively easy to use and teach, twenty-four, or roughly
half the total of VRA Core users, cited concepts they found challenging to understand or teach.
The 24 comments have some commonalities: a) six respondents suggested that Work and
Image records are a challenge in some respects, e.g., explaining the concept of the work;
understanding the difference between image information and work information; b) three
respondents complained about the number (too many) or relevance of the elements; c) three
respondents referred to applying VRA Core within software or systems as challenging.
Some of the challenges mentioned in the comments may be true of other standards as well:
e.g., having unused data elements, the difficulty of training students to understand and apply
data standards in general and parsing source wording to controlled vocabularies; applying data
content standards (or practices); and dealing with change management.
Easy Relatively EasyRelativelyDifficult
Difficult
Percents 14.3% 71.4% 14.3% 0.0%
7
35
7
0 0.0%
10.0%
20.0%
30.0%
40.0%
50.0%
60.0%
70.0%
80.0%
Ease of using VRA Core 4.0

26
Q22. Do you find the VRA Core 4.0 elements:
Response Percent
Response Count
Adequate 82.0% 41
Don’t know enough about it or don’t have an opinion 16.0% 8
Inadequate 2.0% 1
A large majority of users (82 percent) think the VRA Core 4.0 elements are adequate. Because
the number of responses is close to the number of VRA Core users (Q19), it may be assumed
that 16 percent ‘don't have an opinion’ about its adequacy, rather than that they ‘don’t know
enough about it.’
The six comments are diverse. One respondent recommended adding a simple one-point GPS
to location and one noted the difficulty of including object provenance. The other comments
pointed to difficulties in implementing VRA Core within the cataloging tool or system they use,
including allowing multiple repeating values (e.g. multiple artists and roles); one respondent
mentioned working with a flat (non-relational) system.
Q23. Do you find the online VRA Core training /documentation:
Response Percent
Response Count
Adequate 60.0% 30
Don’t know enough about it or don’t have an opinion 38.0% 19
Inadequate 2.0% 1
A majority of users (60 percent) think the training and documentation is adequate. There is room
for growth here, however, with 38 percent responding that they “don't know enough about it or
have an opinion.”
The six comments from this question have some commonalities: a) three of the comments call
for more or different cataloging examples (e.g., for complex works); b) two of the comments
note that the VRA Core resources are fine for professionals, but are not tailored to beginners or
students. Perhaps most illuminating was the comment that the information and cataloging
examples are located in two places; the question did not establish that all the respondents were
aware of this. The same respondent noted that it might help to add “an introduction to the ‘VRA
Core 4.0 Element Description’ on the hosted LC site. It currently begins with the global
elements. Having the XML structure as the first two links under ‘VRA Core Schemas and
Documentation’ is confusing for those looking for directions on how to use the Core.”
27
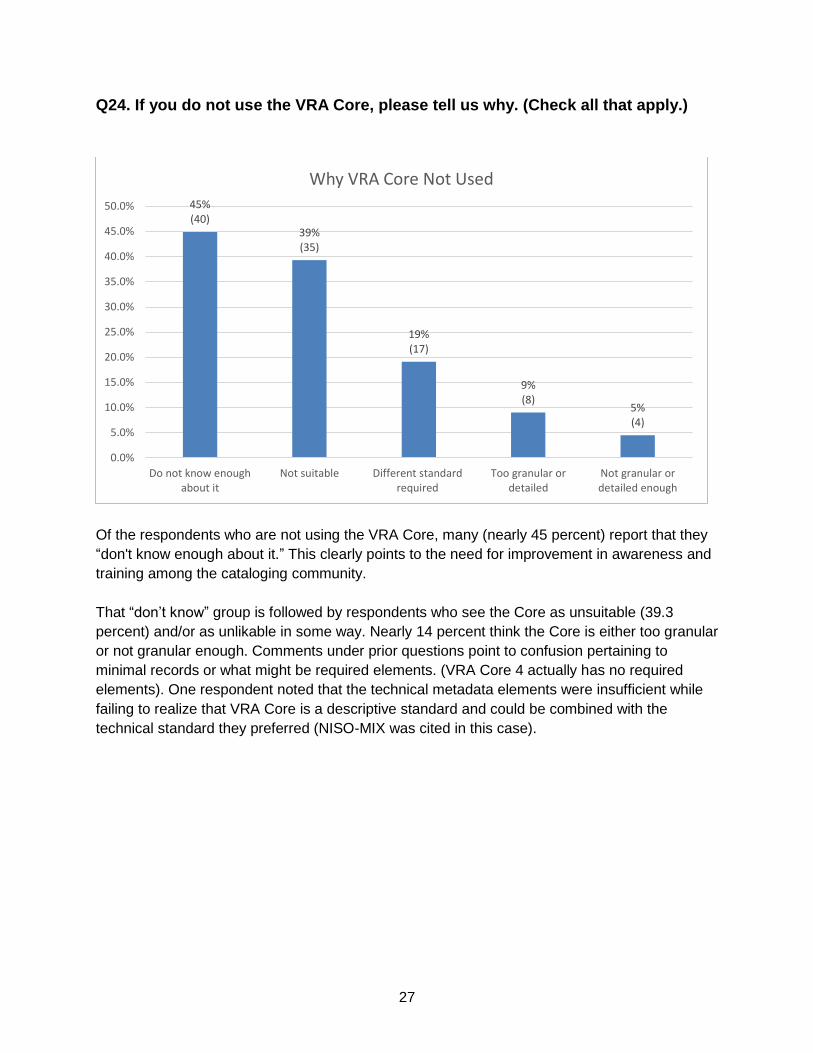
Q24. If you do not use the VRA Core, please tell us why. (Check all that apply.)
Of the respondents who are not using the VRA Core, many (nearly 45 percent) report that they
“don't know enough about it.” This clearly points to the need for improvement in awareness and
training among the cataloging community.
That “don’t know” group is followed by respondents who see the Core as unsuitable (39.3
percent) and/or as unlikable in some way. Nearly 14 percent think the Core is either too granular
or not granular enough. Comments under prior questions point to confusion pertaining to
minimal records or what might be required elements. (VRA Core 4 actually has no required
elements). One respondent noted that the technical metadata elements were insufficient while
failing to realize that VRA Core is a descriptive standard and could be combined with the
technical standard they preferred (NISO-MIX was cited in this case).
45% (40)
39% (35)
19% (17)
9% (8)
5% (4)
0.0%
5.0%
10.0%
15.0%
20.0%
25.0%
30.0%
35.0%
40.0%
45.0%
50.0%
Do not know enoughabout it
Not suitable Different standardrequired
Too granular ordetailed
Not granular ordetailed enough
Why VRA Core Not Used
28
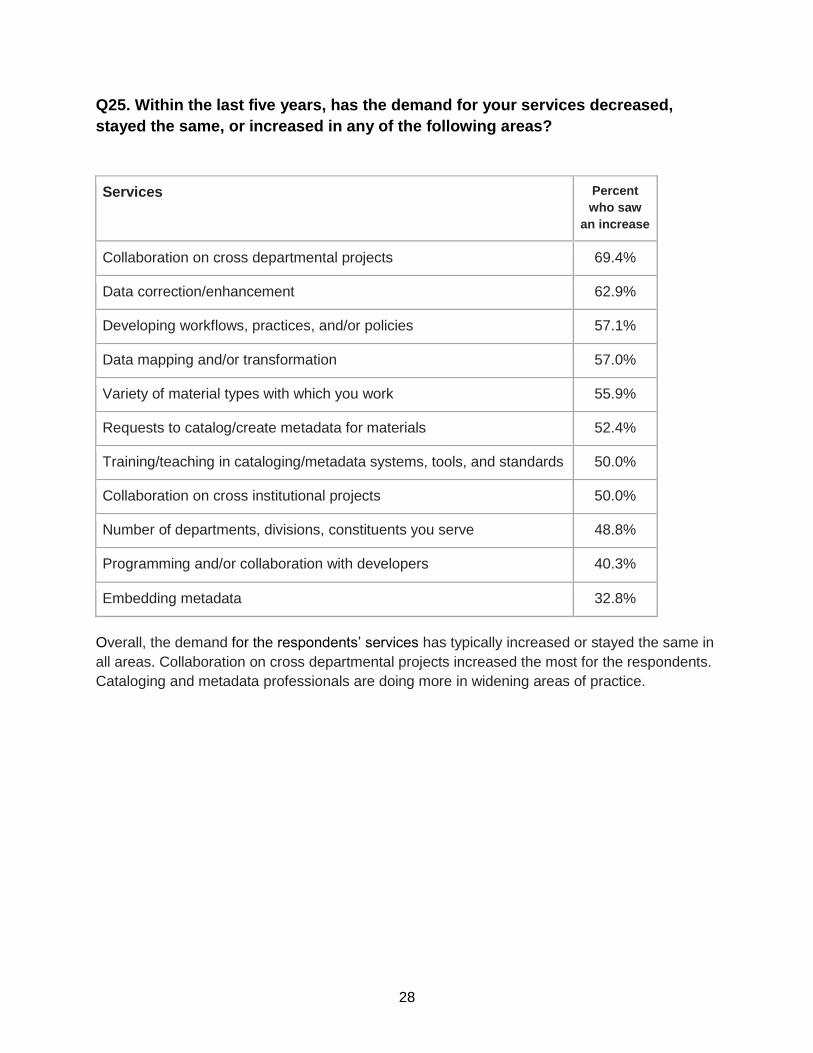
Q25. Within the last five years, has the demand for your services decreased,
stayed the same, or increased in any of the following areas?
Services Percent
who saw
an increase
Collaboration on cross departmental projects 69.4%
Data correction/enhancement 62.9%
Developing workflows, practices, and/or policies 57.1%
Data mapping and/or transformation 57.0%
Variety of material types with which you work 55.9%
Requests to catalog/create metadata for materials 52.4%
Training/teaching in cataloging/metadata systems, tools, and standards 50.0%
Collaboration on cross institutional projects 50.0%
Number of departments, divisions, constituents you serve 48.8%
Programming and/or collaboration with developers 40.3%
Embedding metadata 32.8%
Overall, the demand for the respondents’ services has typically increased or stayed the same in
all areas. Collaboration on cross departmental projects increased the most for the respondents.
Cataloging and metadata professionals are doing more in widening areas of practice.
29
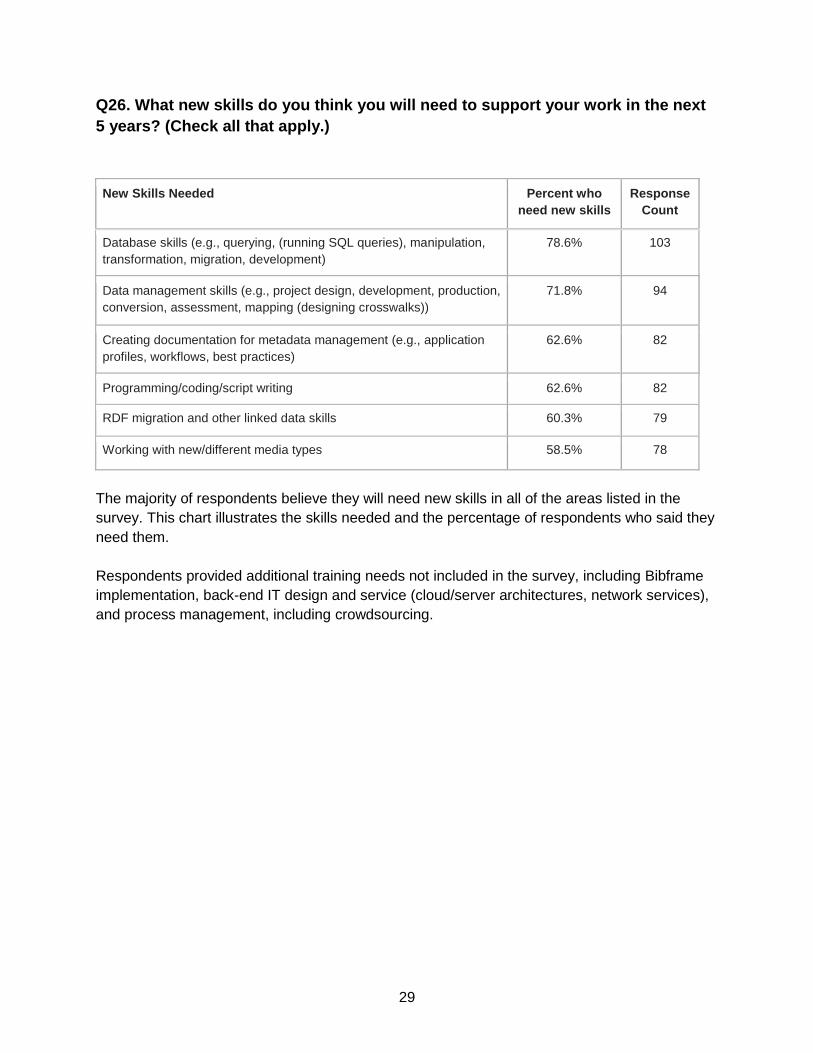
Q26. What new skills do you think you will need to support your work in the next
5 years? (Check all that apply.)
New Skills Needed Percent who
need new skills
Response
Count
Database skills (e.g., querying, (running SQL queries), manipulation,
transformation, migration, development)
78.6% 103
Data management skills (e.g., project design, development, production,
conversion, assessment, mapping (designing crosswalks))
71.8% 94
Creating documentation for metadata management (e.g., application
profiles, workflows, best practices)
62.6% 82
Programming/coding/script writing 62.6% 82
RDF migration and other linked data skills 60.3% 79
Working with new/different media types 58.5% 78
The majority of respondents believe they will need new skills in all of the areas listed in the
survey. This chart illustrates the skills needed and the percentage of respondents who said they
need them.
Respondents provided additional training needs not included in the survey, including Bibframe
implementation, back-end IT design and service (cloud/server architectures, network services),
and process management, including crowdsourcing.
30
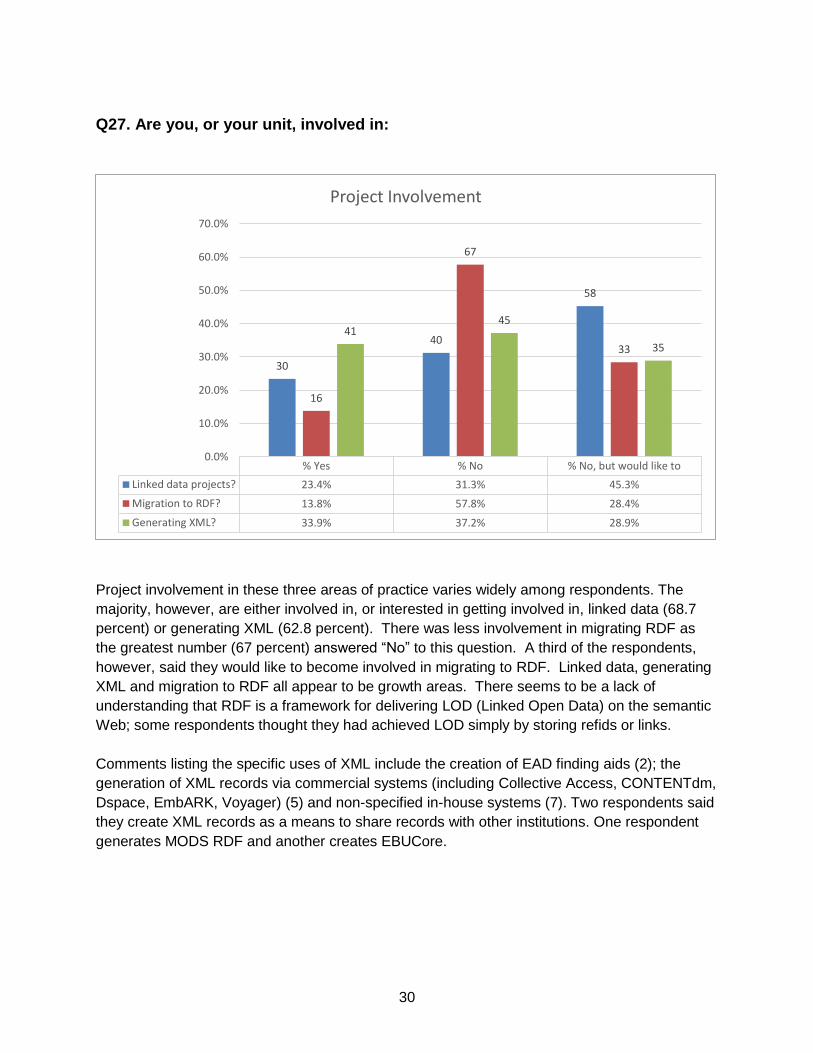
Q27. Are you, or your unit, involved in:
Project involvement in these three areas of practice varies widely among respondents. The
majority, however, are either involved in, or interested in getting involved in, linked data (68.7
percent) or generating XML (62.8 percent). There was less involvement in migrating RDF as
the greatest number (67 percent) answered “No” to this question. A third of the respondents,
however, said they would like to become involved in migrating to RDF. Linked data, generating
XML and migration to RDF all appear to be growth areas. There seems to be a lack of
understanding that RDF is a framework for delivering LOD (Linked Open Data) on the semantic
Web; some respondents thought they had achieved LOD simply by storing refids or links.
Comments listing the specific uses of XML include the creation of EAD finding aids (2); the
generation of XML records via commercial systems (including Collective Access, CONTENTdm,
Dspace, EmbARK, Voyager) (5) and non-specified in-house systems (7). Two respondents said
they create XML records as a means to share records with other institutions. One respondent
generates MODS RDF and another creates EBUCore.
% Yes % No % No, but would like to
Linked data projects? 23.4% 31.3% 45.3%
Migration to RDF? 13.8% 57.8% 28.4%
Generating XML? 33.9% 37.2% 28.9%
30
40
58
16
67
33
41 45
35
0.0%
10.0%
20.0%
30.0%
40.0%
50.0%
60.0%
70.0%
Project Involvement
31
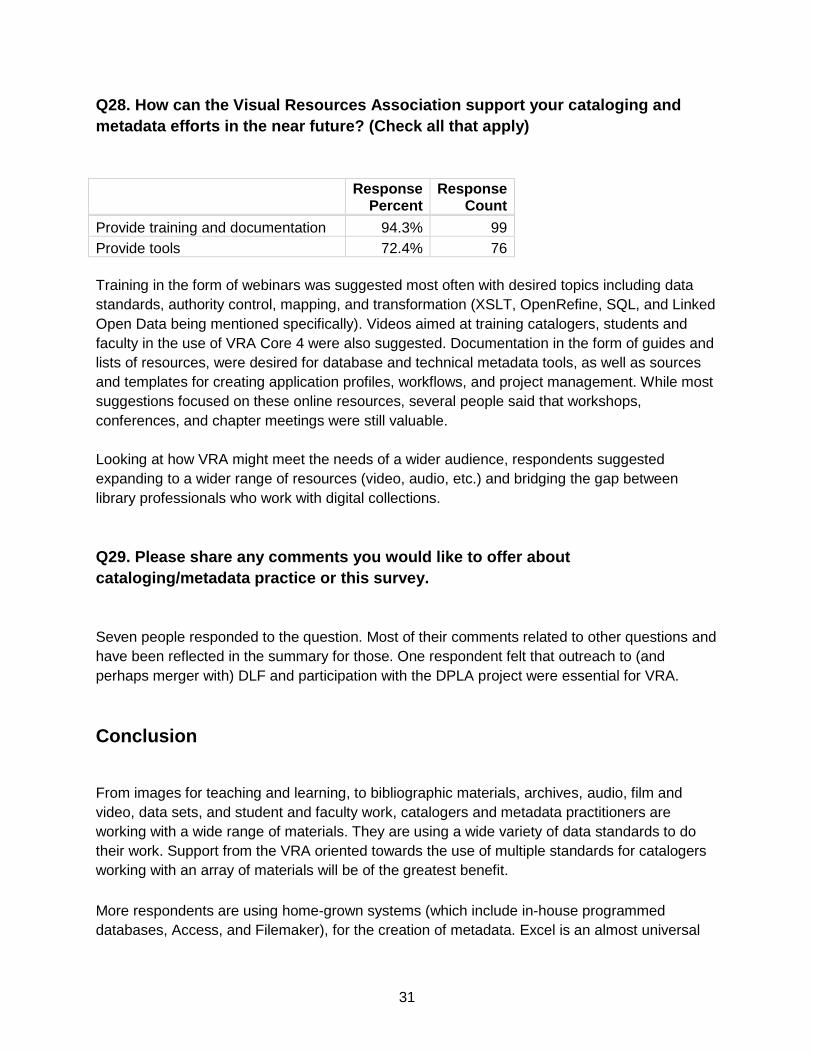
Q28. How can the Visual Resources Association support your cataloging and
metadata efforts in the near future? (Check all that apply)
Response Percent
Response Count
Provide training and documentation 94.3% 99
Provide tools 72.4% 76
Training in the form of webinars was suggested most often with desired topics including data
standards, authority control, mapping, and transformation (XSLT, OpenRefine, SQL, and Linked
Open Data being mentioned specifically). Videos aimed at training catalogers, students and
faculty in the use of VRA Core 4 were also suggested. Documentation in the form of guides and
lists of resources, were desired for database and technical metadata tools, as well as sources
and templates for creating application profiles, workflows, and project management. While most
suggestions focused on these online resources, several people said that workshops,
conferences, and chapter meetings were still valuable.
Looking at how VRA might meet the needs of a wider audience, respondents suggested
expanding to a wider range of resources (video, audio, etc.) and bridging the gap between
library professionals who work with digital collections.
Q29. Please share any comments you would like to offer about
cataloging/metadata practice or this survey.
Seven people responded to the question. Most of their comments related to other questions and
have been reflected in the summary for those. One respondent felt that outreach to (and
perhaps merger with) DLF and participation with the DPLA project were essential for VRA.
Conclusion
From images for teaching and learning, to bibliographic materials, archives, audio, film and
video, data sets, and student and faculty work, catalogers and metadata practitioners are
working with a wide range of materials. They are using a wide variety of data standards to do
their work. Support from the VRA oriented towards the use of multiple standards for catalogers
working with an array of materials will be of the greatest benefit.
More respondents are using home-grown systems (which include in-house programmed
databases, Access, and Filemaker), for the creation of metadata. Excel is an almost universal
32
tool used at some point in the workflow as well. Commercial /proprietary systems are more likely
to be used as display and discovery tools, but in-house programmed (or open source) systems
make a strong showing here as well.
Use of the VRA Core data standard has declined since users were surveyed in 2011. Data
throughout this survey indicates (indirectly) that visual resource collections, and/or workers,
have migrated to libraries (physically and/or administratively) over the last decade; this may be
a factor in the decline. The VRA Core is the fourth most used standard among survey
respondents, and is the preferred standard for catalogers of images for teaching and learning.
This survey points to some concrete suggestions for improving VRA Core 4 use and
understanding including: the need for beginner and introductory materials; outreach to and
participation with other communities of practice; better demonstration of including other material
types like audio and video; better approaches to integrating VRA Core 4 within cataloging tools;
and expansion of mapping and conversion tools (transforms) to facilitate use across (and with)
multiple standards and tools.
The majority of respondents believe they will need new skills in all of the areas listed in the
survey. VRA can support them with resources focused on their professional development in the
areas where there is the most need for their services: collaborative projects; data enhancement;
developing workflows and policies; transforming data; working with new materials; and teaching
and training.
Respondents are either involved in (or interested in getting involved in) linked data, generating
XML, and migrating to RDF. These are growth areas in which the VRA can continue to offer
training, tools, and documentation. At least one respondent is unaware that there is already a
VRA Core 4 to RDF transform.
Respondents overwhelming say they would like to see VRA develop professional support in the
near future in the form of training, documentation, and tools. Respondents suggest in their
comments that training webinars and online videos are the most desirable, but several say that
in-person workshops, conferences, and chapter meetings are still valuable.
The survey does suggest areas in which VRA can engage a broader demographic of catalogers
and metadata specialists, and with larger communities of practice. Hopefully this will be of use
as the Visual Resources Association re-defines itself and its mission in the coming years.
Copyright © 2022 FDOKUMEN