A literature review of the root- knot nematodes (Meloidogyne ...
Upload
khangminh22Category
view
2download
0
NEMATODES AS BIOINDICATORS OF SOIL FOOD WEB
HEALTH IN AGROECOSYSTEMS: A CRITICAL ANALYSIS
DISSERTATION
Presented in Partial Fulfillment of the Requirements for
the Degree Doctor of Philosophy in the Graduate
School of The Ohio State University
By
SHABEG SINGH BRIAR
* * * * *
The Ohio State University 2007
Dissertation Committee:
Professor Parwinder S. Grewal, Adviser
Professor Sally A. Miller, Adviser
Professor Casey W. Hoy
Professor Landon H. Rhodes Approved by
Advisers
____________________ ____________________
Plant Pathology Graduate Program

Abstract
Nematodes occupy a central position in the soil food web occurring at multiple
trophic levels and, therefore, have the potential to provide insights into condition of the
soil food webs. I hypothesized that differences in management strategies may have
differential effects on nematode community structure and soil properties. This
hypothesis was tested in three different replicated experiments. In the first study a
conventional farming system receiving synthetic inputs was compared with an
organically managed system and in the second study four different farming strategies
with and without compost application transitioning to organic management were
compared for nematode communities and soil characteristics including soil bulk
density, organic matter, microbial biomass and mineral-N. The third study was aimed
at assessing the indicative value of various nematode measures in five habitats.
Nematode food webs were analyzed for trophic group abundance and by calculating
MI, and enrichment (EI), structure (SI) and channel indices (CI) based on weighted
abundance of c-p (colonizer-persister) guilds.
Bacterivore nematodes were more abundant in the organic than the conventional
whereas the conventional system had higher population of the root lesion nematode,
Pratylenchus crenatus compared with organic system. Organic hay plots had the lowest
populations of P. crenatus compared to corn, soybeans and oats. Enrichment
ii
opportunists c-p 1 and general opportunists c-p 2 bacterivores were higher in composted
than the non-composted strategies. Population of Pratylenchus sp. was significantly
lower but that of c-p 2 plant parasites Tylenchus and Filenchus were higher in the
composted compared with non-composted amended soils. Principal components
analysis indicated that MI, SI and EI contributed the most to differences between the
habitats. Forests and shrublands had highly structured food webs as expected but their
high enrichment may be unique due to the muck soils. Croplands showed a clear
distinction from other habitats with less structured food webs. Turfgrass lawns
occupied an intermediary position between disturbed and unmanaged habitats. Lack of
increase in SI in the organic farming system could be due to the high tillage
requirement, which might have suppressed the population of high c-p value tillage-
sensitive nematodes.
iii
DEDICATED TO MY PARENTS
iv

ACKNOWLEDGMENTS
During the course of my thesis work, there were many people who were
instrumental in helping me. Without their guidance, help and patience, I would have
never been able to accomplish the work of this thesis. First, I wish to thank my
advisers, Dr. Parwinder Grewal and Dr. Sally Miller for intellectual support,
encouragement, and enthusiasm, which made this thesis possible, and for their patience
in correcting both my stylistic and scientific errors.
I thank my advisory committee members, Dr. Casey Hoy and Dr. Landon
Rhodes for their guidance, help, academic support and constructive suggestions that
opened my eyes to much deeper insight in my research project. Also I want to thank all
members of Dr. Grewal’s lab for their compassion, friendship and help, especially Dr.
Ganpati Jagdale. Also I want to thank all the faculty members and staff of the
Department of Plant Pathology for their help, time and the highest level of education. I
would like also, to express my deep respect and gratitude for all members of the
Department of Entomology, where I conducted my entire research project. I do not
want to forget to thank my wife (Ruby), and two sons (Robin and Monty) for their
patience during stressful times.
v

VITA
April 3, 1973.............................................Born-Faridkot, India.
1995 -1997………………………………Master of Science, Nematology and Plant
Pathology, Punjab Agricultural University,
Ludhiana, Punjab, India.
2003-Present…………………………….Graduate Research Associate, The Ohio State
University.
EMPLOYMENT
September 1998-March 2003…………...Assistant Professor of Nematology, Punjab
Agricultural University, Punjab, India.
September 1997-August 1998………...Research Associate, Department of Plant
Pathology, Punjab Agricultural University,
Ludhiana, Punjab, India.
FIELD OF STUDY
Major: Plant Pathology
vi

TABLE OF CONTENTS
Page
Abstract .................................................................................................................……..ii
Dedication .............................................................................................................……..iv
Acknowledgments...................................................................................................….....v
Vita.........................................................................................................................…......vi
List of Tables...........................................................................................................…....ix
List of Figures.....................................................................................................……....xii
Chapters:
1. Introduction...............................................................................………………………....1
2. Soil nematode community, organic matter, microbial biomass and nitro
gen dynamics in field plots transitioning from conventional to organic
management……….....................................................................................…….….......11
2.1 Introduction……………………………………………………………….……......11
2.2 Materials and methods….…………………………………….…………………....14
2.3 Results…………………………………………………………………..……….....18
2.4 Discussion……………………………………………………………………….....20
2.5 Summary…………………………………………………...…………………........24
2.6 References…………………………………………………………………….........26
3. Effect of compost or non-compost based organic transitioning strategies on soil
nematode community, organic matter, microbial biomass and nitrogen dynamics…...44
3.1 Introduction……………………………………………………………………......44
vii
3.2 Materials and methods……………………………………….………………….....47
3.3 Results………………………………………………………………………..……51
3.4 Discussion………………………………………………….……………...………55
3.5 Summary……………………………………………...…………………………...59
3.6 References………………………………...…………………………………….…61
4. An assessment of the indicative value of nematode trophic group abundance
and food web indices in differentiating habitats with a gradient of anthropogenic
impact…...................................................................................................................….79
4.1 Introduction………..……………………………………………………………...79
4.2 Materials and methods…..………………………………………………………..82
4.3 Results……………………………………………………………………………85
4.4 Discussion..………….……………………………….…………………………...88
4.5 Summary………………………………………………………………………….93
4.6 References………………………………………………………………………...94
5. Synthesis and future directions……………………………………………….……..109
Bibliography………………………………………………………………………..122
viii

LIST OF TABLES
Table Page 2.1 List of nematode genera identified at the experimental site in conventional and
organic farming system plots …………………………………………………….35
2.2 Effect of farming systems on nematode trophic groups, root lesion nematode
Pratylenchus crenatus and nematode community indices including
enrichment (EI), structure (SI), and channel index (CI) from spring 2000
to spring 2004…………….....…………………………………………..………..36
2.3 Effect of farming systems on soil bulk density (BD), total organic
matter % (TOM), particulate organic matter (0.05-2 mm) (POM), % mineral
associated organic matter (MAOM) (<0.05 mm), mineral-N (NH4+-N
and NO3--N (µg g-1 dry soil), and microbial biomass-N (MB-N).……….……....37
2.4 Mean soil bulk density (BD), total organic matter % (TOM), particulate organic
matter (0.05-2 mm) (POM), % mineral associated organic matter
(MAOM) (<0.05 mm), mineral-N (NH4+-N and NO3
--N (µg g-1 dry soil), and
microbial biomass-N (MB-N) in conventional and organic arming
systems…………………………...........................................................................38
3.1 Description cropping sequences of four main plot management strategies:
fallow, mixed species hay, low intensity vegetables as open field
vegetables and intensive vegetable production under high tunnels...…….………69
ix

3.2 Effect of main plot strategies and compost on nematode c-p groups
and food web indices [enrichment (ei), structure (si), and channel
index (ci)]..…….….….................................................................................…........70
3.3 Comparison between main plot strategies with and without compost on
nematode c-p guilds (Bf: bacterivore; Ff: fungivores; Om: omnivores;
Pr: predatory and Pp: plant-parasites) from 2003 and 2006 soil
sampling..…………………......................................................…………………....71
3.4 Effect of main plot strategies and compost on soil properties [bulk density
(BD), organic matter % (TOM), % mineral associated organic matter (MAOM)
(<0.05 mm), particulate organic matter (0.05-2 mm) (POM), mineral-N
(NH4+-N and NO3
--N (µg g-1 dry soil), and microbial biomass-N (MB-N)
(µg g-1)]……………......................................................................................……..73
3.5 Mean (SE) of soil properties [bulk density (BD), organic matter % (TOM), %
mineral associated organic matter (MAOM) (<0.05 mm), particulate
organic matter (0.05-2 mm) (POM), mineral-N (NH4+-N and NO3
--N (µg g-1 dry
soil), and microbial biomass-N (MB-N) (µg g-1)] in various
strategies….….……................................................................................……….....74
4.1 Description of different habitats at Huron and Wayne Counties in Ohio……......101
x
4.2 Mean (± SE) values of different nematode indices including maturity (MI),
plant parasitic (PPI), enrichment (EI), structure (SI), channel (CI)
and Shannon diversity indices (H’) and trophic groups used in the multivariate
analysis.…………...........................................................................................…...102
4.3 Multivariate test (Pillai’s trace) based on different nematode indices
including MI, PPI, EI, SI, CI and H’ comparing the habitats within muck
soils…………….............................................................................................…...103
4.4 Multivariate test (Pillai’s trace) based on different nematode indices including
MI, PPI, EI, SI, CI and H’ comparing turfgrass lawns vs croplands habitats
within mineral soils and with muck soils turfgrass lawns and
croplands……….........................................................................................……..104
4.5 Eigenanalysis of the correlation matrix for nematode indices including
MI, PPI, EI, SI, CI and H’ for all
habitats………………………...............................……………….……………..105
4.6 Eigenanalysis of the correlation matrix for nematode trophic groups for all
habitats…………………………………………………………………………..106
5.1 List of genera of plant-parasitic nematodes………..……………………………118
xi

LIST OF FIGURES
Figure Page
1.1 Framework of nematode faunal analysis as an indicator of the likely conditions
of the soil food web…………………………………………….……....................4
2.1 Bars represent mean precipitation in inches per month from year 2000-2004. Line
graph shows a mean of 5 years air temperature each month from January to
December…………………………………………………………………………..39
2.2 Mean (± SE) nematode trophic groups: bacterivore (A), fungivore (B), omnivore
(C), predatory (D), total plant-parasitic nematodes (E) and root lesion nematode
Pratylenchus crenatus (F) per 10g soil in organic and conventional farming
systems from spring 2000 to spring 2004.………………….....................…...........40
2.3 Mean (± SE) soil population of Pratylenchus crenatus from year 2000 to 2003
comparing corn, soybean, oats and hay. Treatments within a group with the same
letter are not significantly different (p ≤ 0.05) by Fishers’s LSD test between the
crops…………………………………………………………………………….....41
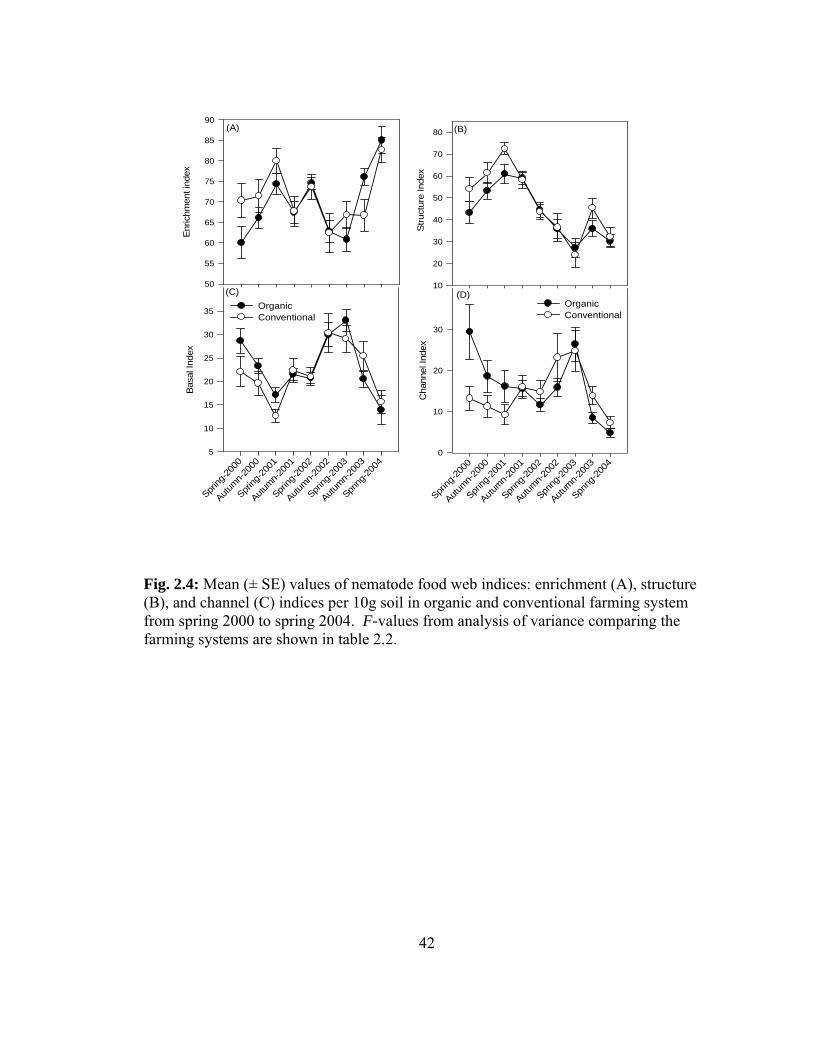
2.4 Mean (± SE) values of nematode food web indices: enrichment (A),
structure (B), and channel (C) indices per 10g soil in organic and conventional
farming system from spring 2000 to spring 2004...................................................42
xii

2.5 Comparison and temporal progression of the food web indicated by nematode
faunal analysis in organic and conventional farming systems from spring 2000 to
spring 2004. Numbers 1-9 represent the progression of changes in the fauna
in each farming system...……….…………………………………………………43
3.1 Effect of various strategies on abundance of root lesion nematode
Pratylenchus and root hair feeders (Tylenchus + Filenchus).……………………...75
3.2 Food webs indicated by nematode faunal analysis in 8 sub plot management
strategies in 2003-2006.……………………..………………........................…….76
3.3 Canonical correlation analysis of soil factors vs nematode c-p guilds………........77
3.4 Bars represent month mean soil temperature (January-December)………….........78
4.1 Principal components analysis of nematode indices.………………………….....107
4.2 Principal components analysis of nematode trophic group abundance.….…........108
5.1 Percent ectoparasites, free-living and endoparasites in total nematode
community in different habitats………..................................……………….…...109
5.2 Comparison of the abundance of ectoparasitic nematodes in corn, soybeans, oats
and hay………………………………………………………………………........120
5.3 Effect of composted and non-composted farming strategies on Pratylenchus sp.
and plant-parasitic nematode c-p guild 2 consisting mainly of Tylenchus and
Filenchus……………………………………………………………………….....121
xiii

CHAPTER 1
INTRODUCTION
Nematodes or roundworms inhabit virtually all ecosystems including marine,
freshwater, and terrestrial environments. They encompass the phylum Nemata that
includes plant, insect, animal and human parasites and predatory forms that consume
microorganisms including bacteria, fungi, algae, and other nematodes (Platt, 1994). In
general nematodes are small, usually less than a millimeter in length, with the exception
of some animal parasitic nematodes, which are rather large and can be seen by the naked
eye (Wallace et al., 1996). Several nematode genera are important as pests of crops and
animals while others contribute to nutrient mineralization (Ferris and Matute, 2003) and
control of plant pests and pathogens (Grewal et al., 2005).
The soil food web a plethora of soil organisms including bacteria, fungi,
nematodes, annelids and arthropods is dependent primarily on autotrophic input from
plants or other external sources including organic matter (Ferris and Bongers, 2006).
Assessment of soil health through complete analysis of such a diverse group of organisms
may require several extraction techniques, which is technically daunting (Ritz and
1
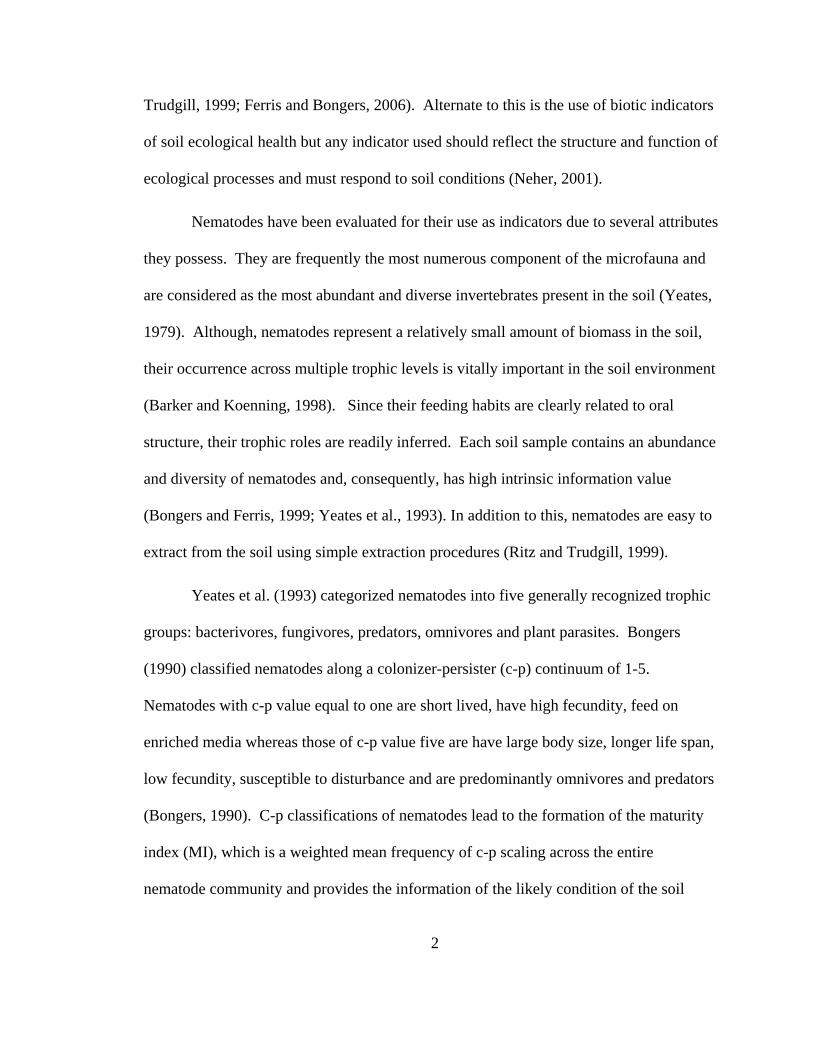
Trudgill, 1999; Ferris and Bongers, 2006). Alternate to this is the use of biotic indicators
of soil ecological health but any indicator used should reflect the structure and function of
ecological processes and must respond to soil conditions (Neher, 2001).
Nematodes have been evaluated for their use as indicators due to several attributes
they possess. They are frequently the most numerous component of the microfauna and
are considered as the most abundant and diverse invertebrates present in the soil (Yeates,
1979). Although, nematodes represent a relatively small amount of biomass in the soil,
their occurrence across multiple trophic levels is vitally important in the soil environment
(Barker and Koenning, 1998). Since their feeding habits are clearly related to oral
structure, their trophic roles are readily inferred. Each soil sample contains an abundance
and diversity of nematodes and, consequently, has high intrinsic information value
(Bongers and Ferris, 1999; Yeates et al., 1993). In addition to this, nematodes are easy to
extract from the soil using simple extraction procedures (Ritz and Trudgill, 1999).
Yeates et al. (1993) categorized nematodes into five generally recognized trophic
groups: bacterivores, fungivores, predators, omnivores and plant parasites. Bongers
(1990) classified nematodes along a colonizer-persister (c-p) continuum of 1-5.
Nematodes with c-p value equal to one are short lived, have high fecundity, feed on
enriched media whereas those of c-p value five are have large body size, longer life span,
low fecundity, susceptible to disturbance and are predominantly omnivores and predators
(Bongers, 1990). C-p classifications of nematodes lead to the formation of the maturity
index (MI), which is a weighted mean frequency of c-p scaling across the entire
nematode community and provides the information of the likely condition of the soil
2
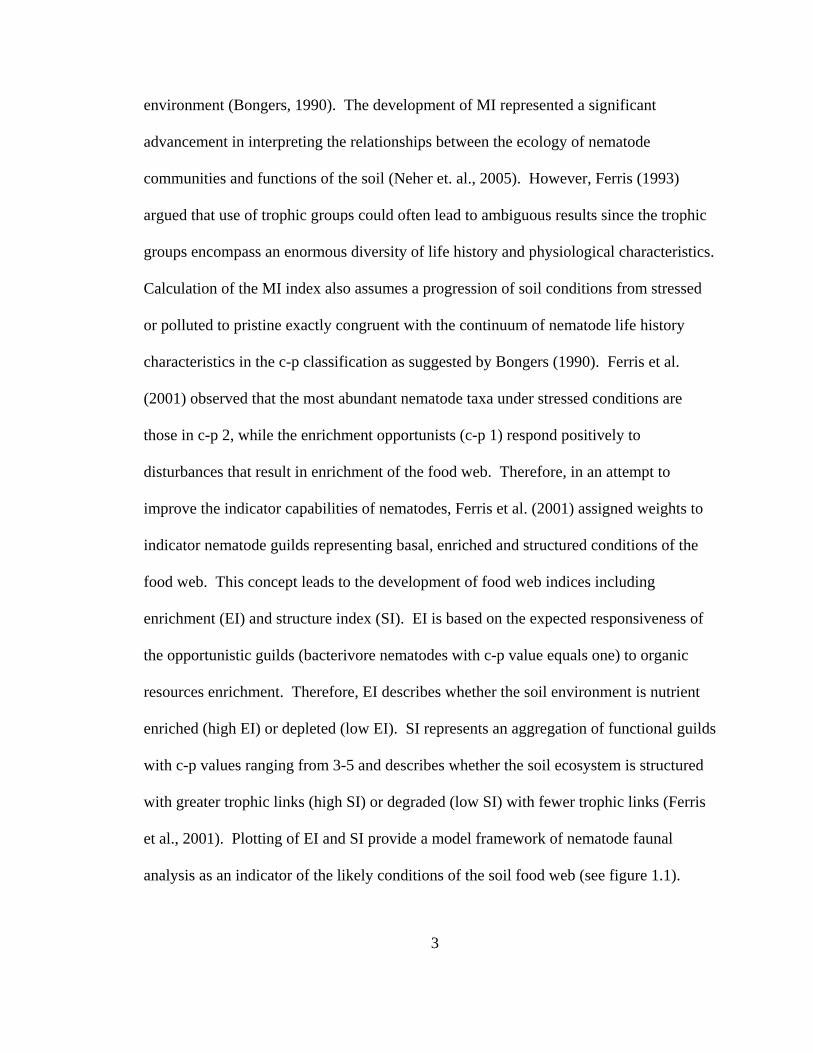
environment (Bongers, 1990). The development of MI represented a significant
advancement in interpreting the relationships between the ecology of nematode
communities and functions of the soil (Neher et. al., 2005). However, Ferris (1993)
argued that use of trophic groups could often lead to ambiguous results since the trophic
groups encompass an enormous diversity of life history and physiological characteristics.
Calculation of the MI index also assumes a progression of soil conditions from stressed
or polluted to pristine exactly congruent with the continuum of nematode life history
characteristics in the c-p classification as suggested by Bongers (1990). Ferris et al.
(2001) observed that the most abundant nematode taxa under stressed conditions are
those in c-p 2, while the enrichment opportunists (c-p 1) respond positively to
disturbances that result in enrichment of the food web. Therefore, in an attempt to
improve the indicator capabilities of nematodes, Ferris et al. (2001) assigned weights to
indicator nematode guilds representing basal, enriched and structured conditions of the
food web. This concept leads to the development of food web indices including
enrichment (EI) and structure index (SI). EI is based on the expected responsiveness of
the opportunistic guilds (bacterivore nematodes with c-p value equals one) to organic
resources enrichment. Therefore, EI describes whether the soil environment is nutrient
enriched (high EI) or depleted (low EI). SI represents an aggregation of functional guilds
with c-p values ranging from 3-5 and describes whether the soil ecosystem is structured
with greater trophic links (high SI) or degraded (low SI) with fewer trophic links (Ferris
et al., 2001). Plotting of EI and SI provide a model framework of nematode faunal
analysis as an indicator of the likely conditions of the soil food web (see figure 1.1).
3

Further, Ferris et al. (2001) also proposed the channel index (CI), which is a percentage
of fungivores among the total fungivores and c-p one opportunists bacterivores. CI
indicates predominant decomposition channels in the soil food web, a high CI (> 50 %)
indicates fungal decomposition channels whereas low CI (< 50 %) suggests bacterial
decomposition channels (Ferris et al., 2001). In later studies use of these indices
provided critical information about below ground processes in distinct agroecosystems
(Bulluck et al., 2002b; Ferris and Matute, 2003; Neher et al., 2005).
4

From Ferris et al., 2001.
Figure 1.1: Functional guilds of soil nematodes characterized by feeding habit (trophic
group) and by life history characteristics expressed along a colonizer-persister (cp) scale
(cp scale proposed by Bongers and Bongers, 1998). Bax (bacterivores), Fux (fungivores),
Cax (carnivores), Omx (omnivores) (where value of x = 1-5 on the cp scale) represents
various functional guilds. Indicator guilds of soil food web condition (basal, structured,
enriched) are designated and weightings of the guilds along the structure and enrichment
trajectories are provided, for determination of the enrichment index (EI) and structure
index (SI) of the food web.
5

Synthetic fertilizers, pesticides, and herbicides are important inputs in
conventional agricultural systems and have been shown to impact diversity and
abundance of nematode trophic groups (Yeates and Bongers, 1999). However, organic
farming depends on the addition of organic matter to the soil in the form of green manure
cover crops and decomposed or partially decomposed animal wastes such as poultry or
beef manure. These alternate crop raising and management strategies aim at reduction or
elimination of synthetic inputs (McSorley and Frederick, 1999), environmental pollution
due to chemical fertilizers and pesticides, and losses emanating from diseases and pests.
Organic amendments have been shown to reduce soil bulk density and increase soil
nitrogen and carbon supply (Drinkwater et al., 1995, Bulluck et al., 2002a). Although
various organic amendments can have differential effects on soil properties and nematode
communities (Nahar et al., 2006), all tend to increase availability of nutrients, such as
nitrogen, microbial biomass and abundance of bacterivore and fungivore nematodes
(Bulluck et al., 2002; Ferris et al, 1996). An increase in organic matter in the soil
increases microbial biomass by providing an enlarged food base for free-living
nematodes (Papatheodorou et al., 2004). We hypothesized that differences in inputs and
management strategies employed in organic and conventional farming would have
differential effects on soil properties and nematode community structure that may have
consequences for the sustainability of the agroecosystems.
In the present study we intended to thoroughly investigate the model proposed by
Ferris et al. (2001) for the assessment of the soil food webs in different farming strategies
6

practiced in Ohio. Specific objectives were to 1) evaluate the effects of crops and
different management strategies on the dynamics of nematode communities (free-living
and plant parasitic) in replicated field plot trials during transition from conventional to
organic management, 2) determine the relationship between nematode c-p (colonizer-
persister) guilds and soil properties and 3) quantify the relative importance of nematode
community measures to discriminate habitats using multivariate analysis.
THESIS
Nematodes are a diverse, highly speciated group of organisms, occupy key
positions at most trophic levels in soil food webs and therefore, have the potential to
provide insights into soil health. Differences in management strategies may have
differential effects on nematode community structure and soil properties. These changes
are effectively reflected by the nematodes. A development of practical understanding
from the research generated would help in choosing farming strategies for increasing
beneficial free-living nematodes and suppressing harmful plant parasitic nematodes.
REFRENCES
Bongers, T., 1990. The maturity index: an ecological measure of environmental
disturbance based on nematode species composition. Oecologica 83, 14-19.
Bulluck III, L.R., Brosius, M., Evanylo, G.K., Ristaino, J.B., 2002a. Organic and
synthetic fertility amendments influence soil microbial, physical and chemical
properties on organic and conventional farms. App. Soil Ecol. 19, 147-160.
7

Bulluck III, L.R., Barker, K.R., Ristaino, J.B., 2002b. Influences of organic and synthetic
soil fertility amendments on nematode trophic groups and community dynamics
under tomatoes. Appl. Soil Ecol. 21, 233-250.
Ferris, H., Bongers, T., 2006. Nematode indicators of organic enrichment. J. Nematol.
38, 3-12.
Ferris, H., 1993. New frontiers in nematode ecology. J. Nematol. 25, 374-382. Ferris, H., Venette, R.C., Lau, S.S., 1996. Dynamics of nematode communities in
tomatoes grown in conventional and organic farming systems and their impact on
soil fertility. Appl. Soil Ecol. 3, 161-175.
Yeates, G.W., Bongers, T., De Goede, R.G.M., Freckman, D.W., Georgieva, S.S., 1993.
Feeding habits in soil nematode families and genera–an outline for soil ecologists.
J. Nematol. 25, 315-331.
Barker, K.R., Koenning, S.R., 1998. Developing sustainable systems for nematode
management. Ann. Rev. Phytopathol. 36, 165-205.
Drinkwater, L.E., Letourneau, D.K., Workneh, F., van Bruggen, A.H.C., Shennan, C.,
1995. Fundamental differences between conventional and organic tomato
agroecosystems in California. Ecol. Appl. 1098-1112.
Ferris, H., Bongers, T., de Geode, R.G.M., 2001. A framework for soil food web
diagnostics: extension of the nematode faunal analysis concept. Appl. Soil Ecol.
18, 13-29.
8
Ferris, H., Matute, M., 2003. Structural and functional succession in the nematode fauna
of a soil food web. Appl. Soil Ecol. 23, 93-110.
Grewal, P.S., Ehlers, R.U., Shapiro-Ilan, D.I. (Eds.). 2005. Nematodes As Biocontrol
Agents. CABI Publishing, CAB International, Oxon, U.K., pp. 1-505
McSorley, R., Frederick, J.J., 1999. Nematode population fluctuations during
decomposition of specific organic amendments. J. Nematol. 31, 37-44.
Nahar, M.S., Grewal, P.S., Miller, S.A., Stinner, D., Stinner, B.R., Kleinhenz, M.D.,
Wszelaki, A., Doohan, D., 2006. Differential effects of raw and composted
manure on nematode community, and its indicative value for soil microbial,
physical and chemical properties. App. Soil Ecol. 34, 140-151.
Neher, D.A., 2001. Role of nematodes in soil health and their use as indicators. J.
Nematol. 33, 161-168.
Papatheodorou, E.M., Argyropoulou, M.D., Stamou, G.P., 2004. The effects of large-
and small-scale differences in soil temperature and moisture on bacterial
functional diversity and the community of bacterivorous nematodes. App. Soil
Ecol. 25, 37-49.
Platt, H.M., 1994. In The Phylogenetic Systematics of Free-living Nematodes, S.
Lorenzen, (Ed.) The Ray Society, London, pp 383.
Porazinska, D.L., Duncan, L.W., McSorley, R., Graham, J.H., 1999. Nematode
communities as indicators of status and processes of a soil ecosystem influenced
by agricultural management practices. Appl. Soil Ecol. 13, 69-86.
9

Ritz, K., Trudgill, D.L., 1999. Utility of nematode community analysis as an integrated
measure of the functional state of soils: perspectives and challenges. Plant Soil
212, 1-11.
Wallace, R.L., Ricci, C., Melone, G., 1996. A cladistic analysis of pseudocoelomate
(aschelminth) morphology. Invertebrate Biology 115, 104-112.
Yeates, G.W., 1979. Soil nematodes in terrestrial ecosystems. J. Nematol. 11, 213-229.
Yeates, G.W., Bongers, T., 1999. Nematode diversity in agroecosystems. Agric. Ecosys.
Environ. 74, 113-135.
Neher, D.A., Wub, J., Barbercheck, M.E., Anas, O., 2005. Ecosystem type affects
interpretation of soil nematode community measures. App Soil Ecol. 30, 47-64.
10

CHAPTER 2
SOIL NEMATODE COMMUNITY, ORGANIC MATTER, MICROBIAL
BIOMASS AND NITROGEN DYNAMICS IN FIELD PLOTS TRANSITIONING
FROM CONVENTIONAL TO ORGANIC MANAGEMENT
2.1 INTRODUCTION
Nematodes are abundant and diverse invertebrates present in the soil (Yeates,
1979). They are considered an important component of the soil biotic community and
assessment of nematode fauna provides a unique insight into soil biological processes
(Ritz and Trudgill, 1999). Nematodes play a critical role in decomposition and nutrient
cycling (Ferris et al., 2004; Ferris and Matatue, 2003; Ingham et al., 1985; Wright, 1998).
Free-living nematodes that feed on bacteria and fungi (as opposed to plants) contribute as
much as 27% of the readily available nitrogen in the soil (Ekschmitt et al., 1999) and also
promote rhizosphere colonization of beneficial rhizobacteria (Kimpinski and Sturz, 1996;
Knox et al., 2003). Nahar et al. (2006) observed a negative correlation between free-
living and plant parasitic nematodes in organically grown tomatoes. Therefore, one of
the major goals of sustainable agriculture should be to enhance populations of free-living
nematodes and reduce that of plant-parasitic nematodes.
11
Synthetic fertilizers, pesticides, and herbicides are important inputs in
conventional agricultural systems. Insecticide and mineral fertilizer applications have
been shown to impact diversity and abundance of nematode trophic groups (Yardim and
Edwards, 1998; Yeates and Bongers, 1999; Yeates et al., 1999; Sohlenius and
Wasilewska, 1984; Sarathchandra et al., 2001; Sohlenius, 1990; Sohlenius and Boström,
1986; Neher and Olson, 1999). By contrast, organic farming depends on the addition of
organic matter to the soil in the form of green manure cover crops and decomposed or
partially decomposed animal wastes such as poultry or beef manure. These alternate crop
raising and management strategies aim at reduction or elimination of synthetic inputs
(Mian and Rodríguez-Kàbana, 1982; Abawi and Widmer, 2000; McSorley and Frederick,
1999), environmental pollution due to chemical fertilizers and pesticides, and losses
emanating from diseases and pests. Organic amendments have been shown to reduce soil
bulk density and increase soil nitrogen and carbon supply (Doran, 1995; Drinkwater et
al., 1995, Bulluck et al., 2002a; Werner, 1997). Although various organic amendments
can have differential effects on soil properties and nematode communities (Nahar et al.,
2006), all tend to increase availability of nutrients such as nitrogen, microbial biomass
and abundance of bacterivore and fungivore nematodes (Gunapala and Scow, 1998;
Freckman, 1988; Griffiths et al., 1994; Bulluck et al., 2002b; Ferris et al, 1996, 1999).
Increase in organic matter in the soil increases microbial biomass by providing an
enlarged food base for free-living nematodes (Papatheodorou et al., 2004; Alon and
Steinberger, 1999; Bongers and Ferris, 1999; Ferris et al., 1999; McSorley and Frederick,
1999). The U.S. National Organic Standards Act requires an organic farming
certification process to manage soil fertility through crop rotation and cover crops,
12

supplemented with animal and crop wastes, while strictly restricting synthetic chemical
inputs. Although addition of organic amendments improves soil health, frequent tillage is
required for mixing organic inputs and to manage weeds in certified organic farms.
Frequent tillage may affect the soil ecosystem by changing the microbial and nematode
trophic structure (Parmelee and Alston, 1986; Fu et al., 2000; Ferris et al., 2001, 2004;
Wang et al., 2004). Berkelmans et al. (2003) observed that organic and low synthetic
input farming practices favored multiplication of bacterivore, omnivore and predatory
nematodes and suppressed root lesion nematode (Pratylenchus thornei) compared to
conventional management. They also observed that severe disruption caused by frequent
tillage operations in the organic farming system decreased the structure index (SI) (an
indicator of greater trophic links and healthy ecosystem; Ferris et al., 2001) to the level of
a conventional system. Other factors such as soil compaction, irrigation and crop rotation
may also impact the soil nematode community (Bouwman and Arts, 2000; López-Fando
and Bello, 1995; McSorley and Gallaher, 1994).
This paper compares the long-term effect of two farming systems, which differ
primarily in external inputs and crop rotation cycles under a field crops agroecosystem.
We hypothesized that differences in management and cropping strategies employed in
organic and conventional farming would have differential effects on soil properties and
nematode community structure thus impacting the sustainability of the systems. This
research is part of the “Organic Food and Farming Education and Research” (OFFER)
program at the Ohio Agricultural Research and Development Center (OARDC), Wooster,
Ohio. The conventional farming system had a corn-soybean rotation and the organic
farming system had a 4-year corn-soybean-oats-hay rotation. Crop rotations were
13

selected keeping in mind the dominant farming practices on agricultural landscapes of
Ohio. To compare between the farming systems we chose the following indicators:
nematode feeding groups (trophic abundance) and nematode food web indices
(enrichment, basal, structure and channel indices), soil organic matter, microbial biomass
and nitrogen dynamics. Assessment of different nematode trophic groups provide
comprehensive insight into soil biological processes (Ritz and Trudgill, 1999) and food
web indices provides critical information about below ground processes in
agroecosystems (Bulluck et al., 2002b; Porazinska et al., 1999; Freckman and Ettema,
1993; Bongers, 1990; Ferris, et al., 1996; Ferris et al., 2001). Nematode faunal analysis
developed by Ferris et al. (2001) provides a graphical representation of the ‘basal’,
‘structural’ and ‘enrichment’ conditions of the soil food web. Our specific objectives in
this study were to evaluate the effects of crops and management strategies on the
dynamics of organic matter, microbial biomass, nitrogen, and nematode communities
(free-living and plant parasitic) in replicated field plots during transition from
conventional to organic management.
2.2 MATERIALS AND METHODS
2.2.1. Site description, treatments and field plot design
A long-term field crop transition experiment was established in spring 2000 at the
field crops research area at the OARDC, Wooster, Ohio (40° 47' N, 81° 55' W; 310 m
elevation). Monthly average precipitation and air temperature for the period of study are
shown in Figure 2.1. The soil at the experimental site was classified as Wooster silt
loam. The experiment had a split block design with two farming systems as main plots,
14

replicated 6 times and all phases of the rotation were present every year. Each block
consisted of four subplots representing complete rotation in organic and two subplots
representing complete rotation in conventional farming system. The organic farming
system comprised of a corn-soybeans-oats-hay (mixture of red clover and timothy)
rotation and the conventional system had corn-soybeans rotation. Individual plots
measured 18 x 18 m. Organic corn received raw straw pack beef manure at the rate of 27
Mg/ha and poultry compost manufactured by DayLay at the rate of 28 Mg/ha. Oats
received raw straw pack manure at the rate of 18 Mg/ha and poultry compost 1.8 Mg/ha.
The conventional corn received starter fertilizers (19:19:19) at the rate of 192 kg and side
dressed with liquid fertilizer (28% N) 385 L per ha. Crops in both systems were rainfed
and there was no external source of Irrigation. Primary tillage in organic plots was given
by chisel plow, disked or harrowed 6” deep twice and tined. Weed control was
mechanical and typical operations included at least two diskings and or field cultivations
before planting, two rotary hoeings or tine weedings soon after planting and two row
cultivations. Conventional soybeans were sown without cultivation and primary tillage
was applied only in corn plots. In the conventional farming system weeds were managed
using herbicides Accent (nicosulfuron) at the rate of 162g + 70g Exceed (prosulfuron)
and 625ml Round-up [N- (phosphonomethyl) glycine] per ha in corn and soybeans,
respectively.
2.2.2. Soil sampling
Soil samples were collected twice each year during spring before addition of
organic matter at the beginning of cropping season and in autumn after crop senescence
or at the end of the cropping season. Three soil cores (5 cm diameter and 15 cm deep)
15

were removed from each plot using a soil auger from three positions: i) in row, ii) in-
between rows and iii) mid way between the two. Samples were mixed thoroughly to
form a composite sample to reduce the variance associated with aggregated spatial
patterns of nematodes in the soil (Barker and Campbell, 1981). Large plant parts or
stones were removed from the samples by passing them through a soil sieve (6 mm
mesh). All soil samples were stored in the dark overnight at 5oC and existing field
moisture was maintained to minimize changes in nematode population (Barker et al.,
1969). Soil samples were collected nine times from spring 2000 to spring 2004.
2.2.3 Nematode extraction, identification and counting
Nematodes were extracted from a 10 g subsample taken from each composite soil
sample using the Baermann funnel technique (Flegg and Hooper, 1970). Nematodes
were collected after 72 h, heat killed, and fixed with triethanolamine formaldehyde (TAF)
solution (Shepherd, 1970). Specimens were identified to the genus level using an
inverted microscope at 40X magnification. Diagnostic keys by Goodey (1963), Siddiqui
(1986), and Jairajpuri and Ahmed (1992) and the University of Nebraska Lincoln
nematode identification website (http://nematode.unl.edu/konzlistbutt.htm) were used.
All identified nematode genera were assigned to a trophic group (plant-parasitic, fungal
feeder, bacterial feeder, omnivore, or predatory) according to Yeates et al. (1993).
Nematode genera were also assigned a colonizer-persister value (c-p value) according to
Bongers (1990). Numbers of nematodes were not corrected for extraction efficiency.
2.2.4. Soil properties
Soil bulk density, organic matter, mineral associated organic matter (<0.05 mm),
particulate organic matter (0.05-2 mm), mineral-N (NH4+-N and NO3
-N), and dissolved
16
organic-N, were analyzed at the Field Crop Ecology Laboratory, OARDC, Wooster,
using standard methods (Sims et al., 1995). Microbial biomass-N was determined using
modified chloroform fumigation method (Brookes et al., 1985).
2.2.5. Food web evaluation
The enrichment index (EI), structure index (SI) and basal index (BI) were
calculated according to Ferris et al. (2001), with basal components (b) of the food web
(fungal and bacterial feeders in the c-p 2 guild) calculated as b = ∑kbnb where kb is the
weighted constant for the guild, and n is the number of nematodes in that guild.
Enrichment (e) and structure (s) components were similarly calculated, using nematode
guilds indicative of enrichment (bacterivores of c-p 1, and fungivores of c-p 2), and
guilds supporting structure (bacterivores of c-p 3-5, fungivores of c-p 3-5, omnivores of
c-p 3-5, and predatory nematodes of c-p = 2-5). Finally, the EI was calculated as 100x
e/(e + b), and the SI as 100x s/(s + b). Channel Index (CI), which provides an index of
nature of decomposition, was calculated as 100 x (0.8 fungivores cp 2/ (3.2 of
bacterivores of c-p 1 + 0.8 fungivores of c-p 2) where the coefficients are the ke
enrichment weightings for the respective guilds (Ferris et al., 2001).
2.2.6. Statistical analysis
Farming systems were compared for nematode trophic groups, various food web
indices, and soil properties, using repeated measures analysis of variance (PROC GLM,
SAS Ver. 9.00, SAS Institute, Cary, NC) and F-values for the split block experimental
design were obtained using an appropriate error term in the model. Results from both
multivariate and univariate repeated measures are presented. No significant interaction
was observed between crops and farming systems except for population abundance of
17

root lesion nematode Pratylenchus crenatus. Therefore the comparison between the crops
was made only for this nematode using Fisher’s LSD mean separation test. Nematode
population data were transformed as ln (x+1) prior to statistical analysis to normalize the
variance in the data.
2.3. RESULTS
2.3.1. Effect of farming systems and crop rotation on nematode communities
Nematode genera identified are shown in Table 2.1 in both farming systems.
Among the most abundant genera were Rhabditis, Cephalobus, Acrobeloides,
Monhystera, Mononchus, Aphelenchoides, Aphelenchus, Pratylenchus, Paratylenchus,
Tylenchus and Filenchus. A small number of juveniles of Heterodera and Longidorus
were found, and only until 2001. Mesodorylaimus, Wilsonema, Placodera, Psilenchus,
Hoplotylus, Helicotylenchus, Trichodorus and Tylenchorynchus were found in low
numbers in both farming systems. Although farming systems differed in abundance of
trophic groups, all genera identified occurred common in both farming systems.
Populations of bacterivore nematodes were significantly higher in organic than
the conventional farming system for most of the study periods (Fig. 2.2A). Overall test
for comparison also showed that farming systems differed significantly for the abundance
of bacterivore nematodes (F = 13.94, P = 0.01) (Table 2.2). No significant differences
were observed between the farming systems for fungivore nematodes (F = 3.57, P =
0.10), omnivore (F = 0.33, P = 0.59) and predatory nematodes (F = 0.04, P = 0.84)
(Table 2.2, Fig. 2.2 B, C and D). Both multivariate and univariate analyses yielded a
significant time x farming system interactions for fungivore and bacterivore nematodes
18
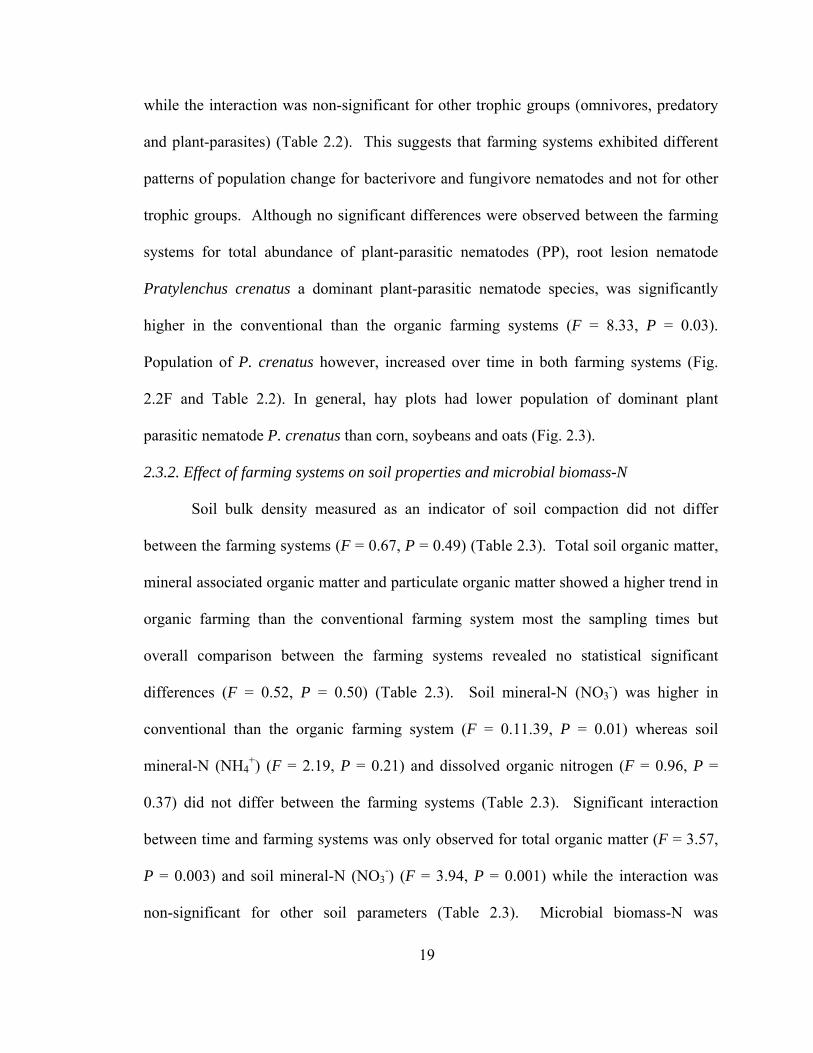
while the interaction was non-significant for other trophic groups (omnivores, predatory
and plant-parasites) (Table 2.2). This suggests that farming systems exhibited different
patterns of population change for bacterivore and fungivore nematodes and not for other
trophic groups. Although no significant differences were observed between the farming
systems for total abundance of plant-parasitic nematodes (PP), root lesion nematode
Pratylenchus crenatus a dominant plant-parasitic nematode species, was significantly
higher in the conventional than the organic farming systems (F = 8.33, P = 0.03).
Population of P. crenatus however, increased over time in both farming systems (Fig.
2.2F and Table 2.2). In general, hay plots had lower population of dominant plant
parasitic nematode P. crenatus than corn, soybeans and oats (Fig. 2.3).
2.3.2. Effect of farming systems on soil properties and microbial biomass-N
Soil bulk density measured as an indicator of soil compaction did not differ
between the farming systems (F = 0.67, P = 0.49) (Table 2.3). Total soil organic matter,
mineral associated organic matter and particulate organic matter showed a higher trend in
organic farming than the conventional farming system most the sampling times but
overall comparison between the farming systems revealed no statistical significant
differences (F = 0.52, P = 0.50) (Table 2.3). Soil mineral-N (NO3-) was higher in
conventional than the organic farming system (F = 0.11.39, P = 0.01) whereas soil
mineral-N (NH4+) (F = 2.19, P = 0.21) and dissolved organic nitrogen (F = 0.96, P =
0.37) did not differ between the farming systems (Table 2.3). Significant interaction
between time and farming systems was only observed for total organic matter (F = 3.57,
P = 0.003) and soil mineral-N (NO3-) (F = 3.94, P = 0.001) while the interaction was
non-significant for other soil parameters (Table 2.3). Microbial biomass-N was
19

significantly higher in the organic as compared to conventional farming system (F =
25.10, P = 0.004) (Table 2.3). In spring 2003, both the farming systems showed a drop in
microbial biomass compared to all other sampling times which was later bounced back in
the next season autumn 2003 (Table 2.3).
2.3.3. Food web evaluation
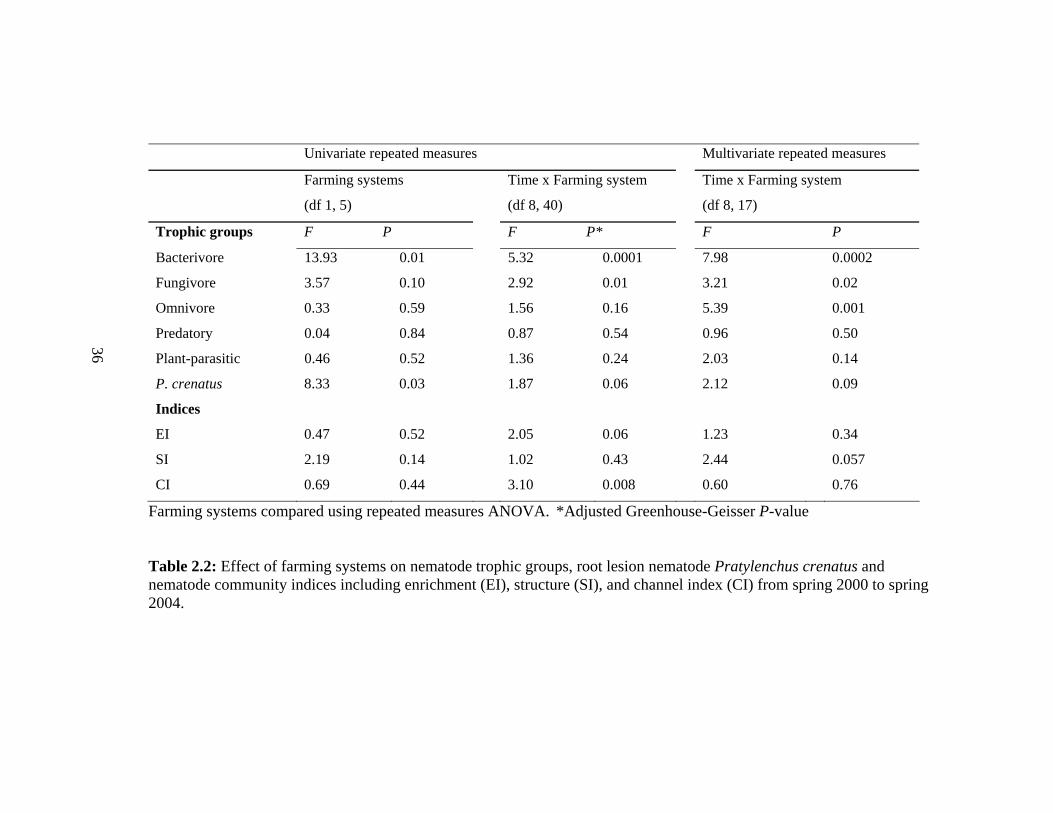
The structure (F = 2.19, P = 0.14), enrichment (F = 0.47, P = 0.52) and channel
indices (F = 0.69, P = 0.44) were not significantly different between farming systems
(Table 2.2; and Fig. 2.4A, B and C). The enrichment index showed abrupt changes over
time in both farming systems, with lowest values in autumn 2002 and spring 2003 in
conventional and organic, respectively, and highest in spring 2004 in both systems
compared. The structure index increased from spring 2000 to spring 2001 and thereafter
declined until spring 2003 and slightly increased in autumn 2003 in both systems (Fig.
2.4A, B and C). Nematode faunal analysis based on plotting enrichment and structure
indices revealed values in quadrat A and B (Fig. 2.5) in both conventional and organic
farming systems. Significant interaction between the farming system and time was only
observed for channel index (F = 3.10, P = 0.008) and not for enrichment (F = 2.05, P =
0.06) and structure indices (F = 1.02, P = 0.43) (Table 2.2).
2.4. DISCUSSION
Soil bulk density monitored as an indicator of soil compaction did not differ
between the two farming systems in this study. Frequent use of agricultural machinery
usually results in increase in soil compaction (Bouwman and Arts, 2000). Therefore,
higher frequency of tillage operations in organic compared to the conventional
20

management should have resulted in higher bulk density in the organic system. The lack
of differences in soil bulk density in the two systems may be attributed to the buffering
effect of the large amounts of organic matter added in the organic system. Organic inputs
including the addition of compost, animal manures and cover crops have been shown to
reduce soil bulk density (Werner, 1997; Drinkwater et al., 1995; Bulluck et al., 2002a).
We found that total organic matter, mineral associated organic matter and particulate
organic matter contents were trended higher in the organic than in the conventional
system. These findings are consistent with other studies where applications of organic
amendments have been shown to increase soil organic matter (Clark et al., 1999; Borken
et al., 2002; Nahar et al., 2006; Tu et al., 2006). Therefore, it is possible that the potential
effects of extra tillage on soil bulk density in organic farming are mitigated by the
addition of organic matter.
This study clearly showed that microbial biomass-N was significantly higher in
the organic compared to the conventional farming system. In contrast, N in the mineral
pools was higher in the conventional than the organic system as indicated by significantly
higher NO3-N pools at least at four sampling times. These findings demonstrate clear
shifts in nitrogen pools between the two systems. Other studies have also observed shifts
in nitrogen pools in organic and conventional systems (Tu et al., 2006; Clark et al., 1999;
Poudel et al., 2001). Although N levels generally start out lower in organic systems,
they increase gradually exceeding those in conventional farming systems by the end of
transition period (Clark et al., 1999). We found that after the transition period was
completed, the organic system had slightly higher N than the conventional farming
system (although not statistically significant). Therefore, to prevent yield losses
21

resulting from low availability of N, Tu et al. (2006) suggested gradual or partial
reduction in synthetic inputs in farming systems transitioning to organic instead of
immediate withdrawal of all conventional inputs during the transition period. The fact
that the organic system recovers from N drop after the transition period indicates the
long-term sustainability of the system as the N pools are predominantly controlled by
microbial biomass compared to highly labile NO3-N in case of the conventional system.
This microbial control of N availability results in slow release of N and reduces N-
leaching substantially (Dalal, 1998; Friedel et al., 2001).
The abundance of free-living nematodes, mainly represented by bacterivores, was
higher in the organic than the conventional system for most of the study period. Other
trophic groups including fungivore, omnivore and predatory nematodes were different
between the systems only from autumn 2000 to autumn 2001. Generally, external
organic matter inputs in the form of compost, animal manures and cover crops increase
energy availability for the soil microbes thereby enhancing microbial activity and
biomass (Lundquist et al., 1999; Gunapala and Scow, 1998; Powlson et al., 1987; Alon
and Steinberger, 1999). Therefore, the observed increase in the abundance of bacterivore
nematodes could be attributed to the increase in the microbial biomass (Ferris et al.,
1996). Further, evidence of the positive relationship between abundance of free-living
nematodes and microbial biomass-N comes from the coupled dynamics of these two
parameters observed in our study. Both the free-living nematodes and microbial
biomass-N showed a sharp decline in spring 2003 in both the farming systems in this
study, which was most likely due to extreme dry conditions during the summer of 2002.
Interestingly, microbial biomass levels bounced back to 2002 levels in autumn 2003
22

followed by bacterivore nematode increase in spring 2004. The delayed response of free-
living nematodes to increase in soil microbial biomass-N has been previously reported by
Papatheodorou et al. (2004) who observed that bacterivore nematodes increased only
months after the increase in populations of bacteria in the soil.
Although total populations of plant-parasitic nematodes were not reduced in the
organic system, root lesion nematode P. crenatus was significantly suppressed in the
organic farming compared to the conventional system. Suppression in populations of
plant parasitic nematodes has been shown to be either due to the addition of organic
amendments (Nahar et al., 2006; Abawi and Widmer, 2000; McSorley and Frederick,
1999; Rodríguez-Kàbana et al., 1981; Hominick, 1999) or to the addition of cover crops
into the soil (Sohlenius and Sandor, 1989; Wang et al., 2001), or both. In our study, only
hay reduced P. crenatus population as compared to other crops in the organic rotation.
Therefore, suppression in population of P. crenatus seems to be primarily due to the
inclusion of hay in the organic system. The lack of effect of organic amendments on root
lesion nematode Pratylenchus sp. and root-knot nematode Meloidogyne incognita was
also reported by Bulluck et al. (2002b). However, Nahar et al. (2006) reported that
organic amendments in the form of compost or raw manure can have differential effects
on plant-parasitic nematodes. Nevertheless, our study shows that transitioning to organic
management can reduce populations of the predominant plant-parasitic nematode, P.
crenatus provided appropriate rotational crops are included.
None of the food web indices differed significantly between the two farming
systems. The construction of faunal profiles revealed that food webs either lay in quadrat
A or B in both farming systems suggesting that the food webs were highly enriched and
23
moderately to highly structured and the decomposition channels were bacterial in both
the systems. Although increase in bacterivore nematodes were observed in the organic
system, no corresponding increases in predatory or omnivorous nematodes were found.
This lack of increase in the higher trophic links in the food web resulted in no differences
in structure index between the two systems. This could be due to frequent tillage
requirement during the preparation of seedbed for mixing of organic manures and cover
crops into the soil and hoeing operations for weed management. It has been reported
previously that several omnivore and predatory nematode genera are more tillage
sensitive than bacterivore nematodes (Fiscus and Neher, 2002; Freckman and Ettema
1993; López-Fando and Bello, 1995). Therefore, it is clear that high tillage in the organic
farming system is counterproductive to the beneficial effects of organic amendments and
cover crops, as it breaks the natural progression of the soil food web towards maturity.
Therefore, we conclude that the organic farming can result in more mature and highly
functional food webs if tillage intensity can be reduced.
2.5 SUMMARY
Dynamics of soil bulk density, organic matter, microbial biomass, nitrogen, and
nematode communities were assessed for a period of four years in field plots
transitioning from conventional to organic farming practices. A rotation of soybeans,
corn, oats and hay was used as an organic transitioning strategy and the conventional
farming system had a corn and soybean rotation for comparison. Organic corn received
raw straw pack beef manure and poultry compost at the rate of 27 and 28 Mg/h
respectively, and organic oats received raw straw pack beef manure and poultry compost
24

at the rate of 18 and 1.8 Mg/h, respectively while conventional plots received synthetic
fertilizers. All crops in the organic system received primary tillage (chisel plow, disked
and tined) whereas only corn received primary tillage in the conventional system but
soybeans were no-till. Weed control was mechanical (twice diskings, rotary hoeings and
row cultivation) in the organic system whereas herbicides were used in the conventional
system. Soil bulk density did not differ in the two systems over a four-year period but
organic farming had slightly higher organic matter, mineral associated organic matter and
particulate organic matter. The conventional system had more N in the mineral pools as
indicated by higher NO3--N whereas organic system had higher N in the microbial
biomass indicating shifts in nitrogen pools between the two systems. Bacterivore
nematodes were more abundant in the organic than the conventional system for most of
the study period. In contrast, the conventional system had significantly higher
populations of the root lesion nematode, Pratylenchus crenatus, than the organic system
after completion of the rotation cycle (transition period) in spring 2004. The organic hay
plots had the lowest populations of P. crenatus compared to corn, soybeans and oats.
Nematode faunal profile estimates showed that the food webs were highly enriched and
moderately to highly structured and the decomposition channels were bacterial in both
systems. The lack of differences in structure index between the organic and conventional
systems is probably due to the excessive tillage in the organic farming system, which
may have prevented the build up of tillage-sensitive omnivorous and predatory
nematodes that contribute to the structure index. We conclude that transition from
conventional to organic farming can increase soil microbial biomass-N and populations
of beneficial bacterivore nematodes while simultaneously reducing the populations of
25
predominant plant-parasitic nematode, P. crenatus. Our findings also underscore the
potential benefits of reducing tillage for the development of a more mature soil food web.
2.6. References
Abawi, G.S., Widmer, T.L. 2000. Impact of soil health management practices on
soil borne pathogens, nematodes and root diseases of vegetable crops.
Appl. Soil Ecol. 15, 37-47.
Alon, A., Steinberger, Y. 1999. Effect of nitrogen amendments on microbial biomass,
above-ground biomass and nematode population in the Negev Desert soil. J Arid
Environ. 41, 429-441.
Barker, K.R., Campbell, C.L., 1981. Sampling nematode populations. In:
Zuckerman, B.M., Rhode R.A. (Eds.), Plant-parasitic Nematodes, Vol. III.
Academic Press, New York, NY pp. 451-471.
Barker, K.R., Nusbaum, C.J., Nelson, L.J., 1969. Effects of storage temperature and
extraction procedure on recovery of plant-parasitic nematodes from field soils. J.
Nematol. 1, 240-247.
Berkelmans, R., Ferris, H., Tenuta, M., Bruggen, A.H.C. van, 2003. Effects of long-term
crop management on nematode trophic levels other than plant feeders disappear
after 1 year of disruptive soil management. Appl. Soil Ecol. 23, 223-235.
Bongers, T., 1990. The maturity index: an ecological measure of environmental
disturbance based on nematode species composition. Oecologica 83, 14-19.
26

Bongers, T., Ferris, H., 1999. Nematode community structure as a bioindicator in
environmental monitoring. Trends Ecol. Evol. 14, 224-228.
Borken, W., Muhs, A., Beese, F., 2002. Changes in microbial and soil properties
following compost treatment of degraded forest soil. Soil Biol. Biochem. 34, 403-
412.
Bouwman, L.A., Arts, W.B.M., 2000. Effects of soil compaction on the relationships
between nematodes, grass production and soil physical properties. Appl. Soil
Ecol. 14, 213-222.
Brookes, P.C., A., Landman, G., Pruden, D.S., Jenkinson, 1985. Chloroform fumigation
and the release of soil nitrogen: A rapid direct extraction method to measure
microbial biomass nitrogen in soil. Soil Biol. Biochem. 17, 837-842.
Bulluck III, L.R., Brosius, M., Evanylo, G.K., Ristaino, J.B., 2002a. Organic and
synthetic fertility amendments influence soil microbial, physical and chemical
properties on organic and conventional farms. App. Soil Ecol. 19, 147-160.
Bulluck III, L.R., Barker, K.R., Ristaino, J.B., 2002b. Influences of organic and synthetic
soil fertility amendments on nematode trophic groups and community dynamics
under tomatoes. Appl. Soil Ecol. 21, 233-250.
Clark, M.S., Ferris, H., Klonsky, K., Lanini, W.T., van Bruggen, A.H.C., Zalom, F.G.,
1998. Agronomic, economic, and environmental comparison of pest management
in conventional and alternative tomato and corn systems in northern California.
Agric. Ecosys. Environ. 68, 51-71.
27

Clark, M.S., Horwarth, W.R., Shennan, C., Scow, K.M., Lanini, W.T., Ferris, H., 1999.
Nitrogen, weeds and water as yield-limiting factors in conventional, low-input,
and organic tomato systems. Agric. Ecosys. Environ. 73, 257-270.
Dalal, R.C., 1998. Soil microbial biomass–what do the numbers really mean? Aust. J.
Exp. Agric. 38, 649–665.
Doran, J., 1995. Building soil quality. In: Proceedings of the 1995 Conservation
Workshop on Opportunities and Challenges in Sustainable Agriculture Red Deer,
Alta., Canada, Alberta Conservation Tillage Society and Alberta Agriculture
Conservation, Development Branch, pp. 151-154.
Drinkwater, L.E., Letourneau, D.K., Workneh, F., van Bruggen, A.H.C., Shennan, C.,
1995. Fundamental differences between conventional and organic tomato
agroecosystems in California. Ecol. Appl. 1098-1112.
Ekschmitt, K., Bakonyi, G., Bongers, M., Bongers, T., Boström, S., Dogan, H., Harrison,
A., Kallimanis, A., Nagy, P., O´Donnell, A.G., Sohlenius, B., Stamou, G.P.,
Wolters, W., 1999. Effects of the nematode fauna on microbial energy and matter
transformation rates in European grassland soils. Plant Soil 212, 45-61.
Ferris, H., Bongers, T., De Goede, R.G.M., 1999. Nematode faunal indicators of soil
food web condition. J. Nematol. 31, 534-535.
Ferris, H., Bongers, T., de Geode, R.G.M., 2001. A framework for soil food web
diagnostics: extension of the nematode faunal analysis concept. Appl. Soil Ecol.
18, 13-29.
Ferris, H., Matute, M., 2003. Structural and functional succession in the nematode fauna
of a soil food web. Appl. Soil Ecol. 23, 93-110.
28
Ferris, H., Venette, R.C., Lau, S.S., 1996. Dynamics of nematode communities in
tomatoes grown in conventional and organic farming systems and their impact on
soil fertility. Appl. Soil Ecol. 3, 161-175.
Ferris, H., Venette, R.C., Scow, K.M., 2004. Soil management to enhance bacterivore
and fungivore nematode populations and their nitrogen mineralization function.
Appl. Soil Ecol. 24, 19-35.
Fiscus, D.A., Neher, D.A. 2002. Distinguishing sensitivity of free-living soil nematode
genera to physical and chemical disturbances. Ecol. Appl. 12, 565-575.
Flegg, J.M., Hooper, D.J., 1970. Extraction of free-living stages from soil. In: Southey,
J.F. (Eds.), Laboratory methods for work with plant and soil nematodes. HMSO,
London, UK pp. 5-22.
Freckman, D.W., 1988. Bacterivorous nematodes and organic-matter decomposition.
Agric. Ecosyst. Environ. 24, 195-217.
Freckman, D.W., Ettema, C.H. 1993. Assessing nematode communities in
agroecosystems of varying human intervention. Agric. Ecosyst. Environ. 45, 239-
261.
Friedel, J.K., Gabel, D., Stahr, K., 2001. Nitrogen pools and turnover in arable soils
under different durations of organic farming. II. Source- and sink-function of the
soil microbial biomass or competition with growing plants? J. Plant Nutr. Soil
Sci. 164, 421-429.
Fu, S., Coleman, D.C., Hendrix, P.F., Crossley, D.A. Jr., 2000. Responses of trophic
groups of soil nematodes to residue application under conventional tillage and no
tillage regimes. Soil Biol. Biochem. 32, 1731-1741.
29
Goodey, T., 1963. Soil and freshwater nematodes. Methuen and Co. Ltd., London, UK.
Griffiths, B.S., Ritz, K., Wheatley, R.E., 1994. Nematodes as indicators of enhanced
microbiological activity in a Scottish organic farming system. Soil Use Manage.
10, 20-24.
Gunapala, N., Scow, K.M., 1998. Dynamics of soil microbial biomass and activity in
conventional and organic farming systems. Soil Biol. Biochem. 30, 805-816.
Hominick, B., 1999. Nematodes. In: Proceeding of the International Workshop Tropical
Soil Biology. Opportunities and challenges for African agriculture Nairobi, 16-19
March 1999 pp 17-22.
Ingham, R.E., Trofymow, J.A., Ingham, E.R., Coleman, D.C., 1985. Interactions of
bacteria, fungi, and their nematode grazers: Effects on nutrient cycling and plant
growth. Ecol. Monogr. 55, 119-140.
Jairajpuri, S.M., Ahmad, W., 1992. Dorylaimida: Free-living, Predacious and Plant-
Parasitic Nematodes. E. J. Brill, Leiden, The Netherlands.
Kimpinski, J., Sturz, A.V., 1996. Population growth of a rhabditid nematode on plant
growth promoting bacteria from potato tubers and rhizosphere soil. J. Nematol.
28, 682-686.
Knox, O.G.G., Killham, K., Mullins, C.E., Wilson, M.J., 2003. Nematode-enhanced
microbial colonization of the wheat rhizosphere. FEMS Microbiol. Lett. 225, 227-
233.
López-Fando, C., Bello, A., 1995. Variability in soil nematode populations due to tillage
and crop rotation in semi-arid mediterranean agrosystems. Soil Tillage Res. 36,
59-72.
30

Lundquist, E.J., Jackson, L.E., Scow, K.M., Hsu, C., 1999. Changes in microbial
biomass and community composition, and soil carbon and nitrogen pools after
incorporation of rye into three California agricultural soils. Soil Biol. Biochem.
31, 221-236.
McSorley, R., Frederick, J.J., 1999. Nematode population fluctuations during
decomposition of specific organic amendments. J. Nematol. 31, 37-44.
McSorley, R., Gallaher, R.N., 1994. Effect of tillage and crop residue management on
nematode densities on corn. Suppl. J. Nematol. 26, 669-674.
Mian, I. M., Rodríguez-Kàbana, R., 1982. Soil amendments with oil cakes and chicken
litter for control of Meloidogyne arenaria. Nematropica 12, 215-220.
Nahar, M.S., Grewal, P.S., Miller, S.A., Stinner, D., Stinner, B.R., Kleinhenz, M.D.,
Wszelaki, A., Doohan, D., 2006. Differential effects of raw and composted
manure on nematode community, and its indicative value for soil microbial,
physical and chemical properties. App. Soil Ecol. 34, 140-151.
Neher, D.A., Olson, R.K., 1999. Nematode communities in soils of four farm cropping
management systems. Pedobiologia 43, 430-438.
Papatheodorou, E.M., Argyropoulou, M. D., Stamou, G.P., 2004. The effects of large-
and small-scale differences in soil temperature and moisture on bacterial
functional diversity and the community of bacterivorous nematodes. App. Soil
Ecol. 25, 37-49.
Parmelee, R.W., Alston, D.G., 1986. Nematode trophic structure in conventional and no
tillage agroecosystems. J. Nematol. 18, 403-407.
31
Porazinska, D.L., Duncan, L.W., McSorley, R., Graham, J.H., 1999. Nematode
communities as indicators of status and processes of a soil ecosystem influenced
by agricultural management practices. Appl. Soil Ecol. 13, 69-86.
Poudel, D.D., Horwath, W.R., Mitchell, J.P., Temple, S.R., 2001. Impacts of farming
systems on soil mineral nitrogen levels in irrigated processing tomatoes. Acta
Hortic. 542, 321-333.
Powlson, D.S., Brookes, P.C., Christensen, B.T., 1987. Measurement of soil microbial
biomass provides an early indication of changes in total soil organic matter due to
straw incorporation. Soil Biol. Biochem. 19, 159-164.
Ritz, K., Trudgill, D.L., 1999. Utility of nematode community analysis as an integrated
measure of the functional state of soils: perspectives and challenges. Plant Soil
212, 1-11.
Rodríguez-Kàbana, R., King, P.S., Pope, M.H., 1981. Combinations of anhydrous
ammonia and ethylene dibromide for control of nematodes parasitic of soybeans.
Nematropica 11, 27-41.
Sarathchandra, S.U., Ghani, A., Yeates, G.W., Burch, G., Cox, N. R., 2001. Effect of
nitrogen and phosphate fertilizers on microbial and nematode diversity in pasture
soils. Soil Biol. Biochem. 33, 953-964.
Shepherd, A.M., 1970. Preparation of nematodes for electron microscopy. In: Southey
J.F. (ed) Laboratory methods for work with plant and soil nematodes, HMSO,
London, UK. pp. 88-95.
Siddiqi, M.R., 1986. Tylenchida: Parasites of plants and insects. CAB International,
Slough, UK.
32

Sims, G.K., Ellsworth, T.R., Mulvaney, R.L., 1995. Microscale determination of
inorganic nitrogen in water and soil extracts. Soil Science, Plant Analysis 26, 303-
316.
Sohlenius, B. 1990. Influence of cropping system and nitrogen input on soil fauna and
microorganisms in a Swedish arable soil. Biol. Fertil. Soils 9, 168-173.
Sohlenius, B., Boström, S., 1986. Short-term dynamics of nematode communities in
arable soil - Influence of nitrogen fertilization in barley crops. Pedobiologia 29,
183-191.
Sohlenius, B., Sandor, A., 1989. Ploughing of a perennial grass ley effect on the
nematode fauna. Pedobiologia 33, 199-210.
Sohlenius, B., Wasilewska, L., 1984. Influence of irrigation and fertilization on the
nematode community in a Swedish pine forest soil. J. Appl. Ecol. 21, 327-342.
Tu, Cong., Louws, F.J., Creamer, N.G., Mueller, J.P., Brownie, C., Fager, K., Bell, M.,
Hu, S., 2006. Responses of soil microbial biomass and N availability to transition
strategies from conventional to organic farming systems. Agric. Ecos. Environ.
113, 206-215.
Wang K.H., McSorley R., Marshall A.J, Gallaher R.N., 2004. Nematode community
changes associated with decomposition of Crotalaria juncea amendment in
litterbags. Appl. Soil Ecol. 27, 31-45.
Wang, K.H., Sipes, B.S., Schmitt, D.P., 2001. Suppression of Rotylenchulus reniformis
by Crotalaria juncea, Brassica napus, and Tagetes erecta. Nematropica 31, 235-
249.
33
Werner, M.R., 1997. Soil quality characteristics during conversion to organic orchard
management. Appl. Soil Ecol. 5, 151-167.
Wright, D.J., 1998. Respiratory physiology, nitrogen excretion and osmotic and ionic
regulation. In: Perry, R.N., Wright, D.J. (Eds.), The Physiology and Biochemistry
of Free-living and Plant-parasitic Nematodes. CAB International, Wallingford,
Oxon, pp. 103-131.
Yardim, E.N., Edwards, C.A., 1998. The effects of chemical pest, disease and weed
management practices on the trophic structure of nematode populations in tomato
agroecosystems. App. Soil Ecol. 7, 137-147.
Yeates, G.W., 1979. Soil nematodes in terrestrial ecosystems. J. Nematol. 11, 213-229.
Yeates, G.W., Bongers, T., 1999. Nematode diversity in agroecosystems. Agric. Ecosys.
Environ. 74, 113-135.
Yeates, G.W., Bongers, T., De Goede, R.G.M., Freckman, D. W., Georgieva, S.S., 1993.
Feeding habits in soil nematode families and genera–an outline for soil ecologists.
J. Nematol. 25, 315-331.
Yeates, G.W., Wardle, D.A., Watson, R.N., 1999. Response of soil nematode
populations, community structure, diversity and temporal variability to
agricultural infestation over a seven-year period. Soil Biol. Biochem. 31, 1721-
1733.
34

Bacterivores Plant parasites Omnivores Fungivores Predatory
35
Rhabditis Pratylenchus a Dorylaimus Aphelenchoides Mononchus
Mesorhabditis Paratylenchus Eudorylaimus Aphelenchus
Rhabdolaimus Tylenchus Pungentus b Filenchus Pelodera Mesodorylaimus
Placodera b Xiphinema Labronema
Cephalobus Longidorus c Aporcelaimellus b
Acrobeloides Hoplolaimus
Acrobeles Helicotylenchus
Wilsonema b Hoplotylus b
Monhystera Tylenchorhynchus b
Panagrolaimus Psilenchus b
Plectus Trichodorus b
Turbatrix Heterodera c
Alaimus
Diplogasteroides
Diplogaster a Identified to species level (Pratylenchus crenatus), b cobserved in low numbers, observed only until year 2001 in low numbers.
Table 2.1: Nematode genera identified at the experimental site in conventional and organic farming system plots.
Univariate repeated measures Multivariate repeated measures
Farming systems Time x Farming system Time x Farming system
(df 1, 5) (df 8, 40) (df 8, 17)
Trophic groups F P F P* F P
Bacterivore 13.93 0.01 5.32 0.0001 7.98 0.0002
Fungivore 3.57 0.10 2.92 0.01 3.21 0.02
Omnivore 0.33 0.59 1.56 0.16 5.39 0.001
Predatory 0.04 0.84 0.87 0.54 0.96 0.50 36 Plant-parasitic 0.46 0.52 1.36 0.24 2.03 0.14
P. crenatus 8.33 0.03 1.87 0.06 2.12 0.09
Indices
EI 0.47 0.52 2.05 0.06 1.23 0.34
SI 2.19 0.14 1.02 0.43 2.44 0.057 CI 0.69 0.44 3.10 0.008 0.60 0.76
Farming systems compared using repeated measures ANOVA. *Adjusted Greenhouse-Geisser P-value
Table 2.2: Effect of farming systems on nematode trophic groups, root lesion nematode Pratylenchus crenatus and nematode community indices including enrichment (EI), structure (SI), and channel index (CI) from spring 2000 to spring 2004.

Univariate repeated measures Multivariate repeated measures
Soil parameter Farming systems Time x Farming system Time x Farming system
(df 1, 5) (df 8, 40) (df 8, 17)
F P F P* F P
37
BD 0.67 0.45 1.17 0.34 2.93 0.02
TOM 0.52 0.50 3.57 0.003 3.43 0.01
MAOM 0.33 0.58 0.85 0.56 2.09 0.09
POM 1.94 0.22 1.93 0.08 3.08 0.02 +NH -N 2.19 0.21 1.53 0.18 1.42 0.27 4
-NO -N 11.39 0.01 3.94 0.001 4.39 0.005 3
DON 0.96 0.37 1.77 0.11 0.81 0.60
MB-N 25.10 0.004 2.10 0.056 3.13 0.02
Farming systems compared using repeated measures ANOVA. *Adjusted Greenhouse-Geisser P-value
Table 2.3: Effect of farming systems on soil bulk density (BD), total organic matter % (TOM), particulate organic matter (0.05-2 mm) (POM), % mineral associated organic matter (MAOM) (<0.05 mm), mineral-N (NH + -
4 -N and NO -N (µg g-1 3
dry soil), and microbial biomass-N (MB-N).

+ -Year Farming system BD TOM MAOM POM NH -N NO -N DON MB-N 4 3
Sp. 2000 Conventional 1.34 2.49 1.89 0.61 1.03 5.67 3.20 55.00 Organic 1.35 2.41 1.82 0.61 0.93 5.81 2.65 53.70
Aut. 2000 Conventional 1.25 2.61 2.03 0.58 1.73 13.03 8.84 64.00 Organic 1.18 2.60 1.95 0.63 1.22 6.75 6.42 78.87
Sp. 2001 Conventional 1.42 2.65 1.27 0.58 1.43 4.38 10.90 37.60 Organic 1.41 2.73 1.41 0.63 0.82 4.91 9.80 54.30
Aut. 2001 Conventional 1.38 2.78 2.20 0.50 1.50 7.77 7.22 31.40 Organic 1.37 2.96 2.24 0.64 1.45 8.78 7.34 48.00 38
Sp. 2002 Conventional 1.38 2.65 1.97 0.62 2.16 9.90 4.14 33.46 Organic 1.38 3.00 2.20 0.74 1.86 8.73 4.73 46.60
Aut. 2002 Conventional 1.44 2.88 2.07 0.72 1.40 9.99 6.55 54.00 Organic 1.44 2.88 2.09 0.70 0.90 4.06 5.68 60.00
Sp. 2003 Conventional 1.51 2.78 1.99 0.69 1.50 10.48 8.51 20.10 Organic 1.50 2.93 2.11 0.76 0.40 6.47 8.31 30.10
Aut. 2003 Conventional 1.44 2.58 1.90 0.62 0.89 3.27 5.70 40.60 Organic 1.38 2.75 2.04 0.67 0.94 2.56 6.10 48.50
Sp. 2004 Conventional 1.56 2.32 1.64 0.60 1.17 4.7 7.60 32.87 Organic 1.54 2.54 1.83 0.72 1.17 5.3 6.61 47.01
Table 2.4: Mean soil bulk density (BD), total organic matter % (TOM), particulate organic matter (0.05-2 mm) (POM), % mineral associated organic matter (MAOM) (<0.05 mm), mineral-N (NH + -
4 -N and NO -N (µg g-1 3 dry soil), and microbial
biomass-N (MB-N) in conventional and organic arming systems.

0
0.05
0.1
0.15
0.2
0.25
0.3
Jan Feb Mar Apr May June July Aug Sep Oct Nov Dec
Mea
n pr
ecip
itatio
n (in
ches
)
0
10
20
30
40
50
60
70
80
Mea
n ai
r tem
pera
ture
( 0 F)
20002001200220032004Air temperature
Fig. 2.1: Bars represent mean precipitation in inches per month from year 2000-2004. Line graph shows a mean of 5 years air temperature each month from January to December.
39

Fig. 2.2: Mean (± SE) nematode trophic groups: bacterivore (A), fungivore (B), omnivore (C), predatory (D), total plant-parasitic nematodes (E) and root lesion nematode Pratylenchus crenatus (F) per 10g soil in organic and conventional farming systems from spring 2000 to spring 2004. F-values from analysis of variance comparing the farming systems are shown in table 2.2.
40

41
aa
a
a
aa
ab
b
ab
b
a
aba
a
a
a
2000 2001 2002 2003
Prat
ylen
chus
cre
natu
s po
pula
tion
/ 10
g so
il
0
10
20
30
40Corn Soybeans Oats Hay
aa
a
ab
aa
ab
b
ab
b
a
ab
a
b
ab
ab
Fig. 2.3: Mean (± SE) soil population of Pratylenchus crenatus from year 2000 to 2003 comparing corn, soybean, oats and hay. Treatments within a group with the same letter are not significantly different (p ≤ 0.05) by Fishers’s LSD test between the crops.
Stru
ctur
e In
dex
10
20
30
40
50
60
70
80
Enric
hmen
t ind
ex
50
55
60
65
70
75
80
85
90
Spring
-2000
Autumn-2
000
Spring
-2001
Autumn-2
001
Spring
-2002
Autumn-2
002
Spring
-2003
Autumn-2
003
Spring
-2004
Basa
l Ind
ex
5
10
15
20
25
30
35 Organic Conventional
Spring
-2000
Autumn-2
000
Spring
-2001
Autumn-2
001
Spring
-2002
Autumn-2
002
Spring
-2003
Autumn-2
003
Spring
-2004
Cha
nnel
Inde
x
0
10
20
30
Organic Conventional
(A) (B)
(C) (D)
Fig. 2.4: Mean (± SE) values of nematode food web indices: enrichment (A), structure (B), and channel (C) indices per 10g soil in organic and conventional farming system from spring 2000 to spring 2004. F-values from analysis of variance comparing the farming systems are shown in table 2.2. 42
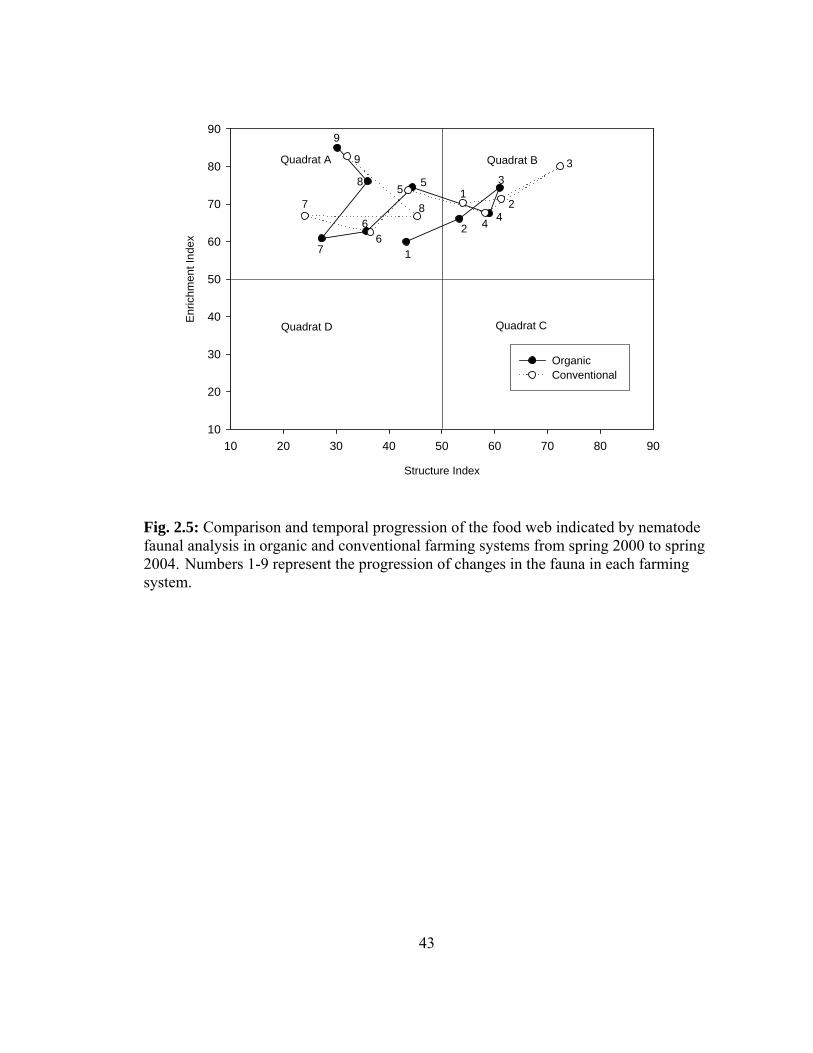
Structure Index
10 20 30 40 50 60 70 80 90
Enr
ichm
ent I
ndex
10
20
30
40
50
60
70
80
90
Organic Conventional
Quadrat A Quadrat B
Quadrat CQuadrat D
1
2
3
4
5
6
7
81
2
3
4
5
6
7 8
9
9
Fig. 2.5: Comparison and temporal progression of the food web indicated by nematode faunal analysis in organic and conventional farming systems from spring 2000 to spring 2004. Numbers 1-9 represent the progression of changes in the fauna in each farming system.
43

CHAPTER 3
EFFECT OF COMPOST OR NON-COMPOST BASED ORGANIC
TRANSITIONING STRATEGIES ON SOIL NEMATODE COMMUNITY,
ORGANIC MATTER, MICROBIAL BIOMASS AND NITROGEN DYNAMICS
3.1. INTRODUCTION
Greater non-farming land use (often leading to higher land prices) shrinking
agricultural infrastructure for small-scale conventional farms, low commodity prices and
less tolerance for conventional farming practices, constrain agricultural systems near
urban areas. Therefore, farmers in periurban areas have started to adopt organic farming
methods to fetch premium prices of their produce. The U.S. National Organic Standards
Act allows certification only after 3 years have passed since the last use of restricted
substances. During this period crop yields are unstable, premium prices unavailable, and
pests (insects, parasitic nematodes, pathogens, and weeds) may be severe since the use of
conventional pesticides is withdrawn (Clark et al., 1999; Tu et al., 2006). In addition to
economical and agricultural aspects, scientific support should be considered while
choosing the field management and crop system to be used during the transition period
(Tu et al., 2006).
44

Nematodes are abundant and diverse invertebrates present in the soil (Yeates,
1979). They are considered an important component of the soil biotic community and
assessment of nematode fauna provides a unique insight into soil biological processes
(Ritz and Trudgill, 1999). Nematodes can be grouped into five major trophic groups;
bacterivores, fungivores, plant parasites, predatory and omnivores (Yeates et al., 1993).
Plant-parasitic nematodes are considered as primary consumers and they affect food web
resources through direct herbivory (Ferris and Bongers, 2006). Bacterivore and
fungivore nematodes graze on decomposer microbes such as bacteria and fungi and
significantly contribute to nutrient mineralization (Ferris and Matatue, 2003; Ferris et al.,
1996; Ingham et al., 1985; Ferris et al., 2004). These nematodes also promote
rhizosphere colonization of beneficial bacteria (Kimpinski and Sturz, 1996; Knox et al.,
2003). Predatory nematodes regulate the food web by preying on nematodes and other
invertebrates in the soil (Grewal et al., 2005). Nematode communities are sensitive to
changes in soil environment caused by different agroecosystem management practices
(Yardim and Edwards, 1998; Yeates and Bongers, 1999; Yeates et al., 1999; Sohlenius
and Wasilewska, 1984; Neher and Olson, 1999). Nematode faunal analysis based on the
relative weighted abundance colonizer-persister (c-p) guilds provides a graphic
representation of the probable conditions of the soil food web (Ferris et al., 2001). This
nematode faunal analysis includes food web indices including enrichment (EI), structure
(SI), basal (BI) and channel (CI), which provide critical information about below ground
processes in distinct systems (Bulluck et al., 2002b; Porazinska et al., 1999; Freckman
and Ettema, 1993; Bongers, 1990; Ferris, et al., 1996; Ferris et al., 2001).
45

Organic amendments have been shown to reduce soil bulk density and increase
soil nitrogen and carbon supply (Doran, 1995; Drinkwater et al., 1995, Bulluck et al.,
2002; Werner, 1997). All organic amendments tend to increase availability of nutrients
such as nitrogen, microbial biomass and abundance of bacterivore and fungivore
nematodes (Gunapala and Scow, 1998; Freckman, 1988; Griffiths et al., 1994; Bulluck et
al., 2002a; Ferris et al, 1996, 1999). Increase in organic matter in the soil increases
microbial biomass by providing an enlarged food base for free-living nematodes
(Papatheodorou et al., 2004; Alon and Steinberger, 1999; Bongers and Ferris, 1999;
Ferris et al., 1999; McSorley and Frederick, 1999).
This study compares the long-term effect of four organic transitioning strategies,
with and without compost amendment, on the soil nematode community and how this
relates to soil characteristics including bulk density, mineral nitrogen, organic matter,
particulate organic matter, and microbial biomass-N. Four main plot management
strategies were fallow (FA), a single planting of mixed perennial hay (HA), low intensity
vegetables as field vegetables (FV) and high intensity vegetables under high tunnels
(HT). Half of each main plot received an annual addition of compost and the other half
received no amendment. High tunnels were constructed for Ohio vegetable growers for
extended duration vegetable production with partial control over environmental variables.
At the end of the transition period tomatoes were grown in all the plots to allow for
comparison. The purpose of this project was to describe the benefits of eight strategies
that differ in input intensity. Various strategies leading to organic vegetable production
may have differential impacts on the soil characteristics and nematode communities.
Therefore, the primary objective of this study was to monitor the effects of strategies on
46

nematode c-p guilds, food web indices (enrichment, structure and channel) and soil
characteristics (organic matter, microbial biomass and nitrogen dynamics). A sub
objective was to determine the relationship between nematode c-p guilds and soil
characteristics.
3.2. MATERIALS AND METHODS
3.2.1. Field site description and management strategies
An organic transition field experiment was established at the Ohio Agricultural
Research and Development Center (OARDC) in Wooster, Ohio (40° 47' N, 81° 55' W;
310 m elevation). Soil at the site was a moderately well drained Wooster silt loam
initially with approximately 1.2% organic matter. The field was previously in a
conventional corn and soybean rotation. Transition to organic farming started in 2003
and four management strategies were studied. Four management strategies (main plots)
were tilled fallow (FA), single planting of mixed species perennial hay (HA), low
intensity open field vegetables (FV) and intensive vegetable production under high
tunnels (HT) (Table 3.1). Half of each main plot received an annual addition of 18.1 t ha-
1 (dry weight) composted dairy manure. The compost mix was incorporated in three
summer additions in tilled fallowing, spread over the surface after hay harvests in mixed
species hay, and incorporated prior to the main summer crop in low-intensity vegetables
and intensive vegetable production under high tunnels. The same quantity of compost
was incorporated prior to planting tomatoes in the fourth year. The main plots were
replicated four times in a randomized split plot design. Main field plots measured 17.1 x
18.3 m long. After 3 years of transition period the field was certified as organic by the
47
Ohio Ecological Food and Farm Association (OEFFA) as per national organic standards
in 2006. High tunnels were constructed according to Lamont and Orzolek, 2000 as
plastic enclosed structures (6.4 m x 14.6 m) (capable of accommodating field sized
equipment) with partial control over environmental variables for extending vegetable
crops growing period. In FA strategy weed seedlings were removed throughout the year
and a cover crop (rye or wheat) was planted in the fall every year to help prevent erosion
and was incorporated into the soil every spring to add organic matter back into the soil.
In the HA plots, 2 or 3 cuttings were taken each year by mowing off the foliage, allowing
it to dry on the ground and then the foliage was removed from the plots. Foliage was
incorporated into the soil of the HA plots only in spring of 2006 in preparation for the
tomato transplanting. The irrigation system for the project was drip irrigation. The drip
tape used all four years was 510-12-450 TSX (hole spacing 0.30 m apart in the tape) with
water being released at a rate of 1.70 L /minute/30.48 m of tape. Drip irrigation was in
place in the HT and FV plots each year from April 1 to November 1, and from November
1 to April 1 irrigation was done in the high tunnels by hand with Dramm watering cans.
Irrigation was done as needed for the first 3 years based on visual appearance of the soil
and the weather. In 2006, plots were on a regular irrigation schedule of 3 day/week for 4-
6 hours per day, unless it had rained.
3.2.2. Soil sampling
Six soil cores (5 cm diameter and 15 cm deep) were removed randomly from the
central portion of each sub-plot using a soil auger and total of four composite soil
samples (two per subplot) were collected per main plot. Therefore, a total of sixty-four
soil samples were analyzed for nematode and soil properties at each sampling time.
48

Nematodes and soil properties were analyzed the first three times in March of 2003-2005
and the fourth time in October of 2006 at the time of tomato harvest. Soil samples were
mixed thoroughly to form a composite sample to reduce the variance associated with
aggregated spatial patterns of nematodes in the soil (Barker and Campbell, 1981). Large
plant parts or stones were removed from the samples by passing them through a soil sieve
(6 mm mesh). All soil samples were stored in the dark overnight at 5oC and existing field
moisture was maintained to minimize changes in nematode populations (Barker et al.,
1969). The soil samples were divided into sub samples for nematode and soil properties
analyses.
3.2.3 Nematode extraction, identification and counting
Nematodes were extracted from a 10 g subsample taken from each composite soil
sample using the Baermann funnel technique (Flegg and Hooper, 1970). Nematodes
were collected after 72 h, heat killed, and fixed with triethanolamine formaldehyde (TAF)
solution (Shepherd, 1970). Specimens were identified to the genus level using an
inverted microscope at 40X magnification. Diagnostic keys by Goodey (1963), Siddiqui
(1986), and Jairajpuri and Ahmed (1992) and the University of Nebraska Lincoln
nematode identification website (http://nematode.unl.edu/konzlistbutt.htm) were used.
All identified nematode genera were assigned to a trophic group (plant-parasitic, fungal
feeder, bacterial feeder, omnivore, or predatory) according to Yeates et al. (1993).
Nematode genera were also assigned a colonizer-persister value (c-p value) according to
Bongers (1990). Numbers of nematodes were not corrected for extraction efficiency.
49

3.2.4. Soil analysis
Soil bulk density (BD), total organic matter (TOM), mineral associated organic
matter (MAOM) (<0.05 mm), particulate organic matter (POM) (0.05-2 mm), mineral-N
(NH4+-N and NO3
--N), and dissolved organic-N (DON), were analyzed at the Field Crop
Ecology Laboratory, OARDC, Wooster, using standard methods (Sims et al., 1995).
Microbial biomass-N (MB-N) was determined using modified chloroform fumigation
method (Brookes et al., 1985).
3.2.5 Soil temperature measurements
Soil temperature (6 cm deep) was recorded using a data logger and soil
thermometer installed inside high tunnel. Outside field soil temperature data was
obtained from the Ohio Agricultural Research and Development Center weather station.
3.2.6. Data analysis
The enrichment (EI), structure (SI) and channel (CI) indices were calculated
according to Ferris et al. (2001), with basal components (b) of the food web (fungal and
bacterial feeders in the c-p 2 guild) calculated as b = ∑kbnb where kb is the weighted
constant for the guild, and n is the number of nematodes in that guild. Enrichment (e)
and structure (s) components were similarly calculated, using nematode guilds indicative
of enrichment (bacterivores of c-p 1, and fungivores of c-p 2), and guilds supporting
structure (bacterivores of c-p 3-5, fungivores of c-p 3-5, omnivores of c-p 3-5, and
predatory nematodes of c-p = 2-5). Finally, the EI was calculated as 100x e/(e + b), and
the SI as 100x s/(s + b). CI provides an index of the nature of decomposition and was
50

calculated as 100 x (0.8 fungivores cp 2/ (3.2 of bacterivores of c-p 1 + 0.8 fungivores of
c-p 2) where the coefficients are the ke enrichment weightings for the respective guilds
(Ferris et al., 2001).
Management strategies were compared for nematode c-p (colonizer-persister)
guilds, food web indices, and soil properties using PROC mixed model. Relationship
between soil parameters and nematode c-p guilds were analyzed by canonical correlation
analysis. All data were analyzed using SAS Ver. 9.00, SAS Institute, Cary, NC.
Nematode population data were transformed as ln (x+1) and food web indices as square
root prior to statistical analysis to normalize the variance in the data. The probability
level of P ≤ 0.05 was regarded as significant.
3.3. RESULTS
During the course of this study twenty-seven nematode genera were identified
from the experimental plots. Nematode genera identified in the bacterivore guilds were
seven in c-p 1 guild (Bf1) (Rhabditis, Mesorhabditis, Rhabdolaimus, Panagrolaimus
Diplogasteroides, Teratocephalus and Monhystera), four in c-p 2 (Bf2) (Cephalobus,
Acrobeloides, Acrobeles, Plectus,) and one in c-p 4 (Bf4) (Alaimus). Two fungivore
genera (Aphelenchoides and Aphelenchus) were observed in c-p 2 guild (Ff2). Only one
predatory genus in c-p 4 guild (Pr4) (Mononchus) and three omnivores in c-p 4 (Om4)
(Dorylaimus, Eudorylaimus and Pungentus) were observed. Plant-parasitic genera
observed were three in c-p 2 guild (Pp2) (Tylenchus, Filenchus and Psilenchus), five in c-
p 3 (Pp3) (Pratylenchus, Paratylenchus, Tylenchorhynchus, Helicotylenchus and
Hoplolaimus) and only one in c-p 5 (Pp5) (Xiphinema). Tylenchus and Filenchus
51
dominated in the Pp2 guild while root lesion nematode was dominant among the
nematodes of Pp3 guild. Rhabditis, Panagrolaimus, Cephalobus, Acrobeloides,
Aphelenchoides, Aphelenchus, Tylenchus, and Filenchus were the most abundant genera
while Helicotylenchus, Hoplolaimus, and Psilenchus were observed in low numbers.
3.3.1. Effect of management strategies on nematode communities
Analysis of soil samples prior to the sowing of crops and application of compost
in spring 2003 showed no significant differences between the plots for nematode c-p
(colonizer-persister) guilds (Table 3.2). Bf1 were significantly higher in the composted
compared to the non-composted management strategies in 2006 (P = 0.0008, F = 12.7).
In 2006 composted plots had a higher abundance of Bf2 nematode guild than the non-
composted plots (P = 0.001, F = 22.6) (Table 3.2). HA composted and HA non-
composted plots however, had similar level of Bf2 nematodes (Table 3.3).
Abundance of fungivore nematodes differed significantly between the main plot
at the end of the transitioning period (P = 0.04, F = 3.7 for 2006) while compost showed
no significant effect (Table 3.2). HT tended to have higher populations of fungivore
nematodes compared to all other strategies, however in 2006 both composted and non-
composted HA strategy had similar levels of fungivore nematodes (Table 3.3).
Population of omnivore (Om) and predatory (Pr) nematodes declined over time
compared to year 2003 baseline soil sampling and no significant effect of main plot
strategies and subplot treatments (compost) was observed on the abundance of omnivore
nematodes throughout the study period (Table 3.2). Predatory nematodes differed
significantly between composted and non-composted plots in 2006 (P = 0.009, F = 7.4)
(Table 3.2).
52
Main plot strategies showed non-significant differences for Pp2 guild throughout
the study period but consistent differences were observed for Pp3 and Pp5 guilds and total
abundance of plant-parasites among the strategies from 2004 to 2006 (Table 3.2).
Compost favored the abundance of Pp2 guild dominated by Tylenchus and Filenchus
while suppressed root-lesion nematode Pratylenchus at the end of the experiment in 2006
(Figure 3.1).
3.3.2. Effect of management strategies on nematode faunal indices
EI was the only index, which differed significantly among the main plot strategies
(P = 0.03, F = 3.9) at the end of the transition period in 2006 while effect of compost was
observed to be significant only for CI (P = 0.0006, F = 13.9) and not fro EI and SI (Table
3.2). Comparison for CI among all the 8 sub-plot strategies from 2003-2006 showed
discernible differences only in 2006 when composted strategies had higher CI compared
to the non-composted strategies. However, HA non-composted showed a similar level of
CI as the other composted strategies.
Figure 3.2 shows the faunal profiles in all the 8 sub-plot strategies. At the time of
establishment of experiment in 2003 food webs were enriched and moderately structured
and no discernible differences were observed between the plots. SI declined in all the
strategies except for year 2005 when HA (composted and non-composted) had the
highest SI compared to other strategies. Although, in year 2006, food webs in all
strategies had low SI and EI in general, HT clearly distinguished from other strategies
(FV, HA and FA) by having the poorly structured and enriched food webs.
53

3.3.3. Effect of strategies on soil properties and microbial biomass-N
Soil BD was consistently lower in the composted than the non-composted plots
from 2004-2006 (Table 3.4 and 3.5). POM and MAOM were consistently higher from
2004-2006 in the composted plots, than the non-composted plots (Table 3.5). Although
soil mineral-N NH4+ showed no significant differences between the composted and non-
composted, significant differences were observed for NO3- -N (P = 0.0001, F = 21.6) and
DON (P = 0.01, F = 6.1) (Table 3.4). Although composted management strategies
favored MB-N over the non-composted strategies throughout the study period,
composted HT and HA favored MB-N the most (Table 3.4 and 3.5).
3.3.4. Relationship of organic matter, mineral-N and microbial biomass with nematode c-
p guilds
Figure 3.3A and B show the results of canonical correlation analysis performed
for determining the relationship between nematode c-p guilds and soil parameters (BD,
MAOM, POM, mineral-N: NH4+-N and NO3
--N, and MB-N) for the first soil sampling in
2003 and the last soil sampling in year 2006, respectively. In year 2003 MB-N, mineral-
N (NO3--N) and POM were the major factors explaining the first canonical variate
whereas POM and DON had important loadings on the second canonical variate. Plant
parasitic nematodes in c-p 3 guild mainly represented by Pratylenchus sp. showed the
highest correlation with the first canonical variate followed by bacterivores Bf1 and Bf2
guilds while Bf1 and Bf2 were also correlated with the second canonical variate. In year
2006, first canonical variate was represented by MAOM, MB-N and various forms of
nitrogen (NO3--N, NH4
+-N and DON). BD also had an important loading on both first
and second canonical variates in this sampling time. Canonical structure further revealed
54

that in year 2006 bacterivores (Bf1 and Bf2) followed by Pp2 were correlated with the first
canonical variate while Ff2 showed correlation with the second canonical variate. Pp3
showed the maximum change in relationship with the soil parameters from 2003 to 2006.
3.3.5 Soil temperature inside high tunnels and outside field plots
The average soil temperature under high tunnels increased than the outside field
soil in vegetable plots from November to May (Figure 3.4).
3.4. DISCUSSION
This study compared soil characteristics and nematode communities in four oranic
transition strategies with and without the addition of compost. In the beginning of the
fourth year in 2006, tomato was transplanted in all the plots. Annual addition of compost
increased organic matter, mineral-N and MB-N in the composted compared to the non-
composted plots throughout the study period. These findings are consistent with other
studies where applications of organic amendments have been shown to increase soil
organic matter, mineral-N and MB-N (Clark et al., 1999; Borken et al., 2002; Tu et al.,
2006; Werner, 1997; Drinkwater et al., 1995). Nematodes communities were also
sensitive enough to respond to changes in soil properties due to addition of compost as
observed in other studies (Nahar et al., 2006; Bulluck et al., 2002b). However, the effect
of compost on soil properties and nematode communities varied due to main plot
strategies in our study.
Pp2 was the dominant plant-parasitic nematode guild consisting mainly of
Tylenchus and Filenchus, and root lesion nematode Pratylenchus was dominant in Pp3
guild. Addition of organic amendments suppressed plant parasitic nematodes. A
55

probable mechanism of suppression is the accumulation of nitrogenous compounds in the
soil after compost addition (Nahar et al., 2006; Abawi and Widmer, 2000; McSorley and
Frederick, 1999; Rodríguez-Kàbana et al., 1981; Hominick, 1999). However, our study
clearly indicated that compost may not have the same effect on all the plant parasitic
nematode guilds, especially when the biology and host range of nematode guilds are
contrasting (Zunke, 1990; Okada et al 2002; Vestegard, 2004). At the end of the
experiment in 2006 when tomato was planted in all the plots, the population of
Pratylenchus sp. was significantly lower in the composted than the non-composted
strategies while that of the Pp2 guild was higher. Migratory endoparasites like
Pratylenchus spp are considered harmful to the host plant, as they cause cell death during
feeding and migration through root tissue, and also predispose the cortex to attack by
other plant pathogens (Zunke, 1990). On the other hand ectoparasites like Tylenchus,
Filenchus and Psilenchus are either considered weak root hair feeders (Yeates et al.,
1993) or fungal feeders (Okada et al., 2002). Therefore, we hypothesize that
accumulation of nitrogenous compounds due to the addition of organic amendments may
have harmful impact on endoparasitic nematodes like Pratylenchus spp but not on
ectoparasites such as Tylenchus, Filenchus and Psilenchus.
Quick responses of fungal feeders and bacterial feeders, to organic amendments
have been attributed to increases in their food availability (Ferris et al., 1999 and 2001;
Griffiths et al., 1994; Nahar et al., 2006; Bulluck et al., 2002a). We also observed that
abundance of bacterivore nematodes dominated by the two c-p guilds Bf1 (mainly
rhabditids) and Bf2 (mainly cephalobids) was significantly higher in the composted than
the non-composted strategies but the compost did not affect abundance of fungivore
56

nematodes. It appears possible that well decomposed compost applied to soil in our
study supplied more labile low C/N organic material and favored only bacterial
communities that provided the base for bacterivore nematodes and not the recalcitrant
high C/N organic material that favors fungal decomposition thereby showing increase in
fungivores (Ferris and Matute, 2003).
The main aim of the HT management strategy was to protect the vegetable crops
from frost damage that occurs during the beginning of spring and end of autumn season
in Ohio. HT in general had the highest total abundance of bacterivore and fungivore
nematodes compared to all other vegetable strategies. Soil analysis also revealed higher
MB-N and mineral-N in both composted and non-composted HT compared to other
management strategies. Marginal increase in average soil temperature might have
enhanced the decomposition processes thereby making the soil food web biologically
more active in HT compared to the other strategies (Bakonyi and Nagy, 2000).
At the time of establishment of experiment food webs were highly enriched and
moderately structured in all the plots. However, by the end of the experiment food webs
in all management strategies had low EI and SI. Organic transition strategies where
compost was applied did not show higher enrichment or structure as was expected.
Increase in the abundance of general opportunists along with enrichment opportunist
bacterivores in the composted strategies reduced the overall level of EI and SI in our
study. However, frequent tillage may have also lowered the SI by preventing the build
up of higher c-p value nematodes in the composted strategies, which are sensitive to
physical disturbance (Fiscus and Neher, 2002; Freckman and Ettema 1993; López-Fando
and Bello, 1995). Evidence of the sensitivity of high c-p value nematodes to physical
57
disturbance also comes from the fact that HT management strategy showed the lowest SI
compared to other strategies where the vegetable crop period was extended compared to
the other strategies. This might explain why addition of organic amendments alone is not
sufficient to increase the trophic links in soil food webs.
External organic matter inputs in the form of compost, animal manures and cover
crops increase energy availability for the soil microbes thereby enhancing microbial
activity and biomass (Lundquist et al., 1999; Gunapala and Scow, 1998; Powlson et al.,
1987; Alon and Steinberger, 1999). In an organic farming system, N availability depends
primarily on the decomposition processes carried by the soil microbes (Laakso et al.,
2000). However, microbivorous organisms such as nematodes feed on the microbes and
enhance mineralization of nutrients, which may otherwise be immobilized in the body of
microbes (Griffiths, 1994; Chen and Ferris, 1999; Bardgett, et al., 1999). In our study
bacterivore nematode c-p guilds including Bf2, Bf2, showed correlation with POM and
MB-N in year 2003 sampling time before the addition of organic matter and the
relationship of these c-p guilds remains the same in year 2006 after the transition period
was over. A positive correlation was also reported between bacterivore nematode,
amount of organic matter and microbial biomass in the soil (Ferris et al., 2004; Villenave
et al., 2003). In our study we also observed changes in relationship of plant parasitic
nematode guilds with soil parameters due to application of organic amendments. Pp3
(mainly Pratylenchus) that showed the highest correlation with MB-N in 2003, was
observed to be more correlated with mineral-N and DON in 2006. However, in 2006
correlation of Pp2 nematodes with MB-N might suggest that this group of nematodes
become functionally more active after the addition of organic matter to the soil in our
58

study. Root hair feeders such as Tylenchus and Filenchus have been shown to contribute
to the increase of microbial activity by eliciting leakage of root metabolites into the soil
and are thus actively involved in nutrient mineralization (Verschoor, 2002; Bardgett et
al., 1999; Yeates et al., 1999).
Higher CI (>50) indicates fungal decomposition channels whereas low CI (< 50)
suggest bacterial decomposition channels (Ferris et al., 2001). Therefore, higher CI in
the non-composted strategies may suggest some level of fungal decomposition channels
in this study. Calculations of food web indices require numerator and denominator and
therefore, increase in the value of index does not necessarily reflect that the numerator
would be higher (Ferris and Matute, 2003). In this case abundance of Bf2 was lower in
non-composted strategies and as a consequence the CI value is inflated (inferred as
fungal decomposition). However, abundance of fungivores did not differ between the
composted and non-composted strategies but the differences were observed between the
main plot strategies. HT and hay strategies showed a higher level of fungivore
nematodes compared to other strategies. Nevertheless, neither abundance of fungivore
nematodes nor CI values suggested absolute fungal decomposition channels in our study.
3.5. SUMMARY
Four main plot crop management strategies including tilled fallow (FA), a single
planting of mixed hay species (HA), low intensity open field vegetables (FV) and
intensive vegetable production under high tunnels (HT) with and without annual addition
of compost were established as a 3-year organic transition experiment. Half of each
main plot received composted dairy manure at the rate of 18.1 t ha-1 dry weight and the
59

other half received no amendment. At the end of the transition period tomatoes were
grown in all the plots to allow for comparison between treatments. Soil bulk density
(BD) was lower while various forms of organic matter [total organic matter (TOM),
particulate organic matter (POM) and mineral associated organic matter (MAOM),
mineral-N (NH4+-N and NO3
--N), dissolved organic-N (DON) and microbial biomass-N
(MB-N)] tended to be higher in composted than the non-composted strategies throughout
the study period. However, composted HT and HA favored MB-N more than all other
management strategies. Enrichment opportunists c-p 1 bacterivores and general
opportunists c-p 2 bacterivores were higher in composted than the non-composted
strategies in general. Main plot HT and HA strategies tended to have higher populations
of fungivore nematodes compared to other strategies. HT had the highest total abundance
of bacterivore and fungivore nematodes compared to the other strategies. At the end of
the experiment, root lesion nematode Pratylenchus sp. was significantly lower in the
composted strategies while the compost favored c-p 2 plant-parasites dominated by
Tylenchus and Filenchus over the non-composted strategies. Nematode food webs in all
strategies had low SI and EI and no consistent differences were observed between
composted and non-composted strategies. Lack of increase in EI in the composted
compared to the non-composted strategies was mainly due to the higher abundance of
general opportunist c-p 2 bacterivores while both low abundance of higher c-p value
(omnivores and predatory) nematodes and higher abundance of c-p 2 bacterivores
contributed for the lower SI in composted strategies. CI values suggest bacterial driven
decomposition channels in all the strategies. Canonical correlation analysis revealed that
bacterivore nematodes were correlated with the MB-N and organic matter. The
60
correlation of c-p 2 plant-parasites with MB-N suggests that this guild was also
functionally active in these organic transitioning plots.
3.6. REFERENCES
Abawi, G.S., Widmer, T.L. 2000. Impact of soil health management practices on soil
borne pathogens, nematodes and root diseases of vegetable crops. Appl. Soil Ecol.
15, 37-47.
Alon, A., Steinberger, Y. 1999. Effect of nitrogen amendments on microbial biomass,
above-ground biomass and nematode population in the Negev Desert soil. J Arid
Environ. 41, 429-441.
Bakonyi, G., Nagy, P., 2000. Temperature- and moisture-induced changes in the structure
of the nematode fauna of a semiarid grassland: patterns and mechanisms Global
Change Biology 11, 697-707.
Bardgett, R.D., Cook, R., Yeates, G.W., Denton, C.S., 1999. The influence of nematodes
on below-ground processes in grassland ecosystems Plant and Soil 212, 23-33.
Barker, K.R., Campbell, C.L., 1981. Sampling nematode populations. In: Zuckerman,
B.M., Rhode R.A. (Eds.), Plant-parasitic Nematodes, Vol. III. Academic Press,
New York, NY pp. 451-471.
Barker, K.R., Nusbaum, C.J., Nelson, L.J., 1969. Effects of storage temperature and
extraction procedure on recovery of plant-parasitic nematodes from field soils. J.
Nematol. 1, 240-247.
Bongers, T., 1990. The maturity index: an ecological measure of environmental
disturbance based on nematode species composition. Oecologica 83, 14-19.
61

Bongers, T., Ferris, H., 1999. Nematode community structure as a bioindicator in
environmental monitoring. Trends Ecol. Evol. 14, 224-228.
Borken, W., Muhs, A., Beese, F., 2002. Changes in microbial and soil properties
following compost treatment of degraded forest soil. Soil Biol. Biochem. 34, 403-
412.
Brookes, P.C., Landman, A., Pruden, G., Jenkinson, D S., 1985. Chloroform fumigation
and the release of soil nitrogen: A rapid direct extraction method to measure
microbial biomass nitrogen in soil. Soil Biol. Biochem. 17, 837-842.
Bulluck III, L.R., Barker, K.R., Ristaino, J.B., 2002a. Influences of organic and synthetic
soil fertility amendments on nematode trophic groups and community dynamics
under tomatoes. Appl. Soil Ecol. 21, 233-250.
Bulluck III, L.R., Brosius, M., Evanylo, G.K., Ristaino, J.B., 2002b. Organic and
synthetic fertility amendments influence soil microbial, physical and chemical
properties on organic and conventional farms. App. Soil Ecol. 19, 147-160.
Chen, J., Ferris, H., 1999. The effects of nematode grazing on nitrogen mineralization
during fungal decomposition of organic matter. Soil Biol. Biochem. 31, 1265-
1279.
Clark, M.S., Horwarth, W.R., Shennan, C., Scow, K.M., Lanini, W.T., Ferris, H., 1999.
Nitrogen, weeds and water as yield-limiting factors in conventional, low-input,
and organic tomato systems. Agric. Ecosys. Environ. 73, 257-270.
Doran, J., 1995. Building soil quality. In: Proceedings of the 1995 Conservation
Workshop on Opportunities and Challenges in Sustainable Agriculture Red Deer,
62
Alta., Canada, Alberta Conservation Tillage Society and Alberta Agriculture
Conservation, Development Branch, pp. 151-154.
Drinkwater, L.E., Letourneau, D.K., Workneh, F., van Bruggen, A.H.C., Shennan, C.,
1995. Fundamental differences between conventional and organic tomato
agroecosystems in California. Ecol. Appl. 1098-1112.
Ferris, H., Bongers, T., 2006. Nematode indicators of organic enrichment. J. Nematol.
38, 3-12.
Ferris, H., Bongers, T., de Geode, R.G.M., 2001. A framework for soil food web
diagnostics: extension of the nematode faunal analysis concept. Appl. Soil Ecol.
18, 13-29.
Ferris, H., Bongers, T., De Goede, R.G.M., 1999. Nematode faunal indicators of soil
food web condition. J. Nematol. 31, 534-535.
Ferris, H., Matute, M., 2003. Structural and functional succession in the nematode fauna
of a soil food web. Appl. Soil Ecol. 23, 93-110.
Ferris, H., Venette, R.C., Lau, S.S., 1996. Dynamics of nematode communities in
tomatoes grown in conventional and organic farming systems and their impact on
soil fertility. Appl. Soil Ecol. 3, 161-175.
Ferris, H., Venette, R.C., Scow, K.M., 2004. Soil management to enhance bacterivore
and fungivore nematode populations and their nitrogen mineralization function.
Appl. Soil Ecol. 24, 19-35.
Fiscus, D.A., Neher, D.A. 2002. Distinguishing sensitivity of free-living soil nematode
genera to physical and chemical disturbances. Ecol. Appl. 12, 565-575.
63
Flegg, J.M., Hooper, D.J., 1970. Extraction of free-living stages from soil. In: Southey,
J.F. (Eds.), Laboratory methods for work with plant and soil nematodes. HMSO,
London, UK pp. 5-22.
Freckman, D. W., 1988. Bacterivorous nematodes and organic-matter decomposition.
Agric. Ecosyst. Environ. 24, 195-217.
Freckman, D.W., Ettema, C.H. 1993. Assessing nematode communities in
agroecosystems of varying human intervention. Agric. Ecosyst. Environ. 45, 239-
261.
Goodey, T., 1963. Soil and freshwater nematodes. Methuen and Co. Ltd., London, UK.
Grewal, P.S., R.-U. Ehlers, and Shapiro-Ilan, D.I. (Eds.). 2005. Nematodes As
Biocontrol Agents. CABI Publishing, CAB International, Oxon, U.K., pp. 1-505.
Griffiths, B.S., 1994. Microbial-feeding nematodes and protozoa in soil: Their effects on
microbial activity and nitrogen mineralization in decomposing hotspots and the
rhizosphere. Plant and Soil 164, 25-33.
Griffiths, B.S., Ritz, K., Wheatley, R.E., 1994. Nematodes as indicators of enhanced
microbiological activity in a Scottish organic farming system. Soil Use Manage.
10, 20-24.
Gunapala, N., Scow, K.M., 1998. Dynamics of soil microbial biomass and activity in
conventional and organic farming systems. Soil Biol. Biochem. 30, 805-816.
Hominick, B., 1999. Nematodes. In: Proceeding of the International Workshop Tropical
Soil Biology. Opportunities and challenges for African agriculture Nairobi, 16-19
March 1999 pp 17-22.
64
Ingham, R.E., Trofymow, J.A., Ingham, E.R., Coleman, D.C., 1985. Interactions of
bacteria, fungi, and their nematode grazers: Effects on nutrient cycling and plant
growth. Ecol. Monogr. 55, 119-140.
Jairajpuri, S.M., Ahmad, W., 1992. Dorylaimida: Free-living, Predacious and Plant-
Parasitic Nematodes. E. J. Brill, Leiden, The Netherlands.
Kimpinski, J., Sturz, A.V., 1996. Population growth of a rhabditid nematode on plant
growth promoting bacteria from potato tubers and rhizosphere soil. J. Nematol.
28, 682-686.
Knox, O.G.G., Killham, K., Mullins, C.E., Wilson, M.J., 2003. Nematode-enhanced
microbial colonization of the wheat rhizosphere. FEMS Microbiol. Lett. 225, 227-
233.
Laakso, J., Setälä, H., Palojärvi, A., 2000. Influence of decomposer food web structure
and nitrogen availability on plant growth. Pl. Soil 225, 153-165.
López-Fando, C., Bello, A., 1995. Variability in soil nematode populations due to tillage
and crop rotation in semi-arid mediterranean agrosystems. Soil Tillage Res. 36,
59-72.
Lundquist, E.J., Jackson, L.E., Scow, K.M., Hsu, C., 1999. Changes in microbial
biomass and community composition, and soil carbon and nitrogen pools after
incorporation of rye into three California agricultural soils. Soil Biol. Biochem.
31, 221-236.
McSorley, R., Frederick, J.J., 1999. Nematode population fluctuations during
decomposition of specific organic amendments. J. Nematol. 31, 37-44.
65
Nahar, M.S., Grewal, P.S., Miller, S.A., Stinner, D., Stinner, B.R., Kleinhenz, M.D.,
Wszelaki, A., Doohan, D., 2006. Differential effects of raw and composted
manure on nematode community, and its indicative value for soil microbial,
physical and chemical properties. App. Soil Ecol. 34, 140-151.
Neher, D.A., Olson, R.K., 1999. Nematode communities in soils of four farm cropping
management systems. Pedobiologia 43, 430-438.
Okada, H., Tsukiboshi, T., Kadota, I., 2002. Mycetophagy in Filenchus misellus
(Andrassy, 1958) Lownsbery & Lownsbery, 1985 (Nematoda: Tylenchidae), with
notes on its morphology. Nematology 4, 795-801.
Papatheodorou, E.M., Argyropoulou, M. D., Stamou, G.P., 2004. The effects of large-
and small-scale differences in soil temperature and moisture on bacterial
functional diversity and the community of bacterivorous nematodes. App. Soil
Ecol. 25, 37-49.
Porazinska, D.L., Duncan, L.W., McSorley, R., Graham, J.H., 1999. Nematode
communities as indicators of status and processes of a soil ecosystem influenced
by agricultural management practices. Appl. Soil Ecol. 13, 69-86.
Powlson, D.S., Brookes, P.C., Christensen, B.T., 1987. Measurement of soil microbial
biomass provides an early indication of changes in total soil organic matter due to
straw incorporation. Soil Biol. Biochem. 19, 159-164.
Ritz, K., Trudgill, D.L., 1999. Utility of nematode community analysis as an integrated
measure of the functional state of soils: perspectives and challenges. Plant Soil
212, 1-11.
66
Rodríguez-Kàbana, R., King, P.S., Pope, M.H., 1981. Combinations of anhydrous
ammonia and ethylene dibromide for control of nematodes parasitic of soybeans.
Nematropica 11, 27-41.
Shepherd, A.M., 1970. Preparation of nematodes for electron microscopy. In: Southey
J.F. (ed) Laboratory methods for work with plant and soil nematodes, HMSO,
London, UK. pp. 88-95.
Siddiqi, M.R., 1986. Tylenchida: Parasites of plants and insects. CAB International,
Slough, UK.
Sims, G.K., Ellsworth, T.R., Mulvaney, R.L., 1995. Microscale determination of
inorganic nitrogen in water and soil extracts. Soil Science, Plant Analysis 26, 303-
316.
Sohlenius, B., Wasilewska, L., 1984. Influence of irrigation and fertilization on the
nematode community in a Swedish pine forest soil. J. Appl. Ecol. 21, 327-342.
Tu, Cong., Louws, F.J., Creamer, N.G., Mueller, J.P., Brownie, C., Fager, K., Bell, M.,
Hu, S., 2006. Responses of soil microbial biomass and N availability to transition
strategies from conventional to organic farming systems. Agric. Ecos. Environ.
113, 206-215.
Verschoor, B.C., 2002. Carbon and nitrogen budgets of plant-feeding nematodes in
grasslands of different productivity App. Soil Ecol. 20,15-25
Vestegard, M., 2004. Nematode assemblages in the rhizosphere of spring barley
(Hordeum vulgare L.) depended on fertilizations and plant growth phase.
Pedobiologia 48, 257-265.
67
Villenave, C., Bongers, T., Ekschmitt, K., Fernandes, P., Oliver, R., 2003. Changes in
nematode communities after manuring in millet fields in Senegal. Nematol., 5,
351-358.
Werner, M.R., 1997. Soil quality characteristics during conversion to organic orchard
management. Appl. Soil Ecol. 5, 151-167.
Yardim, E.N., Edwards, C.A., 1998. The effects of chemical pest, disease and weed
management practices on the trophic structure of nematode populations in tomato
agroecosystems. App. Soil Ecol. 7, 137-147.
Yeates, G.W., Wardle, D.A., Watson, R.N., 1999. Response of soil nematode
populations, community structure, diversity and temporal variability to
agricultural infestation over a seven-year period. Soil Biol. Biochem. 31, 1721-
1733.
Yeates, G.W., 1979. Soil nematodes in terrestrial ecosystems. J. Nematol. 11, 213-229.
Yeates, G.W., Bongers, T., 1999. Nematode diversity in agroecosystems. Agric. Ecosys.
Environ. 74, 113-135.
Yeates, G.W., Bongers, T., De Goede, R.G.M., Freckman, D. W., Georgieva, S.S., 1993.
Feeding habits in soil nematode families and genera–an outline for soil ecologists.
J. Nematol. 25, 315-331.
Zunke, U., 1990. Observations on the invasion and endoparasitic behavior of the root
lesion nematode, Pratylenchus penetrans. J Nematol. 22, 309-320.
68
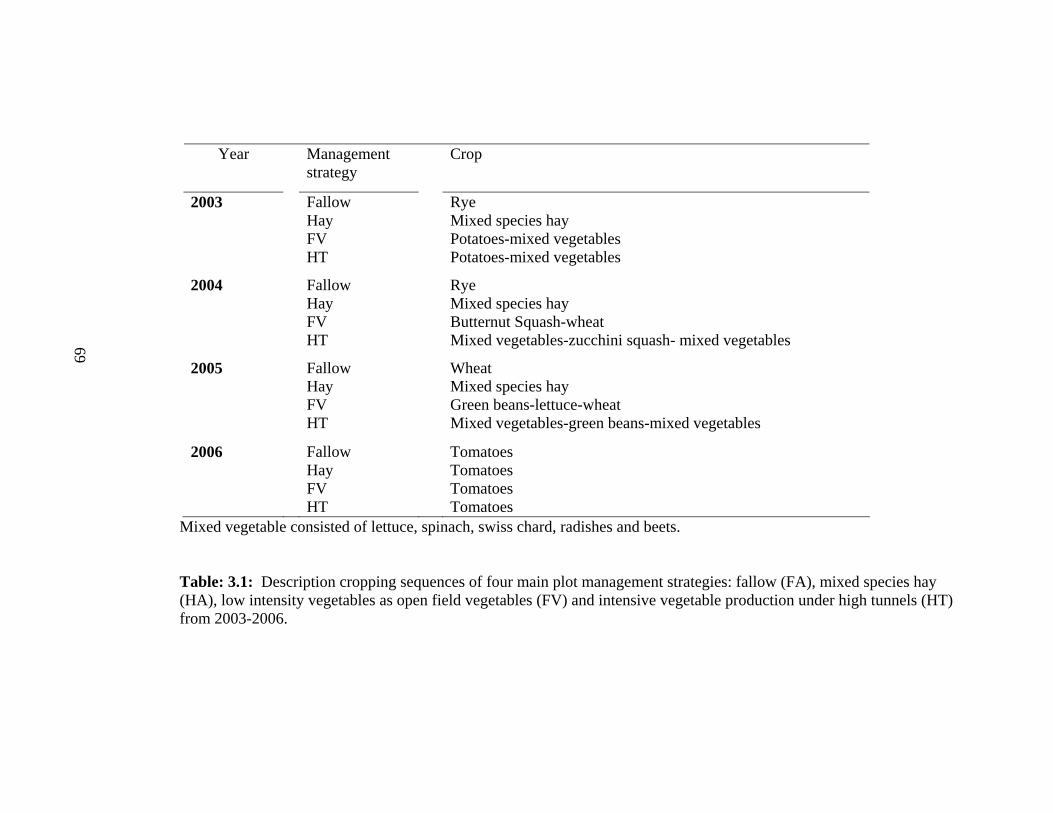
Year
Management strategy
Crop
2003 Fallow Rye Hay Mixed species hay FV Potatoes-mixed vegetables HT Potatoes-mixed vegetables
2004 Fallow Rye Hay Mixed species hay FV Butternut Squash-wheat HT Mixed vegetables-zucchini squash- mixed vegetables
2005 Fallow Wheat Hay Mixed species hay FV Green beans-lettuce-wheat HT Mixed vegetables-green beans-mixed vegetables
2006 Fallow Tomatoes Hay Tomatoes FV Tomatoes HT Tomatoes
69
Mixed vegetable consisted of lettuce, spinach, swiss chard, radishes and beets. Table: 3.1: Description cropping sequences of four main plot management strategies: fallow (FA), mixed species hay (HA), low intensity vegetables as open field vegetables (FV) and intensive vegetable production under high tunnels (HT) from 2003-2006.

. Parameter 2003a 2006* Strategy (df 3, 53) Strategy (df 3, 53) C vs. NC (df 1, 53) Nematode c-p Bf1
¶ 0.89 (0.2) 0.0003 (7.32) 0.0008 (12.68) Bf2 0.12 (2.4) 0.0001 (29.7) 0.001 (22.6) Bf4 0.66 (0.5) 0.01 (4.02) 0.55 (0.3) Fungivores (Ff2) 0.14 (1.8) 0.04 (3.77) 0.51 (0.43) Omnivores (Om4) 0.30 (1.2) 0.64 (0.6) 0.10 (0.75) Predatory (Pr4) 0.38 (1.1) 0.06 (3.42) 0.009 (7.40) Pp2 0.74 (0.4) 0.11 (2.06) 0.05 (3.42) Pp3 0.53 (0.7) 0.01 (6.8) 0.08 (2.5) Pp5 0.40 (1.0) 0.0001 (11.28) 0.94 (0.0) Indices EI 0.25 (1.6) 0.03 (3.90) 0.31 (0.60)
SI 0.16 (0.9) 0.10 (2.20) 0.45 (0.5) CI 0.06 (2.6) 0.50 (0.80) 0.0006 (13.6)
70
Numbers are P and F-values (Numbers in parenthesis are F-values) Bf: bacterivores; Ff: Fungivores; Om: Omnivores; Ca: Carnivores and Pp: Plant parasitic nematodes, C: Composted, NC: Non-composted, aMain plot management strategy, aSoil sampling before the establishments of organic strategies, *Soil sampling after a uniform crop tomato was grown in all strategies in 2006.
Table 3.2: Effect of main plot strategies and compost on nematode c-p groups and food web indices [enrichment (EI), structure (SI), and channel index (CI)].

Year Strategy a Bf Ff Om Pr Pp
Bf1¶ Bf2 Bf4 Total Bf Ff2 Om4 Pr4 Pp2 Pp3 Pp5 Total Pp
2003b 24.6 50.8 4.0
79.4 19.0 5.0
3.7 42.3 1.4 0.2
43.9
2004 FA-C
14.8 11.4 0.25 26.5
2.6 1.1
0.1 3.7 3.3 0.3 7.5 FA-NC
12.1 10.7 0.12 23.0
5.0 2.1
0.1 5.3 2.4 0.0 7.6 FV-C
34.0 19.7 0.12 53.8
5.8 2.4
0.2 3.6 3.0 0.1 6.7 FV-NC
22.1 22.3 0.0 44.3
4.5 4.7
0.0 16.5 7.7 0.2 24.5 HA-C
17.2 22.6 0.0 39.8
7.2 10.1
0.0 16 17.0 0.1 33.1 HA-NC
7.8 14.1 0.0 22.0
4.3 1.0
0.1 18.8 9.6 1.1 29.6 HT-C
43.5 43.7 0.1 87.4
23.6 1.5
0.0 14.0 14.3 0.1 28.5 HT-NC
27.7 59.0 1.0 87.7
32.7 2.2
0.1 9.5 9.1 0.2 18.8
71
bSoil sampling before the establishments of organic strategies, ¶ Numbers in the subscript represents c-p values, a Sub plot strategies, *Soil sampling after a uniform crop tomato was grown in all strategies in 2006. Table 3.3: Comparison between main plot strategies with and without compost on nematode c-p guilds (Bf: bacterivore; Ff: fungivores; Om: omnivores; Pr: predatory and Pp: plant-parasites) from 2003 and 2006 soil sampling.

72
Table 3.3: continued
Year Strategy Bf Ff Om Pr Pp
Bf1 Bf2 Bf4 Total Bf Ff2 Om4 Pr4 Pp2 Pp3 Pp5 Total Pp
2005 FA-C 20.2 22.6 0.6 43.4 2.2 2.3 0.0 6.5 0.6 0.0 7.1 FA-NC 20.2 23.1 0.6 43.8 6.1 2.7 0.1 9.5 1.0 0.0 10.5 FV-C 40.7 39.5 0.7 81.0 5.2 3.6 0.0 22.1 5.0 0.1 27.2 FV-NC 25.4 31.1 1.0 57.5 1.6 2.5 1.0 28.2 4.5 0 32.7 HA-C 155.1 14.7 0.6 170.5 2.6 5.1 1.3 13.2 8.1 0.8 22.1 HA-NC 27.2 21.7 3.2 52.2 0.7 4.0 1.1 23.15 9.5 1.2 34.0 HT-C 41.7 88.2 0.6 130.6 5.5 2.5 0.1 11.5 10.7 0.0 22.2 HT-NC 52.6 102.7 1.0 156.4 14.1 2.0 1.1 18.6 25.5 0.0 44.12006 FA-C 31.2 43.0 0.3 74.6 5.1 0.7 2.7 19.3 1.1 0.0 20.1 FA-NC 3.6 12.8 0.3 16.8 3.7 1.0 0.5 7.0 0.1 0.1 7.2 FV-C 10.8 27.8 0.4 39.1 5.0 1.5 0.7 15.4 3.6 0.5 19.5 FV-NC 5.1 9.6 0.3 15.0 6.6 1.6 0.3 14.0 1.7 0.2 16.0 HA-C 33.2 93.0 1.2 127.0 10.8 2.6 1.3 15.2 9.0 4.0 28.0 HA-NC 22.6 79.7 1.0 103.4 11.6 2.6 1.3 13.0 12.6 3.5 29.2 HT-C 31.12 154.7 2.2 188.0 9.4 1.5 0.9 22.9 5.6 0.5 28.6 HT-NC 9.0 58.8 1.2 69.0 9.7 2.1 0.4 17.0 10.1 0.8 27.8

Year Soil parameters
BD
TOM
POM
MAOM
NH4+-N
NO3--N
DON
MB-N
2003 Strategy a
(df 3, 53)
0.06 (3.1)
0.38 (1.1)
0.62 (0.6)
0.37 (1.2)
0.69 (0.5)
.09 2.7)
0.55 (0.7)
0.09 (2.8)
2006* 73 Strategy
(df 3, 53)
0.41 (1.1)
0.62(2.1)
0.01 (5.1)
0.03 (4.6)
0.89 (0.2)
0.47 (0.9)
0.59(0.6)
0.74 (0.4)
C vs NC
(df 3, 53)
0.001 (20)
0.1 (2.2)
0.0001 (519)
0.0001 (37)
0.27 (1.2)
0.0001 (21.6)
0.01(6.1) 0.10 (2.8)
Numbers are P-values and F-values are in parenthesis, C: Composted, NC: Non-composted, aMain plot strategy, bSoil sampling before the establishments of organic strategies, * Soil sampling after a uniform crop tomato was grown in all strategies in 2006.
Table 3.4: Effect of main plot strategies and compost on soil properties [bulk density (BD), organic matter % (TOM), % mineral associated organic matter (MAOM) (<0.05 mm), particulate organic matter (0.05-2 mm) (POM), mineral-N (NH4
+-N and NO3
--N (µg g-1 dry soil), and microbial biomass-N (MB-N) (µg g-1)].
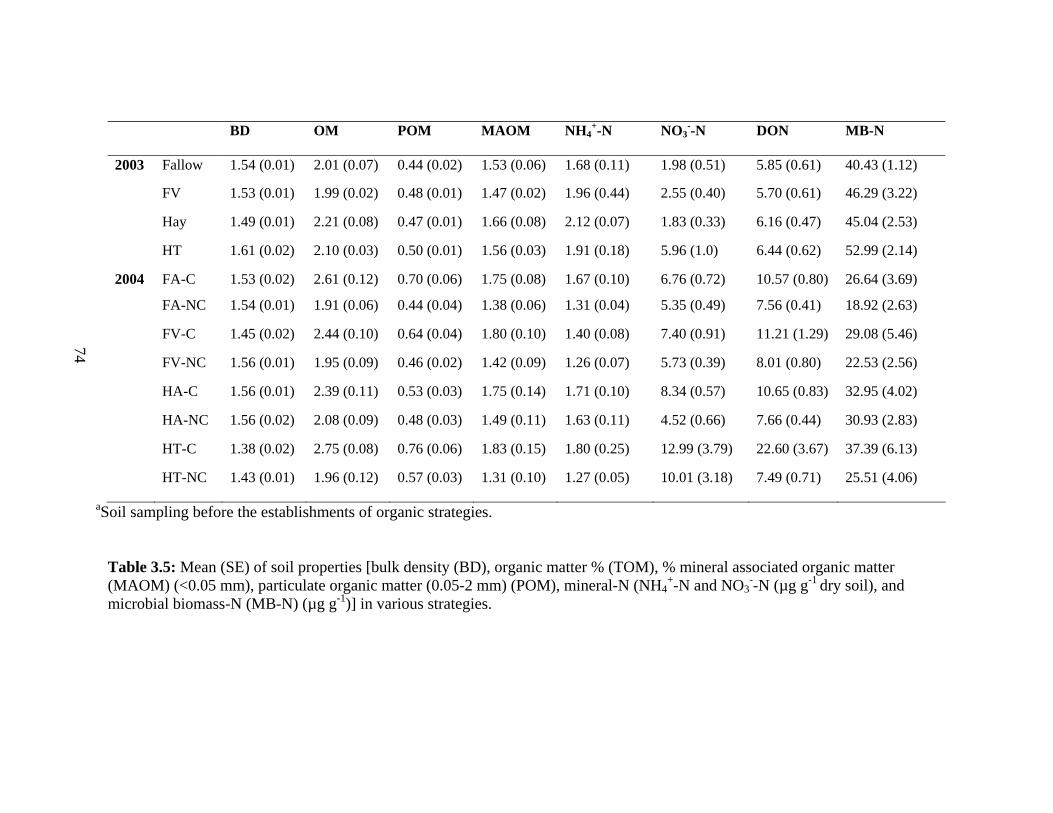
BD OM POM MAOM NH4+-N NO3
--N DON MB-N
2003 Fallow 1.54 (0.01) 2.01 (0.07) 0.44 (0.02) 1.53 (0.06) 1.68 (0.11) 1.98 (0.51) 5.85 (0.61) 40.43 (1.12)
FV 1.53 (0.01) 1.99 (0.02) 0.48 (0.01) 1.47 (0.02) 1.96 (0.44) 2.55 (0.40) 5.70 (0.61) 46.29 (3.22)
Hay 1.49 (0.01) 2.21 (0.08) 0.47 (0.01) 1.66 (0.08) 2.12 (0.07) 1.83 (0.33) 6.16 (0.47) 45.04 (2.53)
HT 1.61 (0.02) 2.10 (0.03) 0.50 (0.01) 1.56 (0.03) 1.91 (0.18) 5.96 (1.0) 6.44 (0.62) 52.99 (2.14)
2004 FA-C 1.53 (0.02) 2.61 (0.12) 0.70 (0.06) 1.75 (0.08) 1.67 (0.10) 6.76 (0.72) 10.57 (0.80) 26.64 (3.69)
FA-NC 1.54 (0.01) 1.91 (0.06) 0.44 (0.04) 1.38 (0.06) 1.31 (0.04) 5.35 (0.49) 7.56 (0.41) 18.92 (2.63)
FV-C 1.45 (0.02) 2.44 (0.10) 0.64 (0.04) 1.80 (0.10) 1.40 (0.08) 7.40 (0.91) 11.21 (1.29) 29.08 (5.46)
FV-NC 1.56 (0.01) 1.95 (0.09) 0.46 (0.02) 1.42 (0.09)
74
1.26 (0.07) 5.73 (0.39) 8.01 (0.80) 22.53 (2.56)
HA-C 1.56 (0.01) 2.39 (0.11) 0.53 (0.03) 1.75 (0.14) 1.71 (0.10) 8.34 (0.57) 10.65 (0.83) 32.95 (4.02)
HA-NC 1.56 (0.02) 2.08 (0.09) 0.48 (0.03) 1.49 (0.11) 1.63 (0.11) 4.52 (0.66) 7.66 (0.44) 30.93 (2.83)
HT-C 1.38 (0.02) 2.75 (0.08) 0.76 (0.06) 1.83 (0.15) 1.80 (0.25) 12.99 (3.79) 22.60 (3.67) 37.39 (6.13)
HT-NC 1.43 (0.01) 1.96 (0.12) 0.57 (0.03) 1.31 (0.10) 1.27 (0.05) 10.01 (3.18) 7.49 (0.71)
aSoil sampling before the establishments of organic strategies.
25.51 (4.06)
Table 3.5: Mean (SE) of soil properties [bulk density (BD), organic matter % (TOM), % mineral associated organic matter (MAOM) (<0.05 mm), particulate organic matter (0.05-2 mm) (POM), mineral-N (NH4
+-N and NO3--N (µg g-1 dry soil), and
microbial biomass-N (MB-N) (µg g-1)] in various strategies.
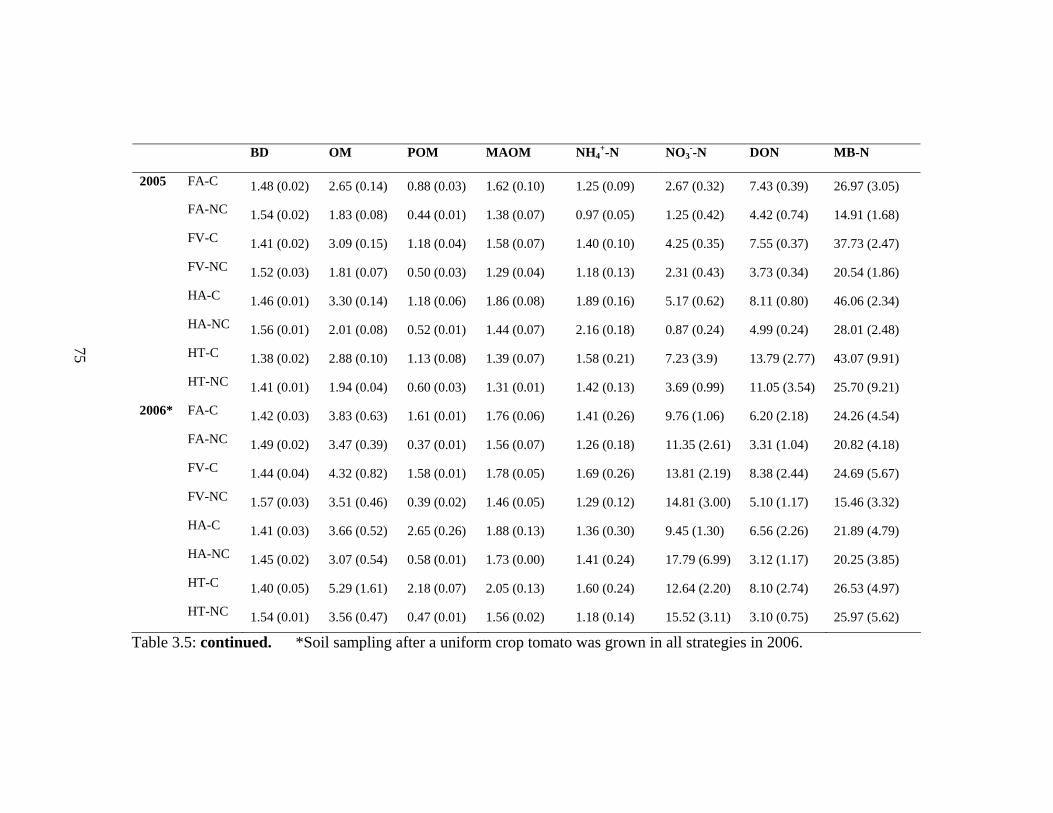
BD OM POM MAOM NH4+-N NO3
--N DON MB-N
2005 FA-C 1.48 (0.02) 2.65 (0.14) 0.88 (0.03) 1.62 (0.10) 1.25 (0.09) 2.67 (0.32) 7.43 (0.39) 26.97 (3.05)
FA-NC 1.54 (0.02) 1.83 (0.08) 0.44 (0.01) 1.38 (0.07) 0.97 (0.05) 1.25 (0.42) 4.42 (0.74) 14.91 (1.68)
FV-C 1.41 (0.02) 3.09 (0.15) 1.18 (0.04) 1.58 (0.07) 1.40 (0.10) 4.25 (0.35) 7.55 (0.37) 37.73 (2.47)
FV-NC 1.52 (0.03) 1.81 (0.07) 0.50 (0.03) 1.29 (0.04) 1.18 (0.13) 2.31 (0.43) 3.73 (0.34) 20.54 (1.86)
HA-C 1.46 (0.01) 3.30 (0.14) 1.18 (0.06) 1.86 (0.08) 1.89 (0.16) 5.17 (0.62) 8.11 (0.80) 46.06 (2.34)
HA-NC 1.56 (0.01) 2.01 (0.08) 0.52 (0.01) 1.44 (0.07) 2.16 (0.18) 0.87 (0.24) 4.99 (0.24) 28.01 (2.48)
HT-C 1.38 (0.02) 2.88 (0.10) 1.13 (0.08) 1.39 (0.07)
75 1.58 (0.21) 7.23 (3.9) 13.79 (2.77) 43.07 (9.91)
HT-NC 1.41 (0.01) 1.94 (0.04) 0.60 (0.03) 1.31 (0.01) 1.42 (0.13) 3.69 (0.99) 11.05 (3.54) 25.70 (9.21)
2006* FA-C 1.42 (0.03) 3.83 (0.63) 1.61 (0.01) 1.76 (0.06) 1.41 (0.26) 9.76 (1.06) 6.20 (2.18) 24.26 (4.54)
FA-NC 1.49 (0.02) 3.47 (0.39) 0.37 (0.01) 1.56 (0.07) 1.26 (0.18) 11.35 (2.61) 3.31 (1.04) 20.82 (4.18)
FV-C 1.44 (0.04) 4.32 (0.82) 1.58 (0.01) 1.78 (0.05) 1.69 (0.26) 13.81 (2.19) 8.38 (2.44) 24.69 (5.67)
FV-NC 1.57 (0.03) 3.51 (0.46) 0.39 (0.02) 1.46 (0.05) 1.29 (0.12) 14.81 (3.00) 5.10 (1.17) 15.46 (3.32)
HA-C 1.41 (0.03) 3.66 (0.52) 2.65 (0.26) 1.88 (0.13) 1.36 (0.30) 9.45 (1.30) 6.56 (2.26) 21.89 (4.79)
HA-NC 1.45 (0.02) 3.07 (0.54) 0.58 (0.01) 1.73 (0.00) 1.41 (0.24) 17.79 (6.99) 3.12 (1.17) 20.25 (3.85)
HT-C 1.40 (0.05) 5.29 (1.61) 2.18 (0.07) 2.05 (0.13) 1.60 (0.24) 12.64 (2.20) 8.10 (2.74) 26.53 (4.97)
HT-NC 1.54 (0.01) 3.56 (0.47) 0.47 (0.01) 1.56 (0.02) 1.18 (0.14) 15.52 (3.11) 3.10 (0.75) 25.97 (5.62)
Table 3.5: continued. *Soil sampling after a uniform crop tomato was grown in all strategies in 2006.

Pratylenchus Tylenchus + Filenchus
Nem
atod
e po
pula
tion
0
5
10
15
20
Strategy (P = 0.01)C vs NC (P = 0.04)
C vs NC (P = 0.05)Strategy (P = 0.10)
FA-C FA-NC FV-C FV-NCHA-C HA-NC HT-C HT-NC
Fig. 3.1: Effect of various strategies on abundance of root lesion nematode Pratylenchus and root hair feeders (Tylenchus + Filenchus). Bars represent the mean population data in 2006. FA-C: Fallow composted, FA-NC: Fallow non-composted, FV-C: Field vegetable composted, FV-NC: Field vegetable non-composted, HA-C: Hay composted, HA-NC: Hay non-composted, HT-C: High tunnels composted, HT-NC: High tunnels non-composted.
75

76
Enric
hmen
t ind
ex
0
25
50
75
100
Fallow-C Fallow-NC FV-C FV-NC HAY-C HAY-NC HT-C HT-NC
Enric
hmen
t ind
ex
0
25
50
75
100
Structure index0 25 50 75 100
0
25
50
75
Structure index0 25 50 75 100
0
25
50
75
2003 2004
2005 2006
A B
CDD
A B
C
A B
CD
A B
CD
Fig. 3.2: Food webs indicated by nematode faunal analysis in 8 sub plot management strategies in 2003-2006. FA-C: Fallow composted, FA-NC: Fallow non-composted, FV-C: Field vegetable composted, FV-NC: Field vegetable non-composted, HA-C: Hay composted, HA-NC: Hay non-composted, HT-C: High tunnels composted, HT-NC: High tunnels non-composted.

C a n o n ic a l v a r ia te 1-0 .8 -0 .6 -0 .4 -0 .2 0 .0 0 .2 0 .4 0 .6 0 .8
Can
onic
al v
aria
te 2
- 1 .5
-1 .0
-0 .5
0 .0
0 .5
1 .0
1 .5
B f1 B f2
B f4
F f2O m 4P r4
P p 2
P p 3
P p 5B D
N H 4N O 3
D O N
M B -N
P O M
M A O M
(A )
C a n o n ic a l v a r ia te 1
-0 .8 -0 .6 -0 .4 -0 .2 0 .0 0 .2 0 .4 0 .6 0 .8 1 .0
Can
onic
al v
aria
te 2
- 1 .5
-1 .0
-0 .5
0 .0
0 .5
1 .0
1 .5
B f1
B f2
B f4
F f2
O m 4P r4
P p 2
P p 3
P p 5
B D
N H 4
N O 3
D O NM B -N
P O M
M A O M
(B )
Figure 3.3: Canonical correlation analysis of soil factors (Mineral nitrogen: NH4 and NO3, Microbial biomass-N: MB-N, Mineral associated organic matter: MAOM, particulate organic matter: POM, Dissolved organic nitrogen: DON, and Bulk density: BD) vs nematode c-p guilds (Bacterivores in c-p groups 1, 2 and 4: Bf1, Bf2, Bf4; fungal feeding in c-p 2: Ff2; Omnivores in c-p 4: Om4; Predators in c-p 4 Pr4; and Plant feeding in c-p 2, 3, and 5: Pp2, Pp3, Pp5). Figure 3.3A 2003 soil sampling. Figure 3.3B 2006 soil sampling.
77

Fig. 3.4: Bars represent monthly mean soil temperature from January to December. Each month average temperature is further average of three years (2003-2006) in that month.
78

79
CHAPTER 4
AN ASSESSMENT OF THE INDICATIVE VALUE OF NEMATODE TROPHIC
GROUP ABUNDANCE AND FOOD WEB INDICES IN DIFFERENTIATING
HABITATS WITH A GRADIENT OF ANTHROPOGENIC IMPACT
4.1. INTRODUCTION
Nematodes exist as a diverse and highly speciated group in the soil environment.
They occupy a central position in the soil food web, occurring at multiple trophic levels
(Yeates, 1979; Moore and de Ruiter, 1991). Therefore, nematodes have the potential to
provide useful insights into the structure and function of the soil food web (Ferris et al.,
1999; Ritz and Trudgill, 1999; Neher et al., 2001). Nematodes can be grouped into five
major trophic groups; bacterivores, fungivores, plant parasites, predators and omnivores
(Yeates et al., 1993). Plant-parasitic nematodes are considered as primary consumers and
they affect food web resources through direct herbivory (Ferris and Bongers, 2006).
Bacterivore and fungivore nematodes graze on decomposer microbes, bacteria and fungi,
and thus significantly contribute to nutrient mineralization (Ferris and Matute, 2003;
Ferris et al., 1996; Ingham et al., 1985). Bacterivore nematodes also promote rhizosphere
colonization of beneficial bacteria (Kimpinski and Sturz, 1996; Knox et al., 2003).
Predatory nematodes regulate the food web by preying on other nematodes and
invertebrates in the soil (Zimmerman and Cranshaw, 1990; Grewal et al., 2005).

80
The development of the maturity index (MI) based on the colonizer-persister (c-p)
values of nematodes has helped in interpreting the biological and trophic status of the soil
food web in different habitats (Bongers 1990). MI is routinely used as an ecological
measure for assessing the status of soil food webs in terrestrial habitats (Nahar et al.,
2006; Neher et al., 2005; Yardim and Edwards, 1998; Yeates et al., 1999; Sohlenius and
Wasilewska, 1984; Sohlenius, 1990; Sohlenius and Boström, 1986; Nethi et al., 2002).
In addition, the plant parasitic index (PPI) (based on c-p value of plant-parasitic
nematodes), combined maturity index (CMI, that includes both free-living and plant-
parasitic nematodes), diversity (species richness and evenness), ratio of bacterivore to
fungivore nematodes, and trophic diversity have been used for the assessment of the soil
food web condition. Ferris et al. (2001) developed enrichment (EI), structure (SI), and
channel (CI) indices based on the relative weighted abundance of nematode c-p guilds.
EI provides an indication of the response of primary decomposers to the available
resources in the soil food web while SI suggests trophic linkages in a food web as
indicated by the presence of higher c-p value nematodes particularly predatory and
omnivores (Ferris et al., 2001). Therefore, plotting EI and SI provides a graphic
representation of nematode faunal profile depicting the likely condition of the soil food
web in a given habitat (Ferris et al., 2001). As CI provides information about the
decomposition channels, a high CI (> 50 %) indicates fungal decomposition channels
whereas low CI (< 50 %) suggests bacterial decomposition channels (Ferris et al., 2001).
In the present study, we compared different habitats located in two counties in
Ohio under different intensities of anthropogenic disturbances using the most widely used
nematode community measures (indices and trophic groups). Although quantification of

81
human impact on a habitat and characterizing habitats into intensively managed or
unmanaged, largely depends on the type of human intervention, a broad classification due
to physical, chemical or biological disturbances is feasible (Neher et al., 2005).
Depending on the nature (physical, chemical or biological) and frequency (magnitude) of
disturbance, croplands and forests can be considered as two extremes on the management
intensity continuum. We designated croplands cultivated for the production of vegetables
and field crops to represent intensively managed habitats, and the forests and shrublands
to represent unmanaged habitats. Turfgrass lawns and grassy borders alongside
croplands represented intermediate levels of management. Nematodes play crucial roles
in many soil processes, so analysis of the soil nematode community is expected to reflect
differences between habitats (Yeates, 1996; Neher et al., 2005). Further, response to
disturbances can be integrated through nematode community measures such as trophic
groups and various indices described above (Ferris et al., 2001; Yeates et al., 1999,
Bongers, 1990). A better understanding of nematode community measures to
characterize different habitats would further advance the indicative capability of
nematodes at global scales (Neher et al., 2005). Therefore, the specific objectives of this
study were (1) to compare different habitats using a composite of nematode community
indices with multivariate analysis of variance (MANOVA) and (2) to identify the relative
importance and interrelationships among nematode community indices and trophic group
abundance to discriminate habitats using principal components analysis (PCA).
As the northern Ohio landscapes contain a number of pockets of muck soils, we
intentionally included habitats located in muck and mineral soils for comparison. Muck
soils have low bulk density and pH, and unlike mineral soils, they have high organic

82
matter content. These soils are well suited for the production of vegetables such as celery
and carrots (Ernst and Martin, 1994). However, muck soils are prone to wind erosion and
oxidation and are therefore becoming shallower than the other land tracts. These soils
often catch fire and burn underground for months. Although, some muck soils have also
been reclaimed for wildlife preserves, the ecology of these soils is poorly understood.
Therefore, we addressed this issue by including different habitats from a predominantly
muck soil landscape in this study.
4.2. MATERIAL AND METHODS
4.2.1 Selection of habitats
This research was conducted at two sites. Multiple locations were selected for
collection of soil samples representing each habitat. In Huron County, Ohio (41° 47' N-
82°' 55' W), five habitats: croplands, turfgrass lawns, grassy borders, shrublands and
forests, were sampled in 12, 7, 7, 6 and 4 different locations, respectively. The soil was
mainly sandy loam muck with 21-48% sand, 36-39% silt and 14-37% clay with an
organic matter content ranging from 9.4-19.5% (Table 4.1). In Wayne County, Ohio (40°
47' N-81° 55' W), two habitats, croplands and turfgrass lawns, were sampled in 5 and 8
different locations, respectively. The soil at this location was silt loam mineral with
organic matter ranging between 2-5% (Table 4.1).
4.2.2. Soil sampling
A total of 604 soil samples from five habitats located in Huron County, and 242
samples from the two habitats located in Wayne County were collected. Each soil
sample was a composite of three soil cores, collected using a soil auger (2.5 cm diameter
83
and 15 cm deep). Root pieces and stone pebbles were removed from the samples by
passing them through a soil sieve (6 mm mesh) and soil samples were stored in the dark
at 5oC until processed for nematode extraction. A portion of soil samples collected for
nematode analysis was also analyzed for percent organic matter and pH at the Field Crop
Ecology Laboratory, Ohio Agricultural Research and Development Center (OARDC),
Wooster using standard methods (Sims et al., 1995).
4.2.3 Nematodes
4.2.3.1 Extraction, identification, counting and assigning functional groups
Nematodes were extracted from 10 g sub sample taken from each composite soil
sample using the Baermann funnel technique (Flegg and Hooper, 1970). Nematodes
were collected every 24 h intervals for 72 h, pooled, heat killed, and fixed with
triethanolamine formaldehyde (TAF) solution (Shepherd, 1970). Nematodes were
identified to the genus level using an inverted microscope following diagnostic keys by
Goodey (1963), Siddiqui (1986), Jairajpuri and Ahmed (1992). All identified nematode
genera were assigned to a functional group (plant parasitic, fungal feeder, bacterial
feeder, omnivore, or predatory) and a colonizer-persister value (c-p value) was assigned
according to Yeates et al. (1993) and Bongers (1990) respectively.
4.2.3.2 Calculation of nematode indices
Shannon diversity (H’), was calculated for nematode diversity, using the
following formulae: Shannon-Weiner Index H’ = ∑Pi (ln Pi), where Pi is the proportion
of genera ni in the nematode community n (Pielou, 1977). Maturity index (MI) for free-
living nematodes (all nematodes except plant parasitic nematodes) was calculated using
the formula MI = (∑vifi) /n, where vi is the c-p value for the nematode genera i, fi is the

84
frequency of nematode genera i, and n is the total number of individual nematodes of the
genera i in the sample (Bongers, 1990). Plant parasitic index (PPI) was calculated
considering only plant parasitic nematodes (Bongers, 1990) as PPI = (∑vifi) /n where vi is
the c-p value for the plant-parasitic nematodes genera i, and fi is the frequency of plant-
parasitic nematodes genera i, and n is the total number of individual nematodes of the
genera i in the sample. Enrichment (EI), and structure indices (SI) were calculated
according to Ferris et al. (2001), with basal components (b) of the food web (fungal and
bacterial feeders in the c-p 2 guild) calculated as b = ∑kbnb where kb is the weighted
constant for the guild, and n is the number of nematodes in that guild. Enrichment (e)
and structure (s) components were similarly calculated, using nematode guilds indicative
of enrichment (bacterivores in c-p 1, and fungivores of c-p 2), and guilds supporting
structure (bacterivores in c-p 3-5, fungivores c-p 3-5, omnivores of c-p 3-5, and predatory
nematodes of c-p =2-5). Finally the EI is calculated as 100 x e/(e + b), and the SI as 100
x s/(s + b). Channel Index (CI), which provides an index of nature of decomposition, was
calculated as 100 x (0.8 fungivores c-p 2/(3.2 bacterivores c-p 1 + 0.8 fungivores c-p 2)
where the coefficients are the ke enrichment weightings for the respective guilds (Ferris
et al., 2001). SI and EI provide information about the structure and enrichment of the
soil food web, respectively and CI provides an index of the bacterial and fungal driven
decomposition channels in the soil food web.
4.2.4. Statistical analysis
All the analyses were performed using general linear models procedure in SAS
Version 9.1, SAS Institute, Inc. (Cary, NC). Multivariate analysis of variance
(MANOVA) using composite of various nematode community indices or trophic groups

85
was performed to obtain F and P-values to determine overall significance of the model
for comparison between the habitats. Locations were considered random nested within
the habitats. Contrasts were included in the MANOVA model statement for habitat
group comparisons. Among the various multivariate test statistics obtained in the SAS
output, “Pillai’s trace”, was considered for F and P-values. An alpha level of 0.05 was
used for all tests. Statistical analysis to determine the combination of nematode indices
that contributed to the differences between the habitats was performed with principal
component analysis (PCA) based on the correlation matrix using Statistica (Version
2002) for Windows package (Stat soft Inc., Tulsa, USA). PCA was also performed on
nematode trophic groups abundance separately using the same statistical software.
Nematode abundance data were transformed by ln (x+1) prior to stabilize the variance
and achieve normality in the data . Raw means and standard errors were calculated using
Minitab Version 13.31 (Minitab, Inc., State College, PA).
4.3. RESULTS
A total of 43 nematode genera were identified. In the muck soils, 38, 32, 32, 34
and 33 nematode genera were detected in forests, shrublands, grassy borders, turfgrass
lawns and croplands, respectively. In the mineral soil, 30 nematode genera were detected
in turfgrass lawns and 32 in croplands. Among the free-living nematode genera,
Acrobeloides was the most abundant in all the habitats at both study sites. Labronema,
Teratocephalus, Discolaimus, Mylonchulus, Hemicriconemoides and Rotylenchus were
only observed in muck soils. Juveniles of the cyst nematodes Heterodera spp. were
observed in low numbers from croplands in the mineral soils but not from the croplands
86
in muck soils. Among the plant parasites, Tylenchus was dominant in all the habitats but
maximum population of this genus was observed in turfgrass lawns followed by
shrublands. The population of Pratylenchus was least in forests and highest in turfgrass
lawns and grassy borders. Hemicriconemoides was only observed in forest soils.
4.3.1 Comparison between the habitats using multivariate analysis of variance
(MANOVA)
MI was observed to be the highest in shrublands and forests compared to the other
habitats (Table 2). Croplands at both the study sites had the lowest Shannon diversity
index (H’) as compared to the other habitats. Shrublands and forests also showed the
highest structure index (SI) followed by the turfgrass lawns and grassy borders in muck
soils and croplands and turfgrass lawns in mineral soils, respectively (Table 4.2). EI
ranged between 62 and 78 in all the habitats. Croplands in the muck soil had the lowest
PPI compared to the other habitats (Table 4.2).
Results of MANOVA showed overall significance of the model for comparison
among the habitats (F = 2.25, df = 120, P = 0.002) using composite of various nematode
indices (MI, PPI, EI, SI, CI and H’). Contrasts revealed that croplands differed
significantly from forests (F = 4.29, df = 27, P = 0.003), shrubs (F = 6.36, df = 27, P =
0.0003), grassy borders (F = 4.08, df = 27, P = 0.0004) and turfgrass lawns (F = 4.85, df
= 27, P = 0.001) (Table 4.3). Although no differences were observed between shrublands
and forests (F = 1.15, df = 27, P = 0.36), turfgrass lawns differed significantly from
shrublands (F = 2.43, df = 27, P = 0.005) but not from forests (F = 0.54, df = 27, P =
0.77) and grassy borders (F = 0.33, df = 27, P = 0.91).

87
Although croplands in muck soil were significantly different from croplands in
the mineral soils (F = 2.85, df = 23, P = 0.03), no significant differences were observed
between turfgrass lawns in the muck soils and mineral soil (F = 1.36, df = 23, P = 0.27).
Further, no significant differences were detected between the muck and mineral soil types
when data from different habitats were lumped (F = 1.74 df = 23, P = 15). Turfgrass
lawns in general were significantly different from croplands when averaged over the soil
type (F = 7.56, df = 23, P = 0.0001) (Table 4).
MANOVA was also performed separately using composite of various nematode
trophic groups and the results showed similar differentiation between the habitats as
observed using indices (results not presented).
4.3.2 Principal components analysis (PCA)
The eigenanalysis of the nematode indices composite showed that 78% of the
variation in the data is accounted for by the first three components (Table 4.5). Loading
variables (nematode indices) that explained maximum variation along PC1, PC2 or PC3
were identified by their PC loadings. MI, EI and CI explained the spread along the PC1
while SI, EI and CI influenced habitat differences along the PC2 axes. Along the PC3
axis only PPI explained the variation in the data.
Eigenanalysis of the nematode trophic group abundance shows that 81% of the
variation in the data is accounted for by the first three components (Table 4.6). Along the
PC1 axis, variation is partly explained by all the trophic groups but plant parasites explins
the maximum variation among all the trophic groups. Along the PC2 axis only
bacterivores and fungivores explained majority of the variation. Predatory nematodes
explained most of the variation between the habitats along the PC3 axis.

88
Mean scores of PC1 and PC2 were calculated for comparison between the habitats
using nematode indices or trophic groups for each location sampled within a habitat.
These mean scores were then plotted on X and Y-axes (X-axis as PC1 as and Y-axis as
PC2) for nematode indices or trophic groups (Figure 4.1and 4.2). Both PC1 and PC2
discriminated among the habitats using nematode indices and trophic group abundance
scores, respectively. However, the resolution of discrimination among the habitats
differed between the two plots. Nematode indices scores revealed that highly disturbed
habitats (croplands in muck and mineral soils) grouped on the lower left side of the plot
whereas undisturbed habitats (forests and shrubs) ordinated on the right side of both the
PC axes. Turfgrass lawns in mineral and muck soils and grassy borders showed an
intermediate position between the undisturbed and disturbed habitats (Figure 4.1).
Nematode trophic group abundance scores showed that most of the cropland locations
were observed on the right side of the PC1 and PC2 axes. Turfgrass lawns in mineral
soils ordinated on the left side of plot and turfgrass lawns in muck soils and shrublands
and forests are aligned on the lower negative side of the PC2. Grassy borders are
scattered but in general had an intermediary position along the two PC axes (Figure 4.2).
4.4. DISCUSSION
In the present study we used MANOVA to test the utility of the composite of
various nematode measures to compare different habitats representing a gradient of
anthropogenic disturbance. The nematode data showed that the croplands were
significantly different from all other habitats including forests, shrublands, turfgrass
lawns, and grassy borders. Turfgrass lawns were not significantly different from forests
89
but showed significant differences from shrublands. PCA analysis using composite of
various nematode indices revealed the relative relationship among the indices and the
contribution of the indices to habitat ordination.
We observed maximum contribution of MI, CI and EI for the differences between
the habitats in the PC1 while SI CI and EI significantly influenced PC2 axes. By
measuring the relative proportion of colonizers and persisters in the soil, the MI assesses
the impact of disturbance in any habitat (Bongers, 1990; Bongers and Bongers, 1998;
Neher, 1999). Greater abundance of high c-p value nematodes results in higher MI value,
which means higher maturity of the soil food web in a given habitat (Neher, 1999;
Porazinska et al., 1999; Yeates and Bongers, 1999). SI value provides information about
the levels of trophic links indicated by the abundance of high c-p value nematodes mainly
omnivores and predatory nematodes, while EI provides an indication of the response of
primary decomposers or enrichment opportunists like rhabditids towards the labile
sources of organic material (Ferris et al, 2001; Ferris and Matute, 2003). CI indicates
predominant decomposition channels in the soil food web (Ferris et al., 2001). We
observed that all the habitats had moderately enriched food webs with EI ranging from 69
to 78%. However, SI and MI showed maximum differences among the habitats: forests,
shrublands and turfgrass lawns in muck soils had high MI and SI while grassy borders
and turfgrass lawns in mineral soils had moderate and the croplands in both muck and
mineral soils had the lowest MI and SI values. MI has the highest weight in the first
component axis followed by EI and SI with moderate weights while PC2 was mainly
represented by SI. The PCA results also revealed that the croplands in both muck and
mineral soils lie on the negative side of the PC axes 1 and 2, suggesting low maturity,
90
structure and diversity but high enrichment conditions as expected in these habitats
(Neher et al., 2005). Turfgrass lawns in muck soils also had moderately enriched but
highly mature and structured food web compared to mineral soil turfgrass lawns in
mineral soil. Position of forests and shrublands on the first two PC axes suggests mature
and structured soil food webs that are moderately enriched. Increase in enrichment of the
soil may lead to decrease in the maturity of the system (Villenave et al., 2003). Relative
weights of the various indices as observed in the PCA analysis in our study might suggest
that highly structured and mature food webs might not have highly enriched food webs.
Since all the habitats showed enriched food webs in the present study, the opposite
relationship of SI and MI with EI cannot be clearly established. However, structure and
maturity of the system seems to be more prone to disturbances as indicated by the clear
differences of croplands from forests and shrublands. Our study also revealed that both
SI and MI are independent of the food web enrichment, at least at moderate to high levels
of enrichment conditions. Our results also indicate that SI and MI are more sensitive than
EI in detecting the differences among the habitats.
Forests did not show higher SI or MI compared with the shrublands. Our results
contrast with general observations of Ferris et al. (2001) that forest and shrublands are
considered to be poorly enriched and highly structured. We took soil samples at 15 cm
depth for nematode analysis in all habitats but this may not be sufficient to capture all the
nematodes in the lower layers of soil especially in the forests. In spite of this, forests
were at par with shrublands in terms of MI and both the habitats showed higher MI, SI
91
and diversity compared to all other habitats except for turfgrass lawns in muck soils. The
high level of enrichment of the food web in the unmanaged forests and shrublands may
be unique to the muck soils.
PPI is generally considered to be higher in the nutrient enriched conditions
because it is affected by the host conditions (Bongers et al., 1997). Several nematode
community indices are insensitive to the changes in the agroecosystem due to the fact that
plant parasitic nematodes, which represent a large portion of the total nematode
community, are not included in the calculation of community indices including SI, EI and
MI (Berkelmans et al., 2003). Although overall contribution of PPI is less as compared
to MI, SI, EI and CI in differentiating the habitats, PPI was the only index, that explained
the variations along the PC3 axis. Most of the plant-parasitic nematodes in our study
were ectoparasites, which are generally polyphagous (Cadet et al., 2005). For example,
Tylenchus and Filenchus are epidermal root hair feeders (Siddiqi, 1986; Yeates et al.,
1993). Therefore, results of our research suggest the importance of plant parasitic
nematodes, especially ectoparasites in determining the impact of human activities in
various habitats (Freckman and Ettema, 1993; Urzelai et al., 2000).
Ordination of habitats using both nematode indices and trophic group abundance
showed differences among the habitats however, resolution of discrimination differed
between the two approaches. Nematode indices scores arranged and grouped the habitats
much as we hypothesized along a gradient of anthropogenic disturbance. On the other
hand ordination of habitats based on the scores calculated for nematode trophic group
abundance showed different grouping of the habitats. Forests, shrublands and turfgrass
lawns in muck soils were grouped together and mineral turfgrass lawns placed on the left
92
side of the PC1 axis while croplands aligned on the right side of the plot. Total
abundance of bacterivores was lower in forests, shrublands, and turfgrass lawns in muck
soils because general opportunists (c-p 2 bacterivores) (mainly cephalobids) were not
found in higher numbers in these habitats compared to the croplands. However,
populations of enrichment opportunists (c-p 1 bacterivores) (mainly rhabditids) were
observed at levels comparable to the croplands. Therefore, enriched conditions in these
habitats resulted from the low abundance of c-p 2 bacterivores. Abundance of trophic
groups may not show an agreement with food web indices, because trophic groups are
further subdivided as functional guilds (indicating distinct food web conditions) in the
calculation of food web indices. Therefore, nematode c-p guilds may be a more useful
tool for habitat differentiation than total abundance of trophic groups. However, total
abundance of different trophic groups of nematodes addresses other ecological questions
such as effect of agricultural inputs (Neher, 1999, 2001; Bulluck et al., 2002; Yardim and
Edwards 1998; Nahar et al., 2005).
Using a combination of nematode indices in our study we were able to detect
differences between the habitats. PCA provided an exploratory approach to resolve the
differences among the habitats. Croplands were clearly different from the unmanaged
forests and shrublands and even from moderately managed turfgrass lawns and grassy
borders in the ordination plot. Turfgrass lawns and grassy borders also lay in the
intermediary position of the plot indicating medium level of disturbance on the
disturbance continuum. However, forests and shrublands do not follow a gradient as
expected in our hypothesis. Using multivariate approaches, we revealed the relationship
between various nematode indices and their relative importance in the differentiation of

93
habitats. Our study also highlighted the importance of nematode trophic groups and PPI
while comparing different habitats with varying degrees of human impact.
4.5. SUMMARY
Indicative value of nematode food web indices and trophic group abundance was
assessed for differentiating habitats in two soil types. Five habitats located in muck and
two in mineral soils were compared using trophic group abundance and composite of soil
nematode community indices by multivariate analysis. A total of 604 soil samples were
collected from croplands, grassy borders, turfgrass lawns, shrublands and forests in
Huron County, Ohio characterized by muck soils and a total of 242 soil samples were
collected from two habitats, turfgrass lawns and croplands in Wayne County, Ohio
characterized by mineral soils. Multiple locations were selected for collection of soil
samples for each habitat. Croplands represented intensively managed habitats whereas
forests and shrublands were considered unmanaged habitats. Turfgrass lawns in urban
landscapes and grassy borders alongside croplands represented intermediate levels of
management due to lack of tillage disturbance. All nematodes extracted from soil
samples were identified to genus level, categorized to trophic groups and various
nematode community indices were calculated. Multivariate analysis of variance revealed
that croplands were significantly different from forests, shrublands, turfgrass lawns and
grassy borders in the muck soils. Turfgrass lawns in muck soils were not different from
forests but were different from shrublands. No differences were observed between
forests and shrublands. Turfgrass lawns in mineral soils differed significantly from
croplands in the mineral soil. No differences were observed between the soil types when

94
nematode data from croplands and turfgrass lawns from each county were lumped
together. All habitats showed moderately enriched food webs as indicated by the mean
enrichment index (EI) values (69-78%) in all the habitats at both the locations. Forests,
shrublands and turfgrass lawns in muck soils had high maturity (MI) and structure index
(SI) whereas grassy borders and turfgrass lawns in mineral soils had intermediate and
croplands in both muck and mineral soils had the lowest MI and SI values. PCA analysis
indicated that MI and EI contributed the most to differences between habitats in the first
principal component (PC1) while SI and CI significantly influenced PC2. Forests and
shrublands had highly structured food webs as expected but their high enrichment may be
unique to the muck soils. Ordination of habitats using nematode indices revealed that
grassy borders and turfgrass lawns hold an intermediary position between undisturbed
habitats (forests and shrublands) and highly disturbed habitats (croplands). Although
overall contribution of plant-parasitic nematode index (PPI) was less compared to the
other indices, PPI explained the variation among the habitats in the PC3 axis. Ordination
of habitats using trophic group abundance may not show complete agreement with food
web indices, because trophic groups are further subdivided as functional guilds while
calculating food web indices.
4.6. REFERENCES
Berkelmans, R., Ferris, H., Tenuta, M., Bruggen, A.H.C. van, 2003. Effects of long-term
crop management on nematode trophic levels other than plant feeders disappear
after 1 year of disruptive soil management. Appl. Soil Ecol. 23, 223-235.
95
Bongers, T., 1990. The maturity index: an ecological measure of environmental
disturbance based on nematode species composition. Oecologica 83, 14-19.
Bongers, T., Bongers, M., 1998. Functional diversity of nematodes. Appl. Soil Ecol. 10,
239-251.
Bongers, T., Ferris, H., 1999. Nematode community structure as a bioindicator in
environmental monitoring. Trends Ecol. Evol. 14, 224-228.
Bongers, T., van der Meulen, H., Korthals, G., 1997. Inverse relationship between the
nematode maturity index and plant-parasitic index under enriched nutrient
conditions. Appl. Soil Ecol. 6, 195-99.
Bulluck III, L.R., Barker, K.R., Ristaino, J.B., 2002. Influences of organic and synthetic
soil fertility amendments on nematode trophic groups and community dynamics
under tomatoes. Appl. Soil Ecol. 21, 233-250.
Cadet, P., Masse, D., Thioulouse, J., 2005. Relationships between plant-parasitic
nematode community, fallow duration and soil factors in the Sudano-Sahelian
area of Senegal Agriculture, Habitats and Environment 108, 302-317.
Ernst, J.E. and Martin, N.H., 1994. Soil survey of Huron county, Ohio. USDA, Soil
Conservation Service. US Government Printing Office.
Ferris, H., Bongers, T., 2006. Nematode indicators of organic enrichment. J. Nematol.
38, 3-12.
Ferris, H., Bongers, T., de Geode, R.G.M., 2001. A framework for soil food web
diagnostics: extension of the nematode faunal analysis concept. Appl. Soil Ecol.
18, 13-29.

96
Ferris, H., Bongers, T., De Goede, R.G.M., 1999. Nematode faunal indicators of soil
food web condition. J. Nematol. 31, 534-535.
Ferris, H., Matute, M., 2003. Structural and functional succession in the nematode fauna
of a soil food web. Appl. Soil Ecol. 23, 93-110.
Ferris, H., Venette, R.C., Lau, S.S., 1996. Dynamics of nematode communities in
tomatoes grown in conventional and organic farming systems and their impact on
soil fertility. Appl. Soil Ecol. 3, 161-175.
Flegg, J.M., Hooper, D.J., 1970. Extraction of free-living stages from soil. In: Southey,
J.F. (Eds.), Laboratory methods for work with plant and soil nematodes. HMSO,
London, UK pp. 5-22.
Freckman, D.W., Ettema, C.H. 1993. Assessing nematode communities in
agroecosystems of varying human intervention. Agric. Ecosyst. Environ. 45, 239-
261.
Goodey, T., 1963. Soil and freshwater nematodes. Methuen and Co. Ltd., London, UK.
Grewal, P.S.,. Ehlers, R. U., Shapiro-Ilan, D.I. (Eds.). 2005. Nematodes As Biocontrol
Agents. CABI Publishing, CAB International, Oxon, U.K., pp. 1-505
Ingham, R.E., Trofymow, J.A., Ingham, E.R., Coleman, D.C., 1985. Interactions of
bacteria, fungi, and their nematode grazers: Effects on nutrient cycling and plant
growth. Ecol. Monogr. 55, 119-140.
Jairajpuri, S.M., Ahmad, W., 1992. Dorylaimida: Free-living, Predacious and Plant-
Parasitic Nematodes. E. J. Brill, Leiden, The Netherlands.

97
Kimpinski, J., Sturz, A.V., 1996. Population growth of a rhabditid nematode on plant
growth promoting bacteria from potato tubers and rhizosphere soil. J. Nematol.
28, 682-686.
Knox, O.G.G., Killham, K., Mullins, C.E., Wilson, M.J., 2003. Nematode-enhanced
microbial colonization of the wheat rhizosphere. FEMS Microbiol. Lett. 225, 227-
233.
Moore, J.C., de Ruiter, P.C., 1991. Temporal and spatial heterogeneity of trophic
interactions within below-ground food webs. Agric. Ecosyst. Environ. 34, 371-
397.
Nahar, M.S., Grewal, P.S., Miller, S. A., Stinner, D., Stinner, B.R., Kleinhenz, M.D.,
Wszelaki, A., Doohan, D., 2006. Differential effects of raw and composted
manure on nematode community, and its indicative value for soil microbial,
physical and chemical properties. App. Soil Ecol. 34, 140-151.
Neher, D.A., 1999. Nematode communities in organically and conventionally managed
agricultural soils. J. Nematol. 31, 142-154.
Neher, D.A., 2001. Role of nematodes in soil health and their use as indicators. J.
Nematol. 33, 161-168.
Neher, D.A., Olson, R.K., 1999. Nematode communities in soils of four farm cropping
management systems. Pedobiologia 43, 430-438.
Neher, D.A., Wub, J., Barbercheck, M.E., Anas, O., 2005. Ecosystem type affects
interpretation of soil nematode community measures. App Soil Ecol. 30, 47-64.
98
Nethi, S., Grewal, P.S., de Nardo, E.A., Stinner, B.R., 2002. Non-target effect of
entomopathogenic nematodes on soil nematode community. Appl. Soil Ecol. 39,
735-744.
Pielou, E. C., 1977. Mathematical Ecology. Wiley, New York.
Porazinska, D.L., Duncan, L.W., McSorley, R., Graham, J.H., 1999. Nematode
communities as indicators of status and processes of a soil ecosystem influenced
by agricultural management practices. Appl. Soil Ecol. 13, 69-86.
Ritz, K., Trudgill, D.L., 1999. Utility of nematode community analysis as an integrated
measure of the functional state of soils: perspectives and challenges. Plant Soil
212, 1-11.
SAS. 2003. SAS software version 9.1 (TS1M3) SAS Institute Inc., Cary, NC, USA.
Shepherd, A.M., 1970. Preparation of nematodes for electron microscopy. In: Southey
J.F. (ed) Laboratory methods for work with plant and soil nematodes, HMSO,
London, UK. pp. 88-95.
Siddiqi, M.R., 1986. Tylenchida: Parasites of plants and insects. CAB International,
Slough, UK.
Sims, G.K., Ellsworth, T.R., Mulvaney, R.L., 1995. Microscale determination of
inorganic nitrogen in water and soil extracts. Soil Science, Plant Analysis 26, 303-
316.
Sohlenius, B. 1990. Influence of cropping system and nitrogen input on soil fauna and
microorganisms in a Swedish arable soil. Biol. Fertil. Soils 9, 168-173.
99
Sohlenius, B., Boström, S., 1986. Short-term dynamics of nematode communities in
arable soil - Influence of nitrogen fertilization in barley crops. Pedobiologia 29,
183-191.
Sohlenius, B., Wasilewska, L., 1984. Influence of irrigation and fertilization on the
nematode community in a Swedish pine forest soil. J. Appl. Ecol. 21, 327-342.
Statistica, 2002. Stat Soft Inc., Tulsa, OK, USA.
Urzelai, A., Hernandez, A.J., Pastor, J., 2000. Biotic indices based on soil nematode
communities for assessing soil quality in terrestrial ecosystems. Sci. Total
Environ. 247, 253-261.
Villenave, C., Bongers, T., Ekschmitt, K., Fernandes, P., Oliver, R., 2003. Changes in
nematode communities after manuring in millet fields in Senegal. Nematol., 5,
351-358.
Yardim, E.N., Edwards, C.A., 1998. The effects of chemical pest, disease and weed
management practices on the trophic structure of nematode populations in tomato
agroecosystems. App. Soil Ecol. 7, 137-147.
Yeates, G.W., Wardle, D.A., 1996. Nematodes as predators and prey: Relationship to
biological control and soil processes. Pedobiologia 40, 43-50.
Yeates, G.W., Wardle, D.A., Watson, R.N., 1999. Response of soil nematode
populations, community structure, diversity and temporal variability to
agricultural infestation over a seven-year period. Soil Biol. Biochem. 31, 1721-
1733.
Yeates, G.W., 1979. Soil nematodes in terrestrial ecosystems. J. Nematol. 11, 213-229.

100
Yeates, G.W., Bongers, T., 1999. Nematode diversity in agroecosystems. Agric. Ecosys.
Environ. 74, 113-135.
Yeates, G.W., Bongers, T., De Goede, R.G.M., Freckman, D. W., Georgieva, S.S., 1993.
Feeding habits in soil nematode families and genera–an outline for soil ecologists.
J. Nematol. 25, 315-331.
Zimmerman, R.J., Cranshaw, W.S., 1990. Compatibility of entomogenous nematodes
(Rhabditida) in aqueous solutions of pesticides used in turfgrass maintenance. J.
Econ. Entomol. 83, 97-100.

*Grassy borders although do not receive direct fertilizer application, they may receive fertilizer nutrients due to runoff from the croplands.
OM
101
Table 4.1: Description of different habitats at Huron and Wayne Counties in Ohio.
County Soil type Habitats Annual disturbance
(%)
Soil pH
Insecticides Fertilizers Tillage
Huron Muck Croplands High High High 19.53 6.2
Muck Turfgrass lawns Low-medium Moderate-high None 10.00 6.9
Muck Grassy borders* Low None None 15.44 7.0
Muck Shrublands None None None 9.40 6.1
Muck Forests None None None 12.40 5.2
Wayne Mineral
Mineral Croplands High High High 2.20 6.3
Mineral Turfgrass lawns Moderate Low-high Moderate 5.20 6.3

Habitats and soil types
Croplands muck
Croplands mineral
Grassy borders muck
Turfgrass lawns muck
Turfgrass lawns mineral
Shrublands muck
Forests muck
Indices
MI 1.84 ± 0.02 1.93 ± 0.02 1.83 ± 0.03 2.09 ± 0.03 1.93 ± 0.02 2.33 ± 0.03 2.14 ± 0.03
PPI 2.02 ± 0.06 2.83 ± 0.02 2.68 ± 0.03 2.67 ± 0.02 2.62 ± 0.03 2.52 ± 0.02 2.44 ± 0.03
EI 71.57 ± 1.11 72.59 ± 1.08 78.88 ± 1.00 74.07 ± 1.05 69.51 ± 1.54 71.95 ± 1.07 72.22 ± 1.61
SI 33.95 ± 1.69 34.61 ± 1.68 48.55 ± 1.85 59.95 ± 1.63 45.11 ± 1.77 70.26 ± 1.37 61.55 ± 2.07
102 CI 21.81 ± 1.41 14.57 ± 1.19 9.20 ± 0.695 15.31 ± 1.15 9.37 ± 0.833 20.56 ± 1.68 17.03 ± 1.42
H’ 1.73 ± 0.03 1.49 ± 0.06 2.22 ± 0.03 2.30 ± 0.02 2.27 ± 0.02 2.20 ± 0.03 2.12 ± 0.03
Trophic gp.
Bacterivores 61.82 ± 4.53 67.67 ± 4.12 89.63 ± 7.90 44.76 ± 2.96 92.04 ± 8.43 38.17 ± 3.61 47.78 ± 5.41
Fungivores 26.07 ± 2.65 15.77 ± 1.14 15.87 ± 1.68 13.49 ± 1.01 18.21 ± 1.70 16.63 ± 3.15 13.67 ± 1.71
Omnivores 3.82 ± 0.27 4.82 ± 0.65 7.42 ± 0.51 10.76 ± 0.93 9.73 ± 0.69 15.80 ± 0.48 8.08 ± 0.58
Predatory 0.95 ± 0.13 2.52 ± 0.29 1.56 ± 0.24 1.69 ± 0.16 2.01 ± 0.24 1.62 ± 0.17 1.81 ± 0.27
Plant-parasitic 29.7 ± 3.40 47.69 ± 3.18 64.00 ± 5.89 92.50 ± 6.50 79.59 ± 7.39 83.03 ± 5.83 39.70 ± 3.34
Table 4.2: Mean (± SE) values of different nematode indices including maturity (MI), plant parasitic (PPI), enrichment (EI), structure (SI), channel (CI) and Shannon diversity indices (H’) and trophic groups abundances used in the multivariate analysis.

Habitat F df P Overall habitat effect 2.25 24, 120 0.002
Croplands vs. forests 4.29 6, 27 0.003
Croplands vs. shrublands 6.36 6, 27 0.0003
Croplands vs. grassy borders 4.08 6, 27 0.004
Croplands vs. turfgrass lawns 4.85 6, 27 0.001
Turfgrass lawns vs. shrublands 2.43 6, 27 0.005 103
Turfgrass lawns vs. forests 0.54 6, 27 0.77
Turfgrass lawns vs. grassy borders 0.33 6, 27 0.91
Forests vs. shrublands 1.15 6, 27 0.36
Table 4.3: Multivariate test (Pillai’s trace) based on different nematode indices including MI, PPI, EI, SI, CI and H’ comparing the habitats within muck soils.
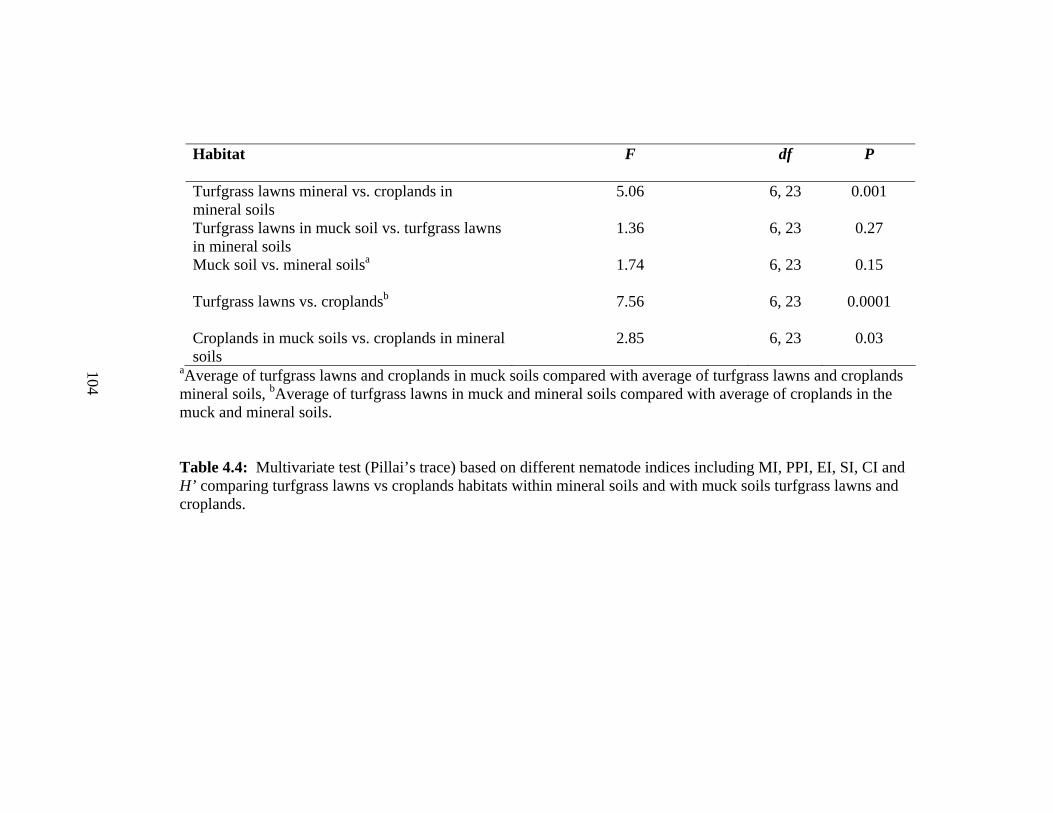
Habitat F df P
Turfgrass lawns mineral vs. croplands in mineral soils
5.06 6, 23 0.001
Turfgrass lawns in muck soil vs. turfgrass lawns in mineral soils
1.36 6, 23 0.27
Muck soil vs. mineral soilsa 1.74 6, 23 0.15
Turfgrass lawns vs. croplandsb 7.56 6, 23 0.0001
Croplands in muck soils vs. croplands in mineral soils
2.85 6, 23 0.03
aAverage of turfgrass lawns and croplands in muck soils compared with average of turfgrass lawns and croplands mineral soils, bAverage of turfgrass lawns in muck and mineral soils compared with average of croplands in the muck and mineral soils.
104
Table 4.4: Multivariate test (Pillai’s trace) based on different nematode indices including MI, PPI, EI, SI, CI and H’ comparing turfgrass lawns vs croplands habitats within mineral soils and with muck soils turfgrass lawns and croplands.
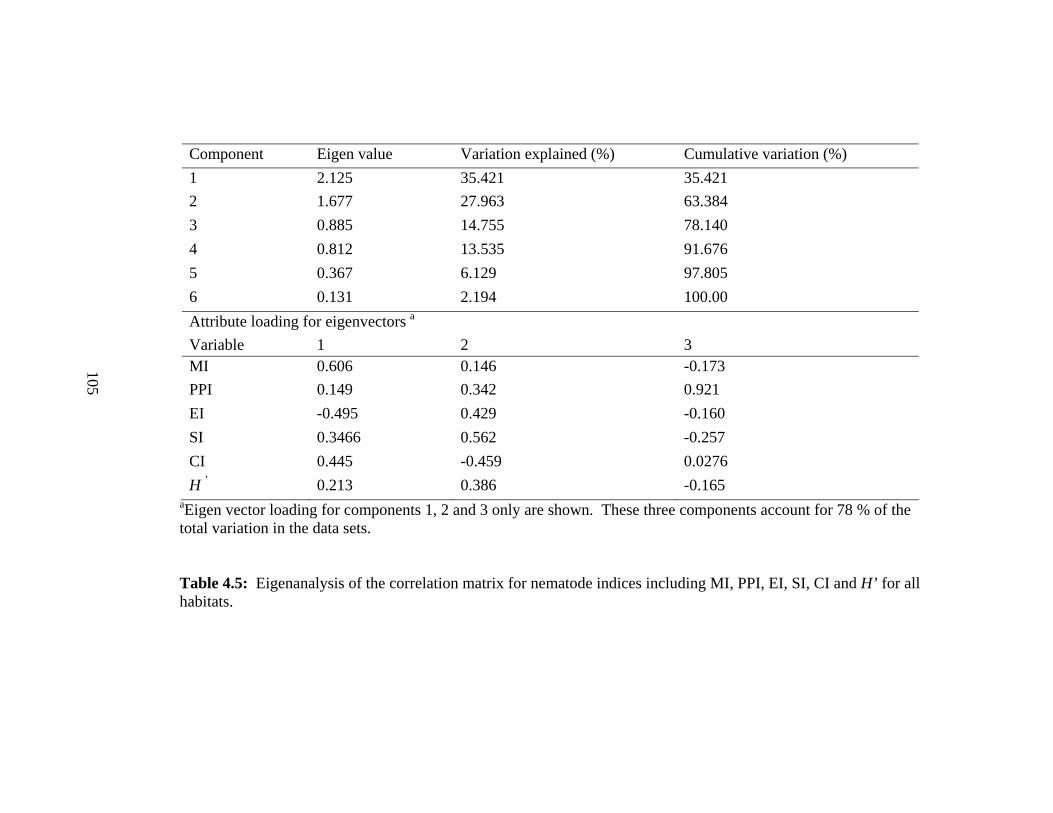
Component Eigen value Variation explained (%) Cumulative variation (%) 1 2.125 35.421 35.421 2 1.677 27.963 63.384 3 0.885 14.755 78.140 4 0.812 13.535 91.676 5 0.367 6.129 97.805 6 0.131 2.194 100.00 Attribute loading for eigenvectors a
Variable 1 2 3 MI 0.606 0.146 -0.173 105 PPI 0.149 0.342 0.921 EI -0.495 0.429 -0.160 SI 0.3466 0.562 -0.257 CI 0.445 -0.459 0.0276 H ’ 0.213 0.386 -0.165
aEigen vector loading for components 1, 2 and 3 only are shown. These three components account for 78 % of the total variation in the data sets. Table 4.5: Eigenanalysis of the correlation matrix for nematode indices including MI, PPI, EI, SI, CI and H’ for all habitats.

Component Eigen value Variation explained (%)
Cumulative variation (%)
1 1.985 39.711 39.711 2 1.276 25.522 65.233 3 0.816 16.335 81.569 4 0.465 9.311 90.880 5 0.455 9.119 100.000 Attribute loading for eigenvectors a
Variable 1 2 3 Bacterivores -0.437 0.548 0.101 Fungivores -0.422 0.572 -0.058 Omnivores -0.477 -0.371 -0.465 106 Predatory -0.361 -0.315 0.853 Plant-parasites -0.520 -0.366 -0.201
aEigen vector loading for components 1, 2 and 3 only are shown. These three components account for 78 % of the total variation in the data sets.
Table 4.6: Eigenanalysis of the correlation matrix for nematode trophic groups for all habitats.

Fig. 4.1: Principal components analysis of nematode indices in different habitats. The plot shows the distribution of the habitats on the first two principal components. Each point represents the mean score of a location within the habitat including muck soil croplands (■), mineral soil croplands (□), turfgrass lawns muck (▲), turfgrass lawns mineral (∆), grassy borders (▲), forests (♦) and shrublands (●).
107
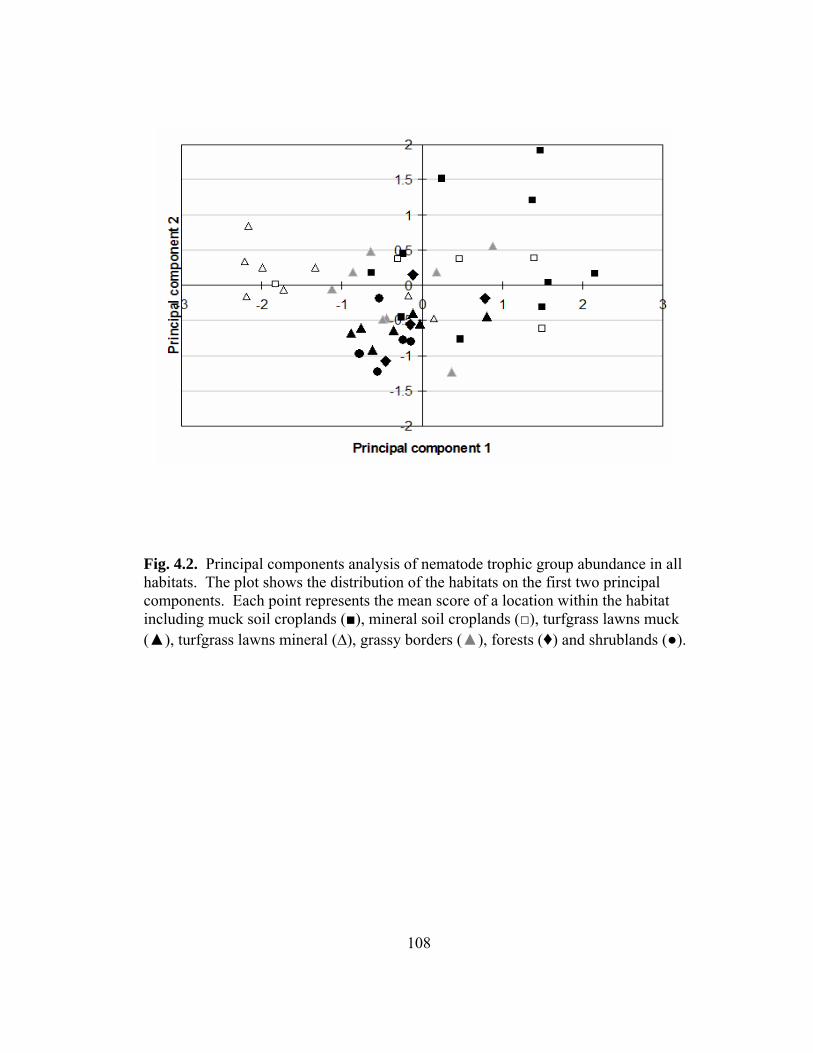
Fig. 4.2. Principal components analysis of nematode trophic group abundance in all habitats. The plot shows the distribution of the habitats on the first two principal components. Each point represents the mean score of a location within the habitat including muck soil croplands (■), mineral soil croplands (□), turfgrass lawns muck (▲), turfgrass lawns mineral (∆), grassy borders (▲), forests (♦) and shrublands (●).
108
CHAPTER 5
SYNTHESIS AND FUTURE DIRECTIONS
OVERALL SYNTHESIS
The results of this study supported my thesis of the value of using nematode
communities to quantify soil health. I focused mainly on understanding the effect of
different farming strategies transitioning from conventional to organic management on
nematode communities. Further, comparison of various habitats across a gradient of
anthropogenic impact also revealed the indicative value and relative contribution of
nematode community measures to habitat differences.
Application of composted manures increased the total abundance of bacterivore
nematodes in organic compared with conventional farming systems (Chapters 2 and 3).
Nematode faunal profile estimates showed that the food webs were highly enriched but
poorly structured in both organic and conventional farming systems. Even long-term
application of organic amendments failed to increase the structure index (SI) in
organically managed farms, probably due to the excessive tillage. Further, research
findings in chapter 4 showed that forests and shrublands had higher SI compared with the
managed croplands. Therefore, our research findings suggest that reduction in the
intensity of tillage in organic farming systems may produce more structured soil food
webs.
109
The research conducted also pointed out some of the problems associated with the
use of food web indices such as EI, SI and CI (Chapter 3). Calculations of food web
indices require numerator and denominator and therefore, increase in the value of an
index does not necessarily reflect that the numerator would be higher (Ferris and Matute,
2003). Application of organic amendments showed greater abundance of bacterivores
dominated by c-p 1 (enrichment opportunists) and c-p 2 (general opportunists) but EI was
not higher in the composted than the non-composted management strategies. Increase in
the abundance of general opportunists along with enrichment opportunist bacterivores in
the composted strategies reduced the overall level of EI. However, higher abundance of
c-p 2 bacterivores in the composted strategies may indicate some level of succession in
the soil food web (Ferris and Matute, 2003). Therefore, caution should be exercised
while interpreting the results based on values of EI alone. EI could be a suitable measure
of enrichment in the food web immediately after the application of external inputs but not
later.
Among the four different management transition strategies (high tunnels
vegetable, mixed species hay crop, tilled fallow and open field vegetables), high tunnels
in general had the highest total abundance of bacterivore and fungivore nematodes. The
average increase in soil temperature of 2-5 o C might have enhanced the decomposition
processes thereby making the soil food web biologically more active in high tunnels
compared with the other strategies. These findings suggested that even a marginal
manipulation of soil temperature could affect the soil biology as indicated by increase in
free-living nematodes and supported by measured soil characteristics.
110

STATUS OF PLANT PARASITIC NEMATODES IN SOIL FOOD WEBS
Free-living nematodes are found in larger numbers in the total soil nematode
community and most studies have relied only on the use of free-living nematodes in
understanding the biological functioning of soil processes (Cadet et. al., 2003). Bongers
(1990) developed an index of maturity (MI) by dividing nematode taxa into five groups
based on the c-p value of 1-5, each representing different life strategies and ecological
requirements, but the plant parasitic nematodes were excluded from the calculation of
MI. Bongers (1990) also developed an index based on plant parasitic taxa only, known
as plant parasitic index (PPI) analogous to MI and scaled 2-5 based on c-p values.
However, it was observed that MI and PPI showed an inverse relationship under nutrient
rich conditions (Bongers et al., 1997; Bongers and Kortahls 1995; Freckman and Ettema,
1993).
Yeates (1994) proposed another index of maturity including both plant parasites
and free-living nematodes known as combined maturity index (CMI). Some studies have
used CMI as an indicator of maturity. For example, Neher (1999) observed higher CMI in
organic farming systems compared to the conventional farming systems and claimed a
better maturity in organic farming systems.
In addition to other nematode community measures discussed above, Ferris et al.
(2001) developed enrichment (EI), structure (SI), and channel (CI) indices based on the
relative weighted abundance of nematode c-p guilds. Calculation of these indices is also
based strictly on free-living nematodes. Therefore, plant-parasitic nematodes have been
excluded from various community measures and may provide useful information that
would improve them.
111

Plant parasitic nematodes possess different feeding habits. They can be broadly
classified into two main categories: ectoparasites and endoparasites. Ectoparasites are
those that do not enter the host roots, while endoparasites feed in the roots. The two
groups of plant parasitic nematodes also appear to compete against each other. For
example, Brinkman et al. (2004) noted that high densities of endoparasitic nematodes
suppress the development of the ectoparasitic nematode Tylenchorynchus ventralis.
Cadet and Spaull (1985) observed that increase in abundance of the ectoparasitic
Helicotylenchus dihystera was associated with a reduction in the pathogenic impact of
other plant-parasitic nematodes. Since endoparasitic nematodes are considered as major
pests of host plants, it would be important to understand the relationship between
ectoparasitic and endoparasitic nematodes. I explored their relationship in my study.
Table 5.1 shows the list of plant-parasitic nematode genera observed in the
present study. Ectoparasitic nematodes were dominated by two genera, Tylenchus and
Filenchus, while the root lesion nematode Pratylenchus was the dominant migratory
endoparasite (Chapter 2, 3 and 4). Percentage of ectoparasites ranged from 20-44% in
the total number of nematodes, with the highest percentage in unmanaged habitats
including shrubs and forests followed by urban landscapes (turfgrass lawns) and the
lowest in vegetable crops (Figure 5.1). This clearly demonstrates that while calculating
various nematode indices a large portion of the nematode community is left out.
The endoparasitic nematode Pratylenchus crenatus was favored by corn followed
by soybeans and oats but not by hay. Cultivation of the host crop, corn, in the rotation
might have contributed to the build up of high levels of this endoparasitic nematode in
the soil (Chapter 2). However, ectoparasitic nematodes did not show any such response
112

in our study (Figures 5.2). This could be due to polyphagous nature of ectoparasites
(Cadet et al., 2005). Moreover Tylenchus and Filenchus were the dominant genera but
they are presumed to be algal feeders and weak phytoparasites (Yeates et. al., 1993).
Our research (Chapter 3) indicated that compost application might not have the
same effect on all the plant-parasitic nematode guilds especially when the biology and
host range of nematode guilds are contrasting (Zunke, 1990; Okada et al 2002;
Vestegard, 2004). The soil population of Pratylenchus crenatus was significantly lower
in the composted than the non-composted transition strategies, while that of the Pp2
guild, which mainly consisted of Tylenchus and Filenchus, was higher in the former
(Figure 5.3). Migratory endoparasites like Pratylenchus are considered harmful to the
host plant, as they cause cell death during feeding and migration through root tissue, and
also predispose the cortex to attack by other plant-pathogens (Zunke, 1990). On the other
hand ectoparasites like Tylenchus, Filenchus and Psilenchus primarily feed on root hairs
(Yeates et al., 1993) and fungi (Okada et al., 2002).
Correlation of c-p 2 plant-parasitic nematodes with MB-N further suggests that
they are functionally more active than other guilds (Chapter 3). Root hair feeders have
been shown to contribute significantly to the increase in microbial activity by eliciting
leakage of metabolites from the roots (Verschoor, 2002; Bardgett et al., 1999; Yeates et
al., 1999).
FUTURE DIRECTIONS
Although, the current research suggested that frequent tillage operations required
in the organic systems was the potential reason for the low SI, further research is needed
113

to test this hypothesis that a low tilled organic farming system would possibly have
higher abundance of omnivores and predatory nematodes resulting in high structured
food webs.
Compost suppressed the population of Pratylenchus sp. but favored ectoparasites
Tylenchus, Filenchus and Psilenchus. Further studies to determine the mechanism of
differential effects of compost on these plant-parasites can fill some of the major gaps in
our understanding of their biology and contribution to soil ecosystem function.
Correlation between c-p 2 plant-parasites and microbial activity indicated that this guild
of plant parasites is functionally important at least in our soil and climatic conditions.
However, our research was not aimed at quantifying the feeding habits of this group of
nematodes. Further research in this direction is required to ascertain their feeding habits
and enhancing our understanding of their role in soil biology. Studies to quantify the
relative contribution of the ectoparasites to nitrogen pools may also be considered.
REFERENCES
Bardgett, R.D., Cook, R., Yeates, G.W., Denton, C.S., 1999. The influence of nematodes
on below-ground processes in grassland ecosystems Plant and Soil 212, 23-33.
Bongers, T., 1990. The maturity index: an ecological measure of environmental
disturbance based on nematode species composition. Oecologica 83, 14-19.
Bongers, T., Korthals, G., 1995. The behavior of MI and PPI under enriched conditions.
Nematologica 41, 286.
114

Bongers, T., van der Meulen, H., Korthals, G., 1997. Inverse relationship between the
nematode maturity index and plant-parasitic index under enriched nutrient
conditions. Appl. Soil Ecol. 6, 195-99.
Brinkman, E.P., Johannes, A.V., Van der Putten, 2004. Endoparasitic nematodes reduce
multiplication of ectoparasitic nematodes, but do not prevent growth reduction of
Ammophila arenaria (L.) Link (marram grass) Appl. Soil Ecol. 27, 65-75.
Cadet, P., Masse, D., Thioulouse, J., 2005. Relationships between plant-parasitic
nematode community, fallow duration and soil factors in the Sudano-Sahelian
area of Senegal Agriculture, Habitats and Environment 108, 302-317.
Cadet, P., Pate, E., Thioulouse, J., 2003. Relationships of nematode communities to
human demographics and environment in agricultural fields and fallow lands in
Senegal Journal of Tropical Ecology 19, 279-290.
Cadet, P., Spaull, V.W., 1985. Studies on relationship between nematodes and sugarcane
in south and west Africa: Plant cane. Revue Nematol. 8, 131-142.
Ferris, H., Bongers, T., de Geode, R.G.M., 2001. A framework for soil food web
diagnostics: extension of the nematode faunal analysis concept. Appl. Soil Ecol.
18, 13-29.
Ferris, H., Matute, M., 2003. Structural and functional succession in the nematode fauna
of a soil food web. Appl. Soil Ecol. 23, 93-110.
Freckman, D.W., Ettema, C.H. 1993. Assessing nematode communities in
agroecosystems of varying human intervention. Agric. Ecosyst. Environ. 45, 239-
261.
115

Neher, D.A., Olson, R.K., 1999. Nematode communities in soils of four farm cropping
management systems. Pedobiologia 43, 430-438.
Okada, H., Tsukiboshi, T., Kadota, I., 2002. Mycetophagy in Filenchus misellus
(Andrassy, 1958) Lownsbery & Lownsbery, 1985 (Nematoda: Tylenchidae), with
notes on its morphology. Nematology 4, 795-801.
Verschoor, B.C., 2002. Carbon and nitrogen budgets of plant-feeding nematodes in
grasslands of different productivity App. Soil Ecol. 20,15-25.
Vestegard, M., 2004. Nematode assemblages in the rhizosphere of spring barley
(Hordeum vulgare L.) depended on fertilizations and plant growth phase.
Pedobiologia 48, 257-265.
Villenave, C., Cadet, P., 1998. Interactions of Helicotylenchus dihystera, Pratylenchus
sefaensis and Tylenchorhynchus gladiolatus on two plants from the Soudano-
Sahelian zone of West Africa. Nematropica 28, 31-39.
Yeates, G.W., 1994. Modification and qualification of the nematode maturity index.
Pedobiologia 38, 97-101.
Yeates, G.W., Wardle, D.A., Watson, R.N., 1999. Response of soil nematode
populations, community structure, diversity and temporal variability to
agricultural infestation over a seven-year period. Soil Biol. Biochem. 31, 1721-
1733.
116

Yeates, G.W., Bongers, T., De Goede, R.G.M., Freckman, D.W., Georgieva, S.S., 1993.
Feeding habits in soil nematode families and genera–an outline for soil ecologists.
J. Nematol. 25, 315-331.
Zunke, U., 1990. Observations on the invasion and endoparasitic behavior of the root
lesion nematode, Pratylenchus penetrans. J. Nematol. 22, 309-320.
117

adominant ectoparasites, bdominant endoparasite. C-p: colonizer persister
Genus C-p value Nature of feeding Family
Tylenchus a 2 Ectoparasites Tylenchidae
Filenchus a 2 Ectoparasites Tylenchidae
Boleodorus 2 Ectoparasites Tylenchidae
Psilenchus 2 Ectoparasites Psilenchidae
Tylenchorynchus 3 Ectoparasites Dolichodoridae
Criconemella 3 Ectoparasites Criconematidae
Paratylenchus 2 Ectoparasites Criconematidae
Trichodorus 4 Ectoparasites Trichodoridae
Longidorus 5 Ectoparasites Longidoridae
Xiphinema 5 Ectoparasites Longidoridae
Helicotylenchus 3 Ectoparasites Hoplolaimidae
Hoplolaimus 3 Ectoparasites Hoplolaimidae
Pratylenchus b 3 Endoparasite Pratylenchidae
Heterodera 3 Endoparasite Heteroderidae
Meloidogyne 3 Endoparasite Heteroderidae
Table 5.1: List of genera of plant-parasitic nematodes.
118

%age: --
Field crops
Endoparasites10%
Ectoparasites31%
Free-living59%
Shrub lands
Ectoparasites44%
Endoparasites8%
Free-living48%
Vegetable crops
Free-living93%
Ectoparasites6%
Endoparasites1%
Turf lawns
Ectoparasites41%
Free-living46%
Endoparasites13%
Grassy borders
Ectoparasites27%
Endoparasites10%
Free-living63%
Forest lands
Free-living64%
Ectoparasites33%
Endoparasites3%
Figure 5.1: Percent ectoparasites, free-living and endoparasites in total nematode community in different habitats
119

Crop
Corn Soybean Oats Hay
Ecto
para
site
pop
ulat
ion/
10 g
soi
l
0
20
40
60
80
Figure 5.2: Comparison of the abundance of ectoparasitic nematodes in corn, soybeans, oats and hay.
120
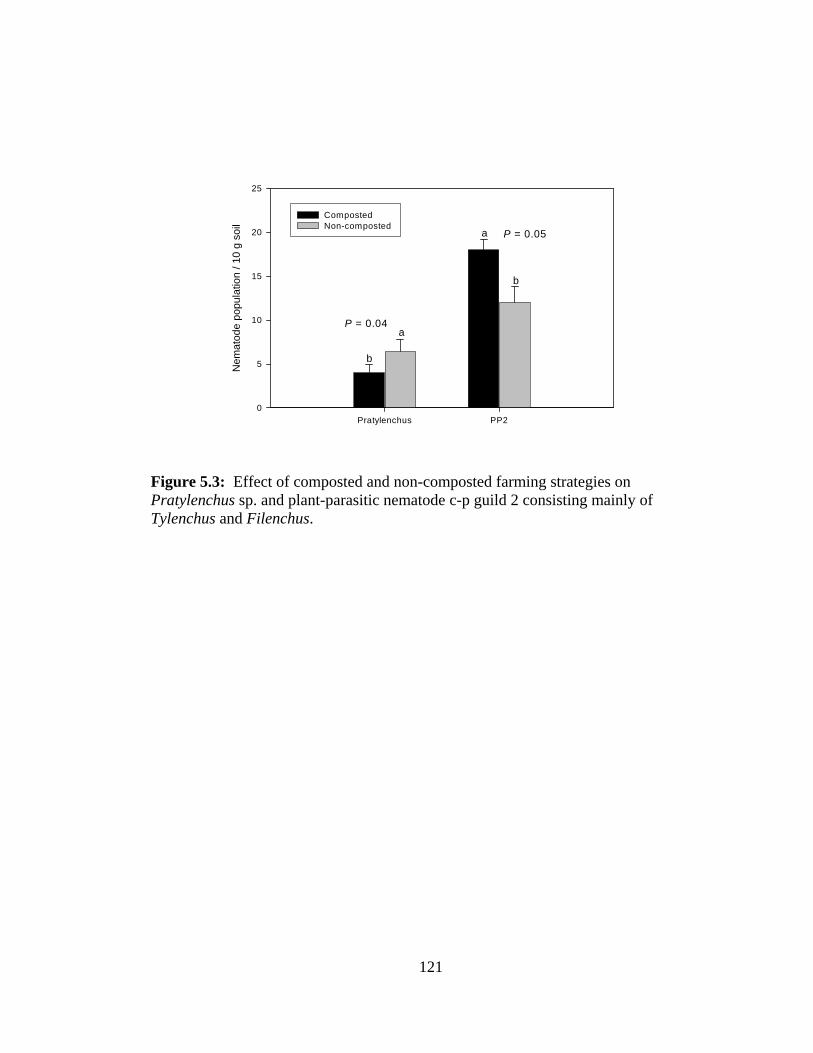
Pratylenchus PP2
Nem
atod
e po
pula
tion
/ 10
g so
il
0
5
10
15
20
25
Composted Non-composted
a
b
a
b
P = 0.04
P = 0.05
Figure 5.3: Effect of composted and non-composted farming strategies on Pratylenchus sp. and plant-parasitic nematode c-p guild 2 consisting mainly of Tylenchus and Filenchus.
121
BIBLIOGRAPHY
Abawi, G.S., Widmer, T.L. 2000. Impact of soil health management practices on soil borne pathogens, nematodes and root diseases of vegetable crops. Appl. Soil Ecol. 15, 37-47.
Alon, A., Steinberger, Y. 1999. Effect of nitrogen amendments on microbial biomass, above-ground biomass and nematode population in the Negev Desert soil. J Arid Environ. 41, 429-441.
Bakonyi, G., Nagy, P., 2000. Temperature- and moisture-induced changes in the structure of the nematode fauna of a semiarid grassland: patterns and mechanisms Global Change Biology 11, 697-707.
Bardgett, R. D., Cook, R., Yeates, G. W., Denton, C. S., 1999. The influence of nematodes on below-ground processes in grassland ecosystems Plant and Soil 212, 23-33.
Barker, K.R., Campbell, C.L., 1981. Sampling nematode populations. In: Zuckerman, B.M., Rhode R.A. (Eds.), Plant-parasitic Nematodes, Vol. III. Academic Press, New York, NY pp. 451-471.
Barker, K.R., Koenning, S.R., 1998. Developing sustainable systems for nematode management. Ann. Rev. Phytopathol. 36, 165-205.
Barker, K.R., Nusbaum, C.J., Nelson, L.J., 1969. Effects of storage temperature and extraction procedure on recovery of plant-parasitic nematodes from field soils. J. Nematol. 1, 240-247.
Berkelmans, R., Ferris, H., Tenuta, M., Bruggen, A.H.C. van, 2003. Effects of long-term crop management on nematode trophic levels other than plant feeders disappear after 1 year of disruptive soil management. Appl. Soil Ecol. 23, 223-235.
Bongers, T., 1990. The maturity index: an ecological measure of environmental disturbance based on nematode species composition. Oecologica 83, 14-19.
122

Bongers, T., Bongers, M., 1998. Functional diversity of nematodes. Appl. Soil Ecol. 10, 239-251.
Bongers, T., Ferris, H., 1999. Nematode community structure as a bioindicator in environmental monitoring. Trends Ecol. Evol. 14, 224-228.
Bongers, T., Korthals, G., 1995. The behavior of MI and PPI under enriched conditions. Nematologica 41, 286.
Bongers, T., van der Meulen, H., Korthals, G., 1997. Inverse relationship between the nematode maturity index and plant-parasitic index under enriched nutrient conditions. Appl. Soil Ecol. 6, 195-99.
Borken, W., Muhs, A., Beese, F., 2002. Changes in microbial and soil properties
following compost treatment of degraded forest soil. Soil Biol. Biochem. 34, 403-412.
Bouwman, L.A., Arts, W.B.M., 2000. Effects of soil compaction on the relationships
between nematodes, grass production and soil physical properties. Appl. Soil Ecol. 14, 213-222.
Brinkman, E. P., Johannes, A.V., Van der Putten, 2004. Endoparasitic nematodes reduce
multiplication of ectoparasitic nematodes, but do not prevent growth reduction of Ammophila arenaria (L.) Link (marram grass) Appl. Soil Ecol. 27, 65-75.
Brookes, P.C., Landman, A., Pruden, G., Jenkinson, D S., 1985. Chloroform fumigation
and the release of soil nitrogen: A rapid direct extraction method to measure microbial biomass nitrogen in soil. Soil Biol. Biochem. 17, 837-842.
Bulluck III, L.R., Barker, K.R., Ristaino, J.B., 2002a. Influences of organic and synthetic
soil fertility amendments on nematode trophic groups and community dynamics under tomatoes. Appl. Soil Ecol. 21, 233-250.
Bulluck III, L.R., Barker, K.R., Ristaino, J.B., 2002b. Influences of organic and synthetic
soil fertility amendments on nematode trophic groups and community dynamics under tomatoes. Appl. Soil Ecol. 21, 233-250.
Cadet, P., Masse, D., Thioulouse, J., 2005. Relationships between plant-parasitic
nematode community, fallow duration and soil factors in the Sudano-Sahelian area of Senegal Agriculture, Habitats and Environment 108, 302-317.
Cadet, P., Pate, E., Thioulouse, J., 2003. Relationships of nematode communities to
human demographics and environment in agricultural fields and fallow lands in Senegal Journal of Tropical Ecology 19, 279-290.
122

Cadet, P., Spaull, V.W., 1985. Studies on relationship between nematodes and sugarcane in South and West Africa: Plant cane, Revue Nematol. 8, 131-142.
Chen, J., Ferris, H., 1999. The effects of nematode grazing on nitrogen mineralization
during fungal decomposition of organic matter. Soil Biol. Biochem. 31, 1265-1279.
Clark, M.S., Ferris, H., Klonsky, K., Lanini, W.T., van Bruggen, A.H.C., Zalom, F.G.,
1998. Agronomic, economic, and environmental comparison of pest management in conventional and alternative tomato and corn systems in northern California. Agric. Ecosys. Environ. 68, 51-71.
Clark, M.S., Horwarth, W.R., Shennan, C., Scow, K.M., Lanini, W.T., Ferris, H., 1999.
Nitrogen, weeds and water as yield-limiting factors in conventional, low-input, and organic tomato systems. Agric. Ecosys. Environ. 73, 257-270.
Dalal, R.C., 1998. Soil microbial biomass–what do the numbers really mean? Aust. J.
Exp. Agric. 38, 649-665. Doran, J., 1995. Building soil quality. In: Proceedings of the 1995 Conservation
Workshop on Opportunities and Challenges in Sustainable Agriculture Red Deer, Alta., Canada, Alberta Conservation Tillage Society and Alberta Agriculture Conservation, Development Branch, pp. 151-154.
Drinkwater, L.E., Letourneau, D.K., Workneh, F., van Bruggen, A. H. C., Shennan, C.,
1995. Fundamental differences between conventional and organic tomato agroecosystems in California. Ecol. Appl. 1098-1112.
Ekschmitt, K., Bakonyi, G., Bongers, M., Bongers, T., Boström, S., Dogan, H., Harrison,
A., Kallimanis, A., Nagy, P., O´Donnell, A.G., Sohlenius, B., Stamou, G.P., Wolters, W., 1999. Effects of the nematode fauna on microbial energy and matter transformation rates in European grassland soils. Plant Soil 212, 45-61.
Ernst, J. E. and Martin, N. H., 1994. Soil survey of Huron county, Ohio. USDA, Soil
Conservation Service. US Government Printing Office. Ferris, H., 1993. New frontiers in nematode ecology. J. Nematol. 25, 374-382. Ferris, H., Bongers, T., 2006. Nematode indicators of organic enrichment. J. Nematol.
38, 3-12. Ferris, H., Bongers, T., de Geode, R.G.M., 2001. A framework for soil food web
diagnostics: extension of the nematode faunal analysis concept. Appl. Soil Ecol. 18, 13-29.
123
Ferris, H., Bongers, T., De Goede, R.G.M., 1999. Nematode faunal indicators of soil food web condition. J. Nematol. 31, 534-535.
Ferris, H., Matute, M., 2003. Structural and functional succession in the nematode fauna
of a soil food web. Appl. Soil Ecol. 23, 93-110. Ferris, H., Venette, R.C., Lau, S.S., 1996. Dynamics of nematode communities in
tomatoes grown in conventional and organic farming systems and their impact on soil fertility. Appl. Soil Ecol. 3, 161-175.
Ferris, H., Venette, R.C., Scow, K.M., 2004. Soil management to enhance bacterivore
and fungivore nematode populations and their nitrogen mineralization function. Appl. Soil Ecol. 24, 19-35.
Fiscus, D.A., Neher, D.A. 2002. Distinguishing sensitivity of free-living soil nematode
genera to physical and chemical disturbances. Ecol. Appl. 12, 565-575. Flegg, J.M., Hooper, D.J., 1970. Extraction of free-living stages from soil. In: Southey,
J.F. (Eds.), Laboratory methods for work with plant and soil nematodes. HMSO, London, UK pp. 5-22.
Freckman, D.W., 1988. Bacterivorous nematodes and organic-matter decomposition.
Agric. Ecosyst. Environ. 24, 195-217. Freckman, D.W., Ettema, C.H. 1993. Assessing nematode communities in
agroecosystems of varying human intervention. Agric. Ecosyst. Environ. 45, 239-261.
Friedel, J.K., Gabel, D., Stahr, K., 2001. Nitrogen pools and turnover in arable soils
under different durations of organic farming. II. Source- and sink-function of the soil microbial biomass or competition with growing plants? J. Plant Nutr. Soil Sci. 164, 421-429.
Fu, S., Coleman, D.C., Hendrix, P.F., Crossley, D.A. Jr., 2000. Responses of trophic
groups of soil nematodes to residue application under conventional tillage and no tillage regimes. Soil Biol. Biochem. 32, 1731-1741.
Goodey, T., 1963. Soil and freshwater nematodes. Methuen and Co. Ltd., London, UK. Grewal, P.S.,. Ehlers, R. U., Shapiro-Ilan, D.I. (Eds.). 2005. Nematodes As Biocontrol
Agents. CABI Publishing, CAB International, Oxon, U.K., pp. 1-505. Griffiths, B.S., 1994. Microbial-feeding nematodes and protozoa in soil: Their effects on
microbial activity and nitrogen mineralization in decomposing hotspots and the rhizosphere. Plant and Soil 164, 25-33.
124
Griffiths, B.S., Ritz, K., Wheatley, R.E., 1994. Nematodes as indicators of enhanced microbiological activity in a Scottish organic farming system. Soil Use Manage. 10, 20-24.
Gunapala, N., Scow, K.M., 1998. Dynamics of soil microbial biomass and activity in
conventional and organic farming systems. Soil Biol. Biochem. 30, 805-816. Hominick, B., 1999. Nematodes. In: Proceeding of the International Workshop Tropical
Soil Biology. Opportunities and challenges for African agriculture Nairobi, 16-19 March 1999 pp 17-22.
Ingham, R.E., Trofymow, J.A., Ingham, E.R., Coleman, D.C., 1985. Interactions of
bacteria, fungi, and their nematode grazers: Effects on nutrient cycling and plant growth. Ecol. Monogr. 55, 119-140.
Jairajpuri, S.M., Ahmad, W., 1992. Dorylaimida: Free-living, Predacious and Plant-
Parasitic Nematodes. E. J. Brill, Leiden, The Netherlands. Kimpinski, J., Sturz, A.V., 1996. Population growth of a rhabditid nematode on plant
growth promoting bacteria from potato tubers and rhizosphere soil. J. Nematol. 28, 682-686.
Knox, O.G.G., Killham, K., Mullins, C.E., Wilson, M.J., 2003. Nematode-enhanced
microbial colonization of the wheat rhizosphere. FEMS Microbiol. Lett. 225, 227-233.
Laakso, J., Setälä, H., Palojärvi, A., 2000. Influence of decomposer food web structure
and nitrogen availability on plant growth. Pl. Soil 225, 153-165. López-Fando, C., Bello, A., 1995. Variability in soil nematode populations due to tillage
and crop rotation in semi-arid mediterranean agrosystems. Soil Tillage Res. 36, 59-72.
Lundquist, E.J., Jackson, L.E., Scow, K.M., Hsu, C., 1999. Changes in microbial biomass and community composition, and soil carbon and nitrogen pools after incorporation of rye into three California agricultural soils. Soil Biol. Biochem. 31, 221-236.
McSorley, R., Frederick, J.J., 1999. Nematode population fluctuations during
decomposition of specific organic amendments. J. Nematol. 31, 37-44. Mian, I.M., Rodríguez-Kàbana, R., 1982. Soil amendments with oil cakes and chicken
litter for control of Meloidogyne arenaria. Nematropica 12, 215-220. Moore, J.C., de Ruiter, P.C., 1991. Temporal and spatial heterogeneity of trophic
interactions within below-ground food webs. Agric. Ecosyst. Environ. 34, 371-397.
125

Nahar, M.S., Grewal, P.S., Miller, S.A., Stinner, D., Stinner, B.R., Kleinhenz, M.D.,
Wszelaki, A., Doohan, D., 2006. Differential effects of raw and composted manure on nematode community, and its indicative value for soil microbial, physical and chemical properties. App. Soil Ecol. 34, 140-151.
Neher, D.A., 1999. Nematode communities in organically and conventionally managed
agricultural soils. J. Nematol. 31, 142-154. Neher, D.A., 2001. Role of nematodes in soil health and their use as indicators. J.
Nematol. 33, 161-168. Neher, D.A., Olson, R.K., 1999. Nematode communities in soils of four farm cropping
management systems. Pedobiologia 43, 430-438. Neher, D.A., Olson, R.K., 1999. Nematode communities in soils of four farm cropping
management systems. Pedobiologia 43, 430-438. Neher, D.A., Wub, J., Barbercheck, M.E., Anas, O., 2005. Ecosystem type affects
interpretation of soil nematode community measures. App Soil Ecol. 30, 47-64. Nethi, S., Grewal, P.S., de Nardo, E.A., Stinner, B.R., 2002. Non-target effect of
entomopathogenic nematodes on soil nematode community. Appl. Soil Ecol. 39, 735-744.
Okada, H., Tsukiboshi, T., Kadota, I., 2002. Mycetophagy in Filenchus misellus
(Andrassy, 1958) Lownsbery & Lownsbery, 1985 (Nematoda: Tylenchidae), with notes on its morphology. Nematology 4, 795-801.
Papatheodorou, E.M., Argyropoulou, M.D., Stamou, G.P., 2004. The effects of large-
and small-scale differences in soil temperature and moisture on bacterial functional diversity and the community of bacterivorous nematodes. App. Soil Ecol. 25, 37-49.
Parmelee, R.W., Alston, D.G., 1986. Nematode trophic structure in conventional and no
tillage agroecosystems. J. Nematol. 18, 403-407. Pielou, E.C., 1977. Mathematical Ecology. Wiley, New York. Platt, H.M., 1994. In The Phylogenetic Systematics of Free-living Nematodes, S.
Lorenzen, (Ed.) The Ray Society, London, pp 383. Porazinska, D.L., Duncan, L.W., McSorley, R., Graham, J.H., 1999. Nematode
communities as indicators of status and processes of a soil ecosystem influenced by agricultural management practices. Appl. Soil Ecol. 13, 69-86.
126

Poudel, D.D., Horwath, W.R., Mitchell, J.P., Temple, S.R., 2001. Impacts of farming systems on soil mineral nitrogen levels in irrigated processing tomatoes. Acta Hortic. 542, 321-333.
Powlson, D.S., Brookes, P.C., Christensen, B.T., 1987. Measurement of soil microbial
biomass provides an early indication of changes in total soil organic matter due to straw incorporation. Soil Biol. Biochem. 19, 159-164.
Ritz, K., Trudgill, D.L., 1999. Utility of nematode community analysis as an integrated
measure of the functional state of soils: perspectives and challenges. Plant Soil 212, 1-11.
Rodríguez-Kàbana, R., King, P.S., Pope, M.H., 1981. Combinations of anhydrous
ammonia and ethylene dibromide for control of nematodes parasitic of soybeans. Nematropica 11, 27-41.
Sarathchandra, S.U., Ghani, A., Yeates, G.W., Burch, G., Cox, N.R., 2001. Effect of
nitrogen and phosphate fertilizers on microbial and nematode diversity in pasture soils. Soil Biol. Biochem. 33, 953-964.
SAS. 2003. SAS software version 9.1 (TS1M3) SAS Institute Inc., Cary, NC, USA. Shepherd, A.M., 1970. Preparation of nematodes for electron microscopy. In: Southey
J.F. (ed) Laboratory methods for work with plant and soil nematodes, HMSO, London, UK. pp. 88-95.
Siddiqi, M.R., 1986. Tylenchida: Parasites of plants and insects. CAB International,
Slough, UK. Sims, G.K., Ellsworth, T.R., Mulvaney, R.L., 1995. Microscale determination of
inorganic nitrogen in water and soil extracts. Soil Science, Plant Analysis 26, 303-316.
Sohlenius, B. 1990. Influence of cropping system and nitrogen input on soil fauna and
microorganisms in a Swedish arable soil. Biol. Fertil. Soils 9, 168-173. Sohlenius, B., Boström, S., 1986. Short-term dynamics of nematode communities in
arable soil - Influence of nitrogen fertilization in barley crops. Pedobiologia 29, 183-191.
Sohlenius, B., Sandor, A., 1989. Ploughing of a perennial grass ley effect on the
nematode fauna. Pedobiologia 33, 199-210. Sohlenius, B., Wasilewska, L., 1984. Influence of irrigation and fertilization on the
nematode community in a Swedish pine forest soil. J. Appl. Ecol. 21, 327-342.
127

Statistica, 2002. Stat Soft Inc., Tulsa, OK, USA. Tu, Cong., Louws, F.J., Creamer, N.G., Mueller, J.P., Brownie, C., Fager, K., Bell, M.,
Hu, S., 2006. Responses of soil microbial biomass and N availability to transition strategies from conventional to organic farming systems. Agric. Ecos. Environ. 113, 206-215.
Urzelai, A., Hernandez, A.J., Pastor, J., 2000. Biotic indices based on soil nematode
communities for assessing soil quality in terrestrial ecosystems. Sci. Total Environ. 247, 253-261.
Verschoor, B.C., 2002. Carbon and nitrogen budgets of plant-feeding nematodes in
grasslands of different productivity App. Soil Ecol. 20,15-25. Vestegard, M., 2004. Nematode assemblages in the rhizosphere of spring barley
(Hordeum vulgare L.) depended on fertilizations and plant growth phase. Pedobiologia 48, 257-265.
Villenave, C., Bongers, T., Ekschmitt, K., Fernandes, P., Oliver, R., 2003. Changes in
nematode communities after manuring in millet fields in Senegal. Nematol., 5, 351-358.
Villenave, C., Cadet, P., 1998. Interactions of Helicotylenchus dihystera, Pratylenchus
sefaensis and Tylenchorhynchus gladiolatus on two plants from the Soudano-Sahelian zone of West Africa. Nematropica 28, 31-39.
Wallace, R.L., Ricci, C., Melone, G., 1996. A cladistic analysis of pseudocoelomate
(aschelminth) morphology. Invertebrate Biology 115, 104-112. Wang K.H., McSorley R., Marshall A.J, Gallaher R.N., 2004. Nematode community
changes associated with decomposition of Crotalaria juncea amendment in litterbags. Appl. Soil Ecol. 27, 31-45.
Wang, K.H., Sipes, B.S., Schmitt, D.P., 2001. Suppression of Rotylenchulus reniformis
by Crotalaria juncea, Brassica napus, and Tagetes erecta. Nematropica 31, 235-249.
Werner, M.R., 1997. Soil quality characteristics during conversion to organic orchard
management. Appl. Soil Ecol. 5, 151-167. Wright, D.J., 1998. Respiratory physiology, nitrogen excretion and osmotic and ionic
regulation. In: Perry, R.N., Wright, D.J. (Eds.), The Physiology and Biochemistry of Free-living and Plant-parasitic Nematodes. CAB International, Wallingford, Oxon, pp. 103-131.
128
Yardim, E.N., Edwards, C.A., 1998. The effects of chemical pest, disease and weed management practices on the trophic structure of nematode populations in tomato agroecosystems. App. Soil Ecol. 7, 137-147.
Yeates, G.W., 1979. Soil nematodes in terrestrial ecosystems. J. Nematol. 11, 213-229. Yeates, G.W., 1994. Modification and qualification of the nematode maturity index.
Pedobiologia 38, 97-101. Yeates, G.W., Bongers, T., 1999. Nematode diversity in agroecosystems. Agric. Ecosys.
Environ. 74, 113-135. Yeates, G.W., Bongers, T., De Goede, R.G.M., Freckman, D. W., Georgieva, S.S., 1993.
Feeding habits in soil nematode families and genera–an outline for soil ecologists. J. Nematol. 25, 315-331.
Yeates, G.W., Wardle, D.A., 1996. Nematodes as predators and prey: Relationship to
biological control and soil processes. Pedobiologia 40, 43-50. Yeates, G.W., Wardle, D.A., Watson, R.N., 1999. Response of soil nematode
populations, community structure, diversity and temporal variability to agricultural infestation over a seven-year period. Soil Biol. Biochem. 31, 1721-1733.
Zimmerman, R.J., Cranshaw, W.S., 1990. Compatibility of entomogenous nematodes
(Rhabditida) in aqueous solutions of pesticides used in turfgrass maintenance. J. Econ. Entomol. 83, 97-100.
Zunke, U., 1990. Observations on the invasion and endoparasitic behavior of the root
lesion nematode, Pratylenchus penetrans. J. Nematol. 22, 309-320.
129
Copyright © 2022 FDOKUMEN