Gastro-Intestinal Nematodes in Ontario sheep flocks
272
Gastro-Intestinal Nematodes in Ontario sheep flocks: An Epidemiological Study of Overwintering and Anthelmintic Resistance by Laura Cristina Falzon A Thesis Presented to The University of Guelph In partial fulfillment of requirements for the degree of Doctor of Philosophy in Population Medicine Guelph, Ontario, Canada © Laura Cristina Falzon, December 2012
-
Upload
khangminh22 -
Category
Documents
-
view
3 -
download
0
Transcript of Gastro-Intestinal Nematodes in Ontario sheep flocks
Gastro-Intestinal Nematodes in Ontario sheep flocks: An Epidemiological
Study of Overwintering and Anthelmintic Resistance
by
Laura Cristina Falzon
A Thesis
Presented to
The University of Guelph
In partial fulfillment of requirements
for the degree of
Doctor of Philosophy
in
Population Medicine
Guelph, Ontario, Canada
© Laura Cristina Falzon, December 2012
ABSTRACT
GASTRO-INTESTINAL NEMATODES IN ONTARIO SHEEP FLOCKS:
AN EPIDEMIOLOGICAL STUDY OF OVERWINTERING AND ANTHELMINTIC
RESISTANCE
Laura Cristina Falzon Co-advisors:
University of Guelph, 2012 Dr. Paula Menzies
XXXXXX Dr. Andria Jones-Bitton
This thesis was conducted to evaluate important epidemiological features of Gastro-
Intestinal Nematode (GIN) infections in Ontario sheep flocks; namely, the PeriParturient
Egg Rise (PPER), overwintering of GIN free-living stages on pasture, and Anthelmintic
Resistance (AR). Three main studies were carried out: a longitudinal study was
conducted on six sheep farms to evaluate the PPER in ewes lambing in different seasons
and to determine whether total plasma protein (TPP) levels and packed cell volume
(PCV) were associated with increased fecal GIN-egg shedding. Secondly, a pilot-study
was conducted on three farms to describe pasture-level environmental conditions and
over-wintering survival and infectivity of free-living GIN larvae, especially Haemonchus
contortus. Lastly, a cross-sectional study was conducted on 47 sheep farms in Ontario, to
evaluate the frequency of AR, compare different diagnostic tests for AR, and evaluate
management practices associated with AR. In the longitudinal study, the PPER was
observed in winter, spring and autumn lambing ewes, though the magnitude and
distribution of the PPER varied with season. Lower TPP and PCV values were associated
with increased fecal GIN-egg counts. The pilot-study suggested that H. contortus larvae
did not overwinter successfully on pasture, while other GINs, such as Teladorsagia sp.,
Trichostrongylus spp. and Nematodirus spp., were able to overwinter on pasture, and
were infective the following spring. Resistance to ivermectin, fenbendazole and
levamisole was demonstrated on 97% (28/29), 95% (19/20) and 6% (1/17) respectively of
the farms tested; most of the resistance observed was found in Haemonchus sp. The Fecal
Egg Count Reduction percentage following treatment was influenced by which mean (i.e.
arithmetic vs. geometric) was used in the formula; use of pre-treatment in addition to
post-treatment faecal egg counts was not influential. Both the fecal egg count reduction
test and the larval development assay diagnosed resistance, but there was poor agreement
between the two tests, as indicated by the Kappa test. The prior use of benzimidazoles on
farms was associated with higher levels of fenbendazole resistance. The information
generated in this thesis will be used to develop a parasite control program for sheep
flocks in Ontario and to guide future research on GIN parasitism.

iv
ACKNOWLEDGEMENTS
People often laugh when I tell them that, when I first found out I was coming to
Guelph, I looked at a world map and drew a horizontal line across Canada. I saw that
Guelph was at the same level as the south of France, and thought to myself “Oh, then it
can’t be too bad!” Little did I know then about the lake effect and snow squalls, though
Paula explained it very clearly and exhaustively on my first day here! Yet, even less did I
know then that my experience in this distant land of snow and polar bears (or so I
thought!) was going to surpass all of my expectations and enrich my life, both through
the lessons learnt and, more importantly, through every encounter made along the way.
“Every time I asked a question, that magnificent teacher, instead of giving the answer,
showed me how to find it. She taught me to organize my thoughts, to do research, to read
and listen, to seek alternatives, to resolve old problems with new solutions, to argue
logically.”
Isabelle Allende
I would like to start by thanking my Advisory Committee – it has been an extreme
privilege and honour working with each one of you. Thank you to Paula for listening to
my song, and for your boundless passion and staunch dedication to the small ruminant
industry. Thank you to Andria, for believing in me, and for infusing me with enthusiasm
for epidemiology. A special thank you to Andrew, for all the time spent with me in lab
meetings, journal clubs and lectures; for your encouraging notes and for painstakingly
going through everything I write, and helping me improve; you are a true teaching
inspiration. Thank you to John, for being constantly present despite the distance, and for

v
always offering insightful comments and support. And thank you to Jocelyn, for all the
practical insights and friendly conversations!
This research work would not have been possible without the contribution of two
great men – Krishna and Jacob. Your life-story is an inspiration to me, and you have
taught me a lot. Some of my fondest memories in Guelph will be of us three bumbling
along some dusty road in our mighty truck, singing “O tara, tara”, with the smell of warm
butter chicken wafting in the air!
I was lucky to have the help of fabulous summer students. In the first year, Katie
kept us cheerful with her infectious laughter and burbling enthusiasm while in the second
year, Kirstie came along, my Hillside companion and true friend; with the other members
of the “Poop Group” Lee and Hasani, we shared several funny moments!
Thank you to Brad, for being my partner-in-crime, and to Shannon, for sharing all
the joys and woes of farm visits! And a special thank you to all the sheep producers that
participated in the research work – not only did you make this research possible, but very
often you opened your homes and hearts to us, and reminded me how lucky I am to do
what I do!
“... I am part of a large family... and it’s enough for me...”
Great Lake Swimmers
Coming to school every morning has always felt like coming home. Thank you to
Cate for keeping the department such a friendly and warm place. Thank you to all the
lovely ladies that work in the main office; everyday brings a smile to my face as I call

vi
“Buenos días” to Karla before checking in on Julie’s latest pictures; then, I discuss
Halloween costumes or the coffee club with Sally before chatting to Linda about the
weather. Thank you to William for all our random conversations, sometimes about
statistics, but often hitting a complete tangent, and discussing the latest “Big Bang
Theory” episode, or listening to his constant pun about Andrew and myself writing the
“Peregrine-Falcon” paper... I’m afraid it hasn’t happened yet!
“... true friendship withstands time, distance, and silence...”
Isabelle Allende
On one of my first days here, Andria told me that during her graduate program,
the most valuable lessons often came from discussions with her class-mates, and she
encouraged me to make the most of my time here. I took heed of her advice, and over the
years I have met several remarkable people that I know will go on to make this world a
better place, and I am honoured to have shared part of this journey with them. In the first
year, I was blessed to meet Natalia, my mentor and cherished friend; Brian, and his
parents Bart and Nancy, my first Canadian friends; Claire, a fellow traveller and dreamer;
Steve, a constantly cheerful companion; and Raf, my international buddy! The second
year had many pleasant surprises in store: Nate, my sunshine; Evan, my confidante;
Tyler, my challenge; Jess, my Green Committee zealot; Julie, my wacky knitting friend
and introduction to CBC radio; Marianne and her famous waffles; Laura Pieper, my
fellow choir singer; and Bimal, my teacher. By the third year, I thought I had exhausted
all my friendship tokens, but apparently still had a few bonus points left: Dan, my

vii
friendly neighbour; Chris, my lunch mate; and Mike, a musical muse and trusted friend.
A special mention goes to Janet and Nuria, for their constant presence and support.
“... the world was an imperfect place – but within that vale of tears there were many sites
and times of quietude and contentment...”
Alexander McCall Smith
My experience in Guelph has been enriched by the many people I met outside of
school. Thank you to all my knitting friends, especially Paula and Andy – there is nothing
quite as exquisite as sitting with friends, drinking tea and knitting! Thank you to all my
fellow choir mates, especially Erica, for all our interesting conversations and for singing
Handel’s “Messiah” with me! Thank you to all the friends met while hiking many of the
beautiful trails in Ontario, and especially to Sue for her tireless chatter on trees, flowers
and birds! And thank you to all the vendors at the Guelph farmer’s market, especially
Kosta – your cinnamon buns are my week’s highlight!
“... for families who delight in being together...”
Anonymous
I thank all my friends back home; the two-legged (Claire, Maria, Chris and
Rodianne) and the four-legged (bouncy Patch and donkey Zepp, our family emblem!) –
in your own way, you each have helped me keep my sanity! Thank you to Kevin, my
brother and best-friend, for giving me an opportunity to see and experience many
different parts of Canada. And, most importantly, thank you to my parents. Despite the
geographical distance, you have been constantly present; you rejoiced in my conquests,

viii
and consoled me in my failures. You are my strength, motivation and inspiration; my
fortune, and my blessing. You are the reason I am who I am, and do what I do, and I love
you very much.

ix
This thesis is dedicated to the memory of Brother Louis Camilleri, whose strength, zeal,
and encouraging words are never forgotten.
x
TABLE OF CONTENTS
LIST OF TABLES ........................................................................................................... xvi
LIST OF FIGURES ......................................................................................................... xix
CHAPTER 1 ....................................................................................................................... 1
Introduction and Objectives ......................................................................................... 1
1.1 The sheep industry in Canada ................................................................................ 1
1.2 Gastro-intestinal nematodes .................................................................................. 2
1.2.1 Life cycle of gastro-intestinal nematodes ....................................................... 3
1.2.2 Haemonchus contortus .................................................................................... 4
1.2.3 Teladorsagia circumcincta .............................................................................. 5
1.2.4 Trichostrongylus spp. ...................................................................................... 6
1.2.5 Clinical signs ................................................................................................... 6
1.2.6 Hypobiosis ...................................................................................................... 7
1.2.7 Periparturient Egg Rise ................................................................................... 8
1.2.8 Overwintering on pasture .............................................................................. 10
1.3 Anthelmintics and anthelmintic resistance .......................................................... 11
1.3.1 Anthelmintic resistance ................................................................................. 13
1.3.1.1 Mode of inheritance and number of genes involved .............................. 15
1.3.1.2 Parasite biology and epidemiology ........................................................ 16
1.3.1.3 Selection pressure for resistance ............................................................ 17
1.4 Tests for determining anthelmintic resistance ..................................................... 22
1.4.1 Fecal Egg Count Reduction Test .................................................................. 22
1.4.2 Larval Development Assay ........................................................................... 24
1.5 Thesis objectives.................................................................................................. 26
1.6 References ........................................................................................................... 28
CHAPTER TWO .............................................................................................................. 41
A longitudinal study on the effect of lambing season on the periparturient egg rise in
Ontario sheep flocks ...................................................................................................... 41
Abstract ...................................................................................................................... 41
2.1 Introduction ......................................................................................................... 42
2.2 Materials and methods ......................................................................................... 45
xi
2.2.1 Number and selection of sheep farms ........................................................... 45
2.2 Study design ..................................................................................................... 46
2.2.3 Animal selection ........................................................................................... 47
2.2.4 Data collection .............................................................................................. 47
2.2.5 Laboratory methods ...................................................................................... 49
2.2.6 Data entry and management.......................................................................... 49
2.2.7 Data analysis ................................................................................................. 50
2.3 Results ................................................................................................................. 53
2.3.1 Study population ........................................................................................... 53
2.3.2 Fecal egg counts ............................................................................................ 53
2.3.3 Packed cell volume and total plasma protein ................................................ 54
2.3.4 Final lnFEC model ........................................................................................ 54
2.3.5 Final TPP model ........................................................................................... 55
2.3.6 Final PCV model........................................................................................... 56
2.4 Discussion and conclusions ................................................................................. 57
2.4.1. Final lnFEC model ....................................................................................... 57
2.4.2 Final TPP model ........................................................................................... 60
2.4.3 Final PCV model........................................................................................... 62
2.4.4 Study limitations ........................................................................................... 63
2.4.5 Conclusion .................................................................................................... 65
2.5 Acknowledgements ............................................................................................. 65
2.6 References ........................................................................................................... 67
CHAPTER 3 ..................................................................................................................... 81
Pilot project to investigate over-wintering of free-living gastrointestinal nematode
larvae of sheep, in Ontario, Canada .............................................................................. 81
Abstract ...................................................................................................................... 81
3.1 Introduction ......................................................................................................... 82
3.2 Materials and methods ......................................................................................... 84
3.2.1 Farm selection ............................................................................................... 84
3.2.2 Environmental data ....................................................................................... 85
3.2.3 Sampling of herbage and soil ........................................................................ 86
xii
3.2.4 Tracer lambs.................................................................................................. 86
3.2.5 Laboratory methods ...................................................................................... 88
3.2.6 Statistical analysis ......................................................................................... 89
3.3 Results ................................................................................................................. 90
3.3.1 Farm description ........................................................................................... 90
3.3.2 Environmental data ....................................................................................... 90
3.3.3 Herbage and soil samples.............................................................................. 92
3.3.4 Tracer lambs.................................................................................................. 93
3.4 Discussion ............................................................................................................ 93
3.4.1 Environmental factors ................................................................................... 93
3.4.2 Herbage and soil samples.............................................................................. 96
3.4.3 Tracer lambs.................................................................................................. 98
3.4.4 Study limitations and future research ......................................................... 100
3.5 Conclusion ......................................................................................................... 101
3.6 Acknowledgements ........................................................................................... 102
3.7 References ......................................................................................................... 103
CHAPTER 4 ................................................................................................................... 111
Anthelmintic resistance in sheep flocks in Ontario, Canada ....................................... 111
Abstract .................................................................................................................... 111
4.1 Introduction ....................................................................................................... 112
4.2 Materials and Methods ...................................................................................... 115
4.2.1. Number and selection of sheep farms ........................................................ 115
4.2.2. Farm monitoring ........................................................................................ 117
4.2.3. Ivermectin drench check ............................................................................ 118
4.2.4 Fecal Egg Count Reduction Test ................................................................ 119
4.2.5 Laboratory analysis ..................................................................................... 120
4.2.6 Larval culture of post-treatment fecal samples ........................................... 121
4.2.7 Larval Development Assay ......................................................................... 122
4.2.8 Descriptive statistics ................................................................................... 123
4.2.8.1 Fecal Egg Count Reduction.................................................................. 123
4.2.8.2 Genera-specific Reduction ................................................................... 123
xiii
4.2.8.3 Larval Development Assay .................................................................. 124
4.3. Results .............................................................................................................. 125
4.3.1 Study population ......................................................................................... 125
4.3.2 Farm monitoring ......................................................................................... 125
4.3.3 Ivermectin drench check ............................................................................. 126
4.3.4 Fecal Egg Count Reduction Test ................................................................ 126
4.3.5 Larval culture results................................................................................... 127
4.3.6 Larval Development Assay ......................................................................... 128
4.4. Discussion ......................................................................................................... 130
4.4.1 Fecal monitoring and ivermectin drench check .......................................... 130
4.4.2 Fecal Egg Count Reduction Test ................................................................ 131
4.4.3 Larval cultures of post-treatment fecal samples ......................................... 133
4.4.4 Larval development assay ........................................................................... 134
4.4.5 Study limitations ......................................................................................... 135
4.5 Conclusion ......................................................................................................... 138
4.6 Acknowledgements ........................................................................................... 139
4.7 References ......................................................................................................... 140
CHAPTER 5 ................................................................................................................... 153
Comparison of tests and methods used for the determination of anthelmintic resistance
in sheep ........................................................................................................................ 153
Abstract .................................................................................................................... 153
5.1 Introduction ....................................................................................................... 154
5.2 Materials and methods ....................................................................................... 157
5.2.1 Farm selection, Fecal Egg Count Reduction Test and Larval Development
Assay .................................................................................................................... 157
5.2.2 Fecal Egg Count Reduction calculations .................................................... 158
5.2.3 Comparison of data from Fecal Egg Count Reduction Calculation methods
.............................................................................................................................. 160
5.2.4 Comparison of Larval Development Assay and Fecal Egg Count Reduction
Test results ........................................................................................................... 161
5.3 Results ............................................................................................................... 163
5.3.1 Descriptive results of different FECR calculation methods ....................... 163
xiv
5.3.2 Comparison of different FECR calculation methods .................................. 165
5.3.3 Comparison of the Larval Development Assay and Fecal Egg Count
Reduction Test results .......................................................................................... 166
5.3.3.1. Categorization of the LDA and FECRT results .................................. 166
5.3.3.2 Kappa agreement .................................................................................. 167
5.4 Discussion .......................................................................................................... 168
5.4.1 Different Fecal Egg Count Reduction calculation methods ....................... 168
5.4.2 Comparison of different Fecal Egg Count Reduction Calculation methods170
5.4.3 Comparison of the Larval Development Assay and Fecal Egg Count
Reduction Test ..................................................................................................... 172
5.4.4 Overall study strengths and limitations, and future research ...................... 176
5.5 Conclusion ......................................................................................................... 177
5.6 Acknowledgements ........................................................................................... 178
5.7 References ......................................................................................................... 179
CHAPTER 6 ................................................................................................................... 193
A survey of farm management practices and their associations with anthelmintic
resistance in sheep flocks in Ontario, Canada ............................................................. 193
Abstract .................................................................................................................... 193
6.1 Introduction ....................................................................................................... 194
6.2 Materials and methods ....................................................................................... 196
6.2.1 Farm selection ............................................................................................. 196
6.2.2 Farm-level questionnaire ............................................................................ 197
6.2.3 Data management and statistical analyses .................................................. 198
6.3 Results ............................................................................................................... 200
6.3.1 Descriptive statistics ................................................................................... 200
6.3.1.1 Farm demographics .............................................................................. 200
6.3.1.2 Use of anthelmintics ............................................................................. 201
6.3.1.3 Quarantine strategies for new animal introductions ............................. 203
6.3.1.4 Pasture management and alternative (non-anthelmintic) strategies for
parasite control ................................................................................................. 204
6.3.1.5 Manure disposal ................................................................................... 205
6.3.1.6 Suspicion of anthelmintic resistance .................................................... 205

xv
6.3.2 Analytical statistics ..................................................................................... 206
6.3.2.1 Ivermectin Fecal Egg Count Reduction ............................................... 206
6.3.2.2 Fenbendazole Fecal Egg Count Reduction .......................................... 207
6.3.3.3 Levamisole Fecal Egg Count Reduction .............................................. 208
6.4 Discussion .......................................................................................................... 208
6.4.1 Descriptive statistics ................................................................................... 208
6.4.2 Ivermectin and Fenbendazole reduction in the Fecal Egg Count Reduction
Test ....................................................................................................................... 212
6.4.3 Study limitations and future research ......................................................... 213
6.5 Conclusion ......................................................................................................... 214
6.6 Acknowledgements ........................................................................................... 215
6.7 References ......................................................................................................... 216
CHAPTER 7 ................................................................................................................... 222
General discussion, study limitations and recommendations for future research ....... 222
7.1 References ......................................................................................................... 238
APPENDIX I .................................................................................................................. 241
Visit Schedule: Over-wintering in Ewes Study........................................................... 241
APPENDIX II ............................................................................................................. 243
Visit Information Form: Over-wintering in Ewes study ............................................. 243
APPENDIX III ................................................................................................................ 245
Administered questionnaire......................................................................................... 245
xvi
LIST OF TABLES
Table Title Page
2.1 Arithmetic mean, standard deviation and median of the gastro-
intestinal nematode (trichostrongyle-type) fecal egg counts (eggs
per gram) from 2581 repeated ewe observations, from six farms in
south-western Ontario, Canada, presented by season and
production stage (December 2009 to June 2011).
70
2.2 Descriptive statistics, as well as coefficients and p-values for the
continuous variables included in the univariable models of the
natural logarithm transformation of fecal egg count in ewes from
six farms in south-western Ontario, Canada (December 2009 to
June 2011).
72
2.3 Final general linear mixed model for the natural logarithm of fecal
egg counts (eggs per gram) in 2581 fecal samples from ewes in
different productions stages, sampled from six farms in south-
western Ontario, Canada (December 2009 to June 2011).
73
2.4 Final general linear mixed model for the total plasma protein
(g/dl) in 1670 blood samples from ewes in different production
stages, sampled from six farms in south-western Ontario, Canada
(December 2009 to June 2011).
74
2.5 Final general linear mixed model for the packed cell volume (%)
in 1662 blood samples from ewes in different production stages,
sampled from six farms in south-western Ontario, Canada
(December 2009 to June 2011).
75
3.1 Arithmetic means of adult gastrointestinal nematode counts (and
percentage distribution) of 16 tracer lambs put out to graze, and
slaughtered after 28 days, in south-western Ontario, between April
and May 2010.
106
4.1 The fecal egg count reduction percentages (and 95% confidence
intervals) following treatment with ivermectin, fenbendazole, and
levamisole on sheep farms in Ontario (2010 and 2011).
144
4.2 The fecal egg count reduction, and percentage reductions (%) in
Haemonchus sp., Teladorsagia spp., and Trichostrongylus spp.,
for ivermectin (n=18 farms), fenbendazole (n=13 farms) and
145
xvii
levamisole (n=11 farms) for post-treatment larval cultures from
sheep farms in Ontario (2011).
4.3 The mean number of larvae isolated from the two control wells,
the farm thiabendazole resistance status, and the percentage
reduction of Haemonchus sp., Teladorsagia spp., and
Trichostrongylus spp., in the TBZ 0.1 and TBZ 0.3 wells, in the
Larval Development Assay for 24 sheep farms in Ontario (2011).
147
5.1 Fecal egg count reduction (FECR) percentages (and 95%
confidence intervals) following ivermectin treatment on 29 sheep
farms in Ontario, Canada (2010 and 2011), calculated using four
different FECR formulae.
183
5.2 Fecal egg count reduction (FECR) percentages (and 95%
confidence intervals), following fenbendazole treatment on 20
sheep farms in Ontario, Canada (2010 and 2011), calculated using
four different FECR formulae.
185
5.3 Fecal egg count reduction (FECR) percentages (and 95%
confidence intervals), following levamisole treatment on 17 sheep
farms in Ontario, Canada (2010 and 2011), calculated using four
different FECR formulae
186
5.4 General linear mixed model for the natural-logarithm of the post-
treatment fecal egg counts (eggs per gram) for 29 sheep farms in
south-western Ontario, Canada (2010 and 2011).
187
5.5 The concordance correlation coefficients (and 95% confidence
intervals) and level of agreement, between the different methods
for calculating fecal egg count reduction (FECR) percentages
following (a) ivermectin, (b) fenbendazole and (c) levamisole
treatment for 29, 20 and 17 sheep farms, respectively, in Ontario,
Canada (2010 and 2011).
188
5.6 Number of farms that were classified as having high or low
resistance to fenbendazole using five different threshold
percentages (90%, 80%, 70%, 60% and 50%) to differentiate the
fecal egg count reduction as indicative of low or high levels of
resistance. Farms were classified as having no resistance when the
fecal egg count reduction was ≥95%.
189
5.7 Number of farms that were classified as having high, low or no
resistance to levamisole using five different threshold percentages
(90%, 80%, 70%, 60% and 50%) to differentiate the fecal egg
count reduction as indicative of low or high levels of resistance.
190
xviii
Farms were classified as having no resistance when the fecal egg
count reduction was ≥95%.
5.8 Weighted Kappa values for the agreement, beyond that due to
chance, between the farm resistance statuses based on the larval
development assay and the fecal egg count reduction test for
benzimidazoles using four different FECR†
calculations, for 13
sheep farms in Ontario, Canada (2011).
191
5.9 Percentages (%) of Haemonchus sp., Teladorsagia sp., and
Trichostrongylus spp. isolated from the control wells of the larval
development assay, and from larval cultures of pooled fecal
samples collected from the control (i.e. untreated) animals on the
second visit for the fecal egg count reduction test, for 13 sheep
farms in Ontario, Canada (2011).
192
6.1 Predictor variables that had a p-value ≤0.20 in univariable
associations with the outcome ivermectin fecal egg count
reduction (FECR) percentage on 29 Ontario sheep flocks (May to
November 2010 and May to November 2011).
220
6.2 Predictor variables that had a p-value ≤0.20 in univariable
associations with the outcome fenbendazole fecal egg count
reduction (FECR) percentage on 20 Ontario sheep flocks (May to
November 2010 and May to November 2011).
221
xix
LIST OF FIGURES
Figure Title Page
2.1 Median Fecal Egg Counts (gastrointestinal nematode eggs per
gram of feces) (± standard error) predicted from a general linear
mixed model, plotted against the Production Stages for the
minimum (24), mean (30.5) and maximum (37) PCV values, for
the (a) winter, (b) spring and (c) autumn lambing seasons, on 6
farms in south-western Ontario, Canada (December 2009 to June
2011).
76
2.2 Total plasma protein (g/dl) (±standard error) predicted from a
general linear mixed model, plotted against the different
production stages for all three lambing seasons (autumn, spring
and winter), for 1670 blood samples from ewes on six farms in
south-western Ontario, Canada (December 2009 to June 2011).
77
2.3 The Total Plasma Protein (g/dl) (± standard error) predicted from
a general linear mixed model, plotted against the different
production stages, for the quartiles of gastrointestinal nematode
fecal egg counts (0 eggs per gram, 200 eggs per gram, 800 eggs
per gram and 13,000 eggs per gram) for 1670 observations from
ewes on six farms in south-western Ontario, Canada (December
2009 to June 2011).
78
2.4 The curvilinear relationship between Packed Cell Volume (%)
and natural log transformation of Fecal Egg Counts (eggs per
gram) for ewes on six farms in south-western Ontario, Canada
(December 2009 to June 2011), as determined from a general
linear mixed model of packed cell volume.
79
2.5 The packed cell volumes (%) (± standard error) predicted from a
general linear mixed model, plotted against the different
production stages for three lambing seasons (autumn, spring and
winter), for 1662 blood samples from ewes on six farms in south-
western Ontario, Canada (December 2009 to June 2011).
80
3.1 Daily maximum, mean and minimum air temperatures, recorded
by HOBOware® Pro Data-Loggers placed on each of three
commercial sheep farms in south-western Ontario, between
December 2009 and May 2010.
107
xx
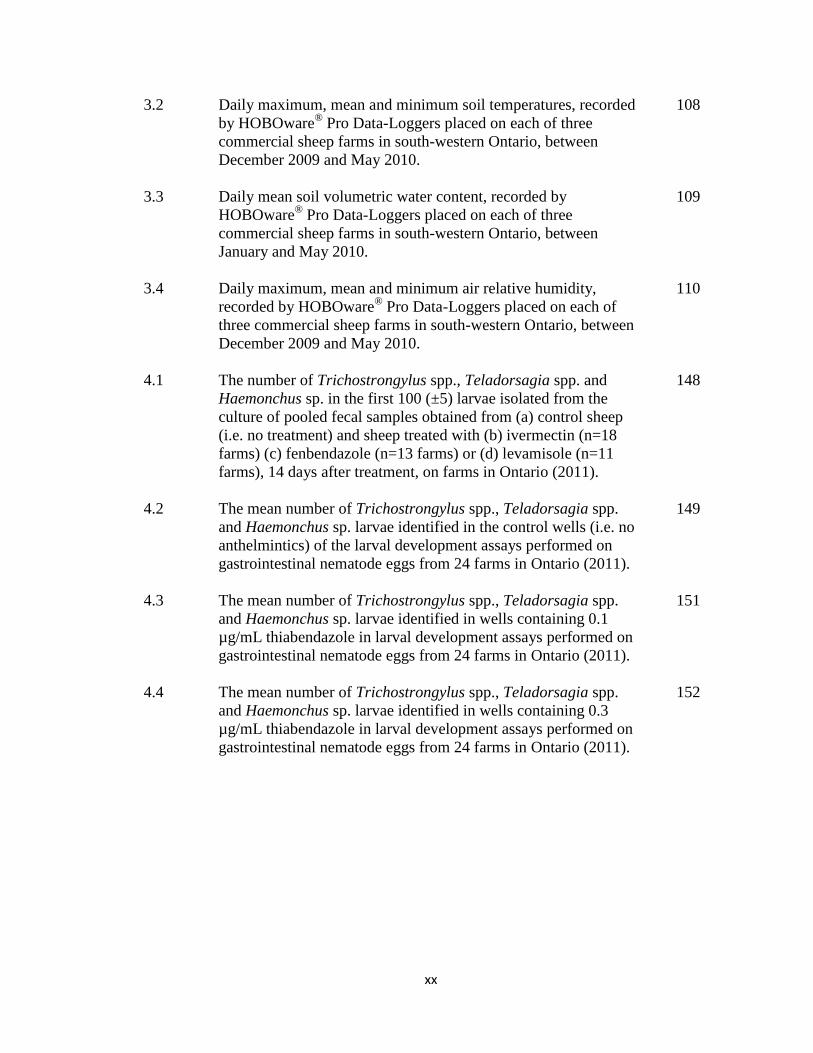
3.2 Daily maximum, mean and minimum soil temperatures, recorded
by HOBOware® Pro Data-Loggers placed on each of three
commercial sheep farms in south-western Ontario, between
December 2009 and May 2010.
108
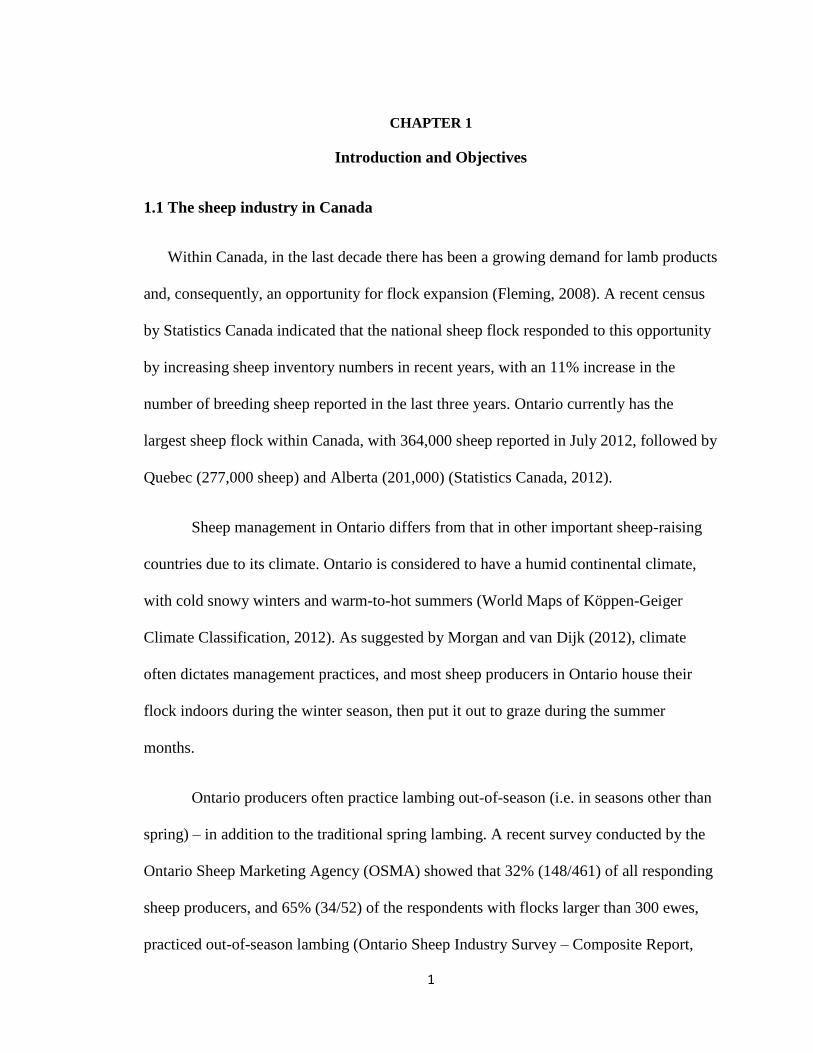
3.3 Daily mean soil volumetric water content, recorded by
HOBOware® Pro Data-Loggers placed on each of three
commercial sheep farms in south-western Ontario, between
January and May 2010.
109
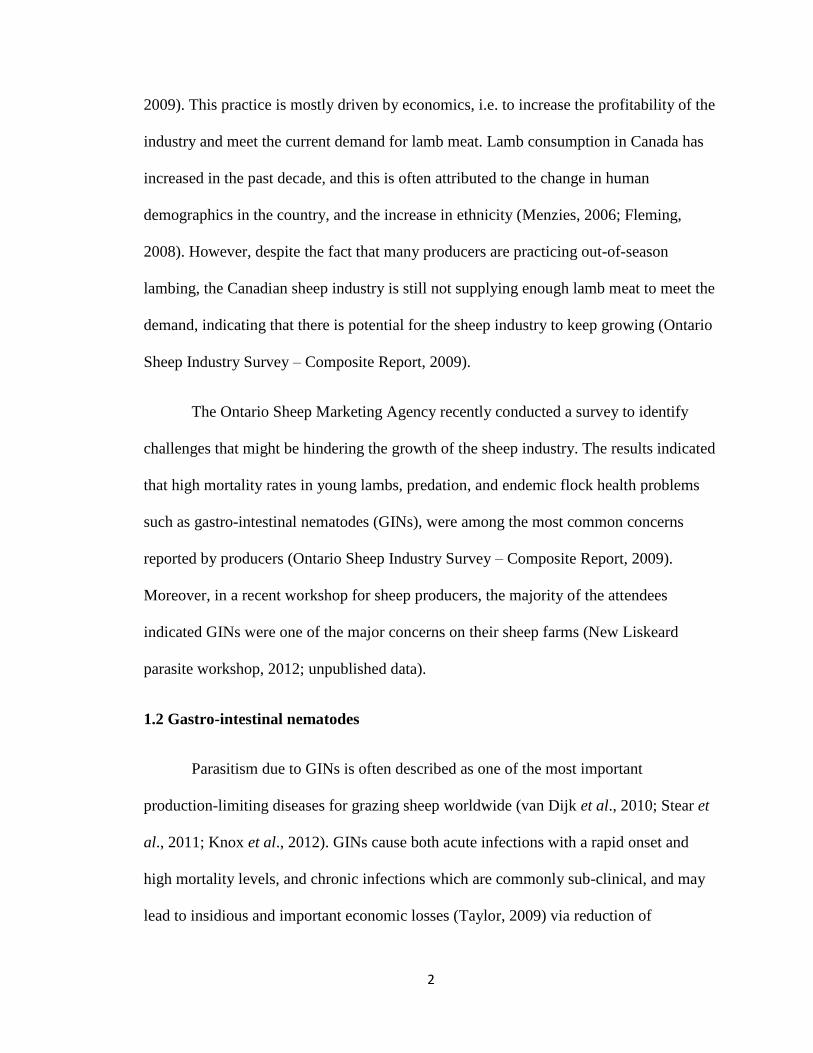
3.4 Daily maximum, mean and minimum air relative humidity,
recorded by HOBOware® Pro Data-Loggers placed on each of
three commercial sheep farms in south-western Ontario, between
December 2009 and May 2010.
110
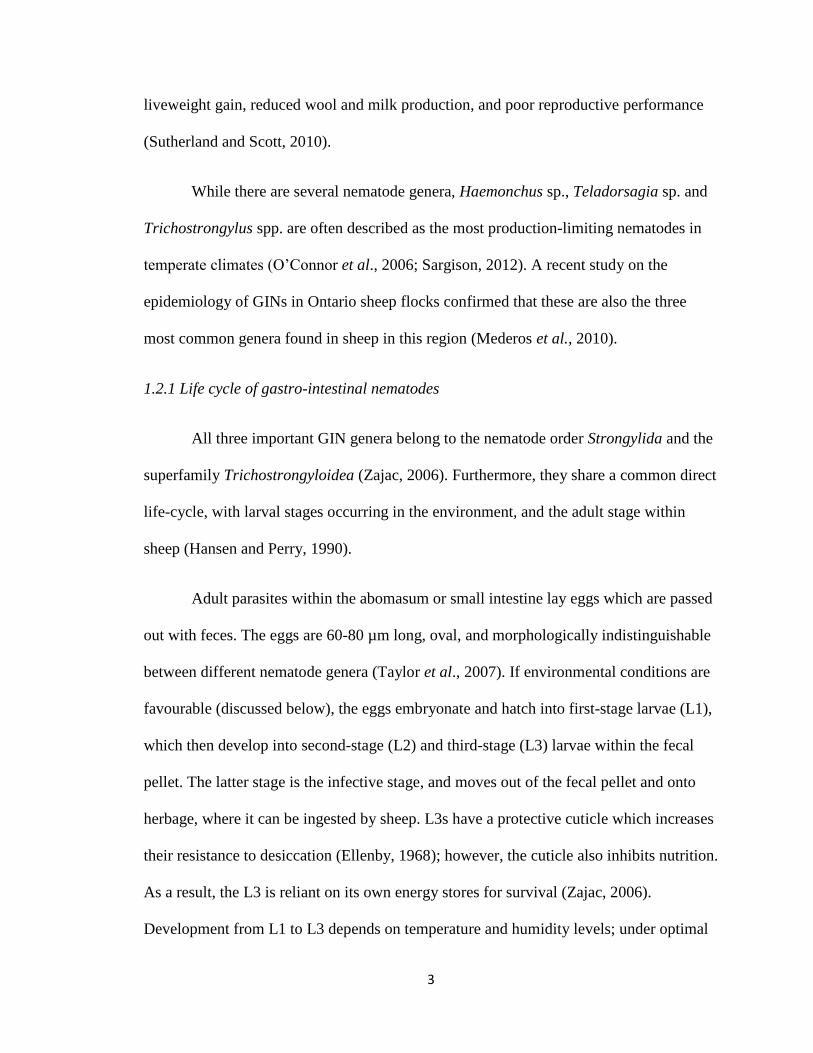
4.1 The number of Trichostrongylus spp., Teladorsagia spp. and
Haemonchus sp. in the first 100 (±5) larvae isolated from the
culture of pooled fecal samples obtained from (a) control sheep
(i.e. no treatment) and sheep treated with (b) ivermectin (n=18
farms) (c) fenbendazole (n=13 farms) or (d) levamisole (n=11
farms), 14 days after treatment, on farms in Ontario (2011).
148
4.2 The mean number of Trichostrongylus spp., Teladorsagia spp.
and Haemonchus sp. larvae identified in the control wells (i.e. no
anthelmintics) of the larval development assays performed on
gastrointestinal nematode eggs from 24 farms in Ontario (2011).
149
4.3 The mean number of Trichostrongylus spp., Teladorsagia spp.
and Haemonchus sp. larvae identified in wells containing 0.1
µg/mL thiabendazole in larval development assays performed on
gastrointestinal nematode eggs from 24 farms in Ontario (2011).
151
4.4 The mean number of Trichostrongylus spp., Teladorsagia spp.
and Haemonchus sp. larvae identified in wells containing 0.3
µg/mL thiabendazole in larval development assays performed on
gastrointestinal nematode eggs from 24 farms in Ontario (2011).
152
1
CHAPTER 1
Introduction and Objectives
1.1 The sheep industry in Canada
Within Canada, in the last decade there has been a growing demand for lamb products
and, consequently, an opportunity for flock expansion (Fleming, 2008). A recent census
by Statistics Canada indicated that the national sheep flock responded to this opportunity
by increasing sheep inventory numbers in recent years, with an 11% increase in the
number of breeding sheep reported in the last three years. Ontario currently has the
largest sheep flock within Canada, with 364,000 sheep reported in July 2012, followed by
Quebec (277,000 sheep) and Alberta (201,000) (Statistics Canada, 2012).
Sheep management in Ontario differs from that in other important sheep-raising
countries due to its climate. Ontario is considered to have a humid continental climate,
with cold snowy winters and warm-to-hot summers (World Maps of Köppen-Geiger
Climate Classification, 2012). As suggested by Morgan and van Dijk (2012), climate
often dictates management practices, and most sheep producers in Ontario house their
flock indoors during the winter season, then put it out to graze during the summer
months.
Ontario producers often practice lambing out-of-season (i.e. in seasons other than
spring) – in addition to the traditional spring lambing. A recent survey conducted by the
Ontario Sheep Marketing Agency (OSMA) showed that 32% (148/461) of all responding
sheep producers, and 65% (34/52) of the respondents with flocks larger than 300 ewes,
practiced out-of-season lambing (Ontario Sheep Industry Survey – Composite Report,
2
2009). This practice is mostly driven by economics, i.e. to increase the profitability of the
industry and meet the current demand for lamb meat. Lamb consumption in Canada has
increased in the past decade, and this is often attributed to the change in human
demographics in the country, and the increase in ethnicity (Menzies, 2006; Fleming,
2008). However, despite the fact that many producers are practicing out-of-season
lambing, the Canadian sheep industry is still not supplying enough lamb meat to meet the
demand, indicating that there is potential for the sheep industry to keep growing (Ontario
Sheep Industry Survey – Composite Report, 2009).
The Ontario Sheep Marketing Agency recently conducted a survey to identify
challenges that might be hindering the growth of the sheep industry. The results indicated
that high mortality rates in young lambs, predation, and endemic flock health problems
such as gastro-intestinal nematodes (GINs), were among the most common concerns
reported by producers (Ontario Sheep Industry Survey – Composite Report, 2009).
Moreover, in a recent workshop for sheep producers, the majority of the attendees
indicated GINs were one of the major concerns on their sheep farms (New Liskeard
parasite workshop, 2012; unpublished data).
1.2 Gastro-intestinal nematodes
Parasitism due to GINs is often described as one of the most important
production-limiting diseases for grazing sheep worldwide (van Dijk et al., 2010; Stear et
al., 2011; Knox et al., 2012). GINs cause both acute infections with a rapid onset and
high mortality levels, and chronic infections which are commonly sub-clinical, and may
lead to insidious and important economic losses (Taylor, 2009) via reduction of
3
liveweight gain, reduced wool and milk production, and poor reproductive performance
(Sutherland and Scott, 2010).
While there are several nematode genera, Haemonchus sp., Teladorsagia sp. and
Trichostrongylus spp. are often described as the most production-limiting nematodes in
temperate climates (O’Connor et al., 2006; Sargison, 2012). A recent study on the
epidemiology of GINs in Ontario sheep flocks confirmed that these are also the three
most common genera found in sheep in this region (Mederos et al., 2010).
1.2.1 Life cycle of gastro-intestinal nematodes
All three important GIN genera belong to the nematode order Strongylida and the
superfamily Trichostrongyloidea (Zajac, 2006). Furthermore, they share a common direct
life-cycle, with larval stages occurring in the environment, and the adult stage within
sheep (Hansen and Perry, 1990).
Adult parasites within the abomasum or small intestine lay eggs which are passed
out with feces. The eggs are 60-80 µm long, oval, and morphologically indistinguishable
between different nematode genera (Taylor et al., 2007). If environmental conditions are
favourable (discussed below), the eggs embryonate and hatch into first-stage larvae (L1),
which then develop into second-stage (L2) and third-stage (L3) larvae within the fecal
pellet. The latter stage is the infective stage, and moves out of the fecal pellet and onto
herbage, where it can be ingested by sheep. L3s have a protective cuticle which increases
their resistance to desiccation (Ellenby, 1968); however, the cuticle also inhibits nutrition.
As a result, the L3 is reliant on its own energy stores for survival (Zajac, 2006).
Development from L1 to L3 depends on temperature and humidity levels; under optimal
4
conditions (discussed below) it can be completed in as short as five days, but may take
weeks or months in cooler conditions (Taylor et al., 2007).
After ingestion, the L3 moves down the alimentary tract of sheep and moults into
L4 and L5 within the abomasal gastric glands (T. circumcincta) or mucosa (T. axei),
before emerging as mature adults which produce eggs. Unless hypobiosis occurs (see
below), the prepatent period is approximately 2-3 weeks long (Taylor et al., 2007).
While Haemonchus contortus, Teladorsagia circumcincta and Trichostrongylus
spp. all share a similar life-cycle, they exhibit important differences in their
pathogenicity, fecundity and environmental requirements (Taylor et al., 2007), as
described below.
1.2.2 Haemonchus contortus
Haemonchus contortus is the largest GIN, measuring 20-30 mm, and the female
parasite is a prolific egg layer, producing thousands of eggs each day (Zajac, 2006; van
Dijk et al., 2010). The adults are found attached to the abomasal mucosa and the female
parasite is hematophagous, causing a loss of both blood and protein (Taylor et al., 2007).
Due to this hematophagous activity, H. contortus is considered the most pathogenic GIN,
and clinical signs of haemonchosis include anemia and sub-mandibular edema (Sargison,
2008).
Haemonchus contortus is described as a tropical parasite (Gordon, 1948; Waller
et al., 2004), and is very susceptible to desiccation (O’Connor et al., 2007; Reynecke et
al., 2011). Development of eggs to L1 and hatching occurs at an optimal temperature of
15°C or higher, but may still occur at a slower rate at 5°C; however, development
5
completely ceases below -3°C (Troell et al., 2005; van Dijk et al., 2010). Optimal larval
development from L1 to L3 occurs between 25-37°C, and L3s do not survive below -
10°C or freeze/thaw cycles (O’Connor et al., 2006).
1.2.3 Teladorsagia circumcincta
Teladorsagia circumcincta (formerly known as Ostertagia circumincta) is a
smaller parasite, measuring 8-10 mm (Taylor et al., 2007). While the adult parasites are
found on the abomasal mucosal surface, the developmental stages occur within the
gastric glands of the fundic region of the abomasum, leading to the formation of visible
nodules on the abomasal mucosa (Zajac, 2006). The resulting hyperplastic gastritis
disrupts the secretion of gastric enzymes and alters the gastric pH, which in turn leads to
clinical signs of diarrhea, dehydration and weight loss (Sutherland and Scott, 2010).
Telardorsagia circumcincta is more cold-tolerant than H. contortus (Smith and
Archibald, 1965; Uriarte et al., 2003; van Dijk et al., 2010; Waghorn et al., 2011), and
optimal development to the infective L3 stage occurs between 16-30°C (O’Connor et al.,
2006). L3s can survive longer than H. contortus and Trichostrongylus spp. on pasture,
which may be because they remain in the fecal material for longer periods of time, where
they are protected from adverse climatic conditions, and also because they are more
resistant to freeze-thaw cycles (O’Connor et al., 2006).
6
1.2.4 Trichostrongylus spp.
Trichostrongylus spp. are the smallest GINs, measuring 5-6 mm. The adult
parasites burrow into the mucosal epithelium of the abomasum or small intestine, causing
extensive desquamation of the epithelium and sub-epithelium (Taylor et al., 2007). This
leads to a chronic inflammatory process which compromises nutrient absorption, and may
lead to severe diarrhea (colloquially called ‘black scours’) and weight loss (Zajac, 2006).
Trichostrongylus spp. L3s can survive at lower temperatures of -10°C, compared
to H. contortus (Gordon, 1948; Ayalew and Gibbs, 1973; Familton and MacAnulty,
1994), but are not as cold-tolerant as Teladorsagia sp. (Smith and Archibald, 1965);
optimal development from L1 to L3 occurs between 22-33°C (O’Connor et al., 2006).
1.2.5 Clinical signs
Both T. circumcincta and H. contortus may manifest as a Type I or Type II
syndrome, though Type II teladorsagiosis is uncommon in sheep (compared to Type II
ostertagiosis in cattle) (Taylor et al., 2007). Type I teladorsagiosis and haemonchosis is
observed in lambs in late summer/early autumn, and is a consequence of infection with
large numbers of L3s on pasture and their development into adult parasites within the
same grazing season. This syndrome is typically associated with a high morbidity, but
mortality is low to high depending on the level of parasites present in the animal. Type II
haemonchosis is commonly observed in adults, especially yearling ewes, in late
winter/early spring, and results from the resumption of activity and maturation of
hypobiotic larvae (discussed below). Though Type II haemonchosis may only affect a
7
small proportion of the flock, mortality may be high unless the ewes are treated early
(Taylor et al., 2007).
1.2.6 Hypobiosis
When climatic conditions are unfavourable, GINs may undergo a temporary
cessation of development within the host at the L3 (Trichostrongylus spp.) or L4 stage
(H. contortus and T. circumcincta) (Taylor et al., 2007). While it is yet unknown what
triggers this hypobiotic stage, Ayalew and Gibbs (1973) suggested that it may be a
consequence of physiological changes or acquired immunity of the host. More recently,
van Dijk et al. (2010) suggested that environmental factors related to temperature,
photoperiod and drought may also be responsible for the arrested development observed
in GINs.
During hypobiosis, the larvae have a lower metabolic rate, which allows them to
survive longer within the host when environmental conditions are unfavourable (Sargison
et al., 2007). This mechanism is particularly important for H. contortus as it allows this
parasite to survive the winter within the host (Blitz and Gibbs, 1972; Ayalew and Gibbs,
1973; McKenna, 1974; Uriarte et al., 2003; Waller et al., 2004; Waller et al., 2006;
Morgan and van Dijk, 2012; Taylor, 2012a). When environmental conditions become
favourable or when host immunity wanes, the parasites complete their development and
start producing eggs (Michel, 1974; Michel, 1976); this leads to pasture contamination,
and therefore represents an important source of infection. As discussed earlier,
resumption of parasite activity may also lead to an acute Type II syndrome, resulting in a
sudden onset of clinical signs in late winter and early spring (Taylor et al., 2007).
8
1.2.7 Periparturient Egg Rise
The periparturient egg rise (PPER) is a term used to describe an increase in fecal
egg shedding observed in ewes around lambing time and lactation (Radostits et al., 2007;
Sargison, 2008) and, as mentioned above, is one of the most significant contributors to
pasture contamination with GIN eggs (Donaldson et al., 1998; Barger, 1999; Zajac, 2006;
Morgan and van Dijk, 2012).
Initial studies of the PPER suggested that it was due to the increased availability
of larvae on pasture in the spring (Zawadowsky and Zvjaguintzev, 1933). However,
Taylor (1935) criticized this theory, indicating that if the PPER phenomenon was merely
linked to pasture availability, the fecal egg shedding would increase exponentially over
the grazing season as pasture contamination built up. In contrast, the PPER is often
described as a transient phenomenon, peaking at 6-8 weeks after lambing, and then
decreasing. Taylor (1935) therefore suggested that other factors related to immunity and
nutrition were more likely the causative factors of the PPER, as these influence the egg
production of the parasites, and consequent fecal egg shedding.
Dunsmore (1965) described the PPER as an interaction between environmental
and physiological factors, whereby seasonal stimuli triggered changes in hypobiotic
larvae, while the animals’ productivity stage influenced the fecundity of the worms.
Michel (1974, 1976 and 1978) also suggested that the PPER occurred due to a
combination of both environmental factors that stimulated the resumption of parasitic
activity, and endocrine and metabolic changes that occurred during the parturient and
9
lactation stage which increased the longevity of worms and resulted in higher fecal egg
counts (FECs).
Following these studies on seasonal and physiological factors, several authors
investigated the possible role of nutrition (Coop and Holmes, 1996; Donaldson et al.,
1998; Houdijk, 2008); all studies indicated that dietary protein was an important factor in
determining the PPER. More recently, a study by Beasley et al. (2012) showed that
pregnant or lactating ewes on low-protein diets had higher FECs compared to pregnant
or lactating ewes on high-protein diets. A study by Houdijk (2012) also indicated that
protein plays a more important role in the PPER compared to metabolizable energy.
These studies suggest that limited protein availability invariably increases the PPER, and
are in accordance with the nutrient partitioning framework described by Coop and
Kyriazakis (1999) and Houdijk et al. (2001). This framework indicates that different
bodily functions are given different priorities, depending on the age and type of animal;
while maintenance of body protein remains top priority in all age groups, reproducing
animals prioritize reproductive performance over expression of anti-parasite immunity.
While the role of metabolizable protein in determining the PPER has been
generally accepted, more research is required to elucidate the link between dietary protein
levels, immune changes and consequent PPER. Jeffcoate and Holmes (1992) suggested
that local IgA may play a role in the PPER since it is synthesized in the gut, but moves to
the plasma in late gestation to be secreted in the milk, resulting in a temporary decline of
IgA in the gut. Beasley et al. (2010) also showed that changes consistent with a reduction
in local immunity expression, such as lower antibody levels and fewer mast cells, globule
leucocytes and goblet cells in the intestinal tissue, occurred in both pregnant and lactating
10
ewes. These observations all suggest that changes in local immunity conditions,
particularly IgA levels, may enhance parasite egg shedding, and are in accordance with
work by Stear et al. (1997, 1998 and 2011), which indicated that parasite-specific IgA
negatively impacts parasite fecundity. Consequently, a decrease in local IgA
concentrations during gestation and parturition would result in the increased fecal egg
shedding observed during this period.
1.2.8 Overwintering on pasture
As described earlier, the GIN life-cycle involves free-living stages which are
susceptible to several environmental factors (Gordon, 1948; O’Connor et al., 2006; van
Dijk et al., 2010); this can lead to seasonal changes in both the genera and number of
larvae present on pasture (Waghorn et al., 2011). Several influential environmental
factors have been described, which include temperature (Veglia, 1915; Krecek et al.,
1992; Stromberg, 1997; van Dijk et al., 2010; Reynecke et al., 2011), moisture (Callinan
and Westcott, 1986; Familton and MacAnulty, 1994; O’Connor et al., 2007), barometric
pressure (Stromberg, 1997), soil type (Krecek et al., 1992), sward height and type
(Veglia, 1915), snow cover (Smith and Archibald, 1965; Troell et al., 2005) and, more
recently, ultraviolet irradiation (van Dijk et al., 2009). Of these, temperature and moisture
are often described as the most influential factors (van Dijk et al., 2009).
Temperature influences both the development of eggs to the infective larval stage,
and the migration and survival of L3 on pasture; however, optimal temperatures are
genera specific (O’Connor et al., 2006). Additionally, while warm temperatures
accelerate the rate of development from eggs to infective larvae, above a certain genera-
11
specific threshold (discussed above), high temperatures are detrimental as the L3s rapidly
deplete their energy reserves and die (Zajac, 2006). Moisture is required to allow for the
migration of larvae on herbage (Callinan and Westcott, 1986; Hansen and Perry, 1990;
Santos et al., 2012), and can therefore become a limiting factor for completion of the
parasite cycle, especially in hot conditions (Familton and MacAnulty, 1994; O’Connor et
al., 2006; Reynecke et al., 2011).
1.3 Anthelmintics and anthelmintic resistance
Anthelmintic drugs have traditionally been used to control GIN infections as they
are simple to use, cheap and highly effective (Sargison, 2012; Taylor, 2012b). Since the
first introduction of phenothiazine in the early 1940s, anthelmintics have been employed
for both therapeutic and prophylactic purposes worldwide (Jackson & Miller, 2006).
The benzimidazoles were introduced to the market in the 1960s, and have
ovicidal, larvicidal and adulticidal properties (Sargison, 2012). In susceptible parasites,
benzimidazoles bind to beta-tubulin, inhibiting microtubule polymerization and
consequent cellular metabolism and cellular processes such as mitosis (Adams, 2001).
They are relatively safe for sheep, although albendazole has been shown to have
teratogenic effects, and should therefore not be used in ewes in early gestation (Zajac,
2006).
The imidazothiazoles, such as levamisole, were introduced in the 1970s.
Levamisole is a cholinomimetic, causing sustained nematode muscle contraction and
paralysis (Adams, 2001). While this drug class kills adult parasites, a study by Grimshaw
et al. (1994) indicated that levamisole may not be effective against hypobiotic larvae.
12
Also, levamisole has a narrower therapeutic safety index compared to the
benzimidazoles, and should therefore be used with caution in pre-lambing ewes
(Sargison, 2012).
Macrocyclic lactones were introduced in the 1980s, and include both avermectins
such as ivermectin, and milbemycins such as moxidectin (Adams, 2001). While both of
these drug sub-classes act on glutamate- and gamma-amino-butyric acid-gated chloride
channels, the milbemycins are more lipophilic, and therefore have a longer residual
activity, compared to the avermectins (Sargison, 2011a). Macrocyclic lactones have
activity against both internal (nematodes) and external (arthropod) parasites, and have a
wide safety margin in sheep as they do not readily cross the blood-brain barrier (Adams,
2001).
In the past five years, two new broad-spectrum anthelmintic drug classes were
introduced for the control of GIN parasitism in sheep: the amino-acetonitrile derivatives
(AADs) (Kaminsky et al. 2008) and the spiroindoles (Ruiz-Lancheros et al., 2011). The
AADs bind to unique nematode-specific acetylcholine receptor sub-units, and are
therefore very specific for nematodes, reducing toxic side effects (Kaminsky et al., 2008).
The spiroindole derquantel also binds to acetylcholine receptors, and is marketed as a
combination product with abamectin (Sargison, 2012).
Lastly, the narrow-spectrum salicylanilide derivative drugs closantel and
nitroxynil are protein ionophores and act by uncoupling the oxidative phosphorylation
process within the parasite mitochondria (Martin, 1997). These drugs bind strongly to
plasma proteins, which allows them to concentrate within hematophagous parasites
13
(Sutherland and Scott, 2010). These drugs, therefore, have a limited spectrum of activity
and are only effective against the hematophagous H. contortus (Waller et al., 2006).
In Canada, only ivermectin is licensed for use in sheep (Compendium of
Veterinary Products, Canada, 2012). Thiabendazole was the first benzimidazole to be
marketed in Canada in the early 1960s (Adams, 2001), but was subsequently replaced
with other structurally similar, but improved drugs, such as fenbendazole and
albendazole. Fenbendazole and albendazole are licensed for use in Canada in cattle
(Compendium of Veterinary Products, Canada, 2012), but are often used in sheep in an
extra-label manner. Levamisole has not been licensed for use in sheep in Canada for the
past 10 years (Health Canada – Drug Product Database Online Query, 2012).
1.3.1 Anthelmintic resistance
Anthelmintic resistance (AR) is defined as “the heritable ability of the parasite to
tolerate a normally effective dose of the anthelmintic” (Abbott et al., 2009), which
implies that the parasite can survive exposure to the standard recommended dose of the
anthelmintic, and pass on this ability to its offspring. Anthelmintic resistance is a
common cause of drench failure (i.e. inadequate control of parasite FECs after
anthelmintic treatment) (McKenna, 1990); however, other confounding factors may also
lead to treatment failure, such as dosing animals with insufficient anthelmintics (Sangster
and Gill, 1999), or use of an inappropriate anthelmintic for the parasite present (Taylor et
al., 2002; Abbott et al., 2009).
Anthelmintic resistance is an escalating problem in many countries (Kaplan,
2004). It is a threat to sheep welfare (Wolstenholme et al., 2004), and has important
14
economic consequences as it leads to sub-optimal growth (Coles, 2001; Sargison, 2011b),
and reduces both carcass and fleece weight (Miller et al., 2012). Anthelmintic resistance
is widespread in New Zealand (Waghorn et al., 2006; Hughes et al., 2007), Australia
(Love et al., 1992; Besier and Love, 2004), and in several South American countries,
such as Brazil and Uruguay (Waller et al., 1996; Cezar et al., 2010). In recent years, AR
has also been described in the United States (Howell et al., 2008; Kaplan and
Vidyashankar, 2012) and in several European countries including Greece (Gallidis et al.,
2009; Gallidis et al., 2012), Italy (Cringoli et al., 2009), Spain (Calvete et al., 2012) and
the United Kingdom (Jackson and Coop, 2000). Moreover, reports of triple-class
resistance are now common (Sargison et al., 2010; Knox et al., 2012 Taylor, 2012a;
Voigt et al., 2012), indicating the urgency to improve control strategies for AR (Taylor,
2012a). In 2007, the first case of AR in Canada was described in a sheep flock in Ontario
(Glauser et al., 2007). However, as indicated recently by Torres-Acosta et al. (2012),
information on the current state of AR in a number of countries, including Canada, is
lacking.
The insurgence and rate of AR development is attributed to various risk factors
related to the mode of genetic inheritance and number of genes involved, the parasite
biology and epidemiology (Sargison, 2012), and selection pressure for resistance. Each of
these factors is further described below.
15
1.3.1.1 Mode of inheritance and number of genes involved
Anthelmintic resistance is an expression of certain parasite genes that enable
parasites to survive the anthelmintics’ mechanism of action (Prichard et al., 1980).
Benzimidazole resistance occurs as a result of an alteration to the parasites’ beta-tubulin
genes, with the result that the drugs cannot bind to the intended target (Lacey and Gill,
1994). The mechanisms behind levamisole resistance are still being investigated, yet
studies in resistant strains of H. contortus seem to suggest that resistance is associated
with the presence of low-affinity acetyl-choline-gated cation channel binding-sites for
levamisole (Sangster et al., 1998b). Macrocyclic lactone resistance likely involves
multiple mechanisms, including an increase in the number of low affinity glutatmate-
chloride receptors and mutations in the P-glycoprotein genes which allow for an
increased drug efflux (Jabbar et al., 2006; Sutherland and Scott, 2010).
The rate of AR development is inevitably influenced by the number of genes
involved and their heritability (Vidyashankar et al., 2012). Depending on the parasite
species and anthelmintic involved, genes encoding resistance may be recessive or
dominant, autosomal or sex-linked, and single or multigenic (Sutherland and Scott,
2010). For instance, studies on avermectin resistance have indicated that it is a dominant,
autosomal trait, controlled by a single gene in both H. contortus and T. circumcincta (Le
Jambre et al., 2000; Leathwick et al., 2001), while in Trichostrongylus colubriformis, it
appears to be a multigenic, partially dominant trait (Gill and Lacey, 1998). Levamisole
resistance is described as a recessive, autosomal, multigenic trait in H. contortus
(Sangster et al., 1998a), but as a sex-linked recessive trait in T. colubriformis (Martin and
McKenzie, 1990). Finally, benzimidazole resistance in both H. contortus and T.

16
colubriformis is described as an autosomal, multigenic trait, either incompletely recessive
or semi-dominant (Le Jambre et al., 1979; Dobson et al., 1996).
1.3.1.2 Parasite biology and epidemiology
Anthelmintic resistance has been shown to develop faster in H. contortus
compared to T. circumcincta and Trichostrongylus spp. (Sangster and Gill, 1999; Mejía
et al., 2003), which may be a result of both genetic and biological differences between
the nematode genera. However, the genera-specific prevalence of AR in a specific
country or region also depends on the prevalence of the different genera of GIN on farms,
which, in turn, is influenced by climate (Vidyashankar et al., 2012). In New Zealand,
resistance has been described as common in Nematodirus spp., Teladorsagia spp. and
Trichostrongylus spp. (Waghorn et al., 2006), while in the United Kingdom, the majority
of AR cases have been associated with Teladorsagia spp. (Bartley et al., 2003). The latter
finding is in agreement with a recent survey conducted by Burgess et al. (2012) that
determined the nematode species present on United Kingdom sheep farms; T.
circumcincta was the only parasite present on all farms surveyed. Both New Zealand and
the United Kingdom are described as having temperate climates, which favours the
survival of the more cold-tolerant T. circumcincta (O’Connor et al., 2006). In contrast, a
study conducted in the southeastern United States (Howell et al., 2008) indicated that H.
contortus was both the most common parasite, and the parasite most commonly
associated with resistance, on the sheep farms surveyed. However, the climate in the
southeastern United States is generally warm and humid, with mild winters, favouring the
survival of the more tropically adapted H. contortus (Troell et al., 2005).

17
1.3.1.3 Selection pressure for resistance
Selection pressure for AR depends on a number of factors, such as drug efficacy
and dose administered, frequency and timing of anthelmintic treatment, and the
proportion of the parasite population in refugia (Sargison, 2011a).
Sub-optimal dosing may select for AR (Calvete et al., 2012), as it allows both
homozygous resistant and heterozygous resistant worms to survive treatment, increasing
the reproductive advantage of heterozygous-resistant worms (which would normally be
killed with a full anthelmintic dose) over homozygous-susceptible worms (Abbott et al.,
2009). Sub-optimal dosing may occur due to incorrect calibration of the anthelmintic
drench gun, poor delivery of the drench into the back of the mouth, and under-estimation
of the animal’s live weight (Scott and Sutherland, 2010). A recent survey by Burgess et
al. (2012) in the United Kingdom found that many producers were either under-
estimating the weight of individual animals or using the average weight of the flock for
dosing, leading to sub-optimal dosing of animals.
The frequency of treatment has often been incriminated as one of the most
important factors in determining AR (Prichard et al., 1980; Sangster, 1999; Cabaret et al.,
2009; Calvete et al., 2012), as it removes susceptible worms, and proffers a reproductive
advantage to any remaining resistant worms. However, recent work has indicated that
factors other than the frequency of treatment may be more important determinants of AR,
as they impact the number of worms that are left in refugia (Sutherland and Scott, 2010).
These include which groups of animals (i.e. which age group and productivity stage) are
treated (Leathwick et al., 1995; Leathwick et al., 2006; Leathwick et al., 2008; Waghorn
18
et al., 2010), and management practices associated with anthelmintic treatment, such as
drench-and-shift (i.e. treating the animals with an anthelmintic and immediately moving
them onto pastures with low numbers of parasite larvae) (Waghorn et al., 2009).
Refugia has been described as the most important concept in selection for AR
(van Wyk, 2001), and describes the proportion of the parasite population that is not
exposed to anthelmintic drugs, either because they are within untreated hosts, or are free-
living on pasture (Kenyon et al., 2009). Preserving a proportion of the susceptible
parasites on a farm in refugia increases the likelihood that these parasites may mate with
resistant ones; this, in turn, reduces the proportion of homozygous-resistant parasites
present on pasture and slows the development of resistance (van Wyk et al., 2006).
The concept of refugia has been investigated in several studies. A study by Martin
et al. (1981) showed that resistance built up faster when fewer parasites were left in
refugia, and a modelling study by Barnes et al. (1995) indicated that leaving a proportion
of the lambs untreated slowed the development of resistance. More recently, several
clinical trials have been carried out in New Zealand to test the concept of refugia, either
by leaving adult ewes (Leathwick et al., 2006), or a proportion of the lambs in a flock
(Waghorn et al., 2008), untreated. Both studies indicated that leaving 10-15% of the flock
untreated slowed the development of resistance by increasing the number of susceptible
parasites in refugia.
Selective treatment is a practical application of refugia theory (Jackson and
Miller, 2006), and is defined as treatment of individual animals when GIN parasitism is
suspected; as opposed to targeted treatment, i.e. treatment of the whole flock when GIN
19
parasitism is suspected (Kenyon and Jackson, 2012). Selective treatment is based on the
idea that, within a flock, the parasite population is over-dispersed and the majority of the
parasites are found within a small proportion of the animals (Sréter et al., 1994; Stear et
al., 1998). Consequently, identifying and treating the high-shedder animals should
effectively reduce the parasite burden on the farm, while also allowing for a reduction in
the treatments given (Kenyon and Jackson, 2012).
Several parameters have been suggested to correctly identify which animals
should be treated, and include parasitological parameters such as FECs, patho-
physiological parameters, such as FAMACHA©
(van Wyk and Bath, 2002) and DISCO
diarrhoea scores (Bentounsi et al., 2012), and performance-based parameters (Bath and
van Wyk, 2009). Each of these is further discussed below.
Fecal egg counts are very accurate in identifying infected animals. Two recent
field studies that evaluated the efficacy of using FECs as a decision parameter for
targeted selective treatment compared to whole-flock systematic treatment, showed that
targeted treatment of animals with high FECs decreased the mean flock FECs, while also
reducing the number of treatments administered (Gallidis et al., 2009; Cringoli et al.,
2009). However, using FECs as an indicator is currently not very practical, as analysis
requires a laboratory setting and is time-consuming and expensive (Gallidis et al., 2009);
ideally, a faster test should be developed which allows for a rough estimation of the FEC
with the opportunity to take an immediate decision regarding treatment of the animal.
Patho-physiological parameters that are used for targeted selective treatment
include the FAMACHA©
score (van Wyk and Bath, 2002) and the diarrhea DISCO score

20
(Bentounsi et al., 2012). The FAMACHA©
score is based on the notion that H. contortus
causes anaemia, which can be assessed by evaluating the colour of the conjunctivae (van
Wyk and Bath, 2002; Jackson and Miller, 2006). While this system is effective in areas
where H. contortus is the most prevalent parasite, such as South Africa (Malan et al.,
2001) and southeastern United States (Kaplan et al., 2004), FAMACHA©
may be less
reliable in temperate areas where non-haematophagous parasites such as T. circumcincta
and Trichostrongylus spp. are more prevalent (Bentounsi et al., 2012). Recent work
conducted in Ontario indicated that FAMACHA©
was poorly correlated with FECs and
packed cell volume (Mederos, 2010). This may be due to the low prevalence of H.
contortus in certain flocks, which lowers the predictive ability of the FAMACHA©
test
(Dohoo et al., 2009). Therefore, in temperate regions, the DISCO diarrhea score, based
on the state of the feces at the moment of collection, may be of more use in identifying
heavily parasitized animals (Bentounsi et al., 2012). However, both the FAMACHA©
and
DISCO scores have important limitations: firstly, both anaemia and diarrhea can be
multi-factorial, therefore reducing the specificity of these tests in diagnosing GIN
infections (van Wyk and Bath, 2002; Bentounsi et al., 2012). Secondly, they are based on
signs of clinical disease and may thus result in a delayed response, increasing the risk of
irreversibly compromising the animals’ productivity and welfare (Kenyon et al., 2009).
Lastly, targeting the treatment towards those animals that only show overt clinical signs
may result in missing those more resilient animals that may not be showing any clinical
repercussions, but are still shedding eggs and contributing to pasture contamination.
Performance-based parameters that can be used to direct selective treatment
include body condition scoring (Osoro et al., 2007), live weight gain (Stafford et al.,
21
2009) and milk production (Gallidis et al., 2009). While all three parameters have been
shown to be effective within certain settings, the application of these parameters may be
limited either by the subjectivity of the assessment (for body condition scoring), or the
costs and practicality associated with measurement of live weight gain and milk
production on multiple occasions (Bath and van Wyk, 2009).
While targeted selective treatment may be a promising option for helping control
AR, several factors require further elucidation. Leaving a certain proportion of the flock
untreated may increase pasture contamination, with consequent negative effects on the
animals’ productivity and welfare (Waghorn et al., 2008; Kenyon and Jackson, 2012). It
is therefore important to determine the proportion of the flock that should be left
untreated without consequent adverse effects on the rest of the flock (Cabaret et al.,
2009). While Waghorn et al. (2008) indicated that leaving 10% of the population
untreated should be sufficient to slow down the development of resistance, this
proportion may vary as it is influenced by drug efficacy and the overall pasture
contamination (Kenyon and Jackson, 2012). Secondly, refugia is an elusive concept,
difficult to explain and put into practice (Jackson and Miller, 2006), and more research is
required to identify extension methods that will appeal to different target audiences
(Woodgate and Love, 2012) and increase the uptake of targeted selective strategies
(Besier, 2012).
22
1.4 Tests for determining anthelmintic resistance
1.4.1 Fecal Egg Count Reduction Test
The standard and most commonly employed field test for diagnosing AR is the
Fecal Egg Count Reduction Test (FECRT) (Coles et al., 1992; Taylor et al., 2002;
Dobson et al., 2012). The FECRT is an indirect measure of an anthelmintic’s efficacy,
and measures the FEC reduction 10-14 days after treatment with an anthelmintic
(McKenna, 2006); a threshold of <95% is recommended as indicative of resistance
(Coles et al., 1992). The FECRT is easy to perform (Maingi et al., 1998), can be used to
test multiple anthelmintics simultaneously (Martin et al., 1989), and is therapeutically
relevant (Sangster and Gill, 1999). However, it is laborious and time-consuming (Craven
et al., 1999), and can only detect resistance when at least 25% of the parasite population
is expressing the resistance genes (Coles et al., 1992; Martin et al., 1989).
When carrying out a FECRT, it is important to appreciate that multiple factors can
influence the outcome of the test. Studies have shown that the FECRT is less reliable at
diagnosing AR when the drug efficacy ranges around 90 - 95%, compared to very low
drug efficacies (Cabaret and Berrag, 2004; Miller et al., 2006). The parasites’ fecundity
and density-dependent effects of worm numbers on egg production may also impact the
FECRT outcome, as they increase the variability of the FECs (Mejía et al., 2003;
Papadopoulos et al., 2012). Several authors have also discussed the impact of low
(Maingi et al., 1998; Miller et al., 2006; Knox et al., 2012) or over-dispersed (Dobson et
al., 2009; Dobson et al., 2012) pre-treatment FECs on the Fecal Egg Count Reduction
(FECR) percentage, as these parameters increase the variance of the estimate, making it
23
less reliable. Over-dispersion of the parasite population has led to several discussions on
whether arithmetic (Dash et al., 1988; McKenna, 1990; Coles et al., 1992; McKenna,
1997) or geometric (Presidente, 1985; Wood et al., 1995; Smothers et al., 1999) means
should be used when calculating the FECR percentage.
Another important factor when estimating the FECR is which treatment data are
included in the FECR formula. The formula endorsed by the World Association for the
Advancement of Veterinary Parasitology (Coles et al., 1992) recommends the inclusion
of a control group when calculating the FECR, to adjust for any changes in FECs that
may occur in untreated animals (e.g. when parasites become hypobiotic or the animals’
immune status changes). However, recent publications have questioned whether such a
group is really necessary (Coles et al., 2006), and whether it is ethically correct to leave
part of the flock untreated, especially if parasite infection levels are high (McKenna,
2006).
Another important consideration is whether both pre- and post-treatment FECs
should be included in the FECR calculation, or whether post-treatment FECs suffice to
evaluate the efficacy of the treatment. Dash et al. (1988) suggested including both, to
adjust for low pre-treatment counts, while Coles et al. (1992) described post-treatment
FECs as sufficient to calculate the drug efficacy. McKenna (2006) found that, using
arithmetic means, there was no significant difference in the estimate when both pre- and
post-treatment FECs were used, compared to only post-treatment FECs, and therefore
suggested that the latter simpler method could be used as this would reduce the number
of fecal samples required, reducing the overall cost of the FECRT.
24
More recently, authors have discussed the analytical sensitivity of the tests used to
estimate FECs, and the effect this may have on the overall FECR estimate (El-Abdellati
et al., 2010; Levecke et al., 2011; Levecke et al., 2012b). A diagnostic method
commonly used for determining FECs is the modified McMaster technique, since it is
fast and easy to perform (Ministry of Agriculture, Fisheries and Food, 1986). However,
this test has a minimum detection limit ranging from 10 to 50 eggs per gram (epg)
(Levecke et al., 2012a), which may introduce a bias when calculating FEC reductions
(El-Abdellati et al., 2010), especially when the baseline FEC is low (Levecke et al.,
2012a). Therefore, the use of more sensitive tests such as the FECPAK techniques
(detection limit = 10 epg) or FLOTAC® technique (detection limit = 1-2 epg) is often
recommended (El-Abdellati et al., 2010; Torgerson et al., 2012) to improve test accuracy,
while repeated FEC measurements could improve the test precision (Kaplan and
Vidyashankar, 2012).
Since the FECRT outcome may be influenced by all the aforementioned factors,
there is a need to standardize both the FEC diagnostic methods and the FECR
calculations used (Coles et al., 2006; Denwood et al., 2010; Knox et al., 2012), to avoid
misclassification of the farm resistance status (Torgerson et al., 2005).
1.4.2 Larval Development Assay
Larval Development Assays (LDAs) are in vitro tests used to determine
anthelmintic susceptibility (Taylor, 1990; Coles et al., 2006; Howell et al., 2008). These
tests determine the effect of anthelmintics on the GIN development process, by exposing
GIN eggs or L1s to different anthelmintic concentrations in separate test wells, and
25
counting the number of L3s that develop within each well after 7-10 days (Jabbar et al.,
2006).
LDAs are more sensitive diagnostic tests compared to the FECRT, as they can
detect AR when 10% of the parasite population expresses resistance (Jabbar et al., 2006;
Papadopoulos, 2008), therefore providing early warning of an impending resistance
problem (Roush and Tabashnik, 1990; Taylor et al., 2009). Moreover, LDAs are rapid
(Taylor et al., 2002), can be easily replicated and standardized (Sangster and Gill, 1999),
and only require one set of fecal samples (Diéz-Baños et al., 2008). On the other hand,
LDAs require a high level of technical expertise (Kaplan and Vidyashankar, 2012), and,
given that they are in vitro tests, they ignore the pharmacodynamics and
pharmacokinetics of the anthelmintic within the host (Sangster and Gill, 1999; Sargison,
2011a).
An ideal laboratory bioassay should generate data that correlate closely with the
standard FECRT field test (Roush and Tabashnik, 1990; Coles et al., 2006), thereby
providing an easier and faster way to diagnose AR on sheep farms. While a few studies
have been performed to compare different in vitro tests (e.g. egg hatch assay, larval
mobility tests and LDAs) and the FECRT (Craven et al., 1999; Königová et al., 2003;
Wolstenholme et al., 2004; Diéz-Baños et al., 2008), these have provided discordant
results, and therefore more research is required to investigate the correlation between in
vivo and in vitro tests (Coles et al., 2006).
26
1.5 Thesis objectives
The overall goal of this thesis was to elucidate important epidemiological features
of GIN parasitism in Ontario sheep flocks, including the PPER, overwintering of GIN on
pasture, the prevalence of AR, and risk factors associated with AR.
The specific objectives of this thesis were:
1. To determine: (a) whether ewes that lamb out-of-season experience a PPER, (b)
whether ewes either not bred or in early gestation during the spring season experience an
increase in fecal egg shedding at that time, related to seasonal effects, and (c) whether
total plasma protein and packed cell volume levels are associated with the PPER (Chapter
2).
2. (a) To describe the environmental factors that may affect the over-wintering
survival of GIN on three commercial sheep farms in south-western Ontario; and (b) to
determine if Haemonchus contortus larvae are able to over-winter on pasture and/or soil
under central Canadian winter conditions, and are capable of establishing a patent
infection in naïve tracer lambs the following spring (Chapter 3).
3. (a) To determine the frequency of ivermectin treatment failure, and the
frequency of resistance to ivermectin, fenbendazole and levamisole using a FECRT; and
(b) to assess the frequency of resistance to thiabendazole and levamisole using a LDA
(Chapter 4).
4. To: (a) compare the FECR percentages obtained using different formulae, for
resistance to ivermectin, fenbendazole, and levamisole; and (b) compare categorized
27
results obtained with the FECRT and LDA for resistance to benzimidazoles and
levamisole (Chapter 5).
5. (a) To describe parasite control and farm management practices commonly
used on Ontario sheep farms; and (b) to determine whether any of these practices are
associated with the presence of resistance to ivermectin, fenbendazole or levamisole
(Chapter 6).
28
1.6 References
Abbott, K.A., Taylor, M.A., Stubbings, L.A., 2009. Sustainable worm control strategies
for sheep. 3rd
Ed. A technical manual for veterinary surgeons and advisers. 51pp.
Published by: Sustainable Control of Parasites in Sheep (SCOPS) and printed by:
Context Publications. Available from: www.nationalsheep.org.uk.
Adams, H.R., 2001. Veterinary Pharmacology and Therapeutics. 8th
Ed (ISBN-13: 978-0-
8138-1743-9). Blackwell Publishing Professional, Iowa 50014-8300, pp. 947-980.
Ayalew, L., Gibbs, H.C., 1973. Seasonal fluctuations of nematode populations in
breeding ewes and lambs. Can. J. Comp. Med. 37, 79-89.
Barger, I.A., 1999. The role of epidemiological knowledge and grazing management for
helminth control in small ruminants. Int. J. Parasitol. 29, 41-47.
Barnes, E.H., Dobson, R.J., Barger, I.A., 1995. Worm control and Anthelmintic
Resistance: Adventures with a model. Parasitol. Today 11, 56-63.
Bartley, D.J., Jackson, E., Johnston, K., Coop, R.L., Mitchell, G.B.B., Sales, J., Jackson,
F., 2003. A survey of anthelmintic resistant nematode parasites in Scottish sheep
flocks. Vet. Parasitol. 117, 61-71.
Bath, G.F., Van Wyk, J.A., 2009. The Five Point Check©
for targeted selective treatment
of internal parasites in small ruminant. Small Rum. Res. 86, 6-13.
Beasley, A.M., Kahn, L.P., Windon, R.G., 2010. The periparturient relaxation of
immunity in Merino ewes infected with Trichostrongylus colubriformis:
Parasitological and immunological responses. Vet. Parasitol. 168, 60-70.
Beasley, A.M., Kahn, L.P., Windon, R.G., 2012. The influence of reproductive
physiology and nutrient supply on the periparturient relaxation of immunity to the
gastrointestinal nematode Trichostrongylus colubriformis in Merino ewes. Vet.
Parasitol. 188, 306-324.
Bentounsi, B., Meradi, S., Cabaret, J., 2012. Towards finding effective indicators
(diarrhoea and anaemia scores and weight gains) for the implementation of targeted
selective treatment against the gastro-intestinal nematodes in lambs in a steppic
environment. Vet. Parasitol. 187, 275-279.
Besier, R.B., 2012. Refugia-based strategies for sustainable worm control: Factors
affecting the acceptability to sheep and goat owners. Vet. Parasitol. 186, 2-9.
Besier, R.B., Love, S.C.J., 2004. Anthelmintic resistance in sheep nematodes in
Australia: the need for new approaches. Aust. J. Exp. Agr. 43, 1383-1391.
29
Blitz, N.M., Gibbs, H.C., 1972. Studies on the arrested development of Haemonchus
contortus in sheep–I. The induction of arrested development. Int. J. Parasitol. 2, 5-
12.
Burgess, C.G.S., Bartley, Y., Redman, E., Skuce, P., Nath, M., Whitelaw, A., Tait, A.,
Gilleard, J.S., Jackson, F., 2012. A survey of trichostrongylid nematode species
present on UK sheep farms and associate anthelmintic control practices. Vet.
Parasitol. 189, 299-307.
Cabaret, J., Berrag, B., 2004. Fecal egg count reduction test for assessing anthelmintic
efficacy: average versus individually based estimations. Vet. Parasitol. 121, 105-
113.
Cabaret, J., Benoit, M., Laignel, G., Nicourt, C., 2009. Current management of farms and
internal parasites by conventional and organic meat sheep French farmers and
acceptance of targeted selective treatments. Vet. Parasitol. 164, 21-29.
Callinan, A.P.L., Westcott, J.M., 1986. Vertical distribution of trichostrongylid larvae on
herbage and in soil. Int. J. Parasitol. 16, 241-244.
Calvete, C., Calavia, R., Ferrer, L.M., Ramos, J.J., Lacasta, D., Uriarte, J., 2012.
Management and environmental factors related to benzimidazole resistance in
sheep nematodes in Northeast Spain. Vet. Parasitol. 184, 193-203.
Cezar, A.S., Toscan, G., Camillo, G., Sangioni, L.A., Ribas, H.O., Vogel, F.S.F., 2010.
Multiple resistance of gastrointestinal nematodes to nine different drugs in a sheep
flock in southern Brazil. Vet. Parasitol. 173, 157-160.
Coles, G.C., 2001. The future of veterinary parasitology. Vet. Parasitol. 98, 31-39.
Coles, G.C., Bauer, C., Borgsteede, F.H.M., Geerts, S., Klei, T.R., Taylor, M.A., Waller,
P.J., 1992. World Association for the Advancement of Veterinary Parasitology
(W.A.A.V.P.) methods for the detection of anthelmintic resistance in nematodes of
veterinary importance. Vet. Parasitol. 44, 35-44.
Coles, G.C., Jackson, F., Pomroy, W.E., Prichard, R.K., von Samson-Himmelstjerna, G.,
Silvestre, A., Taylor, M.A., Vercruysse, J., 2006. The detection of anthelmintic
resistance in nematodes of veterinary importance. Vet. Parasitol. 136, 167-185.
Compendium of Veterinary Products, Canada, 2012. Available from:
http://csf.naccvp.com/?u=country&p=msds. [Accessed: 16th
March, 2012]
Coop, R.L., Holmes, P.H., 1996. Nutrition and parasite interaction. Int. J. Parasitol. 26,
951-962.
Coop, R.L., Kyriazakis, I., 1999. Nutrition-parasite interaction. Vet. Parasitol. 84, 187-
204.
30
Craven, J., Bjorn, H., Barnes, E.H., Henriksen, S.A., Nansen, P., 1999. A comparison of
in vitro tests and a faecal egg count reduction test in detecting anthelmintic
resistance in horse strongyles. Vet. Parasitol. 85, 49-59.
Cringoli, G., Rinaldi, L., Veneziano, V., Mezzino, L., Vercruysse, J., Jackson, F., 2009.
Evaluation of targeted selective treatments in sheep in Italy: effects on faecal worm
egg count and milk production in four case studies. Vet. Parasitol. 164, 36-43.
Dash, K., Hall, K., Barger, I.A., 1988. The role of arithmetic and geometric worm egg
counts in faecal egg count reduction tests and in monitoring strategic drenching
programs in sheep. Aust. Vet. J. 65, 66-68.
Denwood, M., Reid, S.W.J., Love, S., Nielsen, M.K., Matthews, L., McKendrick, I.J.,
Innocent, G.T., 2010. Comparison of three alternative methods for analysis of
equine Faecal Egg Count Reduction Test data. Prev. Vet. Med. 93, 316-323.
Díez-Baños, P., Pedreira, J., Sánchez-Andrade, R., Francisco, I., Suárez, J.L., Díaz, P.,
Panadero, R., Arias, M., Painceira, A., Paz-Silva, A., Morrondo, P., 2008. Field
evaluation for anthelmintic-resistance ovine gastrointestinal nematodes by in vitro
and in vivo assays. J. Parasitol. 94, 925-928.
Dobson, R.J., Le Jambre, L.F., Gill, J.H., 1996. Management of anthelmintic resistance:
Inheritance of resistance and selection with persistent drugs. Int. J. Parasitol. 26,
993-1000.
Dobson, R.J., Sangster, N.C., Besier, R.B., Woodgate, R.G., 2009. Geometric means
provide a biased efficacy result when conducting a faecal egg count reduction test
(FECRT). Vet. Parasitol. 161, 162-167.
Dobson, R.J., Hosking, B.C., Jacobson, C.L., Cotter, J.L., Besier, R.B., Stein, P.A., Reid,
S.A., 2012. Preserving new anthelmintics: A simple method for estimating faecal
egg count reduction test (FECRT) confidence limits when efficacy and/or nematode
aggregation is high. Vet. Parasitol. 186, 79-92.
Dohoo, I., Martin, W., Stryhn, H., 2009. Veterinary Epidemiologic Research – Model-
Building Strategies (ISBN: 978-0-919013-60-5). 2nd Ed. VER Inc., Charlottetown,
Prince Edward Island, Canada, C1A 8X5. pp. 365-390.
Donaldson, J., van Houtert, M.F.J., Sykes, A.R., 1998. The effect of nutrition on the
periparturient parasite status of mature ewes. Anim. Sci. 67, 523–533.
Dunsmore, J.D., 1965. Ostertagia spp. in lambs and pregnant ewes. J. Helminth. 39, 159-
184.
El-Abdellati, A., Charlier, J., Geldhof, P., Levecke, B., Demeler, J., von Samson-
Himmelstjerna, G., Claerebout, E., Vercruysse, J., 2010. The use of a simplified
faecal egg count reduction test for assessing anthelmintic efficacy on Belgian and
German cattle farms. Vet. Parasitol. 169, 352-357.
31
Ellenby, C., 1968. Dormancy and survival in nematodes. Symp. Soc. Exp. Biol. 23, 83-
97.
Familton, A., McAnulty, R., 1994. Sheep nematode larval survival: the epidemiological
consequences of findings from recent studies. Proceedings of the Society of Sheep
and Beef Cattle Veterinarians of the New Zealand Veterinary Association, Annual
Seminar. pp. 185-195.
Fleming, J., 2008. Exciting times for the Canadian Sheep Industry. From the flock 5, 1-2.
Gallidis, E., Papadopoulos, E., Ptochos, S., Arsenos, G., 2009. The use of targeted
selective treatments against gastrointestinal nematodes in milking sheep and goats
in Greece based on parasitological and performance criteria. Vet. Parasitol. 164, 53-
58.
Gallidis, E., Angelopoulou, K., Papadopoulos, E., 2012. First identification of
benzimidazole resistant Haemonchus contortus in sheep in Greece. Small Rum.
Res. 106, 27-29.
Gill, J.H., Lacey, E., 1998. Avermectin/milbemycin resistance in trichostrongylid
nematodes. Int. J. Parasitol. 28, 863-877.
Glauser, J., Fernandez, S., Menzies, P., Peregrine, A.S., 2007. Multiple anthelmintic
resistance in an Ontario sheep flock. In: 22nd Annual General Meeting, Ontario
Sheep Marketing Agency, Guelph, Ontario, 26th–27th October, 2007.
Gordon, H.M., 1948. The epidemiology of parasitic diseases, with special reference to
studies with nematode parasites of sheep. Aust. Vet. J. 24, 17-45.
Grimshaw, W.T.R., Hunt, K.R., Hong, C., Coles, G.C., 1994. Detection of anthelmintic
resistant nematodes in sheep in southern England by a faecal egg count reduction
test. Vet. Rec. 135, 372-374.
Hansen, J.W., Perry, B., 1990. A handbook. The epidemiology, diagnosis and control of
helminth parasites of ruminants. International Laboratory for Research on Animal
Diseases (ILRAD), Nairobi, Kenya. Pages 17-25.
Health Canada – Drug Product Database Online Query, 2012. Available from:
http://webprod3.hc-sc.gc.ca/dpd-bdpp/index-eng.jsp [Accessed: 25th June, 2012]
Houdijk, J.G.M., 2008. Influence of periparturient nutritional demand on resistance to
parasites in livestock. Parasite Immun. 30, 113-121.
Houdijk, J.G.M., 2012. Differential effects of protein and energy scarcity on resistance to
nematode parasites. Small Rum. Res. 103, 41-49.
Houdijk, J.G.M., Jessop, N.S., Kyrisazakis, I., 2001. Nutrient partitioning between
reproductive and immune functions in animals. P. Nutr. Soc. 60, 515-525.
32
Howell, S.B., Burke, J.M., Miller, J.E., Terrill, T.H., Valencia, E., Williams, M.J.,
Williamson, L.H., Zajac, A.M., Kaplan, R.M., 2008. Prevalence of anthelmintic
resistance on sheep and goat farms in the southeastern United States. J. Am. Vet.
Med. Assoc. 233, 1913-1919.
Hughes, P.L., Dowling, A.F., Callinan, A.P.L., 2007. Resistance to macrocyclic lactone
anthelmintics and associated risk factors on sheep farms in the lower North Island
of New Zealand. N. Z. Vet. J. 55, 177-183.
Jabbar, A., Iqbal, Z., Kerboeuf, D., Muhammad, G., Khan, M.N., Afaq, M., 2006.
Anthelmintic resistance: The state of play revisited. Life Sci. 79, 2413-2431.
Jackson, F., Coop, R.L., 2000. The development of anthelmintic resistance in sheep
nematodes. Parasitology 120, 95-107.
Jackson, F., Miller, J., 2006. Alternative approaches to control – Quo vadit? Vet.
Parasitol. 139, 371-384.
Jeffcoate, I.A., Holmes, P.H., 1992. Pathophysiology of the periparturient egg rise in
sheep: a possible for IgA. Res. Vet. Sci. 53, 212-218.
Kaminsky, R., Ducray, P., Jung M., Clover, R., Rufener, L., Bouvier, J., Weber, S.S.,
Wenger, A., Wieland-Berghausen, S., Goebel, T., Gauvry, N., Pautrat, F., Skripsky,
T., Froelich, O., Komoin-Oka, C., Westlund, B., Sluder, A., Mäser, P., 2008. A new
class of anthelmintics effective against drug-resistant nematodes. Nature 452, 176-
180.
Kaplan, R.M., 2004. Drug resistance in nematodes of veterinary importance: a status
report. Trends Parasitol. 20, 477-481.
Kaplan, R.M., Vidyashankar, A.N., 2012. An inconvenient truth: Global worming and
anthelmintic resistance. Vet. Parasitol. 186, 70-78.
Kaplan, R.M., Burke, J.M., Terrill, T.H., Miller, J.E., Getz, W.R., Mobini, S., Valencia,
E., Williams, M.J., Williamson, L.H., Larsen, M., 2004. Validation of the
FAMACHA©
eye color chart for detecting clinical anemia in sheep and goats on
farms in the southern United States. Vet. Parasitol. 123, 105-120.
Kenyon, F., Jackson, F., 2012. Targeted flock/herd and individual ruminant treatment
approaches. Vet. Parasitol. 186, 10-17.
Kenyon, F., Greer, A.W., Coles, G.C., Cringoli, G., Papadopoulos, E., Cabaret, J.,
Berrag, B., Varady, M., Van Wyk, J.A., Thomas, E., Vercruysse, J., Jackson, F.,
2009. The role of targeted selective treatments in the development of refugia-based
approaches to the control of gastrointestinal nematodes of small ruminants. Vet.
Parasitol. 164, 3-11.
Knox, M.R., Besier, R.B., Le Jambre, L.F., Kaplan, R.M., Torres-Acosta, J.F.J., Miller,
J., Sutherland, I., 2012. Novel approaches for the control of helminth parasites of
33
livestock VI: Summary of discussions and conclusions. Vet. Parasitol. 186, 143-
149.
Königová, A., Váraday, M., Čorba, J., 2003. Comparison of in vitro methods and faecal
egg count reduction test for the detection of benzimidazole resistance in small
strongyles of horses. Vet. Res. Comm. 27, 281-288.
Krecek, R.C., Groeneveld, H.T., Maritz, J.I., 1992. A preliminary study of the effect of
microclimate on third-stage larvae of Haemonchus contortus and Haemonchus
placei on irrigated pasture. Int. J. Parasitol. 22, 747-752.
Lacey, E., Gill, J.H., 1994. Biochemistry of benzimidazole resistance. Acta Tropica 56,
245-262.
Le Jambre, L.F., Royal, W.M., Martin, P.J., 1979. The inheritance of thiabendazole
resistance in Haemonchus contortus. Parasitol. 78, 107-119.
Le Jambre, L.F., Gill, J.H., Lenane, I.J., Baker, P., 2000. Inheritance of avermectin
resistance in Haemonchus contortus. Int. J. Parasitol. 30, 105-111.
Leathwick, D.M., Vlassoff, A., Barlow, N.D., 1995. A model for nematodiasis in New
Zealand lambs: the effect of drenching regime and grazing management on the
development of anthelmintic resistance. Int. J. Parasitol. 25, 1479-1490.
Leathwick, D.M., Pomroy, W.E., Heath, A.C.G., 2001. Anthelmintic resistance in New
Zealand. N. Z. Vet. J. 49, 227-235.
Leathwick, D.M., Miller, C.M., Atkinson, D.S., Haack, N.A., Alexander, R.A., Oliver, A-
M., Waghorn, T.S., Potter, J.F., Sutherland, I.A., 2006. Drenching adult ewes:
Implications of anthelmintic treatments pre- and post-lambing on the development
of anthelmintic resistance. N. Z. Vet. J. 54, 297-304.
Leathwick, D.M., Miller, C.M., Atkinson, D.S., Haack, N.A., Waghorn, T.S., Oliver, A-
M., 2008. Managing anthelmintic resistance: Untreated adult ewes as a source of
unselected parasites, and their role in reducing parasite populations. N. Z. Vet. J.
56, 184-195.
Levecke, B., Rinaldi, L., Charlier, J., Maurelli, M.P., Morgoglione, M.E., Vercruysse, J.,
Cringoli, G., 2011. Monitoring drug efficacy against gastrointestinal nematodes
when faecal egg counts are low: do the analytic sensitivity and the formula matter?
Parasitol. Res. 109, 953-957.
Levecke, B., Rinaldi, L., Charlier, J., Maurelli, M.P., Bosco, A., Vercruysse, J., Cringoli,
G., 2012a. The bias, accuracy and precision of faecal egg count reduction test
results in cattle using McMaster, Cornell-Wisconsin and FLOTAC egg counting
methods. Vet. Parasitol. 188, 194-199.
Levecke, B., Dobson R.J., Speybroeck, N., Vercruysse, J., Charlier, J., 2012b. Novel
insights in the fecal egg count reduction test for monitoring drug efficacy against
gastrointestinal nematodes of veterinary importance. Vet. Parasitol. 188, 391-396.
34
Love, S.C., Johns, W.J., Coverdale, O.R., 1992. Anthelmintic resistance in sheep
nematodes in New England region of New South Wales. Aust. Vet. J. 69, 196-197.
Maingi, N., Bjorn, H., Dangolla, A., 1998. The relationship between faecal egg count
reduction and the lethal dose 50% in the egg hatch assay and larval development
assay. Vet. Parasitol. 77, 133-145.
Malan, F.S., Van Wyk, J.A., Wessels, C.D., 2001. Clinical evaluation of anaemia in
sheep: Early trials. Onderstepoort J. Vet. Res. 68, 165-174.
Martin, R.J., 1997. Modes of action of anthelmintic drugs. Vet. J. 154, 11-34.
Martin, P.J., Jambre, L.F.L., Claxton, J.H., 1981. The impact of refugia on the
development of thiabendazole resistance in Haemonchus contortus. Int. J. Parasitol.
11, 35 – 41.
Martin, P.J., Anderson, N., Jarrett, R.G., 1989. Detecting benzimidazole resistance with
faecal egg count reduction test and in vitro assays. Aust. Vet. J. 66, 236-240.
Martin, P.J., McKenzie, J.A., 1990. Levamisole resistance in Trichostrongylus
colubriformis: a sex-linked recessive character. Int. J. Parasitol. 20, 867-872.
McKenna, P.B., 1974. The anthelmintic efficacy of thiabendazole and levamisole against
inhibited Haemonchus contortus larvae in sheep. N. Z. Vet. J. 22, 163-166.
McKenna, P.B., 1990. The detection of anthelmintic resistance by the faecal egg count
reduction test: an examination of some of the factors affecting performance and
interpretation. N. Z. Vet. J. 38, 142-147.
McKenna, P.B., 1997. Use of arithmetic and geometric means in the calculation of
anthelmintic efficacy. Vet. Record 141, 472-473.
McKenna, P.B., 2006. A comparison of faecal egg count reduction test procedures. N. Z.
Vet. J. 54, 202-203.
Mederos, A., 2010. Epidemiological studies of gastrointestinal nematodes in sheep flocks
in Ontario and Quebec, Canada. PhD, University of Guelph. Pages 133-160.
Available at: http://udini.proquest.com/view/epidemiological-studies-of-
goid:744049959/
Mederos, A., Fernandes, S., VanLeeuwen, J., Peregrine, A.S., Kelton, D., Menzies, P.,
LeBoeuf, A., Martin, R., 2010. Prevalence and distribution of gastrointestinal
nematodes on 32 organic and conventional commercial sheep farms in Ontario and
Quebec, Canada (2006 – 2008). Vet. Parasitol. 170, 244-252.
Mejía, M.D., Fernandez, I.B., Schmidt, E.E., Cabaret, J., 2003. Multispecies and multiple
anthelmintic resistance on cattle nematodes in a farm in Argentina: the beginning of
high resistance? Vet. Res. 34, 461-467.
Menzies, P., 2006. The Ontario Sheep Health Program: A structured health management
program for intensively reared flocks. Small Rum. Res. 62, 95-99.
35
Michel, J.F., 1974. Arrested development of nematodes and some related phenomena.
Adv. Parasitol. 12, 279-366.
Michel, J.F., 1976. The epidemiology and control of some nematode infections in grazing
animals. Adv. Parasitol. 14, 355-397.
Michel, J.F., 1978. Topical themes in the study of arrested development. In: F.H.M.
Borgsteede (Ed.), Facts and Reflections. III. Workshop on arrested development of
nematodes in sheep and cattle. Held at Central Veterinary Institute, Lelystad, The
Netherlands, 18-19 May 1978. P.O. Box 65, 8200 AB Lelystad, Netherlands, pp. 7
– 17.
Miller, C.M., Waghorn, T.S., Leathwick, D.M., Gilmour, M.L., 2006. How repeatable is
a faecal egg count reduction test? N. Z. Vet J. 54, 323-328.
Miller, C.M., Waghorn, T.S., Leathwick, D.M., Candy, P.M., Oliver, A-M.B., Watson,
T.G., 2012. The production cost of anthelmintic resistance in lambs. Vet. Parasitol.
186, 376-381.
Ministry of Agriculture, Fisheries and Food, 1986. Manual of Veterinary Parasitological
Laboratory Techniques. Ministry of Agriculture, Fisheries and Food, London, pp.1-
65.
Morgan, E.R., van Dijk, J., 2012. Climate and the epidemiology of gastrointestinal
nematode infections of sheep in Europe. Vet. Parasitol. 189, 8-14.
O’Connor, L.J., Walkden-Brown, S.W., Kahn, L.P., 2006. Ecology of the free-living
stages of major trichostrongylid parasites of sheep. Vet. Parasitol. 142, 1-15.
O’Connor, L.J., Kahn, L.P., Walkden-Brown, S.W., 2007. Moisture requirements for the
free-living development of Haemonchus contortus: Quantitative and temporal
effects under conditions of low evaporation. Vet. Parasitol. 150, 128-138.
Ontario Sheep Industry Survey – Composite Report, 2009. Prepared by Fitzgerald and
Co., Ontario, Canada. 36pp.
Osoro, K., Mateos-Sanz, A., Frutos, P., Garcia, U., Ortega-Mora, M., Ferreira, M.M.,
Celaya, R., Ferre, I., 2007. Anthelmintic and nutritional effects of heather
supplementation on Cashmere goats grazing perennial ryegrass-white clover. J.
Anim. Sci. 85, 861-870.
Papadopoulos, E., 2008. Anthelmintic resistance in sheep nematodes. Small Rumin. Res.
76, 99-103.
Papadopoulos, E., Gallidis, E., Ptochos, S., 2012. Anthelmintic resistance in sheep in
Europe: A selected review. Vet. Parasitol. 189, 85-88.
Presidente, P.J.A., 1985. Methods for detection of resistance to anthelmintics. In:
Anderson, N., Waller, P.J. (Eds.), Resistance in Nematodes to Anthelmintic Drugs.
CSIRO Division of Animal Health, Glebe, NSW, Australia, pp. 13-28.
36
Prichard, R.K., Hall, C.A., Kelly, J.D., Martin, I.C.A., Donald, A.D., 1980.The problem
of anthelmintic resistance in nematodes. Aust. Vet. J. 56, 239-250.
Radostits, O.M., Gay, C.C., Hinchcliff, K.W., Constable, P.D., 2007. Veterinary
Medicine. A textbook of the diseases of cattle, horses, sheep, pigs and goats. Tenth
edition. Saunders, Elsevier Limited. pp. 1613-1691.
Reynecke, D.P., Waghorn, T.S., Oliver, A.M.B., Miller, C.M., Vlassoff, A., Leathwick,
D.M., 2011. Dynamics of the free-living stages of sheep intestinal parasites on
pasture in the North Island of New Zealand. 2. Weather variables associated with
development. N.Z. Vet. J. 59, 287-292.
Roush, R.T., Tabashnik, B., 1990. Pesticide resistance in arthropods (ISBN: 0-412-
01971-X). Chapman and Hall Inc., London, United Kingdom, pp. 4-38.
Ruiz-Lancheros, E., Via, C., Francis, T.N., Geary, T.G., 2011. Activity of novel nicotinic
anthelmintics in cut preparations of Caenorhabditis elegans. Int. J. Parasitol. 41,
455-461.
Sangster, N.C., 1999. Anthelmintic resistance: past, present and future. Int. J. Parasitol.
29, 115-124.
Sangster, N.C., Gill, J., 1999. Pharmacology of anthelmintic resistance. Parasitol. Today
15, 141-146.
Sangster, N.C., Redwin, J.M., Bjorn, H., 1998a. Inheritance of levamisole and
benzimidazole resistance in an isolate of Haemonchus contortus. Int. J. Parasitol.
28, 503-510.
Sangster, N.C., Riley, F.L., Wiley, L.J., 1998b. Binding of [3H]m-aminolevamisole to
receptors in levamisole-susceptible and –resistant Haemonchus contortus. Int. J.
Parasitol. 28, 707-717.
Santos, M.C., Silva, B.F., Amarante, A.F.T., 2012. Environmental factors influencing the
transmission of Haemonchus contortus. Vet. Parasitol. 188, 277-284.
Sargison, N.D., 2008. Sheep flock health: a planned approach (ISBN: 978-1-4051-6044-
5). Blackwell Publishing Ltd., Oxford, United Kingdom, pp. 149-191.
Sargison, N.D., 2011a. Pharmaceutical Control of Endoparasitic Helminth Infections in
Sheep. Vet. Clin. Food Anim. 27, 139-156.
Sargison, N., 2011b. Responsible use of anthelmintics for nematode control in sheep and
cattle. In Practice 33, 318-327.
Sargison, N.D., 2012. Pharmaceutical treatments of gastrointestinal nematode infections
of sheep-future of anthelmintic drugs. Vet. Parasitol. 189, 79-84.
Sargison, N.D., Wilson, D.J., Bartley, D.J., Penny, C.D., Jackson, F., 2007.
Haemonchosis and teladorsagiosis in a Scottish sheep flock putatively associated
37
with the overwintering of hypobiotic fourth stage larvae. Vet. Parasitol. 147, 326-
331.
Sargison, N.D., Jackson, R., Wilson, D.J., Bartley, D.J., Penny, C.D., Gilleard, J.S., 2010.
Characterisation of milbemycin-, avermectin-, imidazothiazole- and benzimidazole-
resistant Teladorsagia circumcincta from a sheep flock. Vet. Rec. 166, 681-686.
Smith, H.J., Archibald, R.M., 1965. The overwinter survival of ovine gastro-intestinal
parasites in the Maritime Provinces. Can. Vet. J. 6, 257-266.
Smothers, C.D., Sun, F., Dayton, A.D., 1999. Comparison of arithmetic and geometric
means as measures of a central tendency in cattle nematode populations. Vet.
Parasitol. 81, 211-224.
Sréter, T., Molnár, V., Kassai, T., 1994. The distribution of nematode egg counts and
larval counts in grazing sheep and their implication for parasite control. Int. J.
Parsitol. 24, 103-108.
Stafford, K.A., Morgan, E.R., Coles, G.C., 2009. Weight-based targeted selective
treatment of gastrointestinal nematodes in a commercial sheep flock. Vet. Parasitol.
164, 59-65.
Statistics Canada, 2012. Available at:
http://www.statcan.gc.ca/tables-tableaux/sum-som/l01/cst01/prim52g-eng.htm
[Accessed: 7th August, 2012]
Stear, M.J., Bairden, K., Duncan, J.L., Holmes, P.H., McKellar, Q.A., Park, K., Strain, S.,
Murray, M., Bishop, S.C., Gettinby, G., 1997. How hosts control worms. Nature
389, 27.
Stear, M.J., Bairden, K., Bishop, S.C., Gettinby, G., McKellar, Q.A., Park, M., Strain, S.,
Wallace, D.S., 1998. The processes influencing the distribution of parasitic
nematodes among naturally infected lambs. Parasitol. 117, 165-171.
Stear, M.J., Singleton, D., Matthews, L., 2011. An evolutionary perspective on
gastrointestinal nematodes of sheep. J. Helminth. 85, 113-120.
Stromberg, B.E., 1997. Environmental factors influencing transmission. Vet. Parasitol.
72, 247-264.
Sutherland, I., Scott, I., 2010. Gastrointestinal nematodes of sheep and cattle. Biology
and control. John Wiley and Sons Ltd, West Sussex, UK. Pages 1-160.
Taylor, E.L., 1935. Seasonal fluctuation in the number of eggs of trichostrongylid worms
in the faeces of ewes. J. Parasitol. 21, 175-179.
Taylor, M.A., 1990. A larval development test for the detection of anthelmintic resistance
in nematodes of sheep. Res. Vet. Sci. 49, 198-202.
Taylor, M.A., 2009. Changing patterns of parasitism in sheep. In Practice 31, 474-483.

38
Taylor, M.A., 2012a. Emerging parasitic diseases of sheep. Vet. Parasitol. 189, 2-7.
Taylor, M.A., 2012b. SCOPS and COWS – ‘Worming it out of UK farmers’. Vet.
Parasitol. 186, 65-69.
Taylor, M.A., Hunt, K.R., Goodyear, K.L., 2002. Anthelmintic resistance detection
methods. Vet. Parasitol. 103, 183-194.
Taylor, M.A., Coop, R.L., Wall, R.L., 2007. Veterinary Parasitology. 3rd
Ed. Blackwell
Publishing, Oxford, UK. pp. 152-162.
Taylor, M.A., Learmount, J., Lunn, E., Morgan, C., Craig, B.H., 2009. Multiple
resistance to anthelmintics in sheep nematodes and comparison of methods used for
their detection. Small Rumin. Res. 86, 67-70.
Torgerson, P.R., Schnyder, M., Hertzberg, H., 2005. Detection of anthelmintic resistance:
a comparison of mathematical techniques. Vet. Parasitol. 128, 291-298.
Torgerson, P.R., Paul, M., Lewis, F.I., 2012. The contribution of simple random sampling
to observed variations in faecal egg counts. Vet. Parasitol. 188, 397-401.
Torres-Acosta, J.F.J., Mendoza-de-Gives, P., Aguilar-Caballero, A.J., Cuéllar-Ordaz,
2012. Anthelmintic resistance in sheep farms: Update of the situation in the
American continent. Vet. Parasitol. 189, 89-96.
Troell, K., Waller, P., Höglund, J., 2005. The development and overwintering survival of
free-living larvae of Haemonchus contortus in Sweden. J. Helminth. 79, 373-379.
Uriarte, J., Llorente, M.M., Valderrábano, J., 2003. Seasonal changes of gastrointestinal
nematode burden in sheep under an intensive grazing system. Vet. Parasitol. 118,
79-92.
van Dijk, J., de Louw, M.D.E., Kalis, L.P.A., Morgan, E.R., 2009. Ultraviolet light
increases mortality of nematode larvae and can explain patterns of larval
availability at pasture. Vet. Parasitol. 39, 1151-1156.
van Dijk, J., Sargison, N.D., Kenyon, R., Skuce, P.J., 2010. Climate change and
infectious disease: helminthological challenges to farmed ruminants in temperate
regions. Animal 4, 377-392.
van Wyk, J., 2001. Refugia – overlooked as perhaps the most potent factor concerning the
development of anthelmintic resistance. Onderstepoort J. Vet. 68, 55-67.
van Wyk, J.A., Bath, G.F., 2002. The FAMACHA©
system for managing haemonchosis
in sheep and goats by clinically identifying individual animals for treatment. Vet.
Res. 33, 509-529.
van Wyk, J.A., Hoste, H., Kaplan, R.M., Besier, R.B., 2006. Targeted selective treatment
for worm management – How do we sell rational programs to farmers? Vet.
Parasitol. 139, 336-346.
39
Veglia, 1915. The anatomy and life-history of Haemonchus (strongylus) contortus
(Rud.). Union of South Africa. Third and Fourth Reports of Director of Veterinary
Research. pp. 369-423.
Vidyashankar, A.N., Handlon, B.M., Kaplan, R.M., 2012. Statistical and biological
considerations in evaluating drug efficacy in equine strongyle parasites using fecal
egg count data. Vet. Parasitol. 185, 45-56.
Voigt, K., Scheuerle, M., Hamel, D., 2012. Triple anthelmintic resistance in
Trichostrongylus spp. in a German sheep flock. Small Rum. Res. 106, 30-32.
Waghorn, T.S., Leathwick, D.M., Rhodes, A.P., Lawrence, K.E., Jackson, R., Pomroy,
W.E., West, D.M., Moffat, J.R., 2006. Prevalence of anthelmintic resistance on
sheep farms in New Zealand. N.Z. Vet. J. 54, 271-277.
Waghorn, T.S., Leathwick, D.M., Miller, C.M., Atkinson, D.S., 2008. Brave or gullible:
Testing the concept that leaving susceptible parasites in refugia will slow the
development of anthelmintic resistance. N. Z. Vet. J. 56, 158-163.
Waghorn, T.S., Miller, C.M., Oliver, A-M.B., Leathwick, D.M., 2009. Drench-and-shift
is a high risk practice in the absence of refugia. N. Z. Vet. J. 57, 359-363.
Waghorn, T.S., Oliver, A-M.B., Miller, C.M., Leathwick, D.M., 2010. Acquired
immunity to endoparasites in sheep interacts with anthelmintic treatment to
influence selection for anthelmintic resistance. N. Z. Vet. J. 58, 98-102.
Waghorn, T.S., Reynecke, D.P., Oliver, A.M.B., Miller, C.M., Vlassoff, A., Koolaard,
J.P., Leathwick, D.M., 2011. Dynamics of the free-living stages of sheep intestinal
parasites on pasture in the North Island of New Zealand. 1. Patterns of seasonal
development. N.Z. Vet. J. 59, 279-286.
Waller, P.J., Echevarria, F., Eddi, C., Maciel, S., Nari, A., Hansen, J.W., 1996. The
prevalence of anthelmintic resistance in nematode parasites of sheep in Southern
Latin America: General overview. Vet. Parasitol. 62, 181-187.
Waller, P.J., Rudby-Martin, L., Ljungström, B.L., Rydzik, A., 2004. The epidemiology of
abomasal nematodes of sheep in Sweden, with particular reference to over-winter
survival strategies. Vet. Parasitol. 122, 207-220.
Waller, P.J., Rydzik, A., Ljungström, B.L., Törnquist, M., 2006. Towards the eradication
of Haemonchus contortus from sheep flocks in Sweden. Vet. Parasitol. 136, 367-
372.
Wolstenholme, A.J., Fairweather, I., Prichard, R., von Samson-Himmelstjerna, G.,
Sangster, N.C., 2004. Drug resistance in veterinary helminths. Trends Parasitol. 20,
469-476.
Wood, I.B., Amaral, N.K., Bairden, K., Duncan, J.L., Kassai, T., Malone, J.B. Jr.,
Pankavich, J.A., Reinecke, R.K., Slocombe, O., Taylor, S.M., Vercruysse, J., 1995.
World Association for the Advancement of Veterinary Parasitology (W.A.A.V.P.)

40
second edition of guidelines for evaluating the efficacy of anthelmintic in ruminants
(bovine, ovine, caprine). Vet. Parasitol. 58, 181-213.
Woodgate, R.G., Love, S., 2012. WormKill to WormBoss – Can we sell sustainable
sheep worm control? Vet. Parasitol. 186, 51-57.
World Maps of Köppen-Geiger Climate Classification, 2012. Available at:
http://koeppen-geiger.vu-wien.ac.at/usa.htm [Accessed: 5th July, 2012].
Zajac, A.M., 2006. Gastrointestinal Nematodes of Small Ruminants: Life Cycle,
Anthelmintics, and Diagnosis. Vet. Clin. Food Anim. 22, 529-541.
Zawadowsky, M.M., Zvjaguintzev, S.N., 1933. The seasonal fluctuation in the number of
eggs of Nematodirus spp. in feces. J. Parasitol. 19, 269-279.
41
CHAPTER TWO
A longitudinal study on the effect of lambing season on the periparturient egg rise in
Ontario sheep flocks
Accepted for publication in Preventive Veterinary Medicine
Abstract
The epidemiology of the periparturient egg rise (PPER) of gastrointestinal nematodes
(GIN) in sheep remains unclear, and may be influenced by the lambing season. This
longitudinal study was performed to determine the effect of out-of-season lambing on the
PPER in ewes in Ontario, and whether Total Plasma Protein (TPP) and Packed Cell
Volume (PCV) were associated with the PPER. Six farms that practiced out-of-season
lambing were enrolled, and sampled for three consecutive lambing seasons (winter,
spring and autumn). For each lambing season, all farms were visited five times. On the
first visit for each lambing season, 15-20 pregnant ewes and 15-20 non-pregnant/early
gestation ewes were randomly selected. At each visit, fecal samples were collected from
all selected animals and processed individually to measure GIN fecal egg counts (FEC).
Blood samples were collected on three visits in each lambing period and processed to
measure TPP and PCV. The ewes were classified into one of five production stages
(maintenance [i.e. not pregnant], early or late gestation [<120d and ≥120d, respectively],
and early or late lactation [<40d and ≥40d, respectively]) based on information collected
during farm visits. Linear mixed models were developed for the TPP, PCV and
logarithmic-transformed FEC (lnFEC). During the winter and spring lambing season, the
FECs increased gradually over the gestation period and peaked during lactation, with
42
these increases being larger in ewes with a low PCV (three-way interaction in the final
model). In the autumn lambing season, the FECs started off higher in early gestation, and
increased rapidly to peak in late gestation, particularly for animals with low PCV levels.
In the TPP model, PCV and lnFEC were positively associated with TPP. During both
autumn and winter lambing seasons, the TPP decreased from maintenance throughout
gestation and early lactation, followed by an increase in late lactation, except for when
there were high FECs. During the spring lambing season, TPP peaked at early gestation,
and then decreased in late gestation, to increase more gradually over lactation. In the
PCV model, PCV increased with TPP and decreased exponentially with increases in
lnFEC. The PPER occurred during all three lambing seasons, and its magnitude and
distribution varied with the lambing season, suggesting that the PPER in ewes depends on
both environmental and animal physiological factors, an important consideration when
implementing preventive parasite control strategies on sheep farms that practice out-of-
season lambing.
Keywords: Gastro-intestinal nematodes; periparturient egg rise; out-of-season lambing
2.1 Introduction
Gastrointestinal nematodes (GINs) are a leading cause of clinical disease and
death in grazing sheep worldwide, hindering both sheep production and profitability
(Sutherland and Scott, 2010). In Ontario, Canada, the most predominant GIN genera are
Teladorsagia circumcincta, Haemonchus contortus and Trichostrongylus spp. (Mederos
et al., 2010).
43
The periparturient egg rise (PPER) observed in the spring in temperate climate
countries is a major source of GIN pasture contamination for both lambs and ewes
(Barger, 1999). Moreover, it may sometimes result in an acute Type II syndrome,
whereby parasites that survived the winter in the host as arrested larvae resume
development, resulting in a sudden onset of clinical signs in late winter and early spring
(Taylor et al., 2007).
There are conflicting ideas on the cause, and occurrence, of increased fecal egg
shedding in ewes. Some authors consider this egg rise to be a seasonal phenomenon,
observed only during the spring months, and independent of the ewes’ productivity stage
(Zawadowsky and Zvjaguintzev, 1933; Brundson, 1964; Gibbs, 1967; Gibbs and Barger,
1986). This so-called “spring rise” (Cvetkovic et al., 1971) has been related to the
increased availability of parasites on pasture in favourable ambient conditions
(Zawadowsky and Zvjaguintzev, 1933), while others have suggested that this could be
due to reactivation of hypobiotic parasites. The arrested development of nematodes has
been described in several studies (Blitz and Gibbs, 1972; Michel, 1974), and the
resumption of parasite development may occur spontaneously or be triggered by seasonal
changes in photoperiod or ambient temperatures (Blitz and Gibbs, 1972).
Other authors believe the fluctuation in egg shedding observed during the
periparturient period is linked to the ewes’ productivity stage, and the endocrine,
immunological, and metabolic changes that ensue (Taylor, 1935; Crofton, 1954;
Brunsdon, 1970; Michel, 1976; Jeffcoate and Holmes, 1990; Coop and Holmes, 1996;
Donaldson, 1998; Beasley et al., 2010b). Crofton (1954) suggested that prolactin may
play a role in the PPER, since it also increased during parturition and lactation, but other

44
studies have indicated that this is most likely an incidental finding (Jeffcoate and Holmes,
1990; Beasley et al., 2010a). Brunsdon (1970) suggested that the PPER may be caused by
a relaxation in immunity during the periparturient period, and work conducted by Beasley
et al. (2010b) showed that changes consistent with a reduction in immunity expression
occur in both pregnant and lactating ewes. These changes in immunity may facilitate the
parasites’ establishment within the host, enhance their prolificacy, and increase their
longevity (Michel, 1976). Houdijk et al. (2001) suggested that a lack of metabolizable
protein may also be a determinant factor in the PPER since both gestation and lactation
are nutritionally demanding periods (Houdijk, 2008), and compete with the hosts’
immune system for available protein. Total plasma protein (TPP) is a useful indicator of
the protein available to the animal, while low Packed Cell Volumes (PCV) are suggestive
of blood and protein loss, which could be a consequence of a parasitic infection
(Radostits et al., 2007). Both TPP and PCV could therefore be useful diagnostic
indicators of the PPER.
Since its first description (Taylor, 1935), the PPER in ewes has been observed in
both temperate (Brunsdon, 1970; Cvetkovic et al., 1971; Beasley et al., 2010b) and
tropical climates (Tembely et al., 1998; Ng’ang’a et al., 2006). More recently, Mederos
et al. (2010) reported an increase in fecal egg shedding in ewes that lambed during the
spring, prior to pasture exposure, on conventional farms in Ontario, Canada. However, a
recent survey conducted by the Ontario Sheep Marketing Agency (OSMA) showed that
32% (148/461) of all respondents, and 65% (34/52) of the respondents with flocks larger
than 300 ewes, practiced out-of-season lambing (Ontario Sheep Industry Survey, 2009).
Consequently, in many flocks in Ontario, ewes lamb throughout the year and not all ewes
45
are pregnant during the spring time. Dunsmore (1965) suggested that both environmental
and physiological factors might be important contributors to the PPER. It is therefore
important to elucidate the epidemiology of fecal egg shedding patterns on Ontario sheep
farms that practice out-of-season lambing, and to identify clinical parameters that might
be associated with the PPER. Ultimately, this would enable us to devise improved
preventive strategies for parasite control on these farms.
The objectives of this study were therefore to determine whether: (i) ewes that
lamb out-of-season experience a PPER; (ii) ewes either not bred or in early gestation
during the spring season experience an increase in fecal egg shedding at that time, related
to seasonal effects, and (iii) TPP and PCV are associated with the PPER. Our hypothesis
was that all ewes lambing out-of-season would experience a PPER, and that ewes not
bred or in early gestation during the spring would experience an increase in fecal egg
shedding related to seasonal effects. Furthermore, we hypothesized that low
concentrations of TPP and PCV would be associated with the PPER.
2.2 Materials and methods
2.2.1 Number and selection of sheep farms
A longitudinal study was conducted between December 2009 and June 2011 in
which six farms were purposively selected in south-western Ontario; the sample size was
dictated by logistical and financial constraints. The farms were selected based on their
willingness to participate in the study, distance from University of Guelph (within a 200
km radius) due to a requirement for frequent sampling, compliance to withhold routine
use of anthelmintics, and known history of GIN parasitism on the farm. The latter was
46
based on the producers’ indication that their local veterinarian had confirmed the
presence of clinical parasitism in their flock. Other inclusion criteria were that farms had
to (i) practice out-of-season lambing, and (ii) have more than 50 ewes in their flock.
During the first year, one farm was lost to follow-up due to personal reasons; another
farm was enrolled as a replacement and a full dataset was collected on that farm.
2.2 Study design
The six farms were visited following a specific schedule, which was set around
the predicted date when 50% of ewes scheduled to lamb that season would have lambed
(“50L”). The 50L was estimated as: date of ram introduction +148 days, based on the
average gestational length in ewes (Senger, 2003). The farms were visited five times for
every lambing period, for three consecutive lambing seasons (winter, spring, autumn).
Specifically, they were visited: six and three weeks before 50L, at 50L, and three and
eight weeks after 50L (Appendix I). These time-points were selected since previous work
has suggested that the PPER occurred between two to four weeks before lambing, and six
to eight weeks after lambing (Abbott et al., 2009). During the winter lambing season,
animals were housed indoors on all six farms. During the spring lambing season, animals
were either housed indoors (Farm E), put on pasture (Farm D and F), or housed indoors
for the first half of the lambing season, and put on pasture for the second half of the
lambing season (Farms A, B and C). In the autumn lambing season, animals were on
pasture for the first half of the lambing season, then housed indoors for the second half of
the lambing season.
47
2.2.3 Animal selection
On the first farm visit of each lambing season, 15 pregnant animals that were due
to lamb that season, and 15 animals that were open or had just been bred, were randomly
selected from the entire sheep flock. The selection was either simple random using a
random number generator, or systematic random, depending on the handling facilities
available. The sample size was based on a recommendation that 10-15 animals per group
are sufficient to detect differences in fecal egg counts (FEC) between groups (Coles et
al., 2006). Animals were identified using ear-tag numbers, and remained in the study for
a lambing season, unless individual ewes were culled or lost their ear tag; lost animals
were not replaced since repeated measurements on the same animal were necessary.
Different animals were selected for each lambing season. After the first lambing season,
the number of animals was increased to 20 animals per group in order to meet or exceed
the recommendation of 10-15 animals per group, even with animals lost to follow-up.
2.2.4 Data collection
At each visit, fecal samples were collected directly from the rectum of each
selected ewe, and the FEC was determined for these individual samples. Blood samples
were collected on three of the five farm visits, per lambing season (3 weeks before 50L,
at 50L, and 8 weeks after 50L). These were obtained from each individual ewe via
jugular venipuncture into 10ml vacutainer tubes containing 15% ethylene-diamine-tetra-
acetic acid (BD Franklin Lakes, NJ, USA) to determine the blood PCV and TPP. Blood
and fecal samples were stored with ice-packs both at the farm and during transport.
48
Data on the animals’ nutrition on each farm were collected by the researchers
during every farm visit using a short questionnaire. The questionnaire gathered
information on quantity and protein content of forage and concentrate being fed to the
sheep, minerals or supplements being given to the sheep, and whether the animals had
access to pasture since the previous farm visit. A copy of the questionnaire can be
obtained from the authors upon request (Appendix II).
For every lambing season, a forage sample was collected from each farm in the
study. This was obtained using a drill hay-corer, and composite samples were taken from
a minimum of five different hay bales located in different storage areas. Forage samples
were submitted to the Agri-Food Laboratory (Guelph, ON N1H 6T9, Canada) for crude
protein analysis based on laboratory nitrogen analysis. Both questionnaire data and forage
analysis data were incorporated in a calculation to determine the Crude Protein (CP)
ingested by each animal, as explained in Section 2.2.6.
For each lambing season, data were obtained from the producers on lambing
dates, ewe parity, litter size, lamb birth-weights, number of lambs weaned, and lamb 50-
day weights, for the lambs born from the ewes enrolled in the study.
All the animal work was approved by the Animal Care Committee (University of
Guelph, Animal Utilization Protocol Approval No. 09R090), while the method for
selection of farmers, structure and implementation of the questionnaire was approved by
the Research Ethics Board (University of Guelph, Protocol Approval No. 09DC005).
49
2.2.5 Laboratory methods
Fecal and blood samples were processed at the Parasitology Laboratory,
Department of Pathobiology, Ontario Veterinary College, University of Guelph. GIN
(trichostrongyle-type) FECs were performed on individual fecal samples using a
modified McMaster concentration method (Ministry of Agriculture, Fisheries and Food,
1986), with a lower detection limit of 50 eggs per gram (epg). The flotation fluid used
was a saturated sodium chloride solution with a specific gravity of 1.20. PCV was
determined using a Baxter Canlab microhematocrit centrifuge (Baxter Corporation,
Mississauga, ON L5N 0C2, Canada), and TPP was determined using a hand
refractometer (ATAGO SPR-NE®, Bellevue, WA 98005, U.S.A.). A hand refractometer
was used for logistic and financial reasons – there was no budget for a direct laboratory
method.
Blood samples were tested 24-48 hours after collection, and fecal samples were
tested 3-7 days after collection. All samples were refrigerated at 4°C before being tested.
2.2.6 Data entry and management
All data were entered into an Excel spreadsheet (Microsoft Office Excel©
, 2007)
and data cleaning was performed manually. Data were compared with information on all
available lambing dates obtained from the producers, and were used to classify animals
into one of five different production stages. Ewes that were not bred at the time of
sampling were classified as ‘maintenance’. Pregnant ewes that were less than 120 days in
gestation were classified as ‘early gestation’. Pregnant ewes that were at, or beyond, 120
days in gestation were classified as ‘late gestation’. Ewes less than 40 days after lambing
50
were classified as ‘early lactation’. Ewes at, or beyond, 40 days lactation were classified
as ‘late lactation’. Animals for which no lambing data were available were assumed to be
in ‘maintenance’.
The CP ingested daily by each animal was estimated using the estimated daily
Dry Matter Intake (DMI), expressed as a percentage of body weight (National Research
Council of the National Academies, 2007), for different production stages and
prolificacy. The estimated DMI percentage was multiplied by the estimated weight of the
animal (based on the average expected weight for the main breed present on the farm),
and then divided by 100 to obtain total daily feed consumption, in kg/d. A constant term
was obtained by dividing 100 by the total consumption of feed in kg/d. This constant was
then used to calculate the total estimated CP ingested (expressed as the percentage of
protein ingested/day) as:
(Quantity forage fed * forage CP content * constant) + (Quantity concentrate fed * concentrate CP
content * constant)
For this calculation, three assumptions were made: (i) unless otherwise specified, all
the ewes on the same farm received the same quantity and type of nutrition; (ii) unless
otherwise specified, the forage and concentrate fed were constant over the same lambing
season; and (iii) weight and prolificacy were estimated at the group level, based on the
main breed present (i.e. ≥75% of the sheep flock) on each farm.
2.2.7 Data analysis
All statistical analyses were conducted using SAS® 9.3 (SAS Institute Inc., Cary,
NC, U.S.A) and the significance level was set at alpha≤0.05. Causal diagrams were
51
designed for each of the three outcomes FEC, TPP and PCV, to guide the model-building
process. In the FEC model, production stage, lambing season, PCV, litter size, total birth
weight, number of lambs weaned and total 50-day weights were considered explanatory
variables; CP and TPP were considered intervening variables between production stage
and FEC, and were therefore not included in the multivariable model. Similarly, access to
pasture was considered an intervening variable between season and FEC, and was not
considered in the multivariable model. In the TPP model, FEC, lambing season, PCV and
production stage were considered as explanatory variables; CP was considered an
intervening variable between production stage and TPP, and was therefore not included
in the multivariable model. In the PCV model, lambing season, FEC, TPP and production
stage were considered explanatory variables. Summary statistics were generated using
PROC MEANS (SAS 9.3), and collinearity between predictor variables (Pearson
correlation coefficient >0.8) was assessed by testing pair-wise correlations.
Three general linear mixed models (GLMM) were fit using PROC MIXED (SAS
9.3). The first model had the natural logarithm of FEC (lnFEC) as the response variable;
different transformations (e.g. square root, natural logarithm, and logarithm to base 10)
were performed in an attempt to achieve a normal distribution of the FEC data, which
were assessed by plotting histograms, normal probability plots, and four different tests
offered by SAS (Shapiro-Wilk, Kolmogorov-Smirnov, Cramer-von Mises and Anderson-
Darling). For the logarithmic transformations of the FEC, the addition of a constant term
to the zero FECs was investigated, with the options being counts from 1 to 49 epg (50
was the lowest number of eggs per gram of feces that the test detected). A constant term
of 25 was selected for the zero FECs since it was associated with the best normality and
52
the natural logarithm was found to be the best transformation. The second and third
models had TPP and PCV as the response variables, respectively.
The dependence of the data was modeled by a random intercept parameter at the
farm level (to account for between-sheep clustering within flocks), and repeated measures
parameters at the sheep level (to account for within-sheep auto-correlation). While
accounting for the farm random effect and repeated measurements, each fixed effect
variable was examined on its own to screen for variables to start the modeling process. A
liberal alpha value for model entry of 0.20 was used to select variables eligible to be
entered in the model. A final GLMM was built by first including all variables that were
significant in the univariable analysis, and keeping those variables with an alpha value
≤0.05 in the final model. Next, predictors of interest that were not significant were forced
into the model to assess potential statistical confounding and conditional effects. All
possible and biologically plausible two-way and three-way interactions were also tested
for significance (alpha≤0.05). The linearity of associations between continuous predictor
variables and outcomes was assessed graphically by plotting lowess smoother curves, and
by testing a quadratic term in the model, as described by Dohoo et al. (2009).
The model assumptions were assessed by plotting residuals against the predicted
outcomes and explanatory variables, to look for homoscedasticity, non-linearity and
outliers. Normality was visually assessed with histograms of the residuals and normal
quantile plots, and assessed statistically using the four normality tests mentioned earlier.
Observations that were identified as outliers or influential were cross-checked with the
original data sheets for any peculiarity in the data to explain its influential behavior. The
model was repeated without the influential observations, and differences in coefficients
53
and goodness-of-fit tests were noted. If the assumptions of linearity or homoscedasticity
were not met, different data transformations were performed and the residuals were re-
assessed (as noted below).
2.3 Results
2.3.1 Study population
The six farms were selected purposively to represent different areas in south-
western Ontario (latitude from 42.7°N to 44.4°N; longitude from 78.7° to 81.8°W) and
different flock sizes (range from 50 to 1500 ewes; arithmetic mean=300 ewes). Farms
were visited five times each lambing season, for a total of 3043 observations. Table 2.1
presents the number of observations for each production stage in each lambing season,
for each farm. Farms A, C, D and E were sampled for three consecutive lambing seasons
(winter, spring and autumn), while Farms B and F were only sampled for two consecutive
lambing seasons (winter and spring). Farm B dropped out of the study after two lambing
seasons, and Farm F did not have sufficient ewes lambing in the autumn. The 50L date
ranged from January 26 to March 10, April 29 to June 18, and October 1 to November 8
for the winter, spring and autumn lambing seasons, respectively.
2.3.2 Fecal egg counts
There were a total of 2581 FEC observations; 462 of the 3043 total animal
observations (15%) had missing FECs. Most missing FEC observations were due to fecal
samples not obtained (i.e. no feces in the rectum at time of sampling) or a sheep was not
present in the flock at the time of sampling. Losses to follow-up in the ewes were mainly
due to culling or ear tag loss.
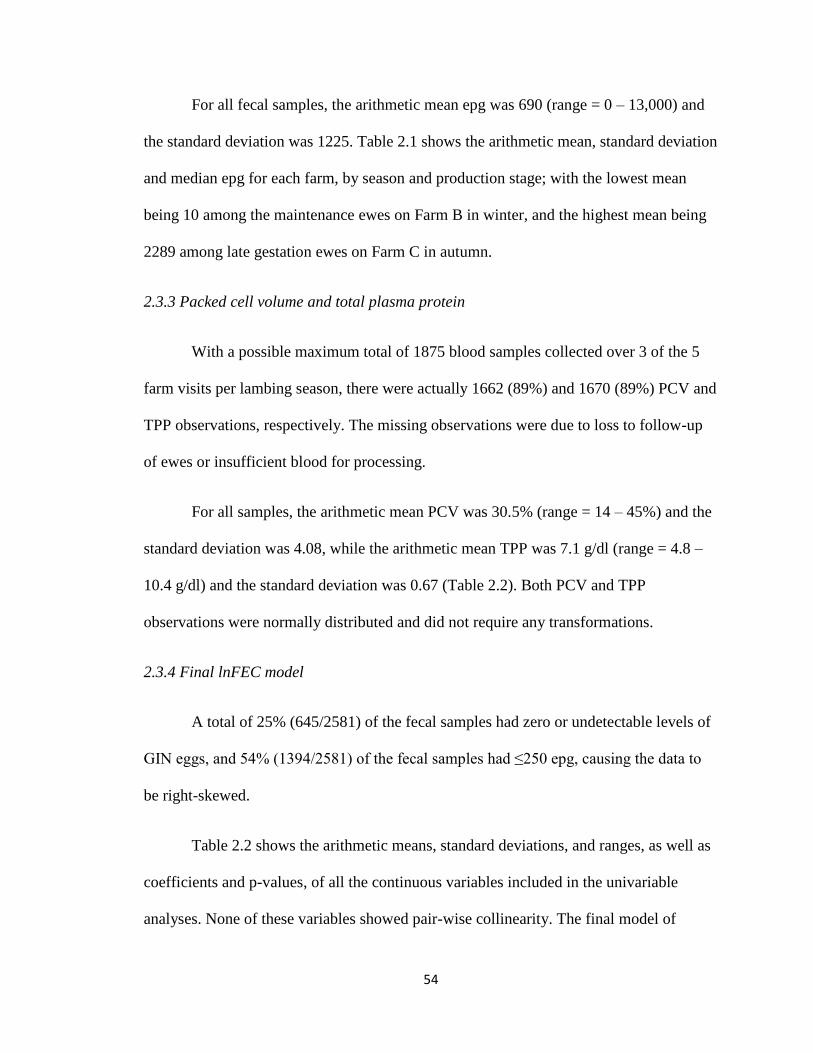
54
For all fecal samples, the arithmetic mean epg was 690 (range = 0 – 13,000) and
the standard deviation was 1225. Table 2.1 shows the arithmetic mean, standard deviation
and median epg for each farm, by season and production stage; with the lowest mean
being 10 among the maintenance ewes on Farm B in winter, and the highest mean being
2289 among late gestation ewes on Farm C in autumn.
2.3.3 Packed cell volume and total plasma protein
With a possible maximum total of 1875 blood samples collected over 3 of the 5
farm visits per lambing season, there were actually 1662 (89%) and 1670 (89%) PCV and
TPP observations, respectively. The missing observations were due to loss to follow-up
of ewes or insufficient blood for processing.
For all samples, the arithmetic mean PCV was 30.5% (range = 14 – 45%) and the
standard deviation was 4.08, while the arithmetic mean TPP was 7.1 g/dl (range = 4.8 –
10.4 g/dl) and the standard deviation was 0.67 (Table 2.2). Both PCV and TPP
observations were normally distributed and did not require any transformations.
2.3.4 Final lnFEC model
A total of 25% (645/2581) of the fecal samples had zero or undetectable levels of
GIN eggs, and 54% (1394/2581) of the fecal samples had ≤250 epg, causing the data to
be right-skewed.
Table 2.2 shows the arithmetic means, standard deviations, and ranges, as well as
coefficients and p-values, of all the continuous variables included in the univariable
analyses. None of these variables showed pair-wise collinearity. The final model of
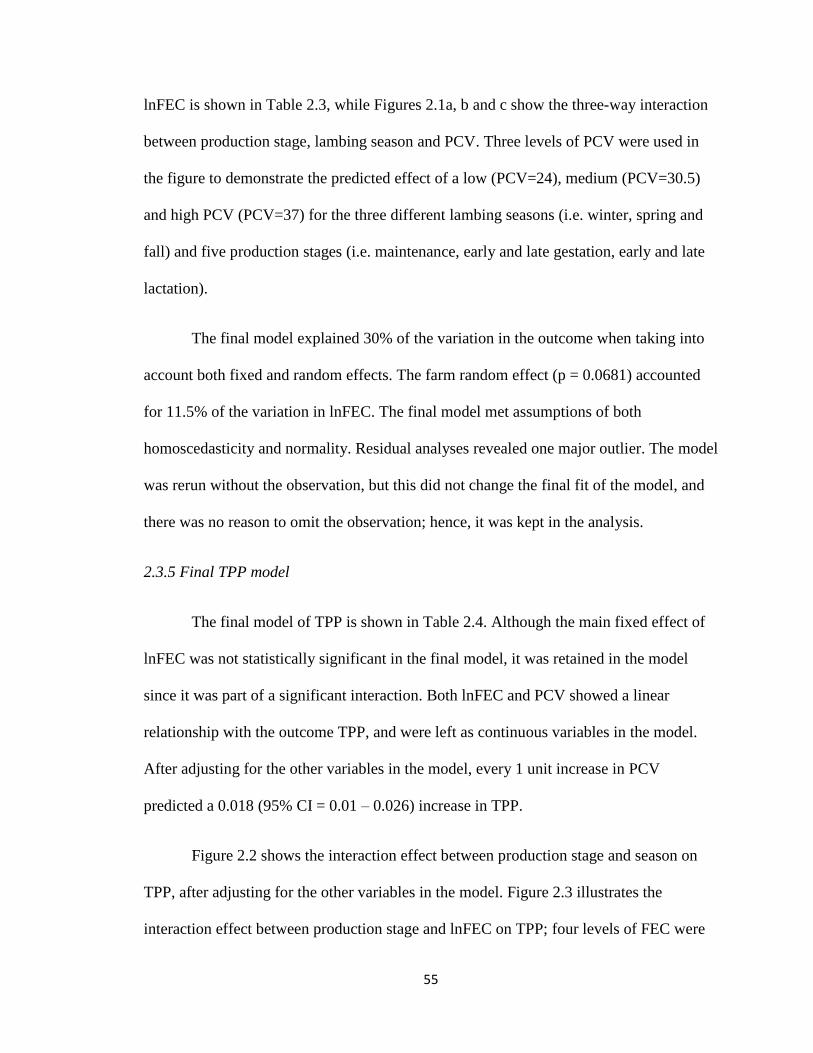
55
lnFEC is shown in Table 2.3, while Figures 2.1a, b and c show the three-way interaction
between production stage, lambing season and PCV. Three levels of PCV were used in
the figure to demonstrate the predicted effect of a low (PCV=24), medium (PCV=30.5)
and high PCV (PCV=37) for the three different lambing seasons (i.e. winter, spring and
fall) and five production stages (i.e. maintenance, early and late gestation, early and late
lactation).
The final model explained 30% of the variation in the outcome when taking into
account both fixed and random effects. The farm random effect (p = 0.0681) accounted
for 11.5% of the variation in lnFEC. The final model met assumptions of both
homoscedasticity and normality. Residual analyses revealed one major outlier. The model
was rerun without the observation, but this did not change the final fit of the model, and
there was no reason to omit the observation; hence, it was kept in the analysis.
2.3.5 Final TPP model
The final model of TPP is shown in Table 2.4. Although the main fixed effect of
lnFEC was not statistically significant in the final model, it was retained in the model
since it was part of a significant interaction. Both lnFEC and PCV showed a linear
relationship with the outcome TPP, and were left as continuous variables in the model.
After adjusting for the other variables in the model, every 1 unit increase in PCV
predicted a 0.018 (95% CI = 0.01 – 0.026) increase in TPP.
Figure 2.2 shows the interaction effect between production stage and season on
TPP, after adjusting for the other variables in the model. Figure 2.3 illustrates the
interaction effect between production stage and lnFEC on TPP; four levels of FEC were
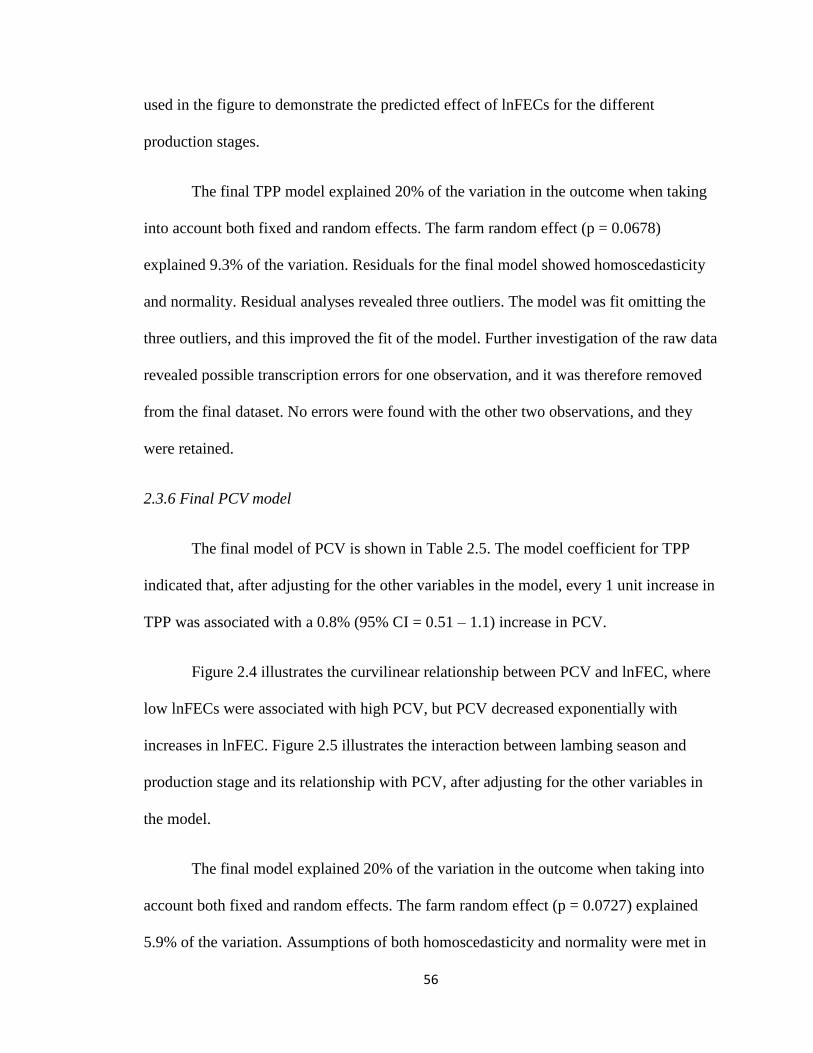
56
used in the figure to demonstrate the predicted effect of lnFECs for the different
production stages.
The final TPP model explained 20% of the variation in the outcome when taking
into account both fixed and random effects. The farm random effect (p = 0.0678)
explained 9.3% of the variation. Residuals for the final model showed homoscedasticity
and normality. Residual analyses revealed three outliers. The model was fit omitting the
three outliers, and this improved the fit of the model. Further investigation of the raw data
revealed possible transcription errors for one observation, and it was therefore removed
from the final dataset. No errors were found with the other two observations, and they
were retained.
2.3.6 Final PCV model
The final model of PCV is shown in Table 2.5. The model coefficient for TPP
indicated that, after adjusting for the other variables in the model, every 1 unit increase in
TPP was associated with a 0.8% (95% CI = 0.51 – 1.1) increase in PCV.
Figure 2.4 illustrates the curvilinear relationship between PCV and lnFEC, where
low lnFECs were associated with high PCV, but PCV decreased exponentially with
increases in lnFEC. Figure 2.5 illustrates the interaction between lambing season and
production stage and its relationship with PCV, after adjusting for the other variables in
the model.
The final model explained 20% of the variation in the outcome when taking into
account both fixed and random effects. The farm random effect (p = 0.0727) explained
5.9% of the variation. Assumptions of both homoscedasticity and normality were met in
57
the final model. Residual analyses revealed two outliers; their removal did not improve
the fit of the final model, and there was no justification to omit the observations, hence
they were retained.
2.4 Discussion and conclusions
2.4.1. Final lnFEC model
The effects of lambing season, production stage and PCV on lnFEC were each
dependent upon one another. During both the winter and spring lambing seasons (Figures
2.1a and 2.1b, respectively), the FECs were consistently lower than the autumn lambing
season for all production stages except late lactation (Fig. 2.1c). During the winter and
spring seasons, the ewes on all farms were housed indoors for most of the time; therefore,
their exposure to parasites was limited. During the summer months, the ewes were kept
on pasture, increasing their exposure to parasites. This would have resulted in higher
fecal egg shedding during the autumn, regardless of production stage.
During the winter and spring lambing seasons, the FECs were significantly higher
in ewes classified as late gestation (spring only), early lactation and late lactation,
compared to ewes classified as maintenance or early gestation. This suggests that the
increase in fecal egg shedding may be explained by a decline in immunity experienced
during parturition and lactation, which would allow hypobiotic parasites to resume
development and egg shedding (Michel, 1978). There was no significant difference in the
FECs of ewes in maintenance or in early gestation in the winter and spring lambing
season, indicating that ewes that were not pregnant (i.e. in maintenance) or in early
gestation in the spring did not experience an increase in fecal egg shedding related to
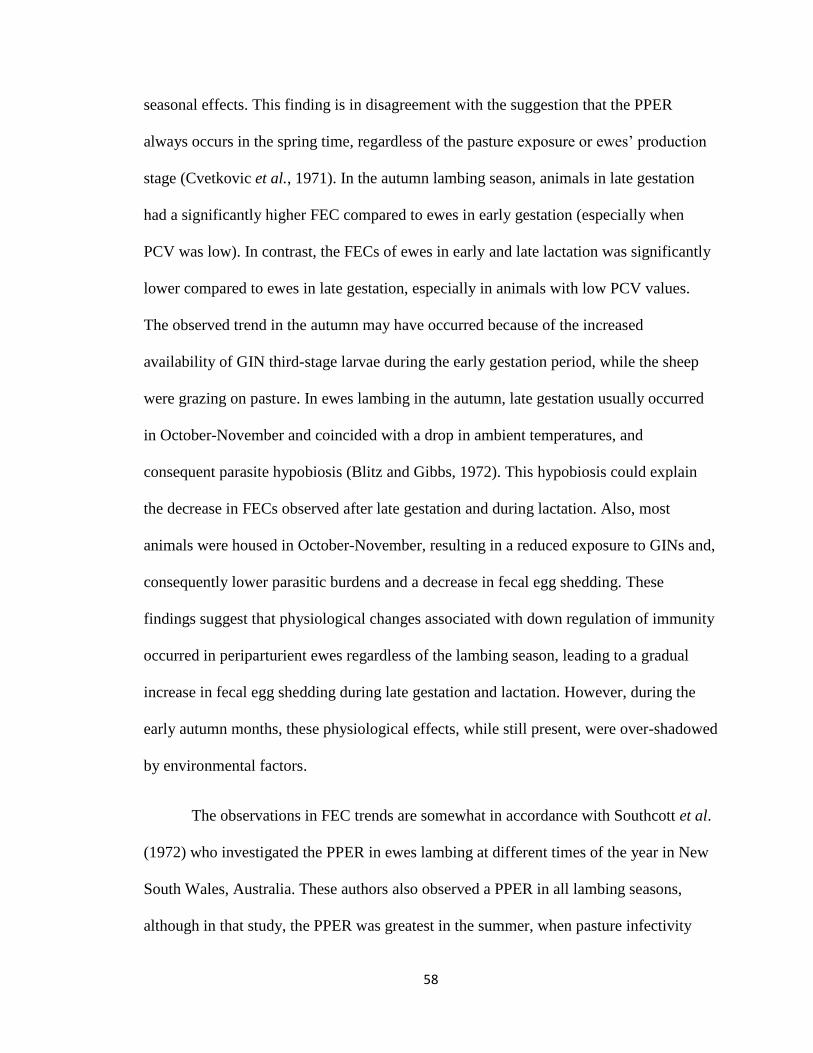
58
seasonal effects. This finding is in disagreement with the suggestion that the PPER
always occurs in the spring time, regardless of the pasture exposure or ewes’ production
stage (Cvetkovic et al., 1971). In the autumn lambing season, animals in late gestation
had a significantly higher FEC compared to ewes in early gestation (especially when
PCV was low). In contrast, the FECs of ewes in early and late lactation was significantly
lower compared to ewes in late gestation, especially in animals with low PCV values.
The observed trend in the autumn may have occurred because of the increased
availability of GIN third-stage larvae during the early gestation period, while the sheep
were grazing on pasture. In ewes lambing in the autumn, late gestation usually occurred
in October-November and coincided with a drop in ambient temperatures, and
consequent parasite hypobiosis (Blitz and Gibbs, 1972). This hypobiosis could explain
the decrease in FECs observed after late gestation and during lactation. Also, most
animals were housed in October-November, resulting in a reduced exposure to GINs and,
consequently lower parasitic burdens and a decrease in fecal egg shedding. These
findings suggest that physiological changes associated with down regulation of immunity
occurred in periparturient ewes regardless of the lambing season, leading to a gradual
increase in fecal egg shedding during late gestation and lactation. However, during the
early autumn months, these physiological effects, while still present, were over-shadowed
by environmental factors.
The observations in FEC trends are somewhat in accordance with Southcott et al.
(1972) who investigated the PPER in ewes lambing at different times of the year in New
South Wales, Australia. These authors also observed a PPER in all lambing seasons,
although in that study, the PPER was greatest in the summer, when pasture infectivity
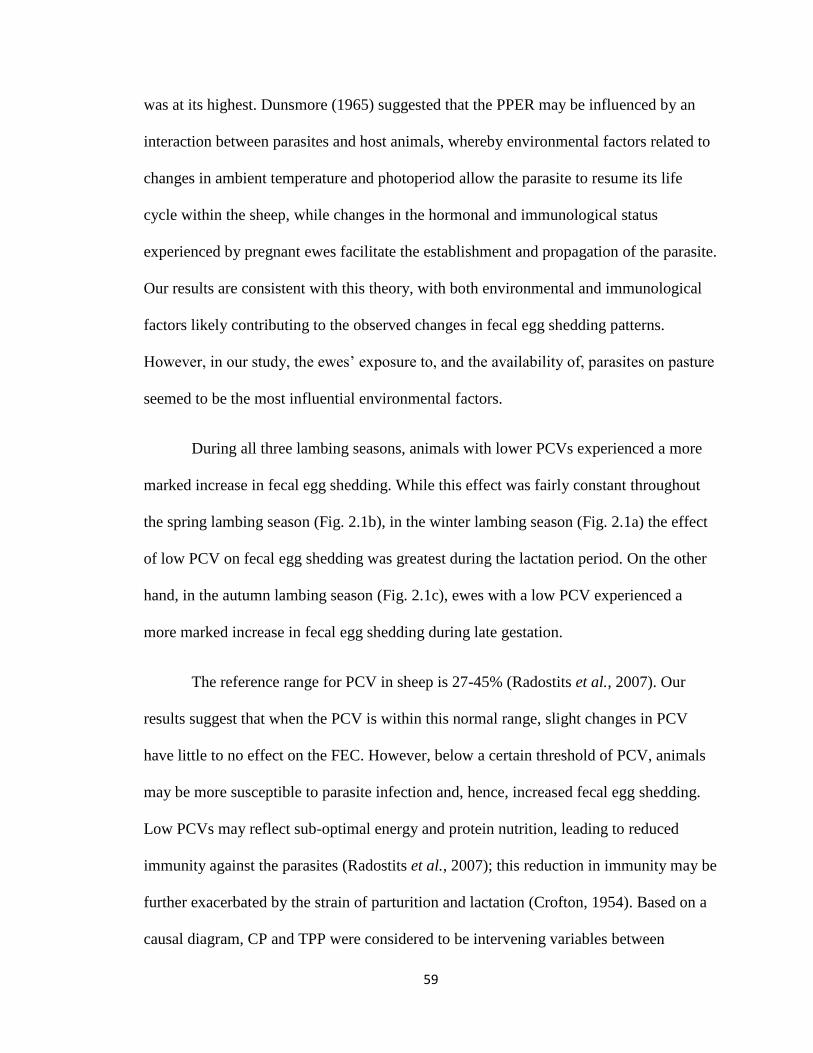
59
was at its highest. Dunsmore (1965) suggested that the PPER may be influenced by an
interaction between parasites and host animals, whereby environmental factors related to
changes in ambient temperature and photoperiod allow the parasite to resume its life
cycle within the sheep, while changes in the hormonal and immunological status
experienced by pregnant ewes facilitate the establishment and propagation of the parasite.
Our results are consistent with this theory, with both environmental and immunological
factors likely contributing to the observed changes in fecal egg shedding patterns.
However, in our study, the ewes’ exposure to, and the availability of, parasites on pasture
seemed to be the most influential environmental factors.
During all three lambing seasons, animals with lower PCVs experienced a more
marked increase in fecal egg shedding. While this effect was fairly constant throughout
the spring lambing season (Fig. 2.1b), in the winter lambing season (Fig. 2.1a) the effect
of low PCV on fecal egg shedding was greatest during the lactation period. On the other
hand, in the autumn lambing season (Fig. 2.1c), ewes with a low PCV experienced a
more marked increase in fecal egg shedding during late gestation.
The reference range for PCV in sheep is 27-45% (Radostits et al., 2007). Our
results suggest that when the PCV is within this normal range, slight changes in PCV
have little to no effect on the FEC. However, below a certain threshold of PCV, animals
may be more susceptible to parasite infection and, hence, increased fecal egg shedding.
Low PCVs may reflect sub-optimal energy and protein nutrition, leading to reduced
immunity against the parasites (Radostits et al., 2007); this reduction in immunity may be
further exacerbated by the strain of parturition and lactation (Crofton, 1954). Based on a
causal diagram, CP and TPP were considered to be intervening variables between

60
production stage and lnFEC, and were therefore not included in our final lnFEC model.
Also, we were unable to draw comparisons between CP ingested and PCV since the
former was determined at the group-level, while the latter was determined at the
individual level. Low PCV values are also caused by blood and protein loss, suggestive
of an ongoing parasitic infection (Radostits et al., 2007); one must therefore be careful
when interpreting cause and effect between PCV and FEC.
Houdijk (2008) showed that, at a constant nutrition level, the ewes’ litter size
affected the PPER. However, in our study, none of the lamb productivity variables (ewe
parity, litter size, number of lambs weaned, total birth weights and total 50-day weights)
were significantly associated with FEC. The discordance in our results may be attributed
to a lack of statistical power to detect differences in FEC by litter size or other
productivity measures. Since our study was conducted on commercial farms, we had to
rely on data collected by the producers; not all producers had an efficient data-recording
system, leading to some missing productivity data. Also, for those who kept records,
most either measured birth weights or 50-day weights; few measured both. The limited
number of observations might therefore have precluded any observable differences in
FEC by productivity measures.
2.4.2 Final TPP model
The reference range for TPP in sheep is 6.0-7.9 g/dl, and TPP was measured as an
indicator of protein available to animals, since several studies have implicated a lack of
dietary protein in the PPER (Coop and Kyriazakis, 1999; Houdijk et al., 2001; Houdijk,
2008). We found that the association of production stage with TPP was dependent on
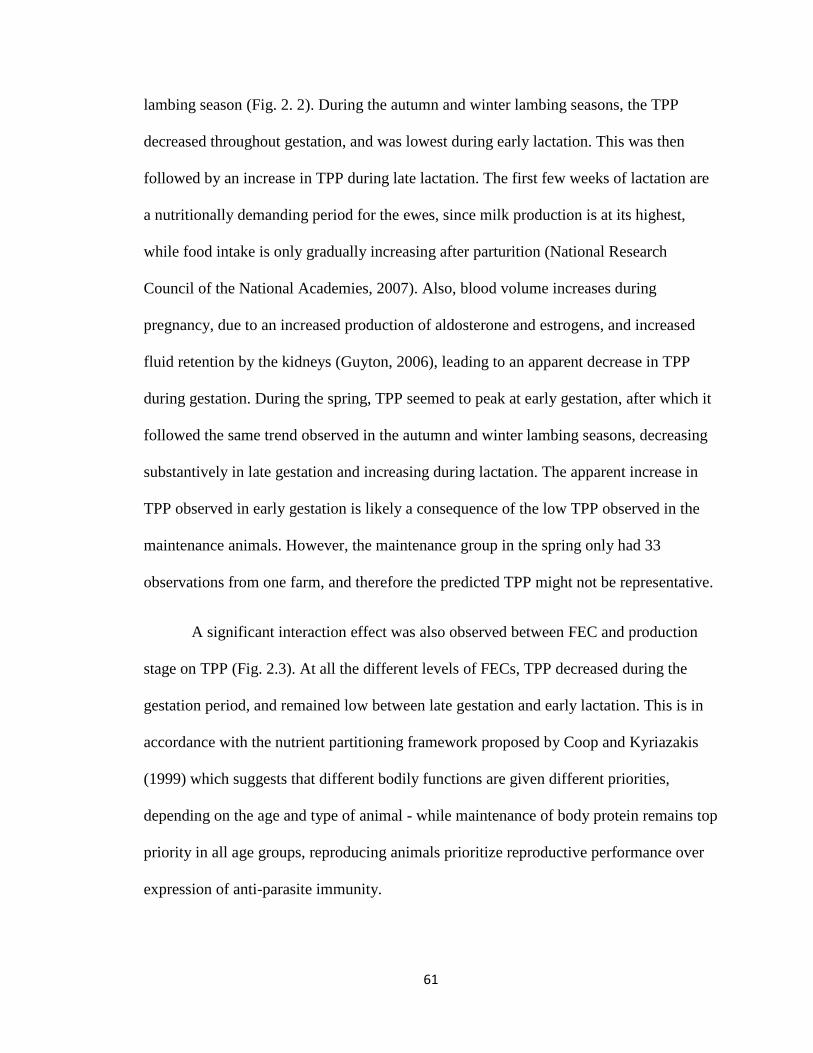
61
lambing season (Fig. 2. 2). During the autumn and winter lambing seasons, the TPP
decreased throughout gestation, and was lowest during early lactation. This was then
followed by an increase in TPP during late lactation. The first few weeks of lactation are
a nutritionally demanding period for the ewes, since milk production is at its highest,
while food intake is only gradually increasing after parturition (National Research
Council of the National Academies, 2007). Also, blood volume increases during
pregnancy, due to an increased production of aldosterone and estrogens, and increased
fluid retention by the kidneys (Guyton, 2006), leading to an apparent decrease in TPP
during gestation. During the spring, TPP seemed to peak at early gestation, after which it
followed the same trend observed in the autumn and winter lambing seasons, decreasing
substantively in late gestation and increasing during lactation. The apparent increase in
TPP observed in early gestation is likely a consequence of the low TPP observed in the
maintenance animals. However, the maintenance group in the spring only had 33
observations from one farm, and therefore the predicted TPP might not be representative.
A significant interaction effect was also observed between FEC and production
stage on TPP (Fig. 2.3). At all the different levels of FECs, TPP decreased during the
gestation period, and remained low between late gestation and early lactation. This is in
accordance with the nutrient partitioning framework proposed by Coop and Kyriazakis
(1999) which suggests that different bodily functions are given different priorities,
depending on the age and type of animal - while maintenance of body protein remains top
priority in all age groups, reproducing animals prioritize reproductive performance over
expression of anti-parasite immunity.
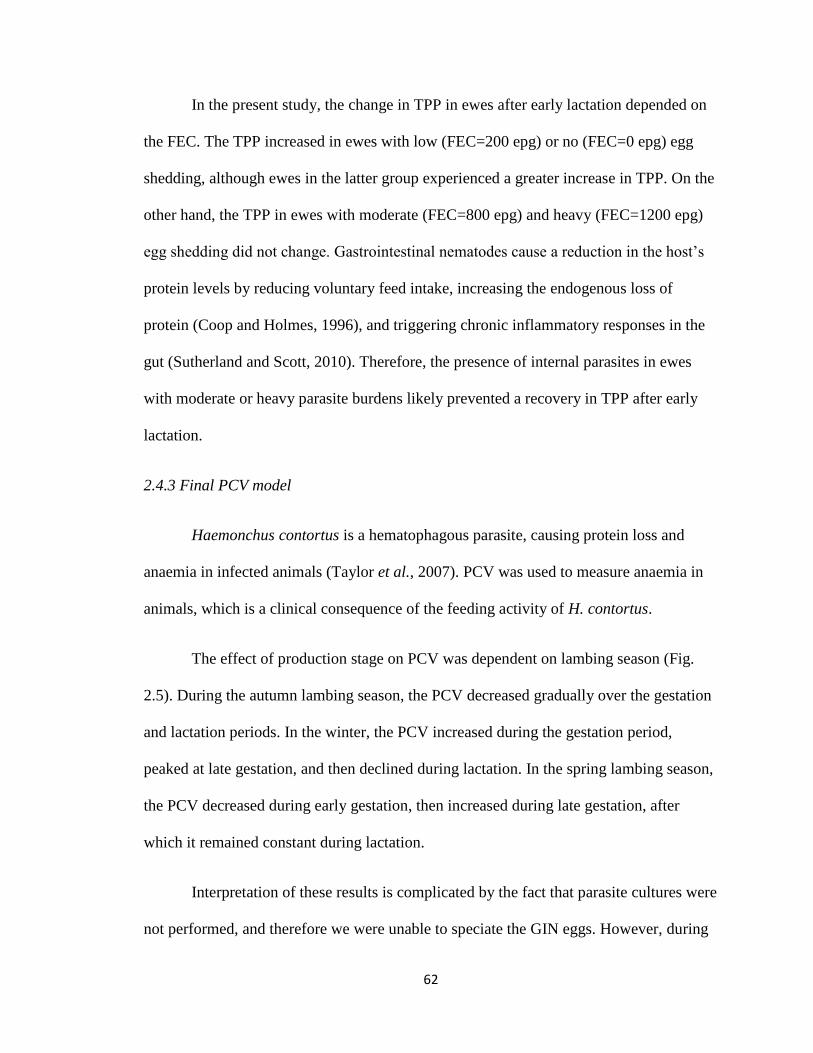
62
In the present study, the change in TPP in ewes after early lactation depended on
the FEC. The TPP increased in ewes with low (FEC=200 epg) or no (FEC=0 epg) egg
shedding, although ewes in the latter group experienced a greater increase in TPP. On the
other hand, the TPP in ewes with moderate (FEC=800 epg) and heavy (FEC=1200 epg)
egg shedding did not change. Gastrointestinal nematodes cause a reduction in the host’s
protein levels by reducing voluntary feed intake, increasing the endogenous loss of
protein (Coop and Holmes, 1996), and triggering chronic inflammatory responses in the
gut (Sutherland and Scott, 2010). Therefore, the presence of internal parasites in ewes
with moderate or heavy parasite burdens likely prevented a recovery in TPP after early
lactation.
2.4.3 Final PCV model
Haemonchus contortus is a hematophagous parasite, causing protein loss and
anaemia in infected animals (Taylor et al., 2007). PCV was used to measure anaemia in
animals, which is a clinical consequence of the feeding activity of H. contortus.
The effect of production stage on PCV was dependent on lambing season (Fig.
2.5). During the autumn lambing season, the PCV decreased gradually over the gestation
and lactation periods. In the winter, the PCV increased during the gestation period,
peaked at late gestation, and then declined during lactation. In the spring lambing season,
the PCV decreased during early gestation, then increased during late gestation, after
which it remained constant during lactation.
Interpretation of these results is complicated by the fact that parasite cultures were
not performed, and therefore we were unable to speciate the GIN eggs. However, during
63
the spring lambing season, a few farms on the study reported clinical signs of Type II
haemonchosis in some of their pregnant ewes (sub-mandibular oedema and pale mucous
membranes); this might explain the drop in PCV observed during early gestation in the
spring. In a study examining the arrested development of H. contortus in sheep (Blitz and
Gibbs, 1972), it was shown that H. contortus overwintered in ewes as arrested fourth-
stage larvae and resumed development in the spring. The consequent accumulation of
adult H. contortus within the abomasum during early gestation would potentially lead to
blood loss and low PCVs. Compensatory erythropoiesis may then allow for a recovery in
the haematocrits in the following weeks (Taylor et al., 2007).
2.4.4 Study limitations
While the sample size was small, the objectives of the study were at the individual
level (i.e. to determine whether ewes that lamb out-of-season experienced a PPER, and to
determine whether ewes not bred or in early gestation during the spring season
experienced an increase in fecal egg shedding, related to seasonal effects). Moreover, the
target population was Ontario sheep farms that practice out-of-season lambing, and most
of these farms have small acreage and little variation in farm topography. Therefore, we
believe that the sample size was appropriate for the study; however, we recognize that the
external validity of the findings may be limited.
We recognize that pasture sampling may have been beneficial to estimate the
level of pasture larval contamination (Couvillion, 1993; Stromberg, 1997). However, due
to financial constraints, we evaluated the additional information this procedure would
have provided, and the limited sensitivity of the procedure to assess pasture
64
contamination, compared to the use of tracer lambs (O’Connor et al., 2006), and decided
to focus on sheep FECs, as these represent the parasitic infection the animals acquire
from pasture (Stromberg, 1997).
Parasite cultures were not performed due to logistic and financial constraints;
however most of these farms reported lambs dying of haemonchosis in the summer.
Furthermore, farm B participated in a study on the epidemiology of GIN parasites in
Ontario sheep flocks between May 2006 and March 2008 (Mederos et al., 2010), and
larval cultures available monthly during the grazing season and twice during the winter
(January and March), indicated that Haemonchus sp. was present on that farm during the
grazing season.
While we recognize that the limited farm variability observed in this study (11.5%
of the total variability) may be due to the low number of farms and the fact that the farms
were not selected randomly, the flocks were purposively selected from geographically
diverse regions and had different flock sizes. Moreover, the target population in this
study was farms that practice out-of-season lambing, which are often more similar as they
share common management practices.
The farms were followed for three consecutive lambing seasons, except for Farms
B and F, which were not sampled in the autumn, leading to fewer overall observations for
the autumn lambing season than the other two seasons. Also, few of the ewes sampled
during the entire study, and none of the ewes sampled during the autumn season, were in
the maintenance group. This might have reduced the statistical power to detect
differences between maintenance and other production groups, especially during the
65
autumn. For the classification of ewes into production stages we used owner-recorded
data, which is not always reliable; therefore misclassification bias might have occurred.
2.4.5 Conclusion
In summary, the PPER was observed during all three lambing seasons, although
the magnitude and timing of maximum fecal egg shedding for each production stage
varied between seasons. Ewes that were open or in early gestation during the spring did
not experience a spring rise in fecal egg shedding. In contrast, ewes lambing in the
autumn experienced a rise in fecal egg shedding over the gestation period, which peaked
at late gestation and then decreased. While both TPP and PCV were associated with FEC,
this association varied between production stages and lambing seasons. Therefore, the
usefulness of these clinical parameters as potential diagnostic indicators of PPER should
be investigated further. Collectively, these findings show that both seasonal and animal
physiological factors play an important role in determining fecal egg shedding, and need
to be considered when implementing preventive parasite control strategies on Ontario
sheep farms that practice out-of-season lambing.
2.5 Acknowledgements
This research was supported by the Ontario Ministry of Agriculture, Food and
Rural Affairs (OMAFRA) – New Directions Research Program, with additional financial
assistance from the Ontario Sheep Marketing Agency (OSMA), the Nova Scotia
Agricultural College – Organic Science Cluster, and the University of Guelph. The study
sponsors were not involved in the study design; collection, analysis and interpretation of
the data; in the writing of the manuscript and in the decision to submit the manuscript for

66
publication. The authors are very grateful to William Sears for statistical advice and to
Brad De Wolf, Steve Roche, Grazyna Adamska-Jarecka, Katie Sippel, Kirstie Puskas,
Lee Siertsema and Hasani Stewart for laboratory and field assistance. We especially
acknowledge the sheep producers that participated in the study.
67
2.6 References
Abbott, K.A., Taylor, M.A., Stubbings, L.A., 2009. Sustainable worm control strategies
for sheep. 3rd
Ed. A technical manual for veterinary surgeons and advisers. 51pp.
Published by: Sustainable Control of Parasites in Sheep (SCOPS) and printed by:
Context Publications. Available from: www.nationalsheep.org.uk.
Barger, I.A., 1999. The role of epidemiological knowledge and grazing management for
helminth control in small ruminants. Int. J. Parasitol. 29, 41-47.
Beasley, A.M., Kahn, L.P., Windon, R.G., 2010a. The periparturient relaxation of
immunity in Merino ewes infected with Trichostrongylus colubriformis: Endocrine
and body compositional responses. Vet. Parasitol. 168, 51-59.
Beasley, A.M., Kahn, L.P., Windon, R.G., 2010b. The periparturient relaxation of
immunity in Merino ewes infected with Trichostongylus colubriformis:
Parasitological and immunological responses. Vet. Parasitol. 168, 60-70.
Blitz, N.M., Gibbs, H.C., 1972. Studies on the arrested development of Haemonchus
contortus in sheep II. Termination of arrested development and the spring rise
phenomenon. Int. J. Parasitol. 2, 13-22.
Brunsdon, R.V., 1964. The seasonal variations in the nematode egg counts of sheep: A
comparison of the spring rise phenomenon in breeding and unmated ewes. N. Z.
Vet. J. 12, 75-80.
Brunsdon, R.V., 1970. The spring rise phenomenon: Seasonal changes in the worm
burdens of breeding ewes and in the availability of pasture infection. N. Z. Vet. J.
18, 47-54.
Coles, G.C., Jackson, F., Pomroy, W.E., Prichard, R.K., von Samson-Himmelstjerna, G.,
Silvestre, A., Taylor, M.A., Vercruysse, J., 2006. The detection of anthelmintic
resistance in nematodes of veterinary importance. Vet. Parasitol. 136, 167-185.
Coop, R.L., Holmes, P.H., 1996. Nutrition and parasite interaction. Int. J. Parasitol. 26,
951-962.
Coop, R.L., Kyriazakis, I., 1999. Nutrition-parasite interaction. Vet. Parasitol. 84, 187-
204.
Couvillion, C.E., 1993. Estimation of the numbers of trichostrongylid larvae on pastures.
Vet. Parasitol. 46, 197-203.
Crofton, H.D., 1954. Nematode parasite populations in sheep on lowland farms I. Worm
egg counts in ewes. Parasitology 44, 465-477.
Cvetkovic, L.J., Golosin, R., Kosanovic, M., 1971. Seasonal fluctuations in the
trichostrongylide worm egg counts in the faeces of unmated ewes and ewes which
lambed in different months of the year. Acta Vet. Beograd. 21, 77-88.
68
Dohoo, I., Martin, W., Stryhn, H., 2009. Veterinary Epidemiologic Research. 2nd Ed.
VER Inc, 8 Berkeley Way, Charlottetown, Prince Edward Island, Canada, C1A
8X5. pp. 365-390.
Dunsmore, J.D., 1965. Ostertagia spp. in lambs and pregnant ewes. J. Helminth. 39, 159-
184.
Gibbs, H.C., 1967. Some factors involved in the “Spring Rise” phenomenon in sheep. In:
Soulsby, E.J.L. (Ed.), The Reaction of the Host to Parasitism. N.G. Elwert
Universitats und Verlagsbuchand, Marburg/Lahn, pp. 160-173.
Gibbs, H.C., Barger, I.A., 1986. Haemonchus contortus and other trichostrongylid
infections in parturient, lactating and dry ewes. Vet. Parasitol. 22, 57-66.
Guyton, A.C., Hall, J.E., 2006. Textbook of Medical Physiology. 11th
ed. Elsevier Inc.,
Philadelphia, Pennsylvania 19103-2899, pp. 1027-1041.
Houdijk, J.G.M., Jessop, N.S., Kyrisazakis, I., 2001. Nutrient partitioning between
reproductive and immune functions in animals. P. Nutr. Soc. 60, 515-525.
Houdijk, J.G.M., 2008. Influence of periparturient nutritional demand on resistance to
parasites in livestock. Parasite Immun. 30, 113-121.
Jeffcoate, I.A., Holmes, P.H., 1990. Pathophysiology of the periparturient egg rise in
sheep: the role of prolactin. Res. Vet. Sci. 48, 295-300.
Littell, R.C., Milliken, G.A., Stroup, W.W. And Wolfinger, R.D., SAS® System for
Mixed Models, Cary, NC: SAS Institute Inc., 1996. 633pp.
Mederos, A., Fernandez, S., Vanleeuwen, J., Peregrine, A.S., Kelton, D., Menzies, P.,
LeBoeuf, A., Martin, R., 2010. Prevalence and distribution of gastrointestinal
nematodes on 32 organic and conventional commercial sheep farms in Ontario and
Quebec, Canada (2006-2008). Vet. Parasitol. 170, 244-252.
Michel, J.F., 1974. Arrested development of nematodes and some related phenomena.
Adv. Parasitol. 12, 279-366.
Michel, J.F., 1976. The epidemiology and control of some nematode infections in grazing
animals. Adv. Parasitol. 14, 355-397.
Michel, J.F., 1978. Topical themes in the study of arrested development. In: F.H.M.
Borgsteede (Ed.), Facts and Reflections. III. Workshop on arrested development of
nematodes in sheep and cattle. Held at Central Veterinary Institute, Lelystad, The
Netherlands, 18-19 May 1978. P.O. Box 65, 8200 AB Lelystad, Netherlands, pp. 7
– 17.
Ministry of Agriculture, Fisheries and Food, 1986. Manual of Veterinary Parasitological
Laboratory Techniques, London, 124pp.

69
National Research Council of the National Academies, 2007. Nutrient Requirements of
Small Ruminants (sheep, goats, cervids and new world camelids). The National
Academies Press; Washington D.C., 2007. 384pp.
Ng’ang’a, C.J., Kanyari, P.W.N., Maingi, N., Munyua, W.K., 2006. The effect of
weather on the occurrence and magnitude of periparturient rise in trichostrongylid
nematode egg output in Dorper ewes in a semi-arid area of Kajiado District of
Kenya. Trop. Anim. Health Prod. 38, 389-395.
O’Connor, L.J., Walkden-Brown, S.W., Kahn, L.P., 2006. Ecology of the free-living
stages of major trichostrongylid parasites of sheep. Vet. Parasitol. 142, 1-15.
Radostits, O.M., Gay, C.C., Hinchcliff, K.W., Constable, P.D., 2007. Veterinary
Medicine. A textbook of the diseases of cattle, horses, sheep, pigs and goats. Tenth
edition. Saunders, Elsevier Limited. pp. 1613-1691.
Senger, P.L., 2003. Pathways to Pregnancy and Parturition. 2nd
Revised Ed. Current
Conceptions Inc., Washington State University Research and Technology Park,
Pullman, WA, U.S.A. pp.304-325
Southcott, W.H., Gorge, J.M., Lewis, R.J., 1972. Parasitism in ewes and lambs in relation
to season of lambing. Aust. Vet. J. 48, 593-597.
Stromberg, B.E., 1997. Environmental factors influencing transmission. Vet. Parasitol.
72, 247-264.
Sutherland, I., Scott, I., 2010. Gastrointestinal nematodes of sheep and cattle. Biology
and control. John Wiley and Sons Ltd, West Sussex, UK. pp.1-60.
Taylor, E.L., 1935. Seasonal fluctuation in the number of eggs of trichostrongylid worms
in the faeces of ewes. J. Parasitol. 21, 175-179.
Taylor, M.A., Coop, R.L., Wall, R.L., 2007. Veterinary Parasitology. 3rd
Ed. Blackwell
Publishing, Oxford, UK. pp. 152-162.
Tembely, S., Lahlou-Kassi, A., Rege, J.E.O., Mukasa-Mugerwa, E., Anindo, D., Sovani,
S., Baker, R.L., 1998. Breed and season effects on the peri-parturient rise in
nematode egg output in indigenous ewes in a cool tropical environment. Vet.
Parasitol. 77, 123-132.
Zawadowsky, M.M., Zvjaguintzev, S.N., 1933. The seasonal fluctuation in the number of
eggs of Nematodirus spp. in feces. J. Parasitol. 19, 269-279.
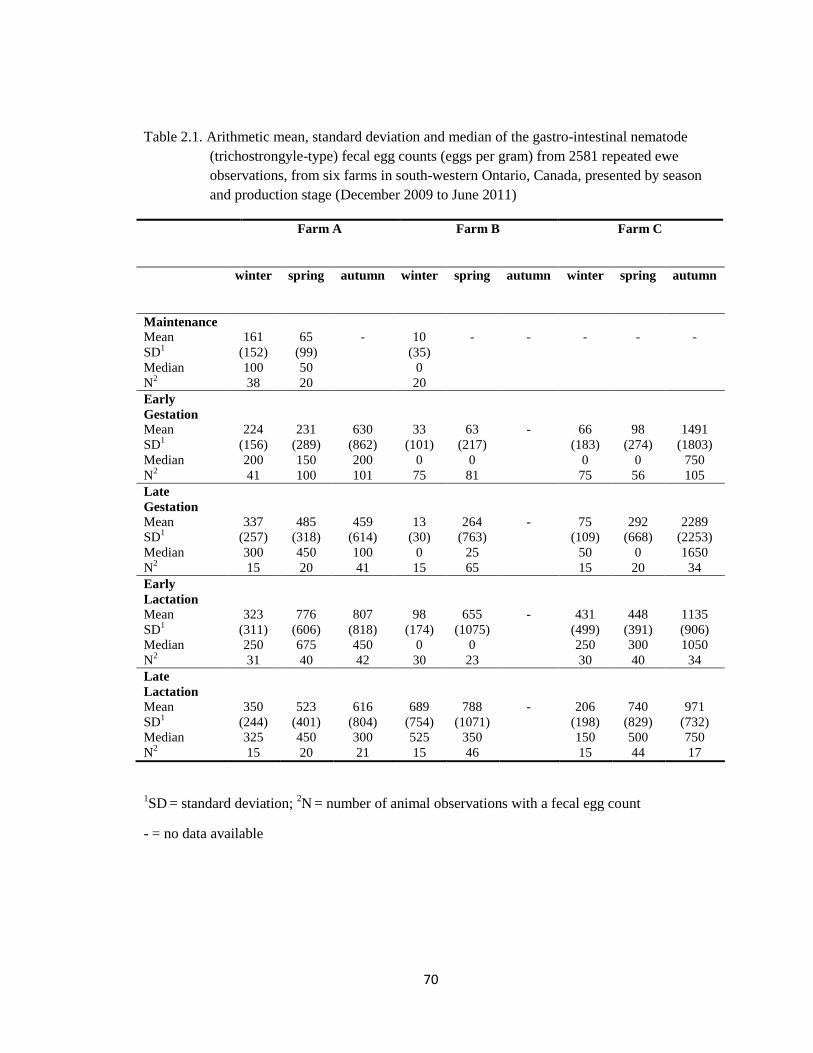
70
Table 2.1. Arithmetic mean, standard deviation and median of the gastro-intestinal nematode
(trichostrongyle-type) fecal egg counts (eggs per gram) from 2581 repeated ewe
observations, from six farms in south-western Ontario, Canada, presented by season
and production stage (December 2009 to June 2011)
Farm A Farm B Farm C
winter
spring
autumn
winter
spring
autumn winter
spring
autumn
Maintenance
Mean
SD1
161
(152)
65
(99)
- 10
(35)
- - - - -
Median 100 50 0
N2
38 20 20
Early
Gestation
Mean
SD1
224
(156)
231
(289)
630
(862)
33
(101)
63
(217)
- 66
(183)
98
(274)
1491
(1803)
Median 200 150 200 0 0 0 0 750
N2
41 100 101 75 81 75 56 105
Late
Gestation
Mean
SD1
337
(257)
485
(318)
459
(614)
13
(30)
264
(763)
- 75
(109)
292
(668)
2289
(2253)
Median 300 450 100 0 25 50 0 1650
N2
15 20 41 15 65 15 20 34
Early
Lactation
Mean
SD1
323
(311)
776
(606)
807
(818)
98
(174)
655
(1075)
- 431
(499)
448
(391)
1135
(906)
Median 250 675 450 0 0 250 300 1050
N2
31 40 42 30 23 30 40 34
Late
Lactation
Mean
SD1
350
(244)
523
(401)
616
(804)
689
(754)
788
(1071)
- 206
(198)
740
(829)
971
(732)
Median 325 450 300 525 350 150 500 750
N2
15 20 21 15 46 15 44 17
1SD
= standard deviation;
2N
= number of animal observations with a fecal egg count
- = no data available
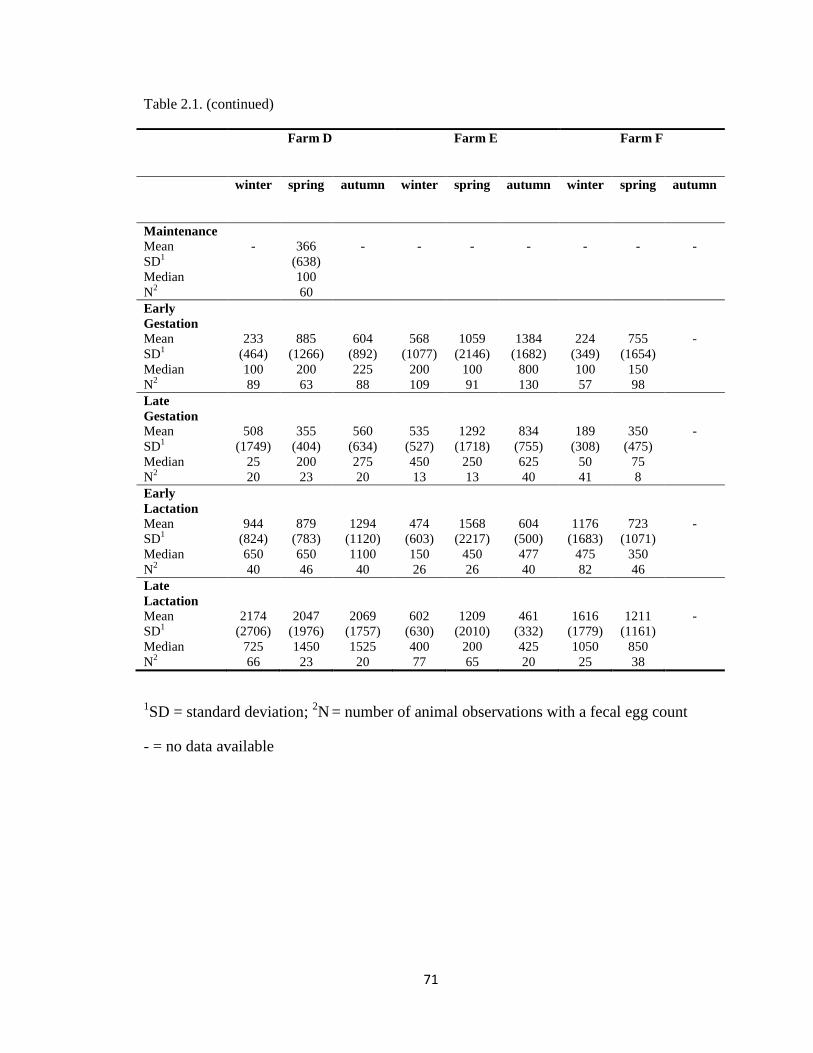
71
Table 2.1. (continued)
Farm D Farm E Farm F
winter spring
autumn
winter
spring
autumn
winter
spring
autumn
Maintenance
Mean
SD1
- 366
(638)
- - - - - - -
Median 100
N2
60
Early
Gestation
Mean
SD1
233
(464)
885
(1266)
604
(892)
568
(1077)
1059
(2146)
1384
(1682)
224
(349)
755
(1654)
-
Median 100 200 225 200 100 800 100 150
N2
89 63 88 109 91 130 57 98
Late
Gestation
Mean
SD1
508
(1749)
355
(404)
560
(634)
535
(527)
1292
(1718)
834
(755)
189
(308)
350
(475)
-
Median 25 200 275 450 250 625 50 75
N2
20 23 20 13 13 40 41 8
Early
Lactation
Mean
SD1
944
(824)
879
(783)
1294
(1120)
474
(603)
1568
(2217)
604
(500)
1176
(1683)
723
(1071)
-
Median 650 650 1100 150 450 477 475 350
N2
40 46 40 26 26 40 82 46
Late
Lactation
Mean
SD1
2174
(2706)
2047
(1976)
2069
(1757)
602
(630)
1209
(2010)
461
(332)
1616
(1779)
1211
(1161)
-
Median 725 1450 1525 400 200 425 1050 850
N2
66 23 20 77 65 20 25 38
1SD = standard deviation;
2N
= number of animal observations with a fecal egg count
- = no data available
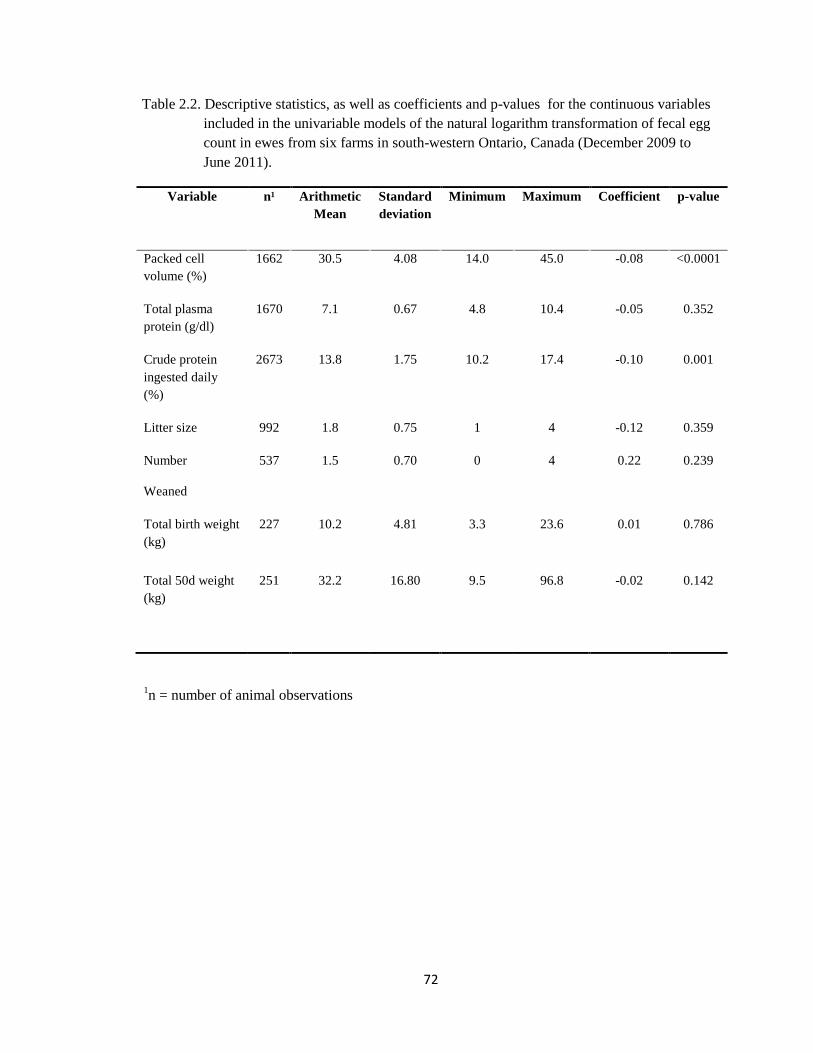
72
Table 2.2. Descriptive statistics, as well as coefficients and p-values for the continuous variables
included in the univariable models of the natural logarithm transformation of fecal egg
count in ewes from six farms in south-western Ontario, Canada (December 2009 to
June 2011).
Variable
n¹ Arithmetic
Mean
Standard
deviation
Minimum Maximum Coefficient p-value
Packed cell
volume (%)
1662 30.5 4.08 14.0 45.0 -0.08 <0.0001
Total plasma
protein (g/dl)
1670 7.1 0.67 4.8 10.4 -0.05 0.352
Crude protein
ingested daily
(%)
2673 13.8 1.75 10.2 17.4 -0.10 0.001
Litter size 992 1.8 0.75 1 4 -0.12 0.359
Number
Weaned
537 1.5 0.70 0 4 0.22 0.239
Total birth weight
(kg)
227 10.2 4.81 3.3 23.6 0.01 0.786
Total 50d weight
(kg)
251 32.2 16.80 9.5 96.8 -0.02 0.142
1n = number of animal observations
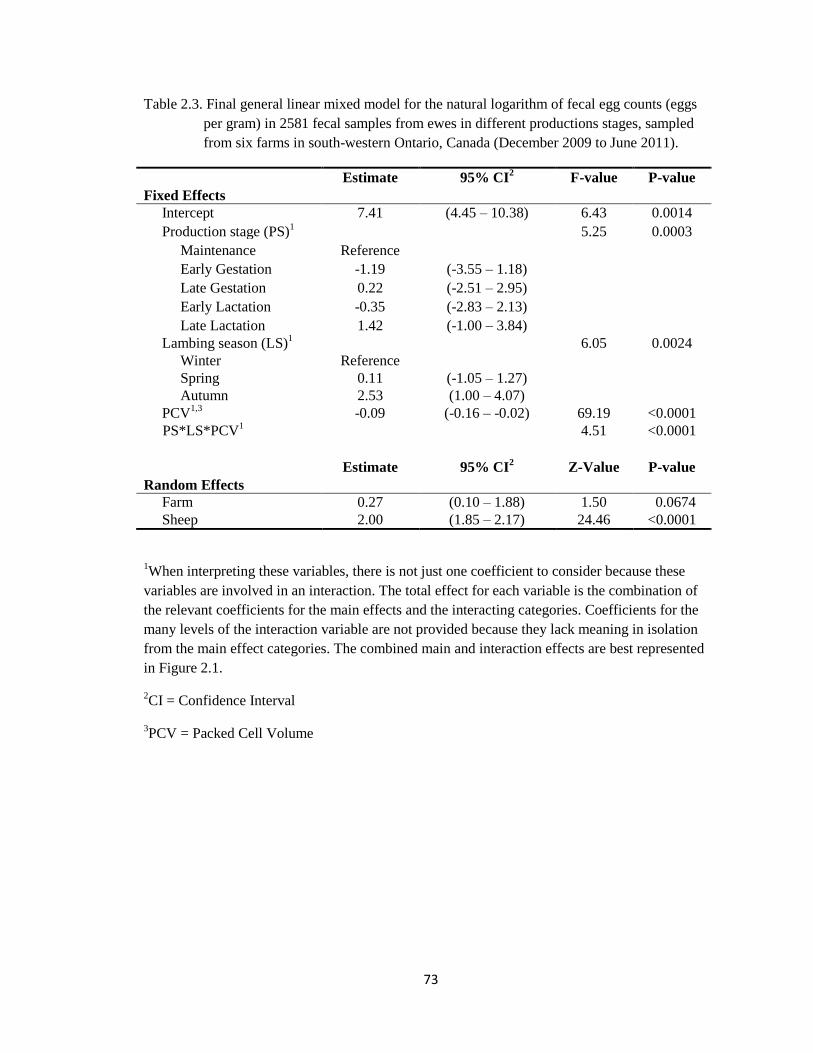
73
Table 2.3. Final general linear mixed model for the natural logarithm of fecal egg counts (eggs
per gram) in 2581 fecal samples from ewes in different productions stages, sampled
from six farms in south-western Ontario, Canada (December 2009 to June 2011).
Estimate 95% CI2
F-value P-value
Fixed Effects
Intercept 7.41 (4.45 – 10.38) 6.43 0.0014
Production stage (PS)1
5.25 0.0003
Maintenance Reference
Early Gestation -1.19 (-3.55 – 1.18)
Late Gestation 0.22 (-2.51 – 2.95)
Early Lactation -0.35 (-2.83 – 2.13)
Late Lactation 1.42 (-1.00 – 3.84)
Lambing season (LS)1
6.05 0.0024
Winter Reference
Spring 0.11 (-1.05 – 1.27)
Autumn 2.53 (1.00 – 4.07)
PCV1,3
-0.09 (-0.16 – -0.02) 69.19 <0.0001
PS*LS*PCV1
4.51 <0.0001
Estimate 95% CI2
Z-Value P-value
Random Effects
Farm 0.27 (0.10 – 1.88) 1.50 0.0674
Sheep 2.00 (1.85 – 2.17) 24.46 <0.0001
1When interpreting these variables, there is not just one coefficient to consider because these
variables are involved in an interaction. The total effect for each variable is the combination of
the relevant coefficients for the main effects and the interacting categories. Coefficients for the
many levels of the interaction variable are not provided because they lack meaning in isolation
from the main effect categories. The combined main and interaction effects are best represented
in Figure 2.1.
2CI = Confidence Interval
3PCV = Packed Cell Volume
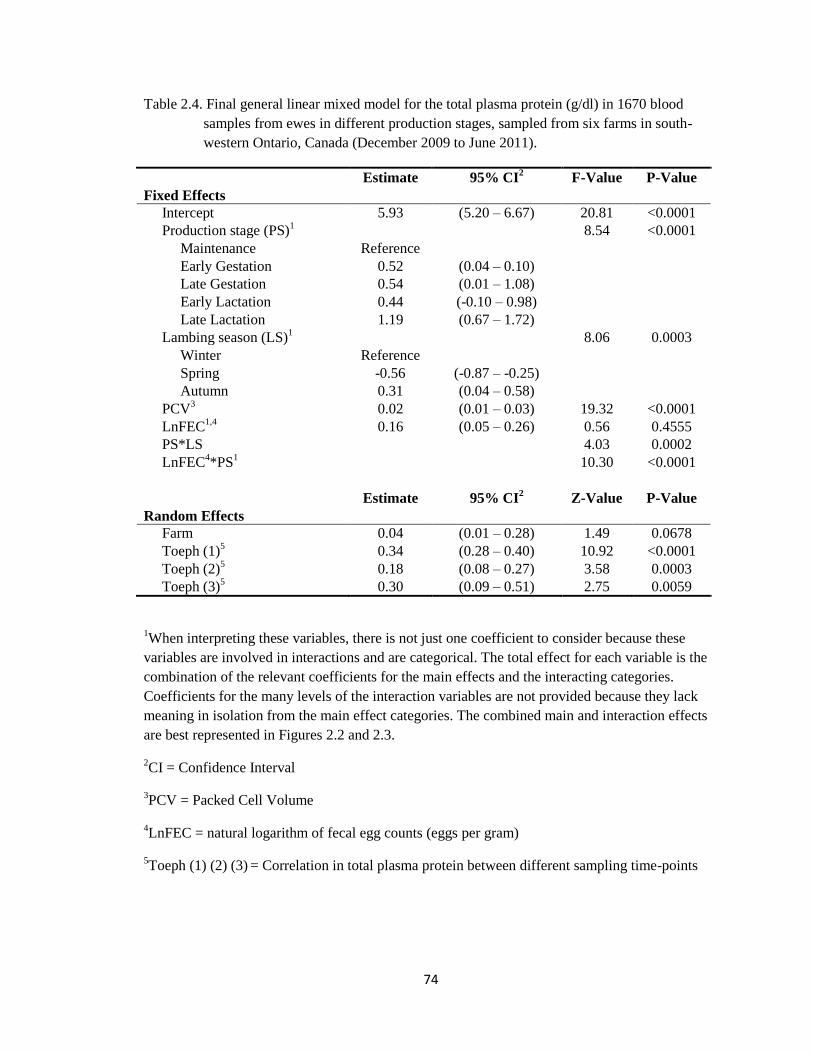
74
Table 2.4. Final general linear mixed model for the total plasma protein (g/dl) in 1670 blood
samples from ewes in different production stages, sampled from six farms in south-
western Ontario, Canada (December 2009 to June 2011).
Estimate 95% CI2
F-Value P-Value
Fixed Effects
Intercept 5.93 (5.20 – 6.67) 20.81 <0.0001
Production stage (PS)1
8.54 <0.0001
Maintenance Reference
Early Gestation 0.52 (0.04 – 0.10)
Late Gestation 0.54 (0.01 – 1.08)
Early Lactation 0.44 (-0.10 – 0.98)
Late Lactation 1.19 (0.67 – 1.72)
Lambing season (LS)1
8.06 0.0003
Winter Reference
Spring -0.56 (-0.87 – -0.25)
Autumn 0.31 (0.04 – 0.58)
PCV3
0.02 (0.01 – 0.03) 19.32 <0.0001
LnFEC1,4
0.16 (0.05 – 0.26) 0.56 0.4555
PS*LS
4.03 0.0002
LnFEC4*PS
1 10.30 <0.0001
Estimate 95% CI2
Z-Value P-Value
Random Effects
Farm 0.04 (0.01 – 0.28) 1.49 0.0678
Toeph (1)5
0.34 (0.28 – 0.40) 10.92 <0.0001
Toeph (2)5
0.18 (0.08 – 0.27) 3.58 0.0003
Toeph (3)5 0.30 (0.09 – 0.51) 2.75 0.0059
1When interpreting these variables, there is not just one coefficient to consider because these
variables are involved in interactions and are categorical. The total effect for each variable is the
combination of the relevant coefficients for the main effects and the interacting categories.
Coefficients for the many levels of the interaction variables are not provided because they lack
meaning in isolation from the main effect categories. The combined main and interaction effects
are best represented in Figures 2.2 and 2.3.
2CI = Confidence Interval
3PCV = Packed Cell Volume
4LnFEC = natural logarithm of fecal egg counts (eggs per gram)
5Toeph (1) (2) (3)
= Correlation in total plasma protein between different sampling time-points

75
Table 2.5. Final general linear mixed model for the packed cell volume (%) in 1662 blood
samples from ewes in different production stages, sampled from six farms in south-
western Ontario, Canada (December 2009 to June 2011).
Estimate 95% CI2
F-value P-value
Fixed Effects
Intercept 22.59 (18.34 – 26.85) 13.65 <0.0001
Production Stage (PS)1
2.56 0.0372
Maintenance Referent
Early Gestation 0.66 (-0.49 – 1.82)
Late Gestation 1.26 (-0.14 – 2.67)
Early Lactation 0.31 (-0.99 – 1.61)
Late Lactation -0.67 (-1.96 – 0.58)
Lambing Season (LS)1
3.40 0.0337
Winter Referent
Spring -0.03 (-1.82 – 1.75)
Autumn -0.66 (-2.17 – 0.85)
Total Plasma Protein 0.80 (0.51 – 1.10) 27.91 <0.0001
LnFEC3
1.62 (0.81 – 2.43) 15.42 <0.0001
LnFEC3*LnFEC
3 -0.20 (-0.27 - -0.13) 29.28 <0.0001
PS*LS1
5.89 <0.0001
Estimate 95% CI2
Z-value P-value
Random Effects
Farm 0.93 (0.34 – 7.00) 1.46 0.0727
Toeph (1)4
0.30 (0.23 – 0.36) 9.15 <0.0001
Toeph (2)4
0.28 (0.19 – 0.37) 6.12 <0.0001
Toeph (3)4
0.55 (0.40 – 0.70) 7.20 <0.0001
1When interpreting these variables, there is not just one coefficient to consider because these
variables are involved in interactions and are categorical. The total effect for each variable is the
combination of the relevant coefficients for the main effects and the interacting categories.
Coefficients for the many levels of the interaction variables are not provided because they lack
meaning in isolation from the main effect categories. The combined main and interaction effects
are best represented in Figure 5.
2CI = Confidence Interval
3LnFEC
= natural logarithm of fecal egg counts (eggs per gram)
4Toeph (1) (2) (3)
= Correlation in packed cell volume between different sampling time-points.
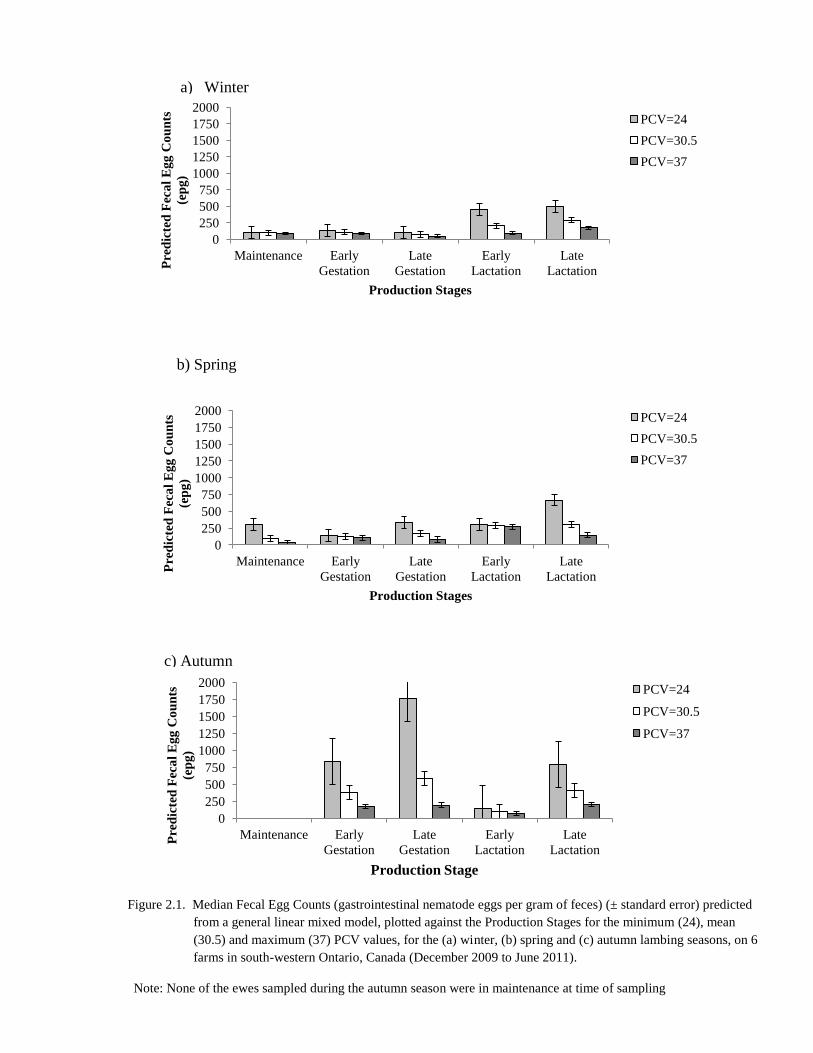
76
0
250
500
750
1000
1250
1500
1750
2000
Maintenance Early
Gestation
Late
Gestation
Early
Lactation
Late
Lactation
Pre
dic
ted
Fec
al
Eg
g C
ou
nts
(ep
g)
Production Stages
PCV=24
PCV=30.5
PCV=37
0
250
500
750
1000
1250
1500
1750
2000
Maintenance Early
Gestation
Late
Gestation
Early
Lactation
Late
Lactation
Pre
dic
ted
Fec
al
Eg
g C
ou
nts
(ep
g)
Production Stages
PCV=24
PCV=30.5
PCV=37
0
250
500
750
1000
1250
1500
1750
2000
Maintenance Early
Gestation
Late
Gestation
Early
Lactation
Late
Lactation
Pre
dic
ted
Fec
al
Eg
g C
ou
nts
(ep
g)
Production Stage
PCV=24
PCV=30.5
PCV=37
b) Spring
a) Winter
c) Autumn
Figure 2.1. Median Fecal Egg Counts (gastrointestinal nematode eggs per gram of feces) (± standard error) predicted
from a general linear mixed model, plotted against the Production Stages for the minimum (24), mean
(30.5) and maximum (37) PCV values, for the (a) winter, (b) spring and (c) autumn lambing seasons, on 6
farms in south-western Ontario, Canada (December 2009 to June 2011).
Note: None of the ewes sampled during the autumn season were in maintenance at time of sampling
*None of the ewes sampled during the autumn season were in maintenance at time of sampling
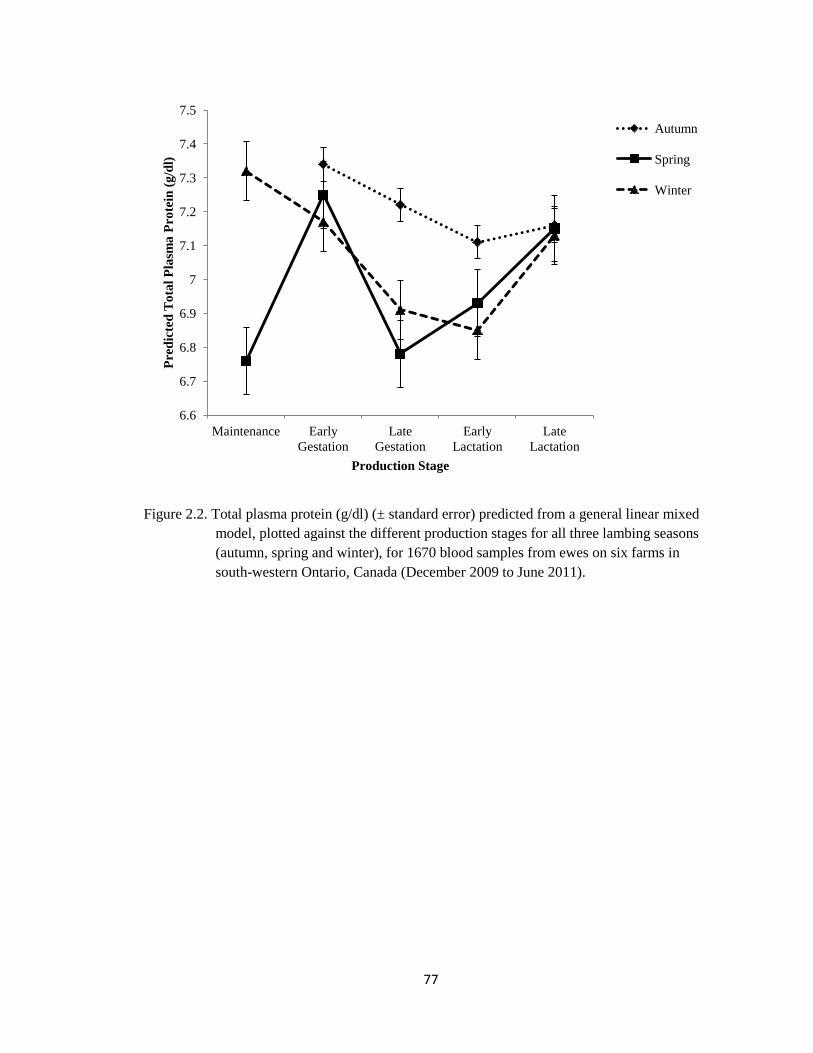
77
Figure 2.2. Total plasma protein (g/dl) (± standard error) predicted from a general linear mixed
model, plotted against the different production stages for all three lambing seasons
(autumn, spring and winter), for 1670 blood samples from ewes on six farms in
south-western Ontario, Canada (December 2009 to June 2011).
6.6
6.7
6.8
6.9
7
7.1
7.2
7.3
7.4
7.5
Maintenance Early
Gestation
Late
Gestation
Early
Lactation
Late
Lactation
Pre
dic
ted
To
tal
Pla
sma
Pro
tein
(g
/dl)
Production Stage
Autumn
Spring
Winter
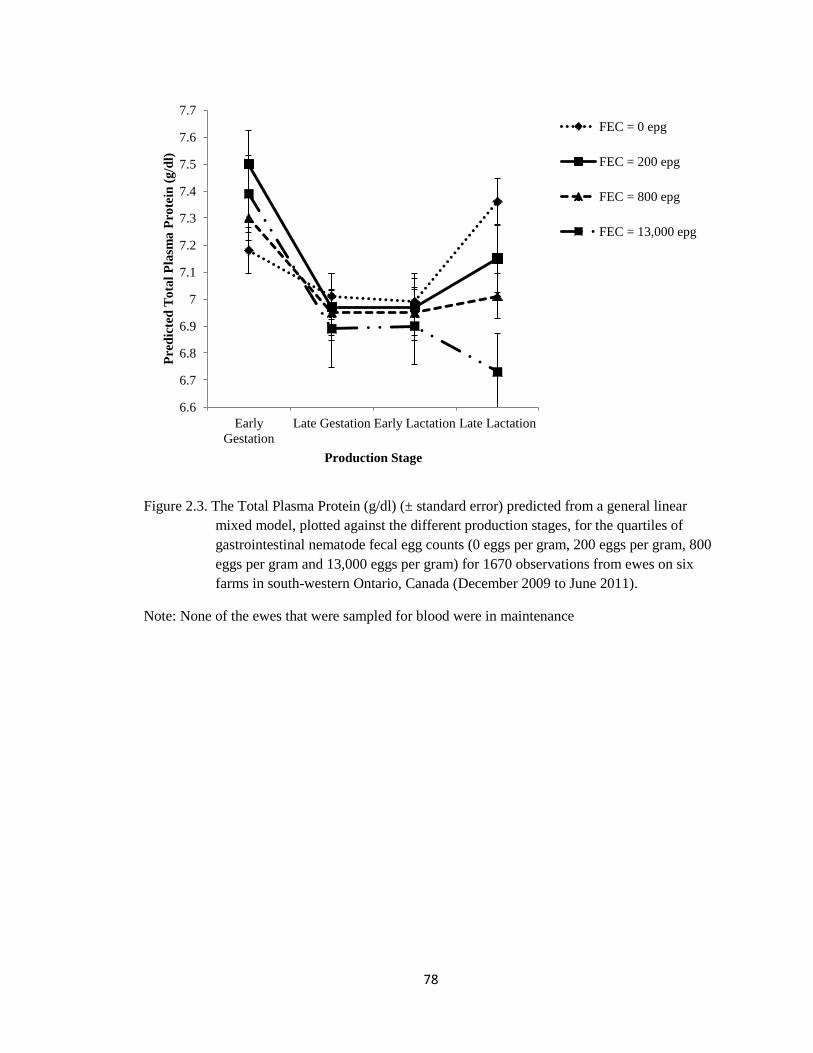
78
Figure 2.3. The Total Plasma Protein (g/dl) (± standard error) predicted from a general linear
mixed model, plotted against the different production stages, for the quartiles of
gastrointestinal nematode fecal egg counts (0 eggs per gram, 200 eggs per gram, 800
eggs per gram and 13,000 eggs per gram) for 1670 observations from ewes on six
farms in south-western Ontario, Canada (December 2009 to June 2011).
Note: None of the ewes that were sampled for blood were in maintenance
6.6
6.7
6.8
6.9
7
7.1
7.2
7.3
7.4
7.5
7.6
7.7
Early
Gestation
Late Gestation Early Lactation Late Lactation
Pre
dic
ted
To
tal
Pla
sma
Pro
tein
(g
/dl)
Production Stage
FEC = 0 epg
FEC = 200 epg
FEC = 800 epg
FEC = 13,000 epg
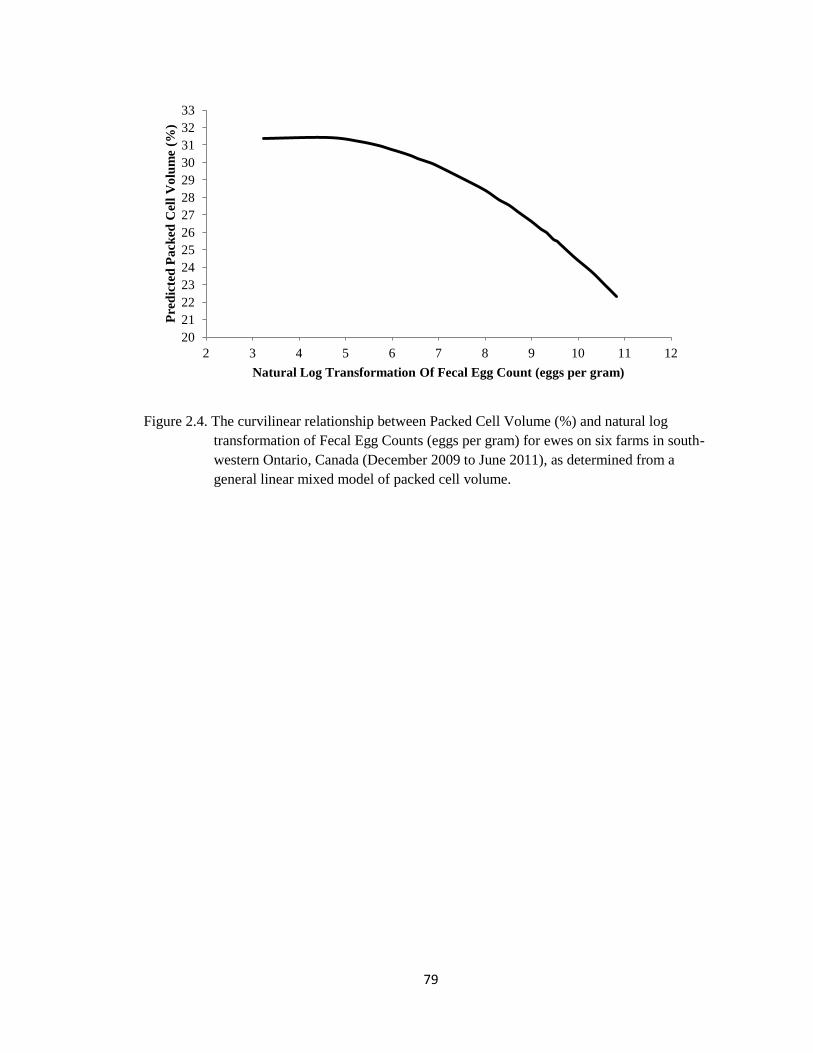
79
Figure 2.4. The curvilinear relationship between Packed Cell Volume (%) and natural log
transformation of Fecal Egg Counts (eggs per gram) for ewes on six farms in south-
western Ontario, Canada (December 2009 to June 2011), as determined from a
general linear mixed model of packed cell volume.
20
21
22
23
24
25
26
27
28
29
30
31
32
33
2 3 4 5 6 7 8 9 10 11 12
Pre
dic
ted
Pa
cked
Cel
l V
olu
me
(%)
Natural Log Transformation Of Fecal Egg Count (eggs per gram)
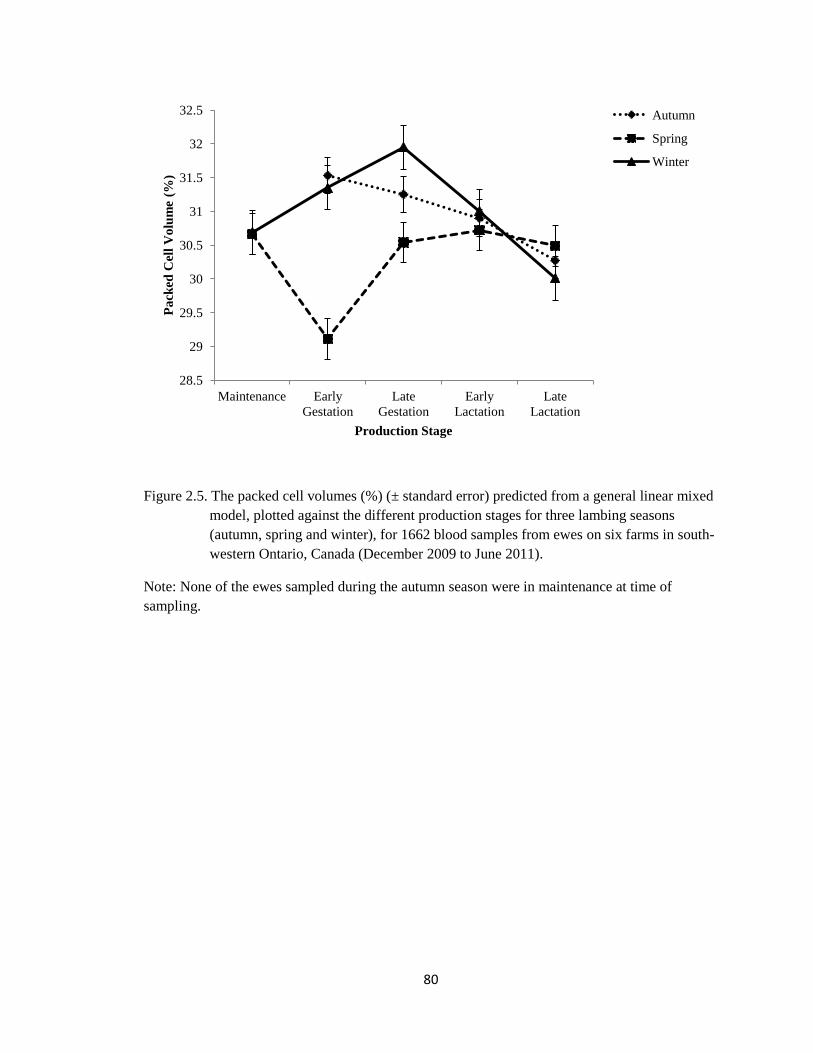
80
Figure 2.5. The packed cell volumes (%) (± standard error) predicted from a general linear mixed
model, plotted against the different production stages for three lambing seasons
(autumn, spring and winter), for 1662 blood samples from ewes on six farms in south-
western Ontario, Canada (December 2009 to June 2011).
Note: None of the ewes sampled during the autumn season were in maintenance at time of
sampling.
28.5
29
29.5
30
30.5
31
31.5
32
32.5
Maintenance Early
Gestation
Late
Gestation
Early
Lactation
Late
Lactation
Pa
cked
Cel
l V
olu
me
(%)
Production Stage
Autumn
Spring
Winter
81
CHAPTER 3
Pilot project to investigate over-wintering of free-living gastrointestinal nematode
larvae of sheep, in Ontario, Canada
In preparation for Small Ruminant Research
Abstract
Gastro-intestinal nematodes (GINs) have a direct life-cycle, with both free-living and
parasitic stages. This pilot study was carried out to describe pasture-level environmental
conditions that may be associated with overwintering survival and infectivity of free-
living GIN stages on pasture on sheep farms in Ontario, Canada. One acre sections of
pasture grazed in the previous season by GIN-infected sheep were assessed on three
farms, starting in the winter after animal removal, until the following spring before turn-
out (January - April). Environmental data were collected using electronic data-loggers,
which measured air and soil temperature, soil moisture and air relative humidity. The
presence and type of GIN larvae on pasture were assessed by collecting monthly herbage
and soil samples over the winter months. The infectivity of larvae in the spring was
assessed by grazing 16 naïve lambs for 28 days, after which the lambs were slaughtered
and the contents of their gastro-intestinal tracts analyzed for the presence of GINs. The
lowest air and soil temperatures (-25.7°C and -19.8°C, respectively), and the lowest air
relative humidity (15.0%), were recorded in January, while the lowest daily soil water
content (-0.20 m3/m
3) was recorded in March. Free-living stages of Trichostrongylus spp.
(84.7 L3/kg dry matter [DM]) and Nematodirus spp. (42.4 L3/kg DM) were isolated from
herbage samples collected in March on one farm; no larvae were isolated from the other
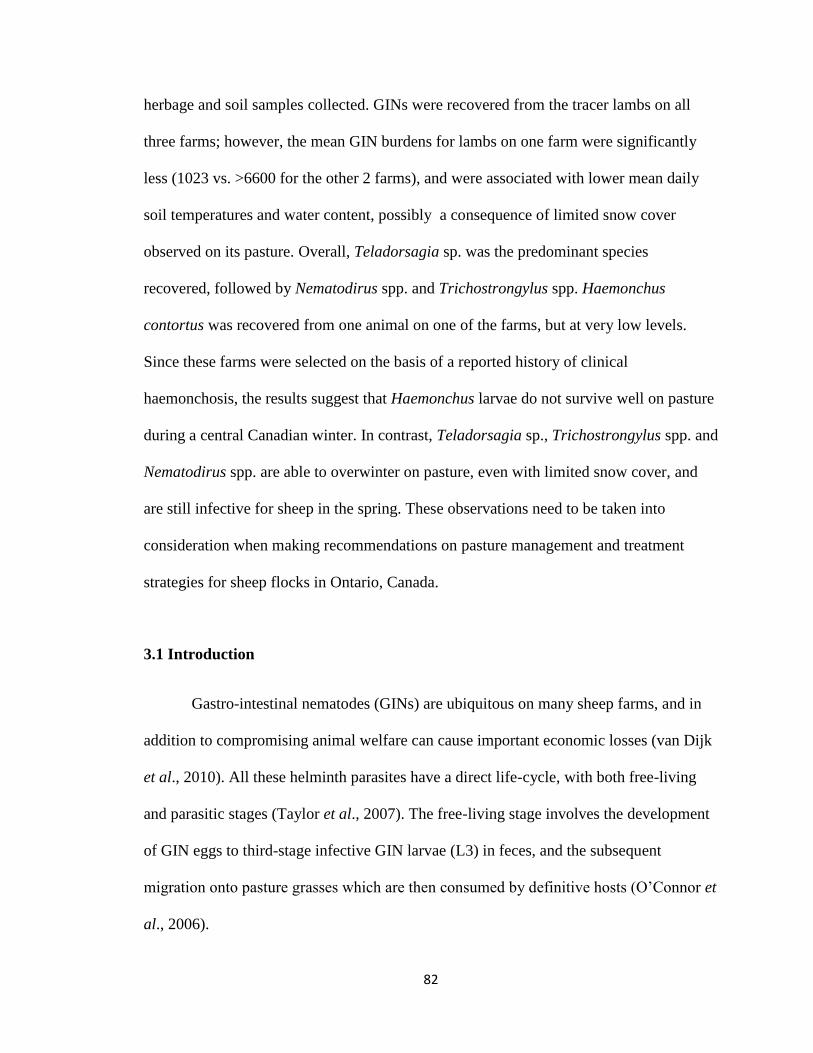
82
herbage and soil samples collected. GINs were recovered from the tracer lambs on all
three farms; however, the mean GIN burdens for lambs on one farm were significantly
less (1023 vs. >6600 for the other 2 farms), and were associated with lower mean daily
soil temperatures and water content, possibly a consequence of limited snow cover
observed on its pasture. Overall, Teladorsagia sp. was the predominant species
recovered, followed by Nematodirus spp. and Trichostrongylus spp. Haemonchus
contortus was recovered from one animal on one of the farms, but at very low levels.
Since these farms were selected on the basis of a reported history of clinical
haemonchosis, the results suggest that Haemonchus larvae do not survive well on pasture
during a central Canadian winter. In contrast, Teladorsagia sp., Trichostrongylus spp. and
Nematodirus spp. are able to overwinter on pasture, even with limited snow cover, and
are still infective for sheep in the spring. These observations need to be taken into
consideration when making recommendations on pasture management and treatment
strategies for sheep flocks in Ontario, Canada.
3.1 Introduction
Gastro-intestinal nematodes (GINs) are ubiquitous on many sheep farms, and in
addition to compromising animal welfare can cause important economic losses (van Dijk
et al., 2010). All these helminth parasites have a direct life-cycle, with both free-living
and parasitic stages (Taylor et al., 2007). The free-living stage involves the development
of GIN eggs to third-stage infective GIN larvae (L3) in feces, and the subsequent
migration onto pasture grasses which are then consumed by definitive hosts (O’Connor et
al., 2006).
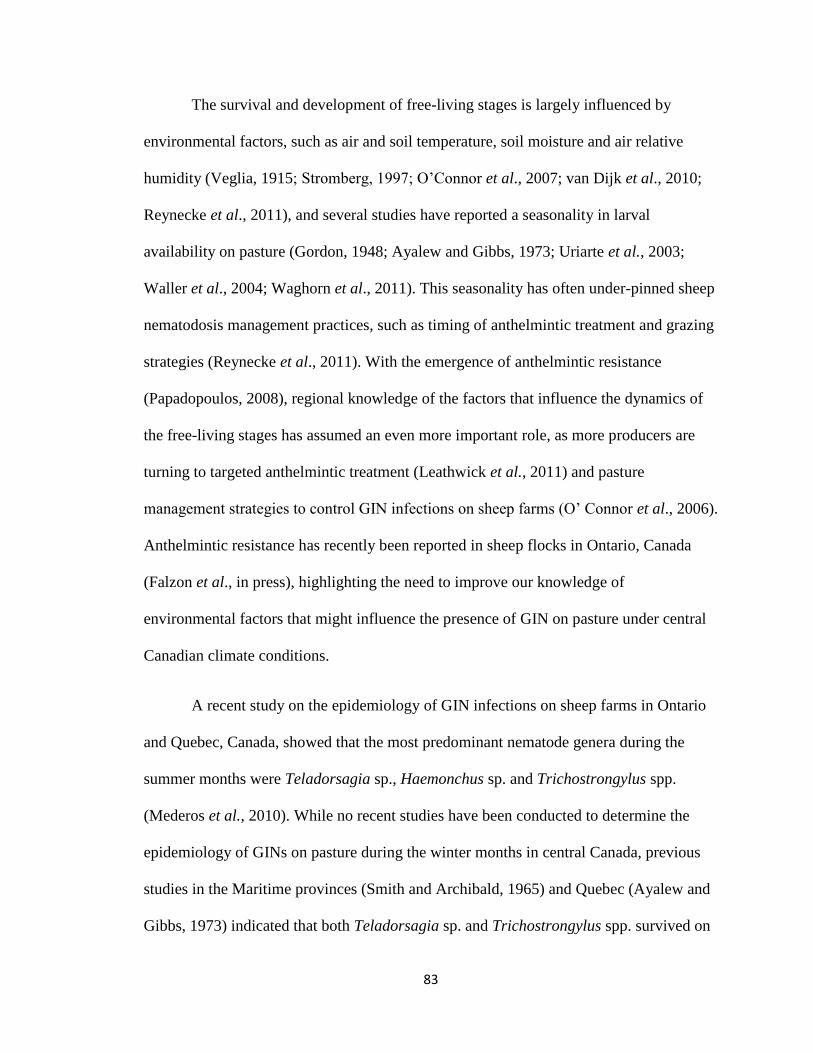
83
The survival and development of free-living stages is largely influenced by
environmental factors, such as air and soil temperature, soil moisture and air relative
humidity (Veglia, 1915; Stromberg, 1997; O’Connor et al., 2007; van Dijk et al., 2010;
Reynecke et al., 2011), and several studies have reported a seasonality in larval
availability on pasture (Gordon, 1948; Ayalew and Gibbs, 1973; Uriarte et al., 2003;
Waller et al., 2004; Waghorn et al., 2011). This seasonality has often under-pinned sheep
nematodosis management practices, such as timing of anthelmintic treatment and grazing
strategies (Reynecke et al., 2011). With the emergence of anthelmintic resistance
(Papadopoulos, 2008), regional knowledge of the factors that influence the dynamics of
the free-living stages has assumed an even more important role, as more producers are
turning to targeted anthelmintic treatment (Leathwick et al., 2011) and pasture
management strategies to control GIN infections on sheep farms (O’ Connor et al., 2006).
Anthelmintic resistance has recently been reported in sheep flocks in Ontario, Canada
(Falzon et al., in press), highlighting the need to improve our knowledge of
environmental factors that might influence the presence of GIN on pasture under central
Canadian climate conditions.
A recent study on the epidemiology of GIN infections on sheep farms in Ontario
and Quebec, Canada, showed that the most predominant nematode genera during the
summer months were Teladorsagia sp., Haemonchus sp. and Trichostrongylus spp.
(Mederos et al., 2010). While no recent studies have been conducted to determine the
epidemiology of GINs on pasture during the winter months in central Canada, previous
studies in the Maritime provinces (Smith and Archibald, 1965) and Quebec (Ayalew and
Gibbs, 1973) indicated that both Teladorsagia sp. and Trichostrongylus spp. survived on
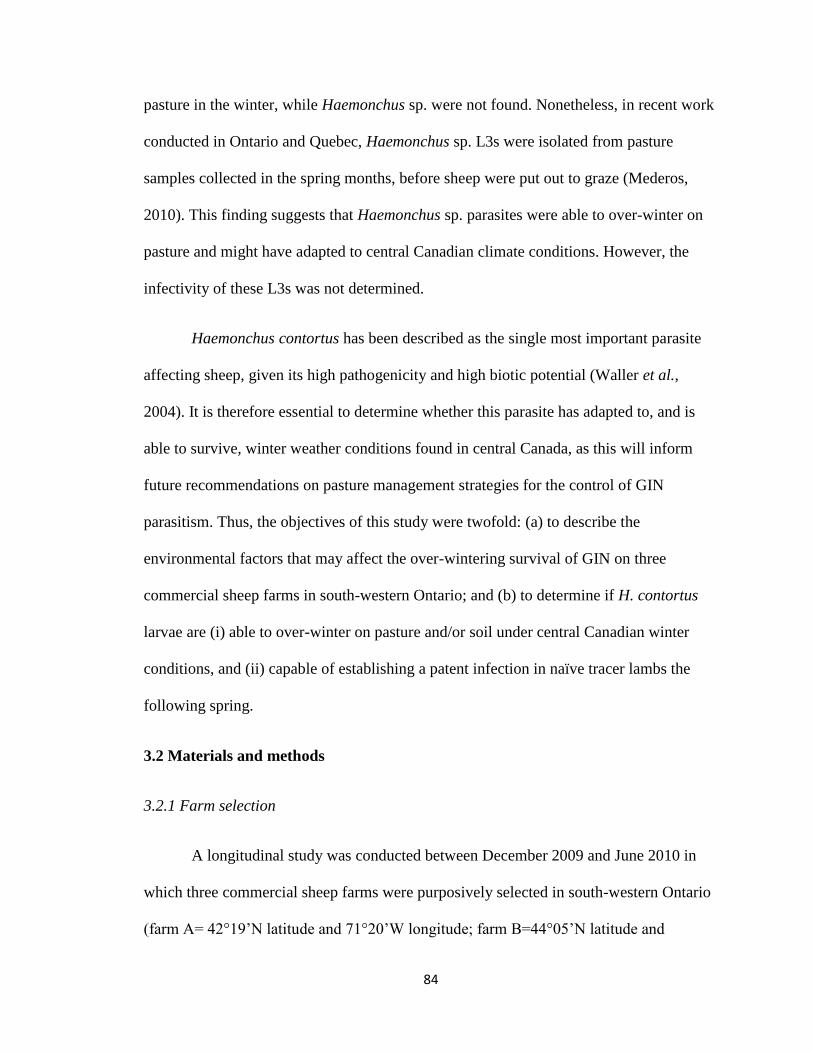
84
pasture in the winter, while Haemonchus sp. were not found. Nonetheless, in recent work
conducted in Ontario and Quebec, Haemonchus sp. L3s were isolated from pasture
samples collected in the spring months, before sheep were put out to graze (Mederos,
2010). This finding suggests that Haemonchus sp. parasites were able to over-winter on
pasture and might have adapted to central Canadian climate conditions. However, the
infectivity of these L3s was not determined.
Haemonchus contortus has been described as the single most important parasite
affecting sheep, given its high pathogenicity and high biotic potential (Waller et al.,
2004). It is therefore essential to determine whether this parasite has adapted to, and is
able to survive, winter weather conditions found in central Canada, as this will inform
future recommendations on pasture management strategies for the control of GIN
parasitism. Thus, the objectives of this study were twofold: (a) to describe the
environmental factors that may affect the over-wintering survival of GIN on three
commercial sheep farms in south-western Ontario; and (b) to determine if H. contortus
larvae are (i) able to over-winter on pasture and/or soil under central Canadian winter
conditions, and (ii) capable of establishing a patent infection in naïve tracer lambs the
following spring.
3.2 Materials and methods
3.2.1 Farm selection
A longitudinal study was conducted between December 2009 and June 2010 in
which three commercial sheep farms were purposively selected in south-western Ontario
(farm A= 42°19’N latitude and 71°20’W longitude; farm B=44°05’N latitude and
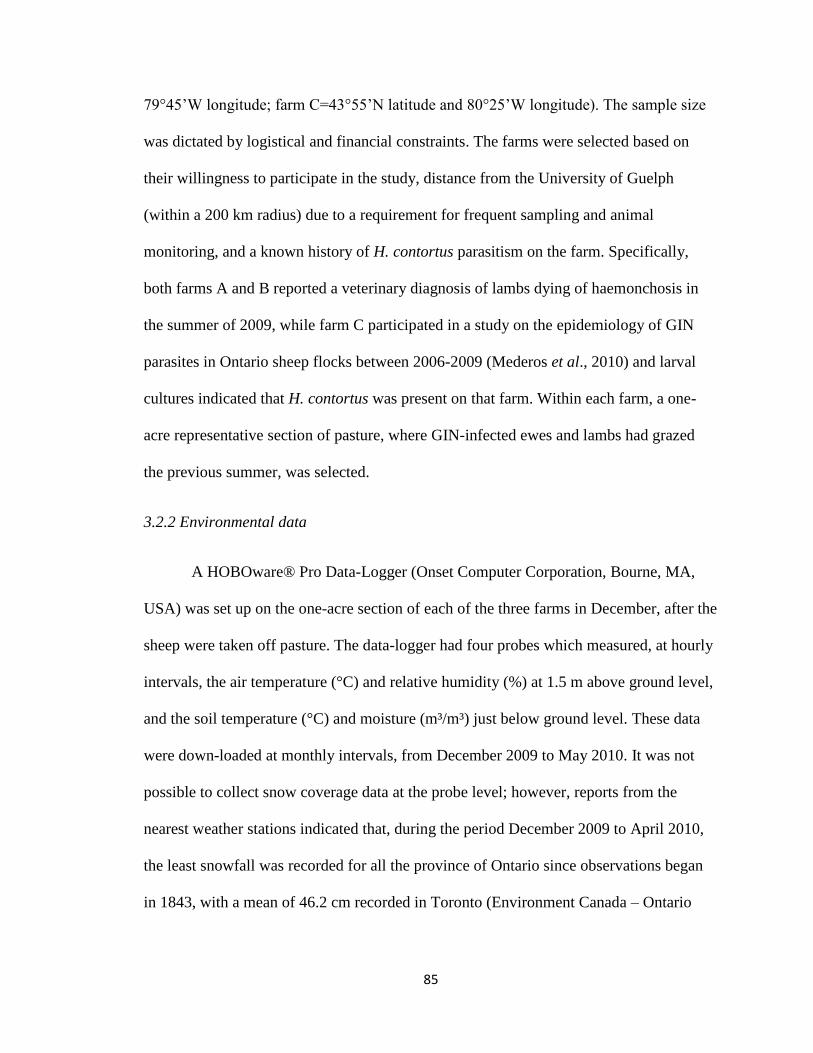
85
79°45’W longitude; farm C=43°55’N latitude and 80°25’W longitude). The sample size
was dictated by logistical and financial constraints. The farms were selected based on
their willingness to participate in the study, distance from the University of Guelph
(within a 200 km radius) due to a requirement for frequent sampling and animal
monitoring, and a known history of H. contortus parasitism on the farm. Specifically,
both farms A and B reported a veterinary diagnosis of lambs dying of haemonchosis in
the summer of 2009, while farm C participated in a study on the epidemiology of GIN
parasites in Ontario sheep flocks between 2006-2009 (Mederos et al., 2010) and larval
cultures indicated that H. contortus was present on that farm. Within each farm, a one-
acre representative section of pasture, where GIN-infected ewes and lambs had grazed
the previous summer, was selected.
3.2.2 Environmental data
A HOBOware® Pro Data-Logger (Onset Computer Corporation, Bourne, MA,
USA) was set up on the one-acre section of each of the three farms in December, after the
sheep were taken off pasture. The data-logger had four probes which measured, at hourly
intervals, the air temperature (°C) and relative humidity (%) at 1.5 m above ground level,
and the soil temperature (°C) and moisture (m³/m³) just below ground level. These data
were down-loaded at monthly intervals, from December 2009 to May 2010. It was not
possible to collect snow coverage data at the probe level; however, reports from the
nearest weather stations indicated that, during the period December 2009 to April 2010,
the least snowfall was recorded for all the province of Ontario since observations began
in 1843, with a mean of 46.2 cm recorded in Toronto (Environment Canada – Ontario
86
Weather Review, 2010). Anecdotally, less snow cover was observed on farm C,
compared to farms A and B.
3.2.3 Sampling of herbage and soil
Herbage and soil samples were collected on a monthly basis during the winter
months (January to April 2010) from the one-acre sections on each of the three farms.
Both herbage and soil samples were collected by walking two “W” routes in the one-acre
section and stopping every 20-30 paces. The herbage was clipped as close as possible to
the ground, avoiding fecal and soil contamination; the total amount of herbage collected
in each paddock section did not exceed 500 g wet weight. Soil samples were collected
using a 30 cm soil auger; core samples were divided into ‘upper 15 cm soil’ (i.e. 0-15cm)
and ‘lower 15 cm soil’ (i.e. >15-30cm) segments (Ministry of Agriculture, Fisheries and
Food, 1986).
3.2.4 Tracer lambs
In April-May 2010, 16 Rideau-Arcott X Dorset weaned lambs of 3-4 months of
age, were selected from the Ponsonby Sheep Research Centre at the University of
Guelph, weighed, and treated with 10 mg/kg bodyweight fenbendazole (Safe-Guard™
Suspension 10%, Intervet Canada Ltd.). The flock at the Ponsonby Sheep Research
Centre has been closed for the past 22 years, and from data acquired from repeated
monitoring of fecal egg counts (FECs) and necropsy examinations, is considered to be
free of infection from all GIN species, except for Nematodirus filicollis. Therefore, the
lambs could be considered naïve. Moreover, these animals had never been on pasture,
87
and fecal samples collected from the lambs on day 0 (i.e. when lambs were put on
pasture) showed zero GIN FECs.
The lambs were put out to graze for 28 days, starting at the same time the rest of
the flock was put on pasture (11th
May on farm A, 14th
April on farm B, and 13th
May on
farm C): five animals on each of farms A and B, and six animals on farm C. Six lambs
were used on farm C instead of five because an additional lamb was available at the
Ponsonby Sheep Research Centre. On two of the farms (farm A and C), the same one-
acre sections of the paddocks that were sampled in the winter months were fenced off,
and the tracer lambs were left to graze on these sections without comingling with other
sheep. On farm B, the owner wanted the tracer lambs rotationally grazed with the rest of
the flock, which was moved onto different fenced-off paddocks, including the paddock
with the one-acre section sampled in the winter, every 3-4 days. The sheep only grazed
the pastures that had been grazed in the previous season but not yet that spring, and the
tracer lambs did not return to the same paddock during their 28-day grazing period. Since
this was done in April when maximum daily temperatures were still cool, it was
improbable that any GIN eggs shed by the rest of the flock would develop into infective
L3s within 3-4 days, as this normally takes a minimum of at least 5 days under optimal
environmental conditions (Taylor et al., 2007). After 28 days of grazing, the lambs were
weighed and slaughtered at the abattoir of the Food Science Department, University of
Guelph. At necropsy, the abomasum, small intestine and large intestine from each lamb
were tied, isolated, and transported in buckets over a period of 1h to the Ontario
Veterinary College (OVC) necropsy room for further processing.
88
3.2.5 Laboratory methods
Herbage and soil samples were processed at the Parasitology laboratory,
Department of Pathobiology, OVC, University of Guelph. Herbage samples were placed
in a 9” diameter, 2.5 L capacity, funnel fitted with a scientific cleaning wipe (Kimwipes®,
Kimberly-Clark Company, Texas, USA) which was laid over a removable wire mesh. A
small length of hard rubber tubing was attached to the stem of the funnel, and the end of
the tubing was fitted with a 50 ml plastic centrifuge tube. The funnel was filled with
lukewarm water until the grass sample was submerged, and the sample was left
overnight. The next day, the water was removed with a suction apparatus, and the
centrifuge tube was detached. The tube was centrifuged at 1800 g for 2 minutes, and the
supernatant discarded. The sediment (approximately 1 ml) was collected; two drops of
the mixed sediment were transferred to a microscope slide and one drop of Lugol’s iodine
was added to kill and stain the larvae. A 24x50mm cover slip was placed over the
mixture and the slide was examined at a magnification of 100-400x (as required). This
was repeated until all the sediment collected had been examined. All L3s recovered were
identified to the genus level and counted. The grass sample was then transferred onto a
tray, dried in an incubator at 37°C until brittle, and its weight recorded. The number of
larvae in the herbage samples was expressed as larvae per kg dry matter (DM).
The same Baermann procedure described above was used for examination of soil
samples, except that samples were submerged in lukewarm water for 48 hours. Free
living soil nematodes were differentiated from infective L3s based on morphological
features and Lugol-staining properties. Larval recovery was presented as presence or
absence of larvae at a depth of 0-15 cm or >15-30 cm below the surface.
89
The lamb necropsies to determine GIN parasite infection were performed
according to the method described by the Ministry of Agriculture, Fisheries and Food
(1986), with minor modifications. Briefly, at necropsy, the abomasum, small intestine
and caecum of each lamb were separated, opened, and the contents collected in separate
buckets. The organs were then each washed in 5 L of lukewarm water. While mixing
vigorously, a 1 L sample was collected in a pre-labeled plastic bottle and left to stand for
5-6 hours, after which the top 100 ml was removed and replaced with 100 ml 40%
formaldehyde solution (i.e. 100% formalin).
After the aforementioned washing, the organs were placed in 5 L warm water and
left overnight, to recover any larvae remaining in the mucosa (Gasbarre, 1987). The
following day, the organs were scraped using a scalpel, and 1 L aliquots were collected
and kept with a final concentration of 10% formalin until further analysis. All worms
recovered were counted and identified microscopically to the species level using
identification keys provided by Ministry of Agriculture, Fisheries and Food (1986).
3.2.6 Statistical analysis
The environmental data were first exported into a Microsoft Excel (Microsoft
Office Excel©
, 2007) spreadsheet, and then into SAS® 9.3 (SAS Institute Inc., Cary, NC,
USA) for data cleaning. The data for each month from the three farms were merged
together, then separated into four datasets for each of the four environmental variables
measured (air and soil temperature, soil volumetric water content and air relative
humidity). Only data from 26th
December 2009 to 31st May 2010 were kept in the dataset
as this corresponded to the relevant study period. Descriptive statistics were carried out to

90
calculate the daily mean, minimum and maximum measurements on the three farms, for
each environmental variable – these measurements were chosen to be consistent with the
measurements used by meteorological services, as suggested by O’Connor et al. (2006).
Herbage, soil and tracer lamb data were manually entered into a Microsoft Excel
spreadsheet, and a student’s t-test used to compare the mean tracer lamb worm counts
between the three farms. An alpha value ≤0.05 was considered to be statistically
significant.
3.3 Results
3.3.1 Farm description
All three study farms kept Rideau or Rideau X Polled Dorset breed sheep for meat
purposes, practiced out-of-season lambing, and used ultrasound for pregnancy diagnosis.
However, the farms had different flock sizes and represented 3 of the 11 Ontario Sheep
Marketing Agency districts (Ontario Sheep Marketing Agency, 2012): Farm A was in
District 7 and had 2000 breeding ewes; Farm B was in District 6 and had 400 breeding
ewes; Farm C was in District 5 and had 130 breeding ewes.
3.3.2 Environmental data
The overall daily mean air temperature in January, the coldest month for the study
period December 2009 to May 2010, was -7.0°C. The daily mean air temperatures
showed a similar level and trend on all three farms (Fig. 3.1). Temperatures remained
below freezing point for most of January and February, then increased above freezing
point in March, though a dip in the temperature was observed in the second part of
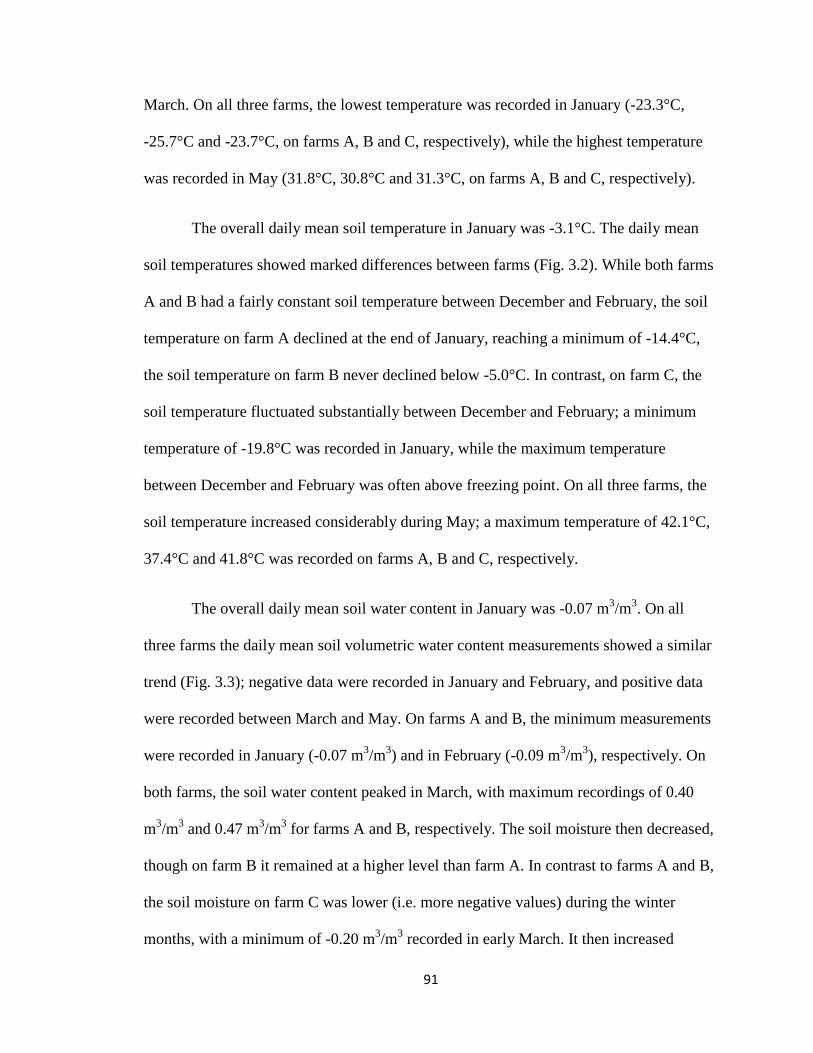
91
March. On all three farms, the lowest temperature was recorded in January (-23.3°C,
-25.7°C and -23.7°C, on farms A, B and C, respectively), while the highest temperature
was recorded in May (31.8°C, 30.8°C and 31.3°C, on farms A, B and C, respectively).
The overall daily mean soil temperature in January was -3.1°C. The daily mean
soil temperatures showed marked differences between farms (Fig. 3.2). While both farms
A and B had a fairly constant soil temperature between December and February, the soil
temperature on farm A declined at the end of January, reaching a minimum of -14.4°C,
the soil temperature on farm B never declined below -5.0°C. In contrast, on farm C, the
soil temperature fluctuated substantially between December and February; a minimum
temperature of -19.8°C was recorded in January, while the maximum temperature
between December and February was often above freezing point. On all three farms, the
soil temperature increased considerably during May; a maximum temperature of 42.1°C,
37.4°C and 41.8°C was recorded on farms A, B and C, respectively.
The overall daily mean soil water content in January was -0.07 m3/m
3. On all
three farms the daily mean soil volumetric water content measurements showed a similar
trend (Fig. 3.3); negative data were recorded in January and February, and positive data
were recorded between March and May. On farms A and B, the minimum measurements
were recorded in January (-0.07 m3/m
3) and in February (-0.09 m
3/m
3), respectively. On
both farms, the soil water content peaked in March, with maximum recordings of 0.40
m3/m
3 and 0.47 m
3/m
3 for farms A and B, respectively. The soil moisture then decreased,
though on farm B it remained at a higher level than farm A. In contrast to farms A and B,
the soil moisture on farm C was lower (i.e. more negative values) during the winter
months, with a minimum of -0.20 m3/m
3 recorded in early March. It then increased
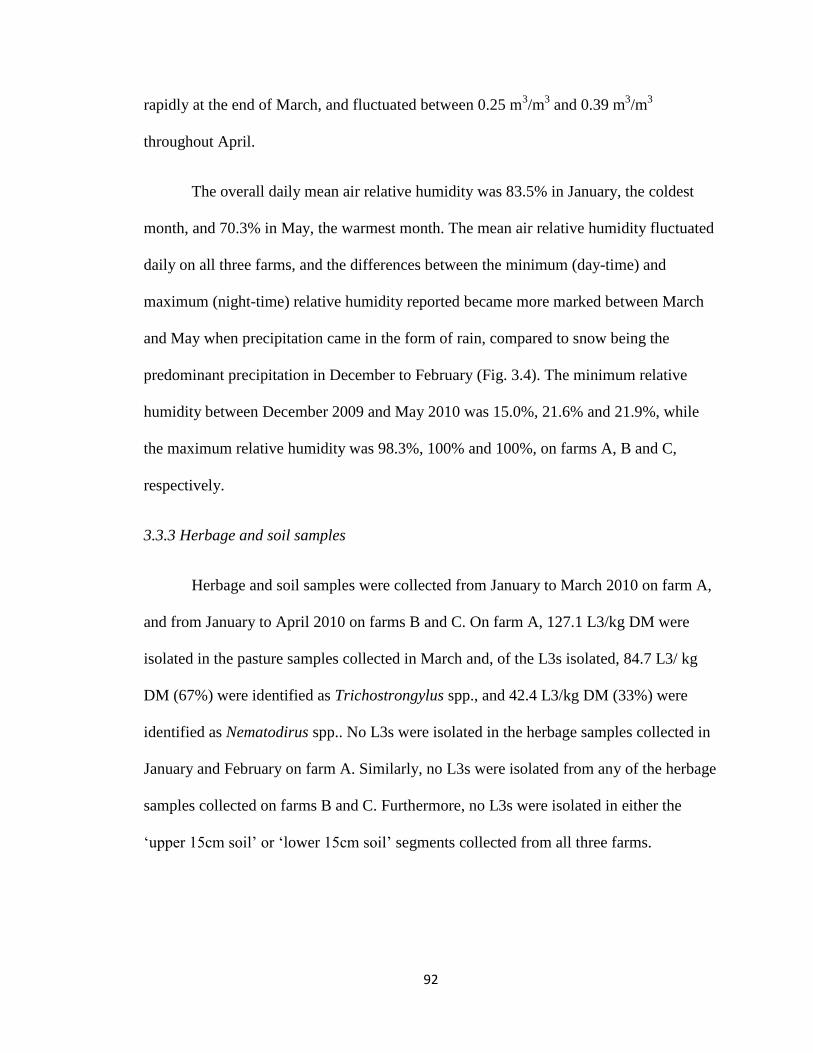
92
rapidly at the end of March, and fluctuated between 0.25 m3/m
3 and 0.39 m
3/m
3
throughout April.
The overall daily mean air relative humidity was 83.5% in January, the coldest
month, and 70.3% in May, the warmest month. The mean air relative humidity fluctuated
daily on all three farms, and the differences between the minimum (day-time) and
maximum (night-time) relative humidity reported became more marked between March
and May when precipitation came in the form of rain, compared to snow being the
predominant precipitation in December to February (Fig. 3.4). The minimum relative
humidity between December 2009 and May 2010 was 15.0%, 21.6% and 21.9%, while
the maximum relative humidity was 98.3%, 100% and 100%, on farms A, B and C,
respectively.
3.3.3 Herbage and soil samples
Herbage and soil samples were collected from January to March 2010 on farm A,
and from January to April 2010 on farms B and C. On farm A, 127.1 L3/kg DM were
isolated in the pasture samples collected in March and, of the L3s isolated, 84.7 L3/ kg
DM (67%) were identified as Trichostrongylus spp., and 42.4 L3/kg DM (33%) were
identified as Nematodirus spp.. No L3s were isolated in the herbage samples collected in
January and February on farm A. Similarly, no L3s were isolated from any of the herbage
samples collected on farms B and C. Furthermore, no L3s were isolated in either the
‘upper 15cm soil’ or ‘lower 15cm soil’ segments collected from all three farms.
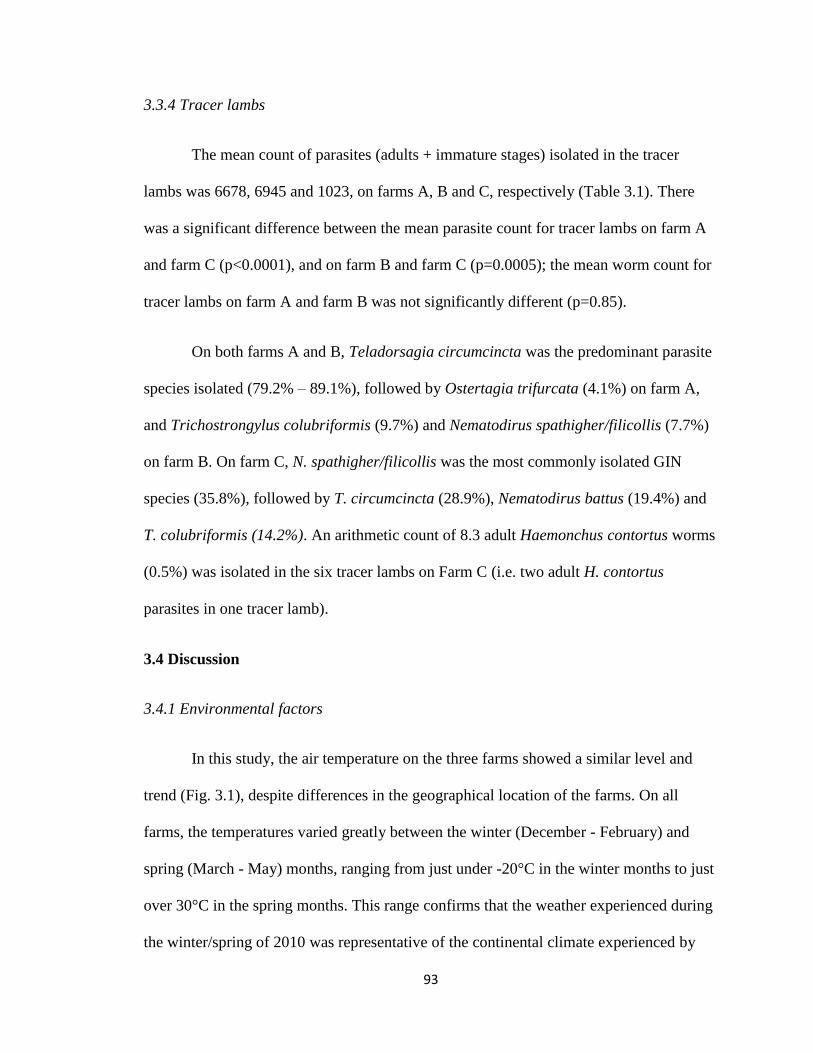
93
3.3.4 Tracer lambs
The mean count of parasites (adults + immature stages) isolated in the tracer
lambs was 6678, 6945 and 1023, on farms A, B and C, respectively (Table 3.1). There
was a significant difference between the mean parasite count for tracer lambs on farm A
and farm C (p<0.0001), and on farm B and farm C (p=0.0005); the mean worm count for
tracer lambs on farm A and farm B was not significantly different (p=0.85).
On both farms A and B, Teladorsagia circumcincta was the predominant parasite
species isolated (79.2% – 89.1%), followed by Ostertagia trifurcata (4.1%) on farm A,
and Trichostrongylus colubriformis (9.7%) and Nematodirus spathigher/filicollis (7.7%)
on farm B. On farm C, N. spathigher/filicollis was the most commonly isolated GIN
species (35.8%), followed by T. circumcincta (28.9%), Nematodirus battus (19.4%) and
T. colubriformis (14.2%). An arithmetic count of 8.3 adult Haemonchus contortus worms
(0.5%) was isolated in the six tracer lambs on Farm C (i.e. two adult H. contortus
parasites in one tracer lamb).
3.4 Discussion
3.4.1 Environmental factors
In this study, the air temperature on the three farms showed a similar level and
trend (Fig. 3.1), despite differences in the geographical location of the farms. On all
farms, the temperatures varied greatly between the winter (December - February) and
spring (March - May) months, ranging from just under -20°C in the winter months to just
over 30°C in the spring months. This range confirms that the weather experienced during
the winter/spring of 2010 was representative of the continental climate experienced by
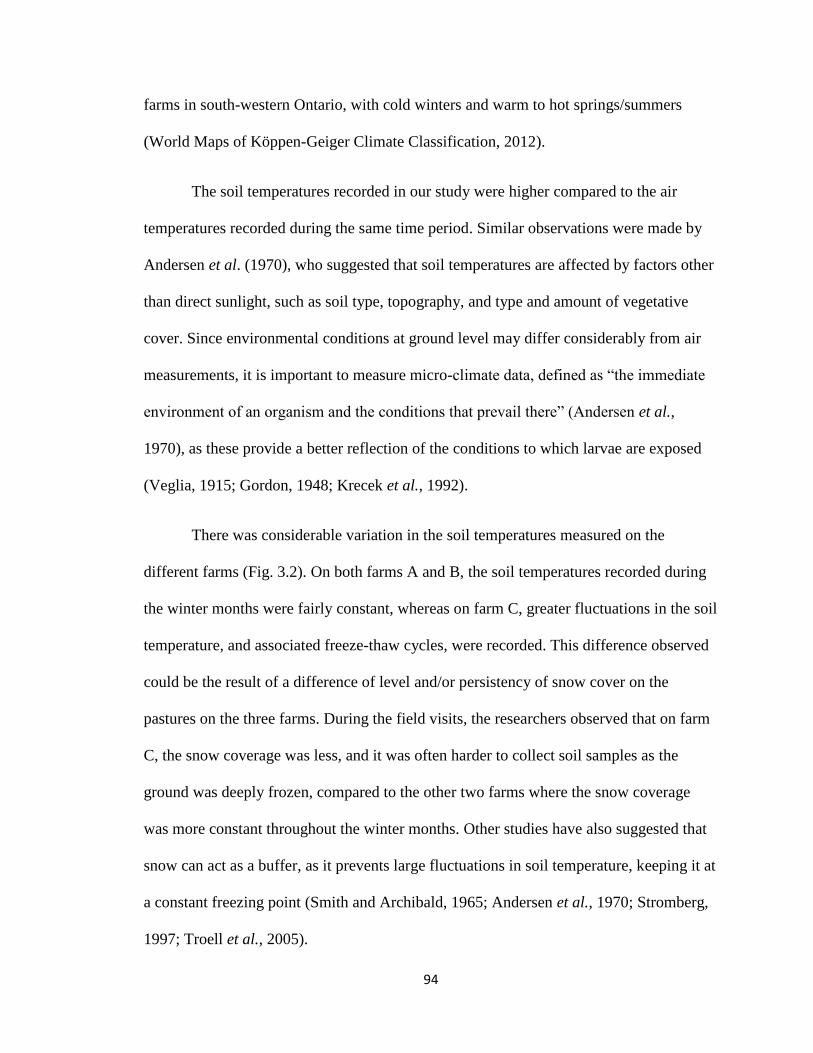
94
farms in south-western Ontario, with cold winters and warm to hot springs/summers
(World Maps of Köppen-Geiger Climate Classification, 2012).
The soil temperatures recorded in our study were higher compared to the air
temperatures recorded during the same time period. Similar observations were made by
Andersen et al. (1970), who suggested that soil temperatures are affected by factors other
than direct sunlight, such as soil type, topography, and type and amount of vegetative
cover. Since environmental conditions at ground level may differ considerably from air
measurements, it is important to measure micro-climate data, defined as “the immediate
environment of an organism and the conditions that prevail there” (Andersen et al.,
1970), as these provide a better reflection of the conditions to which larvae are exposed
(Veglia, 1915; Gordon, 1948; Krecek et al., 1992).
There was considerable variation in the soil temperatures measured on the
different farms (Fig. 3.2). On both farms A and B, the soil temperatures recorded during
the winter months were fairly constant, whereas on farm C, greater fluctuations in the soil
temperature, and associated freeze-thaw cycles, were recorded. This difference observed
could be the result of a difference of level and/or persistency of snow cover on the
pastures on the three farms. During the field visits, the researchers observed that on farm
C, the snow coverage was less, and it was often harder to collect soil samples as the
ground was deeply frozen, compared to the other two farms where the snow coverage
was more constant throughout the winter months. Other studies have also suggested that
snow can act as a buffer, as it prevents large fluctuations in soil temperature, keeping it at
a constant freezing point (Smith and Archibald, 1965; Andersen et al., 1970; Stromberg,
1997; Troell et al., 2005).
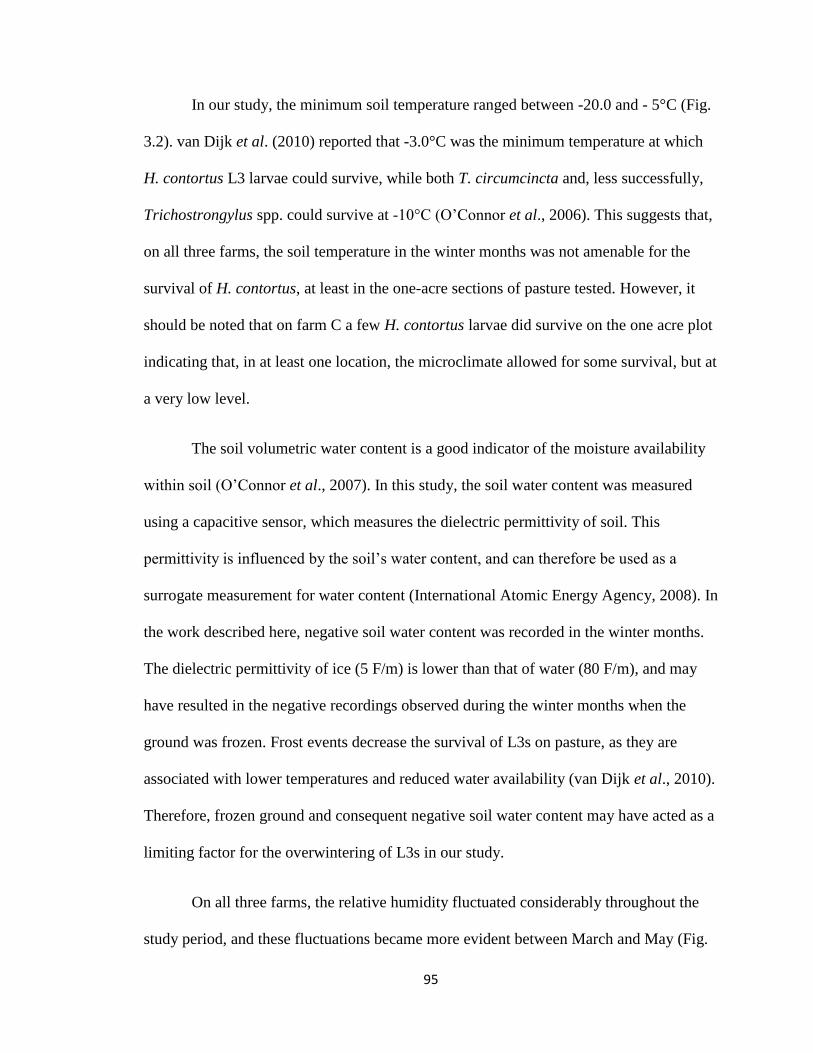
95
In our study, the minimum soil temperature ranged between -20.0 and - 5°C (Fig.
3.2). van Dijk et al. (2010) reported that -3.0°C was the minimum temperature at which
H. contortus L3 larvae could survive, while both T. circumcincta and, less successfully,
Trichostrongylus spp. could survive at -10°C (O’Connor et al., 2006). This suggests that,
on all three farms, the soil temperature in the winter months was not amenable for the
survival of H. contortus, at least in the one-acre sections of pasture tested. However, it
should be noted that on farm C a few H. contortus larvae did survive on the one acre plot
indicating that, in at least one location, the microclimate allowed for some survival, but at
a very low level.
The soil volumetric water content is a good indicator of the moisture availability
within soil (O’Connor et al., 2007). In this study, the soil water content was measured
using a capacitive sensor, which measures the dielectric permittivity of soil. This
permittivity is influenced by the soil’s water content, and can therefore be used as a
surrogate measurement for water content (International Atomic Energy Agency, 2008). In
the work described here, negative soil water content was recorded in the winter months.
The dielectric permittivity of ice (5 F/m) is lower than that of water (80 F/m), and may
have resulted in the negative recordings observed during the winter months when the
ground was frozen. Frost events decrease the survival of L3s on pasture, as they are
associated with lower temperatures and reduced water availability (van Dijk et al., 2010).
Therefore, frozen ground and consequent negative soil water content may have acted as a
limiting factor for the overwintering of L3s in our study.
On all three farms, the relative humidity fluctuated considerably throughout the
study period, and these fluctuations became more evident between March and May (Fig.

96
3.4). However, the relative humidity was rarely less than 20%, which has been described
by van Dijk et al. (2010) as the minimum threshold for the development of GIN free-
living stages. Therefore, it is unlikely that relative humidity was a limiting factor for the
survival of GIN free-living larvae during the winter months on the sampled farms.
3.4.2 Herbage and soil samples
Free-living parasite larvae were recovered from herbage samples collected on
farm A in March, and the species identified were Trichostrongylus spp. and Nematodirus
spp., suggesting that these parasite genera had overwintered on pasture. These parasites
have been described as more cold-tolerant than H. contortus, and other studies have also
shown that they can survive on pasture throughout the winter in temperate areas such as
the Maritime provinces and Quebec, Canada (Smith and Archibald, 1965; Ayalew and
Gibbs, 1973), Spain (Uriarte et al., 2003), and New Zealand (Waghorn et al., 2011).
No larvae were isolated in the herbage samples collected in January and February
on farm A, or in any of the months on farms B and C. These results are in agreement with
previous work conducted on sheep flocks in Ontario and Quebec, where no L3s were
recovered from pasture samples collected in January and March (Mederos et al., 2010).
In both our study and the study by Mederos et al. (2010), the herbage samples were
collected using the standard “W” method, which assumes that infective larvae are
distributed evenly on pasture, and that forage availability and use are homogeneous
(Couvillion, 1993). However, larvae distribution and forage availability also depend on
other factors such as stocking density and rate of pasture growth (Familton and
McAnulty, 1994). Moreover, parasites are often not randomly distributed on pasture, but
97
are often concentrated around sheep fecal droppings (Couvillion, 1993). In December
2010 and April 2011, pasture samples were collected from the same three farms, but this
time the samples were collected purposively within 10 cm of fecal samples. Free-living
larval stages were isolated in the samples collected in December 2010 as follows:
Trichostrongylus spp. on farm A, Teladorsagia sp., Trichostrongylus spp., Haemonchus
sp. and Oesophagostomum/Chabertia spp. on farm B and Trichostrongylus spp. and
Oesophagostomum/Chabertia spp. on farm C. In April 2011, free-living larval stages
were isolated in pasture samples as follows: Trichostrongylus spp. and Nematodirus sp.
on farm A, Telodorsagia sp., Trichostrongylus spp., Nematodirus spp. and
Oesophagostomum/Chabertia spp. on farm B, and Trichostrongylus spp., Telodorsagia
sp. and Oesophagostomum/Chabertia spp. on farm C (data not presented). These results
suggest that our negative findings in winter 2010 may be due to limitations of the
sampling method used.
Soil samples were collected in our study because previous work has suggested
that parasites may migrate deep in the soil, especially when exposed to unfavourable
weather conditions (Callinan and Westcott, 1986; Holasová et al., 1989). More recently,
both Leathwick et al. (2011) and Waghorn et al. (2011) have described soil as a reservoir
for free-living larval stages. However, in our study, no larvae were isolated in the soil
samples collected during the winter months. The discordant results between our study
and other studies (Callinan and Westcott, 1986; Holasová et al., 1989; Leathwick et al.,
2011) may be a consequence of different environmental parameters, such as rainfall or
temperatures which might influence the migration of larvae into the soil. Also, studies
that reported the recovery of free-living larvae in soil samples were either conducted in
98
controlled laboratory settings (Callinan and Westcott, 1986) or during the summer
(Leathwick et al., 2011), whereas our study was conducted on commercial farms during
the winter months. These factors might have influenced the results observed in our study.
Additionally, Waghorn et al. (2011) estimated the larval extraction efficacies from
herbage and soil samples using the Baermann technique to be 24% and 17%,
respectively. These low extraction efficacies lower the sensitivity of the Baermann
technique, and may have influenced the negative observations in our study.
3.4.3 Tracer lambs
The use of tracer lambs is a more sensitive test to assess pasture contamination,
compared to pasture larval recovery methods, as it represents the GIN infection an animal
acquires over a period of time (Stromberg, 1997; O’Connor et al., 2006). In this study,
several steps were taken to ensure that any parasites recovered from the tracer lambs were
as a consequence of ingestion of free-living larvae that had overwintered on pasture from
the previous grazing season: the pasture used had not been grazed since the previous
November; the lambs were GIN-naïve, which was confirmed on FECs the day they were
put on pasture; the lambs were additionally treated with a short-acting anthelmintic on the
day they were moved to the farms; and, on farm B, the lambs were moved every 3-4 days
to ensure that co-grazing would not lead to false-positive results.
Parasites (adults + immature stages) were isolated from all sixteen tracer lambs
placed on pasture in April (farm A) and May (farms B and C); however, the mean worm
count recovered from tracer lambs on farm C was significantly lower (six times lower),
compared to the mean worm counts recovered from lambs on farms A or B (Table 3.1).
99
Moreover, on both farms A and B, Teladorsagia sp. was the predominant parasite
recovered, while on farm C, N. spathiger/filicollis was the predominant parasite
recovered.
O’Connor et al. (2006) described short-term fluctuations in temperature as being
more harmful to GIN, compared to gradual changes in temperature. Other authors have
described freeze-thaw cycles as detrimental to GIN free-living stages, and snow as a
protective factor for the survival of GIN L3s, as it buffers freeze-thaw cycles and
maintains the soil at a constant temperature (Smith and Archibald, 1965; Stromberg,
1997; Troell et al., 2005). More freeze-thaw cycles were observed on farm C between
December and February, and the volumetric soil water content during the winter months
was also lower, compared to the other two farms. These observations may explain the
lower number of nematodes found in tracer lambs on farm C. We recognize that the
differences observed between parasite counts in tracer lambs on different farms could
also be attributed to different parasitism levels in the flocks from the previous year.
However, all three farms reported clinical signs of gastrointestinal parasitism in their
flocks the previous grazing season, suggesting that the level of GIN pasture
contamination was high at that time.
Despite historical evidence of serious clinical haemonchosis problems on the
three study farms, H. contortus parasites were only isolated in one tracer lamb in low
numbers from one farm in our study. These results are in accordance with recent studies
by Uriarte et al. (2003), Waller et al. (2004) and Troell et al. (2005), which also found
that H. contortus did not overwinter successfully on pasture in temperate winter
conditions. In contrast, Teladorsagia sp., Nematodirus spp. and Trichostrongylus spp.
100
were all recovered from the tracer lambs in our study, which suggests that these parasite
genera were more tolerant than H. contortus to cold temperatures. These results are in
agreement with the recovery of Trichostrongylus spp. and Nematodirus spp. from the
herbage samples collected in our study, and also with findings reported in other studies
(Smith and Archibald, 1965; Ayalew and Gibbs, 1973). It is unclear why Teladorsagia
sp. parasites were found in tracer lambs but not from herbage samples on farm A.
3.4.4 Study limitations and future research
This descriptive pilot study was conducted on three commercial sheep farms over
one winter season, leading to limited external validity. However, the farms were
purposively selected to be representative of the industry and geographic distribution of
sheep farms in Ontario, and important differences in both environmental factors and GIN
populations were noted among the farms. Enrolment of more farms over a longer
sampling period would provide more regional and season-to-season information. With
more farms and more time, geographical information systems could be used to describe
trends and monitor changes over a wider geographical distribution, while mathematical
modelling could be employed to predict future changes in the temporal dynamics of the
parasites on pasture as a result of future climate change. Additionally, precise information
on snow cover and soil type could be collected to determine whether these factors affect
the development, migration and survival of L3s on pasture. However, our budget was for
a pilot project on three farms for one winter only.
The small probability of H. contortus being able to over-winter on pasture could
be exploited to eradicate this parasite from Ontario sheep flocks, a goal that could be
101
tested in future research (Barger et al., 1991; Waller et al., 2006; Sargison et al., 2007).
Haemonchus contortus does however overwinter as hypobiotic larvae within the host
(Blitz and Gibbs, 1972; Waller et al., 2004), and periparturient ewes have been identified
as the primary source of pasture contamination with H. contortus the following spring,
when arrested larvae resume development (Waller et al., 2006). An effective anthelmintic
drug could therefore be used to treat ewes before turn-out on pasture, to kill the over-
wintering H. contortus nematodes in ewes, and prevent pasture contamination (Waller et
al., 2004; Sargison et al., 2007). Unfortunately, recent research in Ontario sheep flocks
has shown that resistance to ivermectin and fenbendazole, the two most commonly used
anthelmintics in Canada, is widespread, and most of the anthelmintic resistance reported
is associated with H. contortus (Falzon et al., in press). Since these two anthelmintics
have been shown to be ineffective against H. contortus on many of the sheep farms
surveyed, more research is required to determine whether the use of other anthelmintics
could be used as alternative drugs in Ontario sheep flocks. In particular, anthelmintics
which have been shown to be effective against ivermectin- and fenbendazole-resistant
strains of H. contortus, such as the new anthelmintic monepantel (Mason et al., 2009), or
the narrow-spectrum anthelmintic closantel (Uppal et al., 1993; Waruiru, 1997), might be
a promising alternative.
3.5 Conclusion
Results from this pilot study on the over-wintering and infectivity of parasite
larvae on pasture in the spring suggest that very few Haemonchus larvae were able to
over-winter on pasture in the temperate climate of Ontario. In contrast to Haemonchus,
other important parasite genera such as Teladorsagia, Nematodirus and Trichostrongylus,
102
did survive on pasture during the Ontario winter, and were infective in the spring. These
observations need to be taken into consideration when making recommendations on
pasture management and timing of anthelmintic treatment for parasite control strategies.
3.6 Acknowledgements
This research was supported by the Ontario Ministry of Agriculture, Food and
Rural Affairs – New Directions Research Program, with additional financial assistance
from the Ontario Sheep Marketing Agency, the Nova Scotia Agricultural College –
Organic Science Cluster, and the University of Guelph. The study sponsors were not
involved in: the study design; collection, analysis and interpretation of the data; writing
of the manuscript; and the decision to submit the manuscript for publication. The authors
are very grateful to William Sears for statistical advice, and to Brad De Wolf, Katie
Sippel, Kirstie Puskas, Lee Siertsema and Hasani Stewart for laboratory and field
assistance. We especially acknowledge the sheep producers that participated in the study.
103
3.7 References
Andersen, F.L., Levine, N.D., Boatman, P.A., 1970. Survival of third-stage
Trichostrongylus colubriformis larvae on pasture. J. Parasitol. 56, 209-232.
Ayalew, L., Gibbs, H.C., 1973. Seasonal fluctuations of nematode populations in
breeding ewes and lambs. Can. J. Comp. Med. 37, 79-89.
Barger, I.A., Hall, E., Dash, K.M., 1991. Local eradication of Haemonchus contortus
using closantel. Aust. Vet. J. 68, 347-348.
Blitz, N.M., Gibbs, H.C., 1972. Studies on the arrested development of Haemonchus
contortus in sheep–I. The induction of arrested development. Int. J. Parasitol. 2, 5-
12.
Callinan, A.P.L., Westcott, J.M., 1986. Vertical distribution of trichostrongylid larvae on
herbage and in soil. Int. J. Parasitol. 16, 241-244.
Couvillion, C.E., 1993. Estimation of the numbers of trichostrongylid larvae on pastures.
Vet. Parasitol. 46, 197-203.
Environment Canada – Ontario Weather Review, 2010. Available at:
http://www.ec.gc.ca/default.asp?lang=En&n=714D9AAE-1&news=980B4916-73ED-
40B2-91CD-12B0A270C7CE [Accessed: 24th
October, 2012].
Falzon, L.C., Menzies, P.I., Shakya, K.P., Jones-Bitton, A., Vanleeuwen, J., Avula, J.,
Stewart, H., Jansen, J.T., Taylor, M.A., Learmount, J., Peregrine, A.S., (in press).
Anthelmintic resistance in sheep flocks in Ontario, Canada. Vet. Parasitol.
Familton, A., McAnulty, R., 1994. Sheep nematode larval survival: the epidemiological
consequences of findings from recent studies. Proceedings of the Society of Sheep
and Beef Cattle Veterinarians of the New Zealand Veterinary Association, Annual
Seminar. pp. 185-195.
Gasbarre, L.C., 1987. Recovery of third stage larvae of Ostertagia ostertagi from the
abomasa of experimentally inoculated calves by prolonged saline incubation. Proc.
Helminthol. Soc. Wash. 54, 160-161.
Gordon, H.M., 1948. The epidemiology of parasitic diseases, with special reference to
studies with nematode parasites of sheep. Aust. Vet. J. 24, 17-45.
Holasová, E., Pavlásek, I., Kotrlá, B., 1989. Migration of infective larvae of sheep
gastrointestinal nematodes. Acta. Vet. Brno. 58, 369-378.
International Atomic Energy Agency, 2008. Field estimation of soil water content – a
practical guide to methods, instrumentation and sensor technology. Printed by the
International Atomic Energy Agency – Soil and Water Management and Crop
Nutrition Section, Vienna, Austria. Pages 1-22.
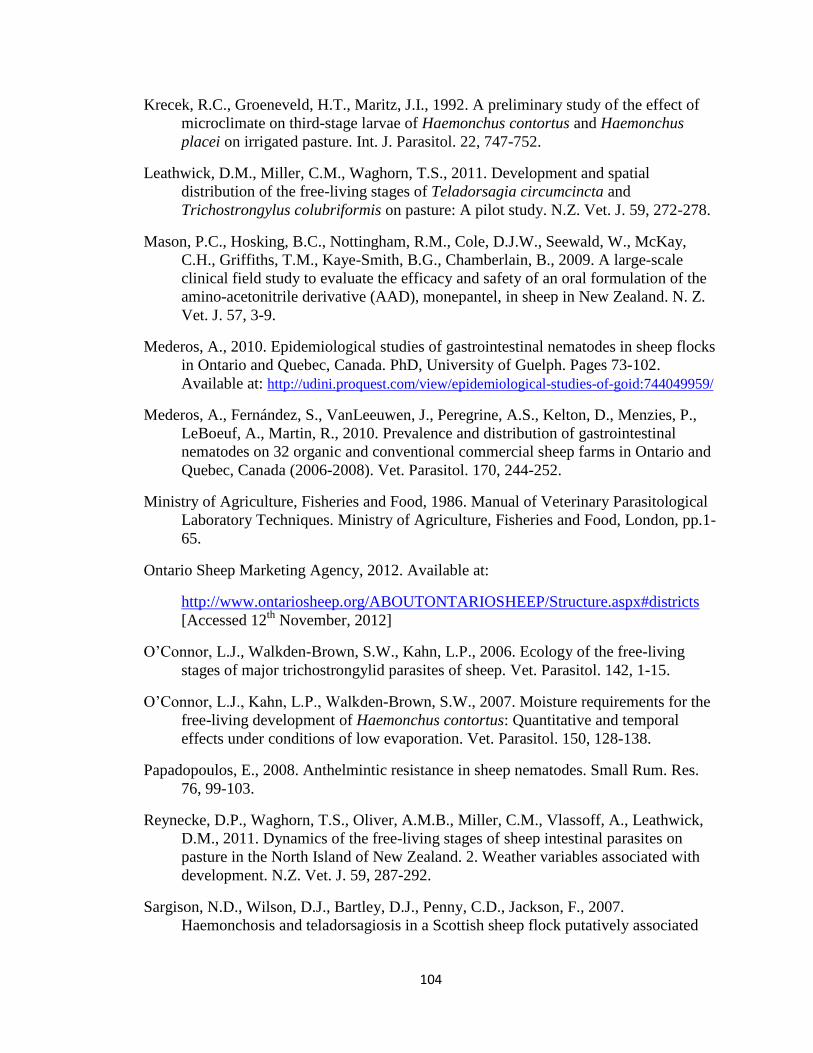
104
Krecek, R.C., Groeneveld, H.T., Maritz, J.I., 1992. A preliminary study of the effect of
microclimate on third-stage larvae of Haemonchus contortus and Haemonchus
placei on irrigated pasture. Int. J. Parasitol. 22, 747-752.
Leathwick, D.M., Miller, C.M., Waghorn, T.S., 2011. Development and spatial
distribution of the free-living stages of Teladorsagia circumcincta and
Trichostrongylus colubriformis on pasture: A pilot study. N.Z. Vet. J. 59, 272-278.
Mason, P.C., Hosking, B.C., Nottingham, R.M., Cole, D.J.W., Seewald, W., McKay,
C.H., Griffiths, T.M., Kaye-Smith, B.G., Chamberlain, B., 2009. A large-scale
clinical field study to evaluate the efficacy and safety of an oral formulation of the
amino-acetonitrile derivative (AAD), monepantel, in sheep in New Zealand. N. Z.
Vet. J. 57, 3-9.
Mederos, A., 2010. Epidemiological studies of gastrointestinal nematodes in sheep flocks
in Ontario and Quebec, Canada. PhD, University of Guelph. Pages 73-102.
Available at: http://udini.proquest.com/view/epidemiological-studies-of-goid:744049959/
Mederos, A., Fernández, S., VanLeeuwen, J., Peregrine, A.S., Kelton, D., Menzies, P.,
LeBoeuf, A., Martin, R., 2010. Prevalence and distribution of gastrointestinal
nematodes on 32 organic and conventional commercial sheep farms in Ontario and
Quebec, Canada (2006-2008). Vet. Parasitol. 170, 244-252.
Ministry of Agriculture, Fisheries and Food, 1986. Manual of Veterinary Parasitological
Laboratory Techniques. Ministry of Agriculture, Fisheries and Food, London, pp.1-
65.
Ontario Sheep Marketing Agency, 2012. Available at:
http://www.ontariosheep.org/ABOUTONTARIOSHEEP/Structure.aspx#districts
[Accessed 12th
November, 2012]
O’Connor, L.J., Walkden-Brown, S.W., Kahn, L.P., 2006. Ecology of the free-living
stages of major trichostrongylid parasites of sheep. Vet. Parasitol. 142, 1-15.
O’Connor, L.J., Kahn, L.P., Walkden-Brown, S.W., 2007. Moisture requirements for the
free-living development of Haemonchus contortus: Quantitative and temporal
effects under conditions of low evaporation. Vet. Parasitol. 150, 128-138.
Papadopoulos, E., 2008. Anthelmintic resistance in sheep nematodes. Small Rum. Res.
76, 99-103.
Reynecke, D.P., Waghorn, T.S., Oliver, A.M.B., Miller, C.M., Vlassoff, A., Leathwick,
D.M., 2011. Dynamics of the free-living stages of sheep intestinal parasites on
pasture in the North Island of New Zealand. 2. Weather variables associated with
development. N.Z. Vet. J. 59, 287-292.
Sargison, N.D., Wilson, D.J., Bartley, D.J., Penny, C.D., Jackson, F., 2007.
Haemonchosis and teladorsagiosis in a Scottish sheep flock putatively associated
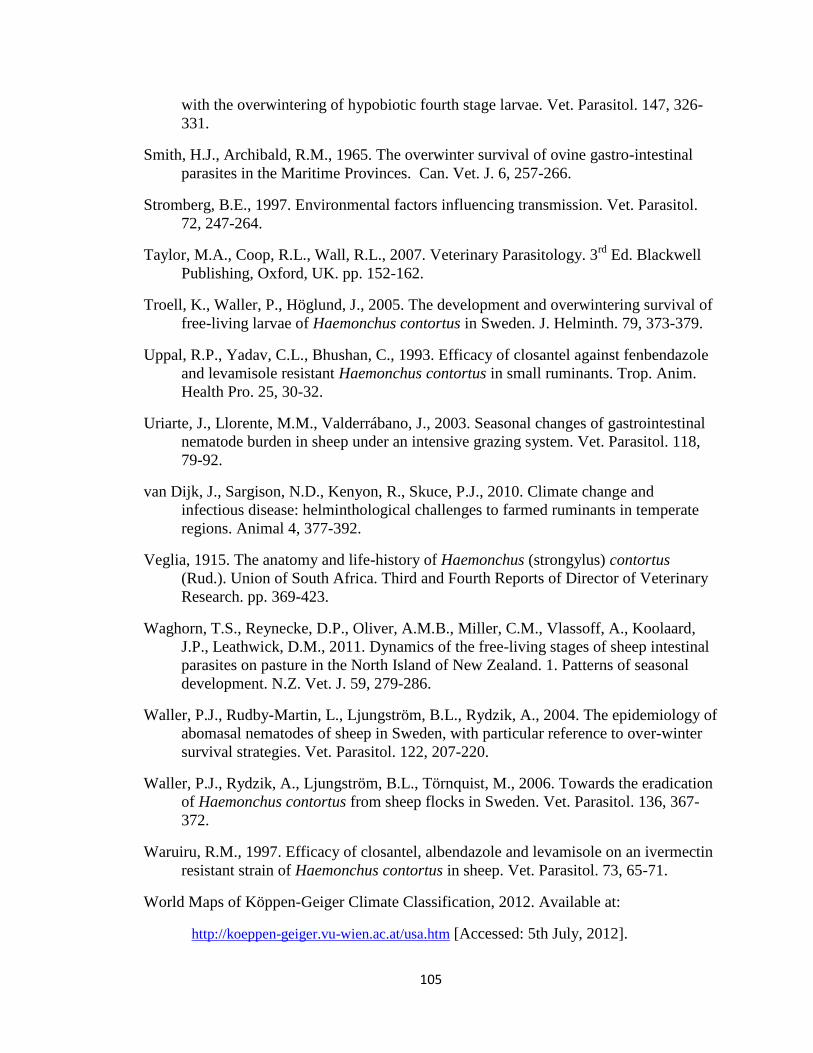
105
with the overwintering of hypobiotic fourth stage larvae. Vet. Parasitol. 147, 326-
331.
Smith, H.J., Archibald, R.M., 1965. The overwinter survival of ovine gastro-intestinal
parasites in the Maritime Provinces. Can. Vet. J. 6, 257-266.
Stromberg, B.E., 1997. Environmental factors influencing transmission. Vet. Parasitol.
72, 247-264.
Taylor, M.A., Coop, R.L., Wall, R.L., 2007. Veterinary Parasitology. 3rd
Ed. Blackwell
Publishing, Oxford, UK. pp. 152-162.
Troell, K., Waller, P., Höglund, J., 2005. The development and overwintering survival of
free-living larvae of Haemonchus contortus in Sweden. J. Helminth. 79, 373-379.
Uppal, R.P., Yadav, C.L., Bhushan, C., 1993. Efficacy of closantel against fenbendazole
and levamisole resistant Haemonchus contortus in small ruminants. Trop. Anim.
Health Pro. 25, 30-32.
Uriarte, J., Llorente, M.M., Valderrábano, J., 2003. Seasonal changes of gastrointestinal
nematode burden in sheep under an intensive grazing system. Vet. Parasitol. 118,
79-92.
van Dijk, J., Sargison, N.D., Kenyon, R., Skuce, P.J., 2010. Climate change and
infectious disease: helminthological challenges to farmed ruminants in temperate
regions. Animal 4, 377-392.
Veglia, 1915. The anatomy and life-history of Haemonchus (strongylus) contortus
(Rud.). Union of South Africa. Third and Fourth Reports of Director of Veterinary
Research. pp. 369-423.
Waghorn, T.S., Reynecke, D.P., Oliver, A.M.B., Miller, C.M., Vlassoff, A., Koolaard,
J.P., Leathwick, D.M., 2011. Dynamics of the free-living stages of sheep intestinal
parasites on pasture in the North Island of New Zealand. 1. Patterns of seasonal
development. N.Z. Vet. J. 59, 279-286.
Waller, P.J., Rudby-Martin, L., Ljungström, B.L., Rydzik, A., 2004. The epidemiology of
abomasal nematodes of sheep in Sweden, with particular reference to over-winter
survival strategies. Vet. Parasitol. 122, 207-220.
Waller, P.J., Rydzik, A., Ljungström, B.L., Törnquist, M., 2006. Towards the eradication
of Haemonchus contortus from sheep flocks in Sweden. Vet. Parasitol. 136, 367-
372.
Waruiru, R.M., 1997. Efficacy of closantel, albendazole and levamisole on an ivermectin
resistant strain of Haemonchus contortus in sheep. Vet. Parasitol. 73, 65-71.
World Maps of Köppen-Geiger Climate Classification, 2012. Available at:
http://koeppen-geiger.vu-wien.ac.at/usa.htm [Accessed: 5th July, 2012].

106
Table 3.1. Arithmetic means of gastrointestinal nematode counts (and percentage distribution) of
16 tracer lambs put out to graze, and slaughtered after 28 days, in south-western
Ontario, between April and May 2010.
Farm A
N=5
Farm B
N=5
Farm C
N=6
Total mean worm count
6678
6945
1023
Range 5225-8050 3200-10360 385-1750
Abomasum
Teladorsagia circumcincta 5925 (89.1) 5350 (79.2) 254 (28.9)
Ostertagia trifurcata 275 (4.1) 50 (0.6) 0 (0.0)
Haemonchus contortus 0 (0.0) 0 (0.0) 8.3 (0.5)
Small intestine
Trichostrongylus colubriformis 106 (1.5) 690 (9.7) 142 (14.2)
Nematodirus battus 130 (2.0) 185 (2.6) 141.7 (19.4)
Nematodirus spathiger and filicolis 240 (3.2) 650 (7.7) 475 (35.8)
Large intestine
Oesophagostomum columbianum 2 (0.04) 20 (0.3) 1.7 (0.4)
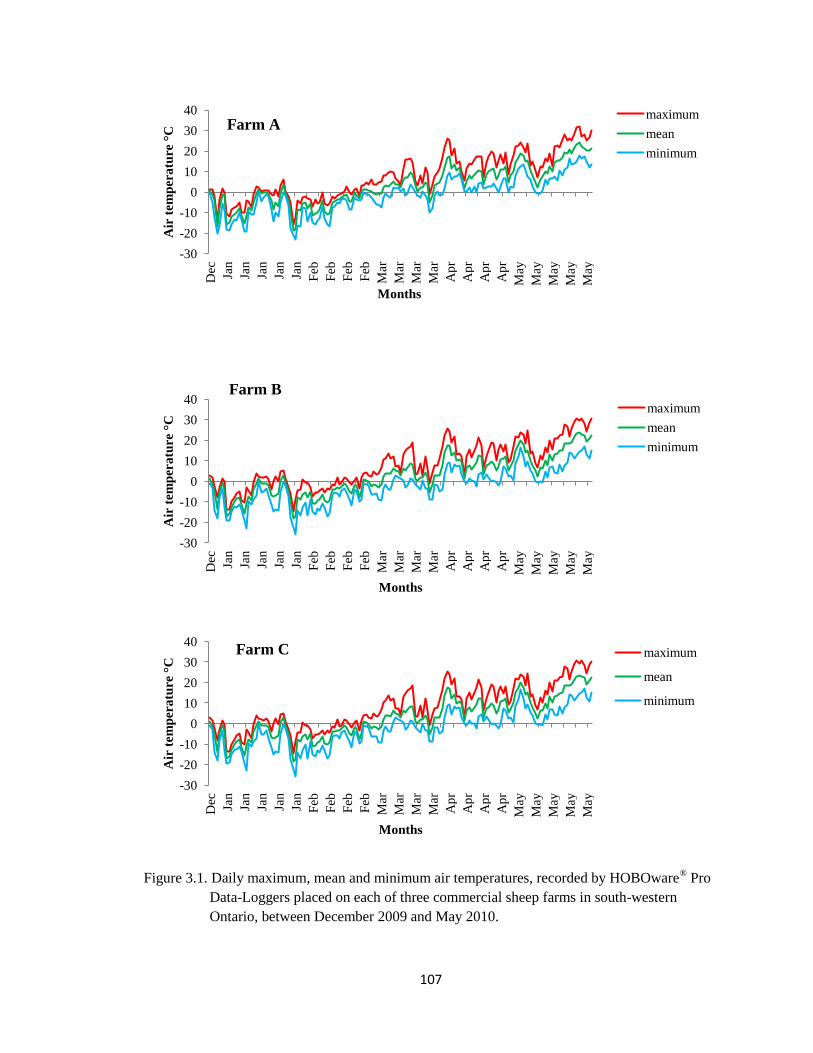
107
Figure 3.1. Daily maximum, mean and minimum air temperatures, recorded by HOBOware® Pro
Data-Loggers placed on each of three commercial sheep farms in south-western
Ontario, between December 2009 and May 2010.
-30
-20
-10
0
10
20
30
40
Dec
Jan
Jan
Jan
Jan
Jan
Feb
Feb
Feb
Feb
Mar
Mar
Mar
Mar
Ap
r
Ap
r
Ap
r
Ap
r
May
May
May
May
May
Air
tem
per
atu
re °
C
Months
maximum
mean
minimum
-30
-20
-10
0
10
20
30
40
Dec
Jan
Jan
Jan
Jan
Jan
Feb
Feb
Feb
Feb
Mar
Mar
Mar
Mar
Ap
r
Ap
r
Ap
r
Ap
r
May
May
May
May
May
Air
tem
per
atu
re °
C
Months
maximum
mean
minimum
-30
-20
-10
0
10
20
30
40
Dec
Jan
Jan
Jan
Jan
Jan
Feb
Feb
Feb
Feb
Mar
Mar
Mar
Mar
Ap
r
Ap
r
Ap
r
Ap
r
May
May
May
May
May
Air
tem
per
atu
re °
C
Months
maximum
mean
minimum
Farm A
Farm B
Farm C
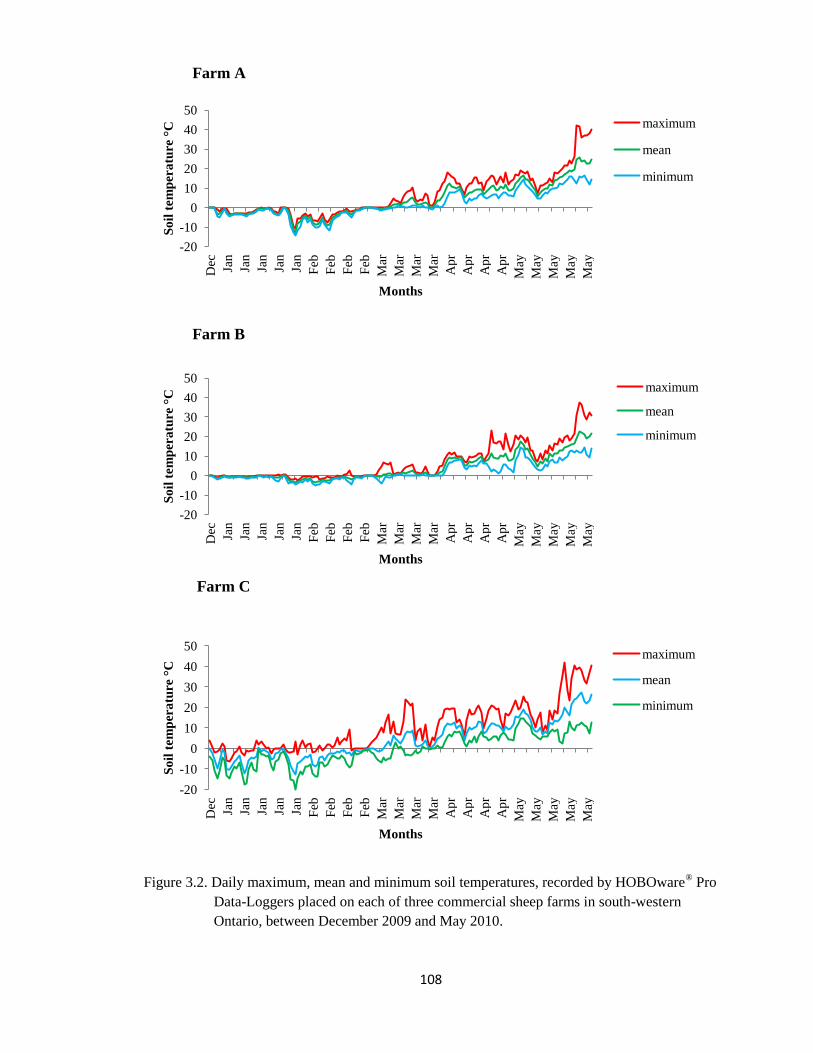
108
Figure 3.2. Daily maximum, mean and minimum soil temperatures, recorded by HOBOware® Pro
Data-Loggers placed on each of three commercial sheep farms in south-western
Ontario, between December 2009 and May 2010.
-20
-10
0
10
20
30
40
50
Dec
Jan
Jan
Jan
Jan
Jan
Feb
Feb
Feb
Feb
Mar
Mar
Mar
Mar
Ap
r
Ap
r
Ap
r
Ap
r
May
May
May
May
May
So
il t
em
per
atu
re °
C
Months
maximum
mean
minimum
-20
-10
0
10
20
30
40
50
Dec
Jan
Jan
Jan
Jan
Jan
Feb
Feb
Feb
Feb
Mar
Mar
Mar
Mar
Ap
r
Ap
r
Ap
r
Ap
r
May
May
May
May
May
So
il t
em
per
atu
re °
C
Months
maximum
mean
minimum
-20
-10
0
10
20
30
40
50
Dec
Jan
Jan
Jan
Jan
Jan
Feb
Feb
Feb
Feb
Mar
Mar
Mar
Mar
Ap
r
Ap
r
Ap
r
Ap
r
May
May
May
May
May
So
il t
em
per
atu
re °
C
Months
maximum
mean
minimum
Farm A
Farm B
Farm C

109
Figure 3.3. Daily mean soil volumetric water content, recorded by HOBOware® Pro Data-
Loggers placed on each of three commercial sheep farms in south-western Ontario,
between January and May 2010.
Note: Data from May 2010 are not presented for farm C as an error was observed in the
recordings.
-0.3
-0.2
-0.1
0
0.1
0.2
0.3
0.4
0.5
Jan
Jan
Jan
Jan
Jan
Jan
Feb
Feb
Feb
Feb
Mar
Mar
Mar
Mar
Mar
Ap
r
Ap
r
Ap
r
Ap
r
Ap
r
May
May
May
May
May
May
So
il m
ois
ture
m³/
m³
Months
Farm A
Farm B
Farm C
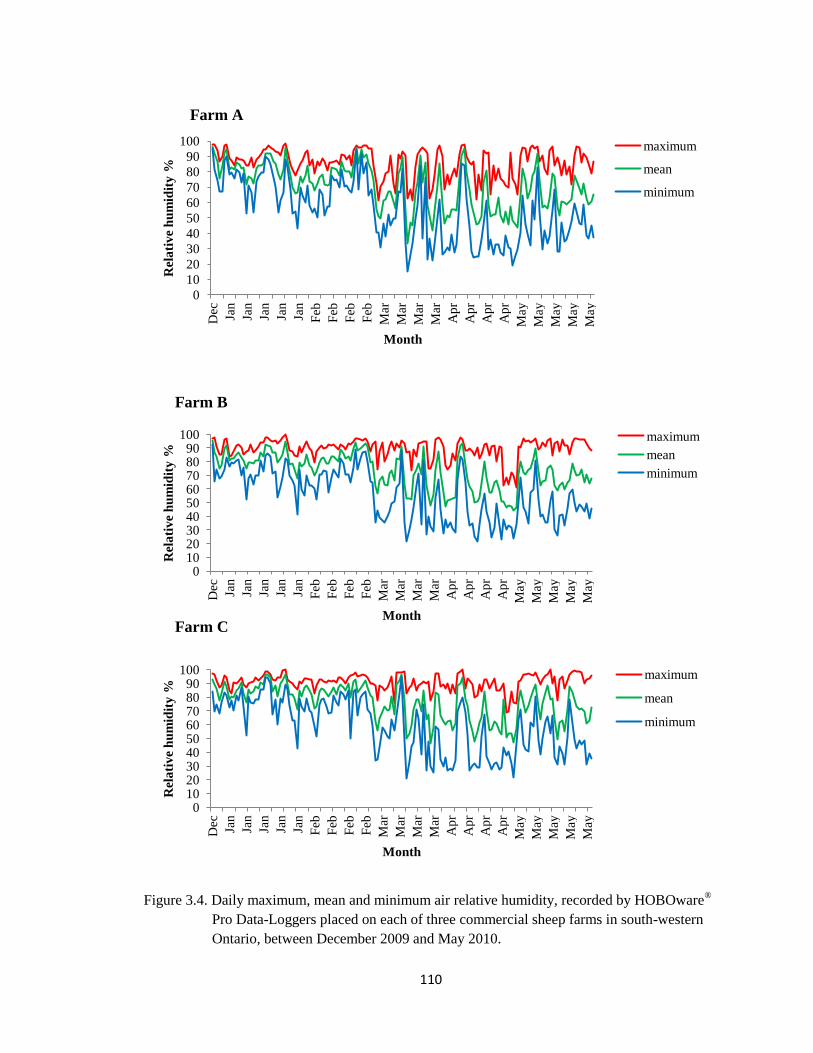
110
Figure 3.4. Daily maximum, mean and minimum air relative humidity, recorded by HOBOware®
Pro Data-Loggers placed on each of three commercial sheep farms in south-western
Ontario, between December 2009 and May 2010.
0 10 20 30 40 50 60 70 80 90
100
Dec
Jan
Jan
Jan
Jan
Jan
Feb
Feb
Feb
Feb
Mar
Mar
Mar
Mar
Ap
r
Ap
r
Ap
r
Ap
r
May
May
May
May
May
Rel
ati
ve
hu
mid
ity
%
Month
maximum
mean
minimum
0 10 20 30 40 50 60 70 80 90
100
Dec
Jan
Jan
Jan
Jan
Jan
Feb
Feb
Feb
Feb
Mar
Mar
Mar
Mar
Ap
r
Ap
r
Ap
r
Ap
r
May
May
May
May
May
Rel
ati
ve
hu
mid
ity
%
Month
maximum
mean
minimum
0
10
20
30
40
50
60
70
80
90
100
Dec
Jan
Jan
Jan
Jan
Jan
Feb
Feb
Feb
Feb
Mar
Mar
Mar
Mar
Ap
r
Ap
r
Ap
r
Ap
r
May
May
May
May
May
Rel
ati
ve
hu
mid
ity
%
Month
maximum
mean
minimum
Farm A
Farm B
Farm C
111
CHAPTER 4
Anthelmintic resistance in sheep flocks in Ontario, Canada
Accepted for publication in Veterinary Parasitology
Abstract
Gastrointestinal nematodes (GIN) are a significant constraint to pasture-based sheep
production worldwide. Anthelmintic resistance (AR) has been reported in most sheep-
raising areas in the world, yet little is known about the AR status in Canada. This study
was conducted to determine the frequency of AR in GIN in sheep flocks in Ontario,
Canada. Forty-seven sheep flocks were enrolled in the study, and their level of parasitism
was monitored monthly throughout a grazing season by analyzing owner-acquired fecal
samples from 15 grazing lambs per flock. When the mean GIN fecal egg count (FEC)
reached a threshold of 200 eggs per gram (epg), oral ivermectin was supplied to
producers to check ivermectin efficacy; the reduction in mean FEC 14 days after
ivermectin treatment was calculated. ‘Drench failure’ was defined as a reduction in mean
FEC of <95%. In those flocks with apparent drench failure, researchers performed a
Fecal Egg Count Reduction Test (FECRT), dividing sheep into 4 treatment groups (n=10-
15): control (i.e. untreated), ivermectin, and, if sufficient numbers of animals -
fenbendazole and levamisole. AR was defined as a reduction in mean FEC <95% and a
lower 95% confidence interval <90%. Larval cultures were performed on pooled post-
treatment FECRT samples. Larval Development Assays (LDAs) to detect the presence of
resistance to thiabendazole and levamisole were performed prior to the ivermectin drench
check on pooled owner-acquired fecal samples that reached the 200 epg threshold.
112
Approximately 89% (42/47) of the farms reached the FEC threshold of 200 epg; 93%
(39/42) of these farms performed an ivermectin drench check, and 88% (34/39) of these
farms had drench failure. The FECRT was performed on 29 of the 34 farms. Resistance
to ivermectin, fenbendazole and levamisole was demonstrated on 97% (28/29), 95%
(19/20) and 6% (1/17) of the farms tested, respectively, with considerable variability in
resistance levels among farms. Haemonchus sp. was the most commonly cultured
parasite from post-treatment fecal samples. LDA results were available for 21 farms; of
these, 14% (3/21) and 62% (13/21) had low and high levels of thiabendazole resistance,
respectively, while none of the farms exhibited resistance to levamisole. Amongst these
tested farms, resistance to both ivermectin and benzimidazoles was very common. These
findings strongly suggest that AR, particularly in Haemonchus sp., is a serious problem in
these sheep flocks. Thus, marked changes in GIN management need to be instituted
immediately to mitigate a worsening situation.
Keywords: Gastro-intestinal nematodes; ivermectin drench failure; fecal egg count
reduction test; anthelmintic resistance; larval development assays; post-treatment larval
cultures
4.1 Introduction
Parasitic gastroenteritis caused by gastrointestinal nematodes (GINs) is widely
considered the most important disease of grazing sheep worldwide, causing weight loss,
diarrhea and death (Sutherland and Scott, 2010). Gastrointestinal nematode infections are
typically controlled with anthelmintic drugs, and sheep producers worldwide have

113
customarily relied heavily on such drugs to maintain sheep health and productivity, while
improving the overall profitability of the sheep industry (Sargison, 2008).
In North America, three broad-spectrum anthelmintic drug classes are most
commonly used in sheep: macrocyclic lactones (e.g. ivermectin and moxidectin),
benzimidazoles (e.g. thiabendazole, fenbendazole and albendazole) and imidazothiazoles
(e.g. levamisole) (Adams, 2001). In Canada, only ivermectin is licensed for use in sheep
(Compendium of Veterinary Products, Canada, 2012). Thiabendazole was the first
benzimidazole to be marketed in Canada in the early 1960s (Adams, 2001), but was
subsequently replaced with other structurally similar, but improved drugs, such as
fenbendazole and albendazole. Fenbendazole and albendazole are licensed for use in
Canada in cattle (Compendium of Veterinary Products, Canada, 2012), but are often used
in sheep in an extra-label manner. Levamisole has not been licensed for use in sheep in
Canada for the past 10 years (Health Canada – Drug Product Database Online Query,
2012).
Anthelmintic resistance (AR) is defined as the ‘heritable ability of the parasite to
tolerate a normally effective dose of the anthelmintic’ (Abbott et al., 2009), and if
sufficiently prevalent in a parasite population, results in treatment failure. However,
treatment failure may also be caused by other confounding factors (McKenna, 1990),
such as under-dosing or incorrect administration of anthelmintic drugs (El-Abdellati et
al., 2010).
Anthelmintic resistance is an escalating problem in most sheep-rearing countries
worldwide (Papadopoulos, 2008), and is a threat to both agricultural income and sheep
welfare (Wolstenholme et al., 2004). It is widespread in New Zealand (Waghorn et al.,

114
2006), Australia (Love et al., 1992; Besier and Love, 2004), and in many South
American countries, such as Brazil and Uruguay (Waller et al., 1996; Cezar et al., 2010).
In recent years, AR has also been described in the United States (Kaplan and
Vidyashankar, 2012) and in several European countries including Greece (Gallidis et al.,
2009), Italy (Cringoli et al., 2009) and the United Kingdom (Jackson and Coop, 2000). In
2007, the first case of AR in Canada was described in a sheep flock in Ontario (Glauser et
al., 2007). Ontario is considered to have a humid continental climate, with cold snowy
winters and warm-to-hot summers (World Maps of Köppen-Geiger Climate
Classification, 2012). While recent studies have investigated how this climate affects the
epidemiology of GIN infections in sheep (Mederos et al., 2010), no surveys have been
published on how widespread the problem of treatment failure and AR is in sheep flocks
in Canada and, in particular, Ontario.
The Fecal Egg Count Reduction Test (FECRT) is the standard test for
determining AR under field conditions (Coles et al., 1992), and provides an indirect
measurement of anthelmintic efficacy by determining the reduction in fecal egg counts
(FECs) after treatment (McKenna, 2006). Several authors have suggested different
threshold values for defining the presence of AR (McKenna, 1990; Wood et al., 1995;
Smart, 2009), but the most commonly accepted threshold is that endorsed by the World
Association for the Advancement of Veterinary Parasitology (WAAVP), which defines
AR as a Fecal Egg Count Reduction (FECR) of <95% and a lower 95% confidence
interval (CI) of <90%; if only one of these two factors is present, the farm is defined as
being “suspected” of having resistance (Coles et al., 1992).
115
Despite being the standard test for AR determination, the FECRT is laborious,
expensive and time-consuming (Craven et al., 1999; El-Abdellati et al., 2010). As a
result, various alternative diagnostic tests have been suggested for the determination of
anthelmintic susceptibility (Coles et al., 2006). The Larval Development Assay (LDA)
described by Taylor (1990) is based on culturing a known number of GIN eggs in the
presence of different anthelmintics. It is reported to be relatively easy to perform, more
sensitive than the FECRT, and allows for the identification of parasite larvae to the genus
level (Taylor, 1990). However, this methodology cannot reliably detect resistance to
avermectins (Grimshaw et al., 1994), and is considered by some to require a high level of
technical expertise, thus limiting its use outside of research laboratories (Kaplan and
Vidyashankar, 2012).
The objectives of this study in Ontario sheep flocks were: (i) to determine the
frequency of ivermectin treatment failure; (ii) to determine the frequency of resistance to
ivermectin, fenbendazole and levamisole using a FECRT; and (iii) to assess the
frequency of resistance to thiabendazole and levamisole using the LDA.
4.2 Materials and Methods
4.2.1. Number and selection of sheep farms
The study was conducted in Ontario, Canada, for two consecutive grazing seasons
(May to November 2010 and May to November 2011). The target population was sheep
farms in Ontario, while the study population was eligible and willing sheep producers (as
defined below) that were members of the Ontario Sheep Marketing Agency (OSMA) – a
producer-operated agency formed under the Ontario Farm Products Marketing Act that
116
represents all producers that raise and sell market lambs. All registered producers
(n=3600) receive the magazine ‘Ontario Sheep News’, with over 70% of these producers
also receiving emails from the OSMA email list-serve (OSMA office, personal
communication).
Forty-seven sheep farms were recruited during the summers of 2010 or 2011. This
sample size is associated with a precision of 14%, using a 95% level of confidence and an
estimated ivermectin drench failure prevalence of 60% (latter estimate based on an
unpublished pilot study conducted on Ontario sheep farms in 2009, in which 8 of 13
farms tested had ivermectin drench failure).
Recruitment required volunteer participation and was carried out through talks
given at various OSMA sheep producer meetings held across the province and letters
posted in the ‘Ontario Sheep News’ and distributed via the email list-serve. To be
included in the study, farms had to: (i) have a minimum of 30 animals (lambs or yearling
ewes) in their first grazing season; and (ii) keep the animals on pasture for at least 3
months during the grazing season. The first criterion was set to include both lambs and
yearling ewes since a number of producers in Ontario opt to keep lambs indoors during
the summer months to reduce risk of predator attacks, thereby minimizing their GIN
exposure and immunity development during their first year of life. This study was
approved by the Animal Care Committee (Protocol Number: 09R056) and the Research
Ethics Board (Protocol Number: 09DC005) at the University of Guelph.
117
4.2.2. Farm monitoring
Starting in May each year, all producers enrolled in the study received a kit for
fecal sample collection. This kit consisted of a Styrofoam cooler with 2 ice-packs,
transparent plastic sealable bags, elastic bands, disposable gloves, cellophane packing
tape, a bag with 5 g of coffee beans (to provide producers with a visual estimate of
approximately 5 g of sheep feces), a courier (Purolator Inc., Canada) shipping label, and a
consent form. Producers were asked to collect 5 g of fresh fecal pellets from the ground
or per rectum, using the gloves provided, from each of 15 lambs or yearling ewes in their
first grazing season, and to package these fecal samples individually, using the plastic
sealable bags and elastic bands. The producers were then asked to place the samples in
the Styrofoam cooler with the chilled ice-packs, and to courier the taped box, along with
the signed consent form, to the Parasitology Laboratory, Department of Pathobiology,
Ontario Veterinary College, University of Guelph.
The fecal samples were analyzed individually and results used to determine the
flock mean FEC, as an indicator of flock-level GIN parasitism. A mean FEC of 200 eggs
per gram (epg) was the threshold used for conducting the ivermectin drench check, since
a previous study has indicated that this is a sufficient level for detecting changes in FEC
following treatment (Miller et al., 2006). If the mean FEC on the farm was <200 epg,
another kit for fecal sample collection was sent to the producer, and they were asked to
repeat the process in 3-4 weeks; kits were thus sent approximately monthly until either
the mean FEC attained was ≥200 epg or until early September. If the mean FEC on the
farm reached ≥200 epg, an ivermectin drench check was conducted.
118
4.2.3. Ivermectin drench check
For the ivermectin drench check, a package containing a sample-collection kit
(see section 4.2.2) and a 1 litre bottle of ivermectin (0.8 mg/mL, Ivomec® Drench for
Sheep, Merial Canada Inc.) was couriered to the producers. The producers were asked to
treat the sampled group with the ivermectin drench as they normally would; no
recommendations on the dosage or methodology of treatment were provided. This was
done to assess what producers normally do on their farms.
Fourteen days after treatment, the producers were asked to collect fecal samples
from 15 of the treated animals, which were not necessarily the same animals sampled
before treatment, and then package the samples individually and send for analysis as
described above. The post-treatment fecal samples were analyzed individually, and the
GIN FECR following ivermectin treatment was calculated for the group sampled as:
100 X ([mean FEC before treatment – mean FEC after treatment]/ mean FEC before
treatment)
In the published literature, drench failure is ascribed when the post-treatment
FECs are positive (Sargison, 2008); however, specific cut-points to indicate drench
failure when post-treatment FECs were positive could not be found. A review by
Campbell and Benz (1984) describes ivermectin efficacy in the absence of resistance as
varying between 95-100% for different stages and species of ovine GINs. As such, in the
work described here, ivermectin drench success was defined as a mean FECR ≥95%, and
ivermectin drench failure as a mean GIN FECR <95%. If a farm had ivermectin drench
119
success, no further sampling was performed on that farm. If a farm had ivermectin drench
failure, a FECRT was initiated.
4.2.4 Fecal Egg Count Reduction Test
The FECRT was conducted a minimum of three weeks after treatment with
ivermectin. Each farm was visited twice by the research team, 14 days apart (day 0 and
day 14), and lambs or yearling ewes in their first grazing season (as described previously)
were included.
On the first visit, eligible animals were divided into one of a maximum of 4
treatment groups, each with 10-15 animals: control (i.e. untreated), or treated with
ivermectin, fenbendazole or levamisole. In the first year of the study, the animals were
divided into groups sequentially (i.e. the first 15 animals passing through a chute were
put in one group; the following 15 animals were put in a second group, etc.), except for 3
farms (farms 1, 3 and 7) where the animals were divided into different pens prior to the
researchers’ visit, based on different age groups or breeds. In the second year, the animals
were systematically assigned into groups to allow for better randomization; this was
carried out by running the animals through a chute and the first animal allocated to the
first group, the second animal allocated to the second group, etc. The age and sex of
lambs was mixed, and all animals used were <2 years of age. The number of animals in
each group was based on recommendations that 10 animals per group are sufficient to
detect differences in FEC between groups (Coles et al., 1992); up to 15 animals per group
were sampled to help account for any losses or non-suppliers of fecal samples that might
occur. On some farms, less than 40 animals were eligible for inclusion in the study; fewer
treatment groups were therefore used on these farms.
120
All animals involved in the FECRT were identified using ear-tag numbers,
weighed, and then either left untreated or treated by the researchers according to the
treatment group assigned. Treatments were as follows: 0.2 mg/kg ivermectin (Ivomec
Drench for Sheep, Merial Canada Inc.); 5 mg/kg fenbendazole (Safe-guard™
Suspension
10%, Intervet Canada Ltd.); or 10.5 mg/kg levamisole (levamisole hydrochloride
suspension, Chiron Compounding Pharmacy Inc., Canada). Doses were calculated based
on each animal’s individual weight. Both the ivermectin and levamisole drenches were
administered using a drench-gun that was calibrated before use, and after half of the
animals per treatment group had been treated. The fenbendazole drench was administered
using a 5 mL syringe since small doses were required, and the dose was administered
orally over the back of the tongue.
Fecal samples were collected by the researchers directly from the rectum of each
selected animal on day 0 and day 14, and these samples were analyzed individually and
used to determine the arithmetic mean FEC pre- and post-treatment for each of the
treatment groups. Due to logistic constraints related to the distant locations of farms, on
two farms in the first year (farms 4 and 9), the producers were asked to collect fecal
samples from the rectums of selected animals 14 days after the first visit and to courier
the samples to the researchers for analysis.
4.2.5 Laboratory analysis
All fecal samples were examined at the Parasitology Laboratory, Department of
Pathobiology, Ontario Veterinary College, University of Guelph. During transportation to
the laboratory, all fecal samples were shipped with ice-packs. Thereafter, they were kept
refrigerated at 4°C before being tested. Time from fecal sample collection on farm to
121
receipt by the laboratory took, on average, two business days, and most fecal samples
were examined within seven days of collection. In the first year of the study, some fecal
samples were stored for up to three weeks before being processed, due to a backlog of
samples in the laboratory. All researchers processing the fecal samples were blinded to
the treatment status of individual sheep. Fecal egg counts were performed on individual
fecal samples using a modified McMaster concentration method (Ministry of Agriculture,
Fisheries and Food [MAFF], 1986), with a lower detection limit of 50 epg.
4.2.6 Larval culture of post-treatment fecal samples
Larval cultures were performed on post-treatment fecal samples (FECRT day 14),
to identify the resistant GIN genera. In the first year, larval cultures were not carried out
due to a backlog of samples in the laboratory; in the second year, the larval cultures were
performed on post-treatment fecal samples (FECRT day 14) for all farms on which a
FECRT was conducted to identify the resistant GIN genera.
For each farm, fecal samples were pooled together using 2 g of feces per animal,
for the control and each treated group, and the pooled feces were broken up finely using a
pestle and mortar. If the fecal mixture was too dry, just enough water was added to
moisten the feces, whereas, if the mixture was too wet, vermiculite was added to bring it
to the necessary consistency (MAFF, 1986). The culture wells were then filled with the
mixture, and separate culture wells were used for the different groups. The wells were
incubated at 27°C for 7 days, after which third-stage GIN larvae (L3s) were harvested by
Baermannization (Coles et al., 1992). The first 100 L3s, or all L3s when <100 developed,
were identified to the genus level, following identification keys (MAFF, 1986).
122
4.2.7 Larval Development Assay
Larval Development Assays (Taylor, 1990) were performed to assess the in vitro
anthelmintic susceptibility of GIN on sheep farms. In the first year, a member of the
research group learned the technique at the Central Science Laboratory, York, United
Kingdom and then established it at the Parasitology Laboratory, Department of
Pathobiology, Ontario Veterinary College, University of Guelph. In the second year,
LDAs were performed for all farms that reached the mean FEC threshold of 200 epg;
this included farms enrolled in the second year, and some farms from the first year that
re-submitted fecal samples in the second year. The samples used for the LDAs were from
animals that had not been treated with an anthelmintic for at least 28 days.
The LDA used was a modification of the method originally described by Taylor
(1990). In the modified method, the culture medium comprised lyophilised Escherichia
coli and fecal extract, the final volume of fecal solution was adjusted to give 300
eggs/mL, and 2 concentrations of thiabendazole (0.1 and 0.3 µg/mL) and levamisole (1.0
and 3.0 µg/mL) were tested. The anthelmintics used were in the pure form: 99%
thiabendazole (Sigma Life Science, T8904-100G, batch number: 079K1429) and 99%
levamisole (ACROS Organics, CAS: 16595-80-5, Lot: A0287589), and therefore were
diluted to the appropriate concentrations. All tests were run in duplicate, with a total of 10
culture wells per farm (2 control wells and 8 test wells) that were incubated at 26 ± 3°C
for seven days. Recovered L3s in each well were counted and the first 100 L3s were
identified microscopically to the genus level (MAFF, 1986).
123
4.2.8 Descriptive statistics
4.2.8.1 Fecal Egg Count Reduction
All data were entered manually into an Excel spreadsheet (Microsoft Office
Excel©
, 2007). The FECR was calculated in SAS® 9.3 (SAS Institute Inc., Cary, NC,
USA), using the method endorsed by the WAAVP (Coles et al., 1992):
FECR = 100 X (1-[T2/C2]), where T2 and C2 are the arithmetic means of epg, 14
days after treatment, for the treated and control groups, respectively;
The 95% CI was estimated as: 100 X (1- [T2/C2] exp [± 1.96 √Y2]), where Y
2 is
the variance of the reduction percentage.
Farms were classified as resistant when the FECR was <95% and the lower 95% CI limit
was <90%; if only one of these two criteria was met, the farm was classified as being
suspected of resistance (Coles et al., 1992).
4.2.8.2 Genera-specific Reduction
The percentage reduction for specific genera for each treatment was calculated for
each farm in which the FECRT was performed using an equation described by Waghorn
et al. (2006). Briefly, the pre-treatment FEC by genera was obtained by multiplying the
proportion of larvae for each genus in the control well with the average pre-treatment
FEC; any genus failing to achieve the equivalent of >50 epg in the pre-treatment counts
was excluded from further calculations as their number was considered too low to give a
reliable result (Coles et al., 2006). The efficacy by genus, for each treatment, was
calculated by dividing the genus-specific post-treatment FECs by the genus-specific
FECs from the pre-treatment samples, and then multiplying this value with the reduction

124
in the untreated group, to control for any changes occurring in the latter group. When the
reduction was <95%, the genus was considered to be resistant to that anthelmintic
treatment. If the overall FECR was ≥95% (i.e. anthelmintic was effective) and/or <50 L3s
were found in an individual treatment culture (culture results deemed inconclusive for
that anthelmintic), the genus-specific reduction was not calculated. A one-way analysis of
variance using proc GLM for unbalanced design (SAS 9.3) was performed to compare
genus-specific FECRs within treatment groups.
4.2.8.3 Larval Development Assay
The LDA was considered reliable when a mean of >100 larvae was isolated in the
2 control wells. Farms that met this criterion were defined as having a low level of drug
resistance when the total number of L3s that developed in wells containing anthelmintics
at the discriminatory drug concentration of 0.1 µg/mL thiabendazole or 1.0 µg/mL
levamisole (Mitchell et al., 2010) was >5% of the number that developed in the control
wells, while there was ≤5% of the number of larvae than in the control wells in the higher
concentration wells. Farms were defined as having a high level of drug resistance when
the total number of L3s that developed in wells containing anthelmintics at the higher
concentration of 0.3 µg/mL thiabendazole or 3.0 µg/mL levamisole was >5% of the
number that developed in the control wells. The 5% cut-offs were selected to be
consistent with the definition of resistance used for the FECRT, whereby resistance is
said to be present if the reduction in GIN eggs following treatment is <95%, compared to
the number of GIN eggs in the control or pre-treatment group.
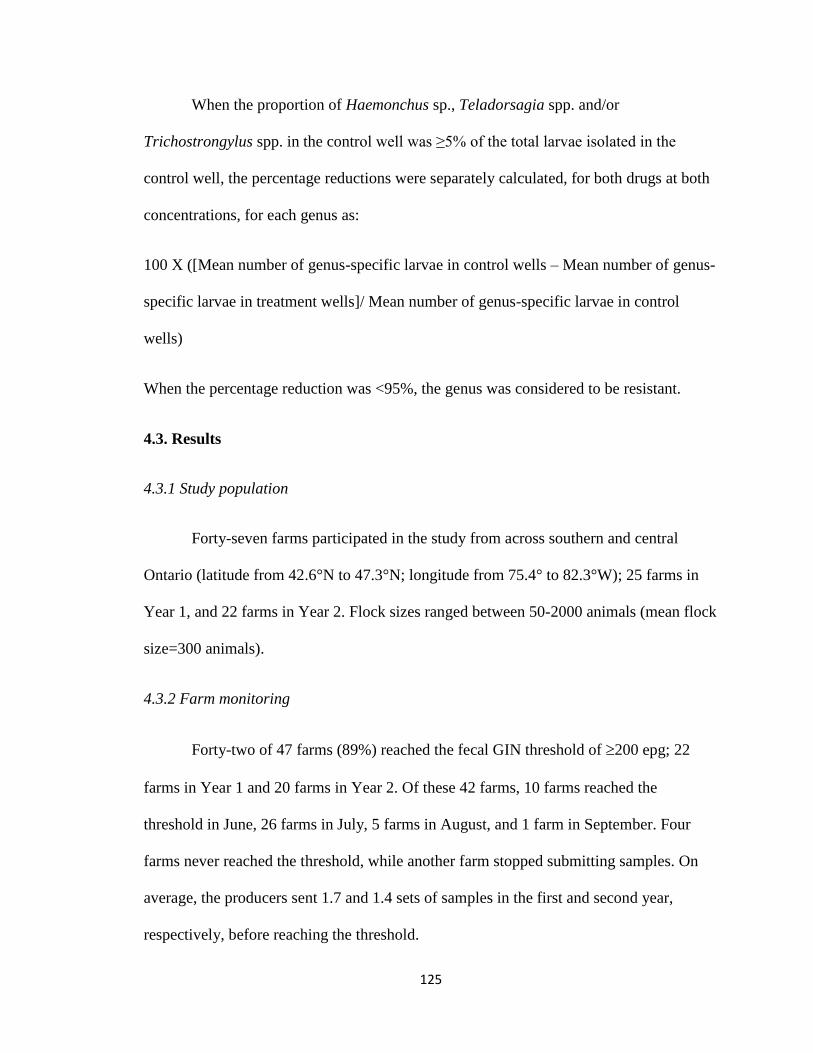
125
When the proportion of Haemonchus sp., Teladorsagia spp. and/or
Trichostrongylus spp. in the control well was ≥5% of the total larvae isolated in the
control well, the percentage reductions were separately calculated, for both drugs at both
concentrations, for each genus as:
100 X ([Mean number of genus-specific larvae in control wells – Mean number of genus-
specific larvae in treatment wells]/ Mean number of genus-specific larvae in control
wells)
When the percentage reduction was <95%, the genus was considered to be resistant.
4.3. Results
4.3.1 Study population
Forty-seven farms participated in the study from across southern and central
Ontario (latitude from 42.6°N to 47.3°N; longitude from 75.4° to 82.3°W); 25 farms in
Year 1, and 22 farms in Year 2. Flock sizes ranged between 50-2000 animals (mean flock
size=300 animals).
4.3.2 Farm monitoring
Forty-two of 47 farms (89%) reached the fecal GIN threshold of 200 epg; 22
farms in Year 1 and 20 farms in Year 2. Of these 42 farms, 10 farms reached the
threshold in June, 26 farms in July, 5 farms in August, and 1 farm in September. Four
farms never reached the threshold, while another farm stopped submitting samples. On
average, the producers sent 1.7 and 1.4 sets of samples in the first and second year,
respectively, before reaching the threshold.

126
4.3.3 Ivermectin drench check
Thirty-nine of 42 farms (93%) performed the ivermectin drench check; 21 farms
in Year 1 and 18 farms in Year 2. The other three farms did not submit post-ivermectin
treatment samples. Of the 39 farms, 5 (13%) farms had ivermectin drench success, while
34 (87%) farms had ivermectin drench failure. All cases of drench success occurred in
the first year. Of the 34 farms with ivermectin drench failure, 16 cases were reported in
the first year and 18 cases were reported in the second year. For farms that performed an
ivermectin drench check, the mean and median pre-ivermectin FECs were 1663 epg and
696 epg, respectively (range: 207 – 8302 epg), while the mean and median post-
ivermectin FECs were 1455 epg and 804 epg, respectively (range: 0 – 5956 epg). The
mean and median overall reductions were -103% and -19%, respectively (range: -1667%
– 100%). Negative reduction values indicate that the FEC increased after treatment with
ivermectin.
4.3.4 Fecal Egg Count Reduction Test
A FECRT was conducted on 29 farms with ivermectin drench failure. In the first
year, tests were conducted on 11 farms and in the second year, the FECRT was
conducted on 16 farms. In addition, a FECRT was performed on two farms from the first
year for which drench failure was reported too late in the season. In the first year, fecal
samples from 5/11 (45%) farms were stored in the refrigerator for up to 3 weeks before
being processed due to a backlog of samples in the laboratory; in the second year, all
samples were analyzed within a week of collection on the farm.
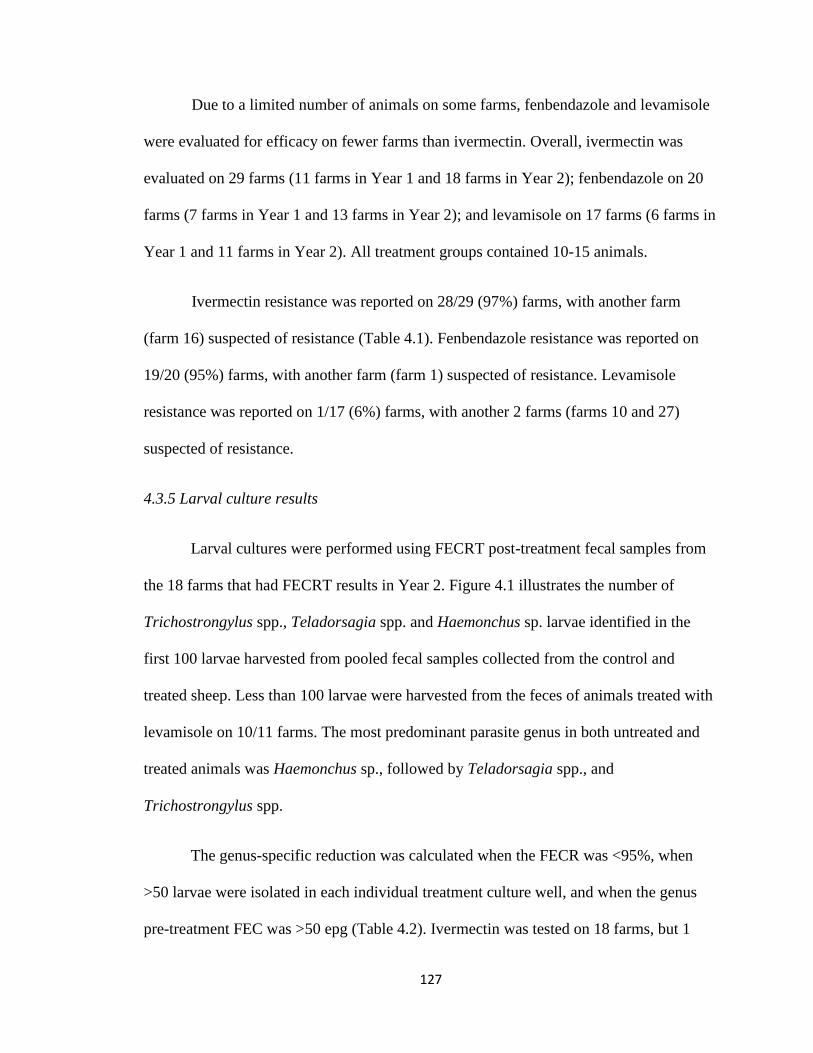
127
Due to a limited number of animals on some farms, fenbendazole and levamisole
were evaluated for efficacy on fewer farms than ivermectin. Overall, ivermectin was
evaluated on 29 farms (11 farms in Year 1 and 18 farms in Year 2); fenbendazole on 20
farms (7 farms in Year 1 and 13 farms in Year 2); and levamisole on 17 farms (6 farms in
Year 1 and 11 farms in Year 2). All treatment groups contained 10-15 animals.
Ivermectin resistance was reported on 28/29 (97%) farms, with another farm
(farm 16) suspected of resistance (Table 4.1). Fenbendazole resistance was reported on
19/20 (95%) farms, with another farm (farm 1) suspected of resistance. Levamisole
resistance was reported on 1/17 (6%) farms, with another 2 farms (farms 10 and 27)
suspected of resistance.
4.3.5 Larval culture results
Larval cultures were performed using FECRT post-treatment fecal samples from
the 18 farms that had FECRT results in Year 2. Figure 4.1 illustrates the number of
Trichostrongylus spp., Teladorsagia spp. and Haemonchus sp. larvae identified in the
first 100 larvae harvested from pooled fecal samples collected from the control and
treated sheep. Less than 100 larvae were harvested from the feces of animals treated with
levamisole on 10/11 farms. The most predominant parasite genus in both untreated and
treated animals was Haemonchus sp., followed by Teladorsagia spp., and
Trichostrongylus spp.
The genus-specific reduction was calculated when the FECR was <95%, when
>50 larvae were isolated in each individual treatment culture well, and when the genus
pre-treatment FEC was >50 epg (Table 4.2). Ivermectin was tested on 18 farms, but 1
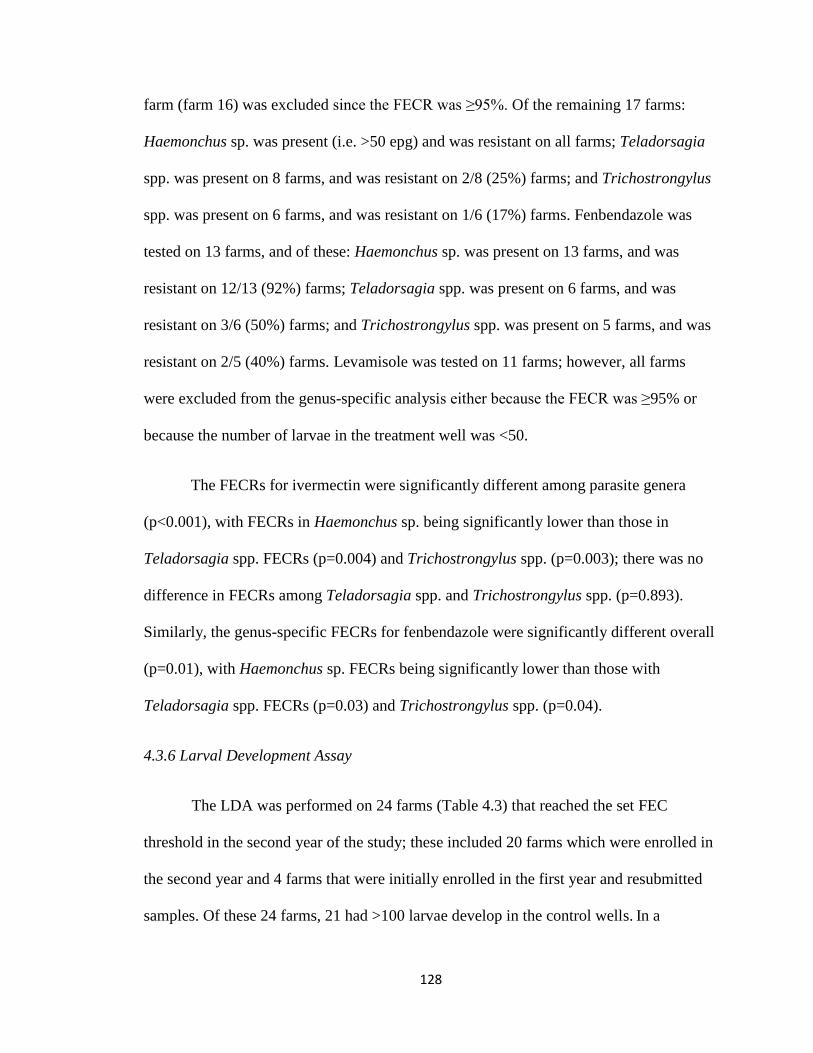
128
farm (farm 16) was excluded since the FECR was ≥95%. Of the remaining 17 farms:
Haemonchus sp. was present (i.e. >50 epg) and was resistant on all farms; Teladorsagia
spp. was present on 8 farms, and was resistant on 2/8 (25%) farms; and Trichostrongylus
spp. was present on 6 farms, and was resistant on 1/6 (17%) farms. Fenbendazole was
tested on 13 farms, and of these: Haemonchus sp. was present on 13 farms, and was
resistant on 12/13 (92%) farms; Teladorsagia spp. was present on 6 farms, and was
resistant on 3/6 (50%) farms; and Trichostrongylus spp. was present on 5 farms, and was
resistant on 2/5 (40%) farms. Levamisole was tested on 11 farms; however, all farms
were excluded from the genus-specific analysis either because the FECR was ≥95% or
because the number of larvae in the treatment well was <50.
The FECRs for ivermectin were significantly different among parasite genera
(p<0.001), with FECRs in Haemonchus sp. being significantly lower than those in
Teladorsagia spp. FECRs (p=0.004) and Trichostrongylus spp. (p=0.003); there was no
difference in FECRs among Teladorsagia spp. and Trichostrongylus spp. (p=0.893).
Similarly, the genus-specific FECRs for fenbendazole were significantly different overall
(p=0.01), with Haemonchus sp. FECRs being significantly lower than those with
Teladorsagia spp. FECRs (p=0.03) and Trichostrongylus spp. (p=0.04).
4.3.6 Larval Development Assay
The LDA was performed on 24 farms (Table 4.3) that reached the set FEC
threshold in the second year of the study; these included 20 farms which were enrolled in
the second year and 4 farms that were initially enrolled in the first year and resubmitted
samples. Of these 24 farms, 21 had >100 larvae develop in the control wells. In a
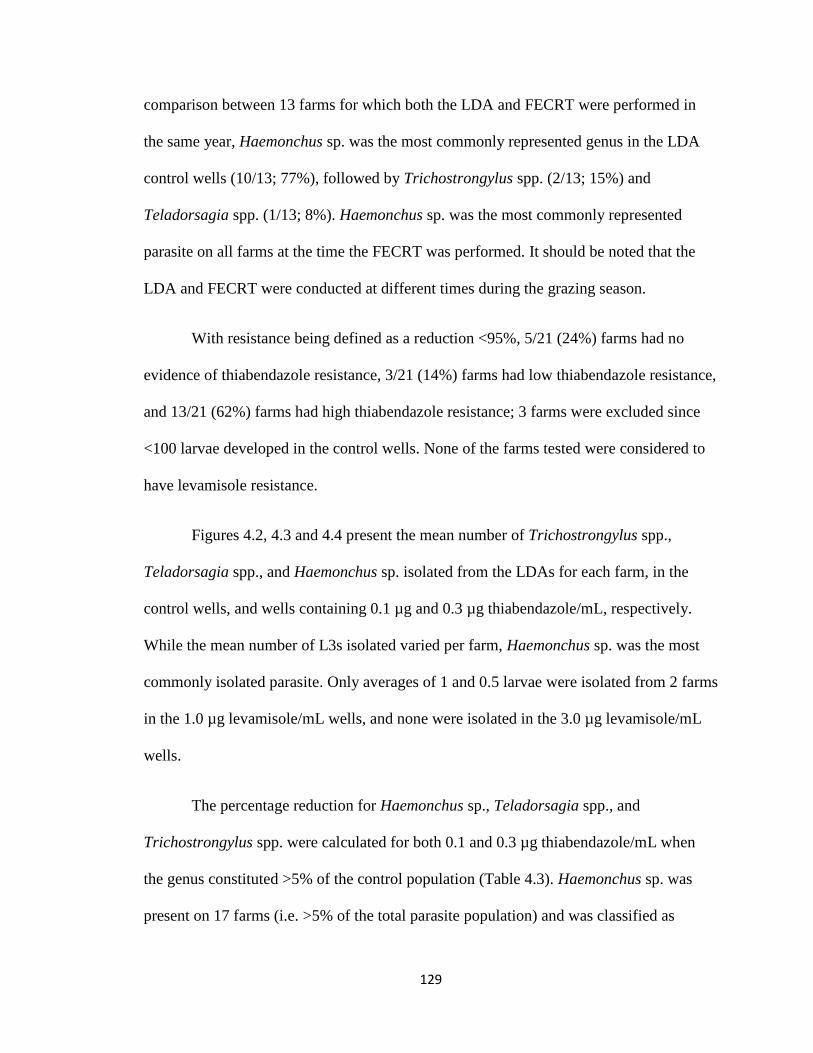
129
comparison between 13 farms for which both the LDA and FECRT were performed in
the same year, Haemonchus sp. was the most commonly represented genus in the LDA
control wells (10/13; 77%), followed by Trichostrongylus spp. (2/13; 15%) and
Teladorsagia spp. (1/13; 8%). Haemonchus sp. was the most commonly represented
parasite on all farms at the time the FECRT was performed. It should be noted that the
LDA and FECRT were conducted at different times during the grazing season.
With resistance being defined as a reduction <95%, 5/21 (24%) farms had no
evidence of thiabendazole resistance, 3/21 (14%) farms had low thiabendazole resistance,
and 13/21 (62%) farms had high thiabendazole resistance; 3 farms were excluded since
<100 larvae developed in the control wells. None of the farms tested were considered to
have levamisole resistance.
Figures 4.2, 4.3 and 4.4 present the mean number of Trichostrongylus spp.,
Teladorsagia spp., and Haemonchus sp. isolated from the LDAs for each farm, in the
control wells, and wells containing 0.1 µg and 0.3 µg thiabendazole/mL, respectively.
While the mean number of L3s isolated varied per farm, Haemonchus sp. was the most
commonly isolated parasite. Only averages of 1 and 0.5 larvae were isolated from 2 farms
in the 1.0 µg levamisole/mL wells, and none were isolated in the 3.0 µg levamisole/mL
wells.
The percentage reduction for Haemonchus sp., Teladorsagia spp., and
Trichostrongylus spp. were calculated for both 0.1 and 0.3 µg thiabendazole/mL when
the genus constituted >5% of the control population (Table 4.3). Haemonchus sp. was
present on 17 farms (i.e. >5% of the total parasite population) and was classified as
130
resistant on 14/17 (82%) farms for 0.1 µg thiabendazole/mL, and on 13/17 (76%) for the
0.3 µg thiabendazole/mL wells. Teladorsagia spp. was present on 13 farms and was
classified as resistant on 5/13 (39%) farms for 0.1 µg thiabendazole/mL and on 4/13
(31%) farms for 0.3 µg thiabendazole/mL. Trichostongylus spp. was present on 7 farms
and was classified as resistant on 2/7 (29%) farms for 0.1 µg thiabendazole/mL, and on
none of the farms for 0.3 µg thiabendazole/mL.
4.4. Discussion
4.4.1 Fecal monitoring and ivermectin drench check
On almost 90% of the farms enrolled in the study, the FEC reached the set
threshold of 200 epg for the ivermectin drench check at some point over the summer
months. While clinical practitioners may use a threshold of >800 epg to indicate a high
FEC (Sargison, 2008), a lower threshold of 200 epg was selected based on previous work
on the distribution and abundance of GIN on farms in Ontario (Mederos et al., 2010).
This work showed that pasture larval counts peak during the summer months, and
because the time interval between sampling for this study was 3-4 weeks, it was planned
that animals were treated before GIN infections became too severe and compromised
their health.
An ivermectin drench check was conducted to assess what normally happens on
sheep farms, when producers are not provided any information on correct anthelmintic
dosages. Of the 39 farms that performed an ivermectin drench check, 87% had drench
failure. This suggests that ivermectin treatment failure is a common occurrence on
Ontario sheep farms. While AR is often incriminated as the main cause for anthelmintic
131
treatment failure, several other factors can be responsible. These include under-dosing or
incorrect administration of the anthelmintic (McKenna, 1990; Taylor et al., 2002; El-
Abdellati et al., 2010).
The reduction in egg count in the ivermectin drench check was estimated using
the first mean FEC that reached or exceeded the 200 epg threshold as the pre-treatment
FEC. However, since approximately two weeks elapsed between submission and analysis
of the pre-treatment fecal samples, delivery of ivermectin to the farms, and producers
treating the animals, it is likely that the actual FEC on the day of treatment by the
producers was higher. Therefore, approximately four weeks passed between the pre- and
post-treatment FECs, which might have led to an under-estimation of the ivermectin
efficacy and, consequently, an over-estimation of the frequency of drench failure.
4.4.2 Fecal Egg Count Reduction Test
Using the FECRT, ivermectin susceptibility was assessed on 29 farms,
fenbendazole susceptibility on 20 farms, and levamisole susceptibility on 17 farms. Most
of the farms that participated in the study were classified as having parasites resistant to
ivermectin (97%) and fenbendazole (95%), the two anthelmintic drugs that are most
frequently used by Canadian producers, while only 6% of the farms tested had parasites
resistant to levamisole (Table 4.1). Ivermectin is the only anthelmintic licensed for use in
sheep in Canada (Compendium of Veterinary Products, Canada, 2012), and many sheep
producers have relied exclusively on this drug for the past two decades. This might
partially explain the widespread resistance to ivermectin observed in this study.
Similarly, while fenbendazole and albendazole are not licensed for use in sheep in
132
Canada, many sheep producers have used products formulated for use in cattle in an
extra-label manner for many decades. Side-resistance between drugs within the same
drug class has been described (Martin et al., 1989; Sangster and Gill, 1999). Furthermore,
it has been hypothesized that cross-resistance could also occur between different drug
classes, whereby one genetic mutation might facilitate further mutations, or enhance the
activity of particular enzymes, allowing the parasite to develop multiple-drug resistance
(Sargison et al., 2010).
Most of the farms in our study had parasites that were susceptible to levamisole.
Since levamisole has not been commercially available in Canada for the last 10 years
(Health Canada – Drug Product Database Online Query, 2012), very few producers in our
study had routine access to the drug, reducing the selective pressure for resistance.
Levamisole resistance has been reported in other countries where the drug is readily
available (Waghorn et al., 2006; Cezar et al., 2010; Sargison et al., 2010). On the few
farms where resistance, or suspected resistance, to levamisole was shown, the mean
reduction percentage was likely affected by a few outlier sheep; the reduced efficacy was
due to a few sheep having low, as opposed to zero, post-treatment FECs (farm 10) or one
sheep with a high post-treatment FEC out of a group with negative post-treatment FECs
(farms 27 and 28). Cabaret and Berrag (2004) have suggested that, in situations like
these, when the overall efficacy is high, low efficacies in one or a few of the individuals
are often not indicators of resistance in those animals, but rather may be due to other
factors such as poor metabolism or poor bioavailability of the drug in those animals.
Coles et al. (2006) suggest that when assessing the efficacy of levamisole, post-
treatment fecal samples should be collected 7-10 days after treatment. However, due to
133
logistic contraints, fecal samples were collected from all animals in this study on day 14
following treatment for the FECRT. The aforementioned recommendations are based on
studies by Grimshaw et al. (1994 and 1996), where a number of larvae were found at
necropsy, despite treatment of animals with levamisole 11 days earlier. The authors
suggested that levamisole was ineffective against immature stages, which could lead to
misinterpretation of positive FECs 14 days after treating animals with levamisole, since
this could be a result of the immature larvae developing into adult worms, rather than the
presence of resistant parasites. However, our study did not support these findings, since
the majority of the farms had 0 post-treatment FECs 14 days after treatment with
levamisole, and the LDA results confirmed these findings. While one may argue that the
FECRT results could be due to the higher dosage (10.5 mg/kg) used in this study (Pugh,
2001), other studies (McKenna, 1974; Andrews, 2000) have shown that levamisole was
effective against arrested larvae in sheep; both studies treated sheep at a dosage of 8.0
mg/kg. It is also possible that during the summer months when this study was conducted,
there were few arrested larvae.
4.4.3 Larval cultures of post-treatment fecal samples
Larval cultures provide insight into the parasite genera present in animals, and
therefore allow for the determination of the efficacy at the genus level (McKenna, 1990).
In the work described here, the fecal samples for larval culture were obtained from
animals that had previously been treated with ivermectin (i.e. drench check prior to the
FECRT). However, a minimum of five weeks elapsed between the ivermectin treatment
for the drench check and the second FECRT visit, when larval cultures were conducted
on the control (i.e. untreated) animals, providing sufficient time for the animals to
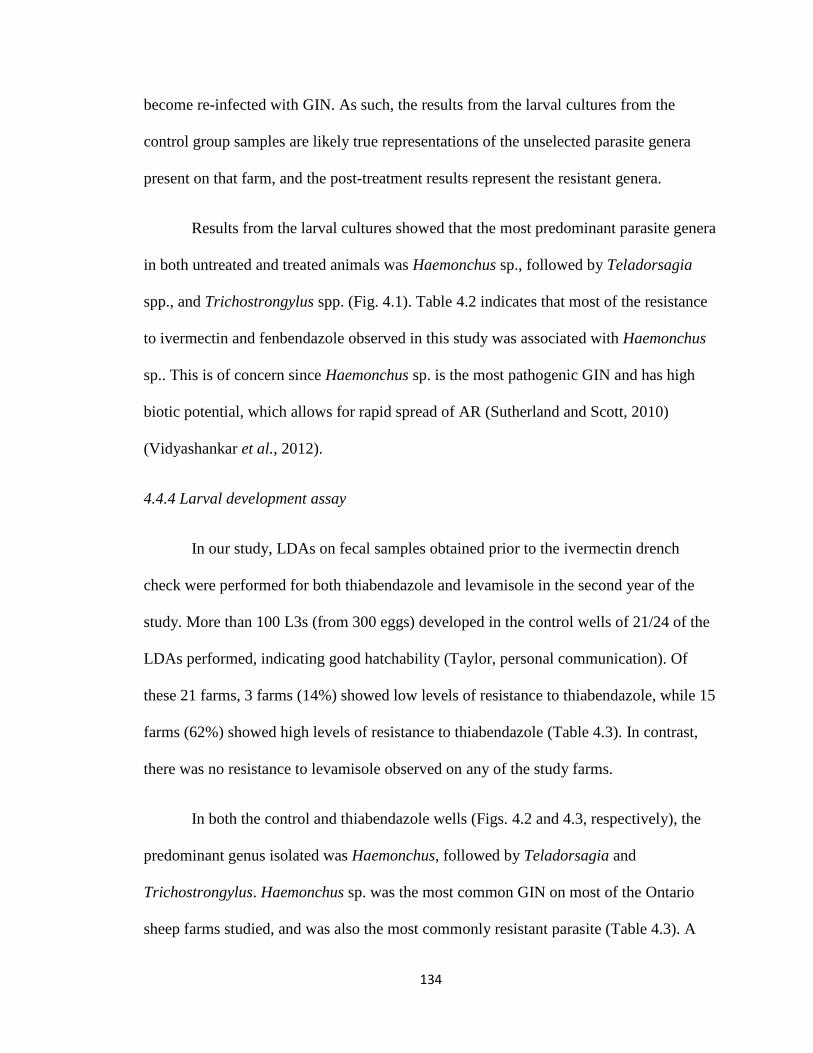
134
become re-infected with GIN. As such, the results from the larval cultures from the
control group samples are likely true representations of the unselected parasite genera
present on that farm, and the post-treatment results represent the resistant genera.
Results from the larval cultures showed that the most predominant parasite genera
in both untreated and treated animals was Haemonchus sp., followed by Teladorsagia
spp., and Trichostrongylus spp. (Fig. 4.1). Table 4.2 indicates that most of the resistance
to ivermectin and fenbendazole observed in this study was associated with Haemonchus
sp.. This is of concern since Haemonchus sp. is the most pathogenic GIN and has high
biotic potential, which allows for rapid spread of AR (Sutherland and Scott, 2010)
(Vidyashankar et al., 2012).
4.4.4 Larval development assay
In our study, LDAs on fecal samples obtained prior to the ivermectin drench
check were performed for both thiabendazole and levamisole in the second year of the
study. More than 100 L3s (from 300 eggs) developed in the control wells of 21/24 of the
LDAs performed, indicating good hatchability (Taylor, personal communication). Of
these 21 farms, 3 farms (14%) showed low levels of resistance to thiabendazole, while 15
farms (62%) showed high levels of resistance to thiabendazole (Table 4.3). In contrast,
there was no resistance to levamisole observed on any of the study farms.
In both the control and thiabendazole wells (Figs. 4.2 and 4.3, respectively), the
predominant genus isolated was Haemonchus, followed by Teladorsagia and
Trichostrongylus. Haemonchus sp. was the most common GIN on most of the Ontario
sheep farms studied, and was also the most commonly resistant parasite (Table 4.3). A
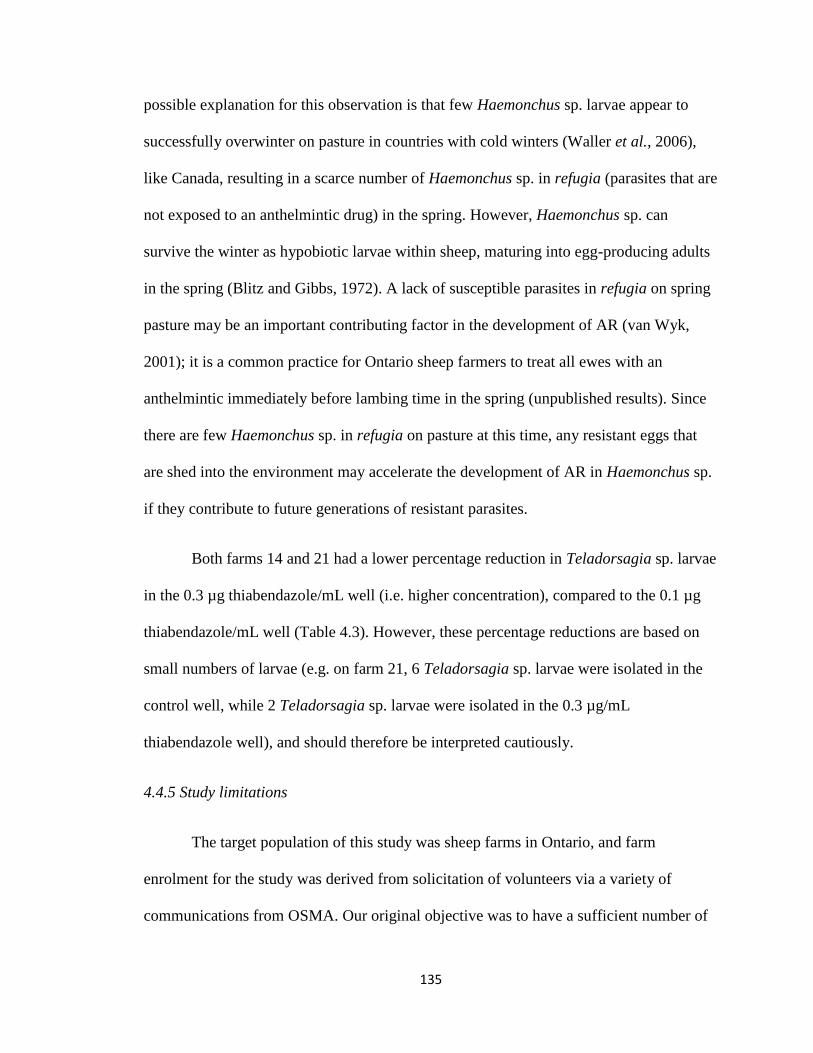
135
possible explanation for this observation is that few Haemonchus sp. larvae appear to
successfully overwinter on pasture in countries with cold winters (Waller et al., 2006),
like Canada, resulting in a scarce number of Haemonchus sp. in refugia (parasites that are
not exposed to an anthelmintic drug) in the spring. However, Haemonchus sp. can
survive the winter as hypobiotic larvae within sheep, maturing into egg-producing adults
in the spring (Blitz and Gibbs, 1972). A lack of susceptible parasites in refugia on spring
pasture may be an important contributing factor in the development of AR (van Wyk,
2001); it is a common practice for Ontario sheep farmers to treat all ewes with an
anthelmintic immediately before lambing time in the spring (unpublished results). Since
there are few Haemonchus sp. in refugia on pasture at this time, any resistant eggs that
are shed into the environment may accelerate the development of AR in Haemonchus sp.
if they contribute to future generations of resistant parasites.
Both farms 14 and 21 had a lower percentage reduction in Teladorsagia sp. larvae
in the 0.3 µg thiabendazole/mL well (i.e. higher concentration), compared to the 0.1 µg
thiabendazole/mL well (Table 4.3). However, these percentage reductions are based on
small numbers of larvae (e.g. on farm 21, 6 Teladorsagia sp. larvae were isolated in the
control well, while 2 Teladorsagia sp. larvae were isolated in the 0.3 µg/mL
thiabendazole well), and should therefore be interpreted cautiously.
4.4.5 Study limitations
The target population of this study was sheep farms in Ontario, and farm
enrolment for the study was derived from solicitation of volunteers via a variety of
communications from OSMA. Our original objective was to have a sufficient number of
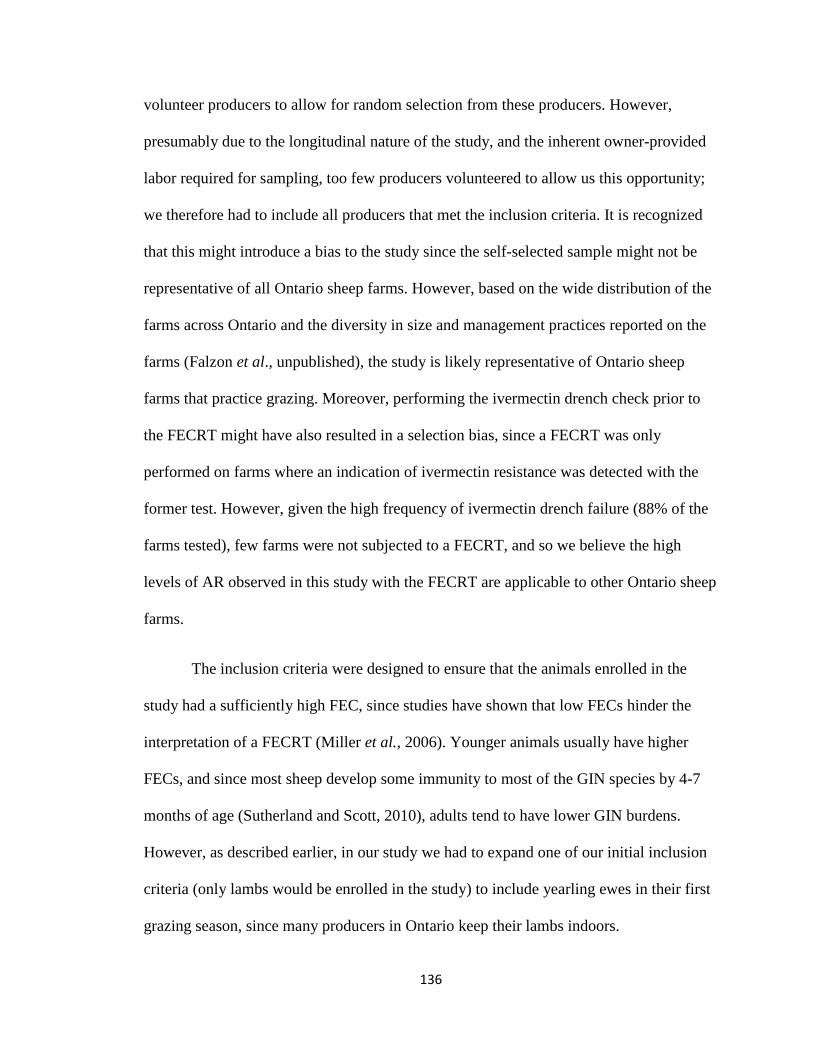
136
volunteer producers to allow for random selection from these producers. However,
presumably due to the longitudinal nature of the study, and the inherent owner-provided
labor required for sampling, too few producers volunteered to allow us this opportunity;
we therefore had to include all producers that met the inclusion criteria. It is recognized
that this might introduce a bias to the study since the self-selected sample might not be
representative of all Ontario sheep farms. However, based on the wide distribution of the
farms across Ontario and the diversity in size and management practices reported on the
farms (Falzon et al., unpublished), the study is likely representative of Ontario sheep
farms that practice grazing. Moreover, performing the ivermectin drench check prior to
the FECRT might have also resulted in a selection bias, since a FECRT was only
performed on farms where an indication of ivermectin resistance was detected with the
former test. However, given the high frequency of ivermectin drench failure (88% of the
farms tested), few farms were not subjected to a FECRT, and so we believe the high
levels of AR observed in this study with the FECRT are applicable to other Ontario sheep
farms.
The inclusion criteria were designed to ensure that the animals enrolled in the
study had a sufficiently high FEC, since studies have shown that low FECs hinder the
interpretation of a FECRT (Miller et al., 2006). Younger animals usually have higher
FECs, and since most sheep develop some immunity to most of the GIN species by 4-7
months of age (Sutherland and Scott, 2010), adults tend to have lower GIN burdens.
However, as described earlier, in our study we had to expand one of our initial inclusion
criteria (only lambs would be enrolled in the study) to include yearling ewes in their first
grazing season, since many producers in Ontario keep their lambs indoors.
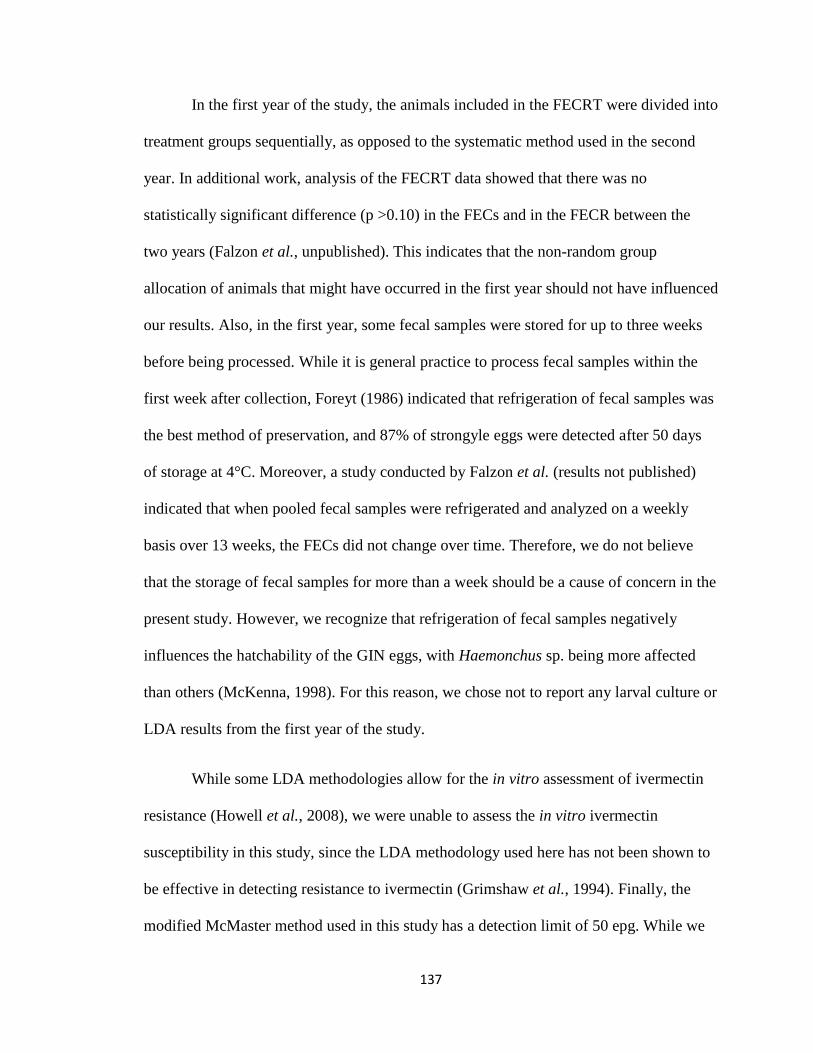
137
In the first year of the study, the animals included in the FECRT were divided into
treatment groups sequentially, as opposed to the systematic method used in the second
year. In additional work, analysis of the FECRT data showed that there was no
statistically significant difference (p >0.10) in the FECs and in the FECR between the
two years (Falzon et al., unpublished). This indicates that the non-random group
allocation of animals that might have occurred in the first year should not have influenced
our results. Also, in the first year, some fecal samples were stored for up to three weeks
before being processed. While it is general practice to process fecal samples within the
first week after collection, Foreyt (1986) indicated that refrigeration of fecal samples was
the best method of preservation, and 87% of strongyle eggs were detected after 50 days
of storage at 4°C. Moreover, a study conducted by Falzon et al. (results not published)
indicated that when pooled fecal samples were refrigerated and analyzed on a weekly
basis over 13 weeks, the FECs did not change over time. Therefore, we do not believe
that the storage of fecal samples for more than a week should be a cause of concern in the
present study. However, we recognize that refrigeration of fecal samples negatively
influences the hatchability of the GIN eggs, with Haemonchus sp. being more affected
than others (McKenna, 1998). For this reason, we chose not to report any larval culture or
LDA results from the first year of the study.
While some LDA methodologies allow for the in vitro assessment of ivermectin
resistance (Howell et al., 2008), we were unable to assess the in vitro ivermectin
susceptibility in this study, since the LDA methodology used here has not been shown to
be effective in detecting resistance to ivermectin (Grimshaw et al., 1994). Finally, the
modified McMaster method used in this study has a detection limit of 50 epg. While we
138
recognize that this may introduce a bias when calculating FECR values (El-Abdellati et
al., 2010), we believe that, given the high post-treatment FECs on many of the farms, this
would have had minimal influence on the high frequency of ivermectin and fenbendazole
resistance detected on the farms in this study. While recent studies have suggested
including pre-treatment egg counts in calculations for FECRTs to account for this bias
(Levecke et al., 2012), we have elected to utilize the calculation endorsed by the
WAAVP (Coles et al., 1992).
4.5 Conclusion
Drench failure to ivermectin occurred on most of the volunteer farms tested.
FECRT results indicated that resistance to ivermectin and fenbendazole, the two drugs
most frequently used by Canadian sheep producers, was common on the Ontario sheep
farms tested, while levamisole was mostly effective. Results from the LDA on fecal
samples obtained prior to the ivermectin drench check also indicated widespread
resistance to benzimidazoles, while confirming susceptibility to levamisole on all farms
tested. Haemonchus sp. was the most commonly isolated parasite in both the LDA and
post-treatment FECRT cultures. It would therefore appear that most of the ivermectin and
benzimidazole resistance detected on the Ontario farms was associated with Haemonchus
sp., which is a concern as this is typically the most pathogenic of the GIN that infect
sheep in Ontario. Overall, these findings strongly suggest that anthelmintic resistance,
particularly in Haemonchus sp., appears to be a serious problem in Ontario sheep flocks.
Thus, veterinarians and sheep producers should exercise more judicious use of
anthelmintics and incorporate sustainable integrated parasite management strategies to

139
mitigate a worsening situation, and to maintain the sustainability of the Ontario sheep
industry.
4.6 Acknowledgements
This research was supported by the Animal Health Strategic Initiative, with
additional support from the University of Guelph for summer student positions and in-
kind assistance from Merial, Canada. The authors are very grateful to William Sears for
statistical advice and to Brad De Wolf, Steve Roche, Grazyna Adamska-Jarecka, Katie
Sippel, Kirstie Puskas, Lee Siertsema, Jacqueline Sinclair, Benjamin Schlegel and David
Baker for laboratory and field assistance. We especially acknowledge the sheep
producers that participated in the study.
Conflict of interest
The authors declare no conflict of interest.
140
4.7 References
Abbott, K.A., Taylor, M.A., Stubbings, L.A., 2009. Sustainable worm control strategies
for sheep. 3rd
Ed. A technical manual for veterinary surgeons and advisers. 51pp.
Published by: Sustainable Control of Parasites in Sheep (SCOPS).
Adams, H.R., 2001. Veterinary Pharmacology and Therapeutics. 8th
Ed (ISBN-13: 978-0-
8138-1743-9). Blackwell Publishing Professional, Iowa 50014-8300, pp. 947-980.
Andrews, S.J., 2000. The efficacy of levamisole, and a mixture of oxfendazole and
levamisole, against the arrested stages of benzimidazole-resistant Haemonchus
contortus and Ostertagia circumcincta in sheep. Vet. Parasitol. 88, 139-146.
Besier, R.B., Love, S.C.J., 2004. Anthelmintic resistance in sheep nematodes in
Australia: the need for new approaches. Aust. J. Exp. Agr. 43, 1383-1391.
Blitz, N.M., Gibbs, H.C., 1972. Studies on the arrested development of Haemonchus
contortus in sheep – II. Termination of arrested development and the spring rise
phenomenon. Int. J. Parasitol. 2, 13-22.
Cabaret, J., Berrag, B., 2004. Fecal egg count reduction test for assessing anthelmintic
efficacy: average versus individually based estimations. Vet. Parasitol. 121, 105-
113.
Campbell, W.C., Benz, G.W., 1984. Ivermectin: a review of efficacy and safety. J. Vet.
Pharmacol. Therap. 7, 1-16.
Cezar, A.S., Toscan, G., Camillo, G., Sangioni, L.A., Ribas, H.O., Vogel, F.S.F., 2010.
Multiple resistance of gastrointestinal nematodes to nine different drugs in a sheep
flock in southern Brazil. Vet. Parasitol. 173, 157-160.
Coles, G.C., Bauer, C., Borgsteede, F.H.M., Geerts, S., Klei, T.R., Taylor, M.A., Waller,
P.J., 1992. World Association for the Advancement of Veterinary Parasitology
(W.A.A.V.P.) methods for the detection of anthelmintic resistance in nematodes of
veterinary importance. Vet. Parasitol. 44, 35-44.
Coles, G.C., Jackson, F., Pomroy, W.E., Prichard, R.K., von Samson-Himmelstjerna, G.,
Silvestre, A., Taylor, M.A., Vercuysse, J., 2006. The detection of anthelmintic
resistance in nematodes of veterinary importance. Vet. Parasitol. 136, 167-185.
Compendium of Veterinary Products, Canada, 2012. Available from:
http://csf.naccvp.com/?u=country&p=msds. [Accessed: 16th
March, 2012]
Craven, J., Bjorn, H., Barnes, E.H., Henriksen, S.A., Nansen, P., 1999. A comparison of
in vitro tests and a faecal egg count reduction test in detecting anthelmintic
resistance in horse strongyles. Vet. Parasitol. 85, 49-59.
141
Cringoli, G., Rinaldi, L., Veneziano, V., Mezzino, L., Vercruysse, J., Jackson, F., 2009.
Evaluation of targeted selective treatments in sheep in Italy: effects on faecal worm
egg count and milk production in four case studies. Vet. Parasitol. 164, 36-43.
El-Abdellati, A., Charlier, J., Geldhof, P., Levecke, B., Demeler, J., von Samson-
Himmelstjerna, G., Claerebout, E., Vercuysse, J., 2010. The use of a simplified
faecal egg count reduction test for assessing anthelmintic efficacy on Belgian and
German cattle farms. Vet. Parasitol. 169, 352-357.
Foreyt, W.J., 1986. Recovery of nematode eggs and larvae in deer: Evaluation of fecal
preservation methods. Journal American Veterinary Medical Association 189,
1065-1067.
Gallidis, E., Papadopoulos, E., Ptochos, S., Arsenos, G., 2009. The use of targeted
selective treatments against gastrointestinal nematodes in milking sheep and goats
in Greece based on parasitological and performance criteria. Vet. Parasitol. 164, 53-
58.
Glauser, J., Fernandez, S., Menzies, P., Peregrine, A.S., 2007. Multiple anthelmintic
resistance in an Ontario sheep flock. In: 22nd Annual General Meeting, Ontario
Sheep Marketing Agency, Guelph, Ontario, 26th–27th October, 2007.
Grimshaw, W.T.R., Hunt, K.R., Hong, C., Coles, G.C., 1994. Detection of anthelmintic
resistant nematodes in sheep in southern England by a faecal egg count reduction
test. Vet. Rec. 135, 372-374.
Grimshaw, W.T.R., Hong, C., Hunt, K.R., 1996. Potential for misinterpretation of the
faecal egg count reduction test for levamisole resistance in gastrointestinal
nematodes of sheep. Vet. Parasitol. 62, 267-273.
Health Canada – Drug Product Database Online Query, 2012. Available from:
http://webprod3.hc-sc.gc.ca/dpd-bdpp/index-eng.jsp [Accessed: 25th June, 2012]
Howell, S.B., Burke, J.M., Miller, J.M., Terrill, T.H., Valencia, E., Williams, M.J.,
Williamson, L.H., Zajac, A.M., Kaplan, R.M., 2008. Prevalence of anthelmintic
resistance on sheep and goat farms in the southeastern United States. J. Am.Vet.
Med. Assoc. 233, 1913-1919.
Jackson, F., Coop, R.L., 2000. The development of anthelmintic resistance in sheep
nematodes. Parasitology 120, 95-107.
Kaplan, R.M., Vidyashankar, A.N., 2012. An inconvenient truth: global worming and
anthelmintic resistance. Vet. Parasitol. 186, 70-78.
Levecke, B., Rinaldi, L., Charlier, J., Maurelli, M.P., Bosco, A., Vercruysse, J., Cringoli,
G., 2012. The bias, accuracy and precision of faecal egg count reduction test results
in cattle using McMaster, Cornell-Wisconsin and FLOTAC egg counting methods.
Vet. Parasitol. 188, 194-199.
142
Love, S.C., Johns, W.J., Coverdale, O.R., 1992. Anthelmintic resistance in sheep
nematodes in New England region of New South Wales. Aust. Vet. J. 69, 196-197.
Martin, P.J., Anderson, N., Jarrett, R.G., 1989. Detecting benzimidazole resistance with
faecal egg count reduction test and in vitro assays. Aust. Vet. J. 66, 236-240.
McKenna, P.B., 1974. The anthelmintic efficacy of thiabendazole and levamisole against
inhibited Haemonchus contortus larvae in sheep. N. Z. Vet. J. 22, 163-166.
McKenna, P.B., 1990. The detection of anthelmintic resistance by the faecal egg count
reduction test: an examination of some of the factors affecting performance and
interpretation. N. Z. Vet. J. 38, 142-147.
McKenna, P.B., 1998. The effect of previous cold storage on the subsequent recovery of
infective third stage nematode larvae from sheep faeces. Vet. Parasit. 80, 167-172.
McKenna, P.B., 2006. A comparison of faecal egg count reduction test procedures. N. Z.
Vet. J. 54, 202-203.
Mederos, A., Fernandes, S., VanLeeuwen, J., Peregrine, A.S., Kelton, D., Menzies, P.,
LeBoeuf, A., Martin, R., 2010. Prevalence and distribution of gastrointestinal
nematodes on 32 organic and conventional commercial sheep farms in Ontario and
Quebec, Canada (2006 – 2008). Vet. Parasitol. 170, 244-252.
Miller, C.M., Waghorn, T.S., Leathwick, D.M., Gilmour, M.L., 2006. How repeatable is
a faecal egg count reduction test? N. Z. Vet J. 54, 323-328.
Ministry of Agriculture, Fisheries and Food, 1986. Manual of veterinary parasitological
laboratory techniques, Technical Bulletin No. 18, HMSO, London, 124 pp.
Mitchell, E.S.E., Hunt, K.R., Wood, R., McLean, B., 2010. Anthelmintic resistance on
sheep farms in Wales. Vet. Rec. 166, 650-652.
Papadopoulos, E., 2008. Anthelmintic resistance in sheep nematodes. Small Rumin. Res.
76, 99-103.
Pugh, D.G., 2001. Sheep and Goat Medicine. W.B. Saunders Company, Philadelphia,
Pennsylvania 19106, USA, pp. 439.
Sangster, N.C., Gill, J., 1999. Pharmacology of anthelmintic resistance. Parasitol. Today
15, 141-146.
Sargison, N.D., 2008. Sheep flock health: a planned approach (ISBN: 978-1-4051-6044-
5). Blackwell Publishing Ltd., United Kingdom, pp. 149-191.
Sargison, N.D., Jackson, R., Wilson, D.J., Bartley, D.J., Penny, C.D., Gilleard, J.S., 2010.
Characterisation of milbemycin-, avermectin-, imidazothiazole- and benzimidazole-
resistant Teladorsagia circumcincta from a sheep flock. Vet. Rec. 166, 681-686.
Smart, J.A., 2009. Faecal egg count reduction test follies. The Society of Sheep and Beef
Cattle Veterinarians – New Zealand Veterinary Association Newsletter 35, 21-25.
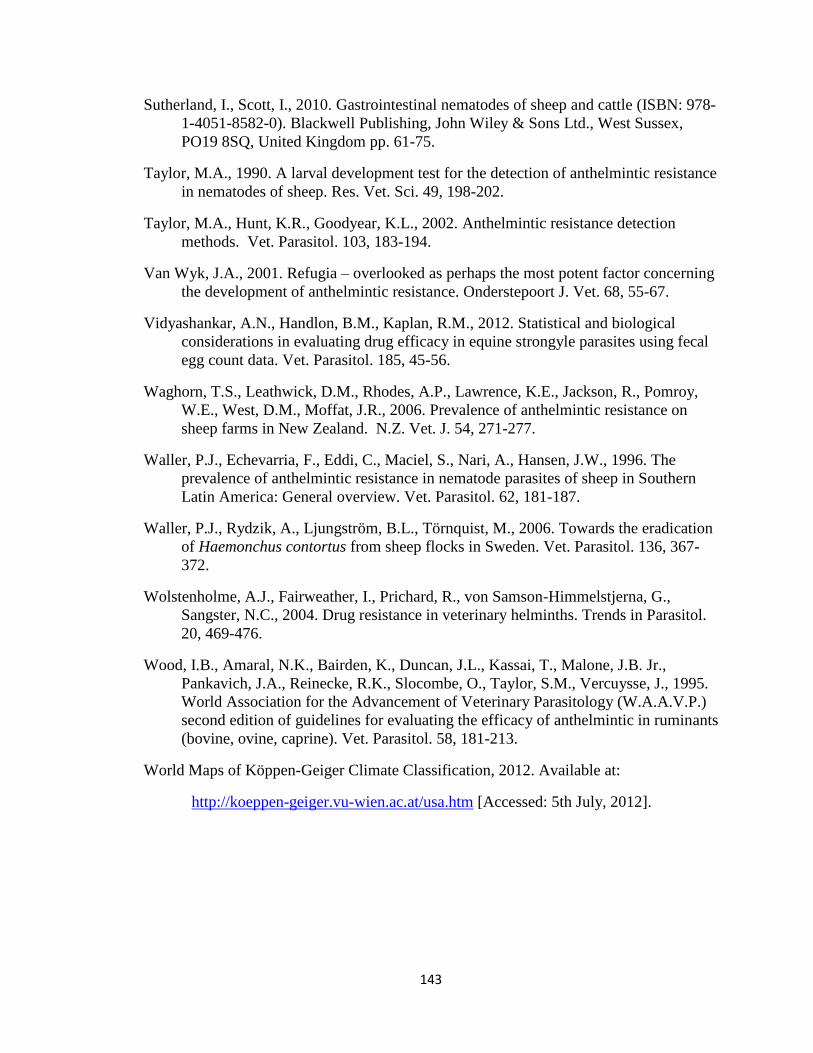
143
Sutherland, I., Scott, I., 2010. Gastrointestinal nematodes of sheep and cattle (ISBN: 978-
1-4051-8582-0). Blackwell Publishing, John Wiley & Sons Ltd., West Sussex,
PO19 8SQ, United Kingdom pp. 61-75.
Taylor, M.A., 1990. A larval development test for the detection of anthelmintic resistance
in nematodes of sheep. Res. Vet. Sci. 49, 198-202.
Taylor, M.A., Hunt, K.R., Goodyear, K.L., 2002. Anthelmintic resistance detection
methods. Vet. Parasitol. 103, 183-194.
Van Wyk, J.A., 2001. Refugia – overlooked as perhaps the most potent factor concerning
the development of anthelmintic resistance. Onderstepoort J. Vet. 68, 55-67.
Vidyashankar, A.N., Handlon, B.M., Kaplan, R.M., 2012. Statistical and biological
considerations in evaluating drug efficacy in equine strongyle parasites using fecal
egg count data. Vet. Parasitol. 185, 45-56.
Waghorn, T.S., Leathwick, D.M., Rhodes, A.P., Lawrence, K.E., Jackson, R., Pomroy,
W.E., West, D.M., Moffat, J.R., 2006. Prevalence of anthelmintic resistance on
sheep farms in New Zealand. N.Z. Vet. J. 54, 271-277.
Waller, P.J., Echevarria, F., Eddi, C., Maciel, S., Nari, A., Hansen, J.W., 1996. The
prevalence of anthelmintic resistance in nematode parasites of sheep in Southern
Latin America: General overview. Vet. Parasitol. 62, 181-187.
Waller, P.J., Rydzik, A., Ljungström, B.L., Törnquist, M., 2006. Towards the eradication
of Haemonchus contortus from sheep flocks in Sweden. Vet. Parasitol. 136, 367-
372.
Wolstenholme, A.J., Fairweather, I., Prichard, R., von Samson-Himmelstjerna, G.,
Sangster, N.C., 2004. Drug resistance in veterinary helminths. Trends in Parasitol.
20, 469-476.
Wood, I.B., Amaral, N.K., Bairden, K., Duncan, J.L., Kassai, T., Malone, J.B. Jr.,
Pankavich, J.A., Reinecke, R.K., Slocombe, O., Taylor, S.M., Vercuysse, J., 1995.
World Association for the Advancement of Veterinary Parasitology (W.A.A.V.P.)
second edition of guidelines for evaluating the efficacy of anthelmintic in ruminants
(bovine, ovine, caprine). Vet. Parasitol. 58, 181-213.
World Maps of Köppen-Geiger Climate Classification, 2012. Available at:
http://koeppen-geiger.vu-wien.ac.at/usa.htm [Accessed: 5th July, 2012].
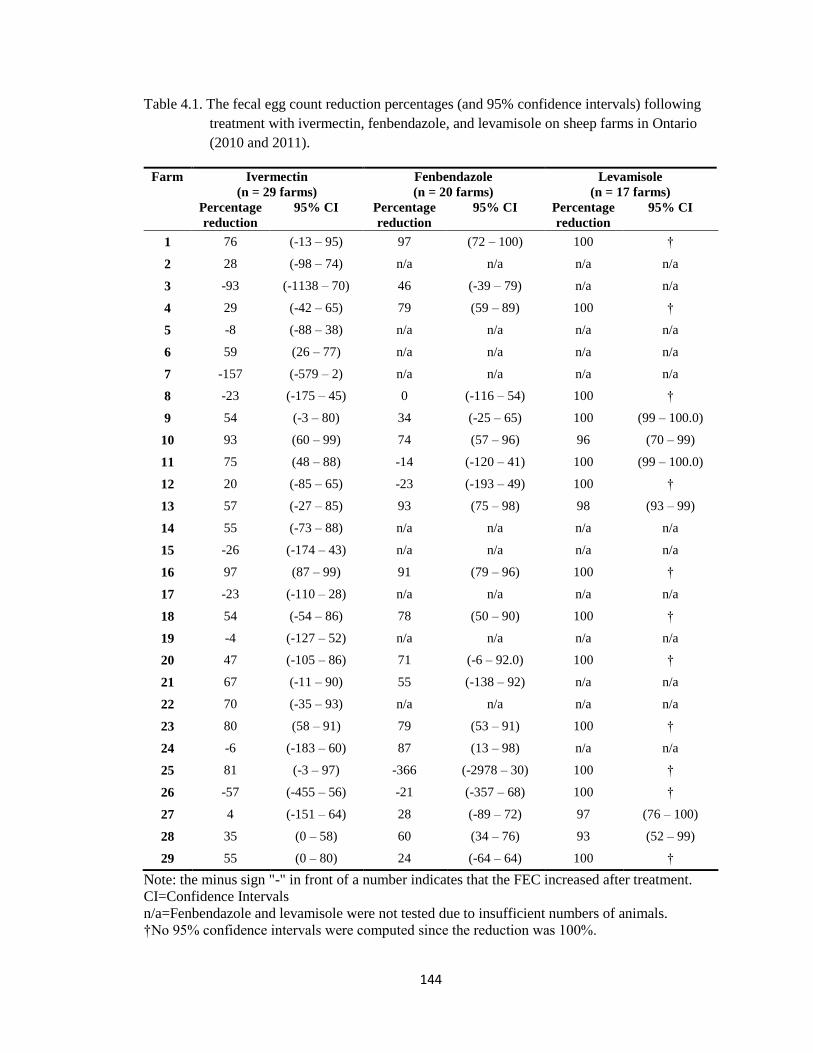
144
Table 4.1. The fecal egg count reduction percentages (and 95% confidence intervals) following
treatment with ivermectin, fenbendazole, and levamisole on sheep farms in Ontario
(2010 and 2011).
Farm Ivermectin
(n = 29 farms)
Fenbendazole
(n = 20 farms)
Levamisole
(n = 17 farms)
Percentage
reduction
95% CI
Percentage
reduction
95% CI
Percentage
reduction
95% CI
1 76 (-13 – 95) 97 (72 – 100) 100 †
2 28 (-98 – 74) n/a n/a n/a n/a
3 -93 (-1138 – 70) 46 (-39 – 79) n/a n/a
4 29 (-42 – 65) 79 (59 – 89) 100 †
5 -8 (-88 – 38) n/a n/a n/a n/a
6 59 (26 – 77) n/a n/a n/a n/a
7 -157 (-579 – 2) n/a n/a n/a n/a
8 -23 (-175 – 45) 0 (-116 – 54) 100 †
9 54 (-3 – 80) 34 (-25 – 65) 100 (99 – 100.0)
10 93 (60 – 99) 74 (57 – 96) 96 (70 – 99)
11 75 (48 – 88) -14 (-120 – 41) 100 (99 – 100.0)
12 20 (-85 – 65) -23 (-193 – 49) 100 †
13 57 (-27 – 85) 93 (75 – 98) 98 (93 – 99)
14 55 (-73 – 88) n/a n/a n/a n/a
15 -26 (-174 – 43) n/a n/a n/a n/a
16 97 (87 – 99) 91 (79 – 96) 100 †
17 -23 (-110 – 28) n/a n/a n/a n/a
18 54 (-54 – 86) 78 (50 – 90) 100 †
19 -4 (-127 – 52) n/a n/a n/a n/a
20 47 (-105 – 86) 71 (-6 – 92.0) 100 †
21 67 (-11 – 90) 55 (-138 – 92) n/a n/a
22 70 (-35 – 93) n/a n/a n/a n/a
23 80 (58 – 91) 79 (53 – 91) 100 †
24 -6 (-183 – 60) 87 (13 – 98) n/a n/a
25 81 (-3 – 97) -366 (-2978 – 30) 100 †
26 -57 (-455 – 56) -21 (-357 – 68) 100 †
27 4 (-151 – 64) 28 (-89 – 72) 97 (76 – 100)
28 35 (0 – 58) 60 (34 – 76) 93 (52 – 99)
29 55 (0 – 80) 24 (-64 – 64) 100 †
Note: the minus sign "-" in front of a number indicates that the FEC increased after treatment.
CI=Confidence Intervals
n/a=Fenbendazole and levamisole were not tested due to insufficient numbers of animals.
†No 95% confidence intervals were computed since the reduction was 100%.

145
Table 4.2. The fecal egg count reduction, and percentage reductions (%) in Haemonchus sp., Teladorsagia spp., and Trichostrongylus spp., for
ivermectin (n=18 farms), fenbendazole (n=13 farms) and levamisole (n=11 farms) from post-treatment larval cultures from sheep farms
in Ontario (2011).
Fa
rm
Ivermectin Fenbendazole Levamisole
FECR %1
Percentage reduction in Percentage reduction in Percentage reduction in
Hae.2
sp.
Tel.3
sp.
Tri.4
spp. FECR %
1 Hae.2
sp.
Tel.3
sp.
Tri.4
spp. FECR %
1 Hae.2
sp.
Tel.3
sp.
Tri.4
spp.
12 20 26 100 100 -23 54 92 95 100 † † †
13 57 20 ‡ ‡
93 88 ‡ ‡
98 † † †
14 55 -24 ‡ ‡
n/a n/a n/a n/a n/a n/a n/a n/a
15 -26 -16 ‡ ‡
n/a n/a n/a n/a n/a n/a n/a n/a
16 97 † † †
91 71 ‡ ‡
100 † † †
17 -23 17 ‡ ‡
n/a n/a n/a n/a n/a n/a n/a n/a
18 54 55 83 100 78 -24 59 85 100 † † †
19 -4 11 100 63 n/a n/a n/a n/a n/a n/a n/a n/a
20 47 43 100 ‡
71 3 73 ‡
100 † † †
21 67 83 ‡ ‡
55 15 ‡ ‡
n/a n/a n/a n/a
22 70 60 ‡ ‡
n/a n/a n/a n/a n/a n/a n/a n/a
23 80 79 ‡ ‡
80 61 ‡ ‡
100 † † †
24 -6 38 ‡ ‡
87 89 ‡ ‡
n/a n/a n/a n/a
25 81 91 100 ‡
-366 -28 100 ‡
100 † † †
26 -57 80 ‡ ‡
-21 100 ‡ ‡
100 † † †
27 4 34 5
100 28 36 ‡
57 97 † †
28 35 -7 100 100 60 55 100 100 93 § § §
29 55 47 100 100 24 -12 100 100 100 † † †

146
n/a=Fenbendazole and levamisole were not tested on all farms due to insufficient numbers of animals. 1FECR=Fecal Egg Count Reduction;
2Hae=Haemonchus;
3Tel=Teladorsagia;
4Tri=Trichostrongylus;
†the genus specific fecal egg count reduction for these farms was not calculated since the fecal egg count reduction was ≥95%
‡the percentage reduction for these species was not calculated since there were <50epg in the pre-treatment samples
§the percentage reduction for this farm was not calculated since <50 larvae developed in the levamisole culture well
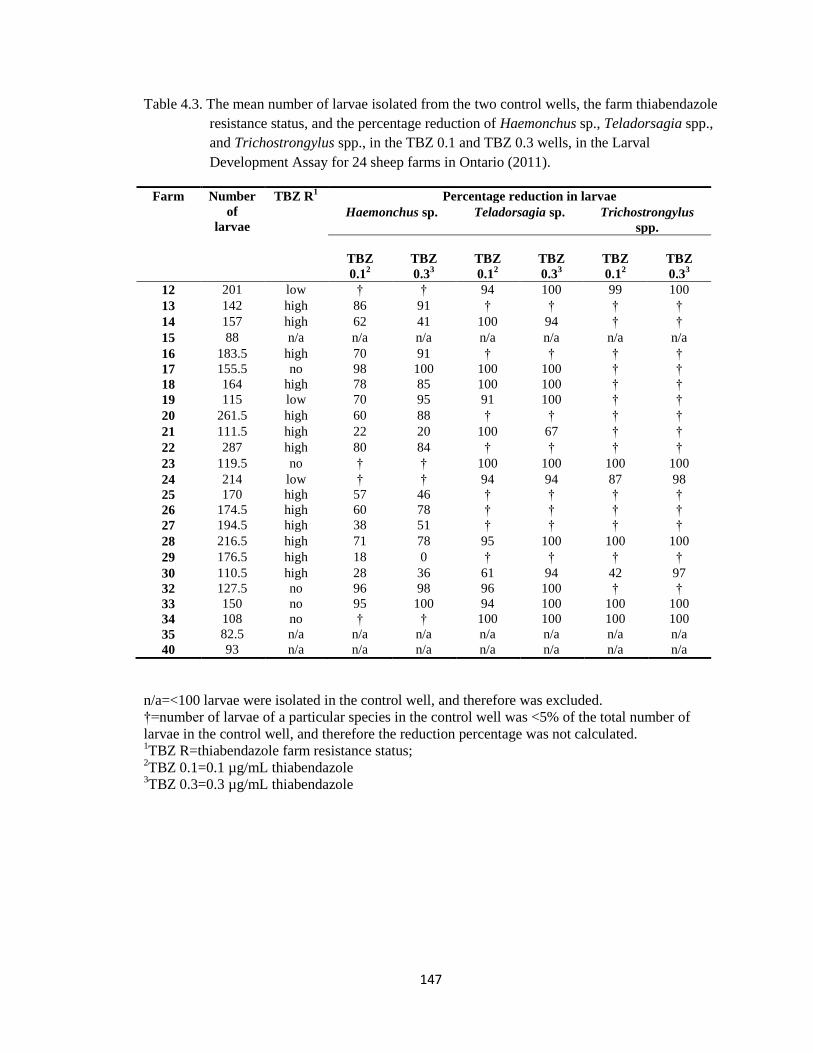
147
Table 4.3. The mean number of larvae isolated from the two control wells, the farm thiabendazole
resistance status, and the percentage reduction of Haemonchus sp., Teladorsagia spp.,
and Trichostrongylus spp., in the TBZ 0.1 and TBZ 0.3 wells, in the Larval
Development Assay for 24 sheep farms in Ontario (2011).
Farm Number
of
larvae
TBZ R1
Percentage reduction in larvae
Haemonchus sp. Teladorsagia sp. Trichostrongylus
spp.
TBZ
0.12
TBZ
0.33
TBZ
0.12
TBZ
0.33
TBZ
0.12
TBZ
0.33
12 201 low † † 94 100 99 100
13 142 high 86 91 † † † †
14 157 high 62 41 100 94 † †
15 88 n/a n/a n/a n/a n/a n/a n/a
16 183.5 high 70 91 † † † †
17 155.5 no 98 100 100 100 † †
18 164 high 78 85 100 100 † †
19 115 low 70 95 91 100 † †
20 261.5 high 60 88 † † † †
21 111.5 high 22 20 100 67 † †
22 287 high 80 84 † † † †
23 119.5 no † † 100 100 100 100
24 214 low † † 94 94 87 98
25 170 high 57 46 † † † †
26 174.5 high 60 78 † † † †
27 194.5 high 38 51 † † † †
28 216.5 high 71 78 95 100 100 100
29 176.5 high 18 0 † † † †
30 110.5 high 28 36 61 94 42 97
32 127.5 no 96 98 96 100 † †
33 150 no 95 100 94 100 100 100
34 108 no † † 100 100 100 100
35 82.5 n/a n/a n/a n/a n/a n/a n/a
40 93 n/a n/a n/a n/a n/a n/a n/a
n/a=<100 larvae were isolated in the control well, and therefore was excluded.
†=number of larvae of a particular species in the control well was <5% of the total number of
larvae in the control well, and therefore the reduction percentage was not calculated. 1TBZ R=thiabendazole farm resistance status;
2TBZ 0.1=0.1 µg/mL thiabendazole
3TBZ 0.3=0.3 µg/mL thiabendazole
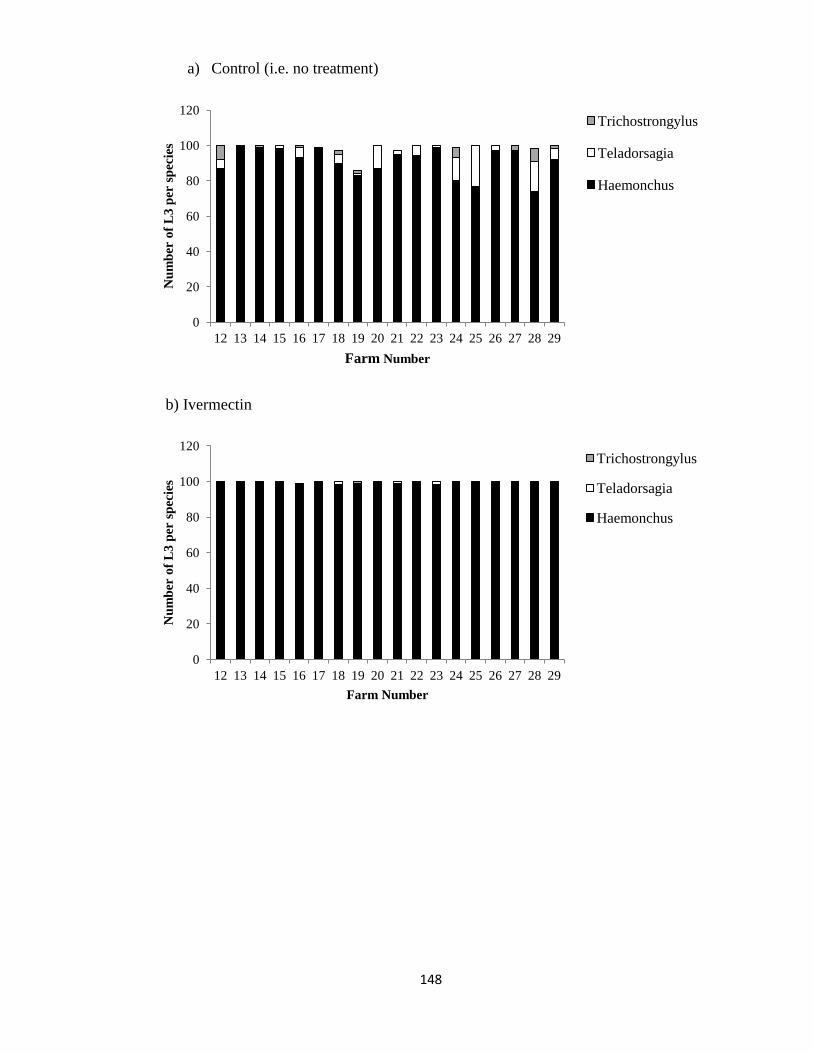
148
0
20
40
60
80
100
120
12 13 14 15 16 17 18 19 20 21 22 23 24 25 26 27 28 29
Nu
mb
er o
f L
3 p
er s
pec
ies
Farm Number
Trichostrongylus
Teladorsagia
Haemonchus
0
20
40
60
80
100
120
12 13 14 15 16 17 18 19 20 21 22 23 24 25 26 27 28 29
Nu
mb
er o
f L
3 p
er s
pec
ies
Farm Number
Trichostrongylus
Teladorsagia
Haemonchus
b) Ivermectin
a) Control (i.e. no treatment)
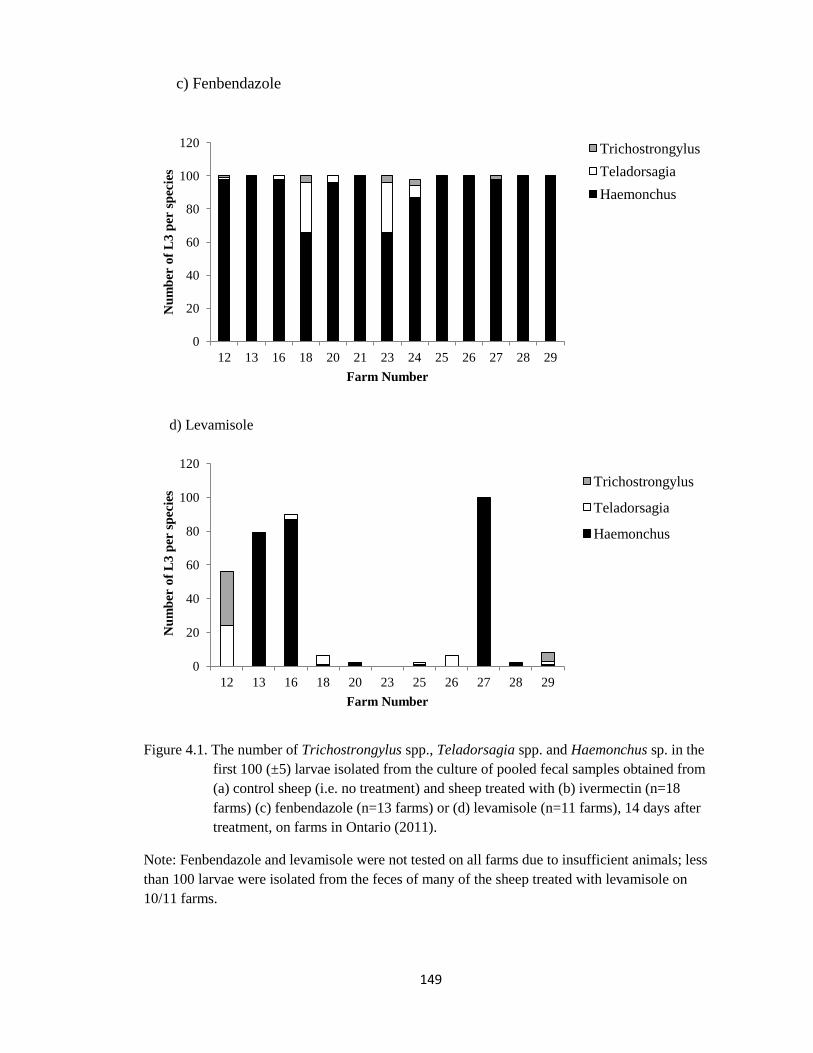
149
d) Levamisole
Figure 4.1. The number of Trichostrongylus spp., Teladorsagia spp. and Haemonchus sp. in the
first 100 (±5) larvae isolated from the culture of pooled fecal samples obtained from
(a) control sheep (i.e. no treatment) and sheep treated with (b) ivermectin (n=18
farms) (c) fenbendazole (n=13 farms) or (d) levamisole (n=11 farms), 14 days after
treatment, on farms in Ontario (2011).
Note: Fenbendazole and levamisole were not tested on all farms due to insufficient animals; less
than 100 larvae were isolated from the feces of many of the sheep treated with levamisole on
10/11 farms.
0
20
40
60
80
100
120
12 13 16 18 20 21 23 24 25 26 27 28 29
Nu
mb
er o
f L
3 p
er s
pec
ies
Farm Number
Trichostrongylus
Teladorsagia
Haemonchus
0
20
40
60
80
100
120
12 13 16 18 20 23 25 26 27 28 29
Nu
mb
er o
f L
3 p
er s
pec
ies
Farm Number
Trichostrongylus
Teladorsagia
Haemonchus
c) Fenbendazole
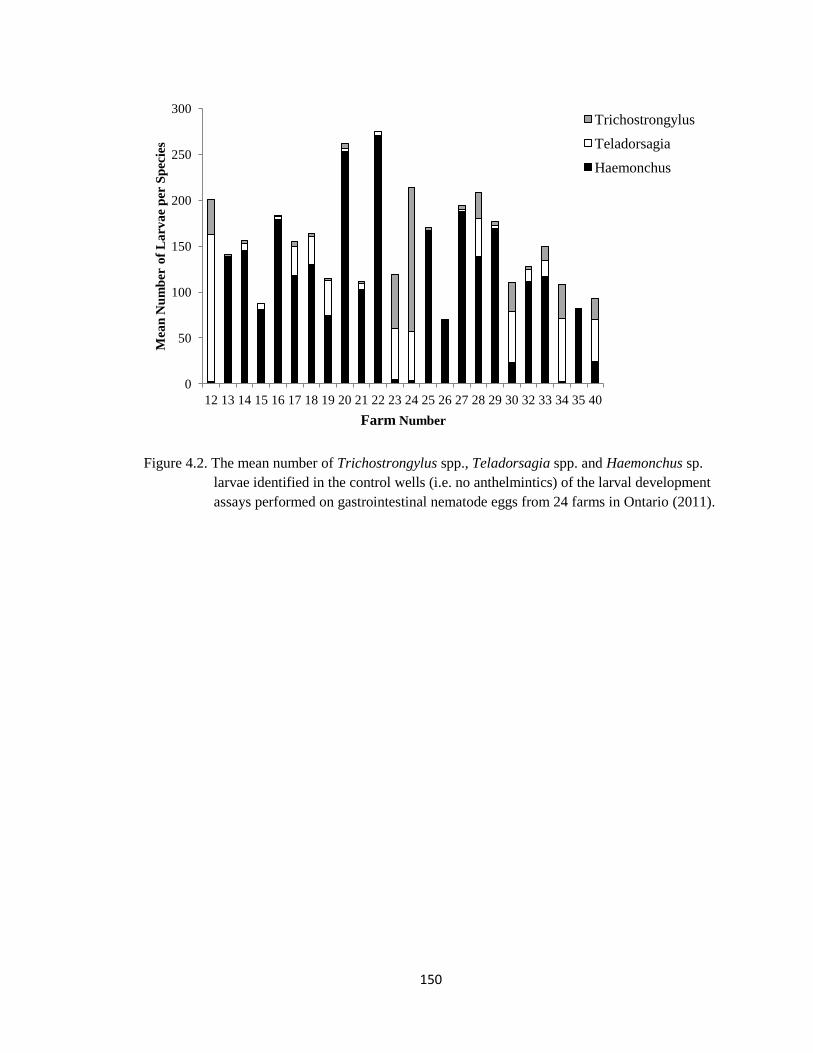
150
Figure 4.2. The mean number of Trichostrongylus spp., Teladorsagia spp. and Haemonchus sp.
larvae identified in the control wells (i.e. no anthelmintics) of the larval development
assays performed on gastrointestinal nematode eggs from 24 farms in Ontario (2011).
0
50
100
150
200
250
300
12 13 14 15 16 17 18 19 20 21 22 23 24 25 26 27 28 29 30 32 33 34 35 40
Mea
n N
um
ber
of
La
rva
e p
er S
pec
ies
Farm Number
Trichostrongylus
Teladorsagia
Haemonchus
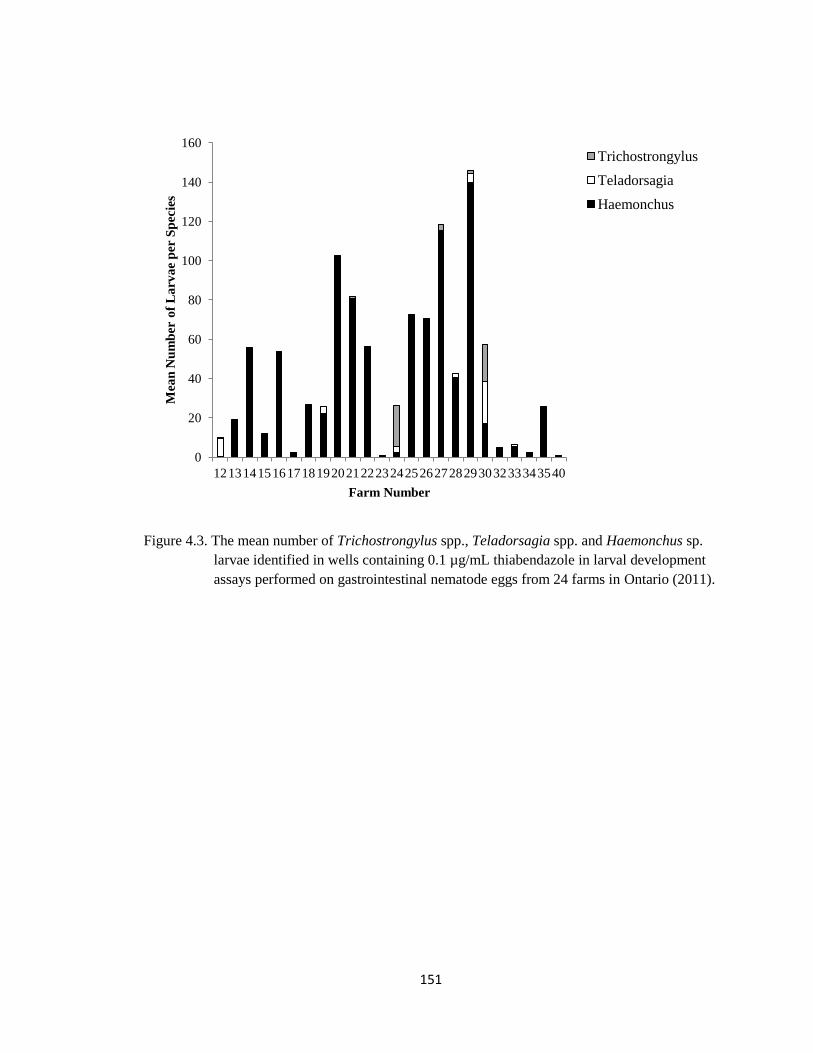
151
Figure 4.3. The mean number of Trichostrongylus spp., Teladorsagia spp. and Haemonchus sp.
larvae identified in wells containing 0.1 µg/mL thiabendazole in larval development
assays performed on gastrointestinal nematode eggs from 24 farms in Ontario (2011).
0
20
40
60
80
100
120
140
160
12 13 14 15 16 17 18 19 20 21 22 23 24 25 26 27 28 29 30 32 33 34 35 40
Mea
n N
um
ber
of
La
rva
e p
er S
pec
ies
Farm Number
Trichostrongylus
Teladorsagia
Haemonchus
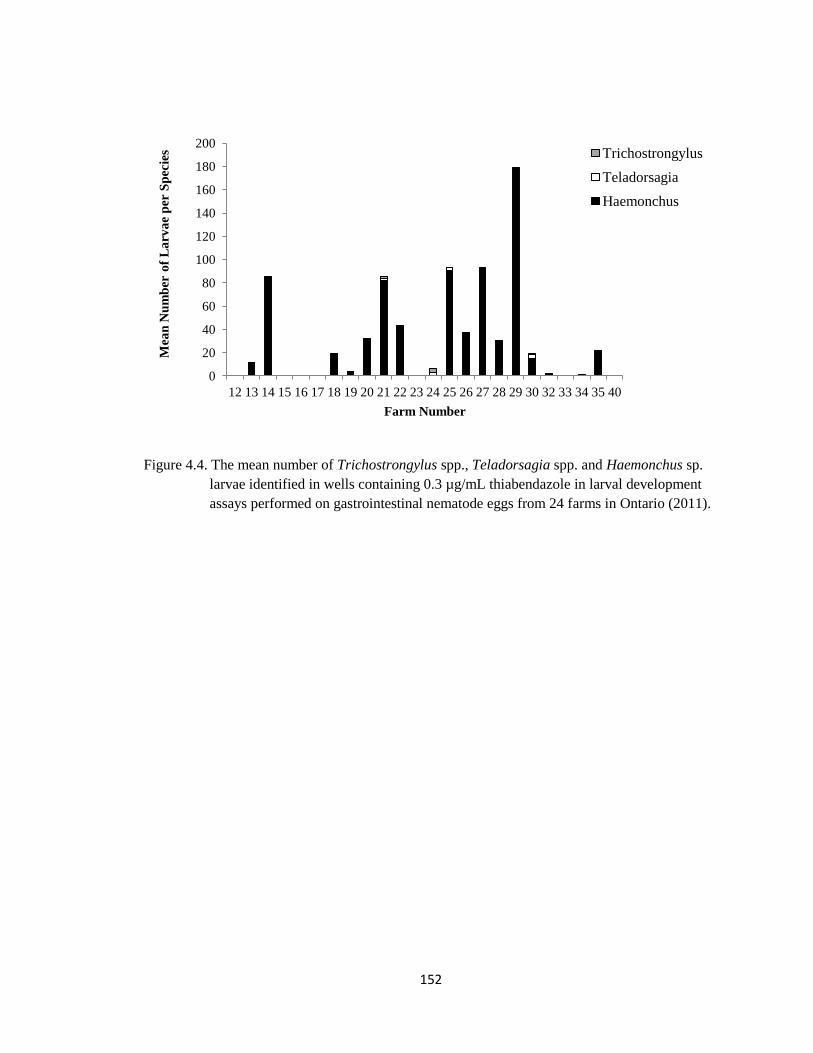
152
Figure 4.4. The mean number of Trichostrongylus spp., Teladorsagia spp. and Haemonchus sp.
larvae identified in wells containing 0.3 µg/mL thiabendazole in larval development
assays performed on gastrointestinal nematode eggs from 24 farms in Ontario (2011).
0
20
40
60
80
100
120
140
160
180
200
12 13 14 15 16 17 18 19 20 21 22 23 24 25 26 27 28 29 30 32 33 34 35 40
Mea
n N
um
ber
of
La
rva
e p
er S
pec
ies
Farm Number
Trichostrongylus
Teladorsagia
Haemonchus
153
CHAPTER 5
Comparison of tests and methods used for the determination of anthelmintic
resistance in sheep
Prepared for submission to Small Ruminant Research
Abstract
Anthelmintic resistance (AR) in parasites of sheep has been reported worldwide. The
Fecal Egg Count Reduction Test (FECRT) is the standard field test for diagnosing AR,
but there are different methods for calculating the Fecal Egg Count Reduction (FECR)
percentages. The Larval Development Assay (LDA) also tests for anthelmintic
susceptibility, yet few studies have been carried out to correlate results between the
FECRT and the LDA. This study was undertaken to: i) compare results obtained with
different FECR calculation methods for defining resistance to ivermectin, fenbendazole,
and levamisole; and ii) compare categorized results obtained with the FECRT and LDA
for resistance to benzimidazoles and levamisole. Four different methods were used to
calculate FECR percentages for the treatment groups: FECR1 and FECR2 used pre- and
post-treatment Fecal Egg Counts (FECs) from both treated and control animals; FECR1
used arithmetic means while FECR2 used geometric means. FECR3 was calculated using
arithmetic means for post-treatment FECs from treated and control animals, while FECR4
was calculated using mean FEC estimates from a General Linear Mixed Model. For all
treatment groups, FECR1 and FECR3 showed fair to almost perfect correlation, as did
FECR2 and FECR4, while the other FECR pair-wise combinations showed poor to fair
correlation. For the second objective, Kappa values between the LDA and the four

154
different FECR methods were computed; FECR values ≥95% were considered as
indicative of no resistance while five different threshold percentages (90%, 80%, 70%,
60% and 50%) were used to indicate low to high resistance. Results evaluating
benzimidazole resistance indicated a poor to moderate agreement; however, the Kappa
value was statistically significant when the percentage reduction was calculated using
FECR1 with an 80% threshold, and using FECR2 with a 70% threshold. In conclusion, the
classification of farm resistance status varied depending on whether arithmetic or
geometric means were used, especially when low levels of resistance were present. In
contrast, inclusion of both pre- and post-treatment, or only post-treatment, groups in the
FECR formula was less influential. The LDA and FECRT showed an overall poor to
moderate Kappa agreement in this study; however, the applicability of these tests
depends on the goal of the monitoring program and the levels of resistance present. Since
the classification of resistance varied with the method used, there is a need for consensus
standardization on classification of AR
5.1 Introduction
Gastro-intestinal nematodes (GINs) are of concern on sheep farms worldwide as
they impair milk, meat and wool production in sheep, and are an important cause of
morbidity and mortality (Knox et al., 2012). For many years, producers have relied
primarily on the use of anthelmintics for the control of GINs in sheep (Sargison, 2008).
However, this reliance has led to the development of anthelmintic resistance (AR), and
many countries are now reporting both multi-drug and multi-nematode species resistance
(Jackson and Coop, 2000; Kaplan, 2004; Kaplan and Vidyashankar, 2012).
155
In every parasite population, a number of genotypically resistant parasites are
typically present (Prichard et al., 1980). When these parasite populations reach a certain
frequency threshold, they become phenotypically resistant in animals (Kaplan and
Vidyashankar, 2012), and are associated with treatment failure and, inevitably, losses in
sheep health and productivity (Kaplan, 2004). It is therefore important to diagnose AR
before it reaches this ‘critical frequency’, where resistance becomes a clinical and
economic problem (Kaplan and Vidyashankar, 2012).
The Fecal Egg Count Reduction Test (FECRT) is the standard field test for the
diagnosis of AR in sheep (Coles et al., 2006). However, the results from a FECRT may
be influenced by several factors, including the study design, the host-parasite interaction
(Levecke et al., 2012), and the mathematical formulae used to calculate drug efficacy
(Miller et al., 2006). In the literature, there are several methods to calculate the Fecal Egg
Count Reduction (FECR); these methods differ based on whether the arithmetic or
geometric mean is used, and whether pre-and post-treatment Fecal Egg Counts (FECs), or
just post-treatment FECs, are used in the calculation (Cabaret and Berrag, 2004). Some
authors have suggested the use of arithmetic means as they are unbiased estimators of the
true mean (Fulford, 1994), and therefore provide better estimates of the parasite egg
output compared to geometric means (Coles et al., 1992; Dobson et al., 2009).
Meanwhile, other authors have described geometric means as more appropriate
estimators of the central tendency parameter for parasite populations which are usually
overdispersed and, therefore, do not have a constant variance (Smothers et al., 1999).
Further, while some FECR formulae take into account both pre- and post-treatment FECs
in both treated and control animals (Presidente, 1985; Dash et al., 1988), other variations
156
of the FECR calculation only take into consideration the post-treatment FECs of both
treated and untreated animals (Coles et al., 2006), thereby reducing the number of fecal
samples required. Lastly, Mejia et al. (2003) described an alternate approach for
calculating FECR, using a General Linear Mixed Model (GLMM) to provide FEC means
corrected for other co-variable effects, such as animal weight and treatment. While
McKenna (2006) reported that different FECR formulae provided similar estimates of
anthelmintic efficacy, Miller et al. (2006) found that different methods may generate
different FECR percentages, hence influencing the decision as to whether AR is present,
and whether an anthelmintic should be used on a farm (Torgerson et al., 2005). It is
therefore important to further assess the correlation between these different methods in
order to improve and standardize the method of FECR calculation and limit
misclassification of farm resistance status (Coles et al., 2006; Denwood et al., 2010).
Larval Development Assays (LDAs) are a laboratory-based test for the diagnosis
of AR that have been described as a suitable alternative to the FECRT since they are
rapid and comparatively inexpensive (Taylor et al., 2002). However, for a laboratory
technique to be widely applicable, it should provide results that correlate closely with
those obtained from a field test (Roush and Tabashnik, 1990). To date, studies that have
compared AR data obtained from laboratory and field tests either used different in vitro
techniques, such as an egg hatch assay (Maingi et al., 1998), a larval feeding inhibition
assay (Díez-Baños et al., 2008) or different LDA methodologies (Hubert and Kerboeuf,
1992); or were carried out in animal species other than sheep (Craven et al., 1999;
Königová et al., 2003). To determine the potential of the LDA methodology described by
Taylor (1990) for field screening in sheep in Canada, it is important to calculate the
157
agreement between the results obtained with the LDA and the different methods of
calculating the FECR, on sheep farms in Canada.
The objectives of this study were to: i) compare the FECR percentages obtained
using different formulae, for resistance to ivermectin, fenbendazole, and levamisole; and
ii) compare categorized results obtained with the FECRT and LDA for resistance to
benzimidazoles and levamisole.
5.2 Materials and methods
5.2.1 Farm selection, Fecal Egg Count Reduction Test and Larval Development Assay
Full details of the farm selection, FECRT and LDA have been described in Falzon
et al. (in press). In brief, 47 sheep flocks across Ontario, Canada, were enrolled over 2
years in a study to determine the frequency of AR in Ontario sheep flocks. A FECRT was
performed on those farms that reported ivermectin drench failure (defined as a FECR
<95% following ivermectin treatment by producers); a mean of 28 days (range = 21 to 35
days) elapsed between ivermectin treatment and the FECRT. The FECRT for ivermectin
(0.2 mg/kg), fenbendazole (5.0 mg/kg) and levamisole (10.5 mg/kg) was conducted on
29, 20 and 17 farms, respectively, over 2 years, and 10-15 animals were included in each
treatment group. Fenbendazole and levamisole were tested on fewer farms due to a
limited number of animals meeting the inclusion criteria on some farms. LDAs (Taylor,
1990) to detect the presence of resistance to thiabendazole and levamisole were
performed for 24 farms in the second year of the study (20 farms that were enrolled in the
second year and 4 farms from the first year that re-submitted fecal samples in the second
year), using two drug concentrations for each drug. The LDAs were carried out on
158
composite fecal samples when the mean FEC was >200 epg and before any treatment was
administered to the animals. All matching LDAs and FECRTs were conducted in the
second year of the study; however, LDAs were performed at the beginning of the grazing
season (June-July) while FECRTs were performed five to eight weeks later.
5.2.2 Fecal Egg Count Reduction calculations
FECR calculations were conducted using SAS® 9.3 (SAS Institute Inc., Cary,
NC, USA) as follows:
(i) FECR1 = 100 x (1- [T2/T1][C1/C2]), where T1 and T2 were pre- and post-
treatment arithmetic means of the GIN eggs per gram (epg) in treated groups,
respectively, and C1 and C2 were pre- and post-treatment arithmetic means of the epg in
the controls (i.e. untreated animals), respectively (Dash et al., 1988).
(ii) FECR2 = 100 x (1- [T2/T1][C1/C2]), where T1 and T2 were pre- and post-
treatment geometric means of the epg in treated groups, respectively, and C1 and C2
were pre- and post-treatment geometric means of the epg in the controls, respectively
(Presidente, 1985).
For both FECR1 and FECR2, the 95% Confidence Intervals (CIs) were estimated
as:
100 x [1 – exp (Log {[T2/T1][C1/C2]}) ± 1.96 x SE (Log{[T2/T1][C1/C2]})], where SE
was the standard error of the reduction, and was estimated as: (1/T1 + 1/T2 + 1/C1 +
1/C2)1/2
.
(iii) FECR3 = 100 x (1-[T2/C2]), where T2 and C2 were the post-treatment arithmetic
means of epg in the treated and control groups, respectively. Ninety-five percent CIs
159
were estimated as: 100 x [1- [T2/C2] exp( ± 1.96 √Y2)] , where Y
2 was the variance of
reduction (Coles et al., 1992).
(iv) FECR4 was calculated by building a GLMM, as described by Mejia et al. (2003).
The GLMM was fit using PROC MIXED (SAS 9.3®), with the natural logarithm of the
post-treatment FEC as the response variable. The dependence of the data was modeled by
a fixed effect for farm (to obtain a coefficient for each farm) and a random slope
parameter at the treatment level (due to different variances between treatment groups)
(Littell et al., 1996). While accounting for the treatment random effect, each fixed effect
variable was examined on its own to screen for variables to start the modeling process.
Variables screened included the natural logarithm of the pre-treatment FEC, animal
weight, farm, treatment (control, ivermectin, fenbendazole and levamisole) and year of
study (first and second). Due to the relatively small sample size, a liberal alpha value of
≤0.20 was used to indicate which terms to initially include in the model. The linearity of
continuous variables was assessed graphically by plotting lowess smoother curves and by
including a quadratic term in the model, as described by Dohoo et al. (2009).
A final GLMM was built using a manual backwards stepwise procedure, by first
including all variables that were significant in the univariable analyses. After the main
effects model was built, predictors of interest that were not significant in the univariable
analysis were forced into the model to assess potential confounding and conditional
effects. All possible two-way interactions between significant predictors were tested. The
model assumptions were assessed by plotting residuals against the predicted outcomes
and explanatory variables, to look for homoscedasticity, non-linearity and outliers.
Normality was visually assessed with histograms of the residuals and normal quantile
160
plots, and assessed statistically using four different tests offered by SAS (Shapiro-Wilk,
Kolmogorov-Smirnov, Cramer-von Mises and Anderson-Darling). Observations that
were identified as outliers or influential were cross-checked with the original data sheets
for any abnormality in the data to explain their behavior. The model was repeated without
those observations, and differences in model estimates were noted.
The predicted post-treatment FECs were back-transformed using the exponential
function (equivalent to geometric means), and the FEC means were then used to
calculate the FECR following the same method described for FECR3 (Coles et al., 1992).
For all FECR methods, farms were classified as resistant when the reduction was
<95% and the lower 95% CI was <90%; if only one of these two criteria was met, the
farm was classified as being suspected of resistance (Coles et al., 1992).
5.2.3 Comparison of data from Fecal Egg Count Reduction Calculation methods
The FECR percentages obtained with the different FECR methods were compared
by computing a Concordance Correlation Coefficient (CCC) using SAS® 9.3, as
described by Lin (1989). Bland-Altman plots were used to evaluate the distribution of the
observations, and outliers were cross-checked with the original data sheets for any
abnormality in the data that may have explained their influential behavior. The CCC was
re-computed without the influential observations, and changes in the CCC were noted.
The CCCs were interpreted using a scale described by Shoukri and Pause (1998), where
values equal to 0.0 or between 0.01-0.20, 0.21-0.40, 0.41-0.60, 0.61-0.80 and 0.81-1.00,
were considered indicative of poor, slight, fair, moderate, substantial and almost perfect
agreement, respectively.
161
5.2.4 Comparison of Larval Development Assay and Fecal Egg Count Reduction Test
results
The LDA was performed for thiabendazole and levamisole; LDAs and matching
FECRTs were only conducted in the second year of the study. To estimate the Kappa
agreement between the LDA and FECRT, results from both tests were first categorized
into ordinal variables (0=no resistance; 1=low resistance; 2=high resistance) using the
following rubric, and the results entered into 3X3 frequency tables.
The LDA results for thiabendazole and levamisole were categorized as having:
“no resistance” if ≤5% of the GIN eggs (compared to the control well) developed in the
0.1 µg/mL thiabendazole well or 1.0 µg/mL levamisole well; “low resistance” if >5% of
the GIN eggs (compared to the control well) developed in the 0.1 µg/mL thiabendazole
well or 1.0 µg/mL levamisole well and ≤5% of the GIN eggs (compared to the control
well) developed in the 0.3 µg/mL thiabendazole well or 3.0 µg/mL levamisole well; and
“high resistance” if >5% of the GIN eggs (compared to the control well) developed in the
0.3 µg/mL thiabendazole well or 3.0 µg/mL levamisole well (Taylor, 1990). The
discriminatory concentrations of 0.1 µg/mL thiabendazole and 1.0 µg/mL levamisole
were used as described by Hong et al. (1992, 1996). The 5% cut-off was selected to be
consistent with the definition of resistance used for the FECRT, whereby resistance is
said to be present if the FEC following treatment is >5% compared to the FEC in the
control or pre-treatment group (Coles et al., 1992).
Since no references for thresholds of high or low levels of resistance based on the
FECRT could be found in the literature, the FECR percentages obtained with the four
162
different calculation methods discussed previously (FECR1-4) were categorized using five
different threshold levels:
i) No resistance present when the FECR was ≥95%; low resistance present when
the reduction was <95% and ≥90%; and high resistance when the reduction
was <90%;
ii) No resistance present when the FECR was ≥95%; low resistance present when
the reduction was <95% and ≥80%; and high resistance when the reduction
was <80%;
iii) No resistance present when the FECR was ≥95%; low resistance present when
the reduction was <95% and ≥70%; and high resistance when the reduction
was <70%;
iv) No resistance present when the FECR was ≥95%; low resistance present when
the reduction was <95% and ≥60%; and high resistance when the reduction
was <60%; and,
v) No resistance present when the FECR was ≥95%; low resistance present when
the reduction was <95% and ≥50%; and high resistance when the reduction
was <50%.
Therefore, by way of example using a threshold of 70%, farms with a FECR >95 %
were classified as susceptible, farms with a FECR between 70 to 95% were classified
as having low resistance, and farms with a FECR <70% were classified as having
high resistance.
163
A weighted Kappa using squared values (Fleiss and Cohen, 1973) was calculated
using an in-house Fortran program (Stat-Menu) that was developed based on subject
matter covered in Fleiss et al. (2003) and Agresti (2002). The weighted Kappa better
accounts for partial agreement between tests, compared to the non-weighted Kappa (e.g.
“no resistance” is in closer agreement with “low resistance” than with “high resistance”)
(Dohoo et al., 2009). The squared approach was used since this puts more weight on the
observations that are more discrepant, and is therefore more consistent with the notion of
intra-class correlation. A McNemar-Bowker test (Agresti, 2002) was also calculated to
determine if the distribution of discordant cells was equal.
Since the LDA and FECRT were conducted at different times during the grazing
season (Falzon et al., in press), the proportion of Haemonchus sp., Teladorsagia sp., and
Trichostrongylus spp. present at each time-point was calculated to assess whether the
parasite population on each farm changed during the grazing season, and to facilitate
interpretation of the Kappa agreement results. This was carried out using information on
parasite species obtained from the LDA, and from the FECRT post-treatment larval
cultures (Falzon et al., in press).
5.3 Results
5.3.1 Descriptive results of different FECR calculation methods
Ivermectin, fenbendazole and levamisole FECR percentages and 95% CIs were
calculated using the four different FECR methods (Tables 5.1, 5.2 and 5.3, respectively).
The percentage of farms classified as resistant varied, depending on the FECR calculation
method and anthelmintic used. The FECR4 reduction could not be calculated for farms 9
164
and 28 since no animal weight data were available for the control animals and the weight
variable was required in the GLMM estimate for FECR4. The final model of the natural
logarithm of post-treatment FECs (Table 5.4) met the assumptions of both
homoscedasticity and normality; however, residual analyses revealed two major outliers.
The model was rerun without these observations, but this did not change the final fit of
the model, and there was no reason to omit the observations; hence, the outliers were
retained in the final model.
Ivermectin resistance was reported on: 28/29 (97%) farms when the FECR1 and
FECR2 methods were used; on 28/29 (97%) farms, with an additional farm suspected of
resistance, when the FECR3 method was used; and on 25/27 (93%) farms, with 2
additional farms suspected of resistance, when the FECR4 method was used (Table 5.1).
Fenbendazole resistance was reported: on 20/20 (100%) farms when the FECR1 and
FECR2 calculations were used; on 19/20 (95%) farms, with one additional farm suspected
of resistance, when the FECR3 calculation was used; and on 17/18 (94%) farms, with 1
additional farm suspected of resistance, when the FECR4 method was used (Table 5.2).
Levamisole resistance was reported: on 0/17 (0%) farms, with 1 farm suspected of
resistance, when the FECR1 calculation was used; on 4/17 (24%) farms, with an
additional 3 farms suspected of resistance, when the FECR2 calculation was used; on 1/17
(6%) farms, with 1 additional farm suspected of resistance, when the FECR3 calculation
was used; and on 3/15 (20%) farms when the FECR4 method was used (Table 5.3). Farms
10, 25 and 26 had the lowest estimates of levamisole reduction for both FECR2 and
FECR4.
165
5.3.2 Comparison of different FECR calculation methods
The CCCs and level of correlation between the four FECR calculation methods for
the ivermectin, fenbendazole and levamisole treatment groups are shown in Table 5.5.
The level of correlation varied depending on which FECR methods were compared, and
which treatment group was being assessed. Overall, FECR1 and FECR3, and FECR2 and
FECR4, showed better correlation, compared to the other pair-wise combinations.
In all treatment groups, farms 1, 3 and 7 were identified as influential observations.
On these three farms, the animals were divided into the treatment groups by the
producers, prior to the researchers’ arrival on the farm; it was suspected that the group
allocation was based on the animals’ age, where older and younger animals were put in
separate groups. These three farms were removed from the dataset since this non-
randomization is likely to have influenced the results obtained for these three farms
(Dohoo et al., 2009). In both the fenbendazole and levamisole treatment groups, farm 25
was identified as an influential observation and its removal improved the CCC between
all FECR pair combinations (e.g. for the fenbendazole treatment group, the correlation
between FECR1 and FECR3 increased from 0.35 to 0.77 when farm 25 was removed);
however, no data errors or other issues were identified that justified its removal, and
therefore it was retained in the dataset.
166
5.3.3 Comparison of the Larval Development Assay and Fecal Egg Count Reduction Test
results
5.3.3.1. Categorization of the LDA and FECRT results
LDAs for thiabendazole and levamisole were performed for 24 farms; however,
matching FECRT data were available for only 13 and 11 of these farms, for fenbendazole
and levamisole respectively, as there were insufficient numbers of animals available on
some farms. Of the 13 farms with matching benzimidazole results, 1 farm was classified
by the LDA as having no resistance to thiabendazole (i.e. ≤5% GIN eggs in 0.1 µg/mL
thiabendazole well), 2 farms were classified as having low resistance (i.e. >5% and ≤5%
GIN eggs in 0.1 and 0.3 µg/mL thiabendazole wells, respectively) and 10 farms were
classified as having high resistance (i.e. >5% GIN eggs in 1.0 µg/mL thiabendazole well).
Of the 11 farms with matching FECRT and LDA results for levamisole, all farms were
classified as having no resistance (i.e. ≤ 5% GIN eggs in 1.0 µg/mL levamisole well).
Regardless of the FECR calculation method used, none of the farms tested for
fenbendazole resistance with the FECRT were classified as having “no resistance
present” (i.e. all farms had FECR <95%) (Table 5.6). When 90% and 80% cut-offs were
used as thresholds to differentiate between high and low resistance, the majority of the
farms were classified as having high resistance; when 70%, 60% and 50% were used as
cut-offs, the number of farms categorized as having low resistance increased. When the
50% threshold was used, all farms were classified similarly among the FECR calculation
methods used.
167
The levamisole FECR percentages were classified similarly across the five
thresholds used to differentiate between high and low resistance, when calculated using
FECR1 and FECR3 (Table 5.7). With the FECR2 and FECR4 methods, the classification of
farms as having high or low resistance changed when higher (90%, 80% and 70%) or
lower (60% and 50%) thresholds were used.
5.3.3.2 Kappa agreement
Kappa agreement analyses were carried out on the ordinal results (i.e. no, low or
high resistance) from both LDA and the four FECR calculation methods, for both
benzimidazoles and levamisole. For the benzimidazole results, the agreement (beyond
chance alone) between the two tests was highest when the 80% and 70% thresholds were
used, especially for FECR1 and FECR2 (Table 5.8). In particular, the agreement between
the LDA and the FECR1 method using an 80% threshold, and with the FECR2 method
using a 70% threshold, was statistically significant (p≤0.05), indicating that these two
thresholds could be used to differentiate between high and low levels of resistance. The
results of the McNemar-Bowker test of symmetry were only statistically significant for
the FECR1 and FECR2 methods at the 50% threshold. At all the other thresholds, the
McNemar-Bowker test of symmetry was not statistically significant, indicating that the
marginal cells (and therefore false-positives and false-negatives) were equally distributed
between the two tests. This suggests that the FECRT and LDA had similar test
sensitivities, and were therefore able to detect the same number of positive cases.
168
For the levamisole results, the weighted Kappa was zero between the LDA and
the four FECR methods, at all the different threshold percentages. The McNemar-Bowker
test was not statistically significant for any of the tests.
Table 5.9 presents the percentages of Haemonchus sp., Teladorsagia sp., and
Trichostrongylus spp. isolated from the control wells of the LDA and from larval cultures
of pooled fecal samples collected from the control animals on the second visit for the
FECRT. Haemonchus sp. was the most common species on 10/13 (77%) farms at the
time the LDA was performed, and on 13/13 (100%) farms at the time the larval culture
was performed.
5.4 Discussion
5.4.1 Different Fecal Egg Count Reduction calculation methods
In the work described here, for both the ivermectin and fenbendazole treatment
groups, almost all farms (28/29 [97%] and 19/20 [95%], respectively) were classified as
having AR, regardless of the FECR calculation used. For fenbendazole, farm 1 had very
different reduction percentages, depending on which FECR method was used. This may
be due to the non-random allocation of older and younger animals into separate treatment
groups which was associated with a large number of zero pre-treatment FECs in the
fenbendazole treatment group, despite a mean FEC>200epg for the group. This, in turn,
may be responsible for the discrepancy between FECR1 and FECR2 that included pre-
treatment FECs, and FECR3 and FECR4 that did not include pre-treatment FECs.
The levamisole reduction percentages obtained with the different FECR
calculations showed greater heterogeneity (Table 5.3), compared to the other two
169
treatment groups. Farms 10, 25 and 26 had the lowest estimates for drug efficacy,
indicating greater levels of AR, with both the FECR2 and FECR4 methods. The
heterogeneity in FECR percentages observed for the levamisole treatment group could be
explained by over-dispersion of the parasite population within the sheep, as suggested by
Levecke et al. (2012). On farm 10, 12/15 of the animals treated with levamisole had post-
treatment FECs of 0 epg, while the other three animals had post-treatment FECs of 100
epg. However, this farm was classified as having resistance to levamisole when using
FECR2 and FECR4 methods. Work carried out by Dobson et al. (2009) showed that
geometric means are subject to increased variability, and become highly unstable, when
there is a high level of aggregation and most of the animals sampled have fecal egg
counts of 0. This might explain for farm 10 why these methods, which used geometric
means, provided lower estimates, compared to the other FECR methods using arithmetic
means. On farms 25 and 26, ewe lambs in their first grazing season were used in addition
to lambs, for the FECRT, since the lambs were kept indoors as young lambs due to
predator concerns; these animals were heavier (50-80kg) than the lambs (10-45kg). Since
the FECR4 method also took into account the animals’ weight, this might have influenced
the overall estimate provided by the GLMM. As indicated in Table 5.4, weight was
negatively correlated with the percentage reduction; lower FECR percentages were
estimated for the heavier animals. Weight was included in the model since it was
considered a potential confounder based on anecdotal evidence. Although in our study all
animals were weighed individually prior to treatment to remove the risk of under-dosing,
it has been hypothesized that heavier animals may carry more resistant parasites as they
170
are more likely to be under-dosed, which in turn may accelerate the development of
resistance (Sutherland and Scott, 2010).
Overall, the FECR results obtained for the three different treatment groups are in
agreement with Miller et al. (2006), who suggested that the FECRT is effective at
diagnosing resistance when AR is present at high levels, but is less reliable when the drug
efficacy ranges around 90 - 95%. This was particularly evident when geometric means
were used, and many FECs of 0 epg were present, leading to biased estimates of overall
treatment efficacy (Dobson et al., 2009). In contrast, inclusion of both pre- and post-
treatment or only post-treatment data was less influential on the FECR percentage,
regardless of the levels of resistance. These results are in agreement with a similar study
by McKenna (2006), which reported that different FECR formulae (using only arithmetic
means) detected a similar number of anthelmintic resistance cases, and therefore
suggested that the simpler formulae (i.e. those using only post-treatment FECs) could be
a suitable alternative to the more complex formulae where both pre- and post-treatment
FECs are required. This would reduce the number of fecal samples required, thereby
reducing the labour and costs associated with the FECRT and making it more accessible
to sheep producers.
5.4.2 Comparison of different Fecal Egg Count Reduction Calculation methods
The concordance correlation coefficient “evaluates the degree to which pairs [of
observations] fall on the 45° line” in a scatterplot (Lin, 1989), and was used to measure
the correlation between the different FECR methods. For all treatment groups, FECR1
and FECR3, as well as FECR2 and FECR4, showed a fair to almost perfect agreement,
171
while the other FECR pairs showed a slight to moderate correlation. This was particularly
evident for the levamisole treatment group, where both FECR1 and FECR3, and FECR2
and FECR4 were almost perfectly correlated (0.96 and 0.93, respectively).
These results suggest that the type of mean (arithmetic vs. geometric) used in the
FECR formulae was more influential than which data (pre- and post-treatment vs. only
post-treatment) were taken into account; the differences between formulae were most
marked when low levels of resistance were present (i.e. to levamisole), resulting in a
large number of post-treatment FECs that were zero. These results are in agreement with
the previous discussion, whereby the right-skewness of the post-treatment results
increases the variability of the estimates, making the reduction percentages more unstable
(Levecke et al., 2011; Dobson et al., 2012), especially when geometric means are used
and the level of resistance is low.
For the fenbendazole treatment group, the differences between the FECR pair-
wise correlations were less distinct. As noted in Section 5.3.2, farm 25 was identified as
an influential observation, and its removal from the dataset improved the correlation
between the different FECR pair-wise combinations. As mentioned earlier, on farm 25
ewe lambs in their first grazing season were used for the FECRT; many of these animals
had zero pre-treatment FECs (8/15 animals in the fenbendazole treatment group),
resulting in a right-skewed distribution of the GIN egg counts within the group of
animals.
172
5.4.3 Comparison of the Larval Development Assay and Fecal Egg Count Reduction Test
To check for the agreement between the FECRT and the LDA used in this study,
a weighted Kappa agreement was calculated. Kappa is defined as “the proportion of
agreement corrected for chance, and scaled to vary from -1 to +1 so that a negative value
indicates poorer than chance agreement, 0 indicates exactly chance agreement, and a
positive value indicates better than chance agreement” (Fleiss and Cohen, 1973).
To estimate the weighted Kappa, the LDA results and the FECR values were
categorized into three ordinal categories: no resistance, low resistance and high resistance
to benzimidazoles and levamisole. Since we could not find any reference in the literature
for FECR threshold percentages indicative of the critical frequency at which resistance
starts to have an economic and clinical impact, we examined five different threshold
percentages to evaluate how these affect the level of agreement between the FECRT and
LDA. While the FECRT threshold percentage for no resistance was kept constant (i.e.
reduction value >95%), five threshold percentages were used to distinguish between low
and high levels of resistance (see Section 5.2.4 for definitions).
Overall, there was a poor to moderate agreement beyond chance, between the
FECRT and LDA for benzimidazoles (Table 5.8). However, the agreement was
statistically significant when the FECR1 method and an 80% threshold were used, and
when the FECR2 and a 70% threshold were used (Weighted Kappa = 0.58 and 0.48,
respectively). This occurred because, at these thresholds, there were fewer observations
in the perfectly discordant cells, and most observations were in either perfect or partial,
agreement. These results suggest that 80% or 70% might be appropriate thresholds to
173
differentiate FECR percentages as indicative of high or low levels of resistance. For
levamisole, despite most of the farms being classified as having no resistance by both
tests, there was no agreement between the LDA and FECRT results.
The poor agreement between methods observed in our study could be explained
by the small sample size (n=13 and 11 for benzimidazoles and levamisole, respectively),
and the fact that some of the concordant cells in the contingency tables were empty,
either because of the high frequency of benzimidazole resistance (i.e. there were no cases
of susceptibility classified by the FECRT) or the low frequency of levamisole resistance
(i.e. there were no cases of resistance classified by the FECRT). Other authors (Craven et
al., 1999; Wolstenholme et al., 2004) have also described a poor correlation between in
vivo and in vitro tests for AR, and suggested that this may be due to the fact that the two
types of tests measure different attributes of the parasites’ response to anthelmintics.
LDAs measure the effect of anthelmintics on the growth of first stage larvae, whereas the
FECRT reflects the anthelmintics’ efficacy against adult parasites (Taylor, 1990). Further
research investigating the agreement between the two tests, using populations with higher
resistance to levamisole and lower resistance to fenbendazole, is warranted.
With respect to limitations, the results from this study need to be interpreted with
caution, since the LDA and the FECRT were not conducted simultaneously (Falzon et al.,
in press). The LDAs were conducted earlier in the grazing season, when the FECs of the
fecal samples submitted by producers reached a mean threshold of ≥200epg, while the
FECRT and larval cultures were conducted approximately 5 to 8 weeks later in the
season, after the animals had been treated with ivermectin and diagnosed with drench
failure. Therefore, the parasite populations, both in terms of species and number, and
174
possibly the resistance level, may have changed over time. However, on most farms, the
parasite populations were similar (Table 5.9), with Haemonchus sp. being the
predominant species at both times. Exceptions included farms 12, 23 and 24, where the
percentage of Haemonchus sp. present on the farm changed over time. Interestingly, both
farms 12 and 23 had a lower percentage of Haemonchus sp. present at the time of the
LDA, and were classified as having “no” or “low resistance” to thiabendazole by the
LDA, whereas in the larval culture post-FECRT, the proportion of Haemonchus sp. was
considerably higher, and the FECR percentages for fenbendazole reduction were
indicative of high levels of resistance. A field study conducted by Falzon et al. (in press)
indicated that most of the ivermectin and fenbendazole resistance detected on the same
farms was associated with Haemonchus sp. Therefore, an increase in the Haemonchus sp.
population, relative to other species, as has been reported in Ontario during the grazing
season (Mederos et al., 2010), might be associated with more detectable levels of AR on
farms when resistant strains of Haemonchus sp. are present. Farm 24, in contrast, was
classified as having low levels of resistance to benzimidazoles by both tests, despite
having a similar observed increase in Haemonchus sp. between the two sampling points.
This might have occurred because the Haemonchus sp. present on this farm were more
susceptible, compared to other farms, and therefore did not influence the farm’s
resistance status.
The McNemar-Bowker’s test of marginal homogeneity for almost all FECR
calculation methods, at the different threshold percentages, was not statistically
significant, indicating that the false-positive and false-negative results were equally
distributed for both the FECRT and LDA. This result was not expected since the FECRT
175
is described as a less sensitive test for detecting AR, compared to the LDA (Martin et al.,
1989), and should therefore have more false-negative results compared to the LDA.
However, this result might be explained by the fact that the FECRT was conducted at a
later time in the grazing season, when apparent resistance levels may have increased as a
result of an overall increase in the proportion of Haemonchus sp. due to the warmer
weather conditions (Mederos et al., 2010). The McNemar-Bowker test was only
statistically significant when FECR1 and FECR2, and the 50% threshold, were used; in
these cases, more farms were classified as having high resistance with the LDA,
compared to the FECRT, indicating that the LDA was a more sensitive test when lower
threshold percentages for FECR were used.
Although the LDA and FECRT showed a poor to moderate agreement, the use of
both tests within a monitoring program could still be useful, as the tests measure different
parasite attributes and, as such, can be used at different stages of the monitoring program
(Roush and Tabashnik, 1990). The LDA is a more sensitive test as it can detect resistance
when 10% of the parasite population are phenotypically resistant, compared to 25% of
the parasite population for the FECRT (Papadopoulos, 2008). LDAs also provide results
more quickly and at less cost (Howell et al., 2008), and can therefore be used to provide
early warning signs of impending resistance problems on sheep farms. In contrast, the
FECRT reflects the phenotypic expression of resistance (Sangster and Gill, 1999), and
can therefore be carried out at a later stage in a parasite control program, to monitor
changes in the severity of the resistance situation.
176
5.4.4 Overall study strengths and limitations, and future research
This study had several strengths: FECRT and matching LDA data obtained during
the same grazing season were available for 13 and 11 farms for fenbendazole and
levamisole, respectively, allowing us to make direct comparisons between the two tests.
Moreover, we explored the use of several different FECR formulae, using both arithmetic
and geometric means, to analyse real farm data. We also explored the use of different
threshold percentages to distinguish between low and high levels of resistance with the
FECRT, and found 80% and 70% to be potentially suitable thresholds. However, research
is needed to investigate at which level resistance has an economic impact on sheep
productivity and profitability.
One of the limitations in our study is the accuracy of the diagnostic test used for
detection of FECs. The McMaster technique used in this study has a minimum detection
limit of 50 epg; this limited sensitivity may fail to detect low FECs, introducing a
misclassification bias and making the FECR calculation less reliable (El-Abdellati et al.,
2010). A way to avert this problem is to use more sensitive tests, such as FECPAK
(detection limit = 10 epg) or the FLOTAC technique (detection limit = 1-2 epg) (El-
Abdellati et al., 2010). The accuracy of the diagnostic test could also be improved by
increasing the test precision, either taking measurements in triplicate (Kaplan and
Vidyashankar, 2012), or using alternative analytical methods. Denwood et al. (2010)
recommended the use of Monte Carlo Markov Chain simulations to calculate the FECR,
as these provide confidence intervals with better defined properties and more precise
estimates for the true FECR. However, all these techniques are either more labour
intensive, or require additional training or apparatus, which might hinder their
177
widespread uptake and application. Research is therefore required to determine an
appropriate trade-off between improved sensitivity of diagnostic and analytical methods,
and the willingness and ability of veterinarians and producers to use these tests.
5.5 Conclusion
The different FECR methods evaluated in this study did not provide consistent
FECR percentages following treatment with ivermectin, fenbendazole or levamisole. The
correlation between the methods was influenced by which means were used in the FECR
formulae, especially when low levels of resistance were present, resulting in a right-
skewness of the parasite data. This suggests that arithmetic means should be used as they
do not require any correction factors and are less prone to bias, especially when data is
right-skewed. In contrast, whether both pre- and post- treatment or only post-treatment
sample data were used in the FECR formulae was less influential. Therefore, the simpler
formula could be used, reducing the cost and labour associated with the FECRT. While
both the FECRT and LDA were able to diagnose AR, the agreement, overall, for
benzimidazole resistance between the two tests was slight to moderate. However, the
agreement improved when 80% or 70% were used as threshold percentages in the
FECRT for defining resistance, indicating that these percentages might be useful cut-offs
to differentiate between high and low levels of resistance. While there was no agreement
between the LDA and FECRT for levamisole resistance results, these findings need to be
interpreted cautiously given the low levels of levamisole resistance present on the farms
investigated. Moreover, since the LDA and FECRT measure different parasite properties,
the applicability of these tests depends on both the primary objective of the monitoring
program, and the expected levels of resistance present on the farm. In conclusion,
178
different methods of calculating FECR and use of different diagnostic tests may lead to
different classifications of a farm’s resistance status. Thus, there is a need for consensus
on the method(s) used to define anthelmintic resistance, to provide more uniform results
to producers and to allow for standardised comparisons between different studies.
5.6 Acknowledgements
This research was supported by the Ontario Ministry of Agriculture, Food and
Rural Affairs - University of Guelph agreement through the Animal Health Strategic
Investment fund, with additional in-kind assistance from Merial. The authors are very
grateful to William Sears for statistical advice. We especially acknowledge the sheep
producers that participated in the study.
179
5.7 References
Agresti, A., 2002. Categorical Data Analysis (ISBN: 0-471-36093-7). 2nd
Ed. John Wiley
& Sons Ltd., The Atrium, Southern Gate, Chichester, West Sussex, PO19 8SQ,
United Kingdom.710 pages.
Cabaret, J., Berrag, B., 2004. Fecal egg count reduction test for assessing anthelmintic
efficacy: average versus individually based estimations. Vet. Parasitol. 121, 105-
113.
Coles, G.C., Bauer, C., Borgsteede, F.H.M., Geerts, S., Klei, T.R., Taylor, M.A., Waller,
P.J., 1992. World Association for the Advancement of Veterinary Parasitology
(W.A.A.V.P.) methods for the detection of anthelmintic resistance in nematodes of
veterinary importance. Vet. Parasitol. 44, 35-44.
Coles, G.C., Jackson, F., Pomroy, W.E., Prichard, R.K., von Samson-Himmelstjerna, G.,
Silvestre, A., Taylor, M.A., Vercruysse, J., 2006. The detection of anthelmintic
resistance in nematodes of veterinary importance. Vet. Parasitol. 136, 167-185.
Craven, J., Bjorn, H., Barnes, E.H., Henriksen, S.A., Nansen, P., 1999. A comparison of
in vitro tests and a faecal egg count reduction test in detecting anthelmintic
resistance in horse strongyles. Vet. Parasitol. 85, 49-59.
Dash, K., Hall, K., Barger, I.A., 1988. The role of arithmetic and geometric worm egg
counts in faecal egg count reduction tests and in monitoring strategic drenching
programs in sheep. Aust. Vet. J. 65, 66-68.
Denwood, M., Reid, S.W.J., Love, S., Nielsen, M.K., Matthews, L., McKendrick, I.J.,
Innocent, G.T., 2010. Comparison of three alternative methods for analysis of
equine Faecal Egg Count Reduction Test data. Prev. Vet. Med. 93, 316-323.
Díez-Baños, P., Pedreira, J., Sánchez-Andrade, R., Francisco, I., Suárez, J.L., Díaz, P.,
Panadero, R., Arias, M., Painceira, A., Paz-Silva, A., Morrondo, P., 2008. Field
evaluation for anthelmintic-resistance ovine gastrointestinal nematodes by in vitro
and in vivo assays. J. Parasitol. 94, 925-928.
Dobson, R.J., Sangster, N.C., Besier, R.B., Woodgate, R.G., 2009. Geometric means
provide a biased efficacy result when conducting a faecal egg count reduction test
(FECRT). Vet. Parasitol. 161, 162-167.
Dobson, R.J., Hosking, B.C., Jacobson, C.L., Cotter, J.L., Besier, R.B., Stein, P.A., Reid,
S.A., 2012. Preserving new anthelmintics: A simple method for estimating faecal
egg count reduction test (FECRT) confidence limits when efficacy and/or nematode
aggregation is high. Vet. Parasitol. 186, 79-92.
Dohoo, I., Martin, W., Stryhn, H., 2009. Veterinary Epidemiologic Research – Model-
Building Strategies (ISBN: 978-0-919013-60-5). 2nd Ed. VER Inc., Charlottetown,
Prince Edward Island, Canada, C1A 8X5. pp. 365-390.
180
El-Abdellati, A., Charlier, J., Geldhor, P., Levecke, B., Demeler, J., von Samson-
Himmelstjerna, G., Claerebout, E., Vercruysse, J., 2010. The use of a simplified
faecal egg count reduction test for assessing anthelmintic efficacy on Belgian and
German cattle farms. Vet. Parasitol. 169, 352-357.
Falzon, L.C., Menzies, P.I., Shakya, K.P., Jones-Bitton, A., Vanleeuwen, J., Avula, J.,
Stewart, H., Jansen, J.T., Taylor, M.A., Learmount, J., Peregrine, A.S., (in press).
Anthelmintic resistance in sheep flocks in Ontario, Canada.Vet. Parasitol.
Fleiss, J.L., Cohen, J., 1973. The equivalence of weighted Kappa and the intraclass
correlation coefficient as measures of reliability. Educ. Psychol. Meas. 33, 613-619.
Fleiss, J.L., Levin, B., Park, M.C., 2003. Statistical methods for rates and proportions
(ISBN: 0-471-52629-0). 3rd
Ed. John Wiley & Sons Ltd., West Sussex, PO19 8SQ,
United Kingdom.760 pages.
Fulford, A.J.C., 1994. Dispersion and bias: can we trust geometric means? Parasitol.
Today 10, 446-448.
Hong, C., Hunt, K.R., Harris, T.J., Coles, G.C., Grimshaw, W.T.R., McMullin, P.G.,
1992. A survey of benzimidazole resistant nematodes in sheep in three counties of
southern England. Vet. Rec. 131, 5-7.
Hong, C., Hunt, K.R., Coles, G.C., 1996. Occurrence of anthelmintic resistant nematodes
on sheep farms in England and goat farms in England and Wales. Vet. Rec. 139,
83-86.
Howell, S.B., Burke, J.M., Miller, J.M., Terrill, T.H., Valencia, E., Williams, M.J.,
Williamson, L.H., Zajac, A.M., Kaplan, R.M., 2008. Prevalence of anthelmintic
resistance on sheep and goat farms in the southeastern United States. J. Am.Vet.
Med. Assoc. 233, 1913-1919.
Hubert, J., Kerboeuf, D., 1992. A microlarval development assay for the detection of
anthelmintic resistance in sheep nematodes. Vet. Rec. 130, 442-446.
Jackson, F., Coop, R.L., 2000. The development of anthelmintic resistance in sheep
nematodes. Parasitology 120, S95-S107.
Kaplan, R.M., 2004. Drug resistance in nematodes of veterinary importance: a status
report. Trends Parasitol. 20, 477-481.
Kaplan, R.M., Vidyashankar, A.N., 2012. An inconvenient truth: Global worming and
anthelmintic resistance. Vet. Parasitol. 186, 70-78.
Knox, M.R., Besier, R.B., Le Jambre, L.F., Kaplan, R.M., Torres-Acosta, J.F.J., Miller,
J., Sutherland, I., 2012. Novel approaches for the control of helminth parasites of
livestock VI: Summary of discussion and conclusion. Vet. Parasitol. 186, 143-149.
181
Königová, A., Váraday, M., Čorba, J., 2003. Comparison of in vitro methods and faecal
egg count reduction test for the detection of benzimidazole resistance in small
strongyles of horses. Vet. Res. Comm. 27, 281-288.
Levecke, B., Rinaldi, L., Charlier, J., Maurelli, M.P., Morgoglione, M.E., Vercruysse, J.,
Cringoli, G., 2011. Monitoring drug efficacy against gastrointestinal nematodes
when faecal egg counts are low: do the analytic sensitivity and the formula matter?
Parasitol. Res. 109, 953-957.
Levecke, B., Dobson R.J., Speybroeck, N., Vercruysse, J., Charlier, J., 2012. Novel
insights in the fecal egg count reduction test for monitoring drug efficacy against
gastrointestinal nematodes of veterinary importance. Vet. Parasitol. 188, 391-396.
Lin, L.I.K., 1989. A concordance correlation coefficient to evaluate reproducibility.
Biometrics 45, 255-268.
Littell, R.C., Milliken, G.A., Stroup, W.W., Wolfinger, R.D., 1996. SAS® System for
Mixed Model (ISBN: 978-1-59047-500-3), Cary, NC: SAS Institute Inc. 633pp.
Maingi, N., Bjorn, H., Dangolla, A., 1998. The relationship between faecal egg count
reduction and the lethal dose 50% in the egg hatch assay and larval development
assay. Vet. Parasitol. 77, 133-145.
Martin, P.J., Anderson, N., Jarrett, R.G., 1989. Detecting benzimidazole resistance with
faecal egg count reduction test and in vitro assays. Aust. Vet. J. 66, 236-240.
McKenna, P.B., 2006. A comparison of faecal egg count reduction test procedures. N.Z.
Vet. J. 54, 202-203.
Mederos, A., Fernandes, S., VanLeeuwen, J., Peregrine, A.S., Kelton, D., Menzies, P.,
LeBoeuf, A., Martin, R., 2010. Prevalence and distribution of gastrointestinal
nematodes on 32 organic and conventional commercial sheep farms in Ontario and
Quebec, Canada (2006 – 2008). Vet. Parasitol. 170, 244-252.
Mejia, M.D., Fernandez, I.B., Schmidt, E.E., Cabaret, J., 2003. Multispecies and multiple
anthelmintic resistance on cattle nematodes in a farm in Argentina: the beginning of
high resistance? Vet. Res. 34, 461-467.
Miller, C.M., Waghorn, T.S., Leathwick, D.M., Gilmour, M.L., 2006. How repeatable is
a faecal egg count reduction test? N.Z. Vet. J. 54, 323-328.
Papadopoulos, E., 2008. Anthelmintic resistance in sheep nematodes. Small Rumin. Res.
76, 99-103.
Presidente, P.J.A., 1985. Methods for detection of resistance to anthelmintics. In:
Anderson, N., Waller, P.J. (Eds.), Resistance in Nematodes to Anthelmintic Drugs.
CSIRO Division of Animal Health, Glebe, NSW, Australia, pp. 13-28.
Prichard, R.K., Hall, C.A., Kelly, J.D., Martin, I.C.A., Donald, A.D., 1980.The problem
of anthelmintic resistance in nematodes. Aust. Vet. J. 56, 239-250.
182
Roush, R.T., Tabashnik, B., 1990. Pesticide resistance in arthropods (ISBN: 0-412-
01971-X). Chapman and Hall Inc., London, United Kingdom, pp. 4-38.
Sangster, N.C., Gill, J., 1999.Pharmacology of anthelmintic resistance. Parasitol. Today
15, 141-146.
Sargison, N.D., 2008. Sheep flock health: a planned approach (ISBN: 978-1-4051-6044-
5). Blackwell Publishing Ltd., Oxford, United Kingdom, pp. 149-191.
Shoukri, M.M., Pause, C.A., 1998.Statistical methods for health sciences (ISBN: 0-8493-
1095-4). 2nd
Edition. CRC Press, New York, USA, pp. 93.
Smothers, C.D., Sun, F., Dayton, A.D., 1999. Comparison of arithmetic and geometric
means as measures of a central tendency in cattle nematode populations. Vet.
Parasitol. 81, 211-224.
Sutherland, I., Scott, I., 2010. Gastrointestinal nematodes of sheep and cattle. Biology
and control (ISBN: 978-1-4051-8582-0). John Wiley and Sons Ltd, West Sussex,
UK. pp.1-60.
Taylor, M.A., 1990. A larval development test for the detection of anthelmintic resistance
in nematodes of sheep. Res. Vet. Sci. 49, 198-202.
Taylor, M.A., Learmount, J., Lunn, E., Morgan, C., Craig, B.H., 2009. Multiple
resistance to anthelmintics in sheep nematodes and comparison of methods used for
their detection. Small Rumin. Res. 86, 67-70.
Taylor, M.A., Hunt, K.R., Goodyear, K.L., 2002. Anthelmintic resistance detection
methods. Vet. Parasitol. 103, 183-194.
Torgerson, P.R., Schnyder, M., Hertzberg, H., 2005. Detection of anthelmintic resistance:
a comparison of mathematical techniques. Vet. Parasitol. 128, 291-298.
Wolstenholme, A.J., Fairweather, I., Prichard, R., von Samson-Himmelstjerna, G.,
Sangster, N.C., 2004. Drug resistance in veterinary helminths. Trends Parasitol. 20,
469-476
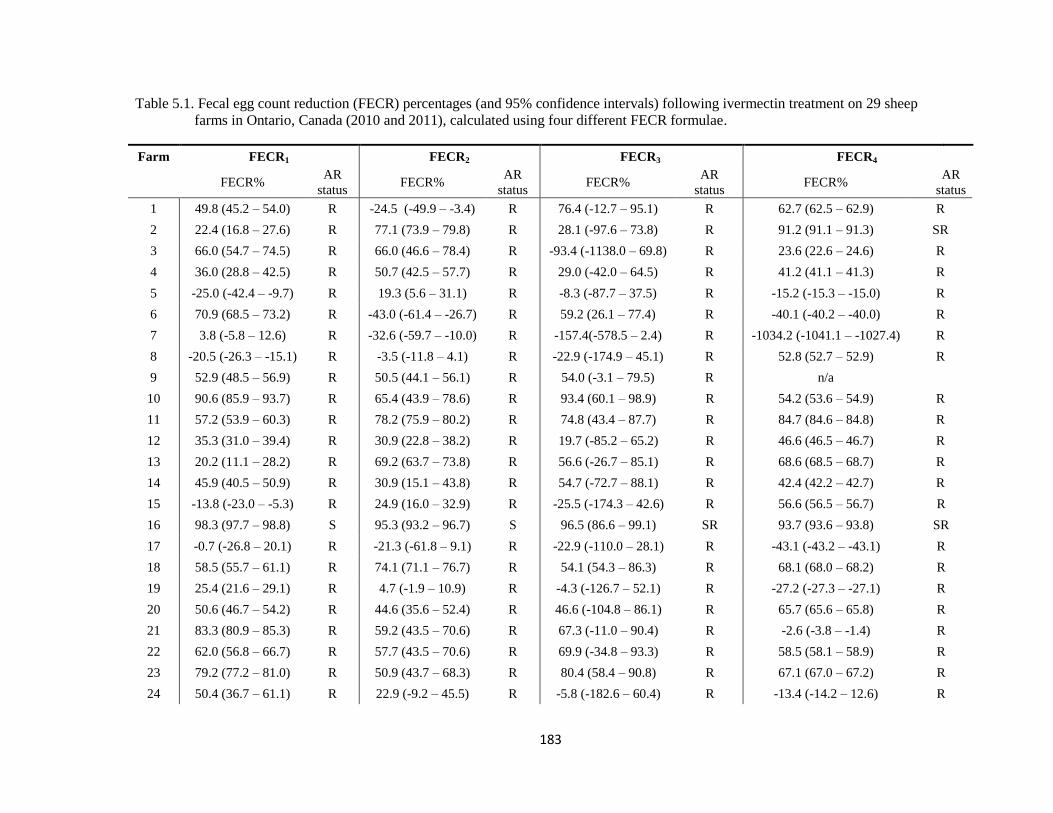
183
Table 5.1. Fecal egg count reduction (FECR) percentages (and 95% confidence intervals) following ivermectin treatment on 29 sheep
farms in Ontario, Canada (2010 and 2011), calculated using four different FECR formulae.
Farm FECR1 FECR2 FECR3 FECR4
FECR% AR
status FECR%
AR
status FECR%
AR
status FECR%
AR
status
1 49.8 (45.2 – 54.0) R -24.5 (-49.9 – -3.4) R 76.4 (-12.7 – 95.1) R 62.7 (62.5 – 62.9) R
2 22.4 (16.8 – 27.6) R 77.1 (73.9 – 79.8) R 28.1 (-97.6 – 73.8) R 91.2 (91.1 – 91.3) SR
3 66.0 (54.7 – 74.5) R 66.0 (46.6 – 78.4) R -93.4 (-1138.0 – 69.8) R 23.6 (22.6 – 24.6) R
4 36.0 (28.8 – 42.5) R 50.7 (42.5 – 57.7) R 29.0 (-42.0 – 64.5) R 41.2 (41.1 – 41.3) R
5 -25.0 (-42.4 – -9.7) R 19.3 (5.6 – 31.1) R -8.3 (-87.7 – 37.5) R -15.2 (-15.3 – -15.0) R
6 70.9 (68.5 – 73.2) R -43.0 (-61.4 – -26.7) R 59.2 (26.1 – 77.4) R -40.1 (-40.2 – -40.0) R
7 3.8 (-5.8 – 12.6) R -32.6 (-59.7 – -10.0) R -157.4(-578.5 – 2.4) R -1034.2 (-1041.1 – -1027.4) R
8 -20.5 (-26.3 – -15.1) R -3.5 (-11.8 – 4.1) R -22.9 (-174.9 – 45.1) R 52.8 (52.7 – 52.9) R
9 52.9 (48.5 – 56.9) R 50.5 (44.1 – 56.1) R 54.0 (-3.1 – 79.5) R n/a
10 90.6 (85.9 – 93.7) R 65.4 (43.9 – 78.6) R 93.4 (60.1 – 98.9) R 54.2 (53.6 – 54.9) R
11 57.2 (53.9 – 60.3) R 78.2 (75.9 – 80.2) R 74.8 (43.4 – 87.7) R 84.7 (84.6 – 84.8) R
12 35.3 (31.0 – 39.4) R 30.9 (22.8 – 38.2) R 19.7 (-85.2 – 65.2) R 46.6 (46.5 – 46.7) R
13 20.2 (11.1 – 28.2) R 69.2 (63.7 – 73.8) R 56.6 (-26.7 – 85.1) R 68.6 (68.5 – 68.7) R
14 45.9 (40.5 – 50.9) R 30.9 (15.1 – 43.8) R 54.7 (-72.7 – 88.1) R 42.4 (42.2 – 42.7) R
15 -13.8 (-23.0 – -5.3) R 24.9 (16.0 – 32.9) R -25.5 (-174.3 – 42.6) R 56.6 (56.5 – 56.7) R
16 98.3 (97.7 – 98.8) S 95.3 (93.2 – 96.7) S 96.5 (86.6 – 99.1) SR 93.7 (93.6 – 93.8) SR
17 -0.7 (-26.8 – 20.1) R -21.3 (-61.8 – 9.1) R -22.9 (-110.0 – 28.1) R -43.1 (-43.2 – -43.1) R
18 58.5 (55.7 – 61.1) R 74.1 (71.1 – 76.7) R 54.1 (54.3 – 86.3) R 68.1 (68.0 – 68.2) R
19 25.4 (21.6 – 29.1) R 4.7 (-1.9 – 10.9) R -4.3 (-126.7 – 52.1) R -27.2 (-27.3 – -27.1) R
20 50.6 (46.7 – 54.2) R 44.6 (35.6 – 52.4) R 46.6 (-104.8 – 86.1) R 65.7 (65.6 – 65.8) R
21 83.3 (80.9 – 85.3) R 59.2 (43.5 – 70.6) R 67.3 (-11.0 – 90.4) R -2.6 (-3.8 – -1.4) R
22 62.0 (56.8 – 66.7) R 57.7 (43.5 – 70.6) R 69.9 (-34.8 – 93.3) R 58.5 (58.1 – 58.9) R
23 79.2 (77.2 – 81.0) R 50.9 (43.7 – 68.3) R 80.4 (58.4 – 90.8) R 67.1 (67.0 – 67.2) R
24 50.4 (36.7 – 61.1) R 22.9 (-9.2 – 45.5) R -5.8 (-182.6 – 60.4) R -13.4 (-14.2 – 12.6) R
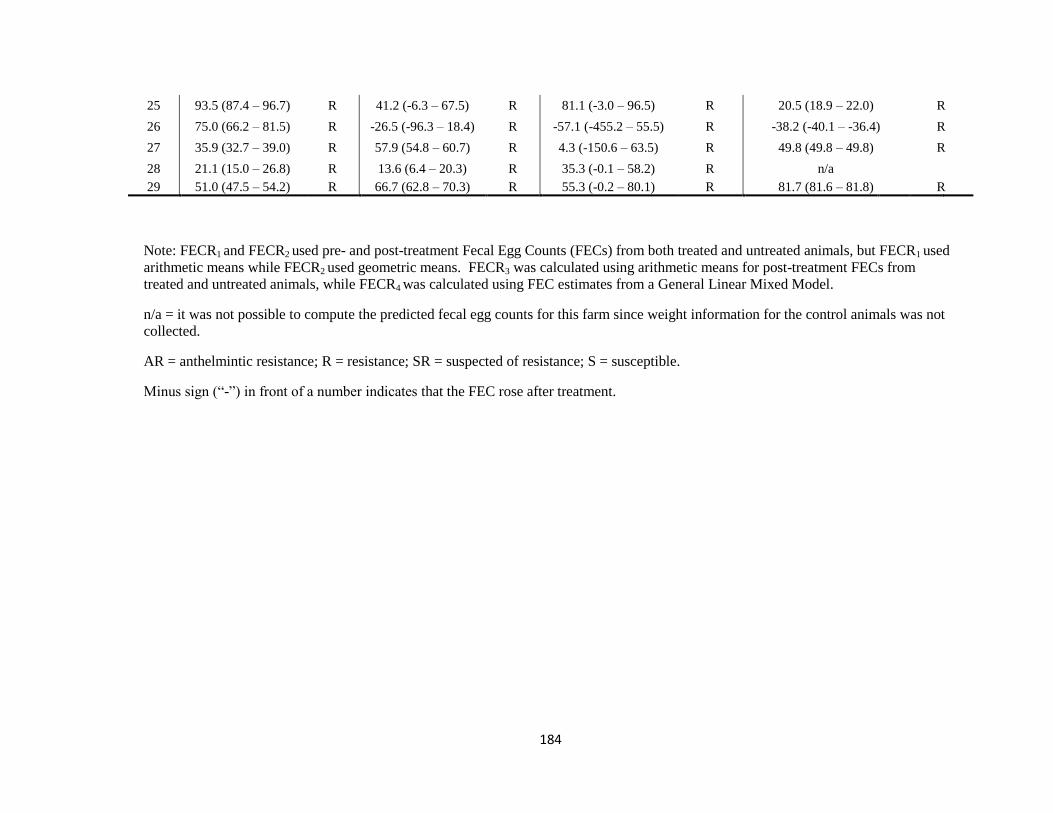
184
25 93.5 (87.4 – 96.7) R 41.2 (-6.3 – 67.5) R 81.1 (-3.0 – 96.5) R 20.5 (18.9 – 22.0) R
26 75.0 (66.2 – 81.5) R -26.5 (-96.3 – 18.4) R -57.1 (-455.2 – 55.5) R -38.2 (-40.1 – -36.4) R
27 35.9 (32.7 – 39.0) R 57.9 (54.8 – 60.7) R 4.3 (-150.6 – 63.5) R 49.8 (49.8 – 49.8) R
28 21.1 (15.0 – 26.8) R 13.6 (6.4 – 20.3) R 35.3 (-0.1 – 58.2) R n/a
29 51.0 (47.5 – 54.2) R 66.7 (62.8 – 70.3) R 55.3 (-0.2 – 80.1) R 81.7 (81.6 – 81.8) R
Note: FECR1 and FECR2 used pre- and post-treatment Fecal Egg Counts (FECs) from both treated and untreated animals, but FECR1 used
arithmetic means while FECR2 used geometric means. FECR3 was calculated using arithmetic means for post-treatment FECs from
treated and untreated animals, while FECR4 was calculated using FEC estimates from a General Linear Mixed Model.
n/a = it was not possible to compute the predicted fecal egg counts for this farm since weight information for the control animals was not
collected.
AR = anthelmintic resistance; R = resistance; SR = suspected of resistance; S = susceptible.
Minus sign (“-”) in front of a number indicates that the FEC rose after treatment.
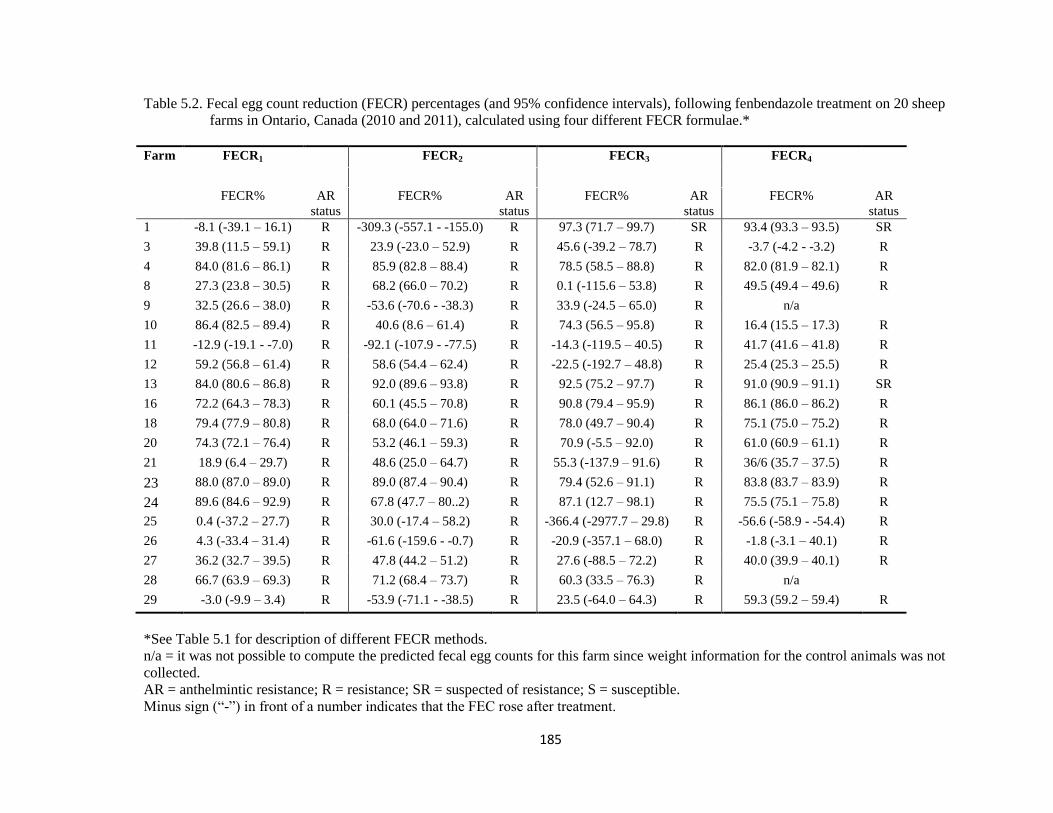
185
Table 5.2. Fecal egg count reduction (FECR) percentages (and 95% confidence intervals), following fenbendazole treatment on 20 sheep
farms in Ontario, Canada (2010 and 2011), calculated using four different FECR formulae.*
Farm FECR1 FECR2 FECR3 FECR4
FECR% AR
status
FECR% AR
status
FECR% AR
status
FECR% AR
status
1 -8.1 (-39.1 – 16.1) R -309.3 (-557.1 - -155.0) R 97.3 (71.7 – 99.7) SR 93.4 (93.3 – 93.5) SR
3 39.8 (11.5 – 59.1) R 23.9 (-23.0 – 52.9) R 45.6 (-39.2 – 78.7) R -3.7 (-4.2 - -3.2) R
4 84.0 (81.6 – 86.1) R 85.9 (82.8 – 88.4) R 78.5 (58.5 – 88.8) R 82.0 (81.9 – 82.1) R
8 27.3 (23.8 – 30.5) R 68.2 (66.0 – 70.2) R 0.1 (-115.6 – 53.8) R 49.5 (49.4 – 49.6) R
9 32.5 (26.6 – 38.0) R -53.6 (-70.6 - -38.3) R 33.9 (-24.5 – 65.0) R n/a
10 86.4 (82.5 – 89.4) R 40.6 (8.6 – 61.4) R 74.3 (56.5 – 95.8) R 16.4 (15.5 – 17.3) R
11 -12.9 (-19.1 - -7.0) R -92.1 (-107.9 - -77.5) R -14.3 (-119.5 – 40.5) R 41.7 (41.6 – 41.8) R
12 59.2 (56.8 – 61.4) R 58.6 (54.4 – 62.4) R -22.5 (-192.7 – 48.8) R 25.4 (25.3 – 25.5) R
13 84.0 (80.6 – 86.8) R 92.0 (89.6 – 93.8) R 92.5 (75.2 – 97.7) R 91.0 (90.9 – 91.1) SR
16 72.2 (64.3 – 78.3) R 60.1 (45.5 – 70.8) R 90.8 (79.4 – 95.9) R 86.1 (86.0 – 86.2) R
18 79.4 (77.9 – 80.8) R 68.0 (64.0 – 71.6) R 78.0 (49.7 – 90.4) R 75.1 (75.0 – 75.2) R
20 74.3 (72.1 – 76.4) R 53.2 (46.1 – 59.3) R 70.9 (-5.5 – 92.0) R 61.0 (60.9 – 61.1) R
21 18.9 (6.4 – 29.7) R 48.6 (25.0 – 64.7) R 55.3 (-137.9 – 91.6) R 36/6 (35.7 – 37.5) R
23 88.0 (87.0 – 89.0) R 89.0 (87.4 – 90.4) R 79.4 (52.6 – 91.1) R 83.8 (83.7 – 83.9) R
24 89.6 (84.6 – 92.9) R 67.8 (47.7 – 80..2) R 87.1 (12.7 – 98.1) R 75.5 (75.1 – 75.8) R
25 0.4 (-37.2 – 27.7) R 30.0 (-17.4 – 58.2) R -366.4 (-2977.7 – 29.8) R -56.6 (-58.9 - -54.4) R
26 4.3 (-33.4 – 31.4) R -61.6 (-159.6 - -0.7) R -20.9 (-357.1 – 68.0) R -1.8 (-3.1 – 40.1) R
27 36.2 (32.7 – 39.5) R 47.8 (44.2 – 51.2) R 27.6 (-88.5 – 72.2) R 40.0 (39.9 – 40.1) R
28 66.7 (63.9 – 69.3) R 71.2 (68.4 – 73.7) R 60.3 (33.5 – 76.3) R n/a
29 -3.0 (-9.9 – 3.4) R -53.9 (-71.1 - -38.5) R 23.5 (-64.0 – 64.3) R 59.3 (59.2 – 59.4) R
*See Table 5.1 for description of different FECR methods.
n/a = it was not possible to compute the predicted fecal egg counts for this farm since weight information for the control animals was not
collected.
AR = anthelmintic resistance; R = resistance; SR = suspected of resistance; S = susceptible.
Minus sign (“-”) in front of a number indicates that the FEC rose after treatment.
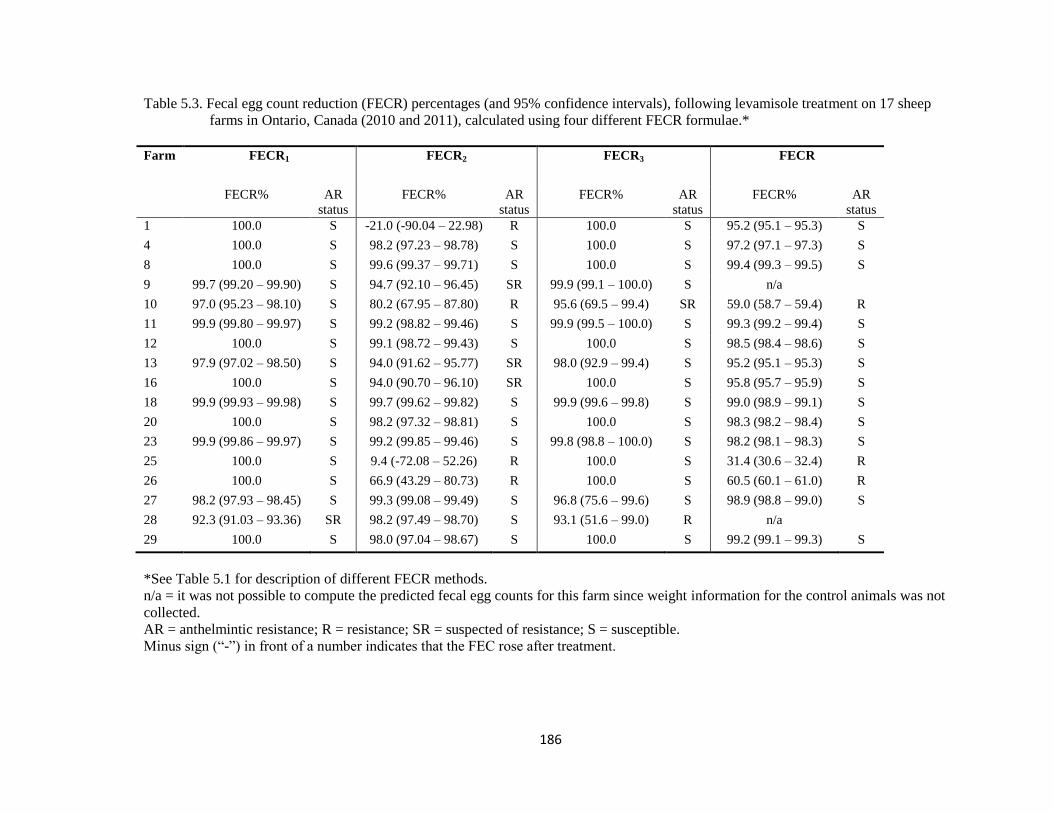
186
Table 5.3. Fecal egg count reduction (FECR) percentages (and 95% confidence intervals), following levamisole treatment on 17 sheep
farms in Ontario, Canada (2010 and 2011), calculated using four different FECR formulae.*
Farm FECR1 FECR2 FECR3 FECR
FECR% AR
status
FECR% AR
status
FECR% AR
status
FECR% AR
status
1 100.0 S -21.0 (-90.04 – 22.98) R 100.0 S 95.2 (95.1 – 95.3) S
4 100.0 S 98.2 (97.23 – 98.78) S 100.0 S 97.2 (97.1 – 97.3) S
8 100.0 S 99.6 (99.37 – 99.71) S 100.0 S 99.4 (99.3 – 99.5) S
9 99.7 (99.20 – 99.90) S 94.7 (92.10 – 96.45) SR 99.9 (99.1 – 100.0) S n/a
10 97.0 (95.23 – 98.10) S 80.2 (67.95 – 87.80) R 95.6 (69.5 – 99.4) SR 59.0 (58.7 – 59.4) R
11 99.9 (99.80 – 99.97) S 99.2 (98.82 – 99.46) S 99.9 (99.5 – 100.0) S 99.3 (99.2 – 99.4) S
12 100.0 S 99.1 (98.72 – 99.43) S 100.0 S 98.5 (98.4 – 98.6) S
13 97.9 (97.02 – 98.50) S 94.0 (91.62 – 95.77) SR 98.0 (92.9 – 99.4) S 95.2 (95.1 – 95.3) S
16 100.0 S 94.0 (90.70 – 96.10) SR 100.0 S 95.8 (95.7 – 95.9) S
18 99.9 (99.93 – 99.98) S 99.7 (99.62 – 99.82) S 99.9 (99.6 – 99.8) S 99.0 (98.9 – 99.1) S
20 100.0 S 98.2 (97.32 – 98.81) S 100.0 S 98.3 (98.2 – 98.4) S
23 99.9 (99.86 – 99.97) S 99.2 (99.85 – 99.46) S 99.8 (98.8 – 100.0) S 98.2 (98.1 – 98.3) S
25 100.0 S 9.4 (-72.08 – 52.26) R 100.0 S 31.4 (30.6 – 32.4) R
26 100.0 S 66.9 (43.29 – 80.73) R 100.0 S 60.5 (60.1 – 61.0) R
27 98.2 (97.93 – 98.45) S 99.3 (99.08 – 99.49) S 96.8 (75.6 – 99.6) S 98.9 (98.8 – 99.0) S
28 92.3 (91.03 – 93.36) SR 98.2 (97.49 – 98.70) S 93.1 (51.6 – 99.0) R n/a
29 100.0 S 98.0 (97.04 – 98.67) S 100.0 S 99.2 (99.1 – 99.3) S
*See Table 5.1 for description of different FECR methods.
n/a = it was not possible to compute the predicted fecal egg counts for this farm since weight information for the control animals was not
collected.
AR = anthelmintic resistance; R = resistance; SR = suspected of resistance; S = susceptible.
Minus sign (“-”) in front of a number indicates that the FEC rose after treatment.
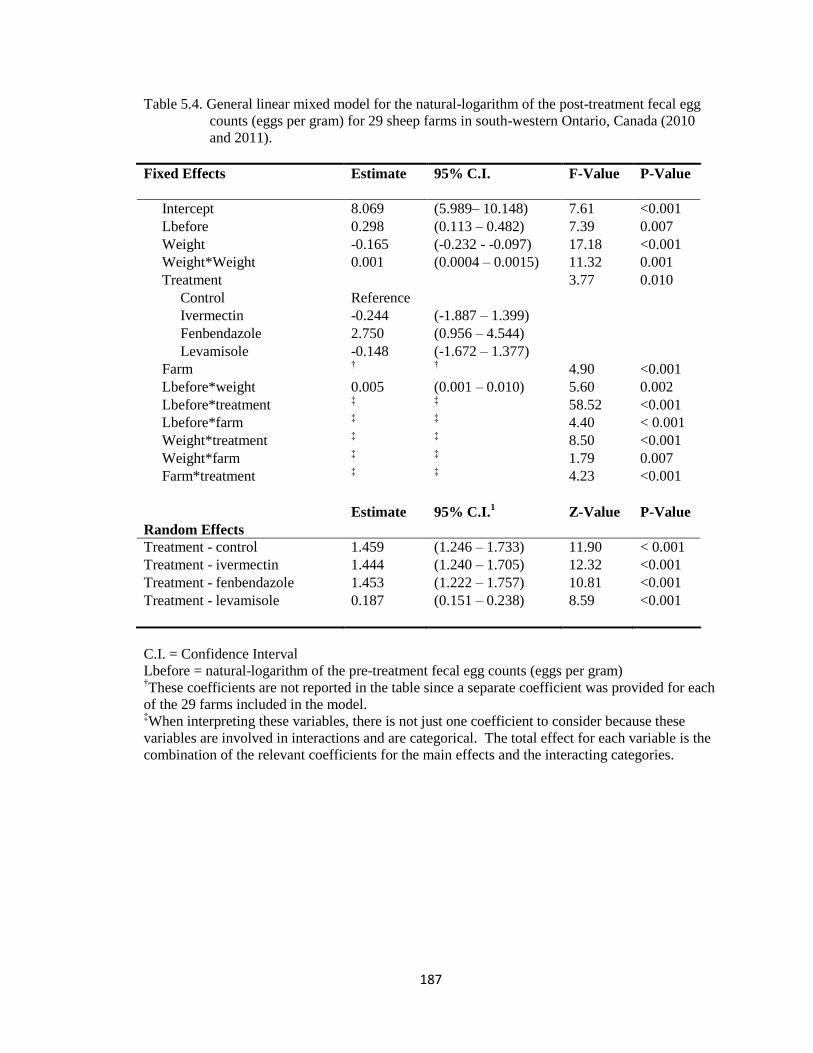
187
Table 5.4. General linear mixed model for the natural-logarithm of the post-treatment fecal egg
counts (eggs per gram) for 29 sheep farms in south-western Ontario, Canada (2010
and 2011).
Fixed Effects Estimate 95% C.I.
F-Value P-Value
Intercept 8.069 (5.989– 10.148) 7.61 <0.001
Lbefore
0.298 (0.113 – 0.482) 7.39 0.007
Weight -0.165 (-0.232 - -0.097) 17.18 <0.001
Weight*Weight 0.001 (0.0004 – 0.0015) 11.32 0.001
Treatment
3.77 0.010
Control Reference
Ivermectin -0.244 (-1.887 – 1.399)
Fenbendazole 2.750 (0.956 – 4.544)
Levamisole -0.148 (-1.672 – 1.377)
Farm † †
4.90 <0.001
Lbefore*weight
0.005 (0.001 – 0.010) 5.60 0.002
Lbefore*treatment ‡ ‡
58.52 <0.001
Lbefore*farm ‡ ‡
4.40 < 0.001
Weight*treatment ‡ ‡
8.50 <0.001
Weight*farm ‡ ‡
1.79 0.007
Farm*treatment ‡ ‡
4.23 <0.001
Estimate 95% C.I.1
Z-Value P-Value
Random Effects
Treatment - control 1.459 (1.246 – 1.733) 11.90 < 0.001
Treatment - ivermectin 1.444 (1.240 – 1.705) 12.32 <0.001
Treatment - fenbendazole 1.453 (1.222 – 1.757) 10.81 <0.001
Treatment - levamisole 0.187 (0.151 – 0.238) 8.59 <0.001
C.I. = Confidence Interval
Lbefore = natural-logarithm of the pre-treatment fecal egg counts (eggs per gram) †These coefficients are not reported in the table since a separate coefficient was provided for each
of the 29 farms included in the model. ‡When interpreting these variables, there is not just one coefficient to consider because these
variables are involved in interactions and are categorical. The total effect for each variable is the
combination of the relevant coefficients for the main effects and the interacting categories.

188
Table 5.5. The concordance correlation coefficients (and 95% confidence intervals) and level of
agreement, between the different methods for calculating fecal egg count reduction
(FECR) percentages following (a) ivermectin, (b) fenbendazole and (c) levamisole
treatment for 26, 18 and 16 sheep farms, respectively, in Ontario, Canada (2010 and
2011).
a) Ivermectin
FECR1 FECR2 FECR3
FECR2
0.33 (0.07 – 0.64)
Fair
-
-
FECR3 0.65 (0.36 – 0.82)
Substantial
0.63 (0.33 – 0.82)
Substantial
-
FECR4 0.10 (-0.31 – 0.48) 0.81 (0.61 – 0.91) 0.51 (0.13 – 0.77)
Slight Almost perfect Moderate
b) Fenbendazole
FECR1 FECR2 FECR3
FECR2 0.67 (0.38 – 0.84) - -
Substantial
FECR3 0.35 (0.08 – 0.56) 0.22 (-0.21 – 0.58) -
Fair Fair
FECR4 0.60 (0.12 – 0.85) 0.37 (-0.13 – 0.72) 0.50 (0.31 – 0.66)
Moderate Fair Moderate
c) Levamisole
FECR1 FECR2 FECR3
FECR2 -0.02 (-0.10 – 0.07) - -
Poor
FECR3 0.96 (0.89 – 0.99) -0.01 (-0.10 – 0.07) -
Almost perfect Poor
FECR4 0.01 (-0.03 – 0.06) 0.93 (0.79 – 0.98) 0.02 (-0.05 – 0.08)
Slight Almost perfect Slight
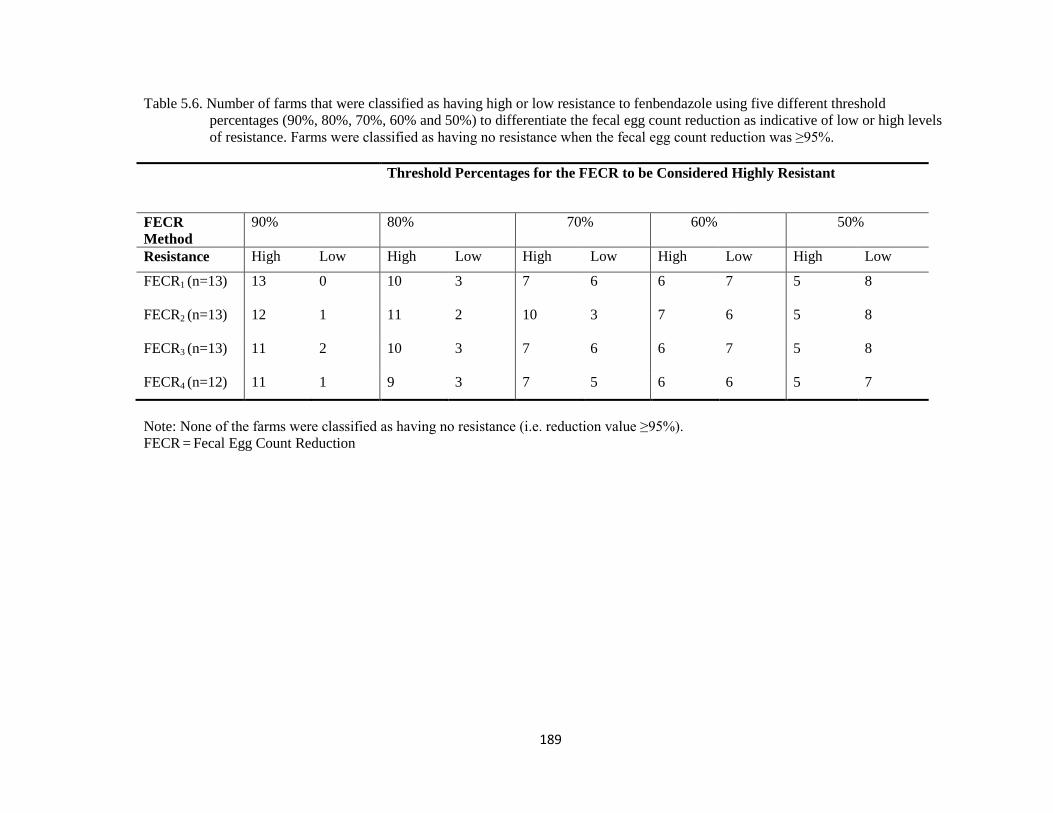
189
Table 5.6. Number of farms that were classified as having high or low resistance to fenbendazole using five different threshold
percentages (90%, 80%, 70%, 60% and 50%) to differentiate the fecal egg count reduction as indicative of low or high levels
of resistance. Farms were classified as having no resistance when the fecal egg count reduction was ≥95%.
Threshold Percentages for the FECR to be Considered Highly Resistant
FECR
Method
90% 80% 70% 60% 50%
Resistance High
Low
High
Low
High
Low
High
Low
High
Low
FECR1 (n=13)
13 0 10 3 7 6 6 7 5 8
FECR2 (n=13)
12 1 11 2 10 3 7 6 5 8
FECR3 (n=13)
11 2 10 3 7 6 6 7 5 8
FECR4 (n=12) 11 1 9 3 7 5 6 6 5 7
Note: None of the farms were classified as having no resistance (i.e. reduction value ≥95%).
FECR =
Fecal Egg Count Reduction
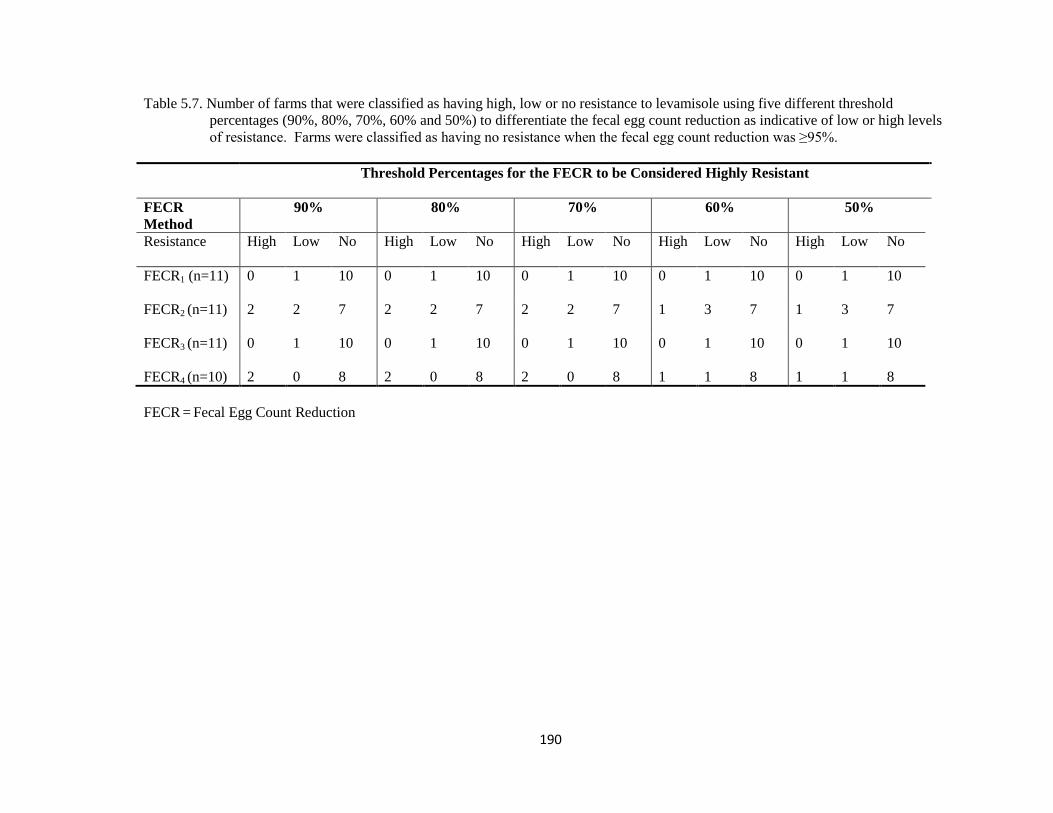
190
Table 5.7. Number of farms that were classified as having high, low or no resistance to levamisole using five different threshold
percentages (90%, 80%, 70%, 60% and 50%) to differentiate the fecal egg count reduction as indicative of low or high levels
of resistance. Farms were classified as having no resistance when the fecal egg count reduction was ≥95%.
Threshold Percentages for the FECR to be Considered Highly Resistant
FECR
Method
90% 80% 70% 60% 50%
Resistance High Low No High Low No High Low No High Low No High Low No
FECR1 (n=11) 0 1 10 0 1 10 0 1 10 0 1 10 0 1 10
FECR2 (n=11) 2 2 7 2 2 7 2 2 7 1 3 7 1 3 7
FECR3 (n=11) 0 1 10 0 1 10 0 1 10 0 1 10 0 1 10
FECR4 (n=10) 2 0 8 2 0 8 2 0 8 1 1 8 1 1 8
FECR =
Fecal Egg Count Reduction
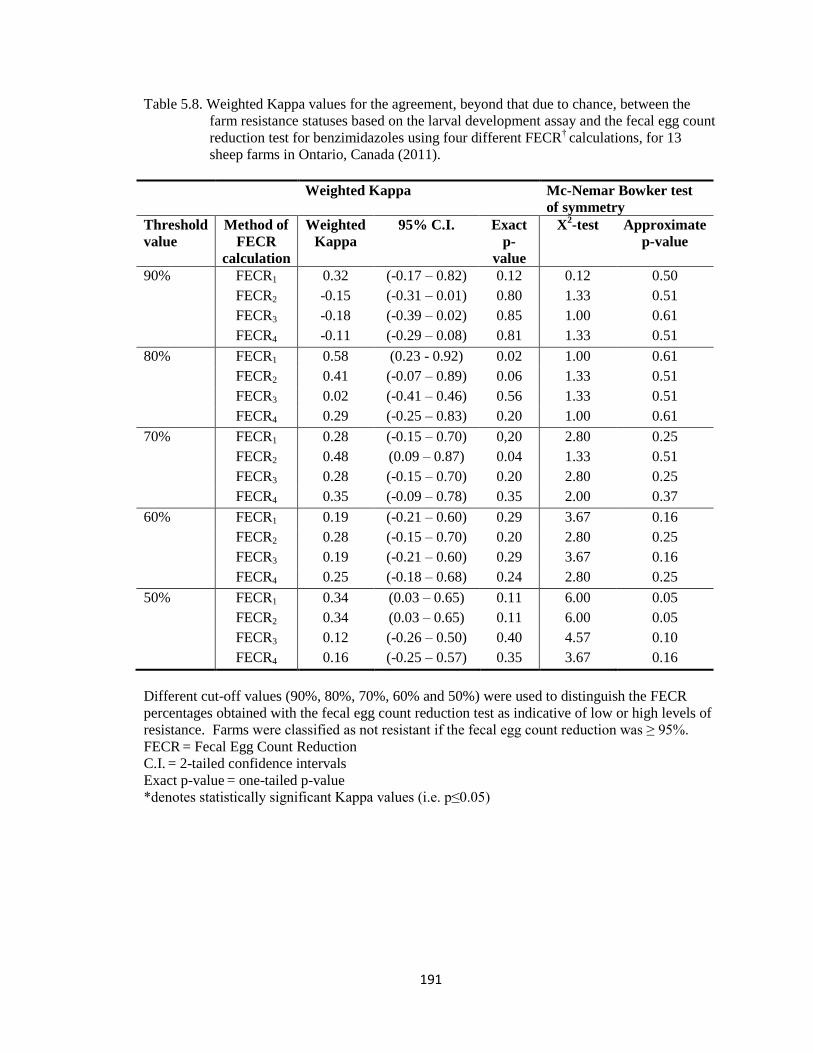
191
Table 5.8. Weighted Kappa values for the agreement, beyond that due to chance, between the
farm resistance statuses based on the larval development assay and the fecal egg count
reduction test for benzimidazoles using four different FECR† calculations, for 13
sheep farms in Ontario, Canada (2011).
Weighted Kappa Mc-Nemar Bowker test
of symmetry
Threshold
value
Method of
FECR
calculation
Weighted
Kappa
95% C.I. Exact
p-
value
X2-test Approximate
p-value
90% FECR1 0.32 (-0.17 – 0.82) 0.12 0.12 0.50
FECR2 -0.15 (-0.31 – 0.01) 0.80 1.33 0.51
FECR3 -0.18 (-0.39 – 0.02) 0.85 1.00 0.61
FECR4 -0.11 (-0.29 – 0.08) 0.81 1.33 0.51
80% FECR1 0.58 (0.23 - 0.92) 0.02 1.00 0.61
FECR2 0.41 (-0.07 – 0.89) 0.06 1.33 0.51
FECR3 0.02 (-0.41 – 0.46) 0.56 1.33 0.51
FECR4 0.29 (-0.25 – 0.83) 0.20 1.00 0.61
70% FECR1 0.28 (-0.15 – 0.70) 0,20 2.80 0.25
FECR2 0.48 (0.09 – 0.87) 0.04 1.33 0.51
FECR3 0.28 (-0.15 – 0.70) 0.20 2.80 0.25
FECR4 0.35 (-0.09 – 0.78) 0.35 2.00 0.37
60% FECR1 0.19 (-0.21 – 0.60) 0.29 3.67 0.16
FECR2 0.28 (-0.15 – 0.70) 0.20 2.80 0.25
FECR3 0.19 (-0.21 – 0.60) 0.29 3.67 0.16
FECR4 0.25 (-0.18 – 0.68) 0.24 2.80 0.25
50% FECR1 0.34 (0.03 – 0.65) 0.11 6.00 0.05
FECR2 0.34 (0.03 – 0.65) 0.11 6.00 0.05
FECR3 0.12 (-0.26 – 0.50) 0.40 4.57 0.10
FECR4 0.16 (-0.25 – 0.57) 0.35 3.67 0.16
Different cut-off values (90%, 80%, 70%, 60% and 50%) were used to distinguish the FECR
percentages obtained with the fecal egg count reduction test as indicative of low or high levels of
resistance. Farms were classified as not resistant if the fecal egg count reduction was ≥ 95%.
FECR = Fecal Egg Count Reduction
C.I. = 2-tailed confidence intervals
Exact p-value = one-tailed p-value
*denotes statistically significant Kappa values (i.e. p≤0.05)

192
Table 5.9. Percentages (%) of Haemonchus sp., Teladorsagia sp., and Trichostrongylus spp.
isolated from the control wells of the larval development assay, and from larval
cultures of pooled fecal samples collected from the control (i.e. untreated) animals on
the second visit for the fecal egg count reduction test, for 13 sheep farms in Ontario,
Canada (2011).
Larval Development Assay
Larval Culture
Farm
%
Haem-
onchus
%
Telador-
sagia
%
Tricho-
strongylus
%
Haem-
onchus
%
Telador-
sagia
%
Tricho-
strongylus
12 1 80 19 87 5 8
13 97† 1 1 100 0 0
16 98 2 0 93 6 1
18 80 18 2 90† 5 2
20 97 1 2 87 13 0
21 92 5 3 95† 2 0
23 4 47 49 99 1 0
24 2 25 73 80† 13 6
25 98 0 2 77 23 0
26 100 0 0 97 3 0
27 96 2 2 97 0 3
28 64† 19 13 74† 17 7
29 96 2 2 92 6 2
†The total percentage does not add up to 100% because other gastrointestinal nematode species,
such as Oesophagostomum/Chabertia sp., were present in small numbers.
193
CHAPTER 6
A survey of farm management practices and their associations with anthelmintic
resistance in sheep flocks in Ontario, Canada
Prepared for submission to Small Ruminant Research
Abstract
Anthelmintic resistance (AR) has been reported on sheep farms worldwide. To better
understand AR on Ontario sheep farms, this study was conducted to describe
management practices, and their associations with AR, on sheep farms in Ontario,
Canada. A questionnaire pertaining to farm practices considered risk factors for AR was
administered on 38 farms that participated in a study to determine the frequency of
ivermectin drench failure and resistance to ivermectin, fenbendazole and levamisole in
Ontario sheep flocks. Most of the producers surveyed had used ivermectin and
fenbendazole drenches (36/38 [95%] and 26/38 [68%], respectively), while only 4/38
(11%) had used levamisole drench, in the previous 5 years. Producers treated their
animals a mean of 2.6 times per year. Routine treatment (defined as treatment of the
whole flock at fixed times during the year) was practiced by 31/38 (82%) of the
producers; most ewes were treated routinely either at lambing (17/31 [55%]) and/or at the
beginning of winter housing (15/31 [48%]). The majority of the producers (31/38; 82%)
also used targeted or targeted selective treatment (defined as treatment of the whole flock
or individual animals, respectively, when gastro-intestinal nematode parasitism was
suspected); however, it was often in addition to, rather than in lieu of, routine treatment.
Twenty-five producers (66%) brought in new animals (including sheep, goats, llamas
and/or alpacas, but not cattle or other livestock) in the previous year; of these 25 farms, 8
194
(32%) kept the animals off pasture for an average of 46 days, and treated the animals
with an anthelmintic while in quarantine, 6 (24%) kept the animals off pasture for an
average of 30 days, 4 (16%) treated the animals with an anthelmintic upon arrival but put
them on pasture immediately, and 7 (28%) did not have any quarantine strategies. Many
producers (17/38; 45%) did not calibrate the drench gun before use. Although univariable
analyses identified several marginally significant risk factors (0.10<p>0.05), no predictor
variables were significant in the final model for ivermectin resistance. The prior use of
benzimidazoles was associated (p=0.01) with increased resistance (lower fecal egg count
reduction percentages) to fenbendazole. Levamisole resistance could not be modeled due
to the very low levels of resistance on the farms surveyed. This study has provided a
picture of management practices currently employed by Ontario sheep producers on their
farms, while allowing us to formulate hypotheses as to how these practices may be
associated with AR.
6.1 Introduction
Gastrointestinal nematodes (GIN) cause significant disease in grazing sheep
worldwide, and effective programs for GIN control are necessary to maintain sheep
health, productivity and profitability (Scott, 2007). For many years, anthelmintic drugs
have represented the cornerstone of GIN control, since they are relatively inexpensive
and easy to use (Kenyon and Jackson, 2012; Taylor, 2012). However, reports of
anthelmintic resistance (AR) have become increasingly more common over the past 20
years (Knox et al., 2012), and AR now represents the status quo in numerous sheep-
rearing countries (Kaplan and Vidyashankar, 2012). A recent study in Canadian sheep
flocks demonstrated that ivermectin drench failure was a common occurrence, and that
195
resistance to both ivermectin and fenbendazole was present on the majority of these
farms (Falzon et al., in press).
To slow the development of AR in flocks, it is necessary to improve our
understanding of the epidemiology of resistance, and to determine which management
practices may be associated with the emergence and/or presence of AR (Coles, 2001).
Several management practices, such as increased frequency of anthelmintic treatment
(Coles, 2010; Calvete et al., 2012), and inadequate quarantine strategies for new animal
introductions (Hughes et al., 2007; Sargison, 2011), have been described as risk factors
for AR. However, the association of AR with these practices is based on complex
theoretical principles (Sargison, 2011) or simulation studies (Leathwick et al., 1995). So
far, few observational studies on risk factors associated with AR have been conducted on
commercial sheep farms (Suter et al., 2004; Lawrence et al., 2006; Hughes et al., 2007;
Calvete et al., 2012), and there is a lack of empirical evidence regarding which
management practices should be recommended to sheep producers to lower the risk of
development of AR on their farms. Moreover, a recent survey on sheep farms in the
United Kingdom (Morgan and Coles, 2010) showed that, despite the widespread
dissemination in 2005/2006 of theoretically plausible practical guidelines on how to
counter AR (Abbott et al., 2009), very few changes in management practices ensued in
the following two years. This reluctance to change could be because producers often do
not perceive the economic impact of resistance until it reaches overt levels (Miller et al.,
2012). Therefore, it is important to improve our knowledge of the management practices
that are commonly used on farms, and to understand producers’ perceptions of AR risk
on their farms, so that extension programs to stakeholders can be improved (Woodgate

196
and Love, 2012). In Ontario, Canada, the ewe flock has been increasing steadily over the
past few years, with 158,900 ewes reported in January 2006, and 189,000 ewes reported
in July 2012 (Statistics Canada, 2012). However, information on farm management
practices commonly practiced on Ontario sheep flocks, and producers’ awareness of AR,
is currently lacking.
The objectives of this study were: (a) to describe parasite control and farm
management practices commonly used on Ontario sheep farms; and (b) to determine
whether any of these practices are associated with the presence of resistance to
ivermectin, fenbendazole or levamisole.
6.2 Materials and methods
6.2.1 Farm selection
A description of the farm selection, ivermectin drench check, and the Fecal Egg
Count Reduction Test (FECRT) can be found in Falzon et al. (Chapter 5). In brief, 47
sheep farms were enrolled in a study over two consecutive grazing seasons in 2010 and
2011, to determine the frequency of AR in Ontario sheep flocks. Among these 47 farms,
animals on 39 farms (15 lambs or yearling ewes/farm) attained mean fecal egg counts
(FECs) for GINs that reached the set threshold of 200 eggs per gram (epg) of feces. As a
result, an ivermectin drench check was carried out by producers on these farms. On the
basis of FECs before treatment and 14 days later, “drench failure” was defined as a
reduction in mean FECs of <95%. FECRTs were then conducted in flocks with
ivermectin drench failure; lambs or yearling ewes were divided into 4 drench treatment
groups (n=10-15 lambs or yearling ewes per group): control (i.e. untreated), ivermectin
197
(dosage: 0.2 mg/kg), and, if sufficient numbers of animals, fenbendazole (dosage: 5.0
mg/kg) and levamisole (dosage: 10.5 mg/kg). The percentage reduction in mean FECs
following treatment with ivermectin, fenbendazole and levamisole was calculated using
the method endorsed by the World Association for the Advancement of Veterinary
Parasitology (Coles et al., 1992). Farms were classified as resistant when the Fecal Egg
Count Reduction (FECR) was <95% and the lower 95% confidence interval limit was
<90%; if only one of these two criteria was met, the farm was classified as being
suspected of resistance (Coles et al., 1992).
6.2.2 Farm-level questionnaire
A questionnaire on management practices and putative risk factors for AR was
administered by one of the co-authors (LCF) in a face-to-face interview with the farm
manager on the farms that performed the ivermectin drench check. Questionnaires took
approximately 30-40 minutes each to complete and were carried out during the grazing
seasons of 2010 and 2011.
The questionnaire contained 29 questions, and was a refinement of a
questionnaire previously pretested on Ontario sheep farms. The questionnaire was
divided into six main sections: (i) demographics of the farm; (ii) use of anthelmintics;
(iii) quarantine strategies for new animal introductions (animals of interest included
sheep, goats, llamas and/or alpacas, but not cattle or other livestock); (iv) pasture
management and alternative strategies for parasite control; (v) manure disposal; and (vi)
perceived anthelmintic resistance. The majority of the questions were closed-ended, with
a few semi-open (i.e. a close-ended question with the addition of a category “other –
198
please specify”) and open-ended questions. Routine treatment was defined as treatment of
the whole flock at fixed times during the year and not based on fecal egg count results or
evidence of clinical parasitism. Targeted treatment and targeted selective treatment were
defined as treatment of the whole flock or individual animals, respectively, when GIN
parasitism was suspected. A copy of the questionnaire can be obtained from the authors
upon request (Appendix III).
6.2.3 Data management and statistical analyses
The questionnaire data were entered into an Excel spreadsheet (Microsoft Office
Excel©
, 2007) and analysed using SAS® 9.3 (SAS Institute Inc., Cary, NC, USA).
Summary descriptive statistics were performed, and predictor variables were
checked for missing values and variability. Due to the limited number of observations,
the levels of outcomes for some of the categorical predictor variables were collapsed to
two for modeling purposes. For example, flock purpose was reduced to ‘meat’ if they
kept sheep for meat purposes, or ‘other’ if they kept sheep for breeding, to train herding
dogs or for dairy purposes. Likewise, responses to a question on calibration of the drench
gun were reduced to ‘no’ if they replied that they never calibrated the drench gun or only
calibrated it once or twice a year, versus ‘yes’ if they calibrated the drench gun before
each use. Similarly, when producers were asked how they determined the weight of the
animal to calculate the dose of the anthelmintic to administer, the responses were reduced
to ‘estimate’ if they estimated the weight, used the expected breed average, or weighed
some animals and used the average weight, or ‘weigh’ if they weighed each animal or
199
weighed the larger animals in the group and used the heaviest weight to calculate the
dose of anthelmintic to administer.
The FECR percentages following ivermectin (n=29), fenbendazole (n=20) or
levamisole (n=17) treatment were used for three separate anthelmintic-based outcomes
and model-building processes. For each of the three models, univariable associations
between the predictor variables and the outcome were screened using linear regression
(for continuous predictor variables) and the Mann-Whitney-Wilcoxon Rank-Sum Test
(for categorical predictor variables), which computes all unique pair-wise differences
between the two groups and estimates the median difference. Predictor variables that
were significantly associated with outcomes at a liberal alpha value of ≤0.20 were
checked for collinearity (Pearson correlation coefficient >0.8); if pairs of highly
correlated variables were identified, one of them was retained in the model based on
biological plausibility or fewer missing observations (Dohoo et al., 2009). All remaining
variables at an alpha ≤0.20 were offered to a general linear model, with all predictor
variables considered as fixed effects. The model was built using a manual forward step-
wise procedure; predictor variables that were significant at an alpha value ≤0.05 were
retained in the final model. All possible two-way interactions between predictor variables
significant in the final main effects model were tested for significance (alpha ≤0.05). The
linearity of associations between continuous predictor variables and outcomes was
assessed graphically by plotting lowess smoothed curves, and by testing a quadratic term
in the model, as described by Dohoo et al. (2009).
The model assumptions were assessed by plotting residuals against the predicted
outcomes for the explanatory variables, to look for homoscedasticity, non-linearity,
200
outliers and potential influential observations. Normality was visually assessed with
histograms of the residuals and normal quantile plots, and assessed statistically using four
different tests offered by SAS (Shapiro-Wilk, Kolmogorov-Smirnov, Cramer-von Mises,
and Anderson-Darling). If the assumptions of linearity or homoscedasticity were not met,
different data transformations were performed and the residuals were re-assessed.
Observations that were identified as outliers or influential were cross-checked with the
original data sheets for any peculiarity in the data to explain the results. The model was
repeated without the outlier or influential observation, and differences in the coefficients
and goodness-of-fit tests were noted.
6.3 Results
6.3.1 Descriptive statistics
The questionnaire was administered on 38/39 farms that performed the ivermectin
drench check (97% response rate); 20 questionnaires were administered in the first year
of the study (2010), while 18 questionnaires were administered in the second year of the
study (2011).
6.3.1.1 Farm demographics
Of the 38 farms surveyed, 29%, 26%, 34%, and 11% had flock sizes of <50
sheep, 50-99 sheep, 100-300 sheep, and >300 sheep, respectively. The sheep grazed a
mean of 51 acres (range from 3 to 310 acres). Most of the producers kept sheep for meat
purposes (31/38; 82%), while 5/38 (13%) of the producers kept sheep for breeding
purposes; one farm kept sheep for training border collies, and another farm kept dairy
sheep. Only 8/38 (21%) farms had purebred sheep of one breed, while the remaining
201
30/38 (79%) farms had crosses or several different breeds. The most common breeds
were Rideau-Arcott (11 farms), Dorset (9 farms), Suffolk (7 farms) and North Country
Cheviot (6 farms). None of the farms included in the study were organic or working
towards organic status. Twenty-five (66%) flocks lambed once a year and, of these, 19
(76%) lambed in the spring, 5 (20%) lambed in the winter, and 1 (4%) lambed in the
autumn. Another 10 flocks (26%) lambed in multiple seasons, while the remaining 3
flocks (8%) lambed year-round.
Producers were asked when they took the sheep off pasture the previous grazing
season, and when they put the sheep out to graze that year. Animals were taken off
pasture in September (1/38 [3%]), October (7/38 [18%]), November (19/38 [50%]) and
December (4/38 [11%]) the previous grazing season; 1 producer did not have sheep the
previous grazing season. During the year of the study, animals were put on pasture in
April (4/38 [11%]), May (20/38 [53%]), and June (8/38 [21%]). Six other producers kept
their sheep on pasture all year-round, including winter months with snow cover. Ewes
and lambs were put out on pasture together on most of the farms (34/38; 89%), and co-
grazed for a mean of 3.8 months (range from 1 to 7 months).
6.3.1.2 Use of anthelmintics
The producers used a mean of 2.6 (range from 1 to 6) different anthelmintic
formulations in the preceding 5 years. Of the 38 producers surveyed, 36 (95%) reported
using ivermectin drench. Other anthelmintic formulations used included: fenbendazole
drench (26/38; 68%); albendazole drench (14/38; 37%); ivermectin injectable (10/38;
26%); moxidectin pour-on (cattle product) used as a drench (5/38; 13%); levamisole
202
drench (4/38; 11%); ivermectin pour-on (cattle product) used as a drench (3/38; 8%); and
moxidectin injectable (1/38; 3%). In the preceding 12 months, producers had treated their
flock or a portion of the flock with an anthelmintic drug a mean of 2.6 times (range from
0 to 5) - this did not include the ivermectin treatment the producers administered for the
ivermectin drench check as part of this study.
The majority of producers (31/38; 82%) treated their sheep routinely, i.e. at fixed
times of the year and not based on FEC results or evidence of clinical parasitism. Ewes
were treated routinely a mean of 2.1 times/year (range from 1 to 4), rams were treated
routinely a mean of 1.3 times/year (range from 0 to 4), while lambs were treated routinely
a mean of 0.9 times/year (range from 0 to 4). Of those producers that treated their sheep
routinely, 17/31 (55%) treated ewes at lambing regardless of season; 15/31 (48%) treated
ewes at housing during the autumn, 13/31 (34%) treated the flock before turnout on
pasture – separate from a lambing-time treatment, 12/31 (32%) treated the flock at some
point during the grazing season, 3/31 (8%) treated adults at breeding, 2/31 (5%) treated
lambs at weaning, and 2/31 (5%) treated the adults at shearing.
Thirty-two farms (85%) used targeted and/or targeted selective treatment.
Specifically, targeted treatment (i.e. treatment of the whole group when GIN infection
was suspected) was performed on 9/38 (24%) of the farms, while targeted selective
treatment (i.e. treatment of individual sheep when GIN infection was suspected) was
performed on 11/38 (29%) of the farms; 12/38 (32%) used both targeted and targeted
selective treatment. To determine which animals to treat using either targeted or targeted
selective treatment, 15/32 (47%) producers relied on clinical signs (such as bottle-jaw,
poor body condition score, weight loss and diarrhea), 3/32 (9%) producers took fecal
203
samples for analysis to determine the FECs, while 1/32 (3%) producer used the
FAMACHA® score; 7/32 (22%) producers used both clinical signs and FECs, 1/32 (3%)
used both FAMACHA® and clinical signs, while 5/32 (16%) used clinical signs, FECs
and FAMACHA®.
Thirty producers (79%) used a drench gun to administer the anthelmintic drench,
while 8/38 (21%) producers never used a drench gun, preferring to administer the drench
using a syringe. Of those producers that used a drench gun, 17/30 (57%) never calibrated
the drench gun, while 1/30 (3%) and 2/30 (7%) checked it once or twice a year,
respectively. In contrast, 10/30 (33%) producers calibrated the drench gun before each
use.
When asked how they determined an animal’s weight before calculating the dose
of anthelmintic, 17/38 (45%) producers estimated the weight by ‘eye-balling’ the animal,
4/38 (11%) used the expected breed average, 6/38 (16%) weighed some of the sheep and
used the average weight, 6/38 (16%) weighed the larger animals, and dosed according to
the heaviest weight, and 5/38 (13%) weighed each animal and calculated the dose
accordingly.
6.3.1.3 Quarantine strategies for new animal introductions
More than half of the farms (25/38; 66%) had brought in new animals (i.e. sheep,
goats, llamas and/or alpacas, but not cattle or other livestock) in the previous 12 months.
Of these 25 farms, 8 farms (32%) kept the animals off pasture for an average of 46 days
and treated the animals with an anthelmintic while in quarantine, 6 farms (24%) kept the
animals off pasture for an average of 30 days, 4 farms (16%) treated the animals with an
204
anthelmintic upon arrival but put them on pasture or with the rest of the flock
immediately, and 7 farms (28%) did not have any quarantine strategies. On those 14
farms that kept the animals in quarantine, the animals were kept off pasture for a mean of
34 days (range from 7 to 180 days). Of those 12 farms that treated the new animals with
an anthelmintic, 7 (58%) used ivermectin drench, 2 (17%) used albendazole drench, 2
(17%) used fenbendazole drench, and 1 (8%) used moxidectin cattle pour-on as drench.
Most of the producers that had brought in new animals (20/25; 80%) said that the newly
acquired animals were eventually turned onto pastures that had been grazed by sheep in
the previous 12 months.
6.3.1.4 Pasture management and alternative (non-anthelmintic) strategies for
parasite control
A few farms practiced pasture management strategies for the control of parasites.
Crop rotation (i.e. the field is used for hay or cultivation of another crop one year, and for
grazing purposes the following year) was practiced on 9/38 (24%) farms, while 6/38
(16%) farms rested their pasture in fallow for a year or longer. Mixed-species co-grazing
was practiced on 9/38 (24%) farms; sheep were grazed with cattle (5/9 farms) and horses
(4/9 farms). Rotational grazing with other species was practiced on 8/38 (21%) farms;
most of these farms had cattle (7/8 farms), while the other farm had horses.
Seven producers (18%) reported using alternative methods for the control of GIN;
5/7 (71%) used diatomaceous earth, 1/7 (14%) used diatomaceous earth and bentonite
clay, while 1/7 (14%) culled the more susceptible animals based on repeated high FECs.
205
6.3.1.5 Manure disposal
Approximately one-third of the farms (15/38; 39%) reported spreading sheep
manure in the previous 12 months on pastures currently grazed by sheep. On these 15
farms, the manure was stored for a mean of 7.2 months (range from 0 to 24 months)
before being spread on pasture, and the manure was spread sometime between February
and November. Potential for manure run-off spreading into grazed pastures was reported
on 15/38 (39%) farms, and 23/38 (61%) farms reported that sheep had access to the
manure pile.
6.3.1.6 Suspicion of anthelmintic resistance
More than half of the farms (21/38; 55%) reported that they suspected AR was
present on their farm prior to the study, and this had been suspected for a mean of 25
months (range from 3 to 108 months). Of these 21 farms, 16 (76%) suspected AR
because there was no improvement in clinical signs after anthelmintic treatment; 5 (24%)
suspected AR because FECs were still high after treatment. When asked whether they
suspected resistance to a specific drug, 14/21 (67%) producers suspected resistance to
ivermectin, 2/21 (10%) producers suspected resistance to benzimidazoles, 3/21 (14%)
suspected resistance to both ivermectin and benzimidazoles, and 2/21 (10%) did not
suspect resistance to a specific drug.
206
6.3.2 Analytical statistics
6.3.2.1 Ivermectin Fecal Egg Count Reduction
The median FECR following treatment with ivermectin for the FECRT was
46.6%, with a range from -157.4% to 96.5% (negative FECR values indicate that the FEC
increased after treatment) (Falzon et al., in press). Ten variables were significantly
associated with the FECR following ivermectin treatment at a p-value ≤0.20. However,
after testing for collinearity, “suspicion of anthelmintic resistance” showed
multicollinearity (Pearson correlation coefficient >0.8) with both “suspicion of
anthelmintic resistance based on high fecal egg counts after treatment” and “suspicion of
anthelmintic resistance based on no improvement of clinical signs after treatment”.
Therefore, only the variable “suspicion of anthelmintic resistance” was retained for
multivariable modeling since it was based on the most observations, an important
consideration for modeling.
Table 6.1 presents the explanatory variables that had associations with FECR with
p-values ≤0.20. For the categorical variables, the difference in median FECR percentages
expresses the median of all differences when subtracting the FECR of the second-
mentioned category from the FECR of the first-mentioned category, for each explanatory
variable. A positive median of differences indicates that the median FECR% was
higher in farms within the first mentioned category, and therefore there was less
resistance on farms in the first-mentioned category compared to farms within the second-
mentioned category. For example, with a median difference of 54%, farmers who did not
use levamisole had a 54% higher FECR%, on average, than farmers who did use
207
levamisole, indicating less resistance on farms not using levamisole. Conversely, a
negative median of differences indicates that the FECR% was lower in farms within the
first mentioned category and therefore there was more resistance on farms in the first
category compared to farms in the second category. For example, with a median of
differences of -22%, flocks that were not treated with an anthelmintic during quarantine
had a 22% lower FECR percentage, on average, than flocks that were treated during
quarantine, indicating more resistance among flocks that were not treated with an
anthelmintic during quarantine. None of the explanatory variables were statistically
significant in the final model (i.e. p ≤0.05).
6.3.2.2 Fenbendazole Fecal Egg Count Reduction
The median FECR following treatment with fenbendazole was 57.8%, with a
range from -366.4% to 97.3% (Falzon et al., in press). Three explanatory variables had p-
values ≤0.20 in univariable associations with FECR following fenbendazole treatment
(Table 6.2) and none of these variables showed multicollinearity. In model-building, only
‘previous use of benzimidazoles’ remained significant (p ≤0.05) in the final model, and
there were no significant interactions, therefore no final model is presented. The median
difference in FECR percentage after fenbendazole treatment was 45%, indicating that
sheep flocks that had not used benzimidazoles prior to the study had 45% higher FECR
percentages, on average, than flocks that had used benzimidazoles, therefore indicating
less resistance among non-benzimidazole users.
208
6.3.3.3 Levamisole Fecal Egg Count Reduction
The median FECR following treatment with levamisole was 100%, with a range
from 93.1% to 100% (Falzon et al., in press). We have not reported the univariable
associations with levamisole FECR, since statistically significant differences were only
associated with very small changes in the FECR, which were of limited biological
significance because FECR percentages in both groups were still above the 95% cut-off
for determining AR. For instance, whether the producer treated or did not treat sheep with
an anthelmintic during quarantine was statistically significant (p=0.046), however, the
difference in the medians of the FECRs was only 2.52, indicating that farms that did not
treat animals with an anthelmintic during quarantine had a median FECR of 99.9% vs. a
median FECR of 97.4% on farms that treated animals with an anthelmintic during
quarantine.
6.4 Discussion
6.4.1 Descriptive statistics
The majority of the producers enrolled in this study had used ivermectin drench
and fenbendazole drench in the previous 5 years (95% and 68%, respectively). In a
complementary study to determine the frequency of anthelmintic resistance in the same
sheep flocks, a high frequency of ivermectin and fenbendazole resistance (97% and 95%
of the farms tested, respectively) was reported (Falzon et al., in press). Since most
producers in Ontario have relied heavily on these two anthelmintics over the previous
five years, this is likely to have been a major driver for the development of resistance to
these two drugs.

209
While the frequency of treatment may increase the selection pressure for
resistance, other epidemiological factors, such as timing of treatment, and which animals
are treated, are also important contributors to the selection pressure for AR (Sutherland
and Scott, 2010). Kettle et al. (1982) described treating mature sheep as an important
contributor to the selection pressure for AR, and a study by Leathwick et al. (2006)
showed that treating ewes at lambing may increase the risk of development of AR.
Untreated ewes may harbour large parasite populations, and are therefore considered an
important source of parasites in refugia (Sutherland and Scott, 2010). Refugia has been
recognized as one of the most important concepts in selection for AR (Van Wyk, 2001),
and relates to preserving susceptible worms on the farm, either within untreated hosts or
as free-living parasites on pasture (Kenyon et al., 2009). In our study, the overall mean
frequency of anthelmintic treatment was 2.6 times per year, which is relatively low
compared to other countries such as New Zealand, where producers treat at least five to
six times per year (Leathwick, personal communication). In our study, however, the ewes
underwent routine treatment a mean of 2.1 times per year (range from 1 to 4 times per
year), and more than half of the producers treated the ewes at lambing time (17/31
[55%]). The common practice of treating adult ewes at lambing at the beginning of the
grazing season may therefore be an important contributor to the development of
resistance in Ontario sheep flocks, as it removes the susceptible parasites in refugia
within the ewe. Therefore, any resistant worms surviving treatment have a selective
advantage, leading to an increased proportion of resistant parasite eggs shed by the ewe.
Moreover, a study conducted recently by Falzon et al. (unpublished data) found that,
while Teladorsagia sp. and Trichostrongylus spp. may survive on pasture over the winter,
210
few Haemonchus sp. larvae can overwinter in pasture on Ontario sheep farms, resulting
in a scarce number of Haemonchus sp. in refugia on pasture at the beginning of the
grazing season (Chapter 3). Therefore, any resistant Haemonchus sp. eggs that are shed
into the environment may accelerate the development of resistance in that species, as they
constitute the majority of parasites on pasture. However, neither “spring lambing” nor
“treatment of ewes at lambing” were significantly associated with any of the outcomes
investigated in this study. This may be a result of the limited variability in the outcome
(i.e. ivermectin and fenbendazole resistance), and should be investigated further.
Targeted and targeted selective treatments are practical applications of the refugia
theory. The latter is based on the notion that, while the majority of the parasite population
is found on pasture, within a sheep flock, parasites are typically over-dispersed, with the
majority of parasites harboured within a small proportion of the flock (Morgan et al.,
2005). Therefore, treating only those animals that require treatment should reduce the
selection pressure at the farm level for resistant parasites, while maintaining adequate
production levels (Cabaret et al., 2009). A majority of the producers interviewed in our
study reported using either targeted (whole flock treatment when GIN parasitism is
suspected), or targeted selective (selected individual treatment when GIN parasitism is
suspected) treatment (55% and 61%, respectively). However, these targeted treatment
approaches were carried out in addition to, rather than in lieu of, producers’ routine
deworming practices (i.e. whole-flock treatment at fixed times regardless of whether the
animals showed signs of parasitism or not). Producers were not using targeted or
selective treatment to reduce the number of treatments administered, but rather as a

211
means to avert possible treatment failure, when signs of parasitism emerged despite
routine treatment.
Quarantine strategies need to be implemented to avoid introducing resistant
parasites onto a farm (Dobson et al., 2001), and have been described in several practical
guidelines for producers (Abbott et al., 2009; Love, 2010; Menzies, 2012). Nevertheless,
in our survey, almost a third of the producers that brought in new livestock onto their
farm (7/25; 28%) did not practice any quarantine strategies. Moreover, most producers
that treated animals when they arrived on the farm only used one anthelmintic, which
often was the same drug in current use for the rest of the flock (ivermectin [7/12; 58%] or
benzimidazoles [4/12; 34%]). Coles (2010) suggests that using only one anthelmintic
may be an inappropriate quarantine treatment, as this allows any parasites resistant to that
anthelmintic to survive treatment. The general recommendation is to treat animals in
quarantine sequentially with different anthelmintic drug classes (Sargison, 2011), thus
avoiding the introduction of resistant parasites from these animals to the rest of the flock.
This is especially relevant in light of the high frequency of ivermectin and fenbendazole
resistance observed on the farms in this study. These results therefore highlight the
importance of educating producers on correct quarantine strategies to prevent importation
of resistant parasites onto their farms.
Different grazing management strategies, such as crop rotation, resting pastures
and mixed-species grazing, have been described as alternative approaches to control
GINs by reducing the numbers of infective larvae on pasture (Jackson and Miller, 2006).
However, while many in our study anecdotally reported the benefits of these approaches,
less than half of the producers employed them on their farm. During the interview, the
212
producers highlighted the difficulties associated with these strategies, such as the lack of
land availability and added complexities in management (data not shown). Other studies
have similarly described the practicality of implementation as an obstacle to the adoption
of similar management approaches (Jackson and Miller, 2006; Besier, 2012).
6.4.2 Ivermectin and Fenbendazole reduction in the Fecal Egg Count Reduction Test
No predictor variables were statistically significant in the final model for
ivermectin FECR which may be a result of the small sample size used in this study,
limiting statistical power to detect differences between groups, or because of the limited
variability in the outcome (i.e. all farms, except one, had ivermectin resistance [i.e. FECR
<95% following ivermectin treatment]) . Nonetheless, several variables had a p-value
≤0.20 (Table 6.1), and should be investigated further for their potential association with
FECR following ivermectin treatment.
Producers that reported previous use of benzimidazoles in their sheep flock had
higher levels of fenbendazole resistance, as the median FECR following fenbendazole
treatment was 45% lower in sheep flocks that had used a benzimidazole prior to the
study, compared to the median FECR in flocks that had not used benzimidazoles.
Exposure to a certain drug class kills the susceptible parasites while conferring a selective
advantage to the resistant parasites (Sargison, 2011). If the same drug is used repeatedly,
the resistant parasites will accumulate on pasture, eventually reaching the critical
threshold for a reduction in drug efficacy (Kaplan and Vidyashankar, 2012). It is
therefore not surprising that more fenbendazole resistance was observed on those farms
that had used the drug prior to the study. However, a similar finding was not associated
213
with ivermectin. This may be a result of the limited variability in the predictor variable
“use of ivermectin drench”, since all producers that were surveyed in the study and
performed the ivermectin FECRT reported using ivermectin drench on their farm prior to
the study. In contrast, 16/20 (80%) producers that conducted a FECRT for benzimidazole
resistance reported use of a benzimidazole product on their farm prior to the study.
6.4.3 Study limitations and future research
Since the majority of the farms surveyed in this study had AR, we used the FECR
as our outcome, to determine whether certain management practices were associated with
a lower FECR percentage, indicative of lower drug efficacy. However, the FECR
percentages are subject to a wide variability (Vidyashankar et al., 2012), and therefore
one must be cautious when interpreting the relevance of any changes in the FECR
percentages.
Although the intent was to randomly sample flocks from those willing to
participate in the study, volunteer numbers were so low that we enrolled all eligible
flocks which volunteered, and this might have introduced a bias towards those flocks that
thought AR was a problem on their farm. While we recognize that the non-random
sample population might limit the external validity of this study, a comparison of the
study flocks with flocks across Ontario (Ontario Sheep Industry Survey, 2009) found a
similarity in flock sizes. Moreover, the majority of sheep flocks in Ontario are kept for
meat purposes, with only approximately 50 dairy flocks, and the most commonly
registered sheep breed is the Rideau, followed by Dorset and Suffolk (Menzies, personal
214
communication); this information suggests that the demographics of our study population
is representative of the Ontario sheep flock.
Further research is required to identify evidence-based recommendations for
protective management practices to reduce the incidence of AR. Current
recommendations for managing AR are based on evidence regarding key processes
involved in the selection for resistance (Dobson et al., 2001) or individual observational
studies (Suter et al., 2004; Lawrence et al., 2006; Hughes et al., 2007; Calvete et al.,
2012). While individual observational studies allow for the evaluation of multiple, and
often complex, risk factors (Dohoo et al., 2009), they often require additional
observational studies in other populations and locations, or randomized clinical trials, in
order to produce enough evidence to warrant changes in recommendations (McGovern et
al., 2001). In recent years, a number of clinical trials have been performed to investigate
the effect of certain putative risk factors for AR (Leathwick et al., 2006; Leathwick et al.,
2008; Waghorn et al., 2008; Waghorn et al., 2009). A systematic review and meta-
analysis on risk factors for AR should be carried out to identify management practices
associated with AR. This type of study provides the most substantive clinical evidence
(Sargeant et al., 2006) and allows for the evaluation of several risk factors and synthesis
of all current research. In turn, this information would enable development of better
recommendations for the control of parasites.
6.5 Conclusion
In this study, both ivermectin and fenbendazole drench were the anthelmintics
used most frequently on Ontario sheep farms, consistent with previous findings of high

215
levels of resistance to both these drugs on these farms. Quarantine strategies were poorly
implemented on many of the farms surveyed. Targeted or targeted selective treatment
was often used in conjunction with routine treatment. Few producers practiced pasture
management strategies as a means to control parasites on their farms. Although
univariable analyses identified several marginally significant risk factors for ivermectin
resistance (0.10<p>0.05), no variables were significant in the final model. However, the
prior use of benzimidazoles was associated with increased resistance (lower FECR
percentages) to fenbendazole. Levamisole resistance could not be modeled due to the
very low levels of resistance on the farms surveyed.
6.6 Acknowledgements
This project was supported by the Ontario Ministry of Agriculture, Food and
Rural Affairs - University of Guelph Agreement, through the Animal Health Strategic
Investment fund managed by the Animal Health Laboratory of the University of Guelph,
with additional support from the University of Guelph for summer student positions, and
in-kind assistance from Merial, Canada. The authors are very grateful to William Sears
for statistical advice. We especially acknowledge the sheep producers that participated in
the study.
Conflict of interest
The authors declare no conflict of interest.

216
6.7 References
Abbott, K.A., Taylor, M.A., Stubbings, L.A., 2009. Sustainable worm control strategies
for sheep. 3rd
Ed. A technical manual for veterinary surgeons and advisers. 51pp.
Published by: Sustainable Control of Parasites in Sheep (SCOPS) and printed by:
Context Publications. Available from: www.nationalsheep.org.uk.
Besier, R.B., 2012. Refugia-based strategies for sustainable worm control: Factors
affecting the acceptability to sheep and goat owners. Vet. Parasitol. 186, 2-9.
Cabaret, J., Benoit, M., Laignel, G., Nicourt, C., 2009. Current management of farms and
internal parasites by conventional and organic meat sheep French farmers and
acceptance of targeted selective treatments. Vet. Parasitol. 164, 21-29.
Calvete, C., Calavia, R., Ferrer, L.M., Ramos, J.J., Lacasta, D., Uriarte, J., 2012.
Management and environmental factors related to benzimidazole resistance in
sheep nematodes in Northeast Spain. Vet. Parasitol. 184, 193-203.
Coles, G.C., 2001. The future of veterinary parasitology. Vet. Parasitol. 98, 31-39.
Coles, G.C., 2010. Sustainable use of anthelmintics in grazing animals. Vet. Rec. 151,
165-169.
Coles, G.C., Bauer, C., Borgsteede, F.H.M., Geerts, S., Klei, T.R., Taylor, M.A., Waller,
P.J., 1992. World Association for the Advancement of Veterinary Parasitology
(W.A.A.V.P.) methods for the detection of anthelmintic resistance in nematodes of
veterinary importance. Vet. Parasitol. 44, 35-44.
Dobson, R.J., Besier, R.B., Barnes, E.H., Love, S.C.J., Vizard, A., Bell, K., Le Jambre,
L.F., 2001. Principles for the use of macrocyclic lactones to minimise selection for
resistance. Aust. Vet. J. 79, 756-761.
Dohoo, I., Martin, W., Stryhn, H., 2009. Veterinary Epidemiologic Research. 2nd Ed.
VER Inc., Prince Edward Island, Canada, C1A 8X5. pp. 365-390.
Falzon, L.C., Menzies, P.I., Shakya, K.P., Jones-Bitton, A., Vanleeuwen, J., Avula, J.,
Stewart, H., Jansen, J.T., Taylor, M.A., Learmount, J., Peregrine, A.S., (in press).
Anthelmintic resistance in sheep flocks in Ontario, Canada.Vet. Parasitol.
Hughes, P.L., Dowling, A.F., Callinan, A.P.L., 2007. Resistance to macrocyclic lactone
anthelmintics and associated risk factors on sheep farms in the lower North Island
of New Zealand. N. Z. Vet. J. 55, 177-183.
Jackson, F., Miller, J., 2006. Alternative approaches to control – Quo vadit? Vet.
Parasitol. 139, 371-384.
Kaplan, R.M., Vidyashankar, A.N., 2012. An inconvenient truth: Global worming and
anthelmintic resistance. Vet. Parasitol. 186, 70-78.

217
Kenyon, F., Greer, A.W., Coles, G.C., Cringoli, G., Papadopoulos, E., Cabaret, J.,
Berrag, B., Varady, M., Van Wyk, J.A., Thomas, E., Vercruysse, J., Jackson, F.,
2009. The role of targeted selective treatments in the development of refugia-based
approaches to the control of gastrointestinal nematodes of small ruminants. Vet.
Parasitol. 164, 3-11.
Kenyon, F., Jackson, F., 2012. Targeted flock/herd and individual ruminant treatment
approaches. Vet. Parasitol. 186, 10-17.
Kettle, P.R., Vlassoff, A., Ayling, J.M., McMurtry, L.W., Smith, S.J., Watson, A.J.,
1982. A survey of nematode control measures used by sheep farmers and of
anthelmintic resistance on their farms Part 2: South Island excluding the Nelson
region. N. Z. Vet. J. 30, 79-81.
Knox, M.R., Besier, R.B., Le Jambre, L.F., Kaplan, R.M., Torres-Acosta, J.F.J., Miller,
J., Sutherland, I., 2012. Novel approaches for the control of helminth parasites of
livestock VI: Summary of discussions and conclusions. Vet. Parasitol. 186, 143-
149.
Lawrence, K.E., Rhodes, A.P., Jackson, R., Leathwick, D.M., Heuer, C., Pomroy, W.E.,
West, D.M., Waghorn, T.S., Moffat, J.R., 2006. Farm management practices
associated with macrocyclic lactone resistance on sheep farms in New Zealand. N.
Z. Vet. J. 54, 283-288.
Leathwick, D.M., Vlassoff, A., Barlow, N.D., 1995. A model for nematodiasis in New
Zealand lambs: the effect of drenching regime and grazing management on the
development of anthelmintic resistance. Int. J. Parasitol. 25, 1479-1490.
Leathwick, D.M., Miller, C.M., Atkinson, D.S., Haack, N.A., Alexander, R.A., Oliver, A-
M., Waghorn, T.S., Potter, J.F., Sutherland, I.A., 2006. Drenching adult ewes:
Implications of anthelmintic treatments pre- and post-lambing on the development
of anthelmintic resistance. N. Z. Vet. J. 54, 297-304.
Leathwick, D.M., Miller, C.M., Atkinson, D.S., Haack, N.A., Waghorn, T.S., Oliver, A-
M., 2008. Managing anthelmintic resistance: Untreated adult ewes as a source of
unselected parasites, and their role in reducing parasite populations. N. Z. Vet. J.
56, 184-195.
Love, S., 2010. Wormkill – the Basics. Available at:
http://www.dpi.nsw.gov.au/__data/assets/pdf_file/0007/365956/WormKill-the-
basics.pdf
[Accessed: 2nd
July, 2012]
McGovern, D.P.B., Valori, R.M., Summerskill, W.S.M., Levi, M., 2001. Hierarchy of
evidence. In: Evidence-based medicine, BIOS Scientific Publishers, Texas, USA.
pp. 14-17.
218
Menzies, P., 2012. Handbook for the control of internal parasites of sheep. Available
from:
http://www.uoguelph.ca/~pmenzies/PDF/Handbook_Control_Internal_Parasites_Sh
eep_PMenzies.pdf [Accessed: 2nd July, 2012]
Miller, C.M., Waghorn, T.S., Leathwick, D.M., Candy, P.M., Oliver, A-M.B., Watson,
T.G., 2012. The production cost of anthelmintic resistance in lambs. Vet. Parasitol.
186, 376-381.
Morgan, E.R., Cavill, L., Curry, G.E., Wood, R.M., Mitchell, E.S.E., 2005. Effects of
aggregation and sample size on composite faecal egg counts in sheep. Vet.
Parasitol. 131, 70-87.
Morgan, E.R., Coles, G.C., 2010. Nematode control practices on sheep farms following
an information campaign aiming to delay anthelmintic resistance. Vet. Rec. 166,
301-303.
Sargeant, J.M., Rajic, A., Read, S., Ohlsson, A., 2006. The process of systematic review
and its application in agri-food public health. Prev. Vet. Med. 75, 141-151.
Sargison, N., 2011. Responsible use of anthelmintics for nematode control in sheep and
cattle. In Practice 33, 318-327.
Scott, P.R., 2007. Sheep Medicine. Manson Publishing Ltd, London, UK. pp. 297-315.
Statistics Canada, 2012. Available at:
http://www.statcan.gc.ca/tables-tableaux/sum-som/l01/cst01/prim52g-eng.htm
[Accessed: 7th August, 2012]
Suter, R.J., Besier, R.B., Perkins, N.R., Robertson, I.D., Chapman, 2004. Sheep-farm risk
factors for ivermectin resistance in Ostertagia circumcincta in Western Australia.
Prev. Vet. Med. 63, 257-269.
Sutherland, I., Scott, I., 2010. Gastrointestinal nematodes of sheep and cattle. Biology
and control. John Wiley and Sons Ltd, West Sussex, UK. pp. 1-60.
Taylor, M.A., 2012. SCOPS and COWS – ‘Worming it out of UK farmers’. Vet.
Parasitol. 186, 65-69.
Van Wyk, J.A., 2001. Refugia – overlooked as perhaps the most potent factor concerning
the development of anthelmintic resistance. Onderstepoort J. Vet. 68, 55-67.
Vidyashankar, A.N., Handlon, B.M., Kaplan, R.M., 2012. Statistical and biological
considerations in evaluating drug efficacy in equine strongyle parasites using fecal
egg count data. Vet. Parasitol. 185, 45-56.
Waghorn, T.S., Leathwick, D.M., Miller, C.M., Atkinson, D.S., 2008. Brave or gullible:
Testing the concept that leaving susceptible parasites in refugia will slow the
development of anthelmintic resistance. N. Z. Vet. J. 56, 158-163.

219
Waghorn, T.S., Miller, C.M., Oliver, A-M.B., Leathwick, D.M., 2009. Drench-and-shift
is a high risk practice in the absence of refugia. N. Z. Vet. J. 57, 359-363.
Woodgate, R.G., Love, S., 2012. WormKill to WormBoss – Can we sell sustainable
sheep worm control? Vet. Parasitol. 186, 51-57.
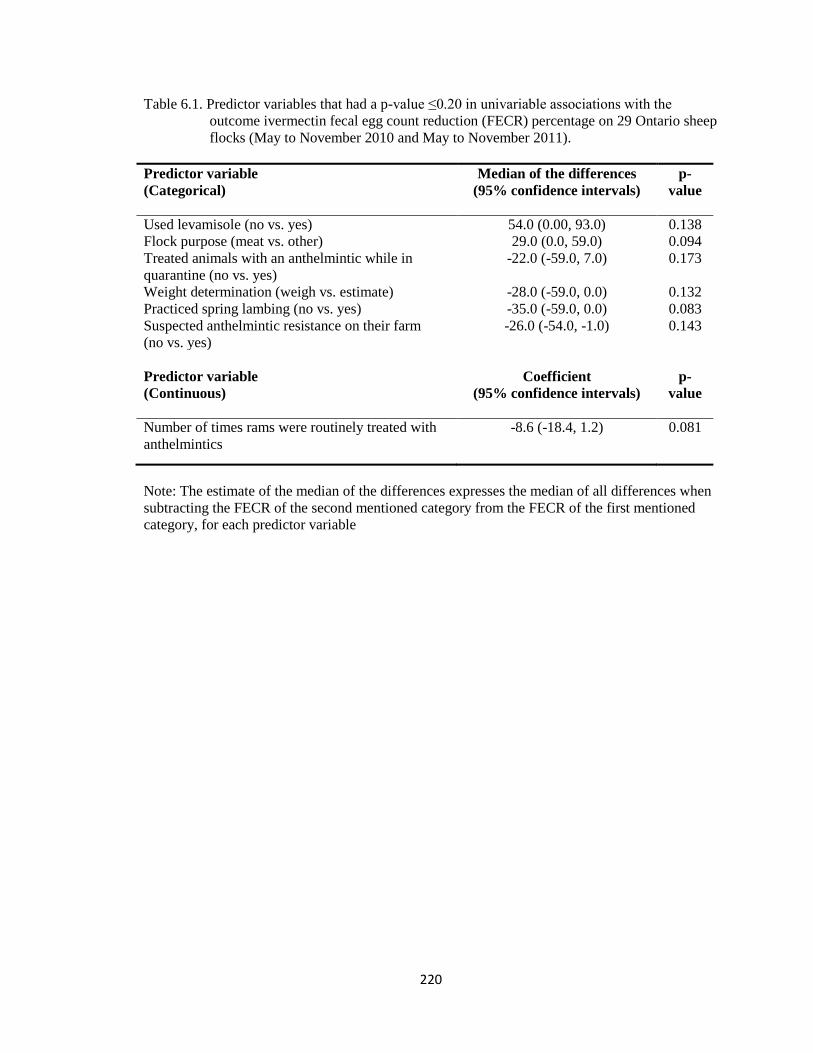
220
Table 6.1. Predictor variables that had a p-value ≤0.20 in univariable associations with the
outcome ivermectin fecal egg count reduction (FECR) percentage on 29 Ontario sheep
flocks (May to November 2010 and May to November 2011).
Predictor variable
(Categorical)
Median of the differences
(95% confidence intervals)
p-
value
Used levamisole (no vs. yes) 54.0 (0.00, 93.0) 0.138
Flock purpose (meat vs. other) 29.0 (0.0, 59.0) 0.094
Treated animals with an anthelmintic while in
quarantine (no vs. yes)
-22.0 (-59.0, 7.0) 0.173
Weight determination (weigh vs. estimate) -28.0 (-59.0, 0.0) 0.132
Practiced spring lambing (no vs. yes) -35.0 (-59.0, 0.0) 0.083
Suspected anthelmintic resistance on their farm
(no vs. yes)
-26.0 (-54.0, -1.0) 0.143
Predictor variable
(Continuous)
Coefficient
(95% confidence intervals)
p-
value
Number of times rams were routinely treated with
anthelmintics
-8.6 (-18.4, 1.2) 0.081
Note: The estimate of the median of the differences expresses the median of all differences when
subtracting the FECR of the second mentioned category from the FECR of the first mentioned
category, for each predictor variable
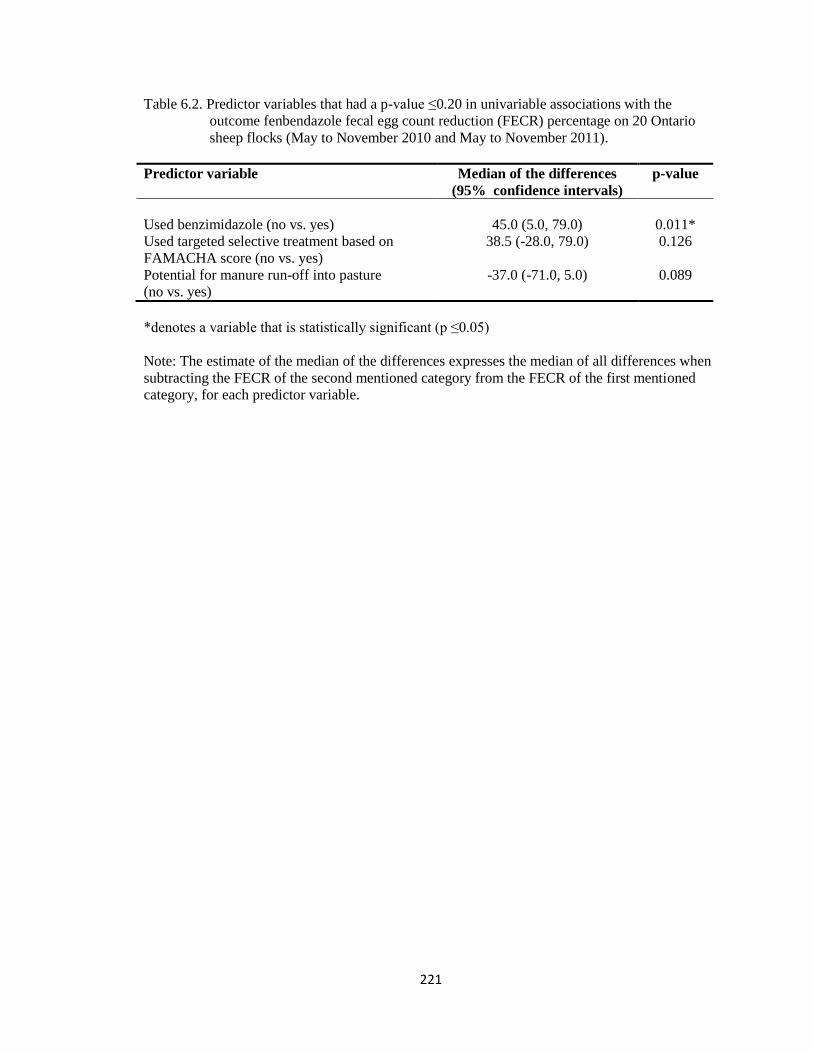
221
Table 6.2. Predictor variables that had a p-value ≤0.20 in univariable associations with the
outcome fenbendazole fecal egg count reduction (FECR) percentage on 20 Ontario
sheep flocks (May to November 2010 and May to November 2011).
Predictor variable Median of the differences
(95% confidence intervals)
p-value
Used benzimidazole (no vs. yes)
45.0 (5.0, 79.0)
0.011*
Used targeted selective treatment based on
FAMACHA score (no vs. yes)
38.5 (-28.0, 79.0) 0.126
Potential for manure run-off into pasture
(no vs. yes)
-37.0 (-71.0, 5.0) 0.089
*denotes a variable that is statistically significant (p ≤0.05)
Note: The estimate of the median of the differences expresses the median of all differences when
subtracting the FECR of the second mentioned category from the FECR of the first mentioned
category, for each predictor variable.
222
CHAPTER 7
General discussion, study limitations and recommendations for future research
The sheep industry in Ontario is currently burgeoning, as the increased demand
for both lamb and mutton meat has created a real opportunity for flock expansion. To
ensure that sheep producers can meet this demand, it is important to identify and
investigate the major causes of losses in their sheep flocks and address these issues
appropriately.
Gastro-intestinal nematodes (GINs) have long been recognized as one of the most
important production-limiting diseases for grazing sheep worldwide, including Canada
(Pullin, 1961). While GIN parasitism has traditionally been controlled with the use of
broad-spectrum anthelmintics, the emergence of anthelmintic resistance (AR) in many
sheep-rearing countries has underscored the importance of providing and promoting more
specific and sustainable recommendations for GIN control on Ontario sheep farms. This
can be achieved by improving our understanding of the epidemiology of these parasites.
Recent research conducted in Ontario and Quebec sheep flocks has provided
important baseline information on the epidemiology and distribution of GIN parasites in
these areas (Mederos, 2010). However, it also highlighted important areas for further
research, including the periparturient egg rise (PPER), overwintering of parasites on
pasture, and the frequency of AR in Ontario sheep flocks. Consequently, the main goal of
this thesis was to investigate these important epidemiological factors associated with GIN
parasitism.
223
The PPER is described as one of the major sources of GIN pasture contamination,
and the study described in Chapter 2 was conducted to improve our knowledge of the
distribution and determinants of the PPER in Ontario sheep flocks that practice out-of-
season lambing. This was carried out by following six Ontario sheep flocks that practiced
out-of-season lambing, over three lambing seasons (winter-spring-autumn). Twenty
pregnant ewes and 20 unbred/early gestation ewes were selected on each farm, for each
lambing season, and both fecal and blood samples were collected from these 40 animals
at fixed time-points before, mid-way, and after lambing. The samples were then
processed to estimate GIN Fecal Egg Counts (FECs), blood Total Plasma Protein (TPP)
and blood Packed Cell Volume (PCV); data were then analyzed to investigate differences
between ewes in different production stages.
Overall, the FECs were significantly higher in the autumn, compared to the winter
and spring lambing season. While a PPER was observed during all three lambing seasons
evaluated in this study, the magnitude and distribution of maximum fecal egg shedding
for each production stage varied between lambing seasons. In both the winter and spring,
ewes that were unbred or in early gestation did not experience a rise in fecal egg
shedding, in contrast to ewes that were in late gestation, in which the FEC increased and
remained elevated during early lactation. By contrast, ewes lambing in the autumn
experienced a rise in fecal egg shedding over the gestation period, which peaked at late
gestation and then decreased. In the animals enrolled in this study, both TPP and PCV
were associated with parasite FECs, though this association varied between production
stages and lambing seasons. Collectively, the findings showed that both seasonal and
animal physiological factors play an important role in determining fecal egg shedding,

224
and should be taken into consideration when making recommendations regarding targeted
treatment of periparturient ewes.
As with most long-term field studies, we encountered several difficulties while
conducting this study. Firstly, since it was a longitudinal study with repeated sampling on
the same animals, it was important to maintain the producers’ compliance, which often
proved difficult as time wore on. This was further complicated by the fact that the
producers were asked to keep animals that were in different production stages in the same
housing system (i.e. either indoors or put to graze on pasture), to allow for a fair
comparison between the different groups. Moreover, randomization was sometimes
difficult to execute, as producers could not understand why we had to run the whole flock
through a chute when we were only sampling a small proportion of the flock. All these
challenges were overcome by explaining the rationale of the study and the importance of
proper epidemiological methods to ensure internal validity of the results, and by
emphasizing the benefits to be gained by the sheep industry. Moreover, we tried to
provide the producers with timely feedback by returning the FEC results promptly and
addressing any concerns expressed.
Carrying out research on pregnant animals also had several difficulties. Firstly,
not all producers used ultrasound to diagnose pregnancy, and therefore we sometimes had
false-positive ewes, leading to a reduced sample size of the pregnant group. Secondly,
producers were sometimes reluctant to allow the researchers to work on animals that
were in late gestation/early lactation, as they feared this might cause injury, abortion or
maternal neglect. Therefore, producers would often not contact us until all animals had
lambed, and on one farm the producer did not allow us to sample the pregnant group,
225
leading to missing data for one lambing season. In another study which has not been
included in this thesis (a clinical trial to evaluate the efficacy of targeted treatment of
periparturient ewes to suppress the PPER), we tried to avert this problem by sampling the
animals at the end of the lambing season (as opposed to midway through lambing), and
by providing the producers with data collection forms with clear instructions on which
data we required. This improved overall study compliance.
The study described in the second chapter was originally designed to compare the
FECs between a group of ewes due to lamb that season, and a comparison group
comprised of ewes that were unbred. However, since all the farms practiced out-of-
season lambing, they bred their ewes approximately two months after lambing.
Therefore, there were few unbred ewes, leading to the necessity of using animals that
were bred, but were early in gestation, to act as a comparison group. Moreover, on
different farms, animals in the comparison group were often at different stages in
gestation. Therefore, to account for all this variability we decided to divide all the
animals into different productivity stages, based on sampling dates relative to lambing
dates which were provided by the producers. However, reliance on producer-collected
data might have led to some misclassification. Moreover, it also reduced the study’s
power to detect differences between certain groups, as not all producers collected the
requested data on lamb birth weights, 50-day weights etc. All these challenges were an
important eye-opener to the practical problems and limitations one encounters when
working on commercial sheep farms.
The PPER in ewes is usually described as a rise in fecal egg shedding
commencing 2-4 weeks before lambing and peaking at lambing, followed by a decrease
226
4-6 weeks later (Abbott et al., 2009). However, in our study, we did not observe the
expected decrease in fecal egg shedding after lambing, even though we collected fecal
samples up to eight weeks after lambing. The sustained high FECs eight weeks after
lambing suggests that factors other than parturition, such as the duration of lactation,
might have an important effect on the increase in fecal egg shedding, as has been shown
in recent studies by Beasley et al. (2010 and 2012). Therefore, further studies should be
conducted to determine the effect of lactation on the PPER, and when the PPER
decreases, in Ontario sheep flocks.
In the same study, forage quality data were collected and incorporated into the
data analysis. Studies have indicated that high levels of bypass protein (also referred to as
rumen-undegradable protein) may reduce fecal egg shedding during the periparturient
period (Beasley et al., 2012; Houdijk, 2012). However, since our study was
observational, we had no control over the type and quantity of nutrition offered to the
animals, which might have limited the variability of the predictor variable ‘Crude Protein
Ingested’. A clinical trial could be conducted to determine whether the administration of
different amounts of bypass protein (e.g. roasted soybeans) could have a protective effect
on the PPER. Also related to nutrition, on several occasions during presentations of the
research work, producers have asked about the potential use of bioactive forages such as
birdsfoot trefoil and sulla, considered indirect sources of bypass protein (Niezen et al.,
1998), as complementary strategies for parasite control. These plants contain an active
metabolite (condensed tannins) which has been shown to reduce fecal egg output in sheep
(Athanasiadou and Kyriazakis, 2004). However, studies need to be conducted to
determine whether these plants could be integrated within Ontario grazing pastures, the
227
palatability of the plants, and whether they can be a cost-effective measure for parasite
control.
Some studies have suggested that certain breeds of sheep are genetically more
resistant to parasites (Burke and Miller, 2002; Good et al., 2006), and therefore
experience a lower PPER. In Ontario, many producers have Rideau sheep, a breed
developed through a long-term cross-breeding program using several different breeds
(e.g. Suffolk, Finnish Landrace, East Friesen, Border Leicester) (Menzies, 2006), and
heavily selected for maternal traits such as prolificacy (Shrestha and Heaney, 2003).
However, no studies have been conducted to determine whether this breed is more
resistant to parasites, compared to other common breeds in Ontario, such as the Suffolk
or Dorset (Menzies, 2006).
Understanding the over-wintering survival of GIN free-living stages in central
Canadian climates is important as it provides information on the level of parasites present
on pasture in refugia at the beginning of the grazing season. Chapter 3 describes a study
on the over-wintering survival of free-living GIN stages, especially Haemonchus
contortus, on three Ontario sheep farms with a previous history of clinical haemonchosis.
Monthly herbage and soil samples were collected from one-acre isolated paddocks,
starting in December (after the sheep were taken off pasture), up to the following April
(before the sheep were once again put out to graze). In the spring (April/May), naïve
lambs were put out to graze on the one-acre isolated paddocks that had not yet been
grazed that season, on each of the three farms. After 28 days, the lambs were slaughtered,
and their gastro-intestinal contents were collected and analyzed for the presence of GINs.

228
Trichostrongylus spp. and Nematodirus spp. larvae were isolated from one
herbage sample collected on one farm in March; no larvae were isolated from the other
herbage samples and from any of the soil samples collected during the winter months on
any of the three farms. Teladorsagia sp., Trichostrongylus spp. and Nematodirus spp.
were isolated from the abomasal and small intestine contents of all tracer lambs, from all
three farms. In contrast, Haemonchus sp. parasites (two) were only isolated in very low
numbers in one tracer lamb, from one farm. These results suggest that very few
Haemonchus sp. larvae were able to overwinter on pasture. However, in contrast to
Haemonchus sp., other important parasite larvae such as Teladorsagia sp. and
Trichostrongylus spp., did survive on pasture during the Ontario winter, and were still
infective in the spring. The poor over-wintering survival of Haemonchus sp. documented
in this study suggests that most, if not all, Haemonchus sp. parasites survive the winter
within host sheep. This poor over-wintering survival, associated with the common
practice of treating ewes before lambing in the spring (Chapter 6), could explain why AR
has emerged as a significant problem in Haemonchus sp. (Chapter 4) on multiple Ontario
sheep farms.
Since the overwintering of Haemonchus sp. larvae on pasture proved to be an
extreme observation (i.e. only two adult worms in one tracer lamb, on one farm), and the
study was very expensive and time-consuming, we decided not to repeat the study the
following year as we agreed that an additional year would not likely change the study
results significantly. While we recognize that one year is suggestive but not conclusive,
we considered this study as a pilot project that could serve to inform future studies.
Ideally, a long-term project involving a larger number of farms in Ontario should be
229
conducted. Environmental data-loggers could be set up on farms from all 11 Ontario
Sheep Marketing Agency districts, and pasture and soil samples could be collected in
November/December, when the sheep are taken off pasture, and once again in the spring
before the animals are put on pasture again. These data, collected over several years,
could be mapped out to indicate whether there are any observable trends in the number
and type of parasites, and whether there is a correlation with the environmental data, in
the different districts. However, one must also be aware of the limitations of the
diagnostic methods (e.g. pasture sampling techniques) and confounding effects (e.g. the
farm topography and stocking density) when conducting such long-term studies, as these
will inevitably influence interpretation of the results.
Anthelmintic resistance has been reported in most sheep-rearing countries
worldwide, and in some areas is now threatening the viability of the sheep industry. Thus,
it is important to improve our understanding of the current AR status in Ontario sheep
flocks and mitigate the risks associated with widespread AR. Chapter 4 describes a study
that evaluated the frequency of ivermectin drench failure and AR in Ontario sheep flocks.
Forty-seven sheep flocks were enrolled over two grazing seasons, and the FECs were
monitored monthly starting in May of each year. Once the mean FEC reached a set
threshold of 200 eggs per gram (epg), ivermectin was sent to each producer for an
ivermectin drench check. If ivermectin drench failure was reported (i.e. Fecal Egg Count
Reduction [FECR] <95% 14 days after ivermectin treatment), a Fecal Egg Count
Reduction Test (FECRT) was conducted to determine if there was resistance to
ivermectin and, if a sufficient number of animals was available, fenbendazole and
levamisole. Larval cultures were conducted on pooled post-treatment FECRT samples to

230
identify resistant GIN genera. Larval Development Assays (LDAs) to assess
thiabendazole and levamisole susceptibility were conducted on pooled owner-acquired
fecal samples collected during the grazing season when the mean FECs reached the set
threshold of 200 epg.
On the basis of the FECRT, the field study indicated that resistance to ivermectin
and fenbendazole was common in GINs on Ontario sheep farms. In contrast, levamisole
was effective on almost all of the farms tested. Results from the LDA indicated
widespread resistance to thiabendazole, while levamisole was effective on all farms
tested. Haemonchus sp. was the most commonly isolated parasite in both the
thiabendazole LDAs and post-treatment FECRT larval cultures. It would therefore appear
that most of the ivermectin and fenbendazole resistance detected on the Ontario farms
was associated with Haemonchus sp., which is a concern as this is typically the most
pathogenic of all the GINs that infect sheep in Ontario.
The greatest challenge of this study was its seasonality, since the ivermectin
drench check could only be performed when the mean FECs reached 200 epg. Once this
threshold was reached, we had to wait for the results of the ivermectin drench check to
confirm whether a FECRT would be performed on that farm. Also, we had to allow for a
minimum time period between the ivermectin drench check and FECRT, to ensure that
the animals had a sufficient level of FECs that would allow us to detect changes in the
FECs after treatment. However, on certain farms, the FECs reached dangerous levels
despite treatment with ivermectin, and we had to conduct the FECRT as early as possible
to ensure that the sheep’s well-being was not compromised. Therefore, it was very hard
to balance the work-load, which sometimes led to a back-log of fecal samples. For this
231
reason, we were unable to perform LDAs and larval cultures in the first year of the study.
In the second year, we decided to perform the LDAs when the FECs reached the 200 epg
threshold; this helped balance the work-load distribution, but resulted in the LDAs and
FECRTs being conducted at different time-points, making it harder to draw comparisons
between the two tests.
Producers were sometimes reluctant to use ivermectin (as required by the study),
since they had previously experienced ivermectin drench failure on their farm and were
concerned regarding further losses when using this product; this led to some farms
refusing to perform a FECRT after ivermectin drench failure was shown on their farm.
Also, some producers were reluctant to keep a negative control (i.e. untreated) group
when conducting a FECRT, as they were worried that this would compromise the health
and productivity of the animals. We addressed this concern by reassuring the producers
that they could treat any control animal that showed overt clinical signs, and asked them
to keep a record of any treatments administered. Moreover, whenever possible, we tried
to send them the pre-treatment FECs as quickly as possible so they could monitor, and
treat if necessary, any high-shedding animals.
Since this research indicated that resistance to ivermectin and fenbendazole, the
two most commonly used anthelmintics in Canada, is widespread, and most of the AR
reported is associated with Haemonchus sp., research is required to determine whether
the use of other anthelmintics could be used as alternatives in Ontario sheep flocks. In
particular, monepantel (Mason et al., 2009) and closantel (Uppal et al., 1993; Waruiru,
1997) are promising alternative drugs as they have been shown to be effective against
both ivermectin- and fenbendazole-resistant strains of H. contortus. However, more
232
research is required to ensure that the efficacy of any new anthelmintic that becomes
commercially available for Ontario sheep producers is preserved. This includes
investigation of the efficacy of targeted selective treatment of ewes at lambing time as a
means to reduce treatment frequency and to slow down further development of
resistance.
In the field study described in Chapter 4, we used the method endorsed by the
World Association for the Advancement of Veterinary Parasitology to calculate the
FECR percentages (Coles et al., 1992). However, the literature describes several FECR
calculation methods, and no formal agreement has been reached as to which method is
more appropriate. Moreover, few studies so far have compared results between the
FECRT and LDAs. Therefore, the study described in Chapter 5 was conducted to
compare different methods for calculating the FECR percentages, and to compare results
obtained with the FECRT and LDA. Four different FECR methods were used (FECR1
and FECR2 used pre- and post-treatment FECs from both treated and control animals, but
FECR1 used arithmetic means while FECR2 used geometric means; FECR3 was
calculated using arithmetic means for post-treatment FECs from treated and control
animals; FECR4 was calculated using mean FEC estimates from a General Linear Mixed
Model), and the FECR percentages were then compared using a concordance correlation
coefficient. Additionally, FECRT and LDA results were categorized into three classes
defined as “no”, “low” or “high resistance”, and the results were compared using the
Kappa agreement method.
The different FECR methods evaluated in this study did not provide consistent
FECR percentages following treatment with ivermectin, fenbendazole or levamisole. The
233
correlation between the methods was influenced by which means (arithmetic vs.
geometric) were used in the FECR formulae, especially when low levels of resistance
were present, resulting in right-skewed parasite data. Therefore, the use of arithmetic
means is recommended, since no correction factor is required, and they are less prone to
bias, particularly when the date is right-skewed. In contrast, whether both pre- and post-
treatment, or only post-treatment groups, were used in the FECR formulae was less
influential. This suggests that the simpler formula (i.e. using only post-treatment data)
could be used, reducing the cost and labour associated with the FECRT.
The LDA and FECRT showed an overall poor to moderate Kappa agreement in
this study, which is in disagreement with a recent study by Taylor et al. (2009) which
indicated a good agreement between the two tests. However, in the latter study, they only
evaluated whether the tests detected the presence of resistance (i.e. yes/no), and no
statistical test was performed to determine the agreement between tests. In our study, the
Kappa agreement was statistically significant when an 80% threshold was used to
differentiate FECR percentages as indicative of low or high levels of resistance,
suggesting that this could be a useful threshold.
As mentioned earlier, the LDA and FECRT were conducted at different time-
points during the grazing season, which limits the overall interpretation of test
comparisons. Moreover, we were unable to perform LDAs for ivermectin, since the
methodology used in this study has not yet been validated for ivermectin (Taylor, 1990).
Lastly, the high prevalence of phenotypically benzimidazole-resistant parasites, and low
prevalence of phenotypically levamisole-resistant parasites, were problematic when
calculating the Kappa agreement, since “the prevalence of the condition being diagnosed
234
affects Kappa. Two tests will have a higher Kappa value if the prevalence of the
underlying conditions is moderate than if it is very high or very low” (Dohoo et al.,
2009).
The modified McMaster technique used in this study had a minimum detection
level of 50 epg, which might have influenced the overall interpretation of the FECR,
especially when the FEC levels were low. This test was used for practicality and cost
issues, since we had to process many fecal samples in a short time-frame and had limited
financial resources. While more sensitive diagnostic methods have been described, these
would likely increase the overall cost of the FECRT, making it cost-prohibitive for sheep
producers. Therefore, we need to evaluate the cost and benefits of increasing the test
sensitivity, especially since one of our goals is to encourage producers to monitor for AR
by performing FECRTs more regularly.
El-Abdellati et al. (2010) have suggested that the Bayesian approach could
account for the limited sensitivity of the McMaster method used in this study. Moreover,
these methods might be more suitable to calculate the FECR, as they allow for greater
flexibility in the model specification, and account for different sources of variability,
providing more accurate estimates (Denwood et al., 2010). Therefore, the FECRT data
obtained in this study could be evaluated using Bayesian methods.
Chapter 6 describes an investigation of management practices currently employed
by Ontario sheep producers on their farms, and their association with AR. A
questionnaire was administered in a face-to-face interview on 38 of the 39 farms that
conducted an ivermectin drench check. Questions were asked on farm demographics,
235
previous use of anthelmintics, quarantine strategies, pasture management and alternative
control strategies, manure disposal, and perceived risk of AR. Ivermectin and
fenbendazole drenches were the most commonly used anthelmintics in the previous five
years, while levamisole drench was not commonly employed. Most producers treated
their flock routinely; most ewes were treated at lambing and/or at the beginning of winter
housing. The majority of producers also used targeted or targeted selective treatment, but
this was often done in addition to, rather than in lieu of, routine treatment. Many
producers (20/30; 67%) did not calibrate the drench gun before use, and more than half of
the producers calculated the dose of anthelmintic to administer by estimating the weight
of the animal or using the flock average weight. Almost a third of the producers that
brought in new animals (i.e. sheep, goats, llamas or alpacas) did not perform any
quarantine strategies. Just over half of the producers surveyed (21/38; 55%) used pasture
management as an alternative parasite control strategy, and more than half of the farms
surveyed indicated that they suspected the presence of AR on their farm prior to the
study. This descriptive information has highlighted important aspects (e.g. proper
quarantine strategies, risk of sub-optimal dosing) that should be addressed when
disseminating information on parasite control strategies to mitigate the development of
AR.
No management practices were significantly associated (i.e. p≤0.05) with the
ivermectin fecal egg count reduction. In contrast, previous use of benzimidazoles was
significantly associated with a lower fecal egg count reduction after treatment with
fenbendazole, suggesting higher levels of resistance. We were unable to model the
levamisole fecal egg count reduction, since there were low levels of phenotypically
236
levamisole-resistant parasites on the farms surveyed, and associations that were
statistically significant were not of biological significance.
The study described in the sixth chapter had limited power due to the small
sample size and limited variability of the outcome (i.e. high levels of ivermectin and
fenbendazole resistance; low levels of levamisole resistance). We therefore opted to use
the continuous FECR percentage as the outcome; however, there is currently no literature
on how different FECR percentages correspond with more severe clinical signs of
resistance, which hindered interpretation of some of the analytical results. Moreover,
following analysis of the questionnaire data, we recognized that the questionnaire could
be improved by modifying certain definitions to avoid overlap between the terms (e.g. the
definition of routine and targeted treatment) and collecting additional data such as: how
often (times/year) each anthelmintic formulation was used in the previous five years, and
specific information on treatment of periparturient ewes in the spring before turn-out on
pasture.
Other studies have suggested that treatment of ewes at lambing in the spring may
lead to the development of AR (Leathwick et al., 2006; Waghorn et al., 2010), and our
research indicated that treatment of ewes pre-lambing was a common practice on the
sheep farms surveyed. As indicated earlier, we believe that this common practice,
together with the poor over-wintering survival of Haemonchus sp. on pasture, is likely a
major driver of the high levels of resistance observed in this species. Therefore, a clinical
trial could be conducted to evaluate whether this management practice is causally
associated with higher levels of AR in Ontario sheep flocks.
237
Furthermore, a systematic review and meta-analysis on risk factors for AR could
be carried out to identify management practices associated with AR. This type of study
provides the most substantive clinical evidence (Sargeant et al., 2006), and allows for the
evaluation of several risk factors and synthesis of all current research.
Lastly, as described by the theory of planned behaviour (Azjen, 1991) and the
health belief model (Becker and Maiman, 1975), people’s perceptions (e.g. seriousness
and threat of a certain disease), attitudes and motivation to change will influence their
decision to adopt recommended preventive actions. Therefore, it is also necessary to
conduct research on sheep producers’ perceptions of the risk of AR, and their motivations
and barriers to making management changes, to inform our communication strategies on
parasite control management practices and ensure that these translate into proactive
changes.
Overall, this study has provided us with valuable information on several important
epidemiological features of GIN parasitism, namely the distribution and determinants of
the PPER, the frequency of Haemonchus sp. overwintering in the environment, and the
frequency of AR in Ontario sheep flocks. Collectively, the results will be used to develop
a strategic integrated parasite control program for commercial sheep flocks in Ontario,
and to guide future research on AR.
238
7.1 References
Abbott, K.A., Taylor, M.A., Stubbings, L.A., 2009. Sustainable worm control strategies
for sheep. 3rd
Ed. A technical manual for veterinary surgeons and advisers. 51pp.
Published by: Sustainable Control of Parasites in Sheep (SCOPS) and printed by:
Context Publications. Available from: www.nationalsheep.org.uk.
Ajzen, I., 1991. The theory of planned behavior. Organ. Behav. Hum. Dec. 50, 179-211.
Athanasiadou, S., Kyriazakis, I., 2004. Plant secondary metabolites: antiparasitic effects
and their role in ruminant productions systems. P. Nutr. Soc. 63, 631-639.
Beasley, A.M., Kahn, L.P., Windon, R.G., 2010. The periparturient relaxation of
immunity in Merino ewes infected with Trichostongylus colubriformis:
Parasitological and immunological responses. Vet. Parasitol. 168, 60-70.
Beasley, A.M., Kahn, L.P., Windon, R.G., 2012. The influence of reproductive
physiology and nutrient supply on the periparturient relaxation of immunity to the
gastrointestinal nematode Trichostrongylus colubriformis in Merino ewes. Vet.
Parasitol. 188, 306-324.
Becker, M.H., Maiman, L.A., 1975. Socio-behavioral determinants of compliance with
health and medical care recommendations. Med. Care 134 (1), 10-24.
Burke, J.M., Miller, J.E., 2002. Relative resistance of Dorper crossbred ewes to
gastrointestinal nematode infection compared with St. Croix and Katahdin ewes in
the southeastern United States. Vet. Parasitol. 109, 265-275.
Coles, G.C., Bauer, C., Borgsteede, F.H.M., Geerts, S., Klei, T.R., Taylor, M.A., Waller,
P.J., 1992. World Association for the Advancement of Veterinary Parasitology
(W.A.A.V.P.) methods for the detection of anthelmintic resistance in nematodes of
veterinary importance. Vet. Parasitol. 44, 35-44.
Denwood, M., Reid, S.W.J., Love, S., Nielsen, M.K., Matthews, L., McKendrick, I.J.,
Innocent, G.T., 2010. Comparison of three alternative methods for analysis of
equine Faecal Egg Count Reduction Test data. Prev. Vet. Med. 93, 316-323.
Dohoo, I., Martin, W., Stryhn, H., 2009. Veterinary Epidemiologic Research – Model-
Building Strategies. 2nd Ed. VER Inc., Charlottetown, Prince Edward Island,
Canada, C1A 8X5. pp. 365-390.
El-Abdellati, A., Charlier, J., Geldhor, P., Levecke, B., Demeler, J., von Samson-
Himmelstjerna, G., Claerebout, E., Vercruysse, J., 2010.The use of a simplified
faecal egg count reduction test for assessing anthelmintic efficacy on Belgian and
German cattle farms. Vet. Parasitol. 169, 352-357
Good, B., Hanrahan, J.P., Crowley, B.A., Mulcahy, G., 2006. Texel sheep are more
resistant to natural nematode challenge than Suffolk sheep based on fecal egg count
and nematode burden. Vet. Parasitol. 136, 317-327.
239
Houdijk, J.G.M., 2012. Differential effects of protein and energy scarcity on resistance to
nematode parasites. Small Rum. Res. 103, 41-49.
Leathwick, D.M., Miller, C.M., Atkinson, D.S., Haack, N.A., Alexander, R.A., Oliver, A-
M., Waghorn, T.S., Potter, J.F., Sutherland, I.A., 2006. Drenching adult ewes:
Implications of anthelmintic treatments pre- and post-lambing on the development
of anthelmintic resistance. N. Z. Vet. J. 54, 297-304.
Mason, P.C., Hosking, B.C., Nottingham, R.M., Cole, D.J.W., Seewald, W., McKay,
C.H., Griffiths, T.M., Kaye-Smith, B.G., Chamberlain, B., 2009. A large-scale
clinical field study to evaluate the efficacy and safety of an oral formulation of the
amino-acetonitrile derivative (AAD), monepantel, in sheep in New Zealand. N. Z.
Vet. J. 57, 3-9.
Mederos, A., 2010. Epidemiological studies of gastrointestinal nematodes in sheep flocks
in Ontario and Quebec, Canada. PhD, University of Guelph. 219pp. Available at:
http://udini.proquest.com/view/epidemiological-studies-of-goid:744049959/
Menzies, P., 2006. The Ontario Sheep Health Program: A structured health management
program for intensively reared flocks. Small Rum. Res. 62, 95-99.
Niezen, J.H., Robertson, H.A., Waghorn, G.C., Charleston, W.A.G., 1998. Production,
fecal egg counts and worm burdens of ewe lambs which grazed six contrasting
forages. Vet. Parasitol. 80, 15-27.
Pullin, J.W., 1961. A discussion of the common diseases of sheep. Can. Vet. J. 2, 359-
368.
Sargeant, J.M., Rajic, A., Read, S., Ohlsson, A., 2006. The process of systematic review
and its application in agri-food public health. Prev. Vet. Med. 75, 141-151.
Shrestha, J.N.B., Heaney, D.P., 2003. Review of Canadian, Outaouais and Rideau Arcott
breeds of sheep: 1. Development and characterization. Small Rum. Res. 49, 79-96.
Taylor, M.A., 1990. A larval development test for the detection of anthelmintic resistance
in nematodes of sheep. Res. Vet. Sci. 49, 198-202.
Taylor, M.A., Learmount, J., Lunn, E., Morgan, C., Craig, B.H., 2009. Multiple
resistance to anthelmintics in sheep nematodes and comparison of methods used for
their detection. Small Rum. Res. 86, 67-70.
Uppal, R.P., Yadav, C.L., Bhushan, C., 1993. Efficacy of closantel against fenbendazole
and levamisole resistant Haemonchus contortus in small ruminants. Trop. Anim.
Health Pro. 25, 30-32.
Waghorn, T.S., Oliver, A-M.B., Miller, C.M., Leathwick, D.M., 2010. Acquired
immunity to endoparasites in sheep interacts with anthelmintic treatment to
influence selection for anthelmintic resistance. N. Z. Vet. J. 58, 98-102.

240
Waruiru, R.M., 1997. Efficacy of closantel, albendazole and levamisole on an ivermectin
resistant strain of Haemonchus contortus in sheep. Vet. Parasitol. 73, 65-71.
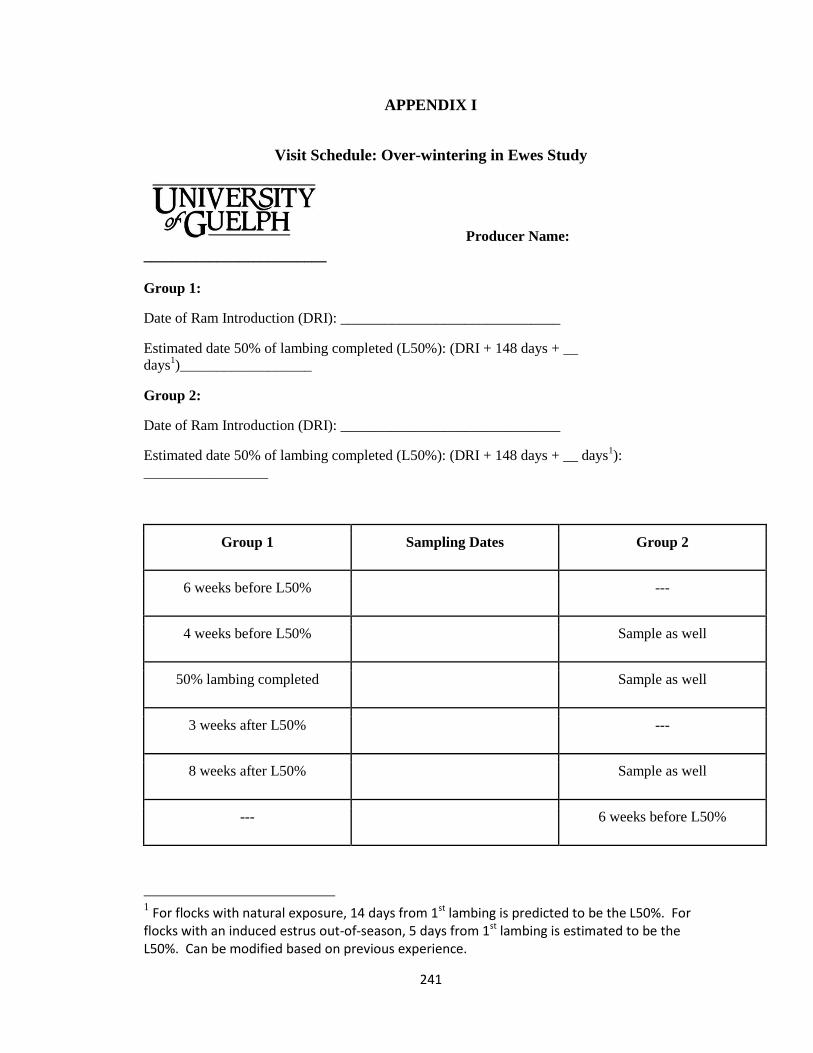
241
APPENDIX I
Visit Schedule: Over-wintering in Ewes Study
Producer Name:
_________________________
Group 1:
Date of Ram Introduction (DRI): ______________________________
Estimated date 50% of lambing completed (L50%): (DRI + 148 days + __
days1)__________________
Group 2:
Date of Ram Introduction (DRI): ______________________________
Estimated date 50% of lambing completed (L50%): (DRI + 148 days + __ days1):
_________________
Group 1 Sampling Dates Group 2
6 weeks before L50% ---
4 weeks before L50% Sample as well
50% lambing completed Sample as well
3 weeks after L50% ---
8 weeks after L50% Sample as well
--- 6 weeks before L50%
1 For flocks with natural exposure, 14 days from 1st lambing is predicted to be the L50%. For flocks with an induced estrus out-of-season, 5 days from 1st lambing is estimated to be the L50%. Can be modified based on previous experience.
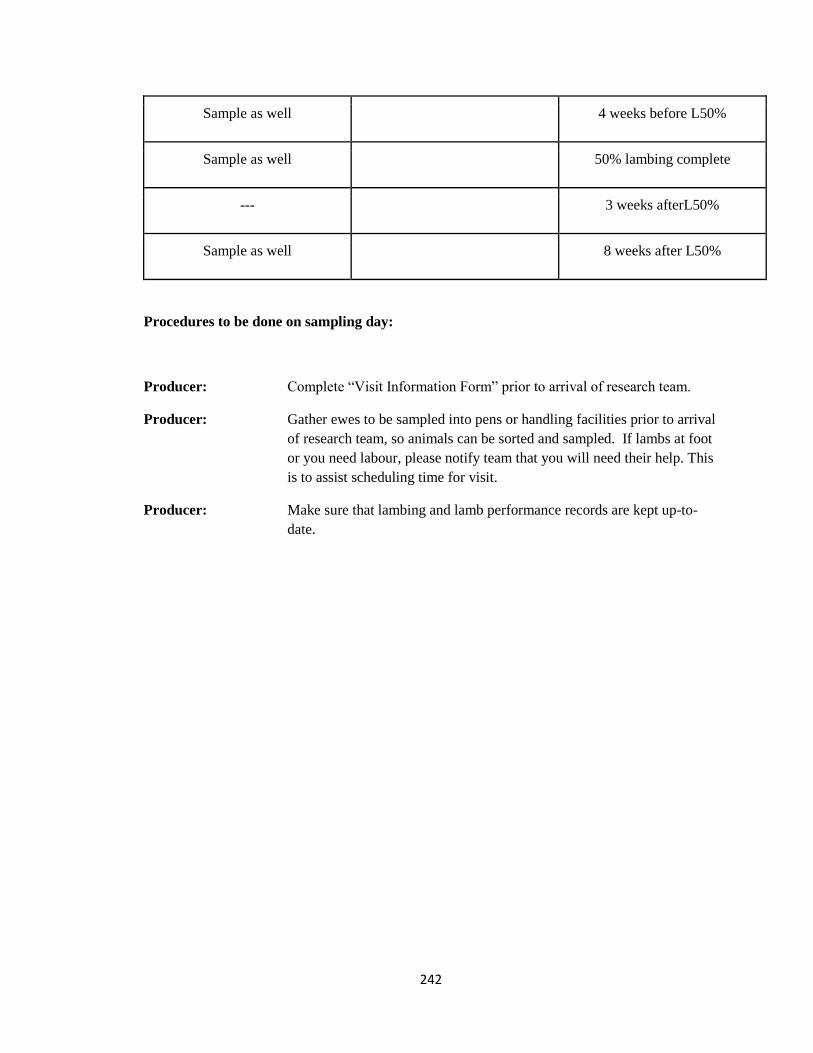
242
Sample as well 4 weeks before L50%
Sample as well 50% lambing complete
--- 3 weeks afterL50%
Sample as well 8 weeks after L50%
Procedures to be done on sampling day:
Producer: Complete “Visit Information Form” prior to arrival of research team.
Producer: Gather ewes to be sampled into pens or handling facilities prior to arrival
of research team, so animals can be sorted and sampled. If lambs at foot
or you need labour, please notify team that you will need their help. This
is to assist scheduling time for visit.
Producer: Make sure that lambing and lamb performance records are kept up-to-
date.

243
APPENDIX II
Visit Information Form: Over-wintering in Ewes study
Producer Name: _________________________________ Date of Visit: ______________
Ewe ID’s to be sampled:
From Lambing Group (15) From Non-Lambing Group (15)
Replacement Ewe ID’s : Replacement Ewe ID’s:
Since our last visit to your farm on ____________________________(date)
Have any ewes on this list left the flock? Yes No
If yes, please list Tag ID and reason left flock (including death)
_________________________________________________________
Please record ewe diet since last visit (changes only):
Forage (type and estimated daily intake)
______________________________________________
Forage analysis?
__________________________________________________________________
Mineral / Premix / Salt (brand, attach tags):
____________________________________________

244
Concentrate (type and estimated daily intake):
___________________________________________
Commercial supplement (Brand, attach tag)__________________________________________
Have ewes had access to pasture since last visit? Yes No
If yes, please indicate: Time on pasture _____________(days) Date left pasture: _____________
Have the ewes received any treatments with a worming product (anthelmintic) (e.g. Ivomec,
Safeguard, natural product) since the last visit? Yes No
If yes, please indicate date: ___________________ and product used: ______________________
Are there other issues or concerns you would like to make the research team aware of?
_____________________________________________________________________________

245
APPENDIX III
Administered questionnaire
Anthelmintic Use Practices on Ontario Sheep Operations
The purpose of this questionnaire is to understand better the usage of dewormers on
Ontario sheep operations. For the purpose of this questionnaire, we shall be defining the
following as:
Parasites - internal parasites only (that is, not lice, keds or mange)
Drugs - products used as de-wormers and sometimes also called anthelmintics
Quarantine - to hold any new animals off pasture used for sheep grazing for 24-48 hours
Used pasture - pasture that has been grazed by sheep in the last 12 months
Name of Producer: _________________ Date: ______________
Background Information
1. How many breeding ewes do you have in your flock?
<50 100 - 300
50 – 99 >300
2. What is the primary purpose of the flock?
Meat Production Breeding Stock for Replacement Sales
Dairy Production Other (please specify) ____________________
Wool Production

246
3. What breeds of sheep do you have on your operation? How many?
i. _______________________________ Number: _____________
ii. _______________________________ Number: _____________
iii. _______________________________ Number: _____________
iv. _______________________________ Number: _____________
v. _______________________________ Number: _____________
4. Are you a certified organic sheep producer?
Yes No
i. If yes, for how long have you been a certified organic sheep producer?
____________________________________________________________
ii. If no, are you working towards organic status?
Yes No
Drench Failure
5. Could you please name the dewormers you have used since Jan 1st 2006 for parasite
control on your farm.
_________________________________
_________________________________
_________________________________
_________________________________
6. In addition to commercial dewormers, what other methods have you used for parasite
control in your sheep since Jan 1st 2006.
________________________________________________________________________
__________________________________________________________________
7. In the last year, since ________ 2009, what products and procedures have you used for
parasite control in your sheep flock? This could include both natural and/or commercial
deworming products.

247
Date Used Age2 Product Used Route
3 Primary Reason for Choice
of Dewormer Product
8. If you use a drench gun, how often do you test that it is delivering the indicated volume?
Never Before each use
Once a year Do not use a drench gun
Twice a year
9. How do you determine the weight of the animal when calculating the dose of dewormer
to be given? Please check the most frequently used method.
Estimation of weight (eyeball) Weigh and use average weight of the group
Expected breed average Other____________________________
Weigh group and use heaviest
Quarantine 10. In the last year, have you brought new animals into your flock or had animals return that
had been on another farm? (Animals of interest include sheep, goats, llamas and/or
alpacas, but not cattle or other livestock)
Yes No (skip to question 11)
i) If yes, what did you do with them in regards to parasite control at arrival?
Please check all applicable.
Nothing
Deworm upon arrival and release immediately into the flock
Deworm while in quarantine
Quarantine new arrivals off pasture for ________________ days
Other ______________________________________________
2 Age: PWL = pre-weaned lambs; WL = weaned lambs; A = adults
3 Route: SC = subcutaneous; OD = oral using drench gun; OS = oral using
syringe; PO = pour-on

248
If a deworming product is used in quarantine, please record.
Age and Species type4 Products Used
(Dose and Frequency) When was it administered
(Day 0 = day of arrival)
ii) If brought-in animals were turned onto pasture, had the pasture been grazed
by sheep within the last 12 months, since ________ 2009?
Yes No
Not applicable (please explain) ___________________________________
_________________________________________________________________
Pasture Management
11. How many acres of pasture do your sheep graze in a season? ___________________
12. What is your estimated current stocking density5? __________________
13. In which months does your flock routinely lamb? Please check all applicable.
Jan May Sep
Feb Jun Oct
Mar Jul Nov
Apr Aug Dec
14. Are the ewes and nursing lambs ever out on pasture together?
4 Species type: PWL = preweaned lambs; WL = weaned lambs; A= adults;
Others = goats, llamas, alpacas 5 5 1 adult sheep = 1 sheep-unit (SU). 1 ewe + nursing lambs = 1.5 SU. Estimate
grazing by the number of months grazed. Please estimate SU per acre of sheep grazing
pasture on your farm on an annual basis. E.g. 100 adult sheep grazing 40 acres over 5
months would be a stocking density of [(100/40) *(5/12)] = 1.04 SU per acre per year

249
Yes (please go to question 15) No (please skip to question 16)
15. If yes, for how many months are they on pasture together? __________________
16. When were your sheep turned out to pasture to graze this spring or when are you
planning to turn them out?
5 Apr – 11 Apr 3 May – 9 May 31 May – 6 Jun
12 Apr – 18 Apr 10 May – 16 May 7 Jun – 13 Jun
19 Apr – 25 Apr 17 May – 23 May 14 Jun – 20 Jun
26 Apr – 2 May 24 May – 30 May 21 Jun – 27 Jun
Other____________________________________________________________
ii. What month were sheep permanently taken off pasture at the end of the previous
grazing season (2009) and put into a barn, barnyard or dry lot?
______________________________________________________________
17. Do you ever rest pastures that have been used for grazing sheep, goats, llamas and/or
alpacas, for more than one year? (The pasture may be used for other things, but not
grazing).
Yes No (please skip to question 18)
ii. If yes, how often? ________________________________________________
18. Do you practice crop rotation with the pastures used by the sheep? (That is, pasture
ploughed every few years and seeded with grain, corn, cash crops, etc. or used for hay)
Yes No
ii. If yes, how often? ________________________________________________
19. Do you practice mixed species grazing, other than those animals used for guarding
purposes? (that is, different species that are at pasture the same time as the sheep)
Yes No (please go to question 20)
i. If yes, what species? Please check all applicable.
Cattle Llamas and/or alpacas
Horses Other
Goats
20. Do you practice rotational grazing with other species? (that is, grazing one species first,
removing, and then placing another species on the same pasture)

250
Yes No (please go to question 21)
i. If yes, what species? Please check all applicable.
Cattle Llamas and/or alpacas
Horses Other
Goats
Dewormer Usage
21. Do you deworm your flock routinely (that is, without seeing signs of disease)?
Yes No (Please skip to question 24)
22. If yes, how many times a year do you routinely deworm your
Ewes ______________ time(s)
Lambs (<12 months of age) ______________ time(s)
Rams ______________ time(s)
23. If yes, at which times do you treat?
Adults at breeding Ewes at lambing
At housing in the fall Other _______________________
At a specific time after turn-out onto pasture (# days = ______________)
At a specific time during the grazing season (date = _________________)
Lambs at weaning
24. Do you deworm the flock because when you believe that it has parasites?
Yes No
25. Do you deworm individual animals when you believe them to have parasites?
Yes No (please skip to question 27)

251
26. How do you determine if the flock or individuals in the flock have parasites?
High faecal egg counts Animals showing clinical signs
FAMACHA system Other ___________________
Resistance
27. Do you believe you have ever had dewormer resistance in your flock with regards to
internal parasites?
Yes No (please skip to question 28)
i. If yes, what made you believe dewormer resistance was present?
Egg counts still high after deworming
No improvement after deworming. Please explain.
_________________________________________________________________
Other _______________________________________________________
ii. If yes, when do you believe resistance first occurred?
_______________________________________________________
iii. If yes, did you suspect resistance to a specific dewormer(s)?
Yes No
iv. If yes, to which dewormer(s)?
________________________________________________________
28. Within the last 12 months, since ________ 2009, did you spread sheep manure on
pastures being grazed by sheep?
Yes No (please skip to question 29)
i. If yes, what was the minimum time from storage (i.e. moved out of the barn to a
manure pile or storage area) until spread on pastures?

252
_______________________________________________________________
ii. If yes, which month was manure spread?
_______________________________________________________________
29. How is your sheep manure stored? Can you please show me? Please check all applicable.
Potential for runoff into a grazing Sheep have access to manure
area None of the above