Campylobacter Monitoring in German Broiler Flocks: An Explorative Time Series Analysis
12
ORIGINAL ARTICLE Campylobacter Monitoring in German Broiler Flocks: An Explorative Time Series Analysis S. Hartnack 1 , M. G. Doherr 1 , T. Alter 2 , K. Toutounian-Mashad 2 and M. Greiner 2 1 Department of Clinical Research and Veterinary Public Health, Vetsuisse Faculty, University of Bern, Bern, Switzerland 2 BfR, Federal Institute for Risk Assessment, Berlin, Germany Impacts • Data generated in the Campylobacter monitoring programme of broiler flocks in Germany are suitable for a time series analysis. • The seasonal peak of notified human campylobacterioses precedes the peak in broiler prevalence. • The potential influence of climatic factors on seasonal changes in campylobacteriosis cases should be considered. Introduction Campylobacter, a major zoonotic pathogen, is the most commonly reported, food-borne bacterial cause of human enteritis in Europe (Anonymous, 2006). Poultry meat is consistently considered to be the most important risk factor for human campylobacteriosis, and the reduction in the number of poultry products contaminated with Campylobacter is suggested as a means to improve public health (Rosenquist et al., 2003; Wagenaar et al., 2006). Other risk factors for human infection include drinking untreated water, consuming raw and unpasteurized milk, handling and cooking food, having contact with food- producing animals and pets, and swimming in natural bodies of water (Kapperud et al., 2003; Uyttendaele et al., 2006). Although studies have provided insight into the epidemiology of Campylobacter infections, our under- standing is still incomplete (Wingstrand et al., 2006). Campylobacter spp. can be isolated from pork, beef and veal, but the highest contamination rates are found in poultry (Ghafir et al., 2007). Numerous studies based on questionnaires, cross-sectional or case–control studies have investigated the epidemiology of Campylobacter spp. and potential risk factors in poultry flocks. Most of these studies have focussed on static risk assessment models without taking into account the fact that some factors might influence the occurrence of Campylobacter through seasonal or other time-dependent patterns. The spread of Campylobacter within the flock is rapid (Berndtson et al., 1996; Evans and Sayers, 2000) and virtually all animals will be colonized with this commensal within 6 days after introduction of the agent (Van Gerwe et al., 2005). Keywords: Campylobacter; time series; broiler; monitoring programme; campylobacteriosis Correspondence: Sonja Hartnack. Department of Clinical Research and Veterinary Public Health, Vetsuisse Faculty, University of Bern, Bremgartenstr 109a, CH-3001 Bern, Switzerland. Tel.: +41 31 631 2648; Fax: +41 31 631 2538; E-mail: [email protected] Received for publication May 16, 2008 doi: 10.1111/j.1863-2378.2008.01184.x Summary Campylobacter, a major zoonotic pathogen, displays seasonality in poultry and in humans. In order to identify temporal patterns in the prevalence of thermo- philic Campylobacter spp. in a voluntary monitoring programme in broiler flocks in Germany and in the reported human incidence, time series methods were used. The data originated between May 2004 and June 2007. By the use of seasonal decomposition, autocorrelation and cross-correlation functions, it could be shown that an annual seasonality is present. However, the peak month differs between sample submission, prevalence in broilers and human incidence. Strikingly, the peak in human campylobacterioses preceded the peak in broiler prevalence in Lower Saxony rather than occurring after it. Significant cross-correlations between monthly temperature and prevalence in broilers as well as between human incidence, monthly temperature, rainfall and wind- force were identified. The results highlight the necessity to quantify the trans- mission of Campylobacter from broiler to humans and to include climatic factors in order to gain further insight into the epidemiology of this zoonotic disease. Zoonoses and Public Health ª 2008 The Authors Journal compilation ª 2008 Blackwell Verlag • Zoonoses Public Health. 56 (2009) 117–128 117
Transcript of Campylobacter Monitoring in German Broiler Flocks: An Explorative Time Series Analysis

ORIGINAL ARTICLE
Campylobacter Monitoring in German Broiler Flocks:An Explorative Time Series AnalysisS. Hartnack1, M. G. Doherr1, T. Alter2, K. Toutounian-Mashad2 and M. Greiner2
1 Department of Clinical Research and Veterinary Public Health, Vetsuisse Faculty, University of Bern, Bern, Switzerland2 BfR, Federal Institute for Risk Assessment, Berlin, Germany
Impacts
• Data generated in the Campylobacter monitoring programme of broiler
flocks in Germany are suitable for a time series analysis.
• The seasonal peak of notified human campylobacterioses precedes the
peak in broiler prevalence.
• The potential influence of climatic factors on seasonal changes in
campylobacteriosis cases should be considered.
Introduction
Campylobacter, a major zoonotic pathogen, is the most
commonly reported, food-borne bacterial cause of human
enteritis in Europe (Anonymous, 2006). Poultry meat is
consistently considered to be the most important risk
factor for human campylobacteriosis, and the reduction
in the number of poultry products contaminated with
Campylobacter is suggested as a means to improve public
health (Rosenquist et al., 2003; Wagenaar et al., 2006).
Other risk factors for human infection include drinking
untreated water, consuming raw and unpasteurized milk,
handling and cooking food, having contact with food-
producing animals and pets, and swimming in natural
bodies of water (Kapperud et al., 2003; Uyttendaele et al.,
2006). Although studies have provided insight into the
epidemiology of Campylobacter infections, our under-
standing is still incomplete (Wingstrand et al., 2006).
Campylobacter spp. can be isolated from pork, beef and
veal, but the highest contamination rates are found in
poultry (Ghafir et al., 2007). Numerous studies based on
questionnaires, cross-sectional or case–control studies
have investigated the epidemiology of Campylobacter spp.
and potential risk factors in poultry flocks. Most of these
studies have focussed on static risk assessment models
without taking into account the fact that some factors
might influence the occurrence of Campylobacter through
seasonal or other time-dependent patterns. The spread of
Campylobacter within the flock is rapid (Berndtson et al.,
1996; Evans and Sayers, 2000) and virtually all animals
will be colonized with this commensal within 6 days
after introduction of the agent (Van Gerwe et al., 2005).
Keywords:
Campylobacter; time series; broiler;
monitoring programme; campylobacteriosis
Correspondence:
Sonja Hartnack. Department of Clinical
Research and Veterinary Public Health,
Vetsuisse Faculty, University of Bern,
Bremgartenstr 109a, CH-3001 Bern,
Switzerland. Tel.: +41 31 631 2648;
Fax: +41 31 631 2538;
E-mail: [email protected]
Received for publication May 16, 2008
doi: 10.1111/j.1863-2378.2008.01184.x
Summary
Campylobacter, a major zoonotic pathogen, displays seasonality in poultry and
in humans. In order to identify temporal patterns in the prevalence of thermo-
philic Campylobacter spp. in a voluntary monitoring programme in broiler
flocks in Germany and in the reported human incidence, time series methods
were used. The data originated between May 2004 and June 2007. By the use
of seasonal decomposition, autocorrelation and cross-correlation functions, it
could be shown that an annual seasonality is present. However, the peak
month differs between sample submission, prevalence in broilers and human
incidence. Strikingly, the peak in human campylobacterioses preceded the peak
in broiler prevalence in Lower Saxony rather than occurring after it. Significant
cross-correlations between monthly temperature and prevalence in broilers as
well as between human incidence, monthly temperature, rainfall and wind-
force were identified. The results highlight the necessity to quantify the trans-
mission of Campylobacter from broiler to humans and to include climatic
factors in order to gain further insight into the epidemiology of this zoonotic
disease.
Zoonoses and Public Health
ª 2008 The Authors
Journal compilation ª 2008 Blackwell Verlag • Zoonoses Public Health. 56 (2009) 117–128 117

However, several questions about the dynamics of the
colonization process and the transmission routes remain
unanswered (Rivoal et al., 2005; Conlan et al., 2007).
Campylobacter are fragile organisms, susceptible to a
number of environmental conditions (temperature, pres-
ence of oxygen, pH, UV, humidity) but may survive in a
viable but non-cultivable form (VBNC) in the environ-
ment (Talibart et al., 2000). In water samples from a
broiler farm with chickens colonized with Campylobacter,
the agent itself was not detected by different culture
methods, but evidence for its presence in 60% of 167
samples was given by an indirect fluorescence antibody
test (Pearson et al., 1993). The VBNC state leads to
uncertainty in the interpretation of observational studies
of the disease ecology because false negative test results
may occur if Campylobacter is only present in its VBNC
state (Skelly and Weinstein, 2003). The potential role of
the VBNC state in broiler prevalence and in human
campylobacteriosis is controversially discussed (Oliver,
2005; Murphy et al., 2006). Besides this, prior to flock
colonization, Campylobacter spp. were detected in the
environment (Rivoal et al., 2005; Bull et al., 2006). A
case–control study indicates that among children, contact
with animals or the environment is the source of a sub-
stantial proportion of sporadic Campylobacter infections
(Ethelberg et al., 2005). Transmission by flies is discussed
as a contributing factor to broiler prevalence and human
campylobacteriosis (Ekdahl et al., 2005; Nichols, 2005). A
systematic review evaluating the major contributing fac-
tors and sources of Campylobacter occurrence in broilers
in Great Britain highlights the importance of hygienic
measures in the primary production stage for decreasing
the risk, while the highest disagreement between study
results was in factors related to vertical transmission and
carry-over (Adkin et al., 2006).
Seasonality with a peak of broiler prevalence and
campylobacteriosis in summer and autumn has been
found in several studies (Wedderkopp et al., 2001; Nylen
et al., 2002; Miller et al., 2004; Meldrum et al., 2005).
Seasonal pattern and a dependence on latitude indicate
that climate factors might play a role either directly or
indirectly. A seasonal pattern in Campylobacter contami-
nation was found in a river, and a decrease in notified
cases of campylobacteriosis was observed when levels of
Campylobacter were low (Eyles et al., 2003). Ambient
temperature has been described as a factor that
might contribute to the seasonal variation of campylo-
bacteriosis (Louis et al., 2005; Fleury et al., 2006).
Specific climate conditions that lead to an increase in
broiler prevalence and in campylobacteriosis after differ-
ent time lags have been hypothesized (Patrick et al.,
2004; Kovats et al., 2005; Tam et al., 2006). Significant
differences in Campylobacter colonization rates were
observed between chickens raised under high and low
relative humidity conditions (Line, 2006). Rainfall was
found to be a risk factor for Campylobacter infection
(Sandberg et al., 2006).
In order to fulfil the requirements prescribed by the
zoonosis directive 2003/99/EC, the broiler flocks were
sampled in Germany. Whereas the European Food Safety
Authority summary report describes trends in human
incidence and in animal prevalence on a yearly basis,
information associated to pattern within the years may
remain undetected.
The first aim of this study was to identify temporal
patterns in the prevalence of Campylobacter in a voluntary
monitoring programme in broiler flocks and in the inci-
dence of human campylobacterioses cases in Germany. A
second aim was to investigate relationships among climate
pattern, prevalence in poultry and human cases. Time
series techniques were used to address both the aims.
Materials and Methods
Broiler-monitoring-related data
The raw data used in this study was from the German
Campylobacter monitoring programme in broiler flocks
between May 2004 and June 2007. This programme con-
sists of convenience sampling in 14 larger poultry abatt-
oirs in different geographical regions in Germany. Each
abattoir processes at least 2000 broilers per slaughter-
batch from a given farm and in these 14 abattoirs more
than 80% of the broiler flocks in Germany are processed
(Peters et al., 2006). Within the programme, cloacal
samples from ten broilers were selected from each
slaughter-batch, pooled and tested for Campylobacter
spp. in compliance with ISO 10272/1 in one of eight
regional labs. Test results and all identified Campylobac-
ter isolates were submitted to the Federal Institute for
Risk Assessment (BfR) for further analysis and evalua-
tion. The information required for our study was
extracted from the monitoring database, checked for
consistency, and analysed using the statistical software
package spss (spss� version 14.0 SPSS Inc., Chicago, IL,
USA).
For the time series analysis, four variables of the data-
base were selected: the status of the pool faecal sample for
Campylobacter (positive/negative), the federal state (Bun-
desland) in which the primary production is located, the
date of arrival of the samples from the slaughterhouses at
the regional labs and the number of animals per slaugh-
ter-batch. The whole dataset contained 3382 records. For
the sample submission and prevalence time series 3360
records and for the weighted prevalence time series 2888
records were taken into account. Main exclusion criteria
were missing or implausible data.
Campylobacter Monitoring S. Hartnack et al.
ª 2008 The Authors
118 Journal compilation ª 2008 Blackwell Verlag • Zoonoses Public Health. 56 (2009) 117–128

Human campylobacterioses data
Human campylobacterioses cases data, based on the man-
datory notification system according to the Act for Pro-
tection against Infectious Diseases, were obtained from
the Robert Koch Institute website (http://www3.rki.de/
SurvStat, accessed on 18.04.2007). As output variables,
the total monthly number of campylobacterioses and the
monthly incidence per 100 000 inhabitants for the period
January 2001 to December 2006 were selected. In Ger-
many, the total recorded number of human campylobac-
terioses comprised 346 427 cases within 6 years ranging
from 50 614 to 64 610 cases per year. In Lower Saxony,
the number of campylobacterioses totalled 28 286 cases
(4007–5443 per year).
Climate data
Climate data were obtained from the German National
Meteorological Service website, (the Deutscher Wetterd-
ienst, DWD) (http://www.dwd.de/de/FundE/Klima/KLIS/
daten/online/nat/ausgabe_monatswerte.htm, website accessed
on 02.09.2007) for the station 10338 Hanover Langenha-
gen in Lower Saxony. The following variables (summa-
rized by month) were included in the database: the mean
temperature (TMM) and the maximum temperature
(TXX) two metres above ground in degrees Celsius, the
total sunshine duration (SOS) in hours, the total precipi-
tation (RSS) and the maximum diurnal precipitation total
(RSX) in millimetres and the mean wind-force (FMM) in
(Bft), Beaufort, for the time span January 2001–June
2007.
Preparation of time series data sets
Time series is a sequence of data points measured at
equal time intervals. The time series for the study were
generated by cross-tabulation of the original data of the
monitoring programme to obtain aggregated data on a
monthly and a weekly basis. Three different time series
data sets were generated for weekly and monthly time
windows. The outcome variables for the time series were
first the total number of samples, second the proportion
of positive samples and third the weighted for the batch-
size proportion of positive samples. The weighting was
done in Excel for Windows by summing the number of
animals in each of the time periods (week or month),
normalizing this sum to one and calculating the fraction
of the positive samples. To generate time series for cam-
pylobacterioses, the data from the Robert Koch Institute
and the climate data were directly transferred into spss.
Time series plots were performed for all series to visualize
possible trends and seasonality.
Statistical analysis of data
Autocorrelation function
Autocorrelation of all time series data sets was assessed by
empirical autocorrelation function (ACF), indicating a
correlation of data at current time (t0) with data from
previous time points, i.e. lagging 1, 2, or more time
points. ACF values range between )1 and +1, with values
near to these borders indicating strong positive or nega-
tive correlation between current values and previous
observations. A plot of the ACF (or correlogram) is a use-
ful check for seasonality and other time series patterns
(Makridakis et al., 1998). The x-axis represents the differ-
ent time lags and the y-axis the ACF values. The approxi-
mate standard errors for the autocorrelation coefficients
were calculated on the assumption that the underlying
process is either independent or white noise (Chatfield,
2004). For testing the entire set of autocorrelation coeffi-
cients for significance, the Box–Ljung test based on the
asymptotic chi-square approximation was used.
Seasonal decomposition
All time series data were decomposed into a trend com-
ponent, a seasonal component and a residual error. As
the magnitude of the seasonal fluctuations did not vary
proportionally to increases or decreases of the time series
by visual inspection and assuming that the size of the sea-
sonal effect is constant from year to year, seasonal
decomposition was done in an additive way in spss, lead-
ing to trend-cycle series, seasonally adjusted series, sea-
sonal factors and errors for the human campylobacteriosis
and the climate data. In this procedure, the seasonal fac-
tors estimate the seasonal component, which contribute
to the time series pattern. If subtracted from the original
time series, the seasonally adjusted series is obtained. As
the data from the broiler monitoring programme ranged
only over 3 years to estimate both deseasonalized time
series and seasonal factors, the following procedure was
applied. First, a centred moving average with a time span
of 12 was calculated for all time series (12MA). The
resulting time series represents then a smoothed trend-
cycle. By subtraction of the 12MA series from the original
time series resulting in a detrended time series and calcu-
lation of the mean monthly differences the seasonal fac-
tors were obtained. Subtracting the seasonal factors from
the original data generated a deseasonalized series. For
estimating the errors, the seasonal factors were subtracted
from the detrended time series.
Cross-correlation
In order to evaluate the relationship between Campylo-
bacter isolates in broiler, human campylobacterioses
and climate, cross-correlation functions using the
S. Hartnack et al. Campylobacter Monitoring
ª 2008 The Authors
Journal compilation ª 2008 Blackwell Verlag • Zoonoses Public Health. 56 (2009) 117–128 119
cross-correlation function of the Trends module in spss
were calculated among the prevalence time series in broi-
lers, the incidence time series in humans and the climate
time series. The lag time for analysis of cross-correlation
refers to a shift between the two time series. For example,
at lags )1, 0 and 1, the correlation of the human incidence
with the prevalence in broilers 1 month earlier, during the
same month, and 1 month later is estimated. This was
done with the original time series and the deseasonalized
time series for the relationship between prevalence in
broiler and human campylobacterioses. The approximate
standard error for the cross-correlation coefficients was
calculated on the assumption that the series are not cross-
correlated and that one of the series is white noise.
Results
Broiler monitoring data
Sample submission and prevalence
Because of data quality, time series for sample submission
and prevalence were determined solely on a monthly
basis.
The sample submission and the prevalence of Campylo-
bacter are shown in Table 1. During the years of the study
period, which comprised for 2004 the period from May
to December and for 2007 the period from January to
June, a decrease in sample submission was found.
Samples from animals originating from Lower Saxony
contributed to 62% of the total number of samples, while
the other 13 federal states each accounted for less than
10% of the total sample size. Therefore, further analyses
were performed both for Germany as a whole and for
Lower Saxony separately.
The pattern of sample submission throughout the year
is quite similar in Germany as a whole and in Lower
Saxony. The highest number of samples was submitted in
May and June, whereas distinctly lower numbers were
found in April, July and October, corresponding to the
prime holiday periods. Time plots for the weekly and
monthly prevalence and weighted prevalence for Germany
and Lower Saxony showed a high variability with values
(range 0–100%) (graph not shown). The highest preva-
lence was detected during the summer months June to
September. The prevalence of Campylobacter in broiler
was considered to be slightly higher in Lower Saxony as
compared with Germany as a whole. The weighted weekly
and monthly prevalences are lower for Germany as a
whole and Lower Saxony as compared with the preva-
lence without weighting. The variable number of animals
per slaughter-batch varied between 500 and 220 001 with
a median of 20 100. No significant difference in the num-
ber of animals per slaughter-batch size could be found
between Campylobacter positive or negative tested slaugh-
ter-batches by a non-parametric test (Wilcoxon P =
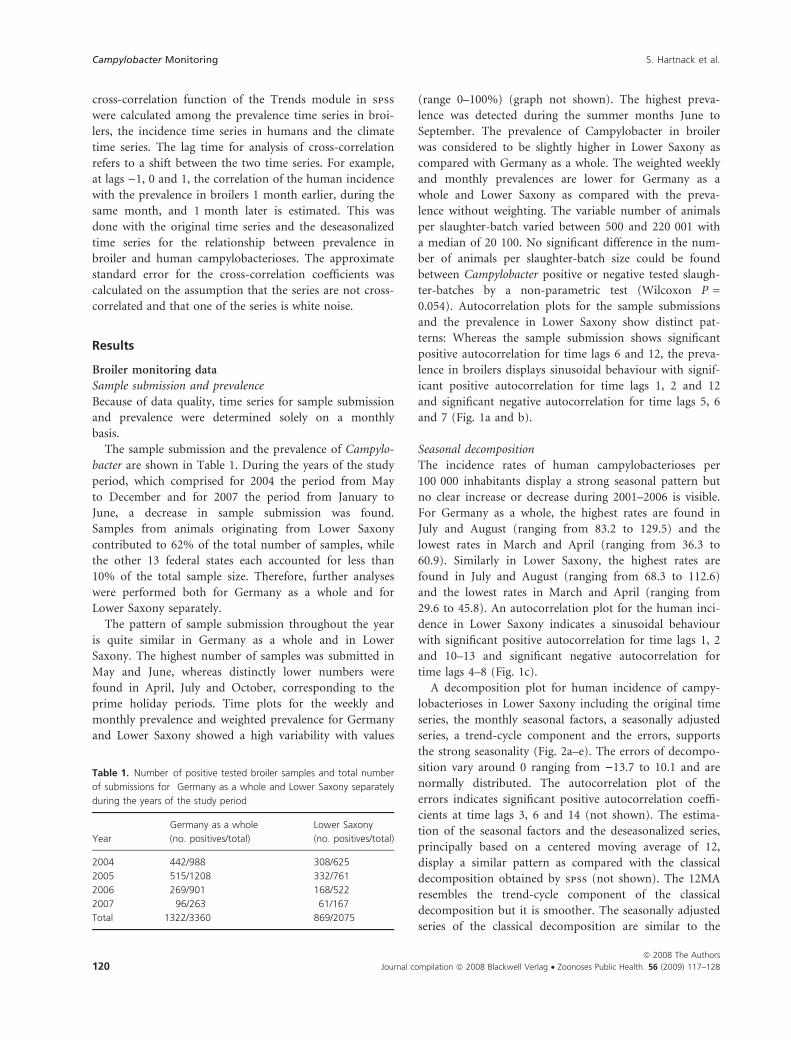
0.054). Autocorrelation plots for the sample submissions
and the prevalence in Lower Saxony show distinct pat-
terns: Whereas the sample submission shows significant
positive autocorrelation for time lags 6 and 12, the preva-
lence in broilers displays sinusoidal behaviour with signif-
icant positive autocorrelation for time lags 1, 2 and 12
and significant negative autocorrelation for time lags 5, 6
and 7 (Fig. 1a and b).
Seasonal decomposition
The incidence rates of human campylobacterioses per
100 000 inhabitants display a strong seasonal pattern but
no clear increase or decrease during 2001–2006 is visible.
For Germany as a whole, the highest rates are found in
July and August (ranging from 83.2 to 129.5) and the
lowest rates in March and April (ranging from 36.3 to
60.9). Similarly in Lower Saxony, the highest rates are
found in July and August (ranging from 68.3 to 112.6)
and the lowest rates in March and April (ranging from
29.6 to 45.8). An autocorrelation plot for the human inci-
dence in Lower Saxony indicates a sinusoidal behaviour
with significant positive autocorrelation for time lags 1, 2
and 10–13 and significant negative autocorrelation for
time lags 4–8 (Fig. 1c).
A decomposition plot for human incidence of campy-
lobacterioses in Lower Saxony including the original time
series, the monthly seasonal factors, a seasonally adjusted
series, a trend-cycle component and the errors, supports
the strong seasonality (Fig. 2a–e). The errors of decompo-
sition vary around 0 ranging from )13.7 to 10.1 and are
normally distributed. The autocorrelation plot of the
errors indicates significant positive autocorrelation coeffi-
cients at time lags 3, 6 and 14 (not shown). The estima-
tion of the seasonal factors and the deseasonalized series,
principally based on a centered moving average of 12,
display a similar pattern as compared with the classical
decomposition obtained by spss (not shown). The 12MA
resembles the trend-cycle component of the classical
decomposition but it is smoother. The seasonally adjusted
series of the classical decomposition are similar to the
Table 1. Number of positive tested broiler samples and total number
of submissions for Germany as a whole and Lower Saxony separately
during the years of the study period
Year
Germany as a whole
(no. positives/total)
Lower Saxony
(no. positives/total)
2004 442/988 308/625
2005 515/1208 332/761
2006 269/901 168/522
2007 96/263 61/167
Total 1322/3360 869/2075
Campylobacter Monitoring S. Hartnack et al.
ª 2008 The Authors
120 Journal compilation ª 2008 Blackwell Verlag • Zoonoses Public Health. 56 (2009) 117–128

estimated deseasonalized series. The errors of the esti-
mated deseasonalized and detrended time series are larger,
varying from )16.1 to 17.1, and are normally distributed.
Decomposition of the prevalence data of the broiler
monitoring programme was not possible, as data for at
least four seasonal periods or years are required. Estima-
tion of deseasonalized time series was therefore performed
with a moving average of 12 and several subtractions
(Fig. 3a–e). The autocorrelation plot of the errors indi-
cates positive and significant autocorrelation at time lags
1, 6 and 8 lags.
Cross-correlation
Campylobacteriosis and Campylobacter prevalence
in broilers
As the human incidence is calculated annually for the
number of inhabitants, the data used for calculation of
cross-correlation comprised the period January 2004–
December 2006.
Plots of the time series broiler prevalence, human cam-
pylobacterioses and temperature are similar with regard
to their seasonality (Fig. 4a–c). Cross-correlation func-
tions plots find strong cross-correlations between the inci-
dence in humans and the prevalence and weighted
prevalence in broilers at different time lags )1 to 2 with
positive correlation (Fig. 5). The plot shows that the posi-
tive coefficients are not symmetric around the lag 0 with
higher values for positive lag times 1 and 2 months as
compared with )1 month. This indicates that the peak in
campylobacterioses precedes the peak in broiler preva-
lence rather than following it. This result needs to be
carefully interpreted as the autocorrelations present in the
original time series might cause spurious cross-correla-
tions. If the same but deseasonalized series are examined
for cross-correlation, there is still some cross-correlation
found but to a lesser extent at time lag 0 (Fig. 6).
Climate data
For Campylobacter prevalence in broilers, significantly
positive or negative cross correlations were detected for
the mean monthly temperature, the maximum monthly
16 15 14 13 12 11 10 9 8 7 6 5 4 3 2 1 Lag number
0.9
(a)
(b)
(c)
0.6
0.3
0.0
–0.3
–0.6
–0.9
0.9
0.6
0.3
0.0
–0.3
–0.6
–0.9
0.9
0.6
0.3
0.0
–0.3
–0.6
–0.9
AC
F
16 15 14 13 12 11 10 9 8 7 6 5 4 3 2 1 Lag number
AC
F
16 15 14 13 12 11 10 9 8 7 6 5 4 3 2 1 Lag number
AC
F
Lower confidence limit
Upper confidence limit
Coefficient
Lower confidence limit
Upper confidence limit
Coefficient
Lower confidence limit
Upper confidence limit
Coefficient
Fig. 1. Coefficients of the autocorrelation function of different time
lags corresponding to different months for (a) the sample submission,
(b) the prevalence of Campylobacter spp. in broilers in Lower Saxony
and (c) the human incidence of campylobacteriosis in Lower Saxony.
The upper and the lower confidence limits refer to the 95% confi-
dence limits.
S. Hartnack et al. Campylobacter Monitoring
ª 2008 The Authors
Journal compilation ª 2008 Blackwell Verlag • Zoonoses Public Health. 56 (2009) 117–128 121

120(b)
100
80
60
40
20
0
–20
Tre
nd
-cyc
le
JUL2006
JAN2006
JUL2005
JAN2005
JUL2004
JAN2004
JUL2003
JAN2003
JUL2002
JAN2002
JUL2001
JAN2001
Date
120
100
80
60
40
20
0
–20
Hu
man
inci
den
ce in
low
er s
axo
ny
(a)
JUL2006
JAN2006
JUL2005
JAN2005
JUL2004
JAN2004
JUL2003
JAN2003
JUL2002
JAN2002
JUL2001
JAN2001
Date
(c)
JUL2006
JAN2006
JUL2005
JAN2005
JUL2004
JAN2004
JUL2003
JAN2003
JUL2002
JAN2002
JUL2001
JAN2001
Date
120
100
80
60
40
20
0
–20
Sea
son
al f
acto
rs
JUL2006
JAN2006
JUL2005
JAN2005
JUL2004
JAN2004
JUL2003
JAN2003
JUL2002
JAN2002
JUL2001
JAN2001
Date
120(d)
100
80
60
40
20
0
–20
Sea
son
al a
dju
sted
ser
ies
JUL2006
JAN2006
JUL2005
JAN2005
JUL2004
JAN2004
JUL2003
JAN2003
JUL2002
JAN2002
JUL2001
JAN2001
Date
(e)120
100
80
60
40
20
0
–20
Res
idu
als
Fig. 2. Seasonal decomposition plot of the human incidence of campylobacterioses in Lower Saxony including a time plot of the original data
(a), a trend-cycle component (b), seasonal factors (c), a seasonal adjusted time plot (d) and the residuals (e).
Campylobacter Monitoring S. Hartnack et al.
ª 2008 The Authors
122 Journal compilation ª 2008 Blackwell Verlag • Zoonoses Public Health. 56 (2009) 117–128

(b)
Date
100
80
60
40
20
0
–20
Tre
nd
-cyc
le
MAY 2007NOV 2006MAY 2006NOV 2005MAY 2005NOV 2004MAY 2004
Date
100(a)
80
60
40
20
0
–20
Pre
vale
nce
low
er s
axo
ny
MAY 2007NOV 2006MAY 2006NOV 2005MAY 2005NOV 2004MAY 2004
(c)
MAY 2007NOV 2006MAY 2006NOV 2005MAY 2005NOV 2004MAY 2004
Date
100
80
60
40
20
0
–20
Sea
son
al f
acto
rs
Date
100(d)
80
60
40
20
0
–20
Sea
son
al a
dju
sted
ser
ies
MAY 2007NOV 2006MAY 2006NOV 2005MAY 2005NOV 2004MAY 2004
(e)
MAY 2007NOV 2006MAY 2006NOV 2005MAY 2005NOV 2004MAY 2004
Date
100
80
60
40
20
0
–20
Res
idu
als
Fig. 3. Seasonal decomposition plot of the prevalence of Campylobacter in broilers in Lower Saxony including a time plot of the original data
(a), a trend-cycle component (b), seasonal factors (c), a seasonal adjusted time plot (d) and the residuals (e).
S. Hartnack et al. Campylobacter Monitoring
ª 2008 The Authors
Journal compilation ª 2008 Blackwell Verlag • Zoonoses Public Health. 56 (2009) 117–128 123

temperature and the hours of sunshine (Fig. 7) indicating
that temperature is correlated with the prevalence of
Campylobacter in broilers in the same month and the two
following months. For the human campylobacterioses
incidence, additionally significant cross-correlations were
found the rainfall and the wind-force (not shown). Gen-
erally, the data pertaining to human campylobacterioses
exhibit a stronger cross-correlation with the climate data
than the Campylobacter prevalence in broilers.
NOV 2006MAY 2006NOV 2005MAY 2005NOV 2004MAY 2004Date
NOV 2006MAY 2006NOV 2005MAY 2005NOV 2004MAY 2004Date
NOV 2006MAY 2006NOV 2005MAY 2005NOV 2004MAY 2004Date
120(a)
(b)
(c)
100
80
60
40
20
Hu
man
inci
den
ce
100
80
60
40
20
0
Bro
iler
pre
vale
nce
25
20
15
10
5
0
–5
Mea
n t
emp
erat
ure
Fig. 4. Time plots for the monthly human incidence (cases per
100 000 inhabitants) of campylobacterioses (a), the prevalence in
broilers (b) and the mean temperature in Lower Saxony (c).
7 6 5 4 3 2 1 0 –1 –2 –3 –4 –5 –6 –7 Lag number
0.9
0.6
0.3
0.0
–0.3
–0.6
–0.9
CC
F
Lower confidence limit
Upper confidence limit
Coefficient
Fig. 5. Coefficients at different positive and negative time lags, corre-
sponding to different months, for the cross-correlation between
human campylobacterioses incidence and weighted broiler prevalence.
The upper and the lower confidence limits refer to the 95% confi-
dence limits.
76543210–1–2–3–4–5–6–7Lag number
0.9
0.6
0.3
0.0
–0.3
–0.6
–0.9
CC
F
Lower confidence limit
Upper confidence limit
Coefficient
Fig. 6. Coefficients at different positive and negative time lags, corre-
sponding to different months, of the seasonal adjusted time series for
the cross-correlation between human campylobacterioses incidence
and broiler prevalence. The upper and the lower confidence limits
refer to the 95% confidence limits.
Campylobacter Monitoring S. Hartnack et al.
ª 2008 The Authors
124 Journal compilation ª 2008 Blackwell Verlag • Zoonoses Public Health. 56 (2009) 117–128

Discussion
The German broiler-monitoring programme according to
the Zoonoses directive 2003/99/EC is intended to monitor
changes in antibiotic resistance. In order to detect possi-
ble trends in antibiotic resistance, at least 170 Campylo-
bacter isolates should be examined each year. This
demand was largely met during the years 2004–2006. Our
aim was to answer the question whether this database
could be additionally explored by time series analysis in
order to identify temporal patterns in the sample submis-
sion pattern and the infection prevalences in broiler flocks
in Germany, and temporal links to the climate patterns
and human Campylobacter monitoring data. Classical
seasonal decomposition is preferably performed with
longer time series comprising (if possible) observations
over several years or even decenniums to detect seasonal
and trend-cycle patterns. In our study, data were only
available for 6 years for the human campylobacterioses
and for 38 months for the Campylobacter prevalence in
broilers. We consider this time-span long enough to
detect seasonality (annual patterns) in the time series. For
describing reliable trend-cycle patterns, longer time series
would be needed. The question about appropriate length
for time series to be analysed in monitoring programmes
should be carefully addressed, as over a long time period
other influences like changes in diagnostic techniques and
disease awareness might play a role, too. We focussed on
the description of sample submission and prevalence dur-
ing the year and the relation between sample submission
and prevalence. Further, we considered the relationship in
time between prevalence of Campylobacter in broiler and
incidence of campylobacterioses in humans and the cli-
mate data temperature, rainfall and wind-force. The most
striking finding of this study is that the data indicate that
the seasonal peak in human campylobacterioses preceded,
rather than followed, the peak in broiler prevalence. This
result is in accordance with a study comparing the peak
of human Campylobacter infections (early June) with
Campylobacter isolation rates from fresh retail chicken
samples (late June) (Meldrum et al., 2005). If the effect of
season is removed by seasonal decomposition in the time
series human campylobacterioses and in the time series
broiler prevalence data, the cross-correlation between
these two time series is substantially reduced but still
present at time lag 0. It should be noted that the time of
notification of human campylobacteriosis and not the
date of infection or disease onset is recorded. This raises
the question about the relative importance of Campylo-
bacter in poultry for human campylobacterioses and leads
to the hypothesis that poultry may not be the main
source of infection for humans, but humans and poultry
may be infected by a common source (Hudson et al.,
1999; Skelly and Weinstein, 2003). The relative impor-
tance of human campylobacterioses because of contami-
nated poultry is considered to be between 20–40%
(Havelaar et al., 2007) in the Netherlands to 80%
frequency of food-borne transmission in the USA (Mead
et al., 1999). Several authors agree that there is a need for
quantifying the contribution of different sources to cam-
pylobacterioses (Patrick et al., 2004; Conlan et al., 2007;
Karenlampi et al., 2007). The Dioxin Crisis in Belgium in
1999 led to the complete withdrawal of poultry products
originating from Belgium, and simultaneously a decrease
in notified campylobacterioses was detected. This decrease
was estimated to be 40% as compared with the expected
number (Vellinga and Van Loock, 2002). Another finding
of our study is that the correlation between climate data
and human campylobacterioses seems to be stronger than
between climate data and broiler prevalence. It is difficult
to directly compare the suitability of the broiler and
human campylobacterioses data for time series analysis,
because both data were collected for different purposes
and by totally different data-generating processes. The
broiler-monitoring data can be described in terms of a
sampling process with known sampling frame and sample
sizes while the human data are based on absolute num-
bers of registered cases. Expected or potential sources of
bias (e.g. selection bias for the broiler data and under-
reporting in the human data) were not addressed in this
study. On the other hand, the data for a study investigat-
ing the effects of climate on the incidence of Campylobac-
ter spp. in humans and the prevalence in broiler flocks in
Denmark related to all the broiler flocks slaughtered
76543210–1–2–3–4–5–6–7Lag number
0.9
0.6
0.3
0.0
–0.3
–0.6
–0.9
CC
F
Lower confidence limit
Upper confidence limit
Coefficient
Fig. 7. Coefficients at different positive and negative time lags, cor-
responding to different months, for the cross-correlation between
mean monthly temperature and broiler prevalence. The upper and the
lower confidence limits refer to the 95% confidence limits.
S. Hartnack et al. Campylobacter Monitoring
ª 2008 The Authors
Journal compilation ª 2008 Blackwell Verlag • Zoonoses Public Health. 56 (2009) 117–128 125

during the period of the study but similarly indicate that
the climate factors with some time lags prior are more
useful predictors for human incidence than for broiler
flock prevalence (Patrick et al., 2004). The underlying rea-
sons for the seasonality in human campylobacterioses and
the Campylobacter prevalence in broiler remain elusive.
Further research, preferably an approach which combines
epidemiological, ecological, microbiological and veterinary
perspectives, seems to be necessary to assess the impact of
bio-security measures on poultry farms and to reduce the
public health burden because of Campylobacter. Data used
for the analysis were considered to be sufficient for an
evaluation on a monthly but not on a weekly basis. As
most of the countries, with the exception of Lower Sax-
ony, contributed less than 10% to the total sample sub-
mission, we decided to generate time series for Lower
Saxony and for Germany as a whole. No marked differ-
ence could be found between the situation of Campylo-
bacter in broilers in Lower Saxony and in Germany as a
whole in the database. In case of limited resources, it
could be advisable for future research to focus on Lower
Saxony instead of trying to investigate different regions.
Both sample submission and prevalence showed a strong
seasonal pattern and a decrease over time but the time
pattern was not fully synchronized. Whereas the seasonal-
ity for the sample submission seems to be related to the
Easter, summer and autumn holidays, the seasonality for
the prevalence with a peak in the summer months seems
to be related to climate factors, mainly the temperature in
the same month and the two previous months. In a study
that investigated environmental temperatures and the
incidence of food poisoning by the use of deseasonalized
data, a strong association between a rise in food poison-
ing and temperatures 2–5 weeks earlier (Bentham and
Langford, 2001) was detected. One of the limitations of
this study was that the available data did not allow gener-
ating time series on a weekly basis. The decrease in sam-
ple submission and in prevalence poses no problem for
the antibiotic resistance monitoring, as a sufficient
number of samples were still examined. However, this
decrease could hinder an appropriate estimation of the
prevalence. The extreme values of 0% or 100% prevalence
are mainly because of a very low number of submitted
samples, which were all negative or positive. This variabil-
ity in prevalence is in accordance with the inconclusive
data for prevalence of Campylobacter in broilers in the lit-
erature and underlines the need for a baseline study for
Campylobacter prevalence based on sample sizes which
are representative for the animals, the geographic origin
and the time point during the year when the samples are
taken. It would be useful if a minimum number of sam-
ple submissions per month could be examined. The
demand of appropriate comparable sampling techniques
and enumeration methods, which are important for the
evaluation of quantitative data (Scherer et al., 2006; Rass-
chaert et al., 2007) are presumed to be met by the organi-
zation of the broiler-monitoring programme. Despite the
fact that this monitoring programme is based on conve-
nience sampling in the slaughterhouses and the regional
labs and is not designed for appropriate prevalence esti-
mation, it still allows the description of Campylobacter
prevalence dynamics in broilers over the year. The sam-
pling scheme with a pool of 10 cloacal samples per
slaughter-batch is considered to be justified as the spread
of Campylobacter in a poultry flock is described to occur
in a few days and the probability that all animals will be
either positive or negative or that the within-herd preva-
lence is close to 100% is very high (Berndtson et al.,
1996; Evans and Sayers, 2000). The weightage factor based
on the variable number of animals per slaughter-batch
was calculated and used to generate weighted prevalence
time series. The aim was to account for possible bias in
the prevalence estimation because of the sampling scheme
of a fixed number of 10 cloacal samples pool regardless of
the slaughter-batch size. The slaughter-batch size was
assumed to be identical to the flock size. The effect of
weighting was that the prevalence was generally lower as
compared with the non-weighted time series. However,
slaughter-batch size was not significantly different in
Campylobacter positive or negative slaughter-batches. This
is in accordance with the findings of another study (Reg-
ula et al., 2005) and indicates that correction for slaugh-
ter-batch size does not improve the estimation of
prevalence.
The approach of seasonal decomposition was chosen
with the aims of eliminating seasonal factors and of
examining time-dependent but non-seasonal factors that
explain the relationship between Campylobacter in broilers
and campylobacterioses in humans. After removal of
trend and seasonal effects through decomposition, the
time series did not exhibit any pattern and, thus, it is
suggested that the variability over time can be sufficiently
explained by a trend and a seasonal component. To
describe the time series of incidence in more detail by a
model, which was beyond the scope of this study, it
should be taken into account that some seasonality is left
after decomposition, as is shown by the significant auto-
correlation coefficients of the errors at time lags 3, 6 and
14. The estimation of deseasonalized time series based on
a 12MA was accomplished parallel to the incidence of
campylobacterioses in humans and for the climate data to
compare the results between the two methods, which
were similar and thus reliable. As seasonal decomposition
was not possible for the time series of prevalence in broil-
ers because of a too short observation time, the esti-
mation of deseasonalized time series proved to be a
Campylobacter Monitoring S. Hartnack et al.
ª 2008 The Authors
126 Journal compilation ª 2008 Blackwell Verlag • Zoonoses Public Health. 56 (2009) 117–128

possibility for examining the relationship in time between
the different time series. The seasonally adjusted time ser-
ies for Campylobacter prevalence should be interpreted
carefully, as the estimated seasonal factors were calculated
for only two periods of the 12 months. The overall
pattern of seasonality is considered to be reliable and
significant auto- and cross-correlation coefficients are
meaningful. The data of the climate factors originate from
one meteorological station in Lower Saxony. This intro-
duces uncertainty in the interpretation of the results. For
further research on the interactions between the occur-
rence of Campylobacter in humans and in broilers, the
meteorological data from several stations should be used
to account for the variability in the data.
References
Adkin, A., E. Hartnett, L. Jordan, D. Newell, and H. Davison,
2006: Use of a systematic review to assist the development
of Campylobacter control strategies in broilers. J. Appl.
Microbiol. 100, 306–315.
Anonymous, 2006: The community summary report on trends
and sources of zoonoses, zoonotic agents, antimicrobial
resistance and foodborne outbreaks in the European Union
in 2005. EFSA J. 94, 107–111.
Bentham, G., and I. H. Langford, 2001: Environmental tem-
peratures and the incidence of food poisoning in England
and Wales. Int. J. Biometeorol. 45, 22–26.
Berndtson, E., M. L. Danielsson-Tham, and A. Engvall, 1996:
Campylobacter incidence on a chicken farm and the spread
of Campylobacter during the slaughter process. Int. J. Food
Microbiol. 32, 35–47.
Bull, S. A., V. M. Allen, G. Domingue, F. Jorgensen, J. A.
Frost, R. Ure, R. Whyte, D. Tinker, J. E. Corry, J. Gillard-
King, and T. J. Humphrey, 2006: Sources of Campylobacter
spp. colonizing housed broiler flocks during rearing. Appl.
Environ. Microbiol. 72, 645–652.
Chatfield, C., 2004: The Analysis of Time Series. An Introduc-
tion. CRC Press, Boca Raton.
Conlan, A. J., C. Coward, A. J. Grant, D. J. Maskell, and J. R.
Gog, 2007: Campylobacter jejuni colonization and transmis-
sion in broiler chickens: a modelling perspective. J. R. Soc.
Interface 4, 819–829.
Ekdahl, K., B. Normann, and Y. Andersson, 2005: Could flies
explain the elusive epidemiology of campylobacteriosis?
BMC Infect. Dis. 5, 11.
Ethelberg, S., J. Simonsen, P. Gerner-Smidt, K. E. Olsen, and
K. Molbak, 2005: Spatial distribution and registry-based
case–control analysis of Campylobacter infections in
Denmark, 1991–2001. Am. J. Epidemiol. 162, 1008–
1015.
Evans, S. J., and A. R. Sayers, 2000: A longitudinal study of
campylobacter infection of broiler flocks in Great Britain.
Prev. Vet. Med. 46, 209–223.
Eyles, R., D. Niyogi, C. Townsend, G. Benwell, and P. Wein-
stein, 2003: Spatial and temporal patterns of Campylobacter
contamination underlying public health risk in the Taieri
River, New Zealand. J. Environ. Qual. 32, 1820–1828.
Fleury, M., D. F. Charron, J. D. Holt, O. B. Allen, and A. R.
Maarouf, 2006: A time series analysis of the relationship of
ambient temperature and common bacterial enteric infections
in two Canadian provinces. Int. J. Biometeorol. 50, 385–391.
Ghafir, Y., B. China, K. Dierick, L. De Zutter, and G. Daube,
2007: A seven-year survey of Campylobacter contamination
in meat at different production stages in Belgium. Int. J.
Food Microbiol. 116, 111–120.
Havelaar, A. H., M. J. Mangen, A. A. de Koeijer, M. J. Bog-
aardt, E. G. Evers, W. F. Jacobs-Reitsma, W. van Pelt, J. A.
Wagenaar, G. A. de Wit, Z. H. van der, and M. J. Nauta,
2007: Effectiveness and efficiency of controlling Campylobac-
ter on broiler chicken meat. Risk Anal. 27, 831–844.
Hudson, J. A., C. Nicol, J. Wright, R. Whyte, and S. K. Hasell,
1999: Seasonal variation of Campylobacter types from
human cases, veterinary cases, raw chicken, milk and water.
J. Appl. Microbiol. 87, 115–124.
Kapperud, G., G. Espeland, E. Wahl, A. Walde, H. Herikstad,
S. Gustavsen, I. Tveit, O. Natas, L. Bevanger, and A. Digr-
anes, 2003: Factors associated with increased and decreased
risk of Campylobacter infection: a prospective case–control
study in Norway. Am. J. Epidemiol. 158, 234–242.
Karenlampi, R., H. Rautelin, D. Schonberg-Norio, L. Paulin,
and M. L. Hanninen, 2007: Longitudinal study of Finnish
Campylobacter jejuni and C. coli isolates from humans, using
multilocus sequence typing, including comparison with epi-
demiological data and isolates from poultry and cattle. Appl.
Environ. Microbiol. 73, 148–155.
Kovats, R. S., S. J. Edwards, D. Charron, J. Cowden, R. M.
D’Souza, K. L. Ebi, C. Gauci, P. Gerner-Smidt, S. Hajat, S.
Hales, P. G. Hernandez, B. Kriz, K. Kutsar, P. McKeown, K.
Mellou, B. Menne, S. O’Brien, W. van Pelt, and H. Schmid,
2005: Climate variability and campylobacter infection: an
international study. Int. J. Biometeorol. 49, 207–214.
Line, J. E., 2006: Influence of relative humidity on transmis-
sion of Campylobacter jejuni in broiler chickens. Poult. Sci.
85, 1145–1150.
Louis, V. R., I. A. Gillespie, S. J. O’Brien, E. Russek-Cohen, A.
D. Pearson, and R. R. Colwell, 2005: Temperature-driven
Campylobacter seasonality in England and Wales. Appl.
Environ. Microbiol. 71, 85–92.
Makridakis, S., S. C. Wheelwright, and R. J. Hyndman, 1998:
Forecasting: Methods and Applications. John Wiley & Sons,
New York.
Mead, P. S., L. Slutsker, V. Dietz, L. F. McCaig, J. S. Bresee, C.
Shapiro, P. M. Griffin, and R. V. Tauxe, 1999: Food-related
illness and death in the United States. Emerg. Infect. Dis. 5,
607–625.
Meldrum, R. J., J. K. Griffiths, R. M. Smith, and M. R. Evans,
2005: The seasonality of human campylobacter infection and
S. Hartnack et al. Campylobacter Monitoring
ª 2008 The Authors
Journal compilation ª 2008 Blackwell Verlag • Zoonoses Public Health. 56 (2009) 117–128 127

Campylobacter isolates from fresh, retail chicken in Wales.
Epidemiol. Infect. 133, 49–52.
Miller, G., G. M. Dunn, A. Smith-Palmer, I. D. Ogden, and N.
J. Strachan, 2004: Human campylobacteriosis in Scotland:
seasonality, regional trends and bursts of infection. Epidemi-
ol. Infect. 132, 585–593.
Murphy, C., C. Carroll, and K. N. Jordan, 2006: Environmen-
tal survival mechanisms of the foodborne pathogen
Campylobacter jejuni. J. Appl. Microbiol. 100, 623–632.
Nichols, G. L., 2005: Fly transmission of Campylobacter. Emerg.
Infect. Dis. 11, 361–364.
Nylen, G., F. Dunstan, S. R. Palmer, Y. Andersson, F. Bager, J.
Cowden, G. Feierl, Y. Galloway, G. Kapperud, F. Megraud,
K. Molbak, L. R. Petersen, and P. Ruutu, 2002: The seasonal
distribution of campylobacter infection in nine European
countries and New Zealand. Epidemiol. Infect. 128, 383–390.
Oliver, J. D., 2005: The viable but nonculturable state in bacte-
ria. J. Microbiol. 43, 93–100.
Patrick, M. E., L. E. Christiansen, M. Waino, S. Ethelberg, H.
Madsen, and H. C. Wegener, 2004: Effects of climate on
incidence of Campylobacter spp. in humans and prevalence
in broiler flocks in Denmark. Appl. Environ. Microbiol. 70,
7474–7480.
Pearson, A. D., M. Greenwood, T. D. Healing, D. Rollins, M.
Shahamat, J. Donaldson, and R. R. Colwell, 1993: Coloniza-
tion of broiler chickens by waterborne Campylobacter jejuni.
Appl. Environ. Microbiol. 59, 987–996.
Peters, J., J. Lienau, G. Nather, T. Alter, K. N. Mac, K. Scherer,
D. Schlichting, M. Friedmann, A. Kasbohrer, S. Braune, G.
Schleuter, M. Hohmann, M. Upmann, R. Scheller, K. Klen-
gel, K. Wilhelm, M. Seelmann, S. Hormannsdorfer, and L.
Ellerbroek, 2006: Resultate der ersten Phase des nationalen
Campylobacter-Masthahnchenmonitorings 2004–2005. Arch.
Lebensmittelhyg. 57, 137–141.
Rasschaert, G., K. Houf, J. Van Hende, and L. De Zutter,
2007: Investigation of the concurrent colonization with
Campylobacter and Salmonella in poultry flocks and
assessment of the sampling site for status determination at
slaughter. Vet. Microbiol. 123, 104–109.
Regula, G., D. M. Lo Fo Wong, U. Ledergerber, R. Stephan, J.
Danuser, B. Bissig-Choisat, and K. D. Stark, 2005: Evaluation
of an antimicrobial resistance monitoring program for Cam-
pylobacter in poultry by simulation. Prev. Vet. Med. 70, 29–43.
Rivoal, K., C. Ragimbeau, G. Salvat, P. Colin, and G. Ermel,
2005: Genomic diversity of Campylobacter coli and Campylo-
bacter jejuni isolates recovered from free-range broiler farms
and comparison with isolates of various origins. Appl.
Environ. Microbiol. 71, 6216–6227.
Rosenquist, H., N. L. Nielsen, H. M. Sommer, B. Norrung,
and B. B. Christensen, 2003: Quantitative risk assessment of
human campylobacteriosis associated with thermophilic
Campylobacter species in chickens. Int. J. Food Microbiol.
83, 87–103.
Sandberg, M., K. Nygard, H. Meldal, P. S. Valle, H. Kruse, and
E. Skjerve, 2006: Incidence trend and risk factors for cam-
pylobacter infections in humans in Norway. BMC Public
Health 6, 179.
Scherer, K., E. Bartelt, C. Sommerfeld, and G. Hildebrandt,
2006: Comparison of different sampling techniques and
enumeration methods for the isolation and quantification of
Campylobacter spp. in raw retail chicken legs. Int. J. Food
Microbiol. 108, 115–119.
Skelly, C., and P. Weinstein, 2003: Pathogen survival trajecto-
ries: an eco-environmental approach to the modeling of
human campylobacteriosis ecology. Environ. Health Perspect.
111, 19–28.
Talibart, R., M. Denis, A. Castillo, J. M. Cappelier, and G.
Ermel, 2000: Survival and recovery of viable but noncultiv-
able forms of Campylobacter in aqueous microcosm. Int. J.
Food Microbiol. 55, 263–267.
Tam, C. C., L. C. Rodrigues, S. J. O’Brien, and S. Hajat,
2006: Temperature dependence of reported Campylobacter
infection in England, 1989–1999. Epidemiol. Infect. 134,
119–125.
Uyttendaele, M., K. Baert, Y. Ghafir, G. Daube, L. De Zutter,
L. Herman, K. Dierick, D. Pierard, J. J. Dubois, B. Horion,
and J. Debevere, 2006: Quantitative risk assessment of Cam-
pylobacter spp. in poultry based meat preparations as one of
the factors to support the development of risk-based micro-
biological criteria in Belgium. Int. J. Food Microbiol. 111,
149–163.
Van Gerwe, T. J., A. Bouma, W. F. Jacobs-Reitsma, B. J. van
den, D. Klinkenberg, J. A. Stegeman, and J. A. Heesterbeek,
2005: Quantifying transmission of Campylobacter spp.
among broilers. Appl. Environ. Microbiol. 71, 5765–5770.
Vellinga, A., and F. Van Loock, 2002: The dioxin crisis as
experiment to determine poultry-related campylobacter
enteritis. Emerg. Infect. Dis. 8, 19–22.
Wagenaar, J. A., D. J. Mevius, and A. H. Havelaar, 2006:
Campylobacter in primary animal production and control
strategies to reduce the burden of human campylobacterio-
sis. Rev. Sci. Tech. 25, 581–594.
Wedderkopp, A., K. O. Gradel, J. C. Jorgensen, and M. Mad-
sen, 2001: Pre-harvest surveillance of Campylobacter and Sal-
monella in Danish broiler flocks: a 2-year study. Int. J. Food
Microbiol. 68, 53–59.
Wingstrand, A., J. Neimann, J. Engberg, E. M. Nielsen, P.
Gerner-Smidt, H. C. Wegener, and K. Molbak, 2006: Fresh
chicken as main risk factor for campylobacteriosis,
Denmark. Emerg. Infect. Dis. 12, 280–285.
Campylobacter Monitoring S. Hartnack et al.
ª 2008 The Authors
128 Journal compilation ª 2008 Blackwell Verlag • Zoonoses Public Health. 56 (2009) 117–128