Edge effect and structure of mixed-species bird flocks in an Afrotropical lowland forest
15
ORIGINAL ARTICLE Edge effect and structure of mixed-species bird flocks in an Afrotropical lowland forest Guillaume Pe ´ron Pierre-Andre ´ Crochet Received: 21 October 2008 / Revised: 20 November 2008 / Accepted: 12 January 2009 / Published online: 10 February 2009 Ó Dt. Ornithologen-Gesellschaft e.V. 2009 Abstract Avian mixed-species flocks are a dominant feature of tropical moist forests, yet their cost–benefit balance and habitat dependence in Africa are not fully documented. We recorded the composition of mixed-spe- cies bird flocks in a pristine Afrotropical lowland forest site in Salonga NP, DRC. Our data showed that at least four types of flock existed, one of which specialized on edge habitats. We used multivariate analyses to further charac- terize edge effect on the most documented mixed-species flock type and found a significant effect on flock compo- sition. While neither species guild nor preferential foraging stratum played an important role in flock participation, the nucleus role was played by a different species at the edge and in the interior, and both species abundance and asso- ciations were habitat-dependant, suggesting ‘‘domino effects’’ on the structure of mixed-species flocks. Keywords Flock size Heterospecific Multi-species Mutualism Salonga Introduction Mixed-species flocks are social groups of individuals of several different species that travel together through their habitat. They occur in many vertebrate taxa from fishes (Lukoschek and McCormick 2002) to mammals (Stensland et al. 2003; Bearzi 2006) and range from temporary associations (Ne ´meth and Moore 2007) to long-term rela- tionships with multi-species territoriality (Morse 1970; Jullien and Thiollay 1998). In birds, mixed-species flocks are found in a wide variety of forested ecosystems, but they reach their maximum development in communities of tropical moist forests, of which they are a dominant feature (Powell 1989). Mixed-species flocking has been puzzling ornithologists for decades, and the fitness advantages of mixed-species flocking behaviour are still only partially understood. Jullien and Clobert (2000) obtained results suggesting an enhanced survival in obligate flocking species, and while some studies showed that individuals fed at higher rates inside than outside mixed-species flocks (Herrera 1979; Hino 1998; Thomson and Ferguson 2007), others suggested that the benefit is the reduction in predation risk (e.g. Thiollay 1999). The most widely considered hypotheses are advantages of flock size when the number of individuals per species is limited (predation risk reduction: Hamilton 1971; Lazarus 1979; foraging enhancement: Clark and Mangel 1984) and mutualistic interactions between species (for foraging enhancement: Waite and Grubb 1988; Brown and Brown 1996; Hino 1998; Bearzi 2006; but also to some extent for predation risk reduction: Munn 1986). These hypotheses lead to different predictions about associations of particular species in flocks (Hutto 1994). Flock composition is also likely to be determined by environmental factors, through species requirements (‘‘species co-dependency on environmental variables’’: Hutto 1994). In tropical Asia, flocks exhibit a variation in composition along a disturbance gradient (Lee et al. 2005), while in South America, forest fragmentation leads to a change in composition via both modifications of the local Communicated by J. Fjieldsa ˚. G. Pe ´ron (&) P.-A. Crochet Equipe Biome ´trie et Biologie des Populations, Centre d’Ecologie Fonctionnelle et Evolutive, CNRS UMR 5175, 1919 Route de Mende, 34293 Montpellier, France e-mail: [email protected]; [email protected] 123 J Ornithol (2009) 150:585–599 DOI 10.1007/s10336-009-0376-4
-
Upload
independent -
Category
Documents
-
view
1 -
download
0
Transcript of Edge effect and structure of mixed-species bird flocks in an Afrotropical lowland forest

ORIGINAL ARTICLE
Edge effect and structure of mixed-species bird flocksin an Afrotropical lowland forest
Guillaume Peron Æ Pierre-Andre Crochet
Received: 21 October 2008 / Revised: 20 November 2008 / Accepted: 12 January 2009 / Published online: 10 February 2009
� Dt. Ornithologen-Gesellschaft e.V. 2009
Abstract Avian mixed-species flocks are a dominant
feature of tropical moist forests, yet their cost–benefit
balance and habitat dependence in Africa are not fully
documented. We recorded the composition of mixed-spe-
cies bird flocks in a pristine Afrotropical lowland forest site
in Salonga NP, DRC. Our data showed that at least four
types of flock existed, one of which specialized on edge
habitats. We used multivariate analyses to further charac-
terize edge effect on the most documented mixed-species
flock type and found a significant effect on flock compo-
sition. While neither species guild nor preferential foraging
stratum played an important role in flock participation, the
nucleus role was played by a different species at the edge
and in the interior, and both species abundance and asso-
ciations were habitat-dependant, suggesting ‘‘domino
effects’’ on the structure of mixed-species flocks.
Keywords Flock size � Heterospecific � Multi-species �Mutualism � Salonga
Introduction
Mixed-species flocks are social groups of individuals of
several different species that travel together through their
habitat. They occur in many vertebrate taxa from fishes
(Lukoschek and McCormick 2002) to mammals (Stensland
et al. 2003; Bearzi 2006) and range from temporary
associations (Nemeth and Moore 2007) to long-term rela-
tionships with multi-species territoriality (Morse 1970;
Jullien and Thiollay 1998). In birds, mixed-species flocks
are found in a wide variety of forested ecosystems, but they
reach their maximum development in communities of
tropical moist forests, of which they are a dominant feature
(Powell 1989).
Mixed-species flocking has been puzzling ornithologists
for decades, and the fitness advantages of mixed-species
flocking behaviour are still only partially understood.
Jullien and Clobert (2000) obtained results suggesting an
enhanced survival in obligate flocking species, and while
some studies showed that individuals fed at higher rates
inside than outside mixed-species flocks (Herrera 1979;
Hino 1998; Thomson and Ferguson 2007), others suggested
that the benefit is the reduction in predation risk (e.g.
Thiollay 1999). The most widely considered hypotheses are
advantages of flock size when the number of individuals per
species is limited (predation risk reduction: Hamilton 1971;
Lazarus 1979; foraging enhancement: Clark and Mangel
1984) and mutualistic interactions between species (for
foraging enhancement: Waite and Grubb 1988; Brown and
Brown 1996; Hino 1998; Bearzi 2006; but also to some
extent for predation risk reduction: Munn 1986). These
hypotheses lead to different predictions about associations
of particular species in flocks (Hutto 1994).
Flock composition is also likely to be determined by
environmental factors, through species requirements
(‘‘species co-dependency on environmental variables’’:
Hutto 1994). In tropical Asia, flocks exhibit a variation in
composition along a disturbance gradient (Lee et al. 2005),
while in South America, forest fragmentation leads to a
change in composition via both modifications of the local
Communicated by J. Fjieldsa.
G. Peron (&) � P.-A. Crochet
Equipe Biometrie et Biologie des Populations,
Centre d’Ecologie Fonctionnelle et Evolutive,
CNRS UMR 5175, 1919 Route de Mende,
34293 Montpellier, France
e-mail: [email protected];
123
J Ornithol (2009) 150:585–599
DOI 10.1007/s10336-009-0376-4
avifauna and of the flocking propensity (Stouffer and
Bierregaard 1995; Stratford and Stouffer 1999). In an
Afrotropical forest site, Dale et al. (2000) found an effect
of distance to edge on the understorey bird community,
which would probably have been reflected in flock com-
position. There are few other studies about the edge effect
on the Afrotropical avifauna, especially focusing on mixed-
species flocks of insectivorous birds. Yet, as suggested
above, there are reasons to believe that the on-going
deforestation (Achard et al. 2002) and associated habitat
changes will impact on flock structure as it does in other
tropical ecosystems (Stouffer and Bierregaard 1995;
Maldonado-Coelho and Marini 2004), potentially acceler-
ating the impoverishment of avian communities, if flocking
is important for the maintenance of any given species
(Powell 1989). Furthermore, the role of ‘‘nucleus’’ species
(species that maintain cohesion, attract other flock mem-
bers and lead the flock; Moynihan 1962) has been little
studied for what concerns the changes between habitats:
are the nucleus species the same at the edge and in the
interior and what happens if the nucleus species becomes
scarce (Hart and Freed 2003)? More generally, are the
associations between different species habitat-dependant?
Here, we used data on flock composition from a seldom
studied region, the Afrotropical lowland forest of the
Congo basin, in a pristine habitat with little human
encroachment, to study the variation in flock structure
between edge and interior habitats. The first aim was to
detect and characterise the edge effect on flock structure,
through species abundance and/or species associations,
potentially highlighting a change in nucleus species.
Second, in an Afrotropical context, little is known about
potential proximal and ultimate mechanisms leading to
associations of particular species. If birds flock to gain
access to the greatest possible flock size (Clark and Mangel
1984), there should be much reduced influence of flock
composition on flock participation (Pomara et al. 2007),
whereas if species compatibilities and complementarities
drive mixed-species flocking, flock composition should
reflect species-specific mutualistic interactions (Hutto
1994), and we would expect in particular different guilds to
associate (Brosset and Erard 1986; Munn 1986), so that
they can benefit from their different skills (Giraldeau 1984;
see also Waite and Grubb 1988). We thus studied potential
determinants of flock participation: effect of the guild
(main insectivore feeding technique; King and Rappole
2001), of the preferential feeding strata (height at which the
species takes most of its prey; Jullien and Thiollay 1998),
of the intrinsic preference for edge or interior (habitat
preference; King and Rappole 2000) and of the flock spe-
cies richness (number of species in the flock; Maurer
1984). All these effects also constitute potential ways
through which habitat can impact on flock structure.
Methods
Study site
A description of the site of Lui Kotal (02�45.6100S,
0�22.7230E) appears in Hohmann and Fruth (2003) and
Fruth et al. (2003). This site is situated in the Salonga
National Park, in the Bandundu province of the Democratic
Republic of the Congo. It is a lowland rainforest with a low
canopy (main tree species: Staudtia stipitata, Greenwayo-
dendron suaveolens, Scorodophloeus zenkeri, Anonidium
manni and Parinari glabra; homogeneous stands of
Monopetalanthus pteridophyllus occur on poor sandy soils
and of Gilbertiodendron sp. and Brachystegia sp. on terra
firma soils). The understorey is generally dense (dominant
family: Rubiaceae; extensive areas are also covered with the
liana Haumania sp.). The rainforest there is dotted with
more or less large areas of savannah maintained open by
regular fires, and with areas of open marshes; it is also
crossed by rivers. There are thus naturally-occurring large
tracts of edge forest. We had access to both edge (considered
to be the 50-m-wide fringe around a man-made clearing and
the adjacent bank of a medium-sized river), and interior
(accessed through a network of forest trails of[50 km). The
sampled area was larger in the interior than in the edge
situation (magnitude of the areas within reach of the
observer: about 100 ha in the interior and 1 ha at the edge).
Although the limited area of edge habitat makes it difficult
to assert that flocks sampled there were completely inde-
pendent, we are confident about the fact that several flocks
shared this area as part of their home-range (Poulsen 1996a;
see also Brosset and Erard 1986 for a discussion about
shared home-range in ant-following flocks in Gabon). As a
confirmation of this assumption, variance in flock com-
position was not lower at the edge than in the interior (see
‘‘Results’’), contrary to what would have been predicted if
the number of independent flocks was much different.
Study species
The species commonly encountered in flocks (Table 1) are
territorial, at least during reproduction, and some, such as
Icterine Greenbul Phyllastrephus icterinus, show long-
lasting territory- and mate-fidelity (Brosset and Erard
1986). Flock participation is then likely determined by
territory boundaries (Jullien and Thiollay 1998; Pomara
et al. 2007; but see Poulsen 1996a). Most species from the
Afrotropical lowland forest are known to breed all year
round, with a peak of laying linked to the main rain season
(Brosset and Erard 1986). The main dry season is consi-
dered to be a period of low reproductive activity for forest
species; territorial behaviours such as singing decrease in
intensity during this season (Brosset and Erard 1986). We
586 J Ornithol (2009) 150:585–599
123

(G.P.) recorded data during June and July 2006, which
constitute the beginning of the main dry season. There was
thus little reproductive activity during data recording, and
hence little interference of this activity with flock partici-
pation (Develey and Peres 2000).
Information on species characteristics and requirements
(‘‘Appendix 1’’) were obtained from handbooks (Fry et al.
1988; Keith et al. 1992; Urban et al. 1997; Fry and Keith
2000, 2004). Using this information, we classified species
a priori following three criteria: (1) preference for edge or
interior, (2) preference for canopy (crown of tallest tree, or
above 20 m), mid-strata, or ground (below 3 m), and (3)
main insectivore feeding technique or ‘‘guild’’ (leaf-
gleaning, searching, sallying or bark-gleaning; nectari-
vores–insectivores and frugivores–insectivores were
classified according to their technique when catching
insects). The four guilds are derived from Thiollay (1999)
and Dale et al. (2000), where they are further described.
Data collection
A mixed-species flock is defined as at least two different
species foraging and moving in a similar direction, with
flock members less than 10 m apart (Morse 1970). This
definition is relatively large and includes temporary asso-
ciations. Each time such a group of individuals was
opportunistically detected from the network of trails, it was
followed for as long as possible. The species composing it
were recorded, except when the conditions (distance to
the observer, duration of the observation, vegetation)
obviously prevented the exhaustive determination of
all member species. The environmental variable (edge/
interior) was also recorded. On one occasion, the flock
moved from the interior to the edge; in this instance, it was
followed for a longer time period at the edge and was hence
recorded as an edge flock.
Only species contacted for more than 10 min were
recorded, which represents a trade-off between the risk of
including an individual not actually associating with the
flock and the difficulty of following the flock for a long
period in the vegetation. This 10-min contact period means
that temporary associations that last only for the time that a
flock spends in the attendants’ territory were included. We
only excluded some observations of obviously non-flock-
ing individuals that occurred by chance in the vicinity of a
flock that crossed their territory (e.g. Stiphornis erythro-
thorax, Illadopsis rufipennis).
Despite the difficulty of assessing accurately the number
of birds present in dense vegetation, we believe that at least
the different species could be detected (the very similar
Xavier’s and Icterine Greenbuls Phyllastrephus xavieri/ic-
terinus were pooled together, and the rope squirrels
Funisciurus sp. were not recorded). This means that we
collected no precise information on the actual size of the
flock (number of individual birds), but we did record the
flocks’ species richness (number of member species). We
did not record more than one flock per day, except when the
distance was at least 3,000 m between two flock encounters.
Statistical analysis
The analysis of flock composition was performed using
tools developed for community ecology. Statistical tests
were performed with R (R Development Core Team 2005).
Table 1 Core sets of species
These are species found in more
than 20% of the flocks sampled
in one or two of the habitats.
When the 20%-threshold was
exceeded in one habitat only,
we speak of species important at
the edge/in the interior only
Edge and Interior correspond to
the frequency in the flocks
sampled in the corresponding
situations
Species important in both edge and interior Edge Interior
Dicrurus atripennis Shining Drongo 0.30 0.24
Phyllastrephus icterinus Icterine Greenbul 0.33 0.74
Criniger calurus Red-tailed Bulbul 0.30 0.21
Deleornis axillaris Grey-headed Sunbird 0.63 0.37
Species important in interior only
Campethera nivosa Buff-spotted Woodpecker 0.11 0.26
Bleda syndactyla Common Bristlebill 0.0 0.21
Bleda n. notatus Green-tailed Bristlebill 0.0 0.21
Terpsiphone rufiventer Black-headed Paradise-Flycatcher 0.19 0.29
Species important at the edge only
Tockus camurus Red-billed Dwarf Hornbill 0.33 0.11
Coracina azurea Blue Cuckoo-Shrike 0.37 0.03
Terpsiphone batesi Bates’s Paradise-Flycatcher 0.26 0.13
Andropadus gracilirostris Slender-billed Greenbul 0.26 0.11
Hedydipna collaris Collared Sunbird 0.30 0.03
J Ornithol (2009) 150:585–599 587
123

Statistical tools for multivariate analyses were obtained
from the R-package VEGAN (Oksanen et al. 2007). We
conducted the analysis in three phases: (1) core species and
flock species richness, (2) multivariate analysis, and (3)
pair-based analysis of interspecific associations.
Core species and flock species richness
‘‘Core’’ or ‘‘important’’ species were defined as species
attending 20% or more of the observed flocks (which only
partially matches the definition for ‘‘nucleus’’ species;
Moynihan 1962). For the purpose of this study, we exam-
ined core species separately in the edge and the interior
situations. Flock species richness is the total number of
species in a flock.
Multivariate analyses
For these analyses, each flock was treated as an ‘‘individual’’
and all species recorded at least twice as ‘‘variables’’. As
outliers are known to distort the result of multivariate anal-
yses (Tabachnik and Fidell 1989), and because they
potentially have interesting ecological properties, we first
performed an outlier analysis (detection of flocks whose
dissimilarity with the rest of the dataset exceeded a cut-off
value). We used Sorensen distance (or Bray–Curtis distance;
McCune and Grace 2002) as a measure of dissimilarity with
cut-off value as two standard deviations from the mean. It
revealed four outlier flocks, which had marked ecological
characteristics (see ‘‘Results’’). To reduce in our sample the
variance linked with such ecological differences between
flocks, we chose to discriminate all flocks that were allied to
the strong outliers by lowering the cut-off value to 1.2 9 SD.
The following analyses were performed on the remaining 50
flocks, hereafter ‘‘typical understorey flocks’’.
We used non-metric multidimensional scaling (NMDS)
to ordinate sample units (remaining flocks, n = 50) in
species space (40 species) based on presence–absence of
species in flocks (McCune and Grace 2002). NMDS is a
computation-intensive optimisation method that minimises
the departure from monotonicity in the relationship between
the original dissimilarity in the n samples and their position
on a reduced k-dimensional ordination space. It is similar in
general purpose and philosophy to principal component
analysis (i.e. creating variables summarising the dissimi-
larities in species composition of the flocks), but reduces the
dimension of the data in a nonlinear fashion, and allows the
use of non-parametric tests. We used Sorensen distance as
dissimilarity measure (McCune and Grace 2002). To decide
the final dimension of the ordination space (k), we measured
the stress of the ordination procedure for k running from 1 to
6. The minimal stress was obtained for k equalling 4; there
were thus 4 axes in the final ordination space.
Multi-response permutation procedure (MRPP; Mielke
and Berry 2001) was then used to provide a non-para-
metric multivariate test of differences in the mixed-
species flocks among habitats. MRPP is based on an
analysis of a rank-transformed distance matrix, with the
same distance measure as NMDS (McCune and Grace
2002), and focuses on testing if the within-habitat aver-
age dissimilarities are smaller than predicted at random.
The observed mean distance among flocks of different
habitats is compared to the distribution of the distances
among habitats obtained from datasets where flocks are
assigned to each habitat category at random. This tech-
nique has already been used for the analysis of mixed-
species flock composition by, e.g., Lee et al. (2005). A
significant MRPP test would indicate that flock compo-
sition is markedly more similar within than between
habitats.
In the case of the effect of species richness of the flocks,
the explanatory variable was continuous, requiring the use
of a non-parametric multivariate analysis of variance
(MANOVA) that allows the user to fit linear models to
distance matrices (Anderson 2001; function adonis in
VEGAN). A significant test of the MANOVA would
indicate that composition of the flocks varies along the
gradient of species richness, i.e. that some species are more
often associated with poor or diverse flocks than expected
at random.
MRPP was also used on species ordination (i.e. on the
transposed observation matrix) to test for the influence of
species’ guilds on flock participation. A significant MRPP
P value for feeding techniques would indicate that flocks
attended by species of the same guild are more similar
than expected at random, i.e. that species associate pref-
erentially inside their guild. To formally test the
hypothesis that species associate with members of dif-
ferent guilds, we studied nearest neighbours in the species
ordinated space. Nearest neighbours of a given species
had to be present in at least two samples to be consi-
dered. We then performed a Fisher’s exact test on the
table ‘‘guild of the species/guild of its nearest neighbour’’
containing in cell (i, j) the number of neighbour pairs
with one species from guild i and one species from guild
j. This test indicated whether some pairs of guilds were
more or less often found together than expected at ran-
dom, given the distribution of the guilds among the study
species. If the MRPP was non-significant and the Fisher’s
test was significant, species associated preferentially with
at least one member of a different guild. The alternative
hypothesis was that species associated independently of
their guild and corresponded to non-significance of both
tests. The effect of other species characteristics (prefer-
ential strata, preference for edge) was tested in the same
way.
588 J Ornithol (2009) 150:585–599
123

Pair-based analysis of interspecific associations
Analyses that highlight the associations between individ-
ual pairs of species permit more detailed insight into the
potential behavioural mechanisms underlying flock com-
position than larger-scale multivariate analysis, and we
used them to highlight the changes in species association
between edge and interior. In particular, as nucleuses
attract other species, they should be found associated with
a comparatively great number of species (Moynihan
1962).
Study of pair-based associations was performed fol-
lowing the methodology described and used in, e.g.,
Hutto (1994) and Hart and Freed (2003), based on a
coefficient of interspecific association and a Fisher’s
exact test. We performed the analyses separately for
edge and interior, so that we could observe the change in
species association between these two habitats. More-
over, from the multivariate analyses, we learnt (see
‘‘Results’’) that habitat was a confounding environmental
factor (species co-dependency on environmental vari-
ables: Hutto 1994; King and Rappole 2000) which would
have biassed the analysis.
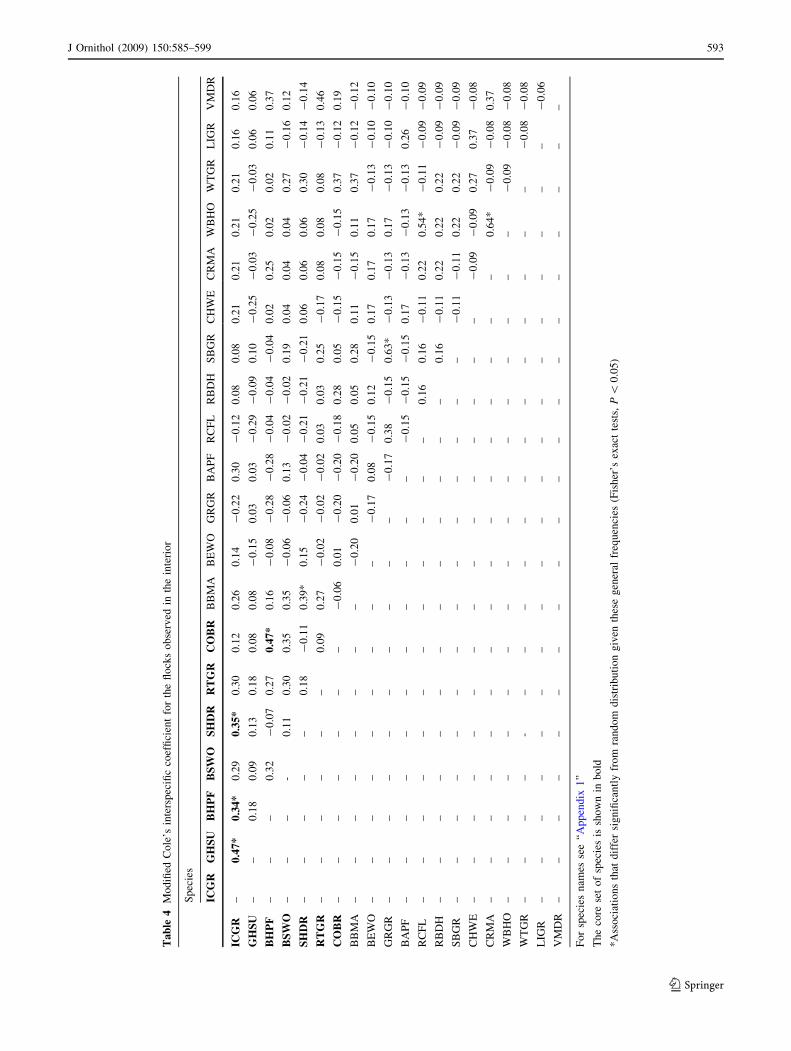
In order to detect whether species attracted or excluded
each other, we computed a coefficient of interspecific
association for each pair of species (Cole 1949). But we
modified Cole’s coefficient in order to have C(A,B) =
C(B,A):
C A;Bð Þ ¼ a� d � b� cffiffiffiffiffiffiffiffiffiffiffiffiffiffiffiffiffiffiffiffiffiffiffiffiffiffiffiffiffiffiffiffiffiffiffiffiffiffiffiffiffiffiffiffiffiffiffiffiffiffiffiffiffiffiffiffiffiffi
aþ bð Þ aþ cð Þ d þ cð Þ d þ bð Þp ;
where a represents number of flocks where both species are
found, b the number of flocks in which only species A is
found, c the number of flock in which only B is found and d
the number of flocks in which neither is found. The coef-
ficient varies between -1 for completely exclusive species
and ?1 for obligate associated species. Its value is 0 for
species that associate randomly given their frequency in
flocks.
We further evaluated the significance of each associ-
ation using Fisher’s exact tests. This test was influenced
by sample size, which prevented the detection of
associations between rare and frequent species due to
the lack of statistical power. On the contrary, associa-
tions of species with similar frequencies were correctly
retrieved.
A positive association is hereafter a pair of species for
which the Cole’s coefficient is positive and the Fisher’s
test significant. A negative association is a pair of
species for which the Cole’s coefficient is negative and
the Fisher’s test significant. A species concentrating
positive associations was considered a candidate nucleus
species.
Results
Species richness of the flocks and core sets of species
As can be seen from ‘‘Appendix 1’’, only a handful of
species were regular members of mixed-species flocks.
Seventy-six species were seen in at least one mixed-species
flock, but only 47 occurred twice or more. The overall
mean specific diversity of the flocks was 5.6 species and
the most diverse flock had 13 species (Fig. 1). Table 1
shows the 13 species that were present in more than 20% of
the flocks (edge or interior). These species are hereafter
referred to as ‘‘core’’. Four species were in the core group
both at the edge and in the interior [Icterine Greenbul,
Grey-headed Sunbird Deleornis axiliaris, Shining Drongo
Dicrurus atripennis and Red-tailed Greenbul (RTGR)
Criniger calurus]. Two core species were found only in the
interior [Common Bristlebill (COBR) Bleda syndactila and
Green-tailed Bleda n. notatus]; no core species was strictly
restricted to edge habitats.
Among the rare flock attendants (those present in less
than 20% of the flocks), 21 species showed a higher fre-
quency at the edge than in the interior, 5 of them being
present only at the edge (‘‘Appendix 1’’). Only 11 species
were more frequent in the interior, of which 7 were only
found in the interior. As a result, species richness was
greater in the edge situation (Fig. 1; Table 2; Welch two-
sample t test: t54 = 2.6, P = 0.01).
Different flocking systems
Among the 65 flocks recorded, the outlier analysis revealed
four ‘‘strong’’ outliers (deviation from the mean [2SD).
These outlier flocks corresponded to clear ecological
groups: two were flocks of canopy feeders that aggregated
on emerging flying termites (Brosset and Erard 1986; Korb
0
2
4
6
8
10
12
14
16
2 3 4 5 6 7 8 9 10 11 12 13
Species richness
Fig. 1 Species richness of the 65 flocks recorded. Shaded areasflocks sampled in the interior. Unfilled areas flocks sampled at the
edge
J Ornithol (2009) 150:585–599 589
123
and Salewski 2000) and two were constituted of ground
feeders that followed ant-swarms to catch the invertebrates
they flush (Brosset and Erard 1986; Dobbs and Martin
1998). Flocks of canopy feeders included species such as
African Forest-Flycatcher Fraseria ocreata, Cassin’s Mal-
imbe Malimbus cassini, Yellow-mantled Weaver Ploceus
tricolor and Blue-throated Roller Eurystomus gularis.
Ground feeders flocks had species such as Brown Illodopsis
Illadopsis fulvescens, Fire-crested Alethe Alethe castanea,
Rufous Flycatcher-Thrush Stizorhina fraseri, Red-tailed
Ant-Thrush Neocossyphus rufus, Common Bristlebill and
Green-tailed Bristlebill. Lowering the cut-off value of the
outlier analysis also discriminated some flocks containing
only species of open areas and forest edge such as Collared
Sunbird Hedydipna collaris, Olive-bellied Sunbird Cynniris
chloropygius, Yellowbill Ceuthmochares aereus, Rufous-
bellied Helmetshrike Prionops rufiventris, and Sooty
Flycatcher Muscicapa infuscata. This markedly different
composition for some flocks suggested the existence of
edge-specialist flocks. Because they were not frequent
enough in our dataset, and because we cannot exclude that
some of these different flocks are in fact subsequent
encounters with the same group of individuals, we chose to
exclude these edge-specialist flocks from further multivar-
iate analysis and to focus on the effect of edge on the typical
forest understorey flocks. The most frequent species of
these typical forest flocks can be found in Table 1. These
species were all common and conspicuous members of the
local avifauna. In summary, we identified four main kinds
of flocks: typical understorey flocks, edge-specialist flocks,
ant-following and canopy-foraging flocks. The last three
types of flocks were all rare and the following multivariate
analyses are based on 50 typical understorey flocks.
Multivariate analysis
Differences between habitats
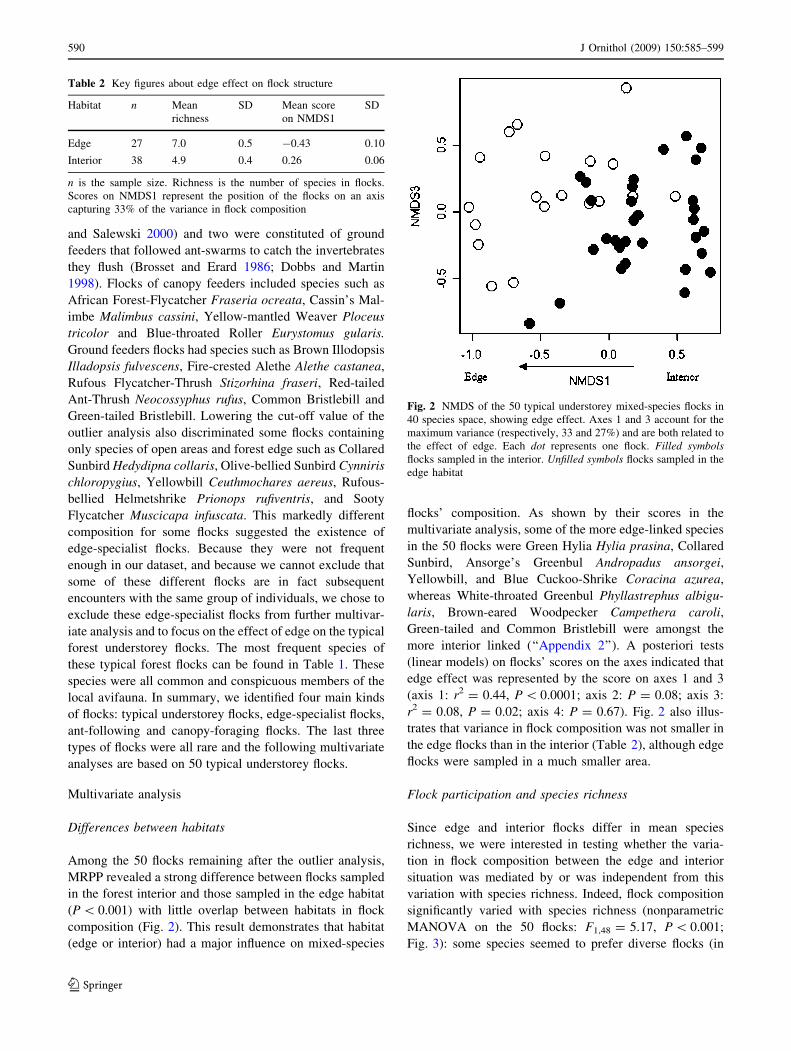
Among the 50 flocks remaining after the outlier analysis,
MRPP revealed a strong difference between flocks sampled
in the forest interior and those sampled in the edge habitat
(P \ 0.001) with little overlap between habitats in flock
composition (Fig. 2). This result demonstrates that habitat
(edge or interior) had a major influence on mixed-species
flocks’ composition. As shown by their scores in the
multivariate analysis, some of the more edge-linked species
in the 50 flocks were Green Hylia Hylia prasina, Collared
Sunbird, Ansorge’s Greenbul Andropadus ansorgei,
Yellowbill, and Blue Cuckoo-Shrike Coracina azurea,
whereas White-throated Greenbul Phyllastrephus albigu-
laris, Brown-eared Woodpecker Campethera caroli,
Green-tailed and Common Bristlebill were amongst the
more interior linked (‘‘Appendix 2’’). A posteriori tests
(linear models) on flocks’ scores on the axes indicated that
edge effect was represented by the score on axes 1 and 3
(axis 1: r2 = 0.44, P \ 0.0001; axis 2: P = 0.08; axis 3:
r2 = 0.08, P = 0.02; axis 4: P = 0.67). Fig. 2 also illus-
trates that variance in flock composition was not smaller in
the edge flocks than in the interior (Table 2), although edge
flocks were sampled in a much smaller area.
Flock participation and species richness
Since edge and interior flocks differ in mean species
richness, we were interested in testing whether the varia-
tion in flock composition between the edge and interior
situation was mediated by or was independent from this
variation with species richness. Indeed, flock composition
significantly varied with species richness (nonparametric
MANOVA on the 50 flocks: F1,48 = 5.17, P \ 0.001;
Fig. 3): some species seemed to prefer diverse flocks (in
Table 2 Key figures about edge effect on flock structure
Habitat n Mean
richness
SD Mean score
on NMDS1
SD
Edge 27 7.0 0.5 -0.43 0.10
Interior 38 4.9 0.4 0.26 0.06
n is the sample size. Richness is the number of species in flocks.
Scores on NMDS1 represent the position of the flocks on an axis
capturing 33% of the variance in flock composition
Fig. 2 NMDS of the 50 typical understorey mixed-species flocks in
40 species space, showing edge effect. Axes 1 and 3 account for the
maximum variance (respectively, 33 and 27%) and are both related to
the effect of edge. Each dot represents one flock. Filled symbolsflocks sampled in the interior. Unfilled symbols flocks sampled in the
edge habitat
590 J Ornithol (2009) 150:585–599
123

particular Hairy-breasted Barbet Tricholaema hirsuta,
Velvet-mantled Drongo Dicrurus modestus and Blue-billed
Malimbe Malimbus nitens), whereas others associated with
few species at a time (in particular Yellow-spotted Nicator
Nicator chloris, Plain Greenbul Andropadus curvirostris
and Bates’ Paradise-Flycatcher Terpsiphone batesi). We
next checked whether variation in flock composition
between habitats was mediated by, or independent of,
variation in species richness. A posteriori tests (linear
models for edge and richness effects) on flocks’ scores on
the axes indicated no interaction between the two effects
(for the effect of species richness: axis 1: P = 0.50; axis 2:
P = 0.003; for the effect of habitat: axis 1: P = 0.03; axis
2: P = 0.53; for the interaction: axis 1: P = 0.52; axis 2:
P = 0.38). Thus, the second axis of the NMDS ordination
represented variation in flock richness independently of
edge effect (Fig. 3), while axis 1 was influenced by habitat
even when accounting for species richness.
Limited effect of species characteristics
MRPP revealed no significant effect of species’ guild on
the composition of the 50 mixed-species flocks (P = 0.43;
Fig. 4). The trend was for species to associate preferen-
tially with members of a different guild (e.g. sallying
species with searching or gleaning species), but formal test
of this hypothesis using the nearest neighbours in the
species ordinated space yielded a non-significant result
(Fisher’s exact test: P = 0.54). These results support the
alternative hypothesis that species associate independently
of their guild.
Similarly, MRPP revealed no effect of the species’
preferential feeding strata on flock participation (P =
0.20). The trend was for species to associate with species
feeding in the same strata. This trend became significant
when tested on nearest neighbours in the species ordinated
space (Fisher’s exact test: P = 0.02). However, because
the MRPP was non-significant, the support for a separate
flocking system in different strata was weak.
As expected, the a priori preference of species for edge
or interior significantly influenced flock participation (P =
0.004).
Associations between species pairs
Since habitat strongly affected species composition, we
performed interspecific association tests separately on edge
and interior flocks after having excluded outlier flocks. Only
positive associations were found: 13 out of 325 for edge
flocks (4%; Table 3) and eight out of 190 for interior flocks
(4%; Table 4). Although the frequency of significant asso-
ciations was close to the frequency predicted at random (5%,
which is the risk threshold of the test), this biased distribution
(no negative, only positive associations) suggested a non-
random mechanism. Moreover, if looking only at the core
sets of species (9 and 7 most common species in edge and
interior flocks, respectively), 20 and 19% of associations
Fig. 3 NMDS of the 50 typical understorey mixed-species flocks in
40 species space, showing effect of species richness. Axes 1 and 2
account for, respectively, 33 and 18% of the total variance and are
related to the effect of edge and species richness, respectively. Each
dot represents one flock. Filled black symbols upper quartile of flock
species richness. Unfilled symbols lower quartile of flock species
richness. Filled grey symbols flocks of medium richness
Fig. 4 NMDS of the 40 species in the 50 flocks’ space, showing
absence of guild effect. Axes 1 and 3 account for the maximum
variance (respectively, 33 and 27%). Black squares, black diamonds,
grey triangles and grey circles stand for gleaners, searchers, bark-
gleaners and salliers, respectively
J Ornithol (2009) 150:585–599 591
123

Tab
le3
Mo
difi
edC
ole
’sin
ters
pec
ific
coef
fici
ent
for
the
flo
cks
ob
serv
edat
the
edg
e
Spec
ies
GH
SU
BL
CS
ICG
RR
BD
HC
OS
UR
TG
RB
AP
FS
HD
RS
BG
RY
EL
LB
HP
FC
RM
AG
RG
RB
BM
AL
IGR
RC
MA
AN
GR
BS
WO
RC
FL
CH
WA
OL
SU
RB
HS
YE
LO
JAA
NW
BH
O
GH
SU
–0.4
2*
0.4
9*
0.3
50.4
3*
-0.0
80.3
60.5
2*
0.4
6*
0.1
00.4
00.2
10.4
00.3
40.3
40.1
20.2
80.0
10.0
10.0
10.2
80.2
80.2
80.2
10.2
1
BL
CS
––
0.4
9*
0.1
50.2
10.2
10.0
90.2
80.1
60.1
60.2
40.0
20.0
20.1
00.1
0-
0.1
50.2
1-
0.3
6-
0.0
6-
0.0
60.2
1-
0.0
60.2
10.0
5-
0.2
9
ICG
R–
––
-0.1
90.0
70.0
70.1
3-
0.0
80.4
0-
0.0
10.6
9*
0.2
80.0
60.3
70.1
40.1
4-
0.0
3-
0.3
3-
0.3
3-
0.0
3-
0.0
30.2
4-
0.0
30.0
80.4
0
RB
DH
––
––
0.7
7*
-0.3
70.3
30.1
30.2
0-
0.0
1-
0.1
90.2
80.4
9*
0.1
40.3
70.3
70.2
40.2
40.2
40.2
40.2
40.2
4-
0.0
3-
0.2
60.0
8
CO
SU
––
––
–-
0.3
10.3
8-
0.0
30.0
30.0
30.1
00.3
20.5
4*
0.4
20.4
20.4
20.0
00.2
80.2
80.0
00.0
00.2
80.0
0-
0.2
40.1
1
RT
GR
––
––
––
-0.2
60.1
80.0
30.0
3-
0.1
5-
0.1
5-
0.4
1-
0.0
8-
0.3
6-
0.3
60.0
00.0
00.0
00.0
00.0
0-
0.3
00.0
00.1
1-
0.2
4
BA
PF
––
––
––
–0.0
2-
0.1
6-
0.4
2-
0.1
00.3
80.3
80.2
20.2
20.7
10.3
20.0
30.0
30.0
3-
0.2
70.6
0*
0.0
30.1
40.1
4
SH
DR
––
––
––
––
0.0
8-
0.1
6-
0.1
0-
0.1
00.1
40.2
2-
0.0
4-
0.0
40.3
20.0
30.0
3-
0.2
70.3
20.0
30.6
0*
0.1
4-
0.2
2
SB
GR
––
––
––
––
–-
0.1
10.2
00.2
0-
0.0
60.2
70.0
00.0
00.3
7-
0.2
4-
0.2
40.0
70.3
70.0
7-
0.2
4-
0.1
90.1
7
YE
LL
––
––
––
––
––
0.2
0-
0.0
6-
0.0
6-
0.2
90.0
0-
0.2
9-
0.2
40.0
70.3
70.0
70.0
7-
0.2
40.0
7-
0.1
9-
0.1
9
BH
PF
––
––
––
––
––
–0.2
6-
0.2
90.0
50.0
50.0
5-
0.2
2-
0.2
2-
0.2
20.1
20.1
2-
0.2
20.1
2-
0.1
70.2
2
CR
MA
––
––
––
––
––
––
-0.0
10.3
30.0
50.6
1*
0.1
2-
0.2
2-
0.2
20.1
20.4
30.1
2-
0.2
20.2
20.2
2
GR
GR
––
––
––
––
––
––
–0.3
30.3
30.3
30.1
20.1
20.4
30.1
2-
0.2
20.7
40.1
20.2
20.2
2
BB
MA
––
––
––
––
––
––
––
0.1
00.4
10.1
70.1
7-
0.1
9-
0.1
9-
0.1
90.1
70.1
7-
0.1
50.2
7
LIG
R–
––
––
––
––
––
––
––
-0.2
2-
0.1
90.5
1-
0.1
9-
0.1
90.1
70.1
70.1
70.2
7-
0.1
5
RC
MA
––
––
––
––
––
––
––
––
0.1
7-
0.1
90.1
70.1
7-
0.1
90.5
1-
0.1
9-
0.1
50.2
7
AN
GR
––
––
––
––
––
––
––
––
–-
0.1
6-
0.1
6-
0.1
60.2
40.2
40.2
4-
0.1
30.3
4
BS
WO
––
––
––
-–
––
––
––
––
––
-0.1
6-
0.1
6-
0.1
6-
0.1
60.2
4-
0.1
3-
0.1
3
RC
FL
–––
––
––
––
––
––
–-
––
––
––
0.2
4-
0.1
60.2
4-
0.1
6-
0.1
3-
0.1
3
CH
WA
––
––
––
––
––
––
–-
––
––
––
–-
0.1
6-
0.1
6-
0.1
6-
0.1
3-
0.1
3
OL
SU
––
––
––
––
––
––
––
––
––
––
–-
0.1
6-
0.1
60.3
4-
0.1
3
RB
HS
––
––
––
––
––
––
––
––
––
––
––
–-
0.1
60.3
40.3
4
YE
LO
–––
––
–-
––
––
––
––
––
––
––
––
–-
0.1
3-
0.1
3
JAA
N–
––
––
––
––
-–
––
––
––
––
––
––
--
0.1
0
WB
HO
––
––
––
––
––
––
––
––
––
––
––
––
–
For
spec
ies
nam
esse
e‘‘
Appen
dix
1’’
The
core
set
of
spec
ies
issh
ow
nin
bold
*A
ssoci
atio
ns
that
dif
fer
signifi
cantl
yfr
om
random
dis
trib
uti
on
giv
enth
ese
gen
eral
freq
uen
cies
(Fis
her
’sex
act
test
s,P
\0.0
5)
592 J Ornithol (2009) 150:585–599
123
Ta
ble
4M
od
ified
Co
le’s
inte
rsp
ecifi
cco
effi
cien
tfo
rth
efl
ock
so
bse
rved
inth
ein
teri
or
Sp
ecie
s
ICG
RG
HS
UB
HP
FB
SW
OS
HD
RR
TG
RC
OB
RB
BM
AB
EW
OG
RG
RB
AP
FR
CF
LR
BD
HS
BG
RC
HW
EC
RM
AW
BH
OW
TG
RL
IGR
VM
DR
ICG
R–
0.4
7*
0.3
4*
0.2
90
.35
*0
.30
0.1
20
.26
0.1
4-
0.2
20
.30
-0
.12
0.0
80
.08
0.2
10
.21
0.2
10
.21
0.1
60
.16
GH
SU
––
0.1
80
.09
0.1
30
.18
0.0
80
.08
-0
.15
0.0
30
.03
-0
.29
-0
.09
0.1
0-
0.2
5-
0.0
3-
0.2
5-
0.0
30
.06
0.0
6
BH
PF
––
–0
.32
-0
.07
0.2
70
.47
*0
.16
-0
.08
-0
.28
-0
.28
-0
.04
-0
.04
-0
.04
0.0
20
.25
0.0
20
.02
0.1
10
.37
BS
WO
––
–-
0.1
10
.30
0.3
50
.35
-0
.06
-0
.06
0.1
3-
0.0
2-
0.0
20
.19
0.0
40
.04
0.0
40
.27
-0
.16
0.1
2
SH
DR
––
––
–0
.18
-0
.11
0.3
9*
0.1
5-
0.2
4-
0.0
4-
0.2
1-
0.2
1-
0.2
10
.06
0.0
60
.06
0.3
0-
0.1
4-
0.1
4
RT
GR
––
––
––
0.0
90
.27
-0
.02
-0
.02
-0
.02
0.0
30
.03
0.2
5-
0.1
70
.08
0.0
80
.08
-0
.13
0.4
6
CO
BR
––
––
––
–-
0.0
60
.01
-0
.20
-0
.20
-0
.18
0.2
80
.05
-0
.15
-0
.15
-0
.15
0.3
7-
0.1
20
.19
BB
MA
––
––
––
––
-0
.20
0.0
1-
0.2
00
.05
0.0
50
.28
0.1
1-
0.1
50
.11
0.3
7-
0.1
2-
0.1
2
BE
WO
––
––
––
––
–-
0.1
70
.08
-0
.15
0.1
2-
0.1
50
.17
0.1
70
.17
-0
.13
-0
.10
-0
.10
GR
GR
––
––
––
––
––
-0
.17
0.3
8-
0.1
50
.63
*-
0.1
3-
0.1
30
.17
-0
.13
-0
.10
-0
.10
BA
PF
––
––
––
––
––
–-
0.1
5-
0.1
5-
0.1
50
.17
-0
.13
-0
.13
-0
.13
0.2
6-
0.1
0
RC
FL
––
––
––
––
––
––
0.1
60
.16
-0
.11
0.2
20
.54
*-
0.1
1-
0.0
9-
0.0
9
RB
DH
––
––
––
––
––
––
–0
.16
-0
.11
0.2
20
.22
0.2
2-
0.0
9-
0.0
9
SB
GR
––
––
––
––
––
––
––
-0
.11
-0
.11
0.2
20
.22
-0
.09
-0
.09
CH
WE
––
––
––
––
––
––
––
–-
0.0
9-
0.0
90
.27
0.3
7-
0.0
8
CR
MA
––
––
––
––
––
––
––
––
0.6
4*
-0
.09
-0
.08
0.3
7
WB
HO
––
––
––
––
––
––
––
––
–-
0.0
9-
0.0
8-
0.0
8
WT
GR
––
––
-–
––
––
––
––
––
––
-0
.08
-0
.08
LIG
R–
––
––
––
––
––
––
––
––
––
-0
.06
VM
DR
––
––
––
––
––
––
––
––
––
––
Fo
rsp
ecie
sn
ames
see
‘‘A
pp
end
ix1
’’
Th
eco
rese
to
fsp
ecie
sis
sho
wn
inb
old
*A
sso
ciat
ion
sth
atd
iffe
rsi
gn
ifica
ntl
yfr
om
ran
do
md
istr
ibu
tio
ng
iven
thes
eg
ener
alfr
equ
enci
es(F
ish
er’s
exac
tte
sts,
P\
0.0
5)
J Ornithol (2009) 150:585–599 593
123

were significant (upper left part in Tables 3 and 4). In this
case, it was much higher than expected at random.
Species that were in the core sets of both edge and
interior flocks were particularly interesting for our purpose.
Icterine Greenbul was the most often involved species in
significant associations in the interior (ICGR in Table 4),
while Grey-headed Sunbird took over at the edge (GHSU
in Table 3). Except for ICGR and GHSU, few species
accumulated several positive associations. Both ICGR and
GHSU were the most frequent species in the flocks sam-
pled in interior or edge habitat, respectively. ICGR and
GHSU thus exhibited the ‘‘quantitative’’ criteria for can-
didate nucleus species, each one in a different habitat. In
both habitats, these two species were also positively asso-
ciated. Furthermore, they meet two of Moynihan’s (1962)
‘‘qualitative’’ criteria (they live in groups even when out-
side mixed-species flocks and, although not strikingly
coloured, they have conspicuous behaviour in the form of
frequent contact calls and active foraging behaviour). On
the other hand, Shining Drongo (SHDR) exhibited what we
term a ‘‘follower’’ pattern: it got involved in a single
association with the greenbul in the interior and with the
sunbird at the edge. Interestingly, the other common sal-
lying species in the interior, Black-headed Paradise-
Flycatcher, also associated with Common Bristlebill
(association BHPF–COBR in Table 3). Hence, the absence
of COBR from the edge area possibly induced the relative
scarcity of BHPF in the edge flocks. The third typical
pattern that we observed was the ‘‘independent’’ RTGR,
showing no significant association with any species, thus
suggesting no specialized interaction with other flocking
species.
Discussion
This study is, to our knowledge, the first to quantify inter-
specific bonds among participants of avian mixed-species
flocks in the Congo Basin. Similarly to most previous
studies from Asia and Africa, an active gleaning species
was found to play nucleus role, while some ‘‘sentinels’’
such as drongos Dicrurus sp. were not identified as nucleus
species by the criteria we used. They thus appear to follow
the flock, in accordance with our impressions gained from
observing the flock behaviour (G.P., unpublished data) and
with other studies (e.g. Hino 1998; Chen and Hsieh 2002)
which have similarly identified Dicrurus sp. as flock fol-
lowers. This result on drongo behaviour is clearly not valid
for every species of the genus since Dicrurus paradiseus is
an alternative flock leader in Sri Lanka (Goodale and Ko-
tagama 2006), and we cannot exclude that the presence of
D. atripennis in the flocks in our study area either enhances
flock cohesion or duration of the associations.
Compared to previous studies from the Neotropics and
tropical Asia, species richness was low, an average 5.6
species per flock. This value lies within the range reported
in South African woodlands (Thomson and Ferguson 2007)
and in Taiwan (Chen and Hsieh 2002), but at latitudes in
Asia similar to our site’s values range around 10 species
per flock (Kotagama and Goodale 2004; Lee et al. 2005)
and generally exceed 10 in South American equatorial
lowland forests (Maldonado-Coelho and Marini 2004;
Jullien and Thiollay 1998; Powell 1989; Munn and Ter-
borgh 1979), with an exceptionally high value of 21.7
reported in a montane forest in Ecuador (Poulsen 1996a).
Our low value likely results from the lower avian diversity
in the considered site than in other study areas (Weber et al.
2001), possibly linked to the recent existence of the con-
temporary African lowland forest belt as compared to other
continental rainforests. It might also reflect the fact that our
sample included temporary associations created when
mono-specific nucleus flocks entered attendants’ territories
(so-called ‘‘bird waves’’), which possibly biased the spe-
cies richness downwards. More generally, we suspect that
the flock attendance patterns were much less stable than
found in Amazonian (Munn and Terborgh 1979) and
Guianan forest (Jullien and Thiollay 1998).
Edge effect
Distance to edge, forest fragmentation and disturbance are
often critical factors in ecological community analysis.
Previous studies on avian communities of the forest un-
derstorey (Stouffer and Bierregaard 1995; Dale et al. 2000;
Maldonado-Coelho and Marini 2004; Lee et al. 2005)
showed that species assemblage varies from forest interior
to edge (or pristine to disturbed areas), either through
changes in the general frequency or in the flocking pro-
pensity of the species. Here, we obtained concordant
results in the form of an edge effect at the flock compo-
sition level. Quite intuitively, we found strong evidence
that intrinsic preference for edge or interior habitat drove
the composition of the flocks. However, the existence of
further ‘‘domino effects’’ (change in flock composition
mediated by species-specific interactions) was suggested
by the link between BHPF and COBR, which probably
induced the relative scarcity of BHPF at the edge, because
COBR is an interior specialist. In addition, the nucleus
species changed between edge (ICGR) and interior
(GHSU). Such a change from one nucleus species to the
other between different habitats within the same flocking
system has so far not been documented to our knowledge,
and might be relevant for the maintenance of flocking
behaviour in disturbed areas. Overall, the three different
edge effects documented (change in species richness,
change in the frequency of species, change in nucleus
594 J Ornithol (2009) 150:585–599
123

species) resulted in a significant difference in flock com-
position between edge and interior habitats, even if the
absence of clear-cut reaction to edge in most species (i.e.
most species were not strict habitat-specialists) and the
results of the outlier analysis showed that the edge and
interior flocks belonged to the same flocking system.
Interestingly, the three commonest flock members
(Grey-headed Sunbird, Icterine Greenbul and Shining
Drongo) are described in handbooks as avoiding degraded,
cleared forest. Here, they were found abundant in flocks
occurring at a naturally-occurring edge (Table 1), as were
to a lesser extent other interior specialists (e.g. Buff-spotted
Woodpecker). Such exploitation of edge habitats around
primary forest by specialised species (primary forest and
understorey microhabitat specialists) might be made pos-
sible by mixed-species flocking (Stouffer and Bierregaard
1995; Lee et al. 2005). Indeed, Hino (1998) suggested that
mixed-species flocking might be a way for specialised
species to broaden their ecological niche.
Two other proximal mechanisms were considered in this
study to explain the variation in flock composition between
habitats: preferential strata and species richness. If strata
were differently organised at the edge and in the interior
and strata preference influenced flock participation, this
could induce an edge effect on flock composition. We
obtained only weak support for this hypothesis; the effect
of strata was not significant in the permutation analysis.
Similarly, as flocks’ species richness varied with habitat
and influenced flock participation, it could have induced
the observed edge effect. However, we showed that both
effects were additive. Thus, the effect of edge was most
likely the result of species intrinsic habitat preference and
domino effects. Furthermore, as our data discarded the role
of exclusion of some species by others, we are not aware of
any explanation for the richness effect, which would
require confirmation through further data collection.
Evolutionary causes of flock formation
If flocking was aimed at benefiting from mutualistic
interactions between ‘‘complementary’’ species, species
from different guilds would be expected to associate
together. Yet, guilds did not play a prominent role in
species associations in our study. Our results on pair
association suggest that the general case is the lack of
mutualistic associations between flock members; most
species seem indifferent to one another when joining in a
mixed-species flock. Similarly, King and Rappole (2001)
suggest that individuals in flocks do not cooperate in food
location, and Poulsen (1996b) points that flocking is
enhanced when birds are forced to unfamiliar, risky areas.
This is also consistent with results of Pomara et al. (2007),
who showed that in several Neotropical passerine species
individuals join any flock that enter their home-range,
whatever the composition of the flock. In our case, the
behaviour of some of the flock participants (e.g. RTGR,
and most rare flock attendants) remained unexplained by
the mutualism hypothesis. For these species, intra-specific
competition and density-dependant mechanisms might
prevent or limit the formation of single-species flocks, and
mixed-species flocking might then appear as an alternative
solution to benefit from the advantages of foraging in a
large group such as reduction of predation risk (Poulsen
1996b). Such species might flock with the first nucleus
species they encounter, hence our result that the nucleus
species was the most common species in the habitat
considered.
Yet, among core species, specialised interactions
occurred; significant interactions were markedly more
common in these sets of species (they represented 19 or
20% of the possible associations in these sets of species).
‘‘Shared vigilance-foraging association’’ seemed to occur
between some species pairs (associations GHSU–SHDR in
Table 3, and ICGR–SHDR, ICGR–BHPF and COBR–
BHPF in Table 4). Recent studies showing feeding benefits
of flocking behaviour highlighted the importance of these
interactions based on the ‘‘beating effect’’ (Hino 1998;
Thomson and Ferguson 2007). Moreover, in agreement
with most studies using pair-based tests (Hutto 1994; Latta
and Wunderle 1996; King and Rappole 2000, 2001; Hart
and Freed 2003), we found only positive associations (i.e.
only species that are more often found together than
expected at random, and no species pairs that exclude each
other), and, most importantly, after having corrected for the
possible confounding effect of shared preferences for edge
or interior. These interactions (Tables 3 and 4) are possibly
mutualistic and remain to be described in more detail in
this system. The relationships between core species thus
appeared to be at least partly driven by species-specific,
habitat-dependant interactions, but mixed-species flocking
also remained largely determined by species-independent
attraction for large group size.
Zusammenfassung
Randeffekt und Struktur von gemischtartlichen
Vogelschwarmen in einem afrotropischen Tieflandwald
Gemischtartliche Vogelschwarme sind ein dominantes
Merkmal tropischer Regenwalder, und doch sind ihre Kosten-
Nutzen Bilanz und ihre Habitatabhangigkeit in Afrika nicht
vollstandig dokumentiert. Wir nahmen die Zusammensetzung
von gemischtartlichen Vogelschwarmen in einem ursprung-
lichen afrotropischen Tieflandwald in Salonga NP, DRC auf.
Unsere Daten zeigten, dass es mindestens vier Schwarmtypen
J Ornithol (2009) 150:585–599 595
123

gab, von denen einer sich auf Randhabitate spezialisierte.
Wir wandten multivariate Analysemethoden an, um den
Randeffekt auf den am haufigsten dokumentierten Typ
gemischtartlicher Vogelschwarme genauer zu charakterisi-
eren, und wir fanden einen signifikanten Effekt fur die
Schwarmzusammensetzung. Wahrend weder die okologi-
sche Gilde der Arten noch das fur den Nahrungserwerb
bevorzugte Stratum eine wichtige Rolle in der Zugehorigkeit
an einem Schwarm spielten, wurde die Schlusselrolle von
einer anderen Art am Rand und im Innern gespielt, und
sowohl die Abundanz als auch die Vergesellschaftung der
Art waren habitatabhangig, was auf einen ,,Dominoeffekt’’
auf die Struktur von gemischtartlichen Vogelschwarmen
hindeutet.
Acknowledgments G.P. thanks G. Hohmann, leader of the project
Lui Kotal, and the Max-Planck-Institute for Evolutionary Anthro-
pology for having allowed him access to the research site. We are
grateful for the helpful comments of reviewers of a previous draft of
this article.
Appendix 1
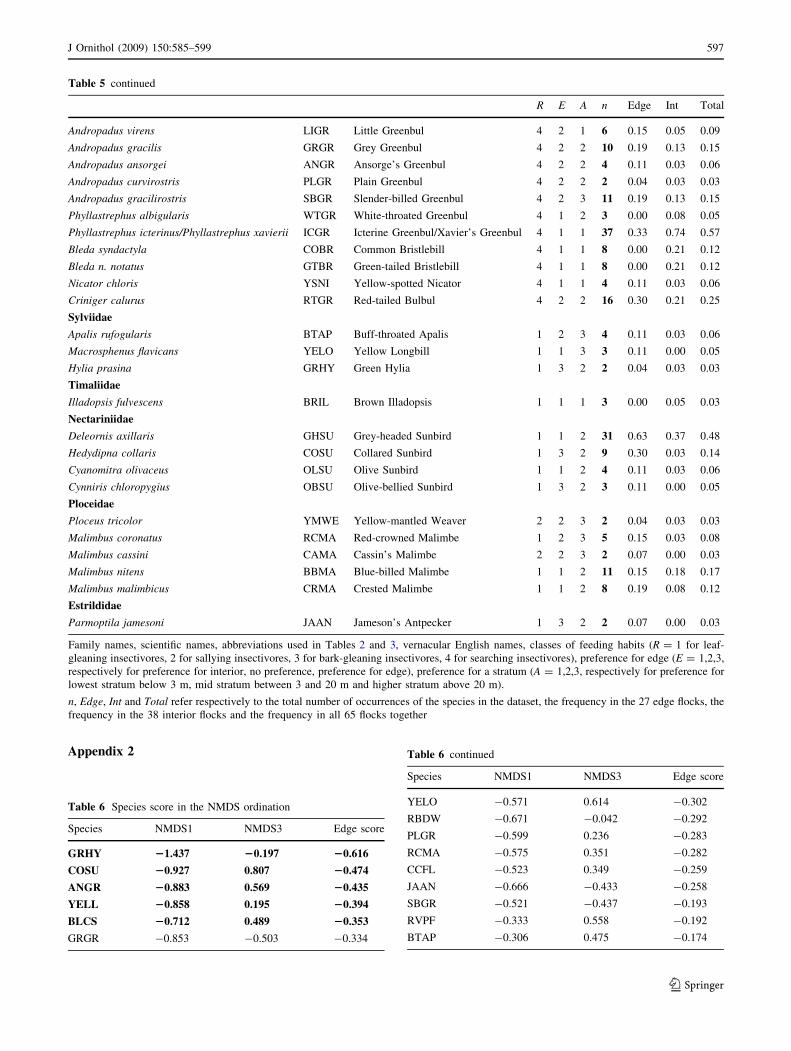
Table 5 Species seen more than once in 65 mixed-species flocks in Lui Kotal, Salonga N P. South, DRC
R E A n Edge Int Total
Musophagidae
Tauraco schuetti BBTU Black-billed Turaco 4 1 2 2 0.00 0.05 0.03
Cuculidae
Ceuthmochares aereus YELL Yellowbill 4 2 3 7 0.22 0.03 0.11
Lybiidae
Tricholaema hirsuta HBBA Hairy-breasted Barbet 4 1 2 3 0.00 0.08 0.05
Coraciidae
Eurystomus gularis BTRO Blue-throated Roller 2 2 3 5 0.15 0.03 0.08
Bucerotidae
Tockus camurus RBDH Red-billed Dwarf Hornbill 4 2 2 13 0.33 0.11 0.20
Picidae
Campethera nivosa BSWO Buff-spotted Woodpecker 3 1 2 13 0.11 0.26 0.20
Campethera caroli BEWO Brown-eared Woodpecker 3 1 2 5 0.00 0.13 0.08
Oriolidae
Oriolus brachyrhynchus WBHO Western Black-headed Oriole 4 2 2 5 0.07 0.08 0.08
Campephagidae
Coracina azurea BLCS Blue Cuckooshrike 4 2 3 11 0.37 0.03 0.17
Dicruridae
Dicrurus atripennis SHDR Shining Drongo 2 1 2 17 0.30 0.24 0.26
Dicrurus modestus VMDR Velvet-mantled Drongo 2 1 2 3 0.04 0.05 0.05
Monarchidae
Erythrocercus mccallii RCFL Red-capped Flycatcher 1 2 2 7 0.11 0.11 0.11
Terpsiphone rufiventer BHPF Black-headed Paradise-Flycatcher 2 1 2 16 0.19 0.29 0.25
Terpsiphone batesi BAPF Bates’s Paradise-Flycatcher 2 3 2 12 0.26 0.13 0.18
Platysteiridae
Diaphorophyia castanea CHWE Chestnut Wattle-eye 1 2 2 6 0.11 0.08 0.09
Prionopidae
Prionops rufiventris RBHS Rufous-bellied Helmetshrike 1 3 3 4 0.11 0.03 0.06
Muscicapidae
Stizorhina fraseri RUFT Rufous Flycatcher-Thrush 2 1 2 2 0.04 0.03 0.03
Neocossyphus rufus RTAT Red-tailed Ant-Thrush 1 1 1 2 0.00 0.05 0.03
Alethe castanea FCAL Fire-crested Alethe 1 1 1 3 0.00 0.08 0.05
Fraseria ocreata AFFF African Forest-Flycatcher 2 2 3 3 0.04 0.05 0.05
Muscicapa infuscata SOFL Sooty Flycatcher 2 3 3 3 0.11 0.00 0.05
Pycnonotidae
596 J Ornithol (2009) 150:585–599
123
Appendix 2
Table 5 continued
R E A n Edge Int Total
Andropadus virens LIGR Little Greenbul 4 2 1 6 0.15 0.05 0.09
Andropadus gracilis GRGR Grey Greenbul 4 2 2 10 0.19 0.13 0.15
Andropadus ansorgei ANGR Ansorge’s Greenbul 4 2 2 4 0.11 0.03 0.06
Andropadus curvirostris PLGR Plain Greenbul 4 2 2 2 0.04 0.03 0.03
Andropadus gracilirostris SBGR Slender-billed Greenbul 4 2 3 11 0.19 0.13 0.15
Phyllastrephus albigularis WTGR White-throated Greenbul 4 1 2 3 0.00 0.08 0.05
Phyllastrephus icterinus/Phyllastrephus xavierii ICGR Icterine Greenbul/Xavier’s Greenbul 4 1 1 37 0.33 0.74 0.57
Bleda syndactyla COBR Common Bristlebill 4 1 1 8 0.00 0.21 0.12
Bleda n. notatus GTBR Green-tailed Bristlebill 4 1 1 8 0.00 0.21 0.12
Nicator chloris YSNI Yellow-spotted Nicator 4 1 1 4 0.11 0.03 0.06
Criniger calurus RTGR Red-tailed Bulbul 4 2 2 16 0.30 0.21 0.25
Sylviidae
Apalis rufogularis BTAP Buff-throated Apalis 1 2 3 4 0.11 0.03 0.06
Macrosphenus flavicans YELO Yellow Longbill 1 1 3 3 0.11 0.00 0.05
Hylia prasina GRHY Green Hylia 1 3 2 2 0.04 0.03 0.03
Timaliidae
Illadopsis fulvescens BRIL Brown Illadopsis 1 1 1 3 0.00 0.05 0.03
Nectariniidae
Deleornis axillaris GHSU Grey-headed Sunbird 1 1 2 31 0.63 0.37 0.48
Hedydipna collaris COSU Collared Sunbird 1 3 2 9 0.30 0.03 0.14
Cyanomitra olivaceus OLSU Olive Sunbird 1 1 2 4 0.11 0.03 0.06
Cynniris chloropygius OBSU Olive-bellied Sunbird 1 3 2 3 0.11 0.00 0.05
Ploceidae
Ploceus tricolor YMWE Yellow-mantled Weaver 2 2 3 2 0.04 0.03 0.03
Malimbus coronatus RCMA Red-crowned Malimbe 1 2 3 5 0.15 0.03 0.08
Malimbus cassini CAMA Cassin’s Malimbe 2 2 3 2 0.07 0.00 0.03
Malimbus nitens BBMA Blue-billed Malimbe 1 1 2 11 0.15 0.18 0.17
Malimbus malimbicus CRMA Crested Malimbe 1 1 2 8 0.19 0.08 0.12
Estrildidae
Parmoptila jamesoni JAAN Jameson’s Antpecker 1 3 2 2 0.07 0.00 0.03
Family names, scientific names, abbreviations used in Tables 2 and 3, vernacular English names, classes of feeding habits (R = 1 for leaf-
gleaning insectivores, 2 for sallying insectivores, 3 for bark-gleaning insectivores, 4 for searching insectivores), preference for edge (E = 1,2,3,
respectively for preference for interior, no preference, preference for edge), preference for a stratum (A = 1,2,3, respectively for preference for
lowest stratum below 3 m, mid stratum between 3 and 20 m and higher stratum above 20 m).
n, Edge, Int and Total refer respectively to the total number of occurrences of the species in the dataset, the frequency in the 27 edge flocks, the
frequency in the 38 interior flocks and the frequency in all 65 flocks together
Table 6 Species score in the NMDS ordination
Species NMDS1 NMDS3 Edge score
GRHY 21.437 20.197 20.616
COSU 20.927 0.807 20.474
ANGR 20.883 0.569 20.435
YELL 20.858 0.195 20.394
BLCS 20.712 0.489 20.353
GRGR -0.853 -0.503 -0.334
Table 6 continued
Species NMDS1 NMDS3 Edge score
YELO -0.571 0.614 -0.302
RBDW -0.671 -0.042 -0.292
PLGR -0.599 0.236 -0.283
RCMA -0.575 0.351 -0.282
CCFL -0.523 0.349 -0.259
JAAN -0.666 -0.433 -0.258
SBGR -0.521 -0.437 -0.193
RVPF -0.333 0.558 -0.192
BTAP -0.306 0.475 -0.174
J Ornithol (2009) 150:585–599 597
123
References
Achard F, Eva HD, Stibig HJ, Mayaux P, Gallego J, Richards T,
Malingreau JP (2002) Determination of deforestation rates of the
world’s humid tropical forests. Science 297:999–1002
Anderson MJ (2001) A new method for non-parametric multivariate
analysis of variance. Austral Ecol 26:32–46
Bearzi M (2006) California sea lions use dolphins to locate food.
J Mammal 87:606–617
Brosset A and Erard C (1986) The forest birds of North-East Gabon. I.
The species, their ecology and behaviour. Rev Ecol, Suppl 3 (in
French with English summary)
Brown CR, Brown M (1996) Social foraging 1: natural history, food
distribution and mechanisms of information transfer. Coloniality
in the Cliff Swallow. University of Chicago Press, Chicago
Chen CC, Hsieh F (2002) Composition and foraging behaviour of
mixed-species flocks led by the grey-cheeked Fulvetta in Fushan
experimental forest, Taiwan. Ibis 144:317–330
Clark CW, Mangel M (1984) Foraging and flocking strategies—
information in an uncertain environment. Am Nat 123:626–641
Cole LC (1949) The measurement of interspecific association.
Ecology 30:411–424
Dale S, Mork K, Solvang R, Plumptre AJ (2000) Edge effects on the
understorey bird community in a logged forest in Uganda.
Conserv Biol 14:265–276
Develey PF, Peres CA (2000) Resource seasonality and the structure
of mixed species bird flocks in a coastal Atlantic forest of south-
eastern Brazil. J Trop Ecol 16:33–53
Dobbs RC, Martin PR (1998) Migrant bird participation at an army ant
swarm in montane Jalisco, Mexico. Wilson Bull 110:293–295
Fruth B, Ilumbe G and Lejoly J (2003) Phytosociology for habitat
assessment in the southwestern part of Salonga National Park,
DRC. 2003 Bonobo workshop: behaviour, ecology and conser-
vation of wild bonobos. In: Thompson J, Hohmann G, Furuichi T
(eds). Inuyama, Japan, Kyoto Univ Primate Res Inst., pp 10–11
Fry CH, Keith S (2000) Picathartes to Oxpeckers: the birds of Africa,
vol 6. Academic Press, London
Fry CH, Keith S (2004) Sparrows to Buntings: the birds of Africa, vol
7. Christopher Helm, London
Fry CH, Keith S, Urban EK (1988) Parrots to Woodpeckers: the birds
of Africa, vol 3. Academic Press, London
Giraldeau LA (1984) Group foraging—the skill pool effect and
frequency-dependent learning. Am Nat 124:72–79
Goodale E, Kotagama SW (2006) Vocal mimicry by a passerine bird
attracts other species involved in mixed-species flocks. Anim
Behav 72:471–477
Hamilton WD (1971) Geometry for selfish herd. J Theor Biol 31:295–
311
Hart PJ, Freed LA (2003) Structure and dynamics of mixed-species
flocks in a Hawaiian rain forest. Auk 120:82–95
Herrera CM (1979) Ecological aspects of heterospecific flocks
formation in a Mediterranean passerine bird community. Oikos
33:85–96
Hino T (1998) Mutualistic and commensal organization of avian
mixed-species foraging flocks in a forest of western Madagascar.
J Avian Biol 29:17–24
Hohmann G and Fruth B (2003) Lui Kotal—a new site for field
research on Bonobos in the Salonga National Park. Pan Africa
News 10(2): 25–27. Available online at http://mahale.web.
infoseek.co.jp/PAN/10_2/contents.html
Hutto RL (1994) The composition and social-organization of mixed-
species flocks in a tropical deciduous forest in Western Mexico.
Condor 96:105–118
Jullien M, Clobert J (2000) The survival value of flocking in
neotropical birds: reality or fiction? Ecology 81:3416–3430
Jullien M, Thiollay JM (1998) Multi-species territoriality and
dynamic of neotropical forest understorey bird flocks. J Anim
Ecol 67:227–252
Keith S, Urban EK, Fry CH (1992) Broadbills to Chats: the birds of
Africa, vol 4. Academic Press, London
King DI, Rappole JH (2000) Winter flocking of insectivorous birds in
montane pine-oak forests in Middle America. Condor 102:664–672
King DI, Rappole JH (2001) Mixed species bird flocks in dipterocarp
forest of north central Burma (Myanmar). Ibis 143:380–390
Korb J, Salewski V (2000) Predation on swarming termites by birds.
Afr J Ecol 38:173–174
Kotagama SW, Goodale E (2004) The composition and spatial
organisation of mixed-species flocks in a Sri Lankan rainforest.
Forktail 20:63–70
Latta SC, Wunderle JM (1996) The composition and foraging ecology
of mixed-species flocks in pine forests of Hispaniola. Condor
98:595–607
Lazarus J (1979) Early warning function of flocking in birds–
experimental study with captive Quelea. Anim Behav 27:855–865
Lee TM, Soh MCK, Sodhi N, Koh LP, Lim SLH (2005) Effects of
habitat disturbance on mixed species bird flocks in a tropical
sub-montane rainforest. Biol Conserv 122:193–204
Lukoschek V and McCormick MI (2002) A review of multi-species
foraging associations in fishes and their ecological significance.
Proceedings of the 9th international coral reef symposium, pp
467–474
Table 6 continued
Species NMDS1 NMDS3 Edge score
GHSU -0.401 -0.083 -0.170
YMWE -0.509 -1.174 -0.128
RBHS -0.198 0.002 -0.087
WBHO -0.133 0.345 -0.087
LIGR -0.083 0.438 -0.072
CRMA -0.1 0.324 -0.071
EOSU 0.06 0.121 0.016
RTGR 0.109 0.214 0.030
BBTU 0.02 -0.628 0.060
VMDR 0.192 0.085 0.078
RTAT 0.286 0.105 0.117
SHDR 0.286 0.07 0.120
CHWA 0.344 0.269 0.129
ICGR 0.339 0.036 0.146
HBBA 0.174 -0.901 0.150
BHPF 0.396 0.013 0.173
GRMA 0.38 -0.244 0.187
BFWO 0.434 -0.171 0.205
GTBR 0.551 20.888 0.315
COBR 0.651 20.481 0.326
BEWO 0.811 0.32 0.331
WTGR 0.766 20.556 0.383
Edge score is the combination of the species score on NMDS1 and
NMDS3 that accounts for the correlation between these axes and the
habitat variable. The more negative the edge score, the more edge-
linked the species. See ‘‘Appendix 1’’ for full species names.Species
mentioned in the main text as being the most edge/interior linked are
shown in bold
598 J Ornithol (2009) 150:585–599
123
Maldonado-Coelho M, Marini MA (2004) Mixed-species bird flocks
from Brazilian Atlantic forest: the effects of forest fragmentation
and seasonality on their size, richness and stability. Biol Conserv
116:19–26
Maurer BA (1984) Interference and exploitation in bird communities.
Wilson Bull 96:380–395
McCune B, Grace JB (2002) Analysis of ecological communities.
Mjm Software Design, OR
Mielke PW, Berry KJ (2001) Permutation methods: distance function
approach. Springer Series in Statistics. New York, USA
Morse DH (1970) Ecological aspects of some mixed-species foraging
flocks of birds. Ecol Monogr 40:119–168
Moynihan M (1962) The organisation and probable evolution of some
mixed-species flocks of Neotropical birds. Smithsonian Miscel-
laneous Collections 1437
Munn CA (1986) Birds that cry wolf. Nature 319:143–145
Munn CA, Terborgh JW (1979) Multispecies territoriality in
Neotropical foraging flocks. Condor 81:338–347
Nemeth Z, Moore FR (2007) Unfamiliar stopover sites and the value
of social information during migration. J Ornithol 148(Suppl.
2):S369–S376
Oksanen J, Kindt R, Legendre P, O’Hara B, Henry M, Stevens H (2007)
vegan: Community Ecology Package. R package version 1.8–8.
http://cran.r-project.org/, http://r-forge.r-project.org/projects/vegan/
Pomara LY, Cooper RJ, Petit LJ (2007) Modelling the flocking
propensity of passerine birds in two Neotropical habitats.
Oecologia 153:121–133
Poulsen BO (1996a) Structure, dynamics and home-range of two mixed
species flocks and species composition in a montane Alder
dominated secondary forest in Ecuador. J Trop Ecol 12:333–343
Poulsen BO (1996b) Relationships between frequency of mixed-
species of mixed-species flocks, weather and insect activity in a
montane cloud forest, Ecuador. Ibis 138:466–470
Powell GVN (1989) On the possible contribution of mixed species
flocks to species richness in Neotropical avifaunas. Behav Ecol
Sociobiol 24:387–393
R Development Core Team (2005) R: A language and environment for
statistical computing. R Foundation for Statistical Computing,
Vienna, Austria. ISBN 3-900051-07-0, http://www.R-project.org
Stensland E, Angerbjorn A, Berggren P (2003) Mixed species groups
in mammals. Mammal Rev 33:205–223
Stouffer PC, Bierregaard RO (1995) Use of Amazonian forest
fragments by understory insectivorous birds. Ecology 76:2429–
2445
Stratford JA, Stouffer PC (1999) Local extinctions of terrestrial
insectivorous birds in a fragmented landscape near Manaus,
Brazil. Conserv Biol 13:1416–1423
Tabachnik BG, Fidell LS (1989) Using multivariate statistics. Allyn
& Bacon, New York
Thiollay JM (1999) Frequency of mixed species flocking in tropical
forest birds and correlates of predation risk: an intertropical
comparison. J Avian Biol 30:282–294
Thomson RL, Ferguson JWH (2007) Composition and foraging
behaviour of mixed-species flocks in two adjacent African
woodland habitats: a spatial and temporal perspective. Ostrich
78(1):65–73
Urban EK, Fry CH, Keith S (1997) Thrushes to Puffbacks,
Flycatchers: the birds of Africa, vol 5. Academic Press, London
Waite TA, Grubb TC (1988) Copying of foraging locations in mixed-
species flocks of temperate-deciduous woodland birds—an
experimental study. Condor 90:132–140
Weber W, White L, Naughton-Treves L, Vedder A (eds) (2001)
African rain forest ecology and conservation: an interdisciplinary
perspective. Yale University Press, New Haven
J Ornithol (2009) 150:585–599 599
123