A simplified and cost-effective enrichment protocol for the isolation of Campylobacter spp. from...
12
METHODOLOGY ARTICLE Open Access A simplified and cost-effective enrichment protocol for the isolation of Campylobacter spp. from retail broiler meat without microaerobic incubation Ping Zhou 1 , Syeda K Hussain 2 , Mark R Liles 3 , Covadonga R Arias 4 , Steffen Backert 5 , Jessica Kieninger 1 and Omar A Oyarzabal 1* Abstract Background: To simplify the methodology for the isolation of Campylobacter spp. from retail broiler meat, we evaluated 108 samples (breasts and thighs) using an unpaired sample design. The enrichment broths were incubated under aerobic conditions (subsamples A) and for comparison under microaerobic conditions (subsamples M) as recommended by current reference protocols. Sensors were used to measure the dissolved oxygen (DO) in the broth and the percentage of oxygen (O 2 ) in the head space of the bags used for enrichment. Campylobacter isolates were identified with multiplex PCR assays and typed using pulsed-field gel electrophoresis (PFGE). Ribosomal intergenic spacer analyses (RISA) and denaturing gradient gel electrophoresis (DGGE) were used to study the bacterial communities of subsamples M and A after 48 h enrichment. Results: The number of Campylobacter positive subsamples were similar for A and M when all samples were combined (P = 0.81) and when samples were analyzed by product (breast: P = 0.75; thigh: P = 1.00). Oxygen sensors showed that DO values in the broth were around 6 ppm and O 2 values in the head space were 14-16% throughout incubation. PFGE demonstrated high genomic similarity of isolates in the majority of the samples in which isolates were obtained from subsamples A and M. RISA and DGGE results showed a large variability in the bacterial populations that could be attributed to sample-to-sample variations and not enrichment conditions (aerobic or microaerobic). These data also suggested that current sampling protocols are not optimized to determine the true number of Campylobacter positive samples in retail boiler meat. Conclusions: Decreased DO in enrichment broths is naturally achieved. This simplified, cost-effective enrichment protocol with aerobic incubation could be incorporated into reference methods for the isolation of Campylobacter spp. from retail broiler meat. Background Campylobacteriosis in the most common foodborne dis- ease in European countries, with an overall incidence of 47.6 cases per 100,000 population [1]; in Canada, with 36.1 cases every 100,000 person-years [2]; and the third most important bacterial foodborne diseases in the US [3]. Campylobacter spp. are found still at high preva- lence in retail broiler carcasses in the US [4; 5], and the isolation of Campylobacter spp. from clinical and food samples has always been done using microaerobic con- ditions, generally 85% N 2 , 10% CO 2 and 5% O 2 , during the enrichment of the samples and during the incuba- tion of plate media. Different methods have been devel- oped to generate microaerobic atmospheres and for a small number of samples, sachets that generate CO 2 are commonly used [6]. If a larger number of samples are processed weekly, the evacuation-replacement is a more economical alternative. In this system, the air in the jar is partially removed by a vacuum pump and then replaced with a microaerobic gas mix. For a large * Correspondence: [email protected] 1 Department of Biological Sciences, 1627 Hall Street, Alabama State University, Montgomery, AL, USA Full list of author information is available at the end of the article Zhou et al. BMC Microbiology 2011, 11:175 http://www.biomedcentral.com/1471-2180/11/175 © 2011 Zhou et al; licensee BioMed Central Ltd. This is an Open Access article distributed under the terms of the Creative Commons Attribution License (http://creativecommons.org/licenses/by/2.0), which permits unrestricted use, distribution, and reproduction in any medium, provided the original work is properly cited.
-
Upload
independent -
Category
Documents
-
view
2 -
download
0
Transcript of A simplified and cost-effective enrichment protocol for the isolation of Campylobacter spp. from...
METHODOLOGY ARTICLE Open Access
A simplified and cost-effective enrichmentprotocol for the isolation of Campylobacter spp.from retail broiler meat without microaerobicincubationPing Zhou1, Syeda K Hussain2, Mark R Liles3, Covadonga R Arias4, Steffen Backert5, Jessica Kieninger1 andOmar A Oyarzabal1*
Abstract
Background: To simplify the methodology for the isolation of Campylobacter spp. from retail broiler meat, weevaluated 108 samples (breasts and thighs) using an unpaired sample design. The enrichment broths wereincubated under aerobic conditions (subsamples A) and for comparison under microaerobic conditions(subsamples M) as recommended by current reference protocols. Sensors were used to measure the dissolvedoxygen (DO) in the broth and the percentage of oxygen (O2) in the head space of the bags used for enrichment.Campylobacter isolates were identified with multiplex PCR assays and typed using pulsed-field gel electrophoresis(PFGE). Ribosomal intergenic spacer analyses (RISA) and denaturing gradient gel electrophoresis (DGGE) were usedto study the bacterial communities of subsamples M and A after 48 h enrichment.
Results: The number of Campylobacter positive subsamples were similar for A and M when all samples werecombined (P = 0.81) and when samples were analyzed by product (breast: P = 0.75; thigh: P = 1.00). Oxygensensors showed that DO values in the broth were around 6 ppm and O2 values in the head space were 14-16%throughout incubation. PFGE demonstrated high genomic similarity of isolates in the majority of the samples inwhich isolates were obtained from subsamples A and M. RISA and DGGE results showed a large variability in thebacterial populations that could be attributed to sample-to-sample variations and not enrichment conditions(aerobic or microaerobic). These data also suggested that current sampling protocols are not optimized todetermine the true number of Campylobacter positive samples in retail boiler meat.
Conclusions: Decreased DO in enrichment broths is naturally achieved. This simplified, cost-effective enrichmentprotocol with aerobic incubation could be incorporated into reference methods for the isolation of Campylobacterspp. from retail broiler meat.
BackgroundCampylobacteriosis in the most common foodborne dis-ease in European countries, with an overall incidence of47.6 cases per 100,000 population [1]; in Canada, with36.1 cases every 100,000 person-years [2]; and the thirdmost important bacterial foodborne diseases in the US[3]. Campylobacter spp. are found still at high preva-lence in retail broiler carcasses in the US [4; 5], and the
isolation of Campylobacter spp. from clinical and foodsamples has always been done using microaerobic con-ditions, generally 85% N2, 10% CO2 and 5% O2, duringthe enrichment of the samples and during the incuba-tion of plate media. Different methods have been devel-oped to generate microaerobic atmospheres and for asmall number of samples, sachets that generate CO2 arecommonly used [6]. If a larger number of samples areprocessed weekly, the evacuation-replacement is a moreeconomical alternative. In this system, the air in the jaris partially removed by a vacuum pump and thenreplaced with a microaerobic gas mix. For a large
* Correspondence: [email protected] of Biological Sciences, 1627 Hall Street, Alabama StateUniversity, Montgomery, AL, USAFull list of author information is available at the end of the article
Zhou et al. BMC Microbiology 2011, 11:175http://www.biomedcentral.com/1471-2180/11/175
© 2011 Zhou et al; licensee BioMed Central Ltd. This is an Open Access article distributed under the terms of the Creative CommonsAttribution License (http://creativecommons.org/licenses/by/2.0), which permits unrestricted use, distribution, and reproduction inany medium, provided the original work is properly cited.
number of samples, or to create unique microaerobicgas mixes with increased H2 content, more sophisticatedmicroaerobic workstations have been developed [7].Besides generating microaerobic conditions, several
O2-quenching agents have been traditionally added toenrichment broths and agar plates for the isolation ofCampylobacter spp. These agents neutralize the toxiceffects of oxygen radicals and include blood or alkalinehematin [8; 9], charcoal [10], iron salts and norepi-nephrine [11], and ferrous sulfate, sodium metabisulfiteand sodium pyruvate (known as FBP supplement) [12].In general, if blood or charcoal is added to agar plates,no other O2 quenching compounds are added [9]. Toensure the microaerobic gas mix for the length of incu-bation (at least 48 h) sealed jars are commonly used,although plastic bags utilized to freeze food productswith a “ziplock” type closing to prevent air leaks havebeen successfully used with gas-generating sachets andmanual evacuation-replacement systems [13; 14].Although a microaerobic mix is indispensable to grow
Campylobacter spp. on agar plates, we have long sus-pected that no extra addition of any microaerobic gasmix is needed to keep Campylobacter spp. alive or evengrow them in enrichment broths. In the present studywe evaluated 108 retail broiler meat samples and com-pared the efficacy of Bolton broth incubated undermicroaerobic conditions using an evacuation-replace-ment system (subsamples M) versus incubation underaerobic conditions (subsamples A) for the isolation ofnaturally occurring Campylobacter spp. PresumptiveCampylobacter spp. collected on agar plates were con-firmed and identified with multiplex polymerase chainreaction (mPCR) assays and their DNA relatedness wasanalyzed using pulsed-field gel electrophoresis (PFGE).In addition, enriched broth cultures were analyzed withribosomal intergenic spacer analysis (RISA) and dena-turing gradient gel electrophoresis (DGGE) to determinethe variability in the total bacterial population profiles ofenrichment broths from subsamples M and A. Ourresults indicate that microaerobic conditions that allowCampylobacter spp. to grow are naturally created inenrichment broths without the addition of extra micro-aerobic gas mix, and therefore a simplified method hasbeen developed to identify these bacteria in foodsamples.
ResultsSimilar number of Campylobacter positive subsamplesFrom 108 retail broiler meat samples analyzed for thepresence of Campylobacter spp., 48 (42%) were posi-tive from the microaerobic subsamples (subsamplesM), and 46 (44%) were positive from the aerobic sub-samples (subsamples A). Combining the data fromsubsamples M and A resulted in a total of 56 (52%)
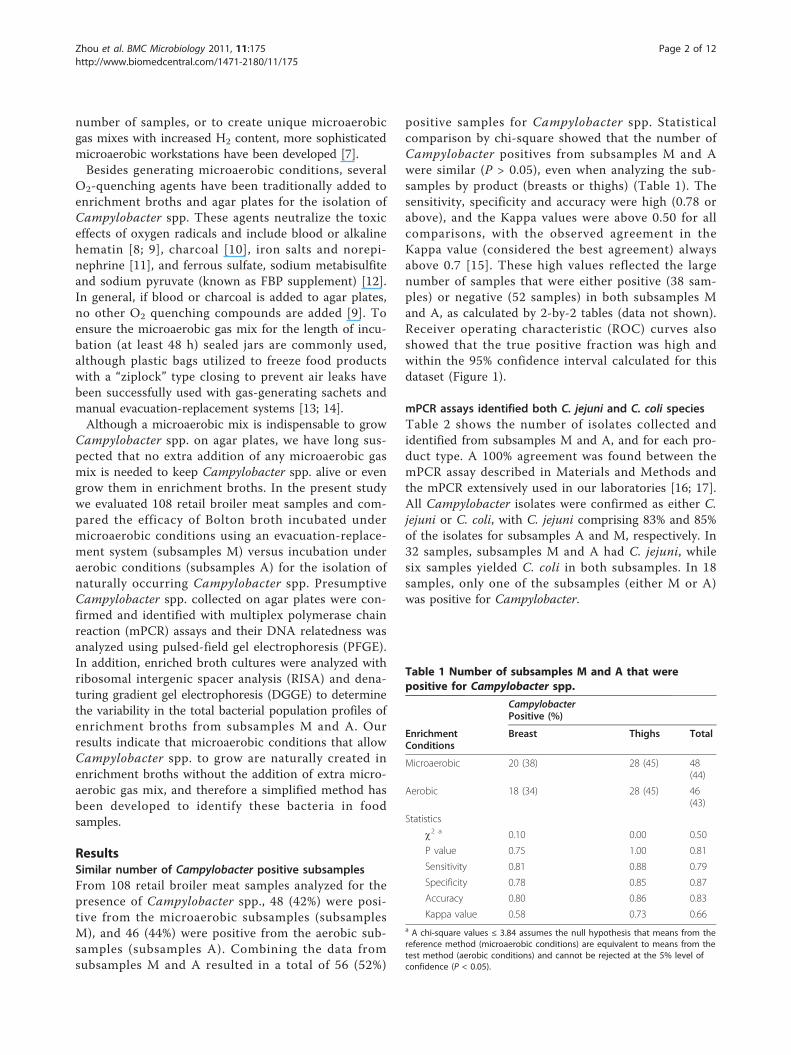
positive samples for Campylobacter spp. Statisticalcomparison by chi-square showed that the number ofCampylobacter positives from subsamples M and Awere similar (P > 0.05), even when analyzing the sub-samples by product (breasts or thighs) (Table 1). Thesensitivity, specificity and accuracy were high (0.78 orabove), and the Kappa values were above 0.50 for allcomparisons, with the observed agreement in theKappa value (considered the best agreement) alwaysabove 0.7 [15]. These high values reflected the largenumber of samples that were either positive (38 sam-ples) or negative (52 samples) in both subsamples Mand A, as calculated by 2-by-2 tables (data not shown).Receiver operating characteristic (ROC) curves alsoshowed that the true positive fraction was high andwithin the 95% confidence interval calculated for thisdataset (Figure 1).
mPCR assays identified both C. jejuni and C. coli speciesTable 2 shows the number of isolates collected andidentified from subsamples M and A, and for each pro-duct type. A 100% agreement was found between themPCR assay described in Materials and Methods andthe mPCR extensively used in our laboratories [16; 17].All Campylobacter isolates were confirmed as either C.jejuni or C. coli, with C. jejuni comprising 83% and 85%of the isolates for subsamples A and M, respectively. In32 samples, subsamples M and A had C. jejuni, whilesix samples yielded C. coli in both subsamples. In 18samples, only one of the subsamples (either M or A)was positive for Campylobacter.
Table 1 Number of subsamples M and A that werepositive for Campylobacter spp.
CampylobacterPositive (%)
EnrichmentConditions
Breast Thighs Total
Microaerobic 20 (38) 28 (45) 48(44)
Aerobic 18 (34) 28 (45) 46(43)
Statistics
c2 a 0.10 0.00 0.50
P value 0.75 1.00 0.81
Sensitivity 0.81 0.88 0.79
Specificity 0.78 0.85 0.87
Accuracy 0.80 0.86 0.83
Kappa value 0.58 0.73 0.66a A chi-square values ≤ 3.84 assumes the null hypothesis that means from thereference method (microaerobic conditions) are equivalent to means from thetest method (aerobic conditions) and cannot be rejected at the 5% level ofconfidence (P < 0.05).
Zhou et al. BMC Microbiology 2011, 11:175http://www.biomedcentral.com/1471-2180/11/175
Page 2 of 12
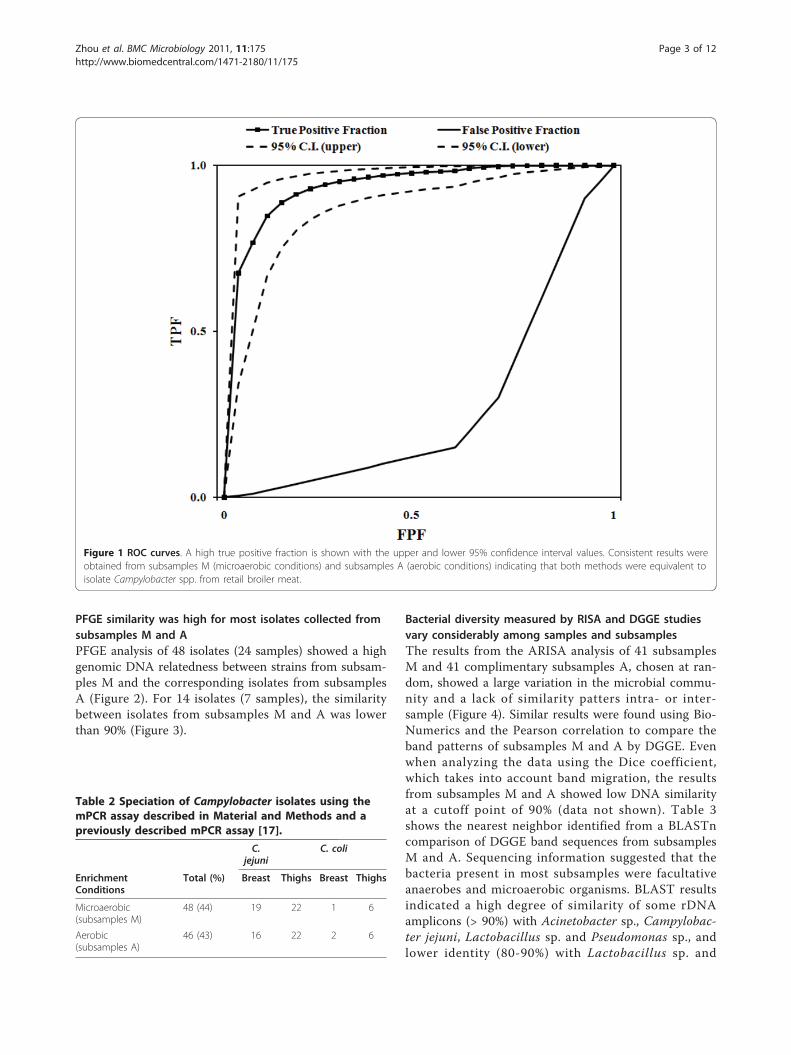
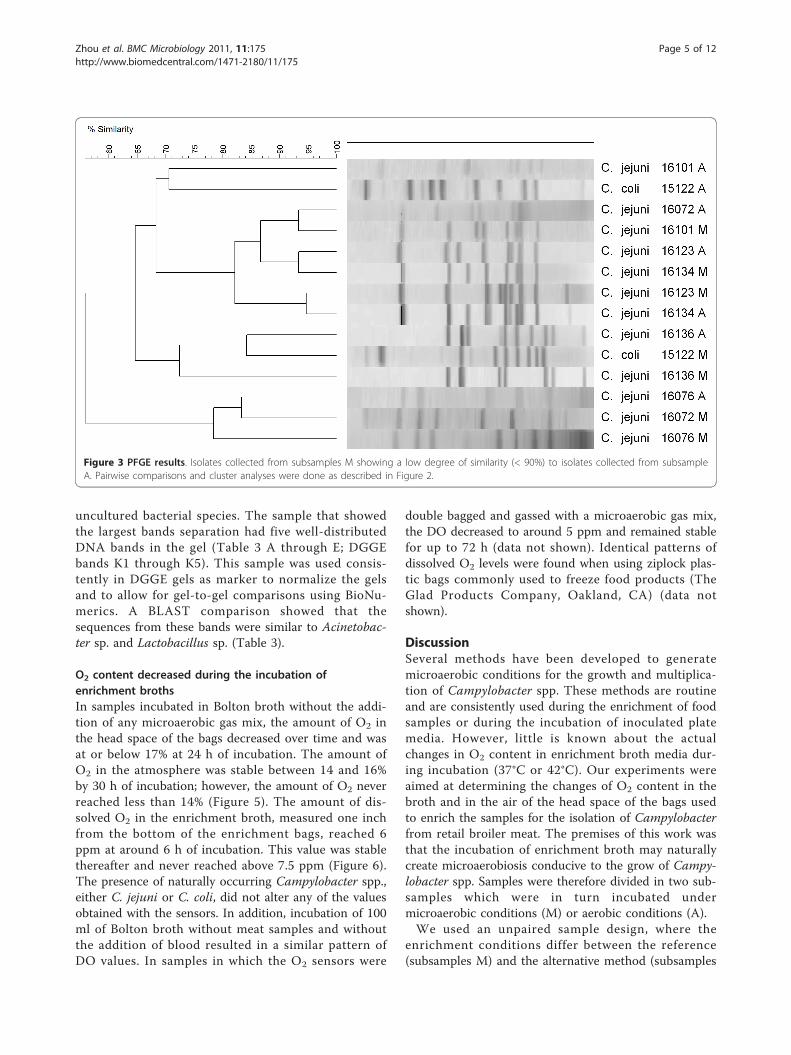
PFGE similarity was high for most isolates collected fromsubsamples M and APFGE analysis of 48 isolates (24 samples) showed a highgenomic DNA relatedness between strains from subsam-ples M and the corresponding isolates from subsamplesA (Figure 2). For 14 isolates (7 samples), the similaritybetween isolates from subsamples M and A was lowerthan 90% (Figure 3).
Bacterial diversity measured by RISA and DGGE studiesvary considerably among samples and subsamplesThe results from the ARISA analysis of 41 subsamplesM and 41 complimentary subsamples A, chosen at ran-dom, showed a large variation in the microbial commu-nity and a lack of similarity patters intra- or inter-sample (Figure 4). Similar results were found using Bio-Numerics and the Pearson correlation to compare theband patterns of subsamples M and A by DGGE. Evenwhen analyzing the data using the Dice coefficient,which takes into account band migration, the resultsfrom subsamples M and A showed low DNA similarityat a cutoff point of 90% (data not shown). Table 3shows the nearest neighbor identified from a BLASTncomparison of DGGE band sequences from subsamplesM and A. Sequencing information suggested that thebacteria present in most subsamples were facultativeanaerobes and microaerobic organisms. BLAST resultsindicated a high degree of similarity of some rDNAamplicons (> 90%) with Acinetobacter sp., Campylobac-ter jejuni, Lactobacillus sp. and Pseudomonas sp., andlower identity (80-90%) with Lactobacillus sp. and
Figure 1 ROC curves. A high true positive fraction is shown with the upper and lower 95% confidence interval values. Consistent results wereobtained from subsamples M (microaerobic conditions) and subsamples A (aerobic conditions) indicating that both methods were equivalent toisolate Campylobacter spp. from retail broiler meat.
Table 2 Speciation of Campylobacter isolates using themPCR assay described in Material and Methods and apreviously described mPCR assay [17].
C.jejuni
C. coli
EnrichmentConditions
Total (%) Breast Thighs Breast Thighs
Microaerobic(subsamples M)
48 (44) 19 22 1 6
Aerobic(subsamples A)
46 (43) 16 22 2 6
Zhou et al. BMC Microbiology 2011, 11:175http://www.biomedcentral.com/1471-2180/11/175
Page 3 of 12
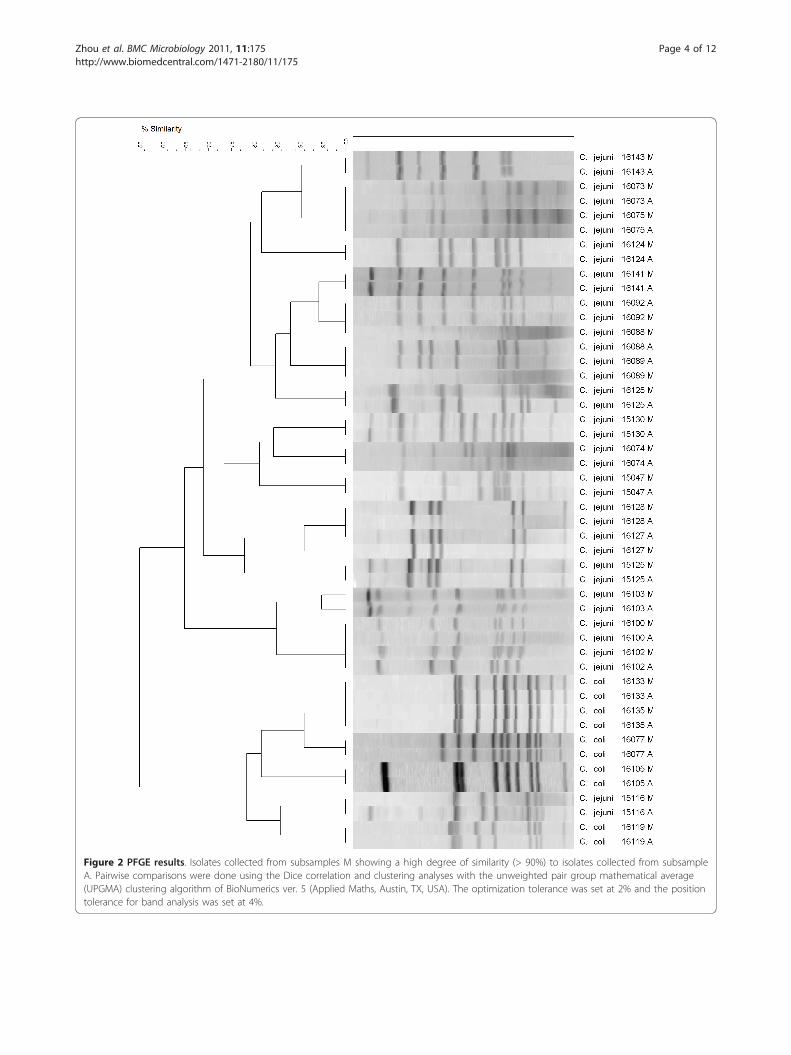
Figure 2 PFGE results. Isolates collected from subsamples M showing a high degree of similarity (> 90%) to isolates collected from subsampleA. Pairwise comparisons were done using the Dice correlation and clustering analyses with the unweighted pair group mathematical average(UPGMA) clustering algorithm of BioNumerics ver. 5 (Applied Maths, Austin, TX, USA). The optimization tolerance was set at 2% and the positiontolerance for band analysis was set at 4%.
Zhou et al. BMC Microbiology 2011, 11:175http://www.biomedcentral.com/1471-2180/11/175
Page 4 of 12
uncultured bacterial species. The sample that showedthe largest bands separation had five well-distributedDNA bands in the gel (Table 3 A through E; DGGEbands K1 through K5). This sample was used consis-tently in DGGE gels as marker to normalize the gelsand to allow for gel-to-gel comparisons using BioNu-merics. A BLAST comparison showed that thesequences from these bands were similar to Acinetobac-ter sp. and Lactobacillus sp. (Table 3).
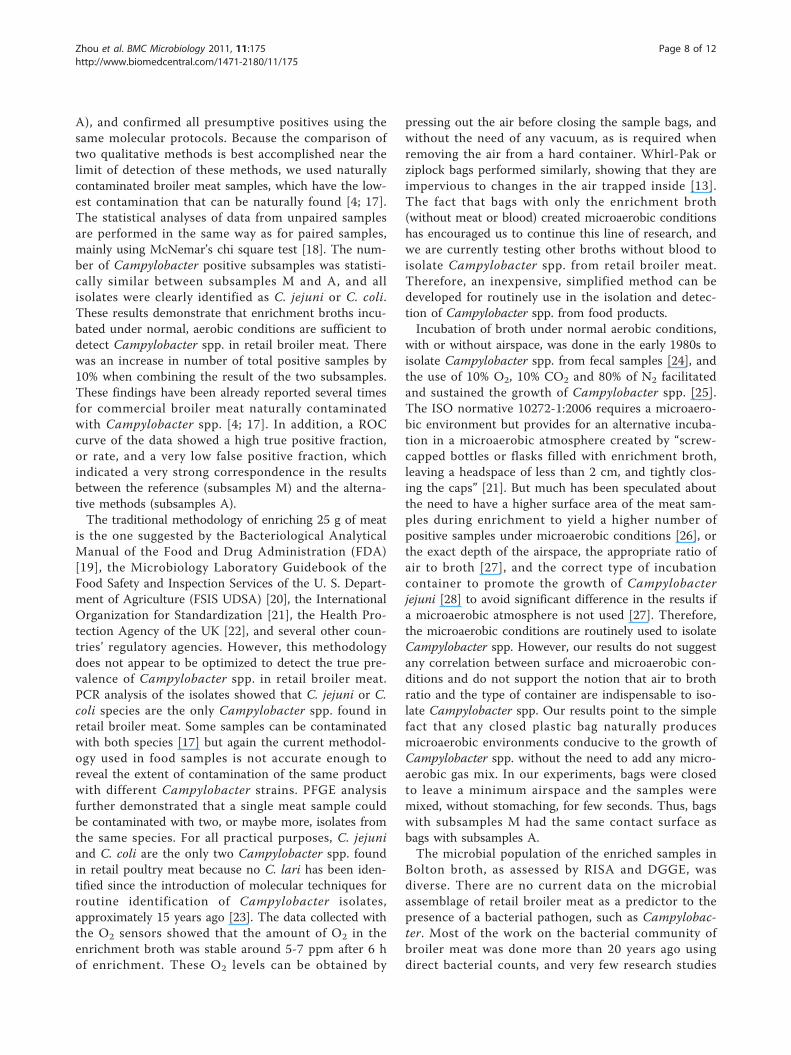
O2 content decreased during the incubation ofenrichment brothsIn samples incubated in Bolton broth without the addi-tion of any microaerobic gas mix, the amount of O2 inthe head space of the bags decreased over time and wasat or below 17% at 24 h of incubation. The amount ofO2 in the atmosphere was stable between 14 and 16%by 30 h of incubation; however, the amount of O2 neverreached less than 14% (Figure 5). The amount of dis-solved O2 in the enrichment broth, measured one inchfrom the bottom of the enrichment bags, reached 6ppm at around 6 h of incubation. This value was stablethereafter and never reached above 7.5 ppm (Figure 6).The presence of naturally occurring Campylobacter spp.,either C. jejuni or C. coli, did not alter any of the valuesobtained with the sensors. In addition, incubation of 100ml of Bolton broth without meat samples and withoutthe addition of blood resulted in a similar pattern ofDO values. In samples in which the O2 sensors were
double bagged and gassed with a microaerobic gas mix,the DO decreased to around 5 ppm and remained stablefor up to 72 h (data not shown). Identical patterns ofdissolved O2 levels were found when using ziplock plas-tic bags commonly used to freeze food products (TheGlad Products Company, Oakland, CA) (data notshown).
DiscussionSeveral methods have been developed to generatemicroaerobic conditions for the growth and multiplica-tion of Campylobacter spp. These methods are routineand are consistently used during the enrichment of foodsamples or during the incubation of inoculated platemedia. However, little is known about the actualchanges in O2 content in enrichment broth media dur-ing incubation (37°C or 42°C). Our experiments wereaimed at determining the changes of O2 content in thebroth and in the air of the head space of the bags usedto enrich the samples for the isolation of Campylobacterfrom retail broiler meat. The premises of this work wasthat the incubation of enrichment broth may naturallycreate microaerobiosis conducive to the grow of Campy-lobacter spp. Samples were therefore divided in two sub-samples which were in turn incubated undermicroaerobic conditions (M) or aerobic conditions (A).We used an unpaired sample design, where the
enrichment conditions differ between the reference(subsamples M) and the alternative method (subsamples
Figure 3 PFGE results. Isolates collected from subsamples M showing a low degree of similarity (< 90%) to isolates collected from subsampleA. Pairwise comparisons and cluster analyses were done as described in Figure 2.
Zhou et al. BMC Microbiology 2011, 11:175http://www.biomedcentral.com/1471-2180/11/175
Page 5 of 12
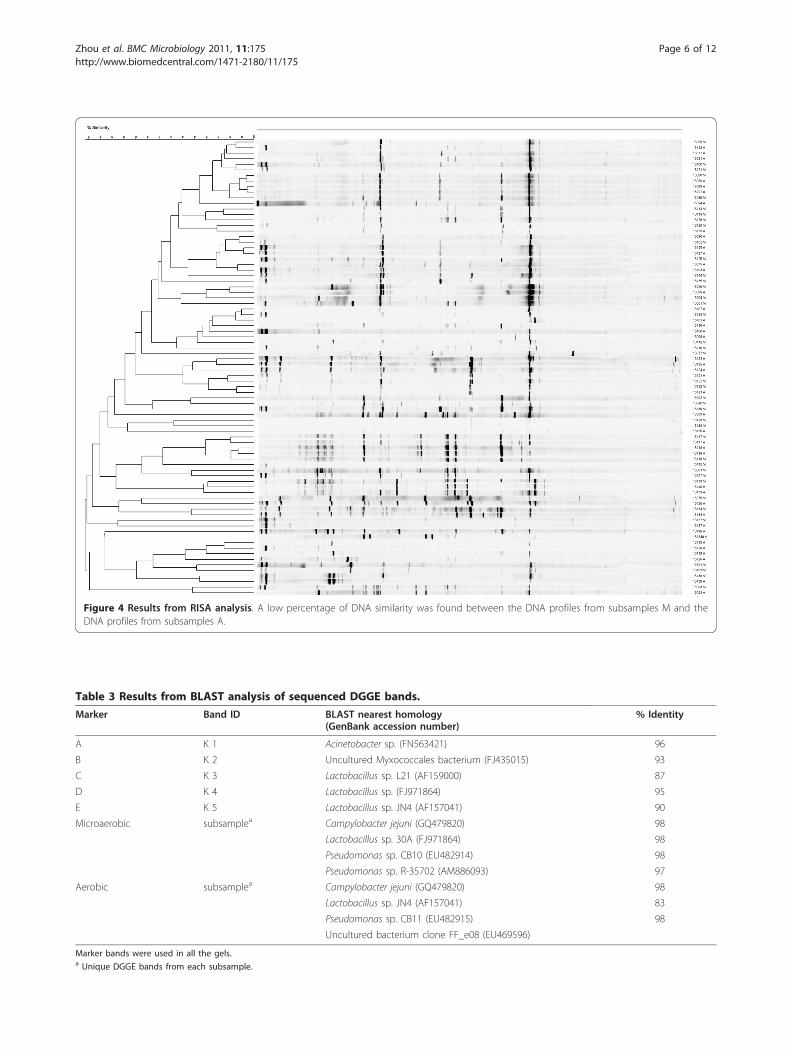
Figure 4 Results from RISA analysis. A low percentage of DNA similarity was found between the DNA profiles from subsamples M and theDNA profiles from subsamples A.
Table 3 Results from BLAST analysis of sequenced DGGE bands.
Marker Band ID BLAST nearest homology(GenBank accession number)
% Identity
A K 1 Acinetobacter sp. (FN563421) 96
B K 2 Uncultured Myxococcales bacterium (FJ435015) 93
C K 3 Lactobacillus sp. L21 (AF159000) 87
D K 4 Lactobacillus sp. (FJ971864) 95
E K 5 Lactobacillus sp. JN4 (AF157041) 90
Microaerobic subsamplea Campylobacter jejuni (GQ479820) 98
Lactobacillus sp. 30A (FJ971864) 98
Pseudomonas sp. CB10 (EU482914) 98
Pseudomonas sp. R-35702 (AM886093) 97
Aerobic subsamplea Campylobacter jejuni (GQ479820) 98
Lactobacillus sp. JN4 (AF157041) 83
Pseudomonas sp. CB11 (EU482915) 98
Uncultured bacterium clone FF_e08 (EU469596)
Marker bands were used in all the gels.a Unique DGGE bands from each subsample.
Zhou et al. BMC Microbiology 2011, 11:175http://www.biomedcentral.com/1471-2180/11/175
Page 6 of 12
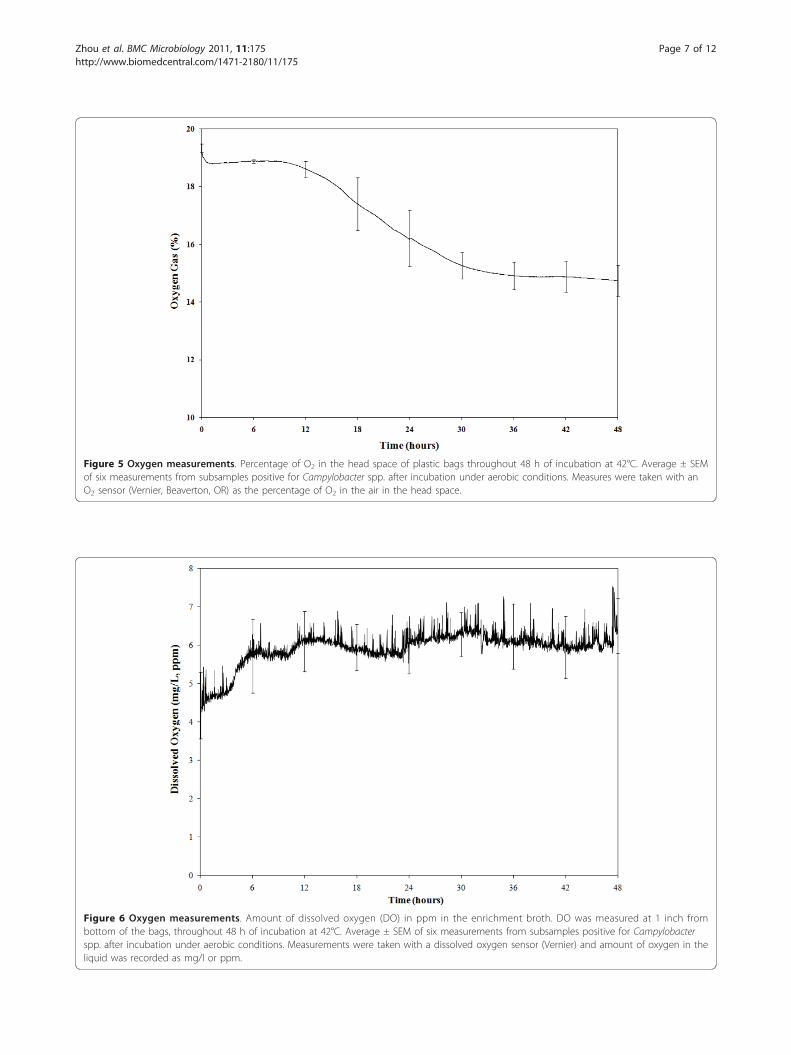
Figure 5 Oxygen measurements. Percentage of O2 in the head space of plastic bags throughout 48 h of incubation at 42°C. Average ± SEMof six measurements from subsamples positive for Campylobacter spp. after incubation under aerobic conditions. Measures were taken with anO2 sensor (Vernier, Beaverton, OR) as the percentage of O2 in the air in the head space.
Figure 6 Oxygen measurements. Amount of dissolved oxygen (DO) in ppm in the enrichment broth. DO was measured at 1 inch frombottom of the bags, throughout 48 h of incubation at 42°C. Average ± SEM of six measurements from subsamples positive for Campylobacterspp. after incubation under aerobic conditions. Measurements were taken with a dissolved oxygen sensor (Vernier) and amount of oxygen in theliquid was recorded as mg/l or ppm.
Zhou et al. BMC Microbiology 2011, 11:175http://www.biomedcentral.com/1471-2180/11/175
Page 7 of 12
A), and confirmed all presumptive positives using thesame molecular protocols. Because the comparison oftwo qualitative methods is best accomplished near thelimit of detection of these methods, we used naturallycontaminated broiler meat samples, which have the low-est contamination that can be naturally found [4; 17].The statistical analyses of data from unpaired samplesare performed in the same way as for paired samples,mainly using McNemar’s chi square test [18]. The num-ber of Campylobacter positive subsamples was statisti-cally similar between subsamples M and A, and allisolates were clearly identified as C. jejuni or C. coli.These results demonstrate that enrichment broths incu-bated under normal, aerobic conditions are sufficient todetect Campylobacter spp. in retail broiler meat. Therewas an increase in number of total positive samples by10% when combining the result of the two subsamples.These findings have been already reported several timesfor commercial broiler meat naturally contaminatedwith Campylobacter spp. [4; 17]. In addition, a ROCcurve of the data showed a high true positive fraction,or rate, and a very low false positive fraction, whichindicated a very strong correspondence in the resultsbetween the reference (subsamples M) and the alterna-tive methods (subsamples A).The traditional methodology of enriching 25 g of meat
is the one suggested by the Bacteriological AnalyticalManual of the Food and Drug Administration (FDA)[19], the Microbiology Laboratory Guidebook of theFood Safety and Inspection Services of the U. S. Depart-ment of Agriculture (FSIS UDSA) [20], the InternationalOrganization for Standardization [21], the Health Pro-tection Agency of the UK [22], and several other coun-tries’ regulatory agencies. However, this methodologydoes not appear to be optimized to detect the true pre-valence of Campylobacter spp. in retail broiler meat.PCR analysis of the isolates showed that C. jejuni or C.coli species are the only Campylobacter spp. found inretail broiler meat. Some samples can be contaminatedwith both species [17] but again the current methodol-ogy used in food samples is not accurate enough toreveal the extent of contamination of the same productwith different Campylobacter strains. PFGE analysisfurther demonstrated that a single meat sample couldbe contaminated with two, or maybe more, isolates fromthe same species. For all practical purposes, C. jejuniand C. coli are the only two Campylobacter spp. foundin retail poultry meat because no C. lari has been iden-tified since the introduction of molecular techniques forroutine identification of Campylobacter isolates,approximately 15 years ago [23]. The data collected withthe O2 sensors showed that the amount of O2 in theenrichment broth was stable around 5-7 ppm after 6 hof enrichment. These O2 levels can be obtained by
pressing out the air before closing the sample bags, andwithout the need of any vacuum, as is required whenremoving the air from a hard container. Whirl-Pak orziplock bags performed similarly, showing that they areimpervious to changes in the air trapped inside [13].The fact that bags with only the enrichment broth(without meat or blood) created microaerobic conditionshas encouraged us to continue this line of research, andwe are currently testing other broths without blood toisolate Campylobacter spp. from retail broiler meat.Therefore, an inexpensive, simplified method can bedeveloped for routinely use in the isolation and detec-tion of Campylobacter spp. from food products.Incubation of broth under normal aerobic conditions,
with or without airspace, was done in the early 1980s toisolate Campylobacter spp. from fecal samples [24], andthe use of 10% O2, 10% CO2 and 80% of N2 facilitatedand sustained the growth of Campylobacter spp. [25].The ISO normative 10272-1:2006 requires a microaero-bic environment but provides for an alternative incuba-tion in a microaerobic atmosphere created by “screw-capped bottles or flasks filled with enrichment broth,leaving a headspace of less than 2 cm, and tightly clos-ing the caps” [21]. But much has been speculated aboutthe need to have a higher surface area of the meat sam-ples during enrichment to yield a higher number ofpositive samples under microaerobic conditions [26], orthe exact depth of the airspace, the appropriate ratio ofair to broth [27], and the correct type of incubationcontainer to promote the growth of Campylobacterjejuni [28] to avoid significant difference in the results ifa microaerobic atmosphere is not used [27]. Therefore,the microaerobic conditions are routinely used to isolateCampylobacter spp. However, our results do not suggestany correlation between surface and microaerobic con-ditions and do not support the notion that air to brothratio and the type of container are indispensable to iso-late Campylobacter spp. Our results point to the simplefact that any closed plastic bag naturally producesmicroaerobic environments conducive to the growth ofCampylobacter spp. without the need to add any micro-aerobic gas mix. In our experiments, bags were closedto leave a minimum airspace and the samples weremixed, without stomaching, for few seconds. Thus, bagswith subsamples M had the same contact surface asbags with subsamples A.The microbial population of the enriched samples in
Bolton broth, as assessed by RISA and DGGE, wasdiverse. There are no current data on the microbialassemblage of retail broiler meat as a predictor to thepresence of a bacterial pathogen, such as Campylobac-ter. Most of the work on the bacterial community ofbroiler meat was done more than 20 years ago usingdirect bacterial counts, and very few research studies
Zhou et al. BMC Microbiology 2011, 11:175http://www.biomedcentral.com/1471-2180/11/175
Page 8 of 12
have used culture-independent methods to study themicrobial profile of these foods [29]. It is known, how-ever, that some cold-tolerant bacteria, such as Entero-bacteriaceae, Acinetobacter and Pseudomonas, arecommonly present on broiler meat [30]. These bacteriaare primarily facultative anaerobes or microaerobicorganisms, and the ribosomal RNA gene sequencesrecovered in our samples, especially form the most pro-minent bands from DGGE gels, had a high similarity tothese bacterial groups.RISA and DGGE can be used to broadly characterize
the total microbial population in complex samples. Theresults from these techniques were analyzed using thePearson correlation, which is the standard procedure forcomparison of densitometric curves [31; 32]. We ana-lyzed the results with the Pearson correlation and alsothe Dice coefficient, which takes into account only theband position and not the band thickness, as it is thecase in densitometric curves. Although the Dice correla-tion showed a higher DNA relatedness among corre-sponding M and A subsamples, the variability in thebacterial populations in each set of subsamples was stilllarge and appeared to be more attributable to the origi-nal bacterial composition of the sampled meat itselfthan to the enrichment conditions (aerobic vs. micro-aerobic). A significant limitation of DGGE-derived phy-logenetic data with the primers used in this study is therelatively short rDNA sequence obtained from eachamplicon, thereby reducing the degree of phylogeneticinference that may be assigned to each band. Yet, bothRISA and DGGE produced consistent results regardingthe variability in the bacterial assemblages associatedwith retail broiler meat samples.
ConclusionsIn summary, our results indicated that the enrichmentof retail broiler meat at 42°C in closed plastic bags andwithout the addition of a microaerobic mix is adequatefor the isolation of Campylobacter spp. With theadvancement of DNA-based biosensors and automationfor bacterial detection, enrichment broths could bescreened for the presence of Campylobacter spp. in ashorter time, with greater sensitivity and without thegeneration of any microaerobic condition. In addition,food microbiology laboratories interested in establishingtechniques for the isolation of Campylobacter fromretail meat will have access to a cost-effective enrich-ment procedure without the need to invest in systemsto generate microaerobiosis. Reference documents fromthe FDA and FSIS USDA should eventually be updatedto provide for an alternative, simplified protocol thatyields similar number of Campylobacter positive samplesas the current reference protocols.
MethodsSample preparation, incubation and CampylobacterisolationRetail broiler meat samples (total = 108 samples; 49breasts and 59 thighs) were purchased from local stores(Auburn, AL) from April 2009 to October 2010. Sam-ples were tested in batches of three to five samples perweek. Each meat package was considered one sample,and from each package ~1-inch pieces were cut asepti-cally and mixed thoroughly. For all samples, 25 g ofmeat was weighed two times (two subsamples) in indivi-dual, sterile Whirl-Pak® (Nasco, Fort Atkinson, WI).Each subsample was enriched in 100 ml of Bolton’sbroth (with antimicrobial supplements) and 5% (v/v) oflysed horse blood [17]. The control subsamples (micro-aerobic subsamples) were incubated in anaerobic jarsgassed with a microaerobic gas mix (85% N2, 10% CO2,5% O2; Airgas, Radnor, PA) using the evacuation-repla-cement system MACSmics Jar Gassing System (Micro-biology International, Frederick, MD). The othersubsamples (aerobic subsamples) were incubated with-out the addition of microaerobic gas mix, by closing thebags after removing the remaining air manually. All sub-samples were incubated at 42°C for 48 h.After incubation and for all subsamples, 0.1 ml of the
enriched broth was transferred to modified charcoalcefoperazone deoxycholate agar [10] through a 0.65 μmmembrane filter as described elsewhere [33]. All agarplates were incubated under microaerobic conditions at42°C for 48 h. Presumptive Campylobacter colonieswere observed under phase contrast microscopy (Olym-pus BX51, Olympus America Inc., Center Valley, P) forspiral morphology and darting motility. Presumptive iso-lates were stored at -80°C in tryptic soy broth (Difco,Detroit, MI) supplemented with 20% glycerol (v/v) and5% (v/v) lysed horse blood for further analysis.
Identification of presumptive Campylobacter isolates bymPCR assaysCampylobacter isolates were recovered from frozen stocksby transferring to Brucella agar plates supplemented with5% horse blood and through 0.6 μm membrane filters asdescribed above. Plates were incubated at 42°C undermicroaerobic conditions for 24 h. Bacterial DNA wasextracted using the Wizard® Genomic DNA PurificationKit as described by the manufacturer (Promega, Madison,WI), but bypassing the RNA digestion step. Isolates wereidentified with a previously described mPCR assay [17; 34;35], and a newly developed mPCR comprised of two setsof primers, one targeting the glyA gene of C. jejuni and theother targeting the ask gene of C. coli. Gene sequencesdownloaded from NCBI GenBank were aligned and ana-lyzed using Molecular Evolutionary Genetics Analysis
Zhou et al. BMC Microbiology 2011, 11:175http://www.biomedcentral.com/1471-2180/11/175
Page 9 of 12
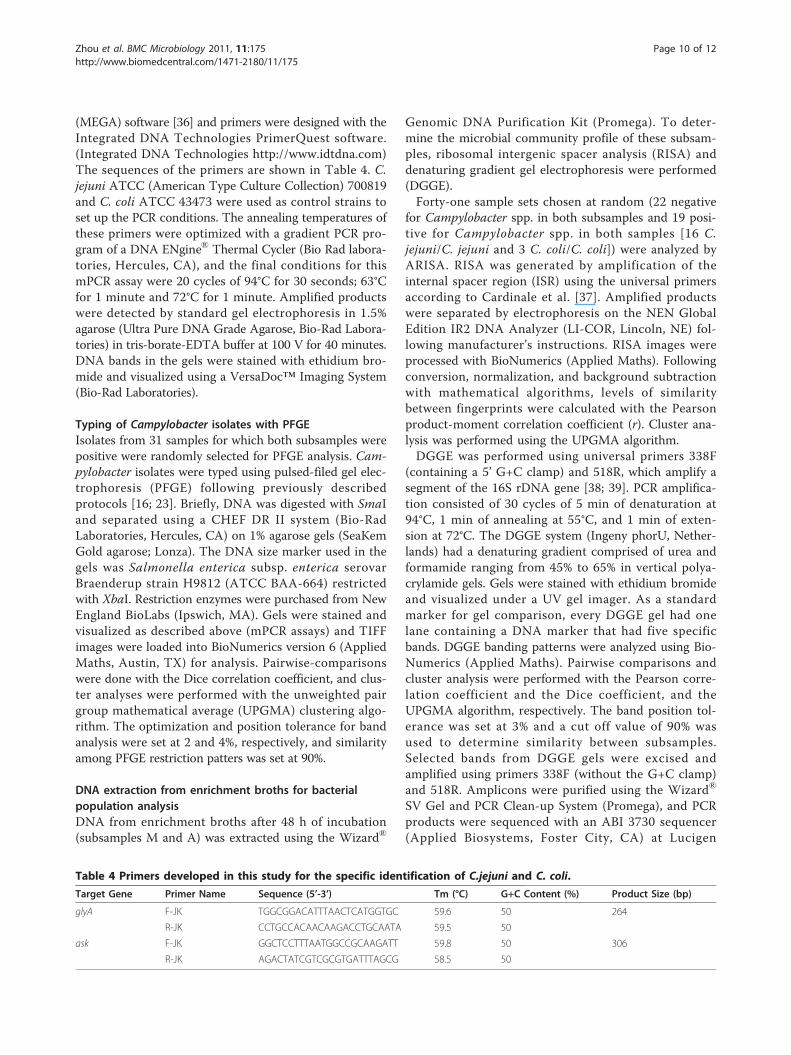
(MEGA) software [36] and primers were designed with theIntegrated DNA Technologies PrimerQuest software.(Integrated DNA Technologies http://www.idtdna.com)The sequences of the primers are shown in Table 4. C.jejuni ATCC (American Type Culture Collection) 700819and C. coli ATCC 43473 were used as control strains toset up the PCR conditions. The annealing temperatures ofthese primers were optimized with a gradient PCR pro-gram of a DNA ENgine® Thermal Cycler (Bio Rad labora-tories, Hercules, CA), and the final conditions for thismPCR assay were 20 cycles of 94°C for 30 seconds; 63°Cfor 1 minute and 72°C for 1 minute. Amplified productswere detected by standard gel electrophoresis in 1.5%agarose (Ultra Pure DNA Grade Agarose, Bio-Rad Labora-tories) in tris-borate-EDTA buffer at 100 V for 40 minutes.DNA bands in the gels were stained with ethidium bro-mide and visualized using a VersaDoc™ Imaging System(Bio-Rad Laboratories).
Typing of Campylobacter isolates with PFGEIsolates from 31 samples for which both subsamples werepositive were randomly selected for PFGE analysis. Cam-pylobacter isolates were typed using pulsed-filed gel elec-trophoresis (PFGE) following previously describedprotocols [16; 23]. Briefly, DNA was digested with SmaIand separated using a CHEF DR II system (Bio-RadLaboratories, Hercules, CA) on 1% agarose gels (SeaKemGold agarose; Lonza). The DNA size marker used in thegels was Salmonella enterica subsp. enterica serovarBraenderup strain H9812 (ATCC BAA-664) restrictedwith XbaI. Restriction enzymes were purchased from NewEngland BioLabs (Ipswich, MA). Gels were stained andvisualized as described above (mPCR assays) and TIFFimages were loaded into BioNumerics version 6 (AppliedMaths, Austin, TX) for analysis. Pairwise-comparisonswere done with the Dice correlation coefficient, and clus-ter analyses were performed with the unweighted pairgroup mathematical average (UPGMA) clustering algo-rithm. The optimization and position tolerance for bandanalysis were set at 2 and 4%, respectively, and similarityamong PFGE restriction patters was set at 90%.
DNA extraction from enrichment broths for bacterialpopulation analysisDNA from enrichment broths after 48 h of incubation(subsamples M and A) was extracted using the Wizard®
Genomic DNA Purification Kit (Promega). To deter-mine the microbial community profile of these subsam-ples, ribosomal intergenic spacer analysis (RISA) anddenaturing gradient gel electrophoresis were performed(DGGE).Forty-one sample sets chosen at random (22 negative
for Campylobacter spp. in both subsamples and 19 posi-tive for Campylobacter spp. in both samples [16 C.jejuni/C. jejuni and 3 C. coli/C. coli]) were analyzed byARISA. RISA was generated by amplification of theinternal spacer region (ISR) using the universal primersaccording to Cardinale et al. [37]. Amplified productswere separated by electrophoresis on the NEN GlobalEdition IR2 DNA Analyzer (LI-COR, Lincoln, NE) fol-lowing manufacturer’s instructions. RISA images wereprocessed with BioNumerics (Applied Maths). Followingconversion, normalization, and background subtractionwith mathematical algorithms, levels of similaritybetween fingerprints were calculated with the Pearsonproduct-moment correlation coefficient (r). Cluster ana-lysis was performed using the UPGMA algorithm.DGGE was performed using universal primers 338F
(containing a 5’ G+C clamp) and 518R, which amplify asegment of the 16S rDNA gene [38; 39]. PCR amplifica-tion consisted of 30 cycles of 5 min of denaturation at94°C, 1 min of annealing at 55°C, and 1 min of exten-sion at 72°C. The DGGE system (Ingeny phorU, Nether-lands) had a denaturing gradient comprised of urea andformamide ranging from 45% to 65% in vertical polya-crylamide gels. Gels were stained with ethidium bromideand visualized under a UV gel imager. As a standardmarker for gel comparison, every DGGE gel had onelane containing a DNA marker that had five specificbands. DGGE banding patterns were analyzed using Bio-Numerics (Applied Maths). Pairwise comparisons andcluster analysis were performed with the Pearson corre-lation coefficient and the Dice coefficient, and theUPGMA algorithm, respectively. The band position tol-erance was set at 3% and a cut off value of 90% wasused to determine similarity between subsamples.Selected bands from DGGE gels were excised andamplified using primers 338F (without the G+C clamp)and 518R. Amplicons were purified using the Wizard®
SV Gel and PCR Clean-up System (Promega), and PCRproducts were sequenced with an ABI 3730 sequencer(Applied Biosystems, Foster City, CA) at Lucigen
Table 4 Primers developed in this study for the specific identification of C.jejuni and C. coli.
Target Gene Primer Name Sequence (5’-3’) Tm (°C) G+C Content (%) Product Size (bp)
glyA F-JK TGGCGGACATTTAACTCATGGTGC 59.6 50 264
R-JK CCTGCCACAACAAGACCTGCAATA 59.5 50
ask F-JK GGCTCCTTTAATGGCCGCAAGATT 59.8 50 306
R-JK AGACTATCGTCGCGTGATTTAGCG 58.5 50
Zhou et al. BMC Microbiology 2011, 11:175http://www.biomedcentral.com/1471-2180/11/175
Page 10 of 12
Corporation (Middleton, WI). Sequences were alignedwith MultAlin [40] and the consensus sequences werecompared to the GenBank database using BLAST http://blast.ncbi.nlm.nih.gov/Blast.cgi. The accession numbersof the sequences deposited in GenBank are GU250527through GU250536.
Detection of O2 changes during the incubation ofenrichment brothThe changes in the amount of O2 in the enrichmentbroth and the head space in the enrichment bags wasmeasured in eight aerobic subsamples using a dissolvedoxygen (DO) sensor (amount of oxygen in liquid mea-sured as mg/l or ppm), and an oxygen (O2) sensor (per-centage of oxygen in the air). These sensors werepurchased from Vernier (Beaverton, OR). A double bag-ging system was used to avoid air leaks during the mea-surements taken with the O2 sensors during incubation.Changes in O2 concentration were measured in all sub-samples. The O2 Gas Sensor was calibrated to the envir-onment within the plastic bag which producescondensation (100% humidity), and therefore was startedat 20.1 O2 in percentage by volume. The DO sensor waspositioned in the enrichment bag with the collection tipof the sensor placed at the bottom of the enrichmentbroth with the subsample. The O2 sensor was placed inthe head space of the bag above the liquid. The excessair was expelled from the bag before sealing and incuba-tion for 48 h. The DO sensor was calibrated by pre-warming the probe for 10 min in the broth before start-ing the readings. Throughout incubation, the sensorswere connected to a laptop computer with the LoggerLite™ data collection program (version 1.4) thatrecorded readings every 1 min. The data were analyzedusing Microsoft Excel (Microsoft Corporation, Red-mond, WA).
Statistical analysesAn unpaired sample design was used where the numberof Campylobacter positive subsamples enriched undermicroaerobic conditions (reference method) was com-pared to the number of Campylobacter positive subsam-ples enriched under aerobic conditions (alternativemethod). Statistical comparisons were made using theformula mcnemar. test (x, y, correct = TRUE) of R [41],which is the McNemar’s chi-squared (g2) test for countdata, and it is based on McNemar’s Test for correlatedproportions [42]. The accuracy, sensitivity, specificity,and Kappa values for the test were calculated using 2-by-2 tables according to Hanrahan and Madupu [43]. Areceiver operating characteristic (ROC) curve was deter-mined with a web-based calculator with an ordinal rat-ing scale of 1 through 4, where 1 represents samplesthat were negative for Campylobacter spp. in both
subsamples, and 4 represents samples that were positivefor both subsamples [44].
AcknowledgementsWe thank Leslie Speegle for her assistance in collecting the sensor data andKennedy Wekesa for allowing us access to the phase contrast microscope.JK work was supported by grant 0754966 from the Research Experiences forUndergraduates Program of the Biology Directorate of the National ScienceFoundation. The work of S.B. is supported by Science Foundation Ireland(UCD 09/IN.1/B2609).
Author details1Department of Biological Sciences, 1627 Hall Street, Alabama StateUniversity, Montgomery, AL, USA. 2Department of Microbiology andImmunology, University of Arkansas for Medical Sciences, Little Rock, AK,USA. 3Department of Biological Sciences, 101 Rouse Life Science BldgAuburn University, AL, USA. 4Department of Fisheries and AlliedAquacultures, 101 Swindle Hall, Auburn University, AL, USA. 5UniversityCollege Dublin, UCD School of Biomolecular and Biomedical Sciences,Science Center West, Belfield Campus, Dublin 4, Ireland.
Authors’ contributionsPZ carried out the sample collection, the DNA preparation, PFGE and PCR-DGGE assays, and image statistical analysis. SKH helped with samplecollection and DGGE analysis. ML helped optimize the DGGE analysis. CRAcarried out RISA assays. SB helped analyze data and wrote part of themanuscript. JRK carried out the primer design to differentiate C. jejuni fromC. coli. OAO conceived and coordinated the study, designed and revised themanuscript. All authors read and accepted the final version of themanuscript.
Received: 10 May 2011 Accepted: 3 August 2011Published: 3 August 2011
References1. Anon: European Food Safety Authority. Trends and sources of zoonoses,
zoonotic agents and antimicrobial resistance in the European Union in 20042006, 96-16.
2. Anon: Isolation, identification, and enumeration of Campylobacter jejuni/coli/lari from poultry rinse and sponge samples. Laboratory Guidebook,MLG 41.00 2010 [http://www.fsis.usda.gov/PDF/MLG_41_01.pdf].
3. Scallan E, Hoekstra RM, Angulo FJ, Tauxe RV, Widdowson MA, Roy SL,Jones JL, Griffin PM: Foodborne illness acquired in the United States–major pathogens. Emerg Infect Dis 2011, 17:7-15.
4. Liu L, Hussain SK, Miller RS, Oyarzabal OA, Research Note: Efficacy of MiniVIDAS for the Detection of Campylobacter spp. from retail broiler meatenriched in Bolton broth with or without the supplementation of blood.J Food Prot 2009, 72:2428-2432.
5. Oyarzabal OA, Wesley IV, Barbaree JM, Lauerman LH, Conner DE: Specificdetection of Campylobacter lari by PCR. J Microbiol Methods 1997,29:97-102.
6. Reilly SS, Gilliland SE: Improving culturing techniques for Campylobacter. JFood Sci 2003, 68:2752-2757.
7. Frost JA, Oza AN, Thwaites RT, Rowe B: Serotyping scheme forCampylobacter jejuni and Campylobacter coli based on directagglutination of heat-stable antigens. J Clin Microbiol 1998,36:335-339.
8. Corry JE, Atabay HI, Forsythe SJ, Mansfield LR: Culture media for theisolation of campylobacters, helicobacters and arcobacters. In Handbookof culture media for food microbiology, progress in industrial microbiology.Edited by: Corry JE, Curtis G, Baird RM. Amsterdam, The Netherlands:Elsevier Science BV; 2003:271-316.
9. Corry JE, Post DE, Colin P, Laisney MJ: Culture media for the isolation ofcampylobacters. Int J Food Microbiol 1995, 26:43-76.
10. Hutchinson DN, Bolton FJ: Improved blood free selective medium for theisolation of Campylobacter jejuni from fecal specimens. J Clin Pathol 1984,37:956-957.
11. Bowdre JH, Krieg NR, Hoffman PS, Smibert RM: Stimulatory effect ofdihydroxyphenyl compounds on the aerotolerance of Spirillum volutans
Zhou et al. BMC Microbiology 2011, 11:175http://www.biomedcentral.com/1471-2180/11/175
Page 11 of 12
and Campylobacter fetus subspecies jejuni. Appl Environ Microbiol 1976,31:127-133.
12. George HA, Hoffman PS, Smibert RM, Krieg NR: Improved media forgrowth and aerotolerance of Campylobacter fetus. J Clin Microbiol 1978,8:36-41.
13. Oyarzabal OA, Macklin KS, Barbaree JM, Miller RS: Evaluation of agar platesfor direct enumeration of Campylobacter spp. from poultry carcassrinses. Appl Environ Microbiol 2005, 71:3351-3354.
14. Szalanski AL, Owens CB, Mckay T, Steelman CD: Detection ofCampylobacter and Escherichia coli O157:H7 from filth flies bypolymerase chain reaction. Med Vet Entomol 2004, 18:241-246.
15. Fleiss JL, Levin B, Paik MC: The measurement of interrater agreement. InStatistical methods for rates and proportion.. 3 edition. Edited by: Fleiss JL,Levin B, Paik MC. New York, NY: Wiley-Interscience; 2003:603-617.
16. Behringer M, Miller WG, Oyarzabal OA: Typing of Campylobacter jejuni andCampylobacter coli isolated from live broilers and retail broiler meat byflaA-RFLP, MLST, PFGE and REP-PCR. J Microbiol Methods 2010, 84:194-201.
17. Oyarzabal OA, Backert S, Nagaraj M, Miller RS, Hussain SK, Oyarzabal EA:Efficacy of supplemented buffered peptone water for the isolation ofCampylobacter jejuni and C. coli from broiler retail products. J MicrobiolMethods 2007, 69:129-136.
18. Brunelle S: Validation of microbiological methods for food. StatisticalAspects of the Microbiological Examination of Foods. 2 edition. AcademicPress, Elsevier; 2008, 259-277.
19. Hunt JM, Abeyta C, Tran T: Isolation of Campylobacter Species from Foodand Water. In Food and Drug Administration Bacteriological AnalyticalManual. Volume Chapter 7.. 8 edition. Revision A/1998. Arlington. VA.Association of Official Analytical Chemists International; 2001.
20. Anon: Isolation, identification, and enumeration of Campylobacter jejuni/coli/lari from poultry rinse and sponge samples. Laboratory Guidebook,MLG 41.00 2010 [http://www.fsis.usda.gov/science/Microbiological_Lab_Guidebook/].
21. Anon: Microbiology of food and animal feeding stuffs - Horizontalmethod for detection and enumeration of Campylobacter spp. Part 1:Detection methods. ISO 2006, 10272-1:2006.
22. Anon: Detection of Campylobacter species. National Standard Method F21Health Protection Agency. UK; 1998, 2.
23. Miller RS, Miller WG, Behringer MG, Hariharan H, Matthew V, Oyarzabal OA:DNA identification and characterization of Campylobacter jejuni andCampylobacter coli isolated from caecal samples of chickens in Grenada.J Appl Microbiol 2010, 108:1041-1049.
24. Martin WH, Patton CM, Morris GK, Potter ME, Puhr ND: Selectiveenrichment broth medium for isolation of Campylobacter jejuni. J ClinMicrobiol 1983, 17:853-855.
25. Bolton FJ, Coates D: Development of a blood-free Campylobactermedium: screening tests on basal media and supplements, and theability of selected supplements to facilitate aerotolerance. J ApplMicrobiol 1983, 54:115-125.
26. Wesley RD, Swaminathan B, Stadelman WJ: Isolation and enumeration ofCampylobacter jejuni from poultry products by a selective enrichmentmethod. Appl Environ Microbiol 1983, 46:1097-1102.
27. Moran L, Kelly C, Madden RH: Factors affecting the recovery ofCampylobacter spp. from retail packs of raw, fresh chicken using ISO10272-1:2006. Lett Appl Microbiol 2009, 48:628-632.
28. Reilly SS, Gilliland SE: Improving culturing techniques for Campylobacter. JFood Sci 2003, 68:2752-2757.
29. Vihavainen E, Lundstrom HS, Susiluoto T, Koort J, Paulin L, Auvinen P,Björkroth KJ: Role of broiler carcasses and processing plant air incontamination of modified-atmosphere packaged broiler products withpsychrotrophic lactic acid bacteria. Appl Environ Microbiol 2007,73:1136-1145.
30. Vihavainen EJ, Björkroth J: Microbial ecology and spoilage of poultry meatand poultry meat products. In Handbook of Poultry Science and Technology,Secondary Processing. Volume 2. Edited by: Guerrero-Legarreta et al. NewYork. NY: Blackwell-Wiley Publishing; 2010:485-493.
31. Vauterin L, Vauterin P: Integrated databasing and analysis. In Molecularidentification, systematic and population structure of prokaryotes. Edited by:Stackebrandt E. Berlin Heidelberg Springer-Verlag; 2006:141-217.
32. Tzeneva VA, Heilig HG, Akkermans HJ, van Vliet W, Akkermans ADL, deVos WM, Smidt H: 16S rRNA targeted DGGE fingerprinting of microbial
communities. In Environmental Genomic. Edited by: Cristofre MC. Totowa,NJ, Humana Press; 2007:335-349.
33. Speegle L, Miller ME, Backert S, Oyarzabal OA, Research Note: Use ofcellulose filters to isolate Campylobacter spp. from naturallycontaminated retail broiler meat. J Food Prot 2009, 72:2592-2596.
34. Linton D, Lawson AJ, Owen RJ, Stanley J: PCR detection, identification tospecies level, and fingerprinting of Campylobacter jejuni andCampylobacter coli direct from diarrheic samples. J Clin Microbiol 1997,35:2568-2572.
35. Persson S, Olsen KEP: Multiplex PCR for identification of Campylobactercoli and Campylobacter jejuni from pure cultures and directly on stoolsamples. J Med Microbiol 2005, 54:1043-1047.
36. Anon: Molecular Evolutionary Genetics Analysis MEGA Version 4. 2010[http://www.megasoftware.net].
37. Cardinale M, Brusetti L, Quatrini P, Borin S, Puglia AM, Rizzi A, Zanardini E,Sorlini C, Corselli C, Daffonchio D: Comparison of different primer sets foruse in automated ribosomal intergenic spacer analysis of complexbacterial communities. Appl Environ Microbiol 2004, 70:6147-6156.
38. Muyzer G, De Waal EC, Uitterlinden AG: Profiling of complex microbialpopulations by denaturing gradient gel electrophoresis analysis ofpolymerase chain reaction-amplified genes coding for 16S rRNA. ApplEnviron Microbiol 1993, 59:695-700.
39. Sheffield VC, Cox DR, Lerman LS, Myers RM: Attachment of a 40-base-pairG + C-rich sequence GC-clamp to genomic DNA fragments by thepolymerase chain reaction results in improved detection of single-basechanges. Proc Natl Acad Sci USA 1989, 86:232-236.
40. Corpet F: Multiple sequence alignment with hierarchical clustering.Nucleic Acids Res 1988, 16:10881-10890.
41. Anon: R: A language and environment for statistical computing. RFoundation for Statistical Computing, Vienna, ISBN 3-900051-07-0 RDevelopment Core Team. Austria; 2010 [http://www.R-project.org].
42. McNemar Q: Note on the sampling error of the difference betweencorrelated proportions or percentages. Psychometrika 1947, 12:153-157.
43. Hanrahan EJ, Madupu G: The 2-by-2 table and its concepts. In Appleton &Lange’s review of epidemiology & biostatistics for the USMLE. Edited by:Hanrahan EJ, Madupu G. New Jersey: Prentice Hall. Englewood Cliffs;1994:11-19.
44. Eng J: Web-based calculator for ROC curves. 2007, Accessed from http://www.rad.jhmi.edu/jeng/javarad/roc/JROCFITi.html. ROC Analysis.
doi:10.1186/1471-2180-11-175Cite this article as: Zhou et al.: A simplified and cost-effectiveenrichment protocol for the isolation of Campylobacter spp. from retailbroiler meat without microaerobic incubation. BMC Microbiology 201111:175.
Submit your next manuscript to BioMed Centraland take full advantage of:
• Convenient online submission
• Thorough peer review
• No space constraints or color figure charges
• Immediate publication on acceptance
• Inclusion in PubMed, CAS, Scopus and Google Scholar
• Research which is freely available for redistribution
Submit your manuscript at www.biomedcentral.com/submit
Zhou et al. BMC Microbiology 2011, 11:175http://www.biomedcentral.com/1471-2180/11/175
Page 12 of 12