Energy Content of Antarctic Mesopelagic Fishes: Implications for the Marine Food Web
7
ORIGINAL PAPER Anton Van de Putte Hauke Flores Filip Volckaert Jan Andries van Franeker Energy content of Antarctic mesopelagic fishes: implications for the marine food web Received: 20 January 2006 / Revised: 3 April 2006 / Accepted: 3 April 2006 / Published online: 11 May 2006 Ó Springer-Verlag 2006 Abstract For a better understanding of the role of mesopelagic fish in the Southern Ocean food web, the energy and water content of Bathylagus antarcticus, Electrona antarctica and Gymnoscopelus braueri from the Lazarev Sea were investigated. Mean dry weight energy content of B. antarcticus (20.4 kJ g 1 ) was sig- nificantly lower than in E. antarctica and G. braueri (both 29.4 kJ g 1 ). In E. antarctica, an increase of dry weight energy density with age was evident from 26.9 kJ g 1 in juveniles of less than 1 year of age to 32.0 kJ g 1 in 3-year-old fish. Water content decreased with size in all three species. Abundant high-energy species such as E. antarctica are at a key position in the food web. Due to a marked influence of age on energy content, population structure can be an important var- iable in estimates of energy fluxes in the Southern Ocean ecosystem. Introduction Energy content of prey is a key factor controlling the structure of food webs and the relationships between their components. Accurate measurements of the calo- rific value of prey and predators allow estimates of food requirements and energy flux from lower to higher tro- phic levels. As such, they are valuable for the develop- ment of ecosystem models and play an important role in ecosystem management. With increasing evidence that the classic diatom-krill-consumer model of the Southern Ocean is more complex than initially assumed, there is a need to better understand the role and position of other organisms, such as squid and mesopelagic fish (Ainley et al. 1992, 1994; van Franeker et al. 1997; Barrera-Oro 2002). Lanternfishes (family Myctophidae) are the most abundant mesopelagic fish of the Antarctic Ocean, both in numbers and biomass (Kock 1992). They are major predators on mesozooplankton (Pakhomov et al. 1996; Pusch et al. 2004). Among them, Electrona antarctica (Gu¨nther, 1878) is considered a key species due to its high abundance and almost circumpolar distribution (Hulley 1990; Sabourenkov 1990; Hopkins et al. 1993; Barrera-Oro 2002). They display a diel migration be- tween 300–650 m during the day and close to the surface layer at night. E. antarctica are an important prey for birds and seals (Lea et al. 2002a; Quillfeldt 2002; Casaux et al. 2003). The myctophid Gymnoscopelus braueri (Lo¨nnberg, 1905) exhibits a similar ubiquity, but ap- pears to be less abundant than E. antarctica (Torres and Somero 1988; Lancraft et al. 1989; Sabourenkov 1990). Their role in the food web can be significant on a local scale (Ainley et al. 1991, 1994). Bathylagus antarcticus Gu¨nther, 1878 (family Bathylagidae) is widely distrib- uted throughout the Antarctic Ocean. It is generally considered a deeper-dwelling midwater species mainly occurring between 950 and 170 m depth, with some vertical migration on a diel as well as seasonal basis (Lancraft et al. 1989; Gon 1990). Apart from sporadic occurrence in the diet of Antarctic fur seals (Casaux et al. 2004), B. antarcticus has not been reported to play a significant role in the diet of higher predators. Energy content of Southern Ocean mesopelagic fish species has been estimated with respect to depth, season or region (Donnelly et al. 1990; Lea et al. 2002b; Tierney et al. 2002), or in the context of diet studies (Clarke and Prince 1980; Cherel and Ridoux 1992; Eder and Lewis 2005). Most studies were based on relatively small sample sizes. A. Van de Putte (&) F. Volckaert Laboratory of Aquatic Ecology, Catholic University Leuven, Ch. Deberiotstraat 32, 3000 Leuven, Belgium E-mail: [email protected] H. Flores J. A. van Franeker IMARES Texel, P.O. Box 167, 1790 AD Den Burg, The Netherlands H. Flores Department of Marine Biology, Groningen University, P.O. Box 14, 9750 AA Haren, The Netherlands Polar Biol (2006) 29: 1045–1051 DOI 10.1007/s00300-006-0148-z
-
Upload
independent -
Category
Documents
-
view
4 -
download
0
Transcript of Energy Content of Antarctic Mesopelagic Fishes: Implications for the Marine Food Web

ORIGINAL PAPER
Anton Van de Putte Æ Hauke Flores Æ Filip Volckaert
Jan Andries van Franeker
Energy content of Antarctic mesopelagic fishes: implicationsfor the marine food web
Received: 20 January 2006 / Revised: 3 April 2006 / Accepted: 3 April 2006 / Published online: 11 May 2006� Springer-Verlag 2006
Abstract For a better understanding of the role ofmesopelagic fish in the Southern Ocean food web, theenergy and water content of Bathylagus antarcticus,Electrona antarctica and Gymnoscopelus braueri fromthe Lazarev Sea were investigated. Mean dry weightenergy content of B. antarcticus (20.4 kJ g�1) was sig-nificantly lower than in E. antarctica and G. braueri(both 29.4 kJ g�1). In E. antarctica, an increase of dryweight energy density with age was evident from26.9 kJ g�1 in juveniles of less than 1 year of age to32.0 kJ g�1 in 3-year-old fish. Water content decreasedwith size in all three species. Abundant high-energyspecies such as E. antarctica are at a key position in thefood web. Due to a marked influence of age on energycontent, population structure can be an important var-iable in estimates of energy fluxes in the Southern Oceanecosystem.
Introduction
Energy content of prey is a key factor controlling thestructure of food webs and the relationships betweentheir components. Accurate measurements of the calo-rific value of prey and predators allow estimates of foodrequirements and energy flux from lower to higher tro-phic levels. As such, they are valuable for the develop-ment of ecosystem models and play an important role in
ecosystem management. With increasing evidence thatthe classic diatom-krill-consumer model of the SouthernOcean is more complex than initially assumed, there is aneed to better understand the role and position of otherorganisms, such as squid and mesopelagic fish (Ainleyet al. 1992, 1994; van Franeker et al. 1997; Barrera-Oro2002).
Lanternfishes (family Myctophidae) are the mostabundant mesopelagic fish of the Antarctic Ocean, bothin numbers and biomass (Kock 1992). They are majorpredators on mesozooplankton (Pakhomov et al. 1996;Pusch et al. 2004). Among them, Electrona antarctica(Gunther, 1878) is considered a key species due to itshigh abundance and almost circumpolar distribution(Hulley 1990; Sabourenkov 1990; Hopkins et al. 1993;Barrera-Oro 2002). They display a diel migration be-tween 300–650 m during the day and close to the surfacelayer at night. E. antarctica are an important prey forbirds and seals (Lea et al. 2002a; Quillfeldt 2002; Casauxet al. 2003). The myctophid Gymnoscopelus braueri(Lonnberg, 1905) exhibits a similar ubiquity, but ap-pears to be less abundant than E. antarctica (Torres andSomero 1988; Lancraft et al. 1989; Sabourenkov 1990).Their role in the food web can be significant on a localscale (Ainley et al. 1991, 1994). Bathylagus antarcticusGunther, 1878 (family Bathylagidae) is widely distrib-uted throughout the Antarctic Ocean. It is generallyconsidered a deeper-dwelling midwater species mainlyoccurring between 950 and 170 m depth, with somevertical migration on a diel as well as seasonal basis(Lancraft et al. 1989; Gon 1990). Apart from sporadicoccurrence in the diet of Antarctic fur seals (Casauxet al. 2004), B. antarcticus has not been reported to playa significant role in the diet of higher predators.
Energy content of Southern Ocean mesopelagic fishspecies has been estimated with respect to depth, seasonor region (Donnelly et al. 1990; Lea et al. 2002b; Tierneyet al. 2002), or in the context of diet studies (Clarke andPrince 1980; Cherel and Ridoux 1992; Eder and Lewis2005). Most studies were based on relatively smallsample sizes.
A. Van de Putte (&) Æ F. VolckaertLaboratory of Aquatic Ecology, Catholic University Leuven,Ch. Deberiotstraat 32, 3000 Leuven, BelgiumE-mail: [email protected]
H. Flores Æ J. A. van FranekerIMARES Texel, P.O. Box 167,1790 AD Den Burg, The Netherlands
H. FloresDepartment of Marine Biology, Groningen University,P.O. Box 14, 9750 AA Haren, The Netherlands
Polar Biol (2006) 29: 1045–1051DOI 10.1007/s00300-006-0148-z
This paper contributes a new dataset for a region sofar not sampled in the context of energetic analyses forecosystem-based energy budget models. We discuss theinfluence of population structure on the energy budgetbased on the species-specific evolution of energy contentwith size and age. The ecological role of the three speciesinvestigated is evaluated in the light of their nutritionalvalue, distribution, biology and function in the food web.
Materials and methods
Sampling procedure
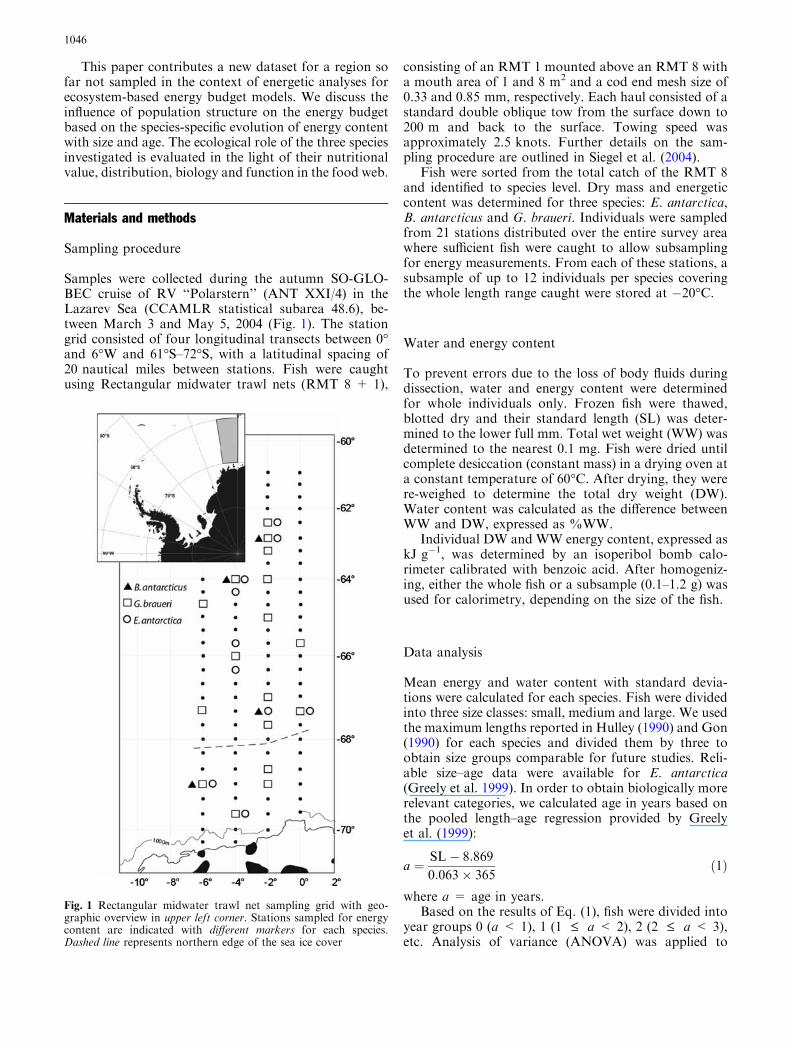
Samples were collected during the autumn SO-GLO-BEC cruise of RV ‘‘Polarstern’’ (ANT XXI/4) in theLazarev Sea (CCAMLR statistical subarea 48.6), be-tween March 3 and May 5, 2004 (Fig. 1). The stationgrid consisted of four longitudinal transects between 0�and 6�W and 61�S–72�S, with a latitudinal spacing of20 nautical miles between stations. Fish were caughtusing Rectangular midwater trawl nets (RMT 8 + 1),
consisting of an RMT 1 mounted above an RMT 8 witha mouth area of 1 and 8 m2 and a cod end mesh size of0.33 and 0.85 mm, respectively. Each haul consisted of astandard double oblique tow from the surface down to200 m and back to the surface. Towing speed wasapproximately 2.5 knots. Further details on the sam-pling procedure are outlined in Siegel et al. (2004).
Fish were sorted from the total catch of the RMT 8and identified to species level. Dry mass and energeticcontent was determined for three species: E. antarctica,B. antarcticus and G. braueri. Individuals were sampledfrom 21 stations distributed over the entire survey areawhere sufficient fish were caught to allow subsamplingfor energy measurements. From each of these stations, asubsample of up to 12 individuals per species coveringthe whole length range caught were stored at �20�C.
Water and energy content
To prevent errors due to the loss of body fluids duringdissection, water and energy content were determinedfor whole individuals only. Frozen fish were thawed,blotted dry and their standard length (SL) was deter-mined to the lower full mm. Total wet weight (WW) wasdetermined to the nearest 0.1 mg. Fish were dried untilcomplete desiccation (constant mass) in a drying oven ata constant temperature of 60�C. After drying, they werere-weighed to determine the total dry weight (DW).Water content was calculated as the difference betweenWW and DW, expressed as %WW.
Individual DW and WW energy content, expressed askJ g�1, was determined by an isoperibol bomb calo-rimeter calibrated with benzoic acid. After homogeniz-ing, either the whole fish or a subsample (0.1–1.2 g) wasused for calorimetry, depending on the size of the fish.
Data analysis
Mean energy and water content with standard devia-tions were calculated for each species. Fish were dividedinto three size classes: small, medium and large. We usedthe maximum lengths reported in Hulley (1990) and Gon(1990) for each species and divided them by three toobtain size groups comparable for future studies. Reli-able size–age data were available for E. antarctica(Greely et al. 1999). In order to obtain biologically morerelevant categories, we calculated age in years based onthe pooled length–age regression provided by Greelyet al. (1999):
a ¼ SL� 8:869
0:063� 365ð1Þ
where a = age in years.Based on the results of Eq. (1), fish were divided into
year groups 0 (a < 1), 1 (1 £ a < 2), 2 (2 £ a < 3),etc. Analysis of variance (ANOVA) was applied to
Fig. 1 Rectangular midwater trawl net sampling grid with geo-graphic overview in upper left corner. Stations sampled for energycontent are indicated with different markers for each species.Dashed line represents northern edge of the sea ice cover
1046
detect significant differences in energy and water contentbetween species and their individual size classes and agegroups. Tukey’s Honestly Significant Difference test(Tukey’s HSD) was used as a post-hoc test to discrimi-nate species and single size classes and age groups fromeach other. Additionally, various regression analyseswere performed in order to estimate the effect of size onenergy and water content. Significance threshold a was0.05 for all statistical tests.
Results
Species comparison
Electrona antarctica was abundant throughout the sam-pling area. A large and continuous part of the total sizerange was covered in this species. Both other species werecaught infrequently. Only the upper portion of the nat-ural size range was obtained for G. braueri. B. antarcticuswas represented by a low number of samples spread overa wide size range, the bulk ranging from 36 to 95 mm,with only one larger specimen of 123 mm (Table 1).
While mean WW energy content of B. antarcticus(2.9 kJ g�1) was significantly lower than that of E. ant-arctica (9.4 kJ g�1) and G. braueri (8.9 kJ g�1), no sig-nificant difference could be detected between the twomyctophids in either WW or DW energy density. Con-versely, the bathylagid’s mean water content (86%) wassignificantly higher compared to that of E. antarctica(68%) and G. braueri (70%). The two myctophidsshowed no statistically significant difference in watercontent from each other (Table 2).
Size and age effects on energy content in E. antarctica
In E. antarctica, the number of samples and theirwidespread size distribution allowed the analysis of theeffect of size, DW and WW on energy density.
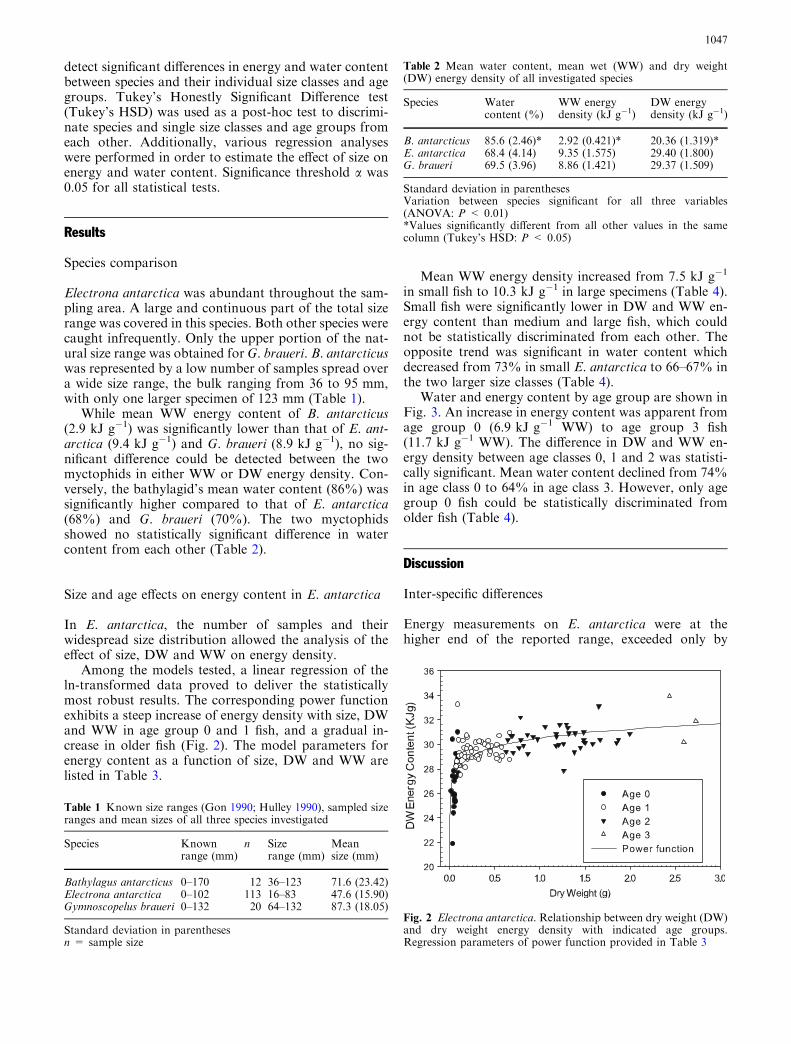
Among the models tested, a linear regression of theln-transformed data proved to deliver the statisticallymost robust results. The corresponding power functionexhibits a steep increase of energy density with size, DWand WW in age group 0 and 1 fish, and a gradual in-crease in older fish (Fig. 2). The model parameters forenergy content as a function of size, DW and WW arelisted in Table 3.
Mean WW energy density increased from 7.5 kJ g�1
in small fish to 10.3 kJ g�1 in large specimens (Table 4).Small fish were significantly lower in DW and WW en-ergy content than medium and large fish, which couldnot be statistically discriminated from each other. Theopposite trend was significant in water content whichdecreased from 73% in small E. antarctica to 66–67% inthe two larger size classes (Table 4).
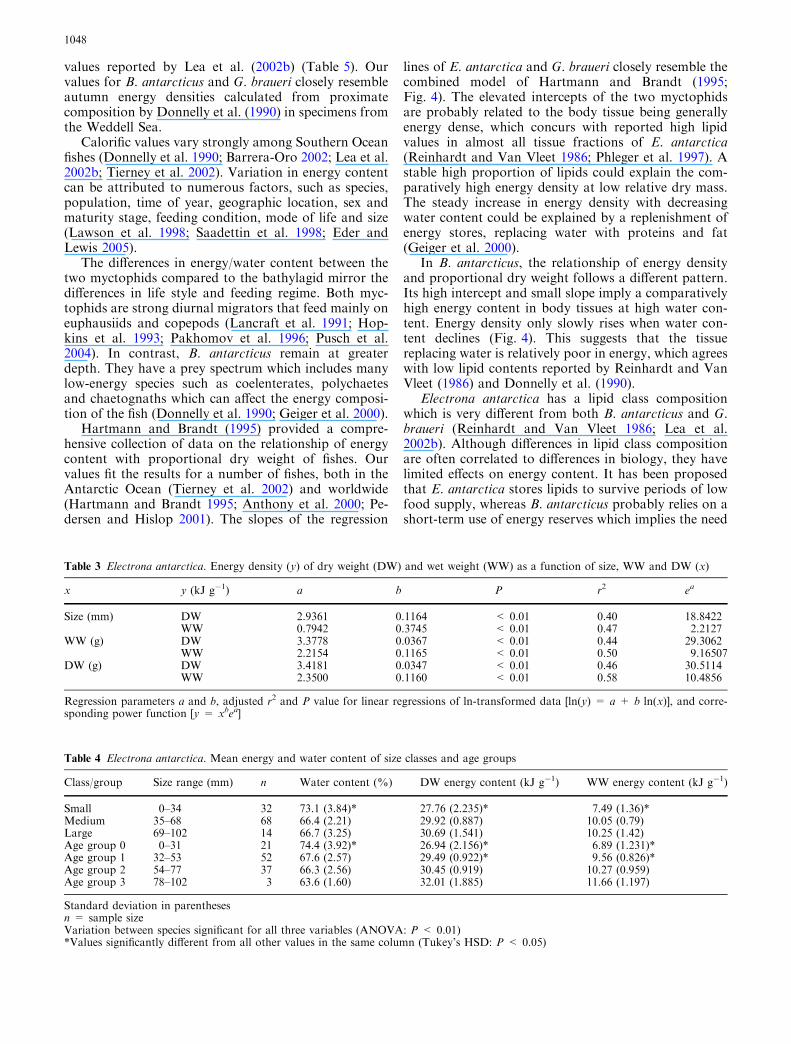
Water and energy content by age group are shown inFig. 3. An increase in energy content was apparent fromage group 0 (6.9 kJ g�1 WW) to age group 3 fish(11.7 kJ g�1 WW). The difference in DW and WW en-ergy density between age classes 0, 1 and 2 was statisti-cally significant. Mean water content declined from 74%in age class 0 to 64% in age class 3. However, only agegroup 0 fish could be statistically discriminated fromolder fish (Table 4).
Discussion
Inter-specific differences
Energy measurements on E. antarctica were at thehigher end of the reported range, exceeded only by
Table 1 Known size ranges (Gon 1990; Hulley 1990), sampled sizeranges and mean sizes of all three species investigated
Species Knownrange (mm)
n Sizerange (mm)
Meansize (mm)
Bathylagus antarcticus 0–170 12 36–123 71.6 (23.42)Electrona antarctica 0–102 113 16–83 47.6 (15.90)Gymnoscopelus braueri 0–132 20 64–132 87.3 (18.05)
Standard deviation in parenthesesn = sample size
Table 2 Mean water content, mean wet (WW) and dry weight(DW) energy density of all investigated species
Species Watercontent (%)
WW energydensity (kJ g�1)
DW energydensity (kJ g�1)
B. antarcticus 85.6 (2.46)* 2.92 (0.421)* 20.36 (1.319)*E. antarctica 68.4 (4.14) 9.35 (1.575) 29.40 (1.800)G. braueri 69.5 (3.96) 8.86 (1.421) 29.37 (1.509)
Standard deviation in parenthesesVariation between species significant for all three variables(ANOVA: P < 0.01)*Values significantly different from all other values in the samecolumn (Tukey’s HSD: P < 0.05)
Fig. 2 Electrona antarctica. Relationship between dry weight (DW)and dry weight energy density with indicated age groups.Regression parameters of power function provided in Table 3
1047
values reported by Lea et al. (2002b) (Table 5). Ourvalues for B. antarcticus and G. braueri closely resembleautumn energy densities calculated from proximatecomposition by Donnelly et al. (1990) in specimens fromthe Weddell Sea.
Calorific values vary strongly among Southern Oceanfishes (Donnelly et al. 1990; Barrera-Oro 2002; Lea et al.2002b; Tierney et al. 2002). Variation in energy contentcan be attributed to numerous factors, such as species,population, time of year, geographic location, sex andmaturity stage, feeding condition, mode of life and size(Lawson et al. 1998; Saadettin et al. 1998; Eder andLewis 2005).
The differences in energy/water content between thetwo myctophids compared to the bathylagid mirror thedifferences in life style and feeding regime. Both myc-tophids are strong diurnal migrators that feed mainly oneuphausiids and copepods (Lancraft et al. 1991; Hop-kins et al. 1993; Pakhomov et al. 1996; Pusch et al.2004). In contrast, B. antarcticus remain at greaterdepth. They have a prey spectrum which includes manylow-energy species such as coelenterates, polychaetesand chaetognaths which can affect the energy composi-tion of the fish (Donnelly et al. 1990; Geiger et al. 2000).
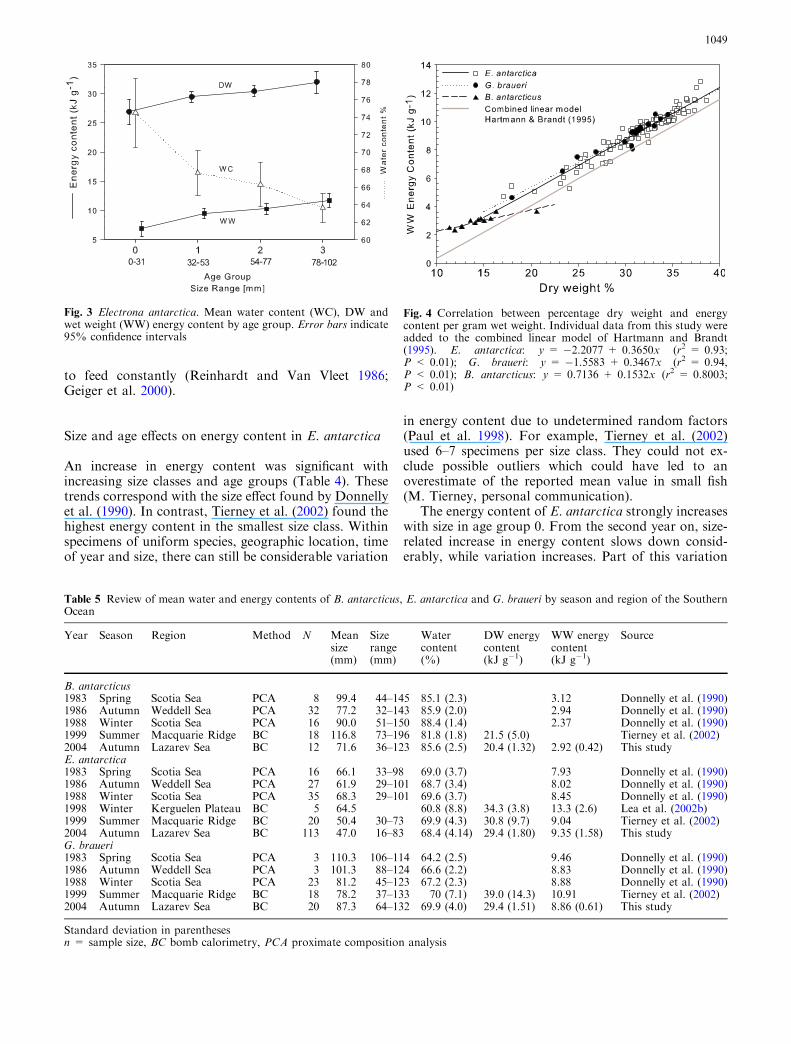
Hartmann and Brandt (1995) provided a compre-hensive collection of data on the relationship of energycontent with proportional dry weight of fishes. Ourvalues fit the results for a number of fishes, both in theAntarctic Ocean (Tierney et al. 2002) and worldwide(Hartmann and Brandt 1995; Anthony et al. 2000; Pe-dersen and Hislop 2001). The slopes of the regression
lines of E. antarctica and G. braueri closely resemble thecombined model of Hartmann and Brandt (1995;Fig. 4). The elevated intercepts of the two myctophidsare probably related to the body tissue being generallyenergy dense, which concurs with reported high lipidvalues in almost all tissue fractions of E. antarctica(Reinhardt and Van Vleet 1986; Phleger et al. 1997). Astable high proportion of lipids could explain the com-paratively high energy density at low relative dry mass.The steady increase in energy density with decreasingwater content could be explained by a replenishment ofenergy stores, replacing water with proteins and fat(Geiger et al. 2000).
In B. antarcticus, the relationship of energy densityand proportional dry weight follows a different pattern.Its high intercept and small slope imply a comparativelyhigh energy content in body tissues at high water con-tent. Energy density only slowly rises when water con-tent declines (Fig. 4). This suggests that the tissuereplacing water is relatively poor in energy, which agreeswith low lipid contents reported by Reinhardt and VanVleet (1986) and Donnelly et al. (1990).
Electrona antarctica has a lipid class compositionwhich is very different from both B. antarcticus and G.braueri (Reinhardt and Van Vleet 1986; Lea et al.2002b). Although differences in lipid class compositionare often correlated to differences in biology, they havelimited effects on energy content. It has been proposedthat E. antarctica stores lipids to survive periods of lowfood supply, whereas B. antarcticus probably relies on ashort-term use of energy reserves which implies the need
Table 3 Electrona antarctica. Energy density (y) of dry weight (DW) and wet weight (WW) as a function of size, WW and DW (x)
x y (kJ g�1) a b P r2 ea
Size (mm) DW 2.9361 0.1164 < 0.01 0.40 18.8422WW 0.7942 0.3745 < 0.01 0.47 2.2127
WW (g) DW 3.3778 0.0367 < 0.01 0.44 29.3062WW 2.2154 0.1165 < 0.01 0.50 9.16507
DW (g) DW 3.4181 0.0347 < 0.01 0.46 30.5114WW 2.3500 0.1160 < 0.01 0.58 10.4856
Regression parameters a and b, adjusted r2 and P value for linear regressions of ln-transformed data [ln(y) = a + b ln(x)], and corre-sponding power function [y = xbea]
Table 4 Electrona antarctica. Mean energy and water content of size classes and age groups
Class/group Size range (mm) n Water content (%) DW energy content (kJ g�1) WW energy content (kJ g�1)
Small 0–34 32 73.1 (3.84)* 27.76 (2.235)* 7.49 (1.36)*Medium 35–68 68 66.4 (2.21) 29.92 (0.887) 10.05 (0.79)Large 69–102 14 66.7 (3.25) 30.69 (1.541) 10.25 (1.42)Age group 0 0–31 21 74.4 (3.92)* 26.94 (2.156)* 6.89 (1.231)*Age group 1 32–53 52 67.6 (2.57) 29.49 (0.922)* 9.56 (0.826)*Age group 2 54–77 37 66.3 (2.56) 30.45 (0.919) 10.27 (0.959)Age group 3 78–102 3 63.6 (1.60) 32.01 (1.885) 11.66 (1.197)
Standard deviation in parenthesesn = sample sizeVariation between species significant for all three variables (ANOVA: P < 0.01)*Values significantly different from all other values in the same column (Tukey’s HSD: P < 0.05)
1048
to feed constantly (Reinhardt and Van Vleet 1986;Geiger et al. 2000).
Size and age effects on energy content in E. antarctica
An increase in energy content was significant withincreasing size classes and age groups (Table 4). Thesetrends correspond with the size effect found by Donnellyet al. (1990). In contrast, Tierney et al. (2002) found thehighest energy content in the smallest size class. Withinspecimens of uniform species, geographic location, timeof year and size, there can still be considerable variation
in energy content due to undetermined random factors(Paul et al. 1998). For example, Tierney et al. (2002)used 6–7 specimens per size class. They could not ex-clude possible outliers which could have led to anoverestimate of the reported mean value in small fish(M. Tierney, personal communication).
The energy content of E. antarctica strongly increaseswith size in age group 0. From the second year on, size-related increase in energy content slows down consid-erably, while variation increases. Part of this variation
Fig. 3 Electrona antarctica. Mean water content (WC), DW andwet weight (WW) energy content by age group. Error bars indicate95% confidence intervals
Table 5 Review of mean water and energy contents of B. antarcticus, E. antarctica and G. braueri by season and region of the SouthernOcean
Year Season Region Method N Meansize(mm)
Sizerange(mm)
Watercontent(%)
DW energycontent(kJ g�1)
WW energycontent(kJ g�1)
Source
B. antarcticus1983 Spring Scotia Sea PCA 8 99.4 44–145 85.1 (2.3) 3.12 Donnelly et al. (1990)1986 Autumn Weddell Sea PCA 32 77.2 32–143 85.9 (2.0) 2.94 Donnelly et al. (1990)1988 Winter Scotia Sea PCA 16 90.0 51–150 88.4 (1.4) 2.37 Donnelly et al. (1990)1999 Summer Macquarie Ridge BC 18 116.8 73–196 81.8 (1.8) 21.5 (5.0) Tierney et al. (2002)2004 Autumn Lazarev Sea BC 12 71.6 36–123 85.6 (2.5) 20.4 (1.32) 2.92 (0.42) This studyE. antarctica1983 Spring Scotia Sea PCA 16 66.1 33–98 69.0 (3.7) 7.93 Donnelly et al. (1990)1986 Autumn Weddell Sea PCA 27 61.9 29–101 68.7 (3.4) 8.02 Donnelly et al. (1990)1988 Winter Scotia Sea PCA 35 68.3 29–101 69.6 (3.7) 8.45 Donnelly et al. (1990)1998 Winter Kerguelen Plateau BC 5 64.5 60.8 (8.8) 34.3 (3.8) 13.3 (2.6) Lea et al. (2002b)1999 Summer Macquarie Ridge BC 20 50.4 30–73 69.9 (4.3) 30.8 (9.7) 9.04 Tierney et al. (2002)2004 Autumn Lazarev Sea BC 113 47.0 16–83 68.4 (4.14) 29.4 (1.80) 9.35 (1.58) This studyG. braueri1983 Spring Scotia Sea PCA 3 110.3 106–114 64.2 (2.5) 9.46 Donnelly et al. (1990)1986 Autumn Weddell Sea PCA 3 101.3 88–124 66.6 (2.2) 8.83 Donnelly et al. (1990)1988 Winter Scotia Sea PCA 23 81.2 45–123 67.2 (2.3) 8.88 Donnelly et al. (1990)1999 Summer Macquarie Ridge BC 18 78.2 37–133 70 (7.1) 39.0 (14.3) 10.91 Tierney et al. (2002)2004 Autumn Lazarev Sea BC 20 87.3 64–132 69.9 (4.0) 29.4 (1.51) 8.86 (0.61) This study
Standard deviation in parenthesesn = sample size, BC bomb calorimetry, PCA proximate composition analysis
Fig. 4 Correlation between percentage dry weight and energycontent per gram wet weight. Individual data from this study wereadded to the combined linear model of Hartmann and Brandt(1995). E. antarctica: y = �2.2077 + 0.3650x (r2 = 0.93;P < 0.01); G. braueri: y = �1.5583 + 0.3467x (r2 = 0.94,P < 0.01); B. antarcticus: y = 0.7136 + 0.1532x (r2 = 0.8003;P < 0.01)
1049
may be related to differences in gender and maturationcondition. Another source of variation might be the timeof spawning. Since E. antarctica is believed to be a batchspawner (Hulley 1990), different batches within the sameyear class may encounter very different food availabilitywhich can have a strong influence on the energeticcomposition of the fish.
Energy data in relation to age groups rather than toarbitrary size classes can be a practical tool to estimateecosystem energy budgets. The results of this studyindicate that using distinct energy contents for each agegroup in E. antarctica could significantly improve energybudget estimates: The total energy budget of a popula-tion would strongly be influenced by the proportionbetween age group 0 juveniles and older fish.
Ecological implications
The size–energy density relationship of E. antarcticasuggests that the smallest fish invest proportionally moreenergy in growth and locomotion than older individuals.This view agrees with the common notion that there is astrong need for young fish to grow quickly in order toescape predation pressure (Anthony et al. 2000). Theneed of an abundant species such as E. antarctica tobuild up high energy reserves over a short period of timemay partly explain the high predatory impact of meso-pelagic fishes, which has been suggested to reach up to40% of the secondary production in the Antarctic Ocean(Pakhomov et al. 1996).
Through its pelagic mode of life, abundance and highlipid content, E. antarctica could be seen as the off-shelfcounterpart of Antarctic silverfish Pleuragramma ant-arcticum, the primary prey of many top predators inHigh-Antarctic shelf waters (Hubold 1985; Arnould andWhitehead 1991; Creet et al. 1994). Stocks of E. ant-arctica represent a large reserve of energy through theirhigh abundance and circumpolar distribution (Lancraftet al. 1989; Kock 1992). The myctophid has an energydensity more than twice that of Antarctic krill Euphausiasuperba (Clarke and Prince 1980; Torres et al. 1994).Although being usually much lower in biomass than krill(Lancraft et al. 1989), they represent a valuable prey fortop predators: the average lanternfish is significantlylarger than an average krill and would thus optimize theenergy yield per prey item of a potential predator. Infact, the proportional mass of myctophid fish oftendominates, or at least equals euphausiids in the diet ofmany Antarctic top predators (e.g. van Franeker 2001;Bost et al. 2002; Quillfeldt 2002; Osman et al. 2004).
Acknowledgements Special thanks go to V. Siegel (Federal ResearchCentre for Fisheries, Hamburg) who kindly provided the samplingmaterial for this study. We thank the crew of RV ‘‘Polarstern’’ andJ. Buyse for their support. M. Leopold and J. Maes contributed tothe improvement of this paper. This work was funded by the Bel-gian Science Policy (project PELAGANT EV/01/30B), the DutchMinistry for Agriculture, Nature and Food quality (LNV) and theDutch Polar Programme (NPP).
References
Ainley DG, Fraser WR, Smith WOJ, Hopkins TL, Torres JJ (1991)The structure of upper level pelagic food webs in the Antarctic:effect of phytoplankton distribution. J Mar Syst 2:111–122
Ainley DG, Ribic CA, Fraser WR (1992) Does prey preferenceaffect habitat choice in Antarctic seabirds? Mar Ecol Prog Ser90:207–221
Ainley DG, Ribic CA, Fraser WR (1994) Ecological structureamong migrant and resident seabirds of the Scotia–WeddellConfluence region. J Anim Ecol 63:247–364
Anthony JA, Roby DD, Turco KR (2000) Lipid content and en-ergy density of forage fishes from the northern Gulf of Alaska. JExp Mar Biol Ecol 248:53–78
Arnould JPY, Whitehead MD (1991) The diet of Antarctic petrels,cape petrels and southern fulmars rearing chicks in Prydz Bay.Ant Sci 3:19–27
Barrera-Oro E (2002) The role of fish in the Antarctic marine foodweb: differences between inshore and offshore waters in thesouthern Scotia Arc and west Antarctic Peninsula. Antarct Sci14:293–309
Bost CA, Zorn T, LeMaho Y, Duhamel G (2002) Feeding of divingpredators and diel vertical migration of prey: king penguins’diet versus trawl sampling at Kerguelen Islands. Mar Ecol ProgSer 227:51–61
Casaux R, Baroni A, Ramon A (2003) Diet of Antarctic fur sealsArctocephalus gazella at the Danco Coast, Antarctic Peninsula.Polar Biol 26:49–54
Casaux R, Bellizia L, Baroni A (2004) The diet of the Antarctic furseal Arctocephalus gazella at Harmony Point, South ShetlandIslands: evidence of opportunistic foraging on penguins? PolarBiol 27:59–65
Cherel Y, Ridoux V (1992) Prey species and nutritive value of foodfed during summer to king penguin Aptenodytes patagonicachicks at Possession Island, Crozet Archipelago. Ibis 134:118–127
Clarke A, Prince PA (1980) Chemical composition and calorificvalue of food fed to Mollymauk chicks Diomedea melanophrisand Diomedea Chrysostoma at Bird-Island, South Georgia. Ibis122:488–494
Creet S, van Franeker JA, Van Spanje TM, Wolff WJ (1994) Dietof the Pintado Petrel Daption capense at King George Island,Antarctica, 1990/91. Mar Ornithol 22:221–229
Donnelly J, Torres JJ, Hopkins TL, Lancraft TM (1990) Proximatecomposition of Antarctic mesopelagic fishes. Mar Biol 106:13–23
Eder EB, Lewis MN (2005) Proximate composition and energeticvalue of demersal and pelagic prey species from the SW AtlanticOcean. Mar Ecol Prog Ser 291:43–52
Geiger SP, Donnelly J, Torres JJ (2000) Effect of the receding ice-edge on the condition of mid-water fishes in the northwesternWeddell Sea: results from biochemical assays with notes on diet.Mar Biol 137:1091–1104
Gon O (1990) Bathylagidae. In: Gon O, Heemstra PC (eds) Fishesof the Southern Ocean. JLB Smith Institute of Ichthyology,Grahamstown, RSA, pp 107–110
Greely T, Gartner JVJ, Torres JJ (1999) Age and growth ofElectrona antarctica (Pisces: Myctophidae), the dominantmesopelagic fish of the Southern Ocean. Mar Biol 133:145–158
Hartmann KJ, Brandt SB (1995) Estimating energy density of fish.Trans Am Fish Soc 124:347–355
Hopkins TL, Ainley DG, Torres JJ, Lancraft TM (1993) Trophicstructure in open waters of the marginal ice zone in the Scotia–Weddell confluence region during spring (1983). Polar Biol13:389–397
Hubold G (1985) The early life-history of the High-Antarctic sil-verfish, Pleuragramma antarcticum. In: Siegfried W, Condy P,Laws R (eds) Antarctic nutrient cycles and food webs. Springer,Berlin, Heidelberg, New York, pp 445–451
Hulley PA (1990) Myctophidae. In: Gon O, Heemstra P (eds)Fishes of the Southern Ocean. JLB Smith Institute of Ichthy-ology, Grahamstown, RSA, pp 146–178
1050
Kock KH (1992) Antarctic fish and fisheries. Cambridge UniversityPress, Cambridge, p 359
Lancraft TM, Torres JJ, Hopkins TL (1989) Micronekton andmacrozooplankton in the open waters near Antarctic ice edgezones (AMERIEZ 1983 and 1986). Polar Biol 9:225–233
Lancraft TM, Hopkins TL, Torres JJ, Donnelly J (1991) Oceanicmicronektonic/macrozooplanktonic community structure andfeeding in ice covered Antarctic waters during the winter(AMERIEZ 1988). Polar Biol 11:157–167
Lawson JW, Magalhaes AM, Miller EH (1998) Important preyspecies of marine vertebrate predators in the northwest Atlan-tic: proximate composition and energy density. Mar Ecol ProgSer 164:13–20
Lea M, Cherel Y, Guinet C, Nichols P (2002a) Antarctic fur sealsforaging in the polar frontal zone: inter-annual shifts in diet asshown from fecal and fatty acid analysis. Mar Ecol Prog Ser245:281–297
Lea MA, Nichols PD, Wilson G (2002b) Fatty acid composition oflipid-rich myctophids and mackerel icefish (Champsocephalusgunnari)—Southern Ocean food-web implications. Polar Biol25:843–854
Osman LP, Hucke-Gaete R, Moreno CA, Torres D (2004) Feedingecology of Antarctic fur seals at Cape Shirreff, South Shetlands,Antarctica. Polar Biol 27:92–98
Pakhomov EA, Perissinotto R, McQuaid C (1996) Prey composi-tion and daily rations of myctophid fishes in the SouthernOcean. Mar Ecol Prog Ser 134:1–14
Paul AJ, Paul JM, Smith RL (1998) Seasonal changes in whole-body energy content and estimated consumption rates of age 0walleye pollock from Prince William Sound, Alaska. EstuarCoast Shelf Sci 47:251–259
Pedersen J, Hislop JRG (2001) Seasonal variations in the energydensity of fishes in the North Sea. J Fish Biol 59:380–389
Phleger CF, Nichols PD, Virtue P (1997) The lipid, fatty acid andfatty alcohol composition of the myctophid fish Electrona ant-arctica: high levels of wax esters and food chain implications.Ant Sci 9:258–265
Pusch C, Hulley PA, Kock KH (2004) Community structure andfeeding ecology of mesopelagic fishes in the slope waters ofKing George Island (South Shetland Islands, Antarctica). DeepSea Res I 51:1685–1708
Quillfeldt P (2002) Seasonal and annual variation in the diet ofbreeding and non-breeding Wilson’s storm-petrels on KingGeorge Island, South Shetland Islands. Polar Biol 25:216–221
Reinhardt SB, Van Vleet ES (1986) Lipid-composition of 22 speciesof Antarctic midwater zooplankton and fish. Mar Biol 91:149–159
Saadettin G, Dincer B, Alemdag N, Colak A, Turfekci M (1998)Proximate composition and selected mineral content of com-mercially important fish species from the Black Sea. J Sci FoodAgric 78:337–342
Sabourenkov E (1990) Mesopelagic fish of the SouthernOcean—summary results of recent Soviet studies. WG-FSA-90/23, CCAMLR, Hobart, pp 433–457
Siegel V, Loeb V, Bergstrom B, Scholing S, Haraldsson M,Kitchener J, Vortkamp M (2004) Demography of Antarctickrill in the Lazarev Sea (Subarea 48.6) and the Elephant Islandarea (Subarea 48.1) in 2004. WG-EMM-04/23, CCAMLR,Hobart, pp 1–22
Tierney M, Hindell M, Goldsworthy S (2002) Energy content ofmesopelagic fish from Macquarie Island. Ant Sci 14:225–230
Torres J, Somero G (1988) Vertical distribution and metabolism inAntarctic mesopelagic fishes. Comp Biochem Physiol 90B:521–528
Torres J, Donnelly J, Hopkins T, Lancraft T, Aarset A, Ainley D(1994) Proximate composition and overwintering strategies ofAntarctic micronektonic crustacea. Mar Ecol Prog Ser 113:221–232
van Franeker JA (2001) Mirrors in ice. PhD Thesis, Ri-jksuniversiteit Groningen, Groningen, p 274
van Franeker JA, Bathmann UV, Mathot S (1997) Carbon fluxesto Antarctic top predators. Deep Sea Res II 44:435–455
1051