Content Server
30
Language Testing 2008 25 (4) 553–581 © 2008 SAGE Publications (Los Angeles, London, New Delhi and Singapore) DOI:10.1177/0265532208094276 EFL classroom peer assessment: Training effects on rating and commenting Hidetoshi Saito Ibaraki University, Japan This study examined the effects of training on peer assessment and com- ments provided regarding oral presentations in EFL (English as a Foreign Language) classrooms. In Study 1, both the treatment and control groups received instruction on skill aspects, but only the treatment group was given an additional 40-minute training on how to rate performances. The results of the correlation difference analyses show no significant differences between the treatment and control groups, but the three instructors are misfitting, pre- sumably because the frame of reference is set by the majority of student data. In the second study, the treatment groups received long training. Again, there are no significant correlation differences between the treatment and control groups; however, all the instructors are not misfitting, which indicates that the frame of reference in the data improved in Study 2. Analyses of com- ments reveal that the treatment groups are superior in both quality and quan- tity of comments. Along with a meta-analytic summary, it is argued that peer assessment is a robust system in which instruction on skill aspects may suf- fice to achieve a certain level of correlation with the criterion variable (instructor), but training may enhance student comments and reduce mis- fitting raters. Keywords: comments, effect sizes, peer assessment, rater training I Introduction and literature review The number of empirical research studies on peer involvement in classrooms has increased. Some researchers have claimed that work- ing with peers in the classroom is a critical means of promoting learning. Such claims draw on evidence from second language (L2) acquisition research, mainstream education research, and both L2 writing and L1 writing research (e.g. DiPardo & Freedman, 1988; Address for correspondence: Hidetoshi Saito, Ibaraki University, Department of English, College of Education, 2–1-1 Bunkyo, Mito 310–8512, Japan; email: [email protected]
-
Upload
independent -
Category
Documents
-
view
0 -
download
0
Transcript of Content Server

Language Testing 2008 25 (4) 553–581
© 2008 SAGE Publications (Los Angeles, London, New Delhi and Singapore) DOI:10.1177/0265532208094276
EFL classroom peer assessment:Training effects on rating andcommentingHidetoshi Saito Ibaraki University, Japan
This study examined the effects of training on peer assessment and com-ments provided regarding oral presentations in EFL (English as a ForeignLanguage) classrooms. In Study 1, both the treatment and control groupsreceived instruction on skill aspects, but only the treatment group was givenan additional 40-minute training on how to rate performances. The results ofthe correlation difference analyses show no significant differences betweenthe treatment and control groups, but the three instructors are misfitting, pre-sumably because the frame of reference is set by the majority of student data.In the second study, the treatment groups received long training. Again, thereare no significant correlation differences between the treatment and controlgroups; however, all the instructors are not misfitting, which indicates thatthe frame of reference in the data improved in Study 2. Analyses of com-ments reveal that the treatment groups are superior in both quality and quan-tity of comments. Along with a meta-analytic summary, it is argued that peerassessment is a robust system in which instruction on skill aspects may suf-fice to achieve a certain level of correlation with the criterion variable(instructor), but training may enhance student comments and reduce mis-fitting raters.
Keywords: comments, effect sizes, peer assessment, rater training
I Introduction and literature review
The number of empirical research studies on peer involvement inclassrooms has increased. Some researchers have claimed that work-ing with peers in the classroom is a critical means of promotinglearning. Such claims draw on evidence from second language (L2)acquisition research, mainstream education research, and both L2writing and L1 writing research (e.g. DiPardo & Freedman, 1988;
Address for correspondence: Hidetoshi Saito, Ibaraki University, Department of English, Collegeof Education, 2–1-1 Bunkyo, Mito 310–8512, Japan; email: [email protected]

554 EFL classroom peer assessment
Liu & Hansen, 2002; Long & Porter, 1985; Webb, 1982, for review).Peer involvement in assessment holds tremendous potential forlearning as well. The literature from various fields offers generalagreement on the following characteristics and potential benefits ofpeer assessment (including the so-called 360 degree assessment inindustrial/ organizational psychology):
1. Although evidence drawn from language classrooms is limited,peer assessment has a fairly strong correlation with instructorratings across different subject areas and with supervisor ratingsacross different organizational settings (e.g. Falchikov & Goldfinch,2000; Fletcher & Baldry, 1999; Harris & Schaubroeck, 1988;Topping, 1998).
2. Peer assessment encourages reflective learning through observingothers’ performances and becoming aware of performance cri-teria (Falchikov, 1986; also claimed in different contexts byTopping, 1998; Tornow, 1993; Somervell 1993).
3. In general, peer assessment seems to generate positive reactionsfrom students, although some students have concerns and wor-ries, as demonstrated by the mixed findings in various contentareas (e.g. Cheng & Warren, 1997; Haaga, 1993; Morahan-Martin, 1996; Saito & Fujita, 2004; Stefani, 1992).
4. Students develop a sense of shared responsibility (e.g. as claimedby Somervell, 1993).
The benefits which peer assessment may bring into a languageclassroom cannot be guaranteed unless students are capable of imple-menting the assessment. The same concerns about student capacity todiscern peer performance and the need for training were raised inrecent guidelines on peer review in L2 writing (Hu, 2005; Liu &Hansen, 2002). In fact, several research studies on peer writingresponse groups have investigated the capacity issue by looking attraining effects and have found benefits of training for the revisionprocess. In these studies, researchers compared trained and untrainedgroups by categorizing and counting the frequency of peer comments.The trained group produced more specific responses than theuntrained group, and the trained students were more responsive tocomments in revision relative to untrained students (Stanley, 1992). Inparticular, training has been found to lead to more changes of ‘mean-ing’ in revision (Berg, 1999). Similarly, in predominantly L1 Englishfreshman composition classrooms, trained groups were found tospend more time on revision and to produce more relevant commentsthan those who were untrained (McGroarty & Zhu, 1997). The effects

Hidetoshi Saito 555
of training on the improvement of the final product were found inBerg’s study (1999) but were absent in a study by McGroarty andZhu (1997). Although the advantages of training for peer writingresponses appear to be confirmed, no study has required students’ useof a rating scale of any kind. Thus, it is not clear whether traininginduces the same benefits for peer rating or whether it works for oralperformance in the same way as it does for writing.
Rater training has played a critical role in assuring rater consist-ency and agreement on performance assessments (especially in high-stakes tests). Several L2 language testing researchers have examinedtraining effects in relation to both expert and novice raters. Thesestudies have offered evidence that supports the following: (1) trainedraters are more reliable than untrained raters (Shohamy, Gordon &Kraemer, 1992; Weigle, 1994, 1998) and (2) training makesraters more self-consistent but does not dramatically alter severity(Lumley & McNamara, 1995; Weigle, 1998). However, research isinconclusive about what roles background variables (whether evalu-ators are lay or experienced) may play in relation to training. Forexample, Shohamy et al. (1992) found positive effects of training butno background effects in terms of reliability differences. In Weigle’sstudies (1994, 1998), novice raters were more strict and inconsistentthan experienced raters, but training reduced extremism in noviceratings.
In other L2 studies, mainly those on writing, sources of differencebetween experienced and novice raters have been identified. Forexample, Cumming (1990) suggested that a major differencebetween lay and experienced raters in the rating process lies in therange of criteria, strategies, and knowledge resources they couldrespectively exploit. Not surprisingly, however, experience does notalways lead to a strong consensus among raters (Lumley, 2002).Schoonen, Vergeer and Eiting’s (1997) study, although not focusedon training, has drawn a complex picture of the role of expertisein rating, partly because of the research design utilized. Schoonenet al. (1997) compared the reliabilities of lay raters with those ofexperienced raters on three different writing tasks using structuralequation modeling. Although the results suggested that both groupsdifferentiated writing products in a similar way, the researchers con-cluded that several factors, such as differences in writing tasks andrated aspects, may affect the differences in severity between lay andexperienced raters.
These studies provide insight into the complex interaction betweenrater training and experience, but the novices in these studies were not

556 EFL classroom peer assessment
L2 learners. L2 learners differ from the lay raters in the studies abovein at least three respects. First, lay raters in those studies were nativespeakers; whereas, L2 learners in peer assessment studies were notnative speakers of the target language. It is likely that their develop-ing language ability affected the peer ratings in various ways. Second,raters in those studies were anonymous; whereas, learners in peerassessment studies often know who they are rating or are at leastaware that they are rating their peers. This awareness is likely to gen-erate leniency and uneasiness, which may not be a factor in thelay/experienced rater comparison studies. Third, the products andperformances rated in peer assessment studies have been stronglyassociated with actual classroom practices; whereas, the settings oflay/experienced rater comparison studies are independent of class-room learning. The lack of understanding of how these factors inter-act with peer assessment further justifies investigating the effects oftraining on L2 peer rating.
Studies on L2 peer assessment have shown some evidence in sup-port of its use in classrooms. Some studies have shown that peerassessment is correlated with instructor assessment (Jafarpur, 1991;Patri, 2002; Saito & Fujita, 2004; Yamashiro, 1999), while othershave found correlations to vary depending on tasks and classes(Cheng & Warren, 1999). Peer feedback increases the correlationbetween peer ratings and instructor ratings (Patri, 2002), althoughmarking in general may be inflated (Cheng & Warren, 1999; Patri,2002; Saito & Fujita, 2004). Regarding user acceptance, studentshave shown both generally positive (Rothschild & Klingenberg,1990; Saito & Fujita, 2004) and mixed attitudes (Cheng & Warren,1997) toward the use of peer assessment; however, such differencesin attitude do not appear to be related to the feedback received (Saito &Fujita, 2004). Unfortunately, none of these studies have investigatedthe effects of training on peer rating. Moreover, it is clear that thesefindings seem somewhat contradictory and, consequently, do notgive solid advice to practitioners. Due to such limited and diversefindings, a quantitative summary of available studies invoking prioreffect sizes may situate the present study in the proper context ofrelated research, as recommended by researchers such as Thompson(2002). Effect size indicates the degree of association between vari-ables and is considered to be appropriate for describing the actualsignificance of a study. The remainder of this section offers a quan-titative summary based on effect sizes (i.e. the strength of the rela-tionship between teacher and peer ratings) retrieved from fourempirical studies. To explore the relevant literature, the ERICdatabase (1966–2003) was searched using ‘peer’, ‘language’, and

Hidetoshi Saito 557
‘assessment’ or ‘rating’ as keywords. Because the present studyintends to identify a status quo based mainly on accessible studies,this search was limited to journal articles and book chapters; how-ever, by excluding what is called ‘fugitive literature’, this searchmight reflect a ‘publication bias’ by only including results that arepublished and widely available (e.g. Rosenthal, 1991). Thus, readersare cautioned that this quantitative summary is by no means com-plete and is biased in favor of published studies. A manual search ofbook chapters and reference works was also implemented.
Four quantitative studies (out of seven located) met the followingcriteria:1 The study (1) describes necessary information for summariz-ing, including sample size, settings, and data collection procedures; (2)provides observational data by both instructors and L2 learners ratingson peer products or performance using a rating scale of some sort; and(3) shows correlation(s) or other measures that can be transformed toan adjusted r2. To summarize the effect sizes of the studies, adjustedr2s were retrieved or calculated. Since each study usually generatedmore than a single r, averaging (with Fisher’s z transformation) wasdone so that each study contributed only one r2 to the present summary(see Rosenthal, 1991). The results of the mean adjusted r2 and 95%confidence intervals (CI) appear in Table 1.
To test the heterogeneity of the adjusted r2 retrieved from the fourstudies, the chi-square was calculated. The x2 value of 1.15 (df � 3)was not significant at .05, indicating that the effect sizes were notheterogeneous. In other words, the effect sizes of the studies sum-marized here collectively show that the strength of the relationshipbetween L2 peer and instructor ratings is fairly stable across studies.
As informative as the studies reviewed above may be, a numberof questions still remain unanswered regarding the role of training inpeer assessment in L2 classrooms and the effect of training on L2students’ ratings and comments, particularly for oral performances.The following hypotheses were formulated based on the previousstudies:
1. Trained groups’ peer ratings of presentation quality correlatewith those of the instructors much more highly than those ofuntrained groups.
2. Trained groups make qualitatively better and quantitatively morecomments on peers’ performances compared to untrained groups.
1Three studies (Devenney, 1989; Jafarpur, 1991; Rothschild & Klingenberg, 1990) were notincluded because they did not meet one or more of the above criteria. Yamashiro (1999), an unpub-lished yet award-winning conference paper, is included here because it was presented at a majorconference and met all the criteria.

558 EFL classroom peer assessment
Tab
le 1
Res
ult
s o
f q
uan
tita
tive
su
mm
ary
of
pre
vio
us
stu
die
s
Stu
dy
Ave
rag
edN
um
ber
of
Ave
rag
ed
Low
er
Up
per
R
esea
rch
Ski
lls a
sses
sed
Rat
erC
on
text
Mai
n r
esu
lts
sam
ple
inst
ruct
ors
adju
sted
r2
95 C
I95
CI
qu
esti
on
str
ain
ing
size
1
Ch
eng
&
173
.265
.000
.535
Iden
tify
ing
A
ll cl
ass
Yes
Un
iver
sity
Co
rrel
atio
ns
vari
edW
arre
nch
arac
teri
stic
sse
min
ar, s
mal
lst
ud
ents
ind
epen
din
g o
n t
ask
(199
9)2
gro
up
ora
lH
on
g K
on
g
typ
es a
nd
cla
sses
pre
sen
tati
on
,w
ritt
en r
epo
rtP
atri
(20
02)
271
.500
.197
.668
Exa
min
ing
Sm
all g
rou
pYe
sU
niv
ersi
tyP
eer
feed
bac
k h
elp
sef
fect
s o
f p
rese
nta
tio
nst
ud
ents
in i
mp
rove
rat
ing
an
d
feed
bac
k o
nH
on
g K
on
gim
pro
ves
corr
ela-
rati
ng
tio
ns
wit
h in
stru
cto
rS
aito
& F
ujit
a 50
2.5
13.3
03.6
43Id
enti
fyin
g
Ess
ay w
riti
ng
Yes
Un
iver
sity
Item
hie
rarc
hie
s(2
004)
char
acte
rist
ics
stu
den
ts in
bet
wee
n in
stru
cto
r an
d e
ffec
ts o
fJa
pan
and
pee
rs d
iffe
red
. at
titu
de
on
No
att
itu
de
effe
ctra
tin
go
n r
atin
g w
as f
ou
nd
. Ya
mas
hir
o
170
7.5
14.4
11.5
93Va
lidat
ing
aP
ub
lic s
pea
kin
gYe
s3U
niv
ersi
tyT
he
valid
ity
of
a(1
999)
rati
ng
sca
lest
ud
ents
inra
tin
g s
cale
bas
edJa
pan
on
pee
r, in
stru
cto
r, an
d s
elf-
rati
ng
s w
as
sup
po
rted
Po
ole
d26
413
.501
.403
.587
No
tes:
CIs
(co
nfi
den
ce in
terv
als)
wer
e ca
lcu
late
d u
sin
g a
n S
PS
S s
crip
t b
y S
mit
hso
n (
n.d
.).
1T
he
nu
mb
er o
f le
arn
ers
rate
d.2
Th
is s
tud
y is
bel
ieve
d t
o b
e id
enti
cal
wit
h C
hen
g a
nd
War
ren
(20
05),
so
th
e la
tter
stu
dy
was
no
t in
clu
ded
. 3
No
t d
ocu
men
ted
in t
he
pap
er, b
ut
it is
like
ly t
hat
stu
den
ts f
ollo
wed
th
e tr
ain
ing
pro
ced
ure
des
crib
ed in
Yam
ash
iro
an
d J
oh
nso
n (
1997
).

Hidetoshi Saito 559
In the following, two studies are described. The first study, with ashort training time, examined the first hypothesis, while the secondstudy tested both hypotheses. The results of the first study aredescribed briefly due to space limitations. The second study is a repli-cation of the first study, but a longer training time is implemented.
II Study 1
1 Method
a Participants: After eliminating absentees, 74 Japanese universityfreshmen, all majoring in economics, who were registered in threesections of a speaking-listening course, participated in the currentstudy. Following the national curriculum, all had completed six yearsof English studies (approximately 750 hours) in middle school.These three sections were chosen because, based on an in-houseplacement test, the proficiency levels of the students were con-sidered relatively high and similar to each other. Two sections wereconsidered as the second best groups, and one section was the thirdbest. In the course, all three sections used the same textbook and weregiven the same mid-term and final exams. Twenty-two students wererandomly subjected to SST (a subset of ACTFL OPI), and all fell intoa mid-novice to high-novice range. None of the participants reportedprevious experience in assessing peers’ English presentations in thebackground questionnaire. Three instructors, all Japanese teachers ofEnglish with greater than five years of experience teaching at the uni-versity level and experience living abroad for more than two years,also participated as raters in the study, including the instructor whotaught all three sections of the speaking-listening course.
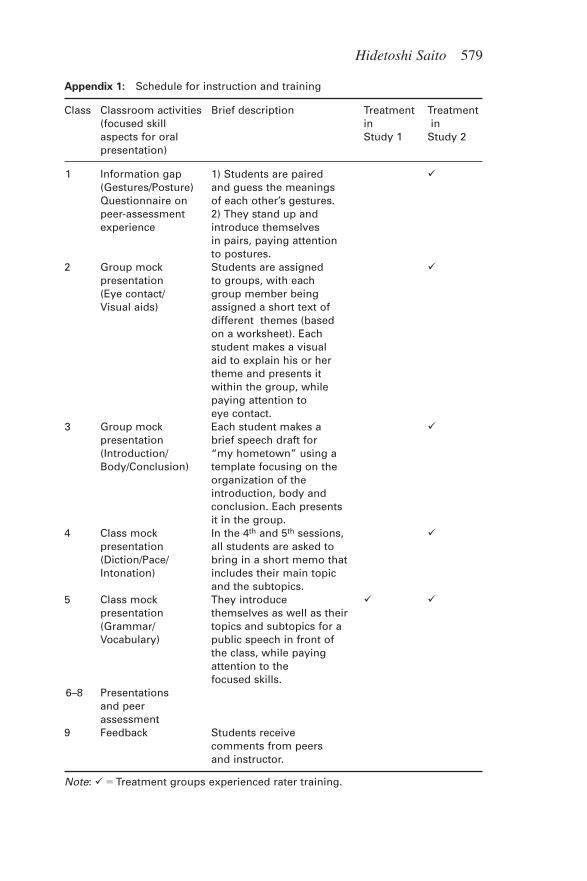
b Procedure: As part of the course requirement, students wereassigned an oral presentation on a topic of their own interest, such astravel, hobbies, or club activities. They were told that this presenta-tion and the presentation draft accounted for 15% of their grade. Thestudents were also told that they needed to speak for at least 5 min-utes and were required to use visual aids. Both the treatment andcontrol groups received a series of instructional inputs on 12 skillaspects of presentation (hereafter, called instruction) directly associ-ated with the assessment items, but only the treatment group had arater training session after the fifth session. Each instruction session(for the first five sessions) began with the instructor demonstratinggood and poor examples of each skill aspect. For example, in thefirst session, the instructor demonstrated strong and weak typesof gestures and postures for an oral presentation, and the students

560 EFL classroom peer assessment
practiced the gestures and postures through paired activities (seeAppendix 1). This instruction on performance aspects continueduntil the fifth session. After the last session, each of the three sec-tions was randomly divided into treatment (n � 37) and controlgroups (n � 37). The treatment group moved to a different room andhad a rater training session for approximately 40 minutes, afterwhich video recordings of three presentations by former studentswere viewed, while the control group stayed in the classroom andwas engaged in an irrelevant writing assignment.
Rating practice consisted of the following steps: First, the in-structor explained all of the items in detail. Students viewed and ratedthree videotaped presentations of former students, each of whichrepresented superior, adequate and minimal levels of performance,or required work on more than two skill items. The students comparedtheir ratings with those of others in the group and also reported, byraising their hands, what rating they had given to each item in orderto compare their ratings with that of the instructor. The instructorthen explained why a certain rating was more appropriate for anitem, pointing out and discouraging obvious over- and under-rating.This comparison and check process was repeated after viewing eachvideotaped presentation. Due to time constraints, this training pro-vided a selective benchmark performance in order to illustrate rat-ings for each item. Although such quick and short training was notideal, it was assumed to represent the time allotment that manylanguage teachers can afford in their actual courses. Instructors alsoreceived the same rater training for about 40 minutes, which wasgiven by the instructor who also taught the students.
In the sixth to eighth sessions (see Appendix 1), students rated andcommented on all classmates’ performances in their own class usingPASS (Peer Assessment Support System), an Internet-based pro-gram. In the ninth session, the students received feedback from theirpeers. Due to logistical reasons, instructors rated videotaped per-formances rather than live presentations. It was assumed that thismethod of presentation had negligible influence on the data; how-ever, this mode difference may have affected the results, as discussedby McNamara and Lumley (1997). Instructors were not allowed torewind the tape except for a few instances in which they felt that theyhad not concentrated enough to judge the performance.
c Instruments: The original form of the oral presentation skillsassessment used for this study was developed by Yamashiro (1999)and Yamashiro and Johnson (1997). Oral presentation skills constitutea set of discrete behavioral aspects of task performance in language

Hidetoshi Saito 561
learning. Students learn these skill aspects in classrooms throughpractice and observation. The instrument was originally composedof three aspects: verbal delivery, non-verbal delivery, and organiza-tion/purpose, each of which contained four skill aspect items.Yamashiro (1999) put this instrument through a multitrait-multi-method analysis, and the data supported the validity of the scale,generating an average effect size (adjusted r2 of .51) (Table 1). Thisscale was slightly modified for the present study in two respects.First, item Purpose was replaced with Visual aids because Purposeseemed to be vague and impressionistic rather than observational,and the use of visual aids was emphasized in instruction. Second, thenumber of steps (rating category) was reduced from five to fourbecause the researcher wanted to avoid the middle category thatoften attracts most responses and also believed that distinguishingamong five levels for 12 items would be too daunting a task for thestudents. Prior to Study 1, the pilot data for this modified versionwere analyzed using Rasch analysis, with all items considered atonce. Two items, Gestures and Visual aids, were found to be misfit-ting. Thus, separate runs for visual aspect and verbal aspect were executed, with the Rasch reliabilities for both aspects being .98. AlthoughDiction was found to be slightly misfitting in this separate run, thesetwo aspects are used for analysis in the following two studies (seeAppendix 1). The verbal aspect constitutes skills that make the deliveryof messages with words possible; whereas, the visual aspect refers toskills that allow the delivery of non-verbal messages by the speaker.
d Analysis: Rasch analysis is a test analysis method that carriesseveral advantages over a classical test analysis, one of which is theseparate calibration of measurement facets. In the present study,Rasch analyses were used to calibrate three measurement facets –item difficulty, rater severity, and presentation quality – separatelyfor each verbal and visual skill aspect.2 Rasch analysis requires uni-dimensionality of the data, so the visual and verbal dimensionswere analyzed separately. Another advantage of Rasch analysis isthe use of fit statistics to flag any aberrant responses in the data.These ‘misfitting’ responses are identified through criteria suchas those proposed by Wright and Linacre (1994).
A series of one-factor linear regression analyses were used to pre-dict instructor rating (dependent variable) from peer rating (inde-pendent variable). This analysis was done for presentation quality
2When analyzing the data, all of the data for each aspect were entered first. While anchoring raterseverity and step measures generated in the first run, separate runs for each rater group were doneto calibrate quality and item measures. This was necessary to ensure the connectivity of the data.

562 EFL classroom peer assessment
measures for both verbal and visual aspects. Note that all of thestudent variables abide by the normality requirement, but the instructorratings for the two aspects were not found to be normally distributed.Thus, instructor ratings in the verbal aspect were normalized throughreflection and a square root transformation, while the instructor rat-ings in the visual aspect were normalized through a square roottransformation alone. Subsequent residual plots indicated that alldependent and independent variables had a linear relationship.Finally, to test the first hypothesis, the magnitude of correlationsbetween treatment-instructor and control-instructor were comparedusing dependent correlation difference analyses in the ZumaStat pro-gram. Correlations were dependent because both the control andtreatment groups rated the same classmates.
2 Results and discussion
The initial calibration of both the visual and verbal aspects producedhigh Rasch reliabilities across the three facets (.94–1.00). A closerlook at each facet reveals that two peer raters in the visual skills donot fit the Rasch model, while four peer raters (three of whom werein the control group) and the three instructors do not fit the Raschmodel in the verbal skills aspect. Among individual items, Diction isfound to be slightly above the misfit criteria (infit/outfit � 1.4, z � 9).Although the overall reliabilities are high, it is surprising that all threeinstructors were misfitting in verbal skills assessment (infit/outfit �1.7–2.0, z � 9). One possible explanation for this could be that theframe of reference set by peer learners, comprising 88.4% of the data,differ from that of instructors. If instructors and peers possess differentframes of reference, the pattern set by the minority group (instructors)would not fit into the pattern of the majority (peers). Such differencesin the frame of reference seem to be more apparent in verbal skills thanvisual skills. The main purpose of this analysis is to describe what isobserved rather than to construct a high-stakes test, so none of the mis-fitting items or raters are eliminated in the subsequent analyses.
The results of the one-factor linear regression analyses were usedto test the predictability of instructor ratings (dependent variable)from peer ratings (independent variable) for the presentation qualitymeasures. All regression analyses generated statistically significant bparameters (the slope of the regression line), along with mediumto large effect sizes of adjusted r2 for both groups, .24 (verbal aspectin control), .32 (verbal in treatment), .71 (visual in control), and .69(visual in treatment).
Hidetoshi Saito 563
The magnitude of correlations between treatment-instructorand control-instructor were compared using dependent correlationdifference analyses to test the first hypothesis. The results aret � 1.10 (df � 71, p � .05) for the verbal aspect and t � .43 (df � 71,p � .05) for the visual aspect. Both comparisons fail to reach statis-tical significance, and the two groups show no difference.
The results of Study 1 indicate that, since both groups are equallygood predictors of instructor rating, there are no significant correlationdifferences between treatment and control. It is also noteworthy that theinstructor ratings are misfitting, possibly because the frame of referencein the data set by the majority peer groups differs from that of the minor-ity instructor group. The lack of differences between the treatment andcontrol groups, as well as the misfitting problems, have led to the ques-tion as to whether longer training may resolve these problems.
III Study 2
1 Method
a Participants: After eliminating absentees, a total of 81 Japanesefreshmen (ages 17–19) participated in Study 2. Based on the self-reported background questionnaire, no students had previous experi-ence in assessing peers in language classrooms. The students wereregistered in three different sections of the speaking-listening courseat the same Japanese private university as in Study 1. The treatmentof Study 2 spread over 5 sessions, making it impossible to randomlydivide each section into treatment and control groups. Thus, threeintact groups participated in the study. The two treatment groupsbelonged to the Economics (hereafter Treatment 1) and SocialWelfare (hereafter Treatment 2) Departments, and the control groupstudents were Applied Psychology and Communication Studies(hereafter Control) majors. All three groups belonged to higher levelsections within each department. Student assignment to a section wasbased on the institutional placement test administered before thesemester had begun. In this program, section assignment was nestedwithin each department for administrative reasons. The general profi-ciency of the students, as measured by the placement test, shows asignificantly different F (2, 78) � 4.89, p � .05. The results of multi-ple comparison Scheffé tests suggest that the difference lies betweenTreatment 1 and Treatment 2. Note, however, that the actual rawmeans do not greatly differ (Treatment 1 M � 45.30, SD � 2.57;Treatment 2 M � 43.12, SD � 1.34; Control M � 44.62, SD � 3.28).In the course, all students used the same textbook and were given

564 EFL classroom peer assessment
the same mid-term and final exams. Four instructors, all Japaneseteachers of English, with greater than five years’ experience teachingat the university level and greater than two years’ experience livingabroad, also participated as raters in the study, including the instruc-tor who taught all three sections of the speaking-listening course.
b Procedure: As in Study 1, both the treatment and control groupsreceived a series of instructional inputs on 12 skill aspects of presen-tation. This time, however, the treatment groups had a rater trainingsession after each instruction (see Appendix 1). Following the instruc-tion on skill aspects, the treatment groups received approximately 40 minutes of rating practice. For example, in the first session, twoskill aspects, gestures and posture, were practiced during instructionand were, thus, the focus of that day’s rater training. The instructorexplained each item in detail, and the students observed video clips oftwo former students’ performances that were representative of twobenchmark responses in Gestures and Posture. After the first videowas viewed, individual students rated the two skill aspects using therating scale. They then formed groups of three or four and comparedand discussed their ratings by asking each other ‘Why did you give aparticular score?’ Students were then asked to raise their hands toindicate what score they had given, and the instructor explained whya certain rating would be more appropriate based on the guideline.The instructor also pointed out and discouraged obvious over- andunder-rating. This comparison and check process was repeated afterviewing each videotaped presentation. The total training timeamounted to about 200 minutes over five sessions, with 10 formerstudent presentations viewed. The control group was engaged in text-book-based activities on speaking, listening, or grammar. Instructorsalso received approximately 90 minutes of training using the 10 videoclips and benchmark responses used to train the students.
As in Study 1, students rated and commented on all other class-mates’ performances in the same class in the sixth to eighth sessions,and in the ninth session, students received feedback from their peers(see Appendix 1). Instructors again rated videotaped performancesrather than live presentations. Instructors were not allowed to rewindthe tape unless necessary.
c Instrument: The rating scale used was the same as the one inStudy 1.
d Analysis: As in Study 1, Rasch analyses and a series of one-factorlinear regression analyses were used. All of the variables conformed
Hidetoshi Saito 565
to the normality requirement, and subsequent residual plots indicatedthat all dependent and independent variables had a linear relationship.Correlation difference analyses were used to test the first hypothesis.Difference tests for independent correlations were run because theratings were done within each intact group, that is, they were inde-pendent of each other.
To examine the second hypothesis, comments given by students inthe treatment and control groups were compared in three analyses:relevance judgment, overall frequency of cited items, and the fre-quency of each cited item. Due to technological failures, however,all comments of Treatment 2 and some portions of other groups’comments were inadvertently lost, leaving 593 comments (84.4% ofall comments) made by respondents in Treatment 1 (n � 26) and 486comments (74.7% of all comments) by respondents in the controlgroup (n � 27). Since each peer rater provided comments for morethan one peer performer, simple summing of the frequency countswas not appropriate due to the dependence in observation (Saito,1999). Thus, all three analyses involve frequency or rating per com-ment averaged within a single peer rater. In relevance judgmentanalysis (following McGroarty & Zhu, 1996), two trained graduatestudents rated all the comments in terms of relevance to the performance, with the rating scale being 3 (relevant and specific),2 (relevant but not specific), or 1 (irrelevant). The inter-rater agreementrate of relevance judgments was 92.5% (intraclass correlationof .71). All discrepancies were subsequently resolved through dis-cussion. Relevance scores were averaged within a single peer rater,so each rater has a single mean relevance score.
In the second analysis, the overall frequency with which an itemwas cited was calculated, which is the number of skill aspects citedper comment averaged within each rater. A comment given to oneperformer may capture more than one category of performance. Forexample, the following comment made by one peer rater was cate-gorized into Gestures, Body, and Pace: ‘We could enjoy the talkbecause the speaker’s gestures were very effective. The content wasvery interesting. It would have been much better had the speakerpaid more attention to pace’ (T3002). This comment describes threeaspects, so the rater received a score of three for this one comment.The number of aspects cited was summed and averaged by the num-ber of comments made by the single rater, so again, each peer raterhad a single average frequency-of-citation score. Two graduate students independently categorized all of the comments into 12 skillaspects and proposed two additional categories: Loudness and
566 EFL classroom peer assessment
Pronunciation. After reclassifying the data with these two categoriesadded, an agreement rate of 91.3% was reached. Subsequent discus-sions resolved all discrepancies. A MANOVA (multivariate analysisof variance) was used for group comparison of the relevance judg-ment scores and overall frequency of citation scores.
The third analysis of comments involved comparisons of the fre-quency of citation according to each skill aspect. Again, the fre-quency of skill aspect citations per comment was averaged within asingle rater, so each rater had an average score for each skill aspect.There were many empty and small cells; that is, peer raters did notrefer to all skill aspects when commenting. This factor naturallyresulted in a lack of normal distributions of the mean scores. Thus,to test the difference between the groups, a non-parametric test,Mann-Whitney U, was used.
2 Results and discussion
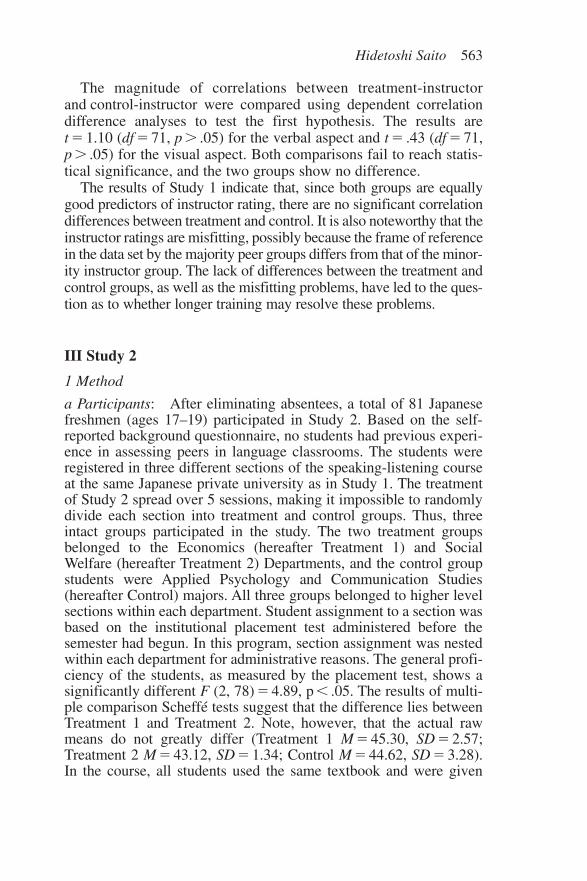
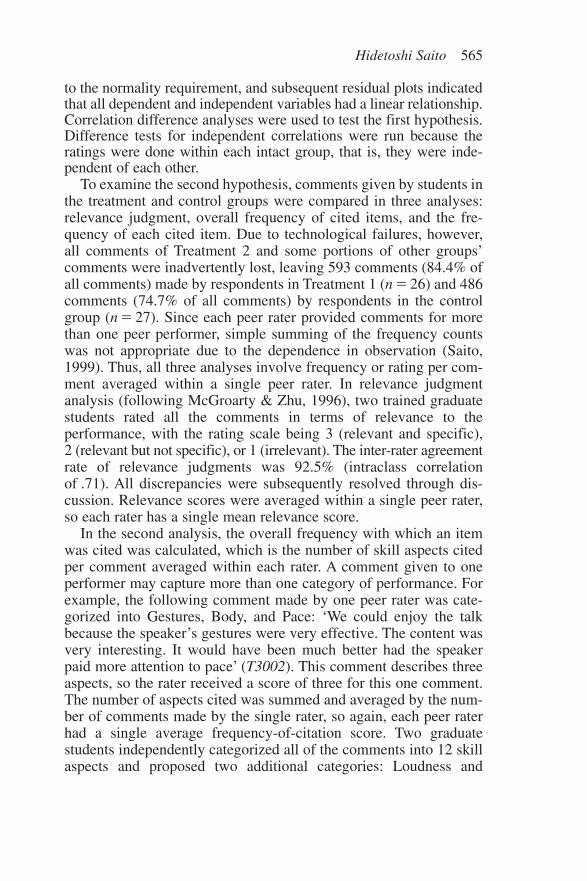
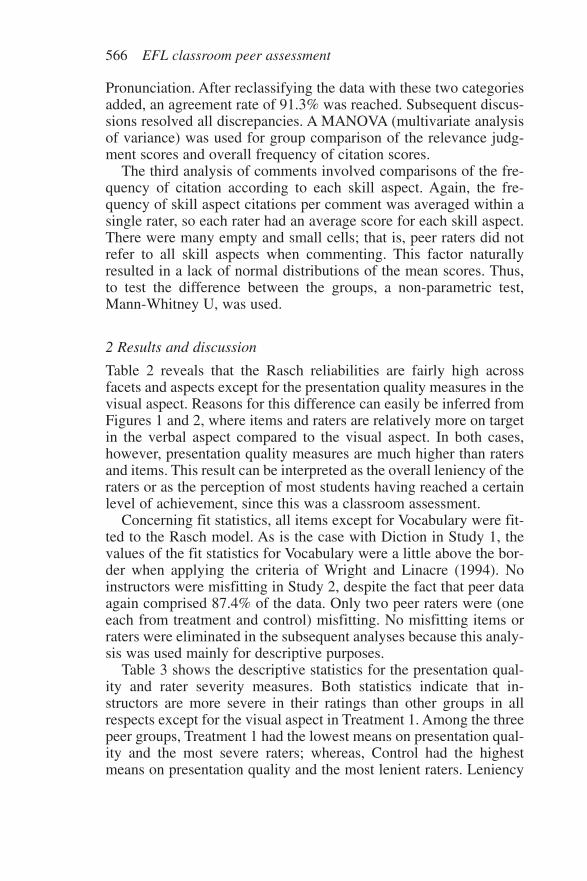
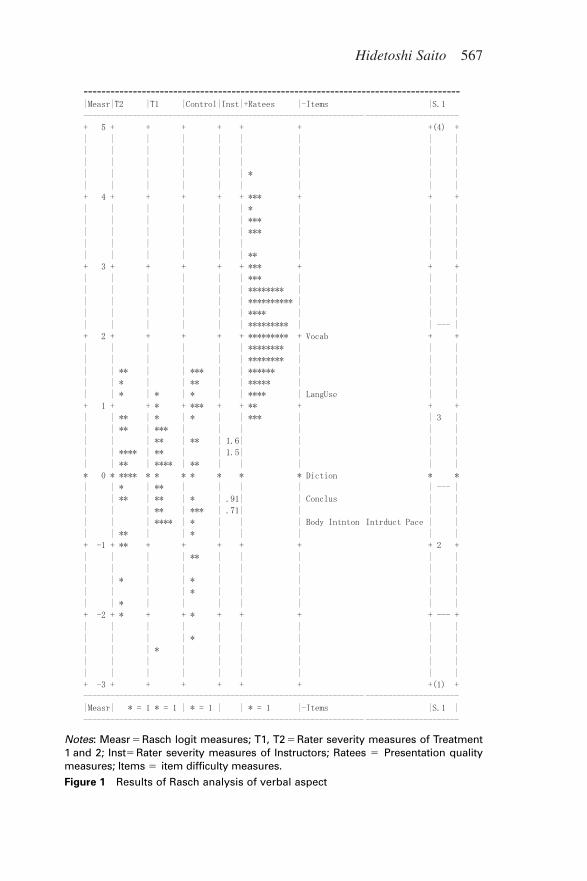
Table 2 reveals that the Rasch reliabilities are fairly high acrossfacets and aspects except for the presentation quality measures in thevisual aspect. Reasons for this difference can easily be inferred fromFigures 1 and 2, where items and raters are relatively more on targetin the verbal aspect compared to the visual aspect. In both cases,however, presentation quality measures are much higher than ratersand items. This result can be interpreted as the overall leniency of theraters or as the perception of most students having reached a certainlevel of achievement, since this was a classroom assessment.
Concerning fit statistics, all items except for Vocabulary were fit-ted to the Rasch model. As is the case with Diction in Study 1, thevalues of the fit statistics for Vocabulary were a little above the bor-der when applying the criteria of Wright and Linacre (1994). Noinstructors were misfitting in Study 2, despite the fact that peer dataagain comprised 87.4% of the data. Only two peer raters were (oneeach from treatment and control) misfitting. No misfitting items orraters were eliminated in the subsequent analyses because this analy-sis was used mainly for descriptive purposes.
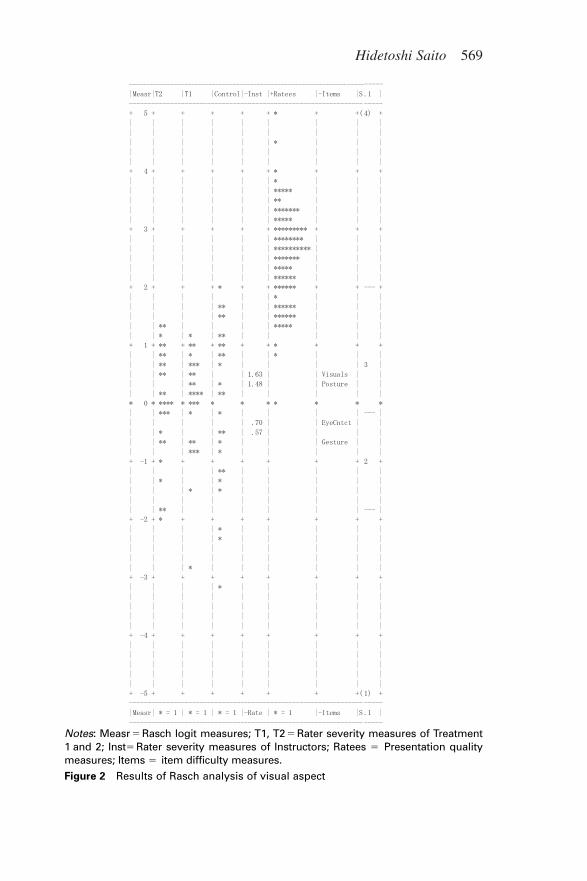
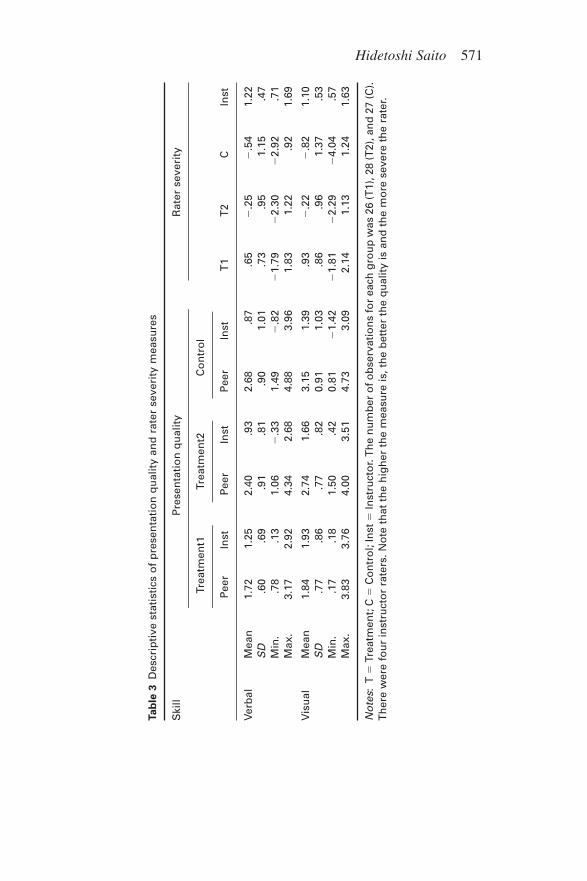
Table 3 shows the descriptive statistics for the presentation qual-ity and rater severity measures. Both statistics indicate that in-structors are more severe in their ratings than other groups in allrespects except for the visual aspect in Treatment 1. Among the threepeer groups, Treatment 1 had the lowest means on presentation qual-ity and the most severe raters; whereas, Control had the highestmeans on presentation quality and the most lenient raters. Leniency
Hidetoshi Saito 567
------------------------------------------------------------------------------------
Notes: Measr � Rasch logit measures; T1, T2 � Rater severity measures of Treatment1 and 2; Inst� Rater severity measures of Instructors; Ratees � Presentation qualitymeasures; Items � item difficulty measures.
Figure 1 Results of Rasch analysis of verbal aspect

568 EFL classroom peer assessment
of peer ratings, in comparison with teachers, concur with several pre-vious studies on L2 (e.g. Patri, 2002; Saito & Fujita, 2004) and inother domains (e.g. Morahan-Martin, 1996; Stefani, 1992). Note alsothat instructors’ standard deviations in presentation quality werewider than in the student groups, indicating wider discrimination inrating.
The results of the regression analyses in Table 4 indicate that allgroups are fairly good predictors of instructor ratings of presentationquality. However, in both aspects, the control group appears to be aslightly better predictor than the treatment groups. Correlation differ-ence tests for independent correlations were also run, in order to exam-ine differences between the treatment and control groups for eachaspect. The results suggest that there are no differences betweenthe control and treatment groups in either aspect, z � .82, p � .05,r �.09 for verbal aspects of Control and Treatment 1, z � .48, p � .05,r � .05 for verbal aspects of Treatment 2 and Control, z � 1.63,p � .05, r � .18 for visual aspects of Treatment 1 and Control, andz � .66, p � .05, r � .07 for visual aspects of Treatment 2 and Control.The results suggest that Hypothesis 1 is not confirmed. It is suspectedthat performance differences among the intact groups might haveaffected the results, although there were no differences in placementtest scores. To check this possibility, a MANOVA was run to comparethe treatment and control groups on presentation quality rated by theinstructor. The results, however, were not significant: Wilks’ λ � .93(F(4, 154) � 1.254), p � .05, η2 � .032. Thus, the absence of a train-ing effect does not seem to be due to a difference in performance.
Concerning the first comment analysis, the descriptive statistics ofthe relevance judgment were M � 2.78, SD � .32 for the controlgroup and M � 2.93, SD � .14 for the treatment group. These dataindicates that the treatment group made slightly more relevant com-ments on peer performance. Descriptive statistics for the overall cit-ation frequency scores were M � 1.19, SD � .48 for the control groupand M � 1.48, SD � .48 for the treatment group. Again, the treatmentgroup seems to mention more skill aspects per comment than the con-trol group. Both the average relevance and citation scores were sub-jected to a MANOVA in order to examine the group difference. Theresults were significant, Wilks’ λ � .85 (F(2, 50) � 4.322), p � .05,η2 � .14. A post-hoc ANOVA on each measure suggests that thisgroup difference lies in both measures, F(1, 51) � 5.24, p � .05,η2 � .093 for relevance scores and F(1, 51) � 4.66, p � .05, η2 � .084for citation scores. The results suggest that the treatment group made
Hidetoshi Saito 569
Notes: Measr � Rasch logit measures; T1, T2 � Rater severity measures of Treatment1 and 2; Inst� Rater severity measures of Instructors; Ratees � Presentation qualitymeasures; Items � item difficulty measures.
Figure 2 Results of Rasch analysis of visual aspect

570 EFL classroom peer assessment
Table 2 Item difficulty and fit statistics of verbal and visual aspects
Skill Item ID Fit
Infit z Outfit z
Verbal Vocabulary 2.04 1.4 9 1.4 9Language use 1.22 1.0 0 .9 �1Diction �.06 .9 �2 .9 �2Conclusion �.35 .9 �2 1.0 0Intonation �.68 .8 �4 .9 �2Body �.71 1.0 0 1.0 0Pace �.73 .9 �4 .9 �1Introduction �.74 .9 �3 .8 �3
Visual Visual aids .53 1.1 4 1.1 1Posture .33 .9 �4 .9 �3Eye contact �.25 1.0 0 1.0 0Gesture �.61 1.0 0 1.0 0
Facets Separation Reliability
Verbal Item 25.37 1.00Rater 7.46 .98Presentation 2.99 .90
Visual Item 11.09 .99Rater 4.94 .96Presentation 1.90 .78
Notes: ID � item difficulty. The higher the item difficulty is, the more difficult it is.
more relevant comments and mentioned more skill aspects per com-ment than the control group.
Finally, Table 5 shows the raw frequency of skill citation and aver-age skill frequency per individual according to category. These rawfrequency results do not seem to show clear differences between thetwo groups, partly because the numbers of total comments used weredifferent. To test the hypothesis, the average frequency of citationwithin a single peer rater was subjected to the Mann-Whitney tests.The results suggest that the treatment group made more frequentcitations per comment on Language use (U� 208.5, p � .01,r � �.43), Conclusion (U � 259, p � .01, r � �.34), Gestures(U � 112, p � .01, r �� .61), and Visual aids (U � 236.5, p � .05,r ��.28). Although these differences further support the hypothesis,all actual individual’s mean scores of each skill aspect turned out tobe less than one, thus leaving this micro-level analysis questionable.
Granted, the first and second analyses of comments consistentlyprovide evidence for the benefits that the treatment group seemed to
Hidetoshi Saito 571
Tab
le 3
Des
crip
tive
sta
tist
ics
of
pre
sen
tati
on
qu
alit
y an
d r
ater
sev
erit
y m
easu
res
Ski
llP
rese
nta
tio
n q
ual
ity
Rat
er s
ever
ity
Trea
tmen
t1Tr
eatm
ent2
Co
ntr
ol
Pee
rIn
stP
eer
Inst
Pee
rIn
stT
1T
2C
Inst
Verb
alM
ean
1.72
1.25
2.40
.93
2.68
.87
.65
�.2
5�
.54
1.22
SD
.60
.69
.91
.81
.90
1.01
.73
.95
1.15
.47
Min
..7
8.1
31.
06�
.33
1.49
�.8
2�
1.79
�2.
30�
2.92
.71
Max
.3.
172.
924.
342.
684.
883.
961.
831.
22.9
21.
69
Vis
ual
Mea
n1.
841.
932.
741.
663.
151.
39.9
3�
.22
�.8
21.
10S
D.7
7.8
6.7
7.8
20.
911.
03.8
6.9
61.
37.5
3M
in.
.17
.18
1.50
.42
0.81
�1.
42�
1.81
�2.
29�
4.04
.57
Max
.3.
833.
764.
003.
514.
733.
092.
141.
131.
241.
63
No
tes:
T �
Trea
tmen
t; C
�C
on
tro
l; In
st �
Inst
ruct
or.
Th
e n
um
ber
of o
bse
rvat
ion
s fo
r ea
ch g
rou
p w
as 2
6 (T
1), 2
8 (T
2), a
nd
27
(C).
Th
ere
wer
e fo
ur
inst
ruct
or
rate
rs. N
ote
th
at t
he
hig
her
th
e m
easu
re is
, th
e b
ette
r th
e q
ual
ity
is a
nd
th
e m
ore
sev
ere
the
rate
r.

572 EFL classroom peer assessment
gain from training, which bolsters the second hypothesis. That is, thetreatment group produced more relevant comments and mentionedmore skill aspects per comment compared to the control group. Thispart of the research conforms to the results of L1 and L2 writingresearch on peer response groups (Berg, 1999; McGroaty & Zhu,1997; Stanley, 1992).
Finally, the present research generated an averaged adjusted r2 of.523 (95% CI � .309 – .654, F(1, 46) � 50.36) from both Studies 1 and 2. These values are plotted in Figure 3, along with those of pre-vious studies. As can be seen in Figure 3, adding the present studydoes not quite change the pooled average of effect size (M � .506,95% CI � .416 � .586). In turn, it does not change the non-significantresults of the diffuse test for the heterogeneity of effect sizes(�2 � 1.22, df � 4, p � .05)), suggesting homogeneity of effect sizes.
One interpretation that can emanate from these data is the robust-ness of peer assessment, in the sense that it achieves the averageeffect size of .506 based on the five EFL peer assessment studies,whose adjusted r2 values are pooled from studies with various set-tings, including both trained and non-trained groups in the presentstudy. Except for the small sample in the Cheng and Warren study(1999), all other studies reached averaged effect sizes of above .50.Such an effect size is almost twice as large as .26, which was what
Table 4 Results of regression analysis of each group on instructor rating
Unstandardized Standardized coefficients coefficients
Skill Model B Std. Beta t p r Adj.error r2
Verbal Constant �.121 .310 �.391 .699Treatment 1 .796 .170 .691 4.684 .000 .691 .478
Constant �.652 .305 �2.135 .042Treatment 2 .678 .121 .741 5.628 .000 .741 .549
Constant �1.528 .389 �3.923 .001Control .911 .138 .797 6.594 .000 .797 .635
Visual Constant .692 .363 1.905 .069Treatment 1 .675 .182 .604 3.714 .001 .604 .365
Constant �.542 .385 �1.406 .171Treatment 2 .801 .136 .756 5.896 .000 .756 .572
Constant �1.531 .418 �3.665 .001Control .935 .128 .826 7.313 .000 .826 .681
Notes: n � 26 (Treatment 1), 28 (Treatment 2), and 27 (Control).

Hidetoshi Saito 573
Table 5 Frequency counts of comment and mean citation frequency by category
Skill Category Counts (Mean)
Control Treatment
Verbal Intonation 8 (.03) 4 (.00)Diction 79 (.19) 46 (.15)Pace 78 (.15) 67 (.13)Language use 5 (.00) 23 (.05)Vocabulary 29 (.04) 51 (.02)Introduction 3 (.00) 4 (.00)Body 88 (.20) 120 (.22)Conclusion 5 (.00) 9 (.01)Pronunciation* 60 (.13) 73 (.14)Length* 8 (.00) 5 (.01)
Visual Eye contact 42 (.07) 38 (.10)Gesture 22 (.04) 95 (.17)Posture 20 (.05) 10 (.02)Visual aid 135 (.29) 192 (.38)
Notes: * � categories added by raters.n � 27 (control), 26 (treatment). The number in the parentheses are mean citationfrequency per single peer rater.
0
0.1
0.2
0.3
0.4
0.5
0.6
0.7
0.8
Cheng &Warren(1999)
Yamashiro(1999)
Patri(2002)
Saito &Fujita(2004)
PresentStudy
Pooled
Study
Effe
ct S
ize
(Adj
uste
d r2
)
Figure 3 Effect sizes and 95% confidence intervals of five EFL peer assessment studies

574 EFL classroom peer assessment
Cohen (1988, p. 414) conceived to be a large effect size for r2 inbehavioral sciences in general. In fact, a meta-analysis (Falchikov &Goldfinch, 2000) of teacher–peer assessment correlation retrievedfrom 56 studies in the general education literature generated a meanr of .69 (roughly equal to .47 when squared), which is similar to thepresent study. This preliminary summary supports the robustness ofpeer assessment in EFL classrooms, although the number of studiesincluded here is still not large enough and there is a possibility ofpublication bias.
IV General discussion and conclusion
In the present study, two hypotheses were investigated. The firsthypothesis was not supported in the short or long training conditions.There are several possible reasons for this result. First, both groupsreceiving instruction on all of the oral presentation skill aspects mayhave established a certain level of correlation between the instructorsand students, and training may not have added any more advantagesto the treatment group on top of instruction in the skill aspects.However, before this interpretation is accepted, comparisons with acontrol group receiving no instruction are necessary.
A second speculation related to the null results of the second studycomes from the intrinsic characteristics of each intact group. Althoughplacement test scores and the post hoc comparison of presentationquality indicated that there were no particular proficiency advantagesfor any group, there is still a possibility that either the differences inmajor (see Falchikov & Goldfinch, 2000) or class specific character-istics affected the strength of the correlations between peer andinstructor ratings, as in Cheng and Warren (1999). This intrinsic dif-ference might have washed away any advantages of training.
The comment data of the present study support the second hypoth-esis because of the significant difference in relevance judgments andfrequency of citation on overall skill aspects. Several interesting pic-tures emerge from the results. First, the present results suggest thatinstruction on skill aspects without rater training may be sufficient forpeer assessment to correlate with instructor scores to a certain degree;however, rater training seems to help students provide more relevantcomments, citing more skill aspects on peer performance. Second,rater training reduces the possibility of a misfit in the data. In Study 1,all three instructors were misfitting because the frame of reference inthe data set by peer data, representing the majority, differs from that

Hidetoshi Saito 575
of instructors. Longer training in Study 2 seems to have convergedthe frame of reference of learners with that of instructors, which hasreduced the number of misfitting peer raters and eliminates misfittinginstructors. From these two observations, the conclusion is made thatrater training does not statistically improve the correlation withinstructors, but it does have an effect at a different level of ratingbehavior, such as commenting and setting a similar frame of refer-ence. However, the present data cannot answer the question as to whohas actually benefited from the longer training. Could it be peer learn-ers alone or instructors? Or both groups?
The results of the present study should be interpreted with somecaution, due to some methodological limitations. The first limitationof the present study is that it did not include a pretest. Although thequestionnaire used in the study confirmed the students’ lack of experi-ence in peer assessment, the absence of a pretest may make uncer-tain any changes that may result from rater training. There is aproblem, however, if the control group experiences any peer ratingas a pretest that can be considered training. In this study, the controlgroups truly had no prior experience in peer assessment.
Another limitation of this study is the shortage of training time. Itcan be argued that neither the short or long training sessions employedhere were sufficient for establishing strong correlations among raters.In their discussion of the use of a pre-listening activity, however, someresearchers (e.g. Field, 2002) have cautioned that spending too muchtime on a pre-listening activity reduces actual listening time and,hence, learning time. The same argument may be applicable for train-ing time for rating in classrooms. Rating itself is not an essential skillin language learning, and rater training should not take up too muchtime in language instruction, although having an explicit knowledge ofhow to discern a good performance may improve a student’s own per-formance. Training time used for this study reflects, to a certain extent,the amount of time a real classroom should afford.
When considering the application of the present results, a numberof issue remain unresolved. Whether long training and peer assess-ment have pedagogical value in language classrooms is an issue toexplore in further studies. In particular, the connection between thesetasks and an actual improvement in language performance remainsunclear. Long training for better comments may not be worth thetime unless such commenting skills assure an improvement in stu-dent language performance. A connection between peer responsetraining and improvement in the student product is examined in writ-ing research, but the results have not been consistent (Berg, 1999;
576 EFL classroom peer assessment
McGroarty & Zhu, 1997). Although the present study has shown theeffects of training on comments, in that training leads to better com-ments, the actual effect size (�2 � .14) may still not be large enoughfor practical significance.
Despite these limitations, the results of the present study supportthe following conclusions. First, when instruction on skill aspects isgiven, this may not, contrary to the expectation, result in better corre-lations between learner and instructor ratings. Peer assessment isfairly robust (reliable without much training), and longer trainingalone may not provide further improvement in correlation. On theother hand, longer training may reduce the possibility of instructormisfit because of improvement in the overall frame of reference ineither the majority peer rating, instructor rating, or both peer andinstructor ratings. Second, rater training for peer assessment mayraise language learners’ awareness of skill aspects and lead toenhancement in the frequency and relevance of comments. In thissense, peer assessment training is a meta-cognitive activity in whichstudent attention is drawn to the features of a language learning task.If increasing consciousness of the performance criteria is the prereq-uisite for learning, then peer assessment training may facilitate theprocess (Black & Wiliam, 1998).
Acknowledgements
I am grateful for all the comments by the two reviewers of LanguageTesting and encouragements from the Editor of Language Testing. Thisresearch was made possible through a grant by the Japan Ministry ofEducation, Culture, Sports, Science, & Technology (task no. 19520475).
V References
Berg, E. C. (1999). The effects of trained peer response on ESL students’ revi-sion types and writing quality. Journal of Second Language Writing, 8,225–241.
Black, P., & Wiliam, D. (1998). Assessment and classroom learning.Assessment in Education, 5, 7–68.
Cheng, W., & Warren, M. (1997). Having second thoughts: Student percep-tions before and after a peer assessment exercise. Studies in HigherEducation, 22, 233–239.
Cheng, W., & Warren, M. (1999). Peer and teacher assessment of the oral andwritten tasks of a group project. Assessment & Evaluation in HigherEducation, 24, 301–314.

Cheng, W., & Warren, M. (2005). Peer assessment of language proficiency.Language Testing, 22, 93–121.
Cohen, J. (1988). Statistical power analysis for the behavioral sciences (2nded.). Hillsdale, NJ: Lawrence Erlbaum.
Cumming, A. (1990). Expertise in evaluating second language compositions.Language Testing, 7(1), 31–51.
Devenney, R. (1989). How ESL teachers and peers evaluate and respond tostudent writing. RELC Journal, 20, 77–90.
DiPardo, A., & Freedman, S. W. (1988). Peer response groups in the writingclassroom: Theoretic foundations and new directions. Review ofEducational Research, 58, 119–149.
Falchikov, N. (1986). Product comparisons and process benefits of collabora-tive peer group and self assessments. Assessment & Evaluation in HigherEducation, 11, 146–165.
Falchikov, N., & Goldfinch, J. (2000). Student peer assessment in higher edu-cation: A meta-analysis comparing peer and teacher marks. Review ofEducational Research, 70, 287–322.
Field, J. (2002). The changing face of listening. In J. C. Richards & W. A. Renandya (Eds.). Methodology in language teaching: An anthologyof current practice (pp. 242–247). Cambridge, UK: CambridgeUniversity Press.
Fletcher, C., & Baldry, C. (1999). Multi-source feedback systems: A researchperspective. International Review of Industrial and OrganizationalPsychology, 14, 149–193.
Haaga, D. A. (1993). Peer review of term papers in graduate psychologycourses. Teaching of Psychology, 20, 28–32.
Harris, M. M., & Schaubroeck, J. (1988). A meta-analysis of self-supervisor,self-peer, and peer-supervisor ratings. Personnel Psychology, 41, 43–62.
Hu, G. (2005). Using peer review with Chinese ESL student writers. LanguageTeaching Research, 9, 321–342.
Jafarpur, A. (1991). Can naive EFL learners estimate their own proficiency?Evaluation and Research in Education, 5, 145–157.
Liu, J., & Hansen, J. G. (2002). Peer response in second language writingclassrooms. Ann Arbor, MI: The University of Michigan Press.
Long, M. H., & Porter, P. A. (1985). Group work, interlanguage talk, and sec-ond language learning. TESOL Quarterly, 19, 207–228.
Lumley, T. (2002). Assessment criteria in a large-scale writing test: What dothey really mean to the raters? Language Testing, 19, 246–276.
Lumley, T., & McNamara, T. F. (1995). Rater characteristics and rater bias:Implications for training. Language Testing, 12, 54–71.
McGroarty, M. E., & Zhu, W. (1997). Triangulation in classroom research: A study of peer revision. Language Learning, 47, 1–43.
McNamara, T., & Lumley, T. (1997). The effect of interlocutor and assessmentmode variables in overseas assessments of speaking skills in occupa-tional settings. Language Testing, 14(2), 140–156.
Morahan-Martin, J. (1996). Should peers’ evaluations be used in class projects?Questions regarding reliability, leniency, and acceptance. PsychologicalReports, 78, 1243–1250.
Hidetoshi Saito 577

578 EFL classroom peer assessment
Patri, M. (2002). The influence of peer feedback on self- and peer-assessmentof oral skills. Language Testing, 19, 109–131.
Rosenthal, R. (1991). Meta-analytic procedures for social research (2nd ed.).Thousand Oaks, CA: Sage.
Rothschild, D., & Klingenberg, F. (1990). Self and peer evaluation of writingin the interactive ESL classroom: An exploratory study. TESL CanadaJournal, 8, 52–65.
Saito, H. (1999). Dependence and interaction in frequency data analysis inSLA research. Studies in Second Language Acquisition, 21, 453–476.
Saito, H., & Fujita, T. (2004). Characteristics and user acceptance of peer rat-ing in EFL writing classrooms. Language Teaching Research, 8, 31–54.
Schoonen, R., Vergeer, M. M., & Eiting, M. (1997). The assessment of writingability: Expert readers versus lay readers. Language Testing, 14, 157–184.
Shohamy, E., Gordon, C. M., & Kraemer, R. (1992). The effect of raters’background and training on the reliability of direct writing tests. TheModern Language Journal, 76, 27–33.
Smithson, M. J. (n.d).: Scripts and software for noncentral confidence inter-val and power calculations: noncentral F files for SPSS. RetrievedDecember 20, 2005, from http://psychology.anu.edu.au/ people/smithson/details/CIstuff/CI.html
Somervell, H. (1993). Issues in assessment, enterprise and higher education:The case for self-, peer and collaborative assessment. Assessment &Evaluation in Higher Education, 18, 221–233.
Stanley, J. (1992). Coaching student writers to be effective peer evaluators.Journal of Second Language Writing, 1, 217–233.
Stefani, L. A. (1992). Comparison of collaborative self, peer and tutor assessmentin a biochemistry practical. Biochemical Education, 20, 148–151.
Thompson, B. (2002). What future quantitative social science research couldlook like: Confidence intervals for effect sizes. Educational Researcher,31, 25–32.
Topping, K. (1998). Peer assessment between students in colleges and univer-sities. Review of Educational Research, 68, 249–276.
Tornow, W. W. (1993). Perceptions or reality: Is multi-perspective measurementa means or an end? Human Resource Management, 32, 221–229.
Webb, N. M. (1982). Student interaction and learning in small groups. Reviewof Educational Research, 52(3), 421–445.
Weigle, S. C. (1994). Effects of training on raters of ESL compositions.Language Testing, 11, 197–223.
Weigle, S. C. (1998). Using FACETS to model rater training effects. LanguageTesting, 15, 263–287.
Wright, B., & Linacre, J. M. (1994). Reasonable mean-square fit values.Rasch Measurement: Transaction of the Rasch Measurement SIG, 8, 370.
Yamashiro, A. (1999). Using structural equation modeling to validate a ratingscale. Presented at the 21st Language Testing Research Colloquium,Tsukuba, Japan.
Yamashiro, A. D., & Johnson, J. (1997). Public speaking in EFL: Elementsfor course design. The Language Teacher, 21, 13–17.
Hidetoshi Saito 579
Appendix 1: Schedule for instruction and training
Class Classroom activities Brief description Treatment Treatment(focused skill in in aspects for oral Study 1 Study 2presentation)
1 Information gap 1) Students are paired �(Gestures/Posture) and guess the meanings Questionnaire on of each other’s gestures. peer-assessment 2) They stand up and experience introduce themselves
in pairs, paying attentionto postures.
2 Group mock Students are assigned �presentation to groups, with each (Eye contact/ group member being Visual aids) assigned a short text of
different themes (based on a worksheet). Each student makes a visual aid to explain his or her theme and presents it within the group, while paying attention to eye contact.
3 Group mock Each student makes a �presentation brief speech draft for (Introduction/ “my hometown” using a Body/Conclusion) template focusing on the
organization of the introduction, body and conclusion. Each presents it in the group.
4 Class mock In the 4th and 5th sessions, �presentation all students are asked to (Diction/Pace/ bring in a short memo that Intonation) includes their main topic
and the subtopics. 5 Class mock They introduce � �
presentation themselves as well as their (Grammar/ topics and subtopics for a Vocabulary) public speech in front of
the class, while paying attention to the focused skills.
6–8 Presentations and peer assessment
9 Feedback Students receive comments from peers and instructor.
Note: �� Treatment groups experienced rater training.

580 EFL classroom peer assessment
Ap
pen
dix
2:
Ru
bri
c fo
r cl
assr
oo
m p
eer
asse
ssm
ent
of
ora
l pre
sen
tati
on
. (A
dap
ted
fro
m Y
amas
hir
o a
nd
Jo
hn
son
, 199
7)
Ski
ll as
pec
t it
ems
Su
per
ior
(4)
Ad
equ
ate
(3)
Min
imal
(2)
Nee
d w
ork
(1)
Vis
ual
ski
lls
Po
stu
reB
ack
stra
igh
ten
ed.
Mo
der
ate
po
stu
re.
So
me
pro
ble
ms
Sw
ays
or
fid
get
s al
l (p
hys
ical
)(S
tan
din
g w
ith
bac
k Lo
oks
co
mfo
rtab
le.
wit
h p
ost
ure
. th
e ti
me.
Lo
oks
st
raig
ht
and
loo
kin
g
un
com
fort
able
.re
laxe
d)
Eye
co
nta
ctC
on
tin
uo
us
eye
con
tact
. M
od
erat
e ey
e Li
mit
ed e
ye c
on
tact
. N
o e
ye c
on
tact
(Lo
oki
ng
eac
h
Rar
ely
refe
rs t
o n
ote
s.
con
tact
. Occ
asio
nal
Fr
equ
ent
refe
ren
ce
aud
ien
ce m
emb
er
refe
ren
ce t
o n
ote
sto
no
tes.
in t
he
eye)
Ges
ture
U
ses
ges
ture
s an
d
Occ
asio
nal
use
of
Inef
fect
ive.
D
istr
acti
ng
. Or
no
(U
sin
g s
om
e, w
ell-
exp
ress
ion
s to
en
han
ce
han
ds
and
bo
dy
Rar
ely
use
dg
estu
res
tim
ed g
estu
res,
th
e p
rese
nta
tio
n. N
atu
ral.
mo
vem
ent.
n
oth
ing
dis
trac
tin
g)
So
met
imes
eff
ecti
ve.
(vis
ual
)V
isu
al a
ids
Eff
ecti
ve u
se o
f vi
sual
E
ffec
tive
to
so
me
No
t so
eff
ecti
ve.
Inef
fect
ive
or
no
use
.(U
sin
g v
isu
al a
ids
aid
s.ex
ten
t.
Rar
ely
use
def
fect
ivel
y)Ve
rbal
ski
lls
Intr
od
uct
ion
Mai
n t
hem
e is
cle
arly
M
ain
th
eme
and
M
ain
th
eme
and
N
o in
tro
du
ctio
n.
(org
aniz
atio
n
(In
tro
du
cin
g t
hes
is
del
inea
ted
, an
d a
ll th
e su
b-t
op
ics
sub
-to
pic
s an
d c
on
ten
t)st
atem
ent,
su
b-t
op
ics
are
liste
d.
del
inea
ted
wel
l to
a
del
inea
ted
su
b-t
op
ics)
cert
ain
deg
ree.
insu
ffic
ien
tly
or
bri
efly
.B
od
y D
etai
ls a
re e
xpla
ined
. D
etai
ls a
re e
xpla
ined
. B
rief
, in
suff
icie
nt
P
rob
lem
s w
ith
co
nte
nt.
(Pre
sen
tati
on
of
All
the
sub
-to
pic
s ar
e A
ll th
e su
b-t
op
ics
pre
sen
tati
on
of
No
cle
ar m
ain
po
int.
d
etai
ls o
f m
ain
co
vere
d. T
he
con
ten
t ar
e co
vere
d t
o a
d
etai
ls.
No
t o
rgan
ized
wel
l.th
emes
an
d s
ub
top
ics
is a
ttra
ctiv
e.ce
rtai
n d
egre
e.w
ith
att
ract
ive
con
ten
t)C
on
clu
sio
n
Res
tate
men
t o
f m
ajo
r M
ajo
r to
pic
s B
rief
, in
suff
icie
nt
No
co
ncl
usi
on
(In
clu
din
g r
esta
tem
ent/
top
ics
and
co
ncl
ud
ing
su
mm
ariz
ed.
sum
mar
y o
f su
mm
atio
n a
nd
rem
arks
pro
vid
ed.
Co
ncl
ud
ing
rem
arks
m
ajo
r to
pic
s.cl
osi
ng
sta
tem
ent)
mis
sed
.

Hidetoshi Saito 581(d
eliv
ery)
Pac
e Fl
uid
, nat
ura
l del
iver
y.
Ad
equ
ate
pac
e.
Lon
g p
ause
s at
H
alti
ng
, un
even
pac
e.
(Sp
eaki
ng
at
a g
oo
d
Ap
pro
pri
ate
pau
ses.
A f
ew lo
ng
er
seve
ral p
lace
s.
Dis
trac
tin
g.
rate
– n
ot
too
fas
t,
pau
ses.
So
me
un
even
nes
s n
ot
too
slo
w –
wit
h
of
pac
e.ap
pro
pri
ate
pau
ses)
Into
nat
ion
A
deq
uat
e in
ton
atio
n
Mo
stly
ad
equ
ate,
M
any
inad
equ
ate
Un
nat
ura
l, st
ran
ge
(Sp
eaki
ng
usi
ng
th
rou
gh
ou
t.b
ut
som
e in
dic
atio
n
into
nat
ion
s.
into
nat
ion
th
rou
gh
ou
t.p
rop
er p
itch
pat
tern
s)o
f u
nn
atu
raln
ess
Dic
tio
nC
lear
art
icu
lati
on
A
deq
uat
e S
om
e M
um
blin
g. U
ncl
ear.
(Sp
eaki
ng
cle
arly
–
all t
he
tim
e.ar
ticu
lati
on
. u
ncl
earn
ess.
no
mu
mb
ling
or
Mo
stly
cle
ar.
inte
rfer
ing
acc
ent)
(lan
gu
age)
Lan
gu
age
Use
G
ram
mat
ical
an
d f
ully
A
few
loca
l err
ors
S
om
e g
lob
al
Nu
mer
ou
s er
rors
. (U
sin
g c
lear
an
d
com
pre
hen
sib
le.
bu
t d
o n
ot
affe
ct
erro
rs a
ffec
t D
iffi
cult
to
co
rrec
t se
nte
nce
co
mp
reh
ensi
on
.co
mp
reh
ensi
bili
ty.
com
pre
hen
d.
form
s)Vo
cab
ula
ry
Use
of
adeq
uat
e U
sed
a f
ew
So
me
voca
bu
lary
N
um
ero
us
inst
ance
s o
f
(Usi
ng
vo
cab
ula
ry
voca
bu
lary
. Var
iety
.in
adeq
uat
e in
adeq
uac
y.
inad
equ
ate
voca
bu
lary
ap
pro
pri
ate
to t
he
voca
bu
lary
ter
ms.
Li
mit
ed v
oca
bu
lary
.u
se. V
ery
limit
ed
aud
ien
ce)
voca
bu
lary