Roles of insulin receptor substrates in the action of green tea (-)- epigallocatechin gallate on...
49
Roles of insulin receptor substrates in the action of green tea (-)- epigallocatechin gallate on insulin-stimulated growth of 3T3-L1 preadipocytes 國 立 中 央 大 學 生 命 科 學 研 究 所 碩 士 論 文 胰島素接受器受質在綠茶唲茶素對胰島素 刺激前脂肪細胞生長作用中扮演的角色 研 究 生:古惠珍 (Hui-Chen Ku) 指導教授:高永旭 (Yung-Hsi Kao) 博士 中 華 民 國 九 十 六 年 七 月
-
Upload
independent -
Category
Documents
-
view
3 -
download
0
Transcript of Roles of insulin receptor substrates in the action of green tea (-)- epigallocatechin gallate on...

Roles of insulin receptor substrates in the action of green tea (-)-epigallocatechin gallate on insulin-stimulated growth of
3T3-L1 preadipocytes
國 立 中 央 大 學
生 命 科 學 研 究 所
碩 士 論 文
胰島素接受器受質在綠茶唲茶素對胰島素
刺激前脂肪細胞生長作用中扮演的角色
研 究 生:古惠珍 (Hui-Chen Ku)
指導教授:高永旭 (Yung-Hsi Kao) 博士
中 華 民 國 九 十 六 年 七 月
國立中央大學圖書館 碩博士論文電子檔授權書
(95 年 7 月最新修正版)
本授權書所授權之論文全文電子檔(不包含紙本、詳備註 1 說明),為本人於國立中
央大學,撰寫之碩/博士學位論文。(以下請擇一勾選)
( )同意 (立即開放)
( )同意 (一年後開放),原因是:
(ˇ )同意 (二年後開放),原因是:研究成果未發表
( )不同意,原因是:
以非專屬、無償授權國立中央大學圖書館與國家圖書館,基於推動「資源共享、互
惠合作」之理念,於回饋社會與學術研究之目的,得不限地域、時間與次數,以紙
本、微縮、光碟及其它各種方法將上列論文收錄、重製、公開陳列、與發行,或再
授權他人以各種方法重製與利用,並得將數位化之上列論文與論文電子檔以上載網
路方式,提供讀者基於個人非營利性質之線上檢索、閱覽、下載或列印。
研究生簽名: 古惠珍 學號:942204009
論文名稱: 胰島素接受器受質在綠茶唲茶素對胰島素刺激前脂肪細胞生長作用中扮
演的角色
指導教授姓名:高永旭
系所 : 生命科學 所 博士班 碩士班
日期:民國 96 年 7 月 20 日
1. 本授權書之授權範圍僅限電子檔,紙本論文部分依著作權法第 15 條第 3 款之規定,採推定
原則即預設同意圖書館得公開上架閱覽,如您有申請專利或投稿等考量,不同意紙本上架陳
列,須另行加填聲明書,詳細說明與紙本聲明書請至 http://blog.lib.ncu.edu.tw/plog/ 碩博士論
文專區查閱下載。
2. 本授權書請填寫並親筆簽名後,裝訂於各紙本論文封面後之次頁(全文電子檔內之授權書簽
名,可用電腦打字代替)。
3. 請加印一份單張之授權書,填寫並親筆簽名後,於辦理離校時交圖書館(以統一代轉寄給國
家圖書館)。
4. 讀者基於個人非營利性質之線上檢索、閱覽、下載或列印上列論文,應依著作權法相關規定
辦理。

I
Abstract Obesity is a common disease, and it was associated with risk of cancer, diabetes,
hypertention, and cardiovascular disease. Development of obesity results from increases
in the cell number and fat accumulation of adipocyts, and is regulated by endocrine and
nutritional factors. Insulin regulates mitogenesis and adipogenesis of fat cells and
stimulates lipogenesis and inhibits lipolysis. By contrast, green tea catechins (once called
vitamin P), especially (-)-epigallocatechin gallate (EGCG), inhibits proliferation and
differentiation of fat cells and induces the apoptosis of preadipocytes and adipocytes.
EGCG has been proposed as a chemopreventative for obesity and diabetes. However,
relatively little is known about the mechanism of the action of EGCG on
insulin-stimulated fat cell function. This study was designed to investigate the pathways
of EGCG's modulation of the insulin-stimulated mitogenesis of 3T3-L1 preadipocytes.
EGCG decreased insulin-induced increases in levels of phospho-insulin receptor (pIR),
phospho-insulin receptor substrates 1, 2, and 3 (pIRS1, 2, and 3), phospho-Raf1,
phospho-MEK1/2, and phospho-Erk1/2 proteins and induced further insulin-decreased
pIRS4 level. In addition, EGCG reduced the insulin-stimulated associations of IR with
IRS1 and IRS2. EGCG also reduced the association of IRS proteins with downstream
signaling proteins. Besides, pretreatment with 67-kDa laminin receptor could antagonize
the effect of EGCG on insulin-induced pMEK1/2 and pIRS2. These data suggest that
EGCG exerts its antimitogenic effects via inhibiting insulin signaling by the 67-kDa
laminin receptor-dependent pathway. Moreover, EGCG was more effective than
epicatechin, epicatechin gallate, and epigallocatechin in changing the insulin-stimulated
mitogenic signals. Results of this study may relate to the mechanism by which EGCG
modulates insulin-related preadipocytes.

II
中文摘要
肥胖是一種常見的疾病,與癌症,糖尿病,高血壓以及心血管疾病都有相關。
造成肥胖的原因是脂肪細胞數目的增加,或脂肪細胞內三酸甘油酯的堆積。根據研
究指出,內分泌與營養都會影響到肥胖的調節作用,其中胰島素在細胞分化時期會
刺激細胞進行增生和 adipogenesis,並促使細胞進行脂肪生成和抑制脂肪分解作
用。然而綠茶唲茶素(亦稱維生素 P),尤其是綠茶表沒食子酸酯型唲茶素酸酯(英文
名稱和簡稱分別為 (-)-epigallocatechin gallate 和 EGCG),已被證實可以抑制脂
肪細胞的增生與分化,並可促使前脂肪細胞和脂肪細胞的 apoptosis,所以可作為
預防肥胖的保健物質。因此,EGCG 是否可調節胰島素刺激前脂肪細胞的增生仍然不
清楚。在本論文中,使用 3T3-L1 前脂肪細胞株做為研究素材,我發現胰島素濃度
100 nM,胰島素可分別增加胰島素接受器、IRS1、IRS2、IRS3、Raf1、MEK 和 Erk
蛋白的磷酸化,但減少 IRS-4 蛋白的磷酸化,然而前處理 EGCG (20μM)於前脂肪細
胞可以明顯抑制胰島素所促進訊息蛋白的磷酸化及胰島素接受器與 IRS-1 和 IRS-2
兩者之間的結合作用,並且可以明顯抑制胰島素所促進 IRS 蛋白質和下游訊息蛋白
質之間的結合作用。此外,前處理層粘連蛋白接受器的抗體(67-kDa laminin
receptor;被認為是一種 EGCG 接受器),可以中和 EGCG 抑制胰島素所促進訊息蛋
白 MEK 和 IRS2 的磷酸化。以上種種的跡象顯示,EGCG 可透過阻礙胰島素的訊息傳
導路徑而抑制前脂肪細胞的增生,並且 EGCG 可透過層粘連蛋白接受器干擾胰島素
的訊息傳導作用。此外,EGCG 比其他綠茶唲茶素干擾胰島素刺激增生更有效果。此
篇研究結果可以說明在前脂肪細胞中,EGCG 調節胰島素訊息的作用機制。

III
Acknowledgements Firstly, I thank Professor Yung-Hsi Kao for his advice in pursuing my
master degree. With his supervision and guidance, I have acquired
invaluable knowledge.
Secondly, I thank Professors Rong-Nan Huang, Shiow-Lian Catherine Jin,
Chien-Chia Wang, and Shen-Liang Chen as my committee members for my
oral examination.
I extend my grateful thanks to the lab partners in the Professor Kao’s lab
due to their technical assistance. Finally, I thank my beloved family for their
support and understanding in the course of my past and future studies.

IV
Abstract Ⅰ 中文摘要 Ⅱ Acknowledgements Ⅲ Contents Ⅳ List of figures Ⅴ Abbreviations Ⅵ Introduction 1 Materials and Methods 4 Results 8 Discussions 12 References 14 Appendix 39

V
List of figures
Fig. 1 Chemical structures of four major green tea catechins. 17 Fig. 2 Effect of EGCG on insulin-induced phosphorylation of insulin 18
receptor substrates (IRSs) and insulin receptor was dose dependent Fig. 3 Effect of EGCG on insulin-induced phosphorylation of insulin 20
receptor substrates (IRSs) and insulin receptor was time dependent
Fig. 4 Inhibitory effect of EGCG on insulin-induced phosphorylation of 22 insulin receptor substrates (IRSs) in the 3T3-L1 preadipocytes
Fig. 5 Inhibitory effect of EGCG on insulin-induced levels of 23 pRaf1, p MEK, and p ERK proteins
Fig. 6 Catechin-specific effect of green tea on insulin-stimulated signaling 25
Fig. 7 EGCG reduced insulin-stimulated interactions of insulin receptor 27 with IRS1 and IRS2 proteins
Fig. 8 Effect of EGCG on insulin-stimulated interactions of IRS1 with 28
Ras, pRaf1, and pMEK
Fig. 9 Effect of EGCG on insulin-stimulated interactions of IRS2 with 30 Ras, pRaf1, and pMEK
Fig.10 Effect of EGCG on insulin-mediated interactions of IRS3 with 32
insulin signaling proteins Fig. 11 Effect of EGCG on insulin-mediated interactions of IRS4 with 34
insulin signaling proteins
Fig. 12 Effect of EGCG on insulin-mediated interactions of IRS proteins with 36 laminin receptor
Fig. 13 Laminin receptor antibody antagonized the effects of EGCG on 38
insulin-stimulated pMEK and pIRS2 levels

VI
Abbreviations
BrdU 5-bromo-2’-deoxyuridine
BSA Bovine serum albumin
CS Calf serum
DMEM Dulbecco’s Modified Eagle Medium
DMSO Dimethyl sulfoxide
EC Epicatechin
ECG Epicatechin gallate
EGC Epigallocatechin
EGCG Epigallocatechin gallate
EDTA Ethylene Diamine Tetraacetic Acid
Erk Extracellularly regulated kinase
GTC Green tea catechin
IP Immunoprecipitation
IR Insulin receptor
IRS Insulin receptor substrate
67-kDa LR 67-kDa laminin receptor
MEK Mitogen-activated protein kinase kinase
PBS Phosphate buffered saline
PMSF Phenylmethylsulfonyl fluoride
SDS Sodium dodecyl sulfate
TEMED N,N,N,N-tetramethyl-ethylenediamine
Tween 20 Polyoxyethylenesorbitan monolaurate

1
Introduction
Insulin Insulin, a polypeptide hormone with a molecular weight of about 5800 Daltons, is
produced by β cells of pancreas. It is composed of two peptide chains referred to as the
A chain and B chain linked together by two disulfide bonds. In most species, the A chain
consists of 21 amino acids and the B chain of 30 amino acids. Insulin is a key hormone
regulating growth, development and homeostasis of glucose, fat, and protein metabolism
(1,2). Insulin resistance is a usual pathological condition in which target cells are unable
to respond to regular levels of circulating insulin. Human with insulin resistance are very
subject to developing type 2 diabetes, and insulin resistance is often associated with
several health disorders, including obesity, hypertension, chronic infection, and
cardiovascular diseases (3).
Insulin signal transduction Insulin acts by binding to its transmembrane receptor (IR), which is a tyrosine kinase
having an α2β2 configuration. Insulin binding to the α subunits induces conformational
changes and thereby resulting in stimulation of the β subunits tyrosine kinase activity
through autophosphorylation of Tyr residue in the β subunits (1,4). The activated insulin
receptor then phosphorylates substrate proteins, such as Shc, Gab-1, Cbl/CAP, and the
family of insulin receptor substrate (IRS) proteins, on selective Tyr residues that serve as
docking sites for downstream molecules. This elicits two main kinase signaling
pathways – the mitogen-activated protein kinase (MAPK) and phosphoinositide 3-kinase
(PI3K) pathways. These two kinase pathways mediate the metabolic and
growth-promoting functions of insulin, such as translocation of GLUT4 glucose
transporters, stimulation of glycogen and protein synthesis, and initiation of specific gene
transcription (5,6). Whether one of the pathways can explain for the the green tea
catechin regulation of insulin signaling will require further studies.

2
Insulin receptor substrate proteins The family of insulin receptor substrates contains nine members: (i) four insulin
receptor substrate (IRS) proteins (IRSI, IRS2, IRS3 and IRS4), (ii) 3 Src - Homology
-collagen (SHC) proteins, (iii) growth factor receptor bound-2 (Grb-2) associated binder-I
(Gab-I), and (iv) p62dok (4). All IRS proteins are characterized by an NH2-terminal
pleckstrin homology (PH) domain followed by a phosphotyrosine binding (PTB) domain
and a domain of variable length consisting of considerable potential tyrosine
phosphorylation sites (7-9). The molecular weights of the IRS proteins are 185 kDa for
IRSI, 190 kDa for IRS2, 60 kDa for IRS3 and 160 kDa for IRS4, respectively. To date
mice lacking IRS-1, IRS-2, IRS-3 and IRS-4 have been described (10). IRS1-deficient
mice have growth retardation and insulin resistance (11, 12). IRS2 KO mice are diabetic
(13). IRS3-null mice have no glucose metabolism or growth problem (14). Mice lacking
insulin receptor substrate 4 exhibit mild defects in growth, reproduction, and glucose
homeostasis (15). Whether any of IRS proteins is involved in the green tea catechin
regulation of insulin signaling pathway in 3T3-L1 preadipocytes was relatively little
known.
EGCG and preadipocytes Green tea, a beverage generally consumed in Asian countries, is a vital source of a
kind of flavonoids called catechins. Green tea catechins primarily include
(-)-epigallocatechin gallate (EGCG), (-)-epigallocatechin, (-)-epicatechin gallate, and
(-)-epicatechin. They have different characteristic chemical structures (Fig. 1) and
biological functions (16-22). For instance, EGCG lowers the incidences of cancers (17,
18, 20), oxidative stress-induced neurodegenerative diseases (23), collagen-induced
arthritis (24), and cytokine-induced inflammation in vivo (17). In addition, EGCG can
reduce body weight and body fat (25, 26). In spite of the significance of EGCG and other
tea catechins, little is known about the mechanism of their action in regulating the
mitogenesis of preadipocytes. The fact that the EGCG receptor, the so-called 67-kDa
laminin receptor, discovered in cancer cells (27), has not been identified in fat cells and
the fact that fat cells have different isoforms of laminins (28) has also caused many

3
controversies. Thus, a complete examination of the signal element through which EGCG
performs its regulation of preadipocyte mitogenesis should help make these observations
clear.
Preliminary observations Previously we observed the followings (22): (1) Insulin-stimulated mitogenesis, as
indicated by changes in the cell number and BrdU incorporation, of 3T3-L1
preadipocytes is inhibited by EGCG in dose-dependent manner. (2) EGCG decreased
insulin-stimulated MEK1 activity in a dose-dependent manner in 3T3-L1 preadipocytes.
(3) EGCG decreased insulin-induced increases in levels of phospho-insulin receptor β
and phospho-insulin receptor substrate 1. (4) EGCG reduced the insulin-stimulated
associations of IR with IRS1. (5) EGCG was more effective than epicatechin, epicatechin
gallate, and epigallocatechin in reducing the insulin-induced increase in MEK activity.
Despite the importance of EGCG in regulating adipocyte activity, the exact mechanism
of its action in mediating insulin signaling in the mitogenesis of fat cells was still not
clear.
Objectives The present study was designed to examine the mechanism by which EGCG acts in
modulating insulin signaling in the mitogenesis of 3T3-L1 preadipocytes. Our specific
aim was to investigate whether IRS proteins other than IRS1 is involved in the EGCG
modulation of the insulin signaling pathway. Because the 67 LR was discovered as an
EGCG receptor in cancer cells, further study as to whether it mediates the EGCG
regulation of insulin signaling in preadipocytes was also addressed.

4
Materials and Methods
Chemical reagents Green tea EGCG and other catechins (>98% pure) were isolated from green tea
(Camellia sinensis) in our laboratory as described previously (28). Catechins were
dissolved in 0.1% DMSO. Other materials (i.e., penicillin G, streptomycin, etc) were
purchased from Sigma (St. Louis, MO). Dulbecco's modified Eagle's medium (DMEM),
fetal bovine serum (FBS), calf serum, penicillin-streptomycin and trypsin were purchased
from GibcoBRL of Life Technologies (New York, NY). BenchMarkTM Pre-Stained
Protein Ladder was purchased from Invitrogen Life Science Technologies (Carlsbad, CA).
TEMED, 2-mercaptoethanol, and EDTA were purchased from J. T. Baker. 1,
4-dithiothreitol, and Triton X-100 were purchased from Merck. Bio-Rad protein assay
dye reagent and Coomassie blue R-250 were purchased from Bio-Rad. Except laminin
receptor antibody (#GCA1016B95b; Genesis Biotech Inc, Taiwan), all antibodies (β-actin,
sc-1616; IRS1, sc-8038; IRS2, sc-1555; IRS3, sc-28831; IRS4, sc-28830; pIRS1,
sc-17200; pIRS1/IRS2, sc-17195-R; p-tyrosine, sc-7020; pMEK, sc-; pRaf1, sc-28005;
Ras, sc-35; laminin R, sc-20979; IGFI R, sc-462; IR,sc-09; pIR, sc-25103; donkey
anti-rabbit IgG-HRP, sc-2313; donkey anti-mouse IgG-HRP, sc-2005; donkey anti-goat
IgG-HRP, sc-2020; goat anti-rat IgG-HRP, sc-2006; normal mouse serum, sc-45051;
protein A/G plus agarose, sc-1616) were purchased from Santa Cruz Biotechnology
(Santa Cruz Biotechnology, Inc, CA). Insulin, acrylamide/ bis- acrylamide, trypan blue,
DMSO and BSA were purchased from Sigma.
Cell culture Murine 3T3-L1 cell line was purchased from American Type Culture Collection
(ATCC, Manassas, VA). The preadipocytes were grown in DMEM (pH 7.4). containing
10% heat-inactivated (56°C, 30 min) CS, 100 units/ml penicillin G, and 0.1mg/ml
streptomycin under the humidified condition of 95% air and 5% CO2 at 37°C. 3T3-L1
cells were plated at a density of 12,000-15,000 per cm2 of a 10-cm plate (29), and then
subcultured every 2-3 days before the confluent. In this study, 3T3-L1 cells at the second

5
day of culture (log phase of 3T3-L1 development) were starved for overnight in
serum-free DMEM, and then pretreated with catechins at a varying dose( 0-50 uM) and
duration( 0-24h). After the treatment, cells were stimulated with 100 nM insulin for 5
min.
Protein determination Protein content of the cell lysates was determined in duplicate by the protein-dye
binding (32) microassay method using a microtiter plate reader. The reaction mixture
contained 10 µl of lysates and 200 ul of diluted (1:4, v/v) dye solution (Bio-Rad Protein
Assay). After 10 min incubation, the absorbance of the reaction was read at 595 nm. A
linear range of BSA standard was observed from 0.25 to 5 µg per well.
Western blot analysis Western blotting analysis was performed as described by Hung et al. (30). 3T3-L1
preadipocytes were grown in 10 cm plates. The cells were washed twice with 10 mM
PBS and lysed in the lysis buffer containing 20 mM Tris-HCl (pH 7.6), 1 mM EDTA, 1
mM Na3VO4, 0.2% Triton-X100, and 1 mM phenylmethylsulfonyl fluoride (PMSF).
Lysate was agitated for 15 min at 4°C and their supernatant were collected after the
centrifugation at 14,000 rpm and 4°C for 10 min. Protein concentration of the supernatant
was determined with Bradford reagent. Samples were then diluted by adding the same
volume of 2× sample buffer containing 100 mM Tris-HCl (pH6.8), 4% SDS, 20%
glycerol, 0.2% bromophenol blue, and 10% β-mercaptoethanol (Sigma). Equal amounts
of protein (50 µg) were electrophoresed by denaturing 12% SDS-PAGE. Proteins were
then blotted onto Immobilon-NC transfer membranes (Millipore Corporation, Bedford,
MA). The membranes were blocked with 5% nonfat dried milk in PBS-0.1% Tween 20
(polyoxyethylenesorbitan monolaurate, Sigma) for 1 h. After being washed with PBST
for 3 times, the membranes were incubated with primary antibodies (diluted in blocking
buffer) for 1 h at room temperature or overnight at 4 °C. Primary antibodies used for
Western blotting were diluted as follows: anti-pRaf1, 1:1000; anti-pMEK, 1:1000;
anti-pERK, 1:1000; anti-pIRS1, 1:500; anti-pIRS1/2, 1:1000; anti-IRS3, 1:1000;
6
anti-IRS4, 1:1000; anti-IR, 1:500; anti-pY, 1:500; anti-laminin R, 1:500; anti-Ras, 1:500;
anti-β-actin, 1:2000. Secondary antibodies (i.e. horseradish peroxidase-conjugated
donkey anti-goat IgG, donkey anti-mouse IgG, donkey anti-rabbit IgG, and goat anti-rat
IgG )were diluted in blocking buffer at a final ratio of 1:3,000. The membranes were
washed three times prior to detection using the Western Lightning chemiluminescence
Reagent Plus kit (PerkinElmer Life Science, Inc. MA). The relative amounts of these
proteins were normalized with β-actin.
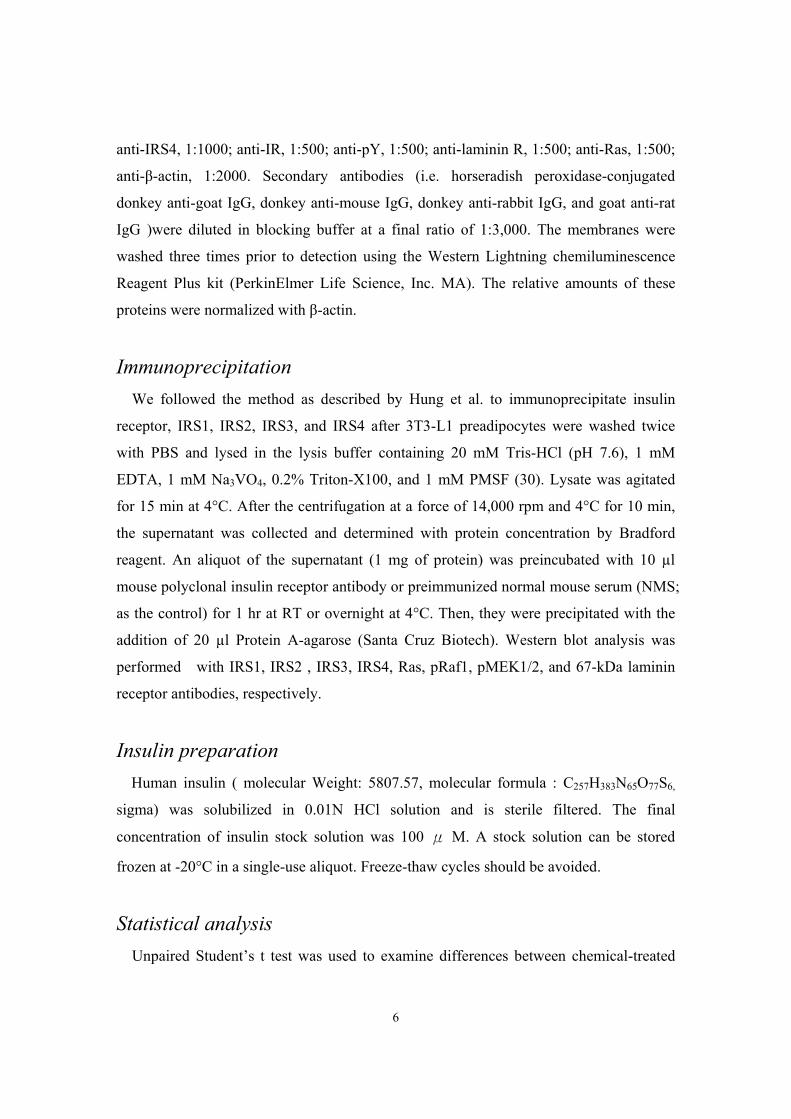
Immunoprecipitation We followed the method as described by Hung et al. to immunoprecipitate insulin
receptor, IRS1, IRS2, IRS3, and IRS4 after 3T3-L1 preadipocytes were washed twice
with PBS and lysed in the lysis buffer containing 20 mM Tris-HCl (pH 7.6), 1 mM
EDTA, 1 mM Na3VO4, 0.2% Triton-X100, and 1 mM PMSF (30). Lysate was agitated
for 15 min at 4°C. After the centrifugation at a force of 14,000 rpm and 4°C for 10 min,
the supernatant was collected and determined with protein concentration by Bradford
reagent. An aliquot of the supernatant (1 mg of protein) was preincubated with 10 µl
mouse polyclonal insulin receptor antibody or preimmunized normal mouse serum (NMS;
as the control) for 1 hr at RT or overnight at 4°C. Then, they were precipitated with the
addition of 20 µl Protein A-agarose (Santa Cruz Biotech). Western blot analysis was
performed with IRS1, IRS2 , IRS3, IRS4, Ras, pRaf1, pMEK1/2, and 67-kDa laminin
receptor antibodies, respectively.
Insulin preparation Human insulin ( molecular Weight: 5807.57, molecular formula : C257H383N65O77S6,
sigma) was solubilized in 0.01N HCl solution and is sterile filtered. The final
concentration of insulin stock solution was 100 μ M. A stock solution can be stored
frozen at -20°C in a single-use aliquot. Freeze-thaw cycles should be avoided.
Statistical analysis Unpaired Student’s t test was used to examine differences between chemical-treated

7
groups and non-treated control. ANOVA and Student-Newman-Keuls multiple range test
were used to examine differences among various groups. Significance was set as P<0.05
or P<0.01. All results are presented as the mean±SE. All statistics were performed using
Sigmaplot.

8
Results
Effect of EGCG on insulin-induced phosphorylation of insulin receptor
substrates (IRSs) and insulin receptor was dose dependent in 3T3-L1
preadipocytes To test whether the inhibitory effect of EGCG on the insulin-induced phosphorylation
of IRS proteins and insulin receptor was dose dependent, we treated cells with different
concentrations of EGCG (10, 20, and 50 uM), followed by stimulation with 100 nM
insulin for 5 min. EGCG dose-dependently inhibited insulin-induced levels of
phospho-IRS1 (Fig. 2A), phospho-IRS2 (Fig. 2B), and phospho- insulin receptor (Fig.
2C).
Effect of EGCG on insulin-induced phosphorylation of insulin receptor
substrates (IRSs) and insulin receptor was time dependent in 3T3-L1
preadipocytes To know whether the inhibitory effect of EGCG on insulin-induced phosphorylation of
IRS proteins and insulin receptor was time dependent, we treated cells with EGCG for
different time periods (30 min, 60 min, 90 min, 3h, 6h, 12h and 24h), followed by
stimulation with 100 nM insulin for 5 min. EGCG time-dependently inhibited
insulin-induced levels of phospho-IRS1 (Fig. 3A), phospho-IRS2 (Fig. 3B), and phospho-
insulin receptor (Fig. 3C).
Inhibitory effect of EGCG on insulin-induced phosphorylation of insulin
receptor substrates (IRSs) in the 3T3-L1 preadipocytes We assessed whether EGCG inhibited the insulin-stimulated phosphorylation of other
IRS proteins (Fig.4). Pretreatment with 20 μM EGCG resulted in a significant decrease
in the amount of phospho-IRS-1, but not total IRS-1 protein induced by insulin. EGCG
significantly decreased insulin-induced levels of phospho-IRS2 (Fig. 4B) and
phospho-IRS3 (Fig. 4C), but further decreased insulin-inhibited phospho-IRS4 levels.

9
(Fig.4D). However, none of total IRS2 and IRS3 proteins were altered by insulin
treatment in the presence or absence of EGCG.
Inhibitory effect of EGCG on insulin-induced levels of pRaf1, pMEK, and
pERK proteins To further assess whether EGCG regulated the downstream signaling proteins of IRS,
the levels of the phosphorylated Raf1, MEK1/2, and ERK1/2 were measured (Fig.5). We
found that EGCG decreased insulin-induced levels of phospho-Raf1(Fig. 5A),
phospho-MEK1/2(Fig. 5B), and phospho-ERK1/2(Fig. 5C). However, insulin did not
alter total levels of MEK1 or ERK1/2 in the presence or absence of EGCG.
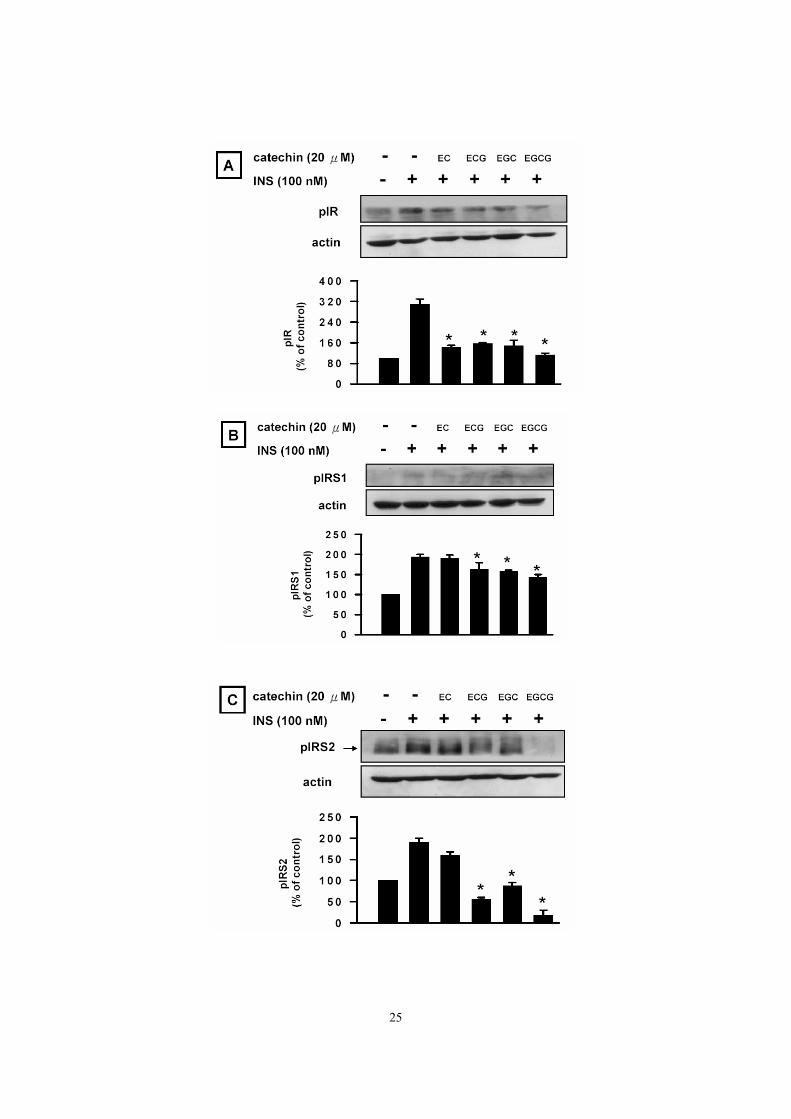
Catechin-specific effect of green tea on insulin-stimulated signaling Catechin-specific effect of green tea on insulin-stimulated signaling was assessed by
measuring the amounts of the phosphorylated forms of insulin receptor (Fig. 6A), IRS1
(Fig. 6B), IRS2 (Fig.6C), and MEK1/2 (Fig.6D). At the given concentration of 20 uM for
90 min, EGCG was generally more effective than other catechins in reducing
insulin-stimulated signaling.
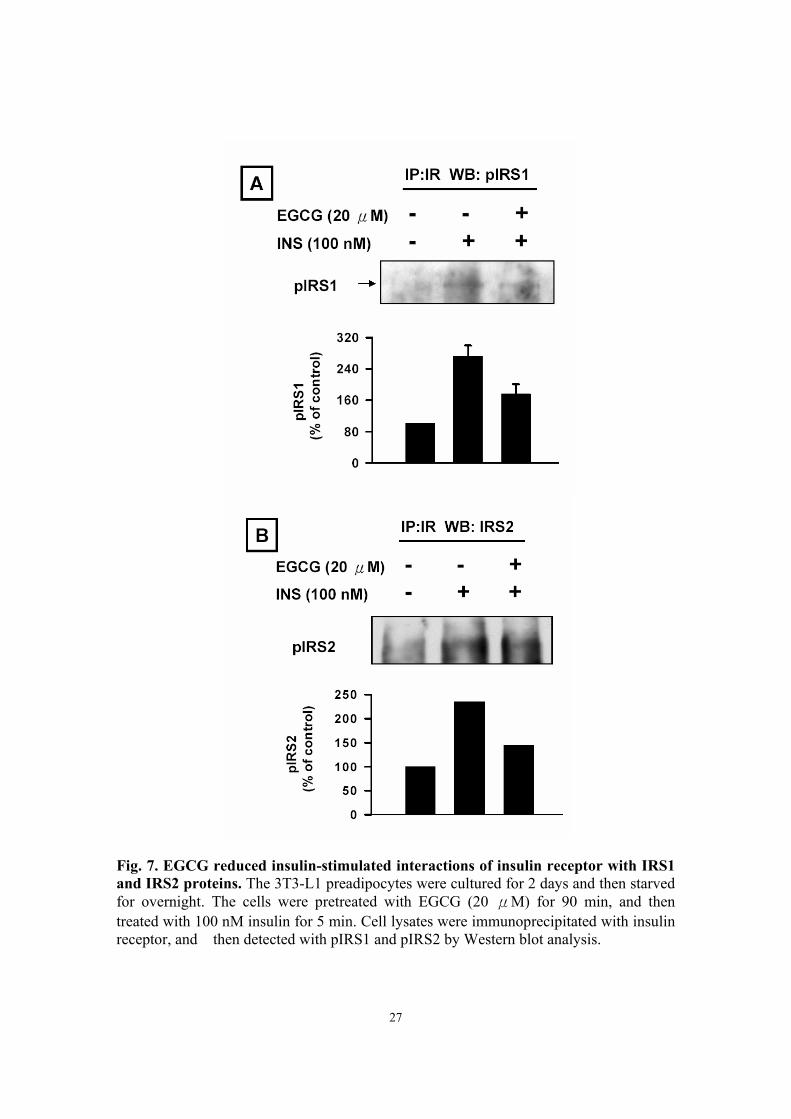
EGCG reduced insulin-stimulated interactions of insulin receptor with IRS1
and IRS2 proteins For clear assessment of the effect of EGCG on insulin signaling in 3T3-L1
preadipocytes, we further determined whether EGCG regulates insulin-mediated
association of insulin receptor with IRS1 and IRS2 proteins. We found that EGCG
reduced insulin-stimulated associations of insulin receptor with IRS1 (Fig. 7A) and IRS2
(Fig. 7B).
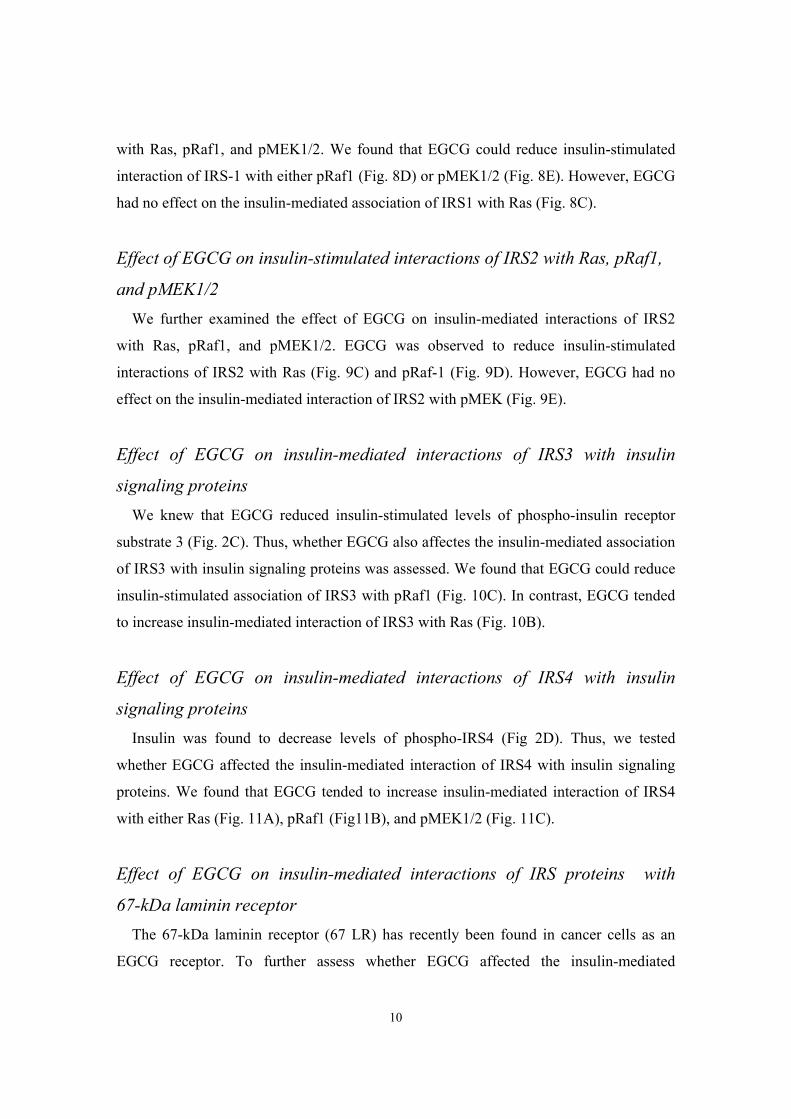
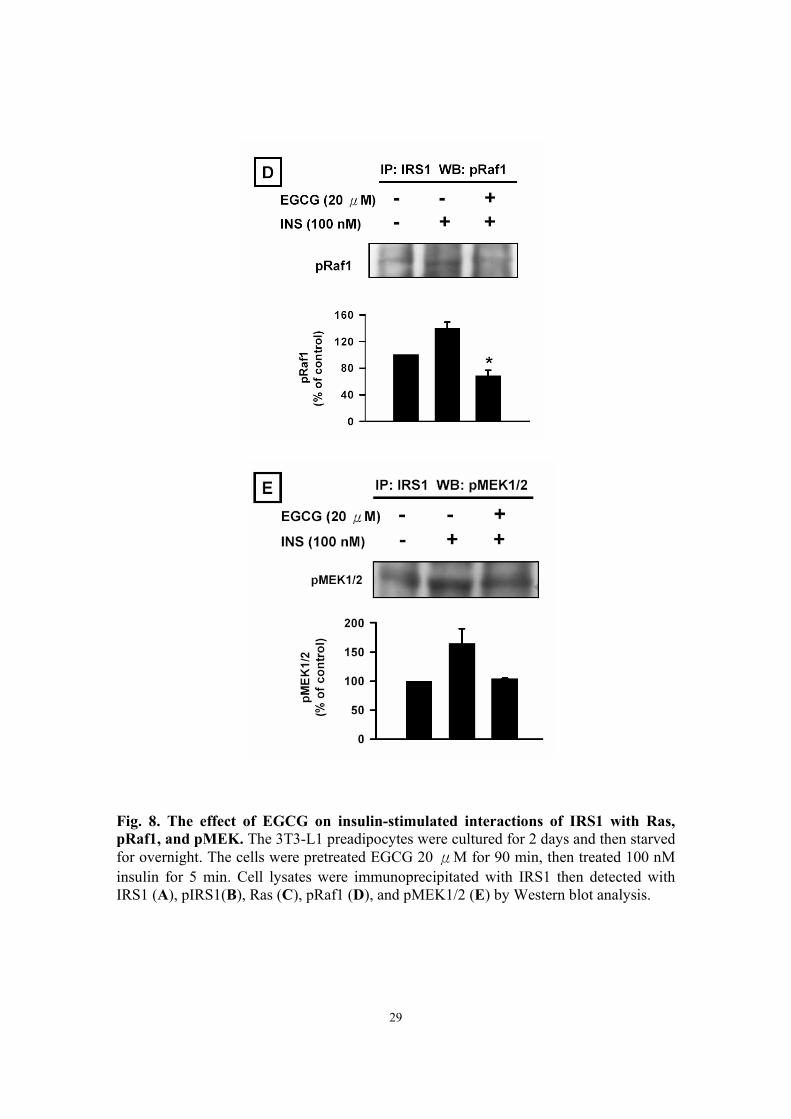
Effect of EGCG on insulin-stimulated interactions of IRS1 with Ras, pRaf1,
and pMEK1/2 To further understand the mechanism of the molecular effects of EGCG on insulin
signaling, we assessed whether EGCG affected insulin-mediated interaction of IRS1
10
with Ras, pRaf1, and pMEK1/2. We found that EGCG could reduce insulin-stimulated
interaction of IRS-1 with either pRaf1 (Fig. 8D) or pMEK1/2 (Fig. 8E). However, EGCG
had no effect on the insulin-mediated association of IRS1 with Ras (Fig. 8C).
Effect of EGCG on insulin-stimulated interactions of IRS2 with Ras, pRaf1,
and pMEK1/2 We further examined the effect of EGCG on insulin-mediated interactions of IRS2
with Ras, pRaf1, and pMEK1/2. EGCG was observed to reduce insulin-stimulated
interactions of IRS2 with Ras (Fig. 9C) and pRaf-1 (Fig. 9D). However, EGCG had no
effect on the insulin-mediated interaction of IRS2 with pMEK (Fig. 9E).
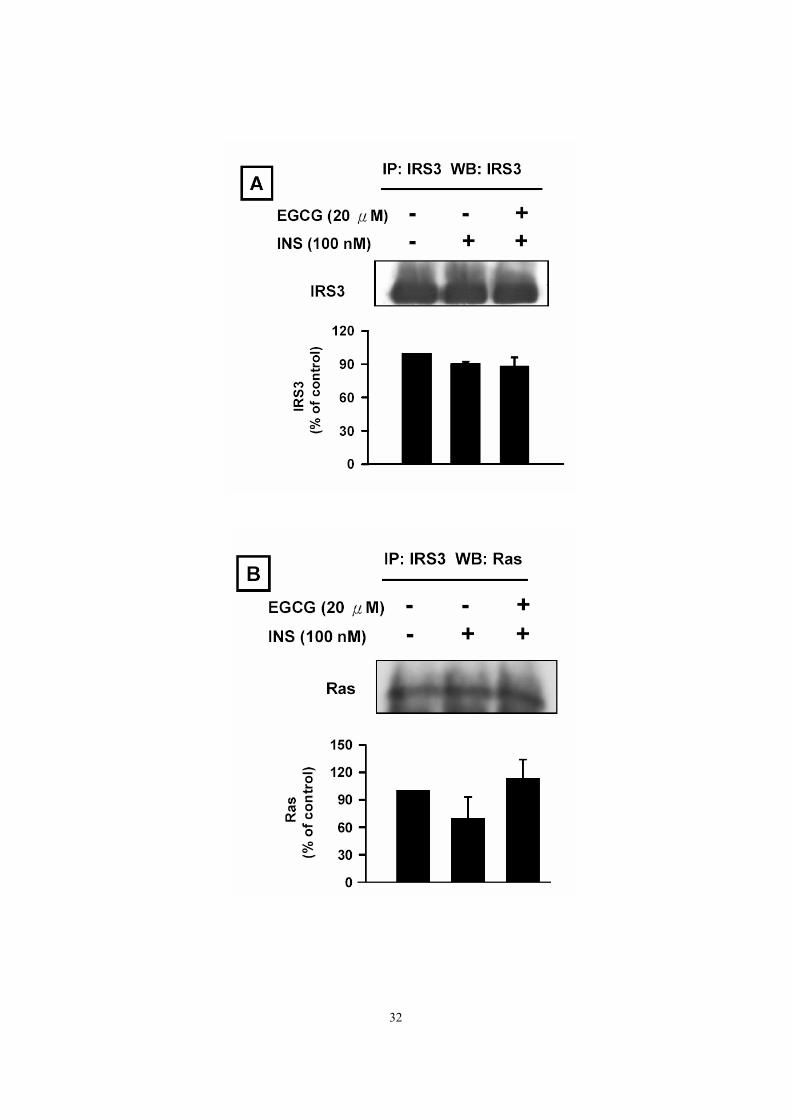
Effect of EGCG on insulin-mediated interactions of IRS3 with insulin
signaling proteins We knew that EGCG reduced insulin-stimulated levels of phospho-insulin receptor
substrate 3 (Fig. 2C). Thus, whether EGCG also affectes the insulin-mediated association
of IRS3 with insulin signaling proteins was assessed. We found that EGCG could reduce
insulin-stimulated association of IRS3 with pRaf1 (Fig. 10C). In contrast, EGCG tended
to increase insulin-mediated interaction of IRS3 with Ras (Fig. 10B).
Effect of EGCG on insulin-mediated interactions of IRS4 with insulin
signaling proteins Insulin was found to decrease levels of phospho-IRS4 (Fig 2D). Thus, we tested
whether EGCG affected the insulin-mediated interaction of IRS4 with insulin signaling
proteins. We found that EGCG tended to increase insulin-mediated interaction of IRS4
with either Ras (Fig. 11A), pRaf1 (Fig11B), and pMEK1/2 (Fig. 11C).
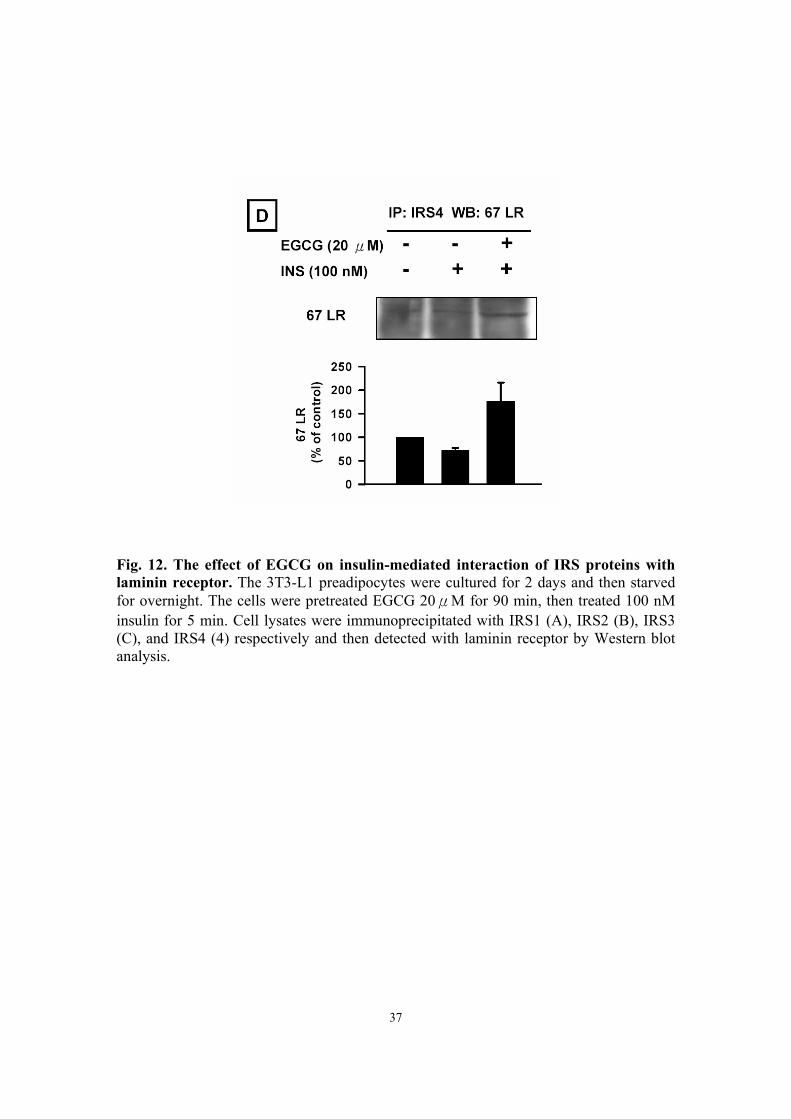
Effect of EGCG on insulin-mediated interactions of IRS proteins with
67-kDa laminin receptor The 67-kDa laminin receptor (67 LR) has recently been found in cancer cells as an
EGCG receptor. To further assess whether EGCG affected the insulin-mediated
11
association of IRS proteins with 67 LR, we found EGCG could increase
insulin-stimulated interactions of IRS1 with 67 LR (Fig. 12A), IRS2 with 67 LR (Fig.
12B) and IRS4 with 67 LR (Fig. 12D), but it did not alter insulin-stimulated interactions
of IRS3 with 67 LR (Fig. 12C).
Laminin receptor antibody antagonized the effects of EGCG on
insulin-stimulated pMEK and pIRS2 levels To assesse whether EGCG affected insulin signaling through 67-kDa LR, we
pretreated preadipocytes with 67-kDa LR antiserum for 1h and then stimulated them with
EGCG for 90 min and insulin for another 5 min (Fig. 13). We found that the
EGCG-decreased insulin-increased levels of phospho-MEK1/2 (Fig. 13A) and
phospho-IRS2 (Fig. 13B) were blocked by the addition of laminin receptor antiserum.

12
Discussions
Previously we observed that insulin at 1-1000 nM could stimulate the growth of
3T3-L1 preadipocytes as indicated by increased cell number and BrdU incorporation (22).
However, the results did not demonstrate whether EGCG regulated the phosphorylation
of the different types of IRS. The present study is delineated to demonstrate that EGCG
decreases insulin-induced increases in levels of the different IRS types and insulin
receptor with dose- and time-dependent manners. EGCG decreased insulin-induced
increases in levels of pIRS1, pIRS2, and pIRS3. However, the insulin-decreased levels of
pIRS4 is further enhanced by EGCG treatment. These observations suggest that EGCG
has the selective effect on insulin signaling to a particular type of IRS. This conclusion is
also supported by the following observations.
First, EGCG reduced insulin-induced association of IRS1 with pRaf1 and pMEK1/2,
but not with Ras (Fig. 8). Second, EGCG reduced insulin-induced association of IRS-2
with Ras and pRaf-1, but not with pMEK1/2 (Fig. 9). Third, EGCG reduced
insulin-induced association of IRS3 with pRaf1, but not with Ras (Fig.10). Finally,
EGCG increasd insulin-induced association of IRS4 with Ras, pRaf1, and pMEK1/2(Fig.
11).
In this study, we found that EGCG reduced insulin-stimulated associations of insulin
receptor with IRS1 (Fig. 7A) and IRS2 (Fig. 7B). These results may be used to explain
the findings that EGCG significantly decreased insulin-induced increases in levels of
phospho-IRS1(Fig. 4B) and phospho-IRS2 (Fig. 4C). In addition, EGCG reduced
insulin-stimulated association of IRS with Ras, pRaf1, and pMEK1/2 . These results can
explain that EGCG significantly decreased insulin-induced increases in levels of
phospho-Raf1(Fig. 5A), phospho-MEK1/2(Fig. 5B), and phospho-ERK1/2(Fig. 5C).
Catechin-specific effects of green tea have been reported on the biological system and
cell functions based on the various laboratory studies (31-33). We found that, at the same
dose and duration of treatment, EGCG was more effective than other catechins to inhibit
insulin signaling in stimulating mitogenesis of 3T3-L1 preadipocytes. According to the
nature of their structures (Fig 1), the galloyl group in the C ring of EGCG seemed to be

13
responsible for its effects. Since the esterification of the galloyl group partially reflects
the hydrophobic force of EGCG (34), the hydrophobic interactions of EGCG with the
cellular components of 3T3-L1 preadipocytes, such as EGCG receptor (27), may
contribute in the inhibitory effects of EGCG on insulin-signaling. But, this will require
more thorough studies.
The 67-kDa laminin receptor has recently been found in cancer cells as an EGCG
receptor (27). It is responsible for the inhibitory effect of EGCG on growth of the
metastatic lung cancer cells more than of non-metastatic cells. Whether EGCG regulates
insulin signal pathway in 3T3-L1 preadipocytes through affecting its own receptor or
other growth factor’s receptor is still not clear. We observed herein that EGCG
stimulated the association of either IRS1, IRS2, or IRS4, but not IRS3, with the EGCG
receptor (Fig. 12). Besides, pretreatment with 67 LR antiserum can block the inhibitory
effect of EGCG on insulin-increased levels of pMEK1/2 (Fig. 13A) and pIRS2 (Fig.
13B). These results indicate the laminin receptor-dependent effect of EGCG on the
insulin signaling in preadipocytes. This study is similar to the reported findings by
Tachibana et al (27).
We can conclude that EGCG dose- and time-dependently decreased insulin-induced
increases in levels of phospho-insulin receptor (p-IR), phospho-insulin receptor substrates
1, 2, and 3 (pIRS1, pIRS2, and pIRS3), phospho-Raf1, phospho-MEK, and
phospho-Erk1/2 proteins. In addition, EGCG reduced the insulin-stimulated
associations of IR with IRS1 and IRS2. EGCG also reduced the association of these
two IRS proteins with their downstream signaling proteins. Moreover, EGCG was more
effective than epicatechin, epicatechin gallate, and epigallocatechin in changing the
insulin-stimulated mitogenic signals. Results of this study may relate to the
mechanism by which EGCG modulates insulin-related fat cell activity and body weight
as reported by Kao et al. (22) and Hung et al. (30).

14
References 1. Zick Y. (2001) Insulin resistance: a phosphorylation-based uncoupling of insulin
signaling. TRENDS in Cell Biology 11: 437-441 2. Pirola L , Johnston A M, and Obberghen EV. (2004) Modulation of insulin action.
Diabetologia 47:170.184 3. Kahn BB, Flier JS. (2000) Obesity and insulin resistance. The Journal of Clinical
Investigation 106: 473-481 4. Obberghen EV, Baron V, Delahaye L, Emanuelli B, Filippa N, Gioretti S, Lebrun
P, Mothe P, Peraldi P, Rocchi S, Sawka D. Tartare S, and Giudicelli J (2001) Surfing the insulin signaling web. European Journal of Clinical Investigation 31: 966-977
5. LeRoith L, Zick Y. (2001) Recent advances in our understanding of insulin action and
insulin resistance. Diabetes care 24: 588-597 6. Virkamaki A, Ueki K, Kahn CR. (1999) Protein-protein interaction in insulin
signaling and the molecular mechanisms of insulin resistance. J. Clin. Invest. 103: 931–943
7. Thirone ACP, Huang C, Klip A (2006) Tissue-specific roles of IRS proteins in insulin
signaling and glucose transport. TRENDS in endocrinology ad metabolism 17: 70-76 8. Johnston AM, Pirola L, Obberghen EV. (2003) Molecular mechanisms of insulin
receptor substrate protein-mediated modulation of insulin signaling. FEBS letters 546: 32-36
9. White MF (2002) IRS proteins and the common path to diabetes. Am J Physiol
Endocrinol Metab 283: 413-422
10. Tseng Y H, Ueki K, Kriauciunas K M, Kahn C R (2002) Differential roles of nsulin receptor substrates in the anti-apoptotic function of insulin-like growth factor-1 and insulin. The journal of biological chemistry 277: 31601-31611
11. Tamemoto H, Kadowaki T, Tobe K (1994) Insulin resistance and growth retardation
in mice lacking insulin receptor substrate-1 Nature 372: 182–186
12. Araki E., Lipes M A, Patti M E (1994) Alternative pathway of insulin signaling in mice with targeted disruption of IRS-1 gene. Nature 372: 186–190
13. Withers, D J, Gutierrez, J S, Towery H (1998) Disruption of IRS-2 causes type 2
diabetes in mice. Nature 391: 900–904

15
14. Liu S, Wang Q, Lienhard G E, and Keller S R (1999) Insulin receptor substrate 3 is
essential for growth or glucose homeostasis. J. Biol. Chem. 274: 18093–18099 15. Fantin V R, WangG E, Lienhard G E, and Keller S R (2000) Mice lacking insulin
receptor substrate 4 exhibit mild defects in growth, reproduction, and glucose homeostasis. Am. J. Physiol. 278: 127–133
16. Ahmad N and Mukhtar H. (1999)Green tea polyphenols and cancer: biologic
mechanisms and practical implications. Nutr Rev 57: 78–83 17. Liao S, Kao YH, and Hiipakka RA. (2001) Green tea: biochemical and biological
basis for health benefits. Vitam Horm 62: 1–94 18. Lin JK, Liang YC, and Lin-Shiau SY. (1999)Cancer chemoprevention by tea
polyphenols through mitotic signal transduction blockade. Biochem Pharmacol 58: 911–915
19. Mitscher LA, Jung M, Shankel D, Dou JH, Steele L, and Pillai SP.(1997)
Chemoprotection: a review of the potential therapeutic antioxidant properties of green tea (Camellia sinensis) and certain of its constituents. Med Res Rev 17: 327–365
20. Yang CS and Wang ZY.(1993)Tea and cancer. J Natl Cancer Inst 85:1038–1049 21. Wolfram S, Wang Y and Thielecke F. (2006) Anti-obesity effect of green tea: From
beside to bench. Mol. Nutr. Food Res 50: 176-187 22. Kao YH, Chang HH, Lee MJ, and Chen CL. (2006) Tea, obesity, and diabetes. Mol.
Nutr. Food Res 50:188-210 23. Mendel S and Youdim MB. (2004) Catechin polyphenols: neurodegeneration and
neuroprotection in neurodegenerative diseases. Free Radic Biol Med 37: 304–317
24. Haqqi TM, Anthony DD, Gupta S, Ahmad N, Lee MS, Kumar GK, and Mukhtar H. (1999)Prevention of collagen-induced arthritis in mice by a polyphenolic fraction from green tea. Proc Natl Acad Sci USA 96: 4524–4529
25. Kao YH, Hiipakka RA, and Liao S. (2000) Modulation of endocrine systems and food
intake by green tea epigallocatechin gallate. Endocrinology 141: 980–987 26. Kao YH, Hippakka RA, and Liao S. (2000) Modulation of obesity by a green tea
catechin. Am J Clin Nutr 72: 1232–1241 27. Tachibana H, Koga K, Fujimura Y, and Yamada K.(2004) A receptor for green tea
polyphenol EGCG. Nat Struct Mol Biol 11: 380–381 28. Niimi T, Kumagai C, Okano M, and Kitagawa Y. (1997) Differentiation dependent

16
expression of laminin-8 (alpha 4 beta 1 gamma 1) mRNAs in mouse 3T3-L1 adipocytes. Matrix Biol 16: 223–230
29. Bradford MM. (1976) A rapid and sensitive method for the quantification of
microgram quantities of protein utilizing the principle of protein-dye binding. Anal Biochem 72:248-254
30. Hung PF, Wu BT, Chen HC, Chen YH, Chen CL, Wu MH, Liu HC, Lee MJ, and
Kao YH. (2005) Antimitogenic effect of green tea (-)-epigallocatechin gallate on 3T3-L1 preadipocytes depends on the ERK and Cdk2 pathways. Am J Physiol Cell Physiol 288: C1094-1108
31. Tegos G, Stermitz FR, Lomovskaya O, and Lewis K. (2002) Multidrug pump
inhibitors uncover remarkable activity of plant antimicrobials. Antimicrob Agents Chemother 46:3133-3141
32. Cao Y, Cao R. (1999) Angiogenesis inhibited by drinking tea. Nature 398:381 33. Nakayama M, Suzuki K, Toda M, Okubo S, and Hara Y. (1993) Inhibition of the
infectivity of influenza virus by tea polyphenols. Antivir Res 21:289-299 34. Tang HR, Covington AD, and Hancock RA. (2003) Structure-activity relationships in the
hydrophobic interation of polyphenals with cellulose and collagen. Biopolymer 70: 403-13

17
Fig. 1. Chemical structures of four major green tea catechins. The differences among these catechins occur in the number of hydroxyl groups, the molecular weight, and the presence of a galloyl group.

18

19
Fig. 2. The effect of EGCG on insulin-induced phosphorylation of insulin receptor substrates (IRSs) and insulin receptor was dose dependent. The 3T3-L1 preadipocytes were cultured for 2 days and then starved for overnight. The cells were pretreated with EGCG (10, 20, and 50 μM) for 90 min, and then treated with 100 nM insulin for 5 min. (A) pIRS1 was measured by Western blot analysis, and corrected with β-actin. (B) pIRS2 was measured by Western blot analysis. (C) pIR was measured by Western blot analysis. Data are expressed as the means ± SE of duplicates within three independent experiments (*, P<0.05 versus insulin)

20

21
Fig. 3. The effect of EGCG on insulin-induced phosphorylation of insulin receptor substrates (IRSs) and insulin receptor was time dependent. The 3T3-L1 preadipocytes were cultured for 2 days and then starved for overnight. The cells were pretreated with EGCG (20 μM) for different time periods, and then treated with 100 nM insulin for 5 min. (A) pIRS1 was measured by Western blot analysis, and corrected with β-actin. (B) pIRS2 was measured by Western blot analysis. (C) pIR was measured by Western blot analysis. Data are expressed as the means ± SE of duplicates within three independent experiments.

22
Fig. 4. Inhibitory effect of EGCG on insulin-induced phosphorylation of insulin receptor substrates (IRSs) levels. 3T3-L1 preadipocytes were cultured for 2 days and then starved for overnight. Cells were pretreated with EGCG (20 μM) for 90 min, and then treated with 100 nM insulin for 5 min. (A) pIRS1 was measured by Western blot analysis, and was corrected with β-actin. (B) pIRS2 was measured by Western blot analysis. and corrected with β-actin. (C) Lysates were immunoprecipitated by IRS3 and then its phosphorylation levels were measured by Western blot with phosphotyrosine (pY) antibody. (D) Lysates were immunoprecipitated by IRS4 and then its phosphorylation levels were measured by Western blot with phosphotyrosine (pY) antibody. Data are expressed as the means ± SE of duplicates within three independent experiments (*, P<
0.05 versus insulin)

23

24
Fig. 5. Inhibitory effect of EGCG on insulin-induced levels of pRaf1, pMEK, and pERK proteins. Cells were pretreated with EGCG (20 uM) for 90 min, and then treated with 100 nM insulin for 5 min. (A) pRaf1 was measured by Western blot analysis, and was corrected with β-actin. (B) pMEK1/2 was measured by Western blot analysis. (C) pERK was measured by Western blot analysis. Data are expressed as the means ± SE of duplicates within three independent experiments.
25

26
Fig. 6. Catechin-specific effect of green tea on insulin-stimulated signaling. The 3T3-L1 preadipocytes were cultured for 2 days and then starved for overnight. The cells were pretreated with EC, ECG, EGC,or EGCG (20μM) for 90 min, and then treated with 100 nM insulin for 5 min. (A) pIR was measured by Western blot analysis, and was corrected with β-actin. (B) pIRS1 was measured by Western blot analysis. (C) pIRS2 was measured by Western blot analysis. (D) pMEK was measured by Western blot analysis.
27
Fig. 7. EGCG reduced insulin-stimulated interactions of insulin receptor with IRS1 and IRS2 proteins. The 3T3-L1 preadipocytes were cultured for 2 days and then starved for overnight. The cells were pretreated with EGCG (20 μM) for 90 min, and then treated with 100 nM insulin for 5 min. Cell lysates were immunoprecipitated with insulin receptor, and then detected with pIRS1 and pIRS2 by Western blot analysis.

28
29
Fig. 8. The effect of EGCG on insulin-stimulated interactions of IRS1 with Ras, pRaf1, and pMEK. The 3T3-L1 preadipocytes were cultured for 2 days and then starved for overnight. The cells were pretreated EGCG 20 μM for 90 min, then treated 100 nM insulin for 5 min. Cell lysates were immunoprecipitated with IRS1 then detected with IRS1 (A), pIRS1(B), Ras (C), pRaf1 (D), and pMEK1/2 (E) by Western blot analysis.

30

31
Fig. 9. The effect of EGCG on insulin-stimulated interactions of IRS2 with Ras, pRaf1, pMEK. The 3T3-L1 preadipocytes were cultured for 2 days and then starved for overnight. The cells were pretreated EGCG 20μM for 90 min, then treated 100 nM insulin for 5 min. Cell lysates were immunoprecipitated with IRS2 then detected with IRS2 (A), pIRS2(B), Ras (C), pRaf1 (D), and pMEK1/2 (E) by Western blot analysis.
32

33
Fig. 10. The effect of EGCG on insulin-mediated interactions of IRS3 with insulin signaling proteins. The 3T3-L1 preadipocytes were cultured for 2 days and then starved for overnight. The cells were pretreated EGCG 20 μM for 90 min, then treated 100 nM insulin for 5 min. Cell lysates were immunoprecipitated with IRS3 then detected with IRS3 (A), Ras(B), and pRaf1 (C) by Western blot analysis.

34

35
Fig. 11. The effect of EGCG on insulin-mediated interactions of IRS4 with insulin signaling proteins. The 3T3-L1 preadipocytes were cultured for 2 days and then starved for overnight. The cells were pretreated EGCG 20 μM for 90 min, then treated 100 nM insulin for 5 min. Cell lysates were immunoprecipitated with IRS4 then detected with Ras (A), pRaf1(B), and pMEK1/2 (C) by Western blot analysis.

36
37
Fig. 12. The effect of EGCG on insulin-mediated interaction of IRS proteins with laminin receptor. The 3T3-L1 preadipocytes were cultured for 2 days and then starved for overnight. The cells were pretreated EGCG 20μM for 90 min, then treated 100 nM insulin for 5 min. Cell lysates were immunoprecipitated with IRS1 (A), IRS2 (B), IRS3 (C), and IRS4 (4) respectively and then detected with laminin receptor by Western blot analysis.

38
Fig. 13. Laminin receptor antibody antagonized the inhibitory effects of EGCG on insulin-stimulated pMEK and pIRS2 levels. The 3T3-L1 preadipocytes were cultured for 2 days and then starved for overnight. The cells were pretreated with 67-kDa laminin receptor antibody (5 ug/ml) for 60 min, and then treated with EGCG (20 μM)for 90 min, and 100 nM insulin for another 5 min. (A) pMEK was measured by Western blot analysis, and was corrected with β-actin. (B) pIRS2 was measured by Western blot analysis.

39
Appendix 1. Medium: DMEM (Dulbecco’s modified Eagle medium), 3.7g NaHCO3, 10% FBS,
100 unit/ml Penicillin, and 100 µg/ml Streptomycin, add ddH2O to 1000 ml and adjust pH to 7.4. The medium was filtered through 0.2 µM top filter and then stored at 4°C.
2. 10× PBS: 8 g NaCl
0.2 g KCl 2.16 g NaHPO4•7H2O 0.2 g KH2PO4 add ddH2O to 1 L adjust pH to 7.4
3. Lysis buffer: 1 mM EDTA 1 mM PMSF 1 mM Na3VO4 (Phosphtase inhibitor) 20 mM Tris-HCl (pH 7.6) 0.2% Triton-X 100
4. 2× sample buffer: 100 mM Tris-Cl(PH 6.8) 4% SDS 20% glycerol 0.2% bromophenol blue 10 ml β-mecaptoethenol
5. 30% Acrylamide/bisacrylamide: 145 g acrylamide
5 g bisacrylamide add ddH2O to 500 ml
6. 4× lower (running) Tris buffer: Tris 36.34g add ddH2O 180 ml adjust pH to 8.8 then add ddH2O to 200 ml
7. 4× upper (stacking) Tris buffer: Tris 12.2 g add ddH2O 80 ml adjust pH to 6.8 then add ddH2O to 100 ml
40
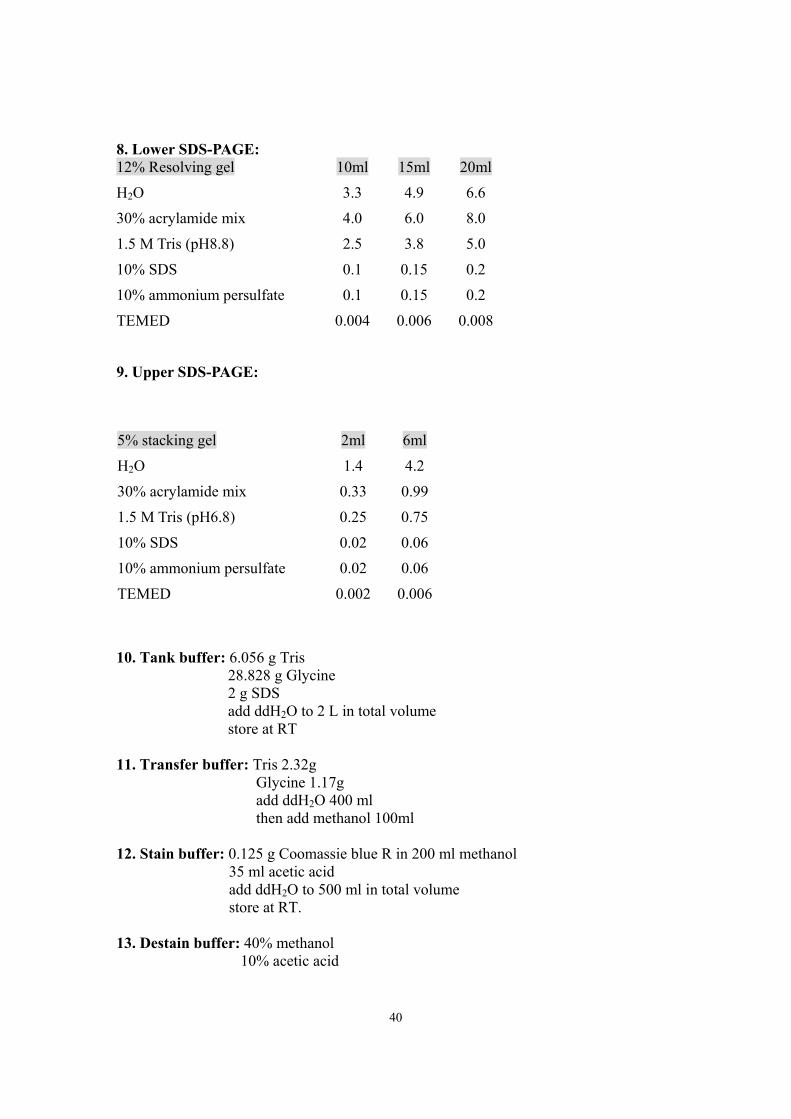
8. Lower SDS-PAGE: 12% Resolving gel 10ml 15ml 20ml
H2O 3.3 4.9 6.6
30% acrylamide mix 4.0 6.0 8.0
1.5 M Tris (pH8.8) 2.5 3.8 5.0
10% SDS 0.1 0.15 0.2
10% ammonium persulfate 0.1 0.15 0.2
TEMED 0.004 0.006 0.008
9. Upper SDS-PAGE:
10. Tank buffer: 6.056 g Tris 28.828 g Glycine 2 g SDS add ddH2O to 2 L in total volume store at RT
11. Transfer buffer: Tris 2.32g Glycine 1.17g add ddH2O 400 ml then add methanol 100ml
12. Stain buffer: 0.125 g Coomassie blue R in 200 ml methanol
35 ml acetic acid add ddH2O to 500 ml in total volume store at RT.
13. Destain buffer: 40% methanol 10% acetic acid
5% stacking gel 2ml 6ml
H2O 1.4 4.2
30% acrylamide mix 0.33 0.99
1.5 M Tris (pH6.8) 0.25 0.75
10% SDS 0.02 0.06
10% ammonium persulfate 0.02 0.06
TEMED 0.002 0.006
41
store at RT
14. PBST: 1X PBS 499.5 ml Tween-20 500 µl
15. 5% non-fat milk: 5 g in 100 ml PBST 16. Ampicillin stock solution: 100 mg ampicillin in 1 ml ddH2O store at -20°C