Interleukin-6-deficient mice develop hepatic inflammation and systemic insulin resistance
Upload
khangminh22Category
view
3download
0
Insulin Resistance and Its Treatment by Thiazolidinediones HAROLD E. LEBOVITZ AND MARY ANN BANERJI
State University of New York, Health Science Center at Brooklyn, Box 50, 450 Clarkson Avenue, Brooklyn, New York II203
ABSTRACT
Insulin resistance is a change in physiologic regulation such that a fixed dose of insulin causes less of an effect on glucose metabolism than occurs in normal individuals, The normal compensatory response to insulin resistance is an increase in insulin secretion that results in hyperinsulinemia. If the
hyperinsulinemia is sufftcient to overcome the insulin resistance, glucose regulation remains normal; if not, type 2 diabetes ensues. Associated with insulin resistance, however, is a cluster of other metabolic abnormalities involving body fat distribution, lipid metabolism, thrombosis and tibrinolysis,
blood pressure regulation, and endothelial cell function, This cluster of abnormalities is referred to as the insulin resistance syndrome or the metabolic syndrome. It is causally related not only to the development of type 2 diabetes but also to cardiovascular disease. A major unresolved issue is whether
there is a single underlying cause of this syndrome and, if so, what might it be? Several promising hypotheses have been proposed. There are some data to support the hypothesis that fetal malnutrition imprints on metabolic regulatory processes that, in later adult life, predispose to the development of
the insulin resistance syndrome. Visceral obesity also has been a candidate for the cause of the syndrome. Whatever mechanism is ultimately found to be responsible, it will undoubtedly have both
genetic and environmental components. Among the biochemical mediators that are likely to be responsible for the interference with insulin’s effects on intermediary metabolism are free fatty acids
and other products from adipose tissue. Recent data suggest that the substances stimulate serine phosphorylation of molecules involved in the initial steps of insulin action, thereby blocking the ability of these molecules to be tyrosine phosphotylated and initiate the subsequent steps of the insulin action
cascade. The thiazolidinediones are a new class of agents that have been developed to treat type 2 diabetic
patients, These drugs act as peroxisome proliferator-activated receptor gamma (PPARy) agonists. Following their binding to the receptor, the heterodimer molecule that contains the binding site is activated. The activated complex binds to the response elements of specific genes that regulate molecules that effect insulin action and lipid metabolism. These genes are either activated or inhibited.
Specifically, the thiazolidinediones improve insulin action and decrease insulin resistance. The exact mechanism by which these agents decrease insulin resistance is not clear but they do decrease the
elevated free fatty acid levels present in insulin-resistant patients and they appear to change the body distribution of adipose tissue. Treatment of insulin-resistant type 2 diabetic patients with thiazolidi-
nediones not only improves glycemic control and decreases insulin resistance, it also improves many of the abnormalities that are part of the insulin resistance syndrome.
265 Copyright 0 2001 by The Endocrine Society
All rights of reproduction in any form reserved

266 HAROLD E. LEBOVITZ & MARY ANN BANERJI
I. Introduction
Insulin resistance has been recognized since the 1930s. However, it was the development of sensitive assays for insulin and quantitative methods for estimat- ing insulin action that made it possible to define the scope of the problem and its clinical implications (Reaven, 1988; Zavaroni et al., 1989). Most individuals appear to develop insulin resistance when environmental factors interact with specific genetic predispositions that confer susceptibility (Stern, 1997; Samaras and Campbell, 2000). The key environmental factors responsible for the develop- ment of insulin resistance are abnormalities of nutritional intake (Samaras et al.,
1998), leading to fetal malnutrition and/or adult obesity and decreased physical activity. The genetic factors have yet to be clarified. Changing lifestyles through- out the world have resulted in as much as 16 to 25 percent of some adult populations having insulin resistance and an associated cluster of metabolic and cardiovascular risk factor abnormalities that have been termed “the metabolic syndrome.” Individuals with the metabolic syndrome are at increased risk to develop type 2 diabetes, polycystic ovarian syndrome (PCOS), and/or accelerated atherosclerosis with its accompanying cardiovascular complications.
The metabolic syndrome and its associated diseases have engendered exten- sive research into understanding the molecular mechanisms involved in causing insulin resistance and to develop pharmacologic agents to specifically treat insulin resistance and the metabolic syndrome. The thiazolidinediones represent such a new class of drugs that have been developed to treat insulin resistance. Inquiries into the mechanism of action of these drugs have led to our greatly expanded knowledge of peroxisome proliferator activated receptors (PPARs) and their role in human physiology (Willson et al., 2000). This chapter focuses on some of our studies to define the mechanisms responsible for insulin resistance, the metabolic syndrome, and its clinical consequences in humans and to understand the role that the thiazolidinediones may play in treatment.
II. Insulin Resistance and the Metabolic Syndrome: A Disease of Nutritional Intake?
Insulin resistance and the metabolic syndrome have been the subject of hundreds of reviews. An area of major interest to us has been the role of nutrition and its effect on body composition as a cause of insulin resistance and its associ- ated metabolic and cardiovascular risk factor abnormalities. Our identification of insulin-sensitive and insulin-resistant variants of type 2 diabetes in African Ameri- can populations in the late 1980s (Banerji and Lebovitz, 1989) gave us the opportunity to dissociate the pathogenesis of hyperglycemia from that of insulin resistance in type 2 diabetic patients. We observed several major differences between these two variants. Insulin-sensitive type 2 diabetics had a mean body

INSULIN RESISTANCE & THIAZOLIDINEDIONES 267
mass index (BMI) of 25.6 kg/m2; normal mean fasting plasma insulin levels; and normal insulin sensitivity, as measured by the euglycemic-hyperinsulinemic clamp (Banerji and Lebovitz, 1992; Chaiken et al., 1991). They had no evidence of diabetic dyslipidemia or increased blood pressure (Chaiken et al., 1993). In contrast, individuals with the insulin-resistant variant had a mean BMI of 30.2 kg/m2; were hyperinsulinemic and insulin resistant, as measured by the eugly- cemic-hyperinsulinemic clamp; and had classic diabetic dyslipidemia (Banerji and Lebovitz, 1989; Chaiken et al., 1991 ,I 993). A more-detailed analysis of our populations revealed that insulin resistance was rarely observed in African Ameri- can individuals with a BMI < 24.5 kg/m2; was almost always observed in those with a BMI > 28.5 kg/m2; and was present in about 50 percent of those with a BMI between 24.5 and 28.5 kg/m2 (Banerji and Lebovitz, 1992). These data suggested that body fat distribution, rather than generalized obesity, might be responsible for insulin resistance. Similar data on insulin-sensitive and insulin-re- sistant diabetic subjects have been reported in Caucasian and Oriental populations (Groop et al., 1993; Haffner et al., 1999; Taniguchi et al., 2000). Table I summa- rizes the differences that have been reported between insulin-sensitive and insu- lin-resistant type 2 diabetic patients.
Utilizing a computerized tomography (CT) technique involving 22 to 24 scans of the trunk, abdomen, and extremities and a computer program analysis, we were able to show that insulin sensitivity, as measured by the euglycemic hyperinsulinemic clamp, was negatively correlated with visceral adipose tissue volume in both men and women (Figure 1) and had no significant correlation with subcutaneous adipose tissue volume (Figure 2) (Banerji et al., 1995a,1997). We hypothesized that insulin sensitivity was determined to a significant degree by the volume of visceral adipose tissue mass. This relationship is a negative curvilinear one. The greatest impact in decreasing insulin resistance occurs when the visceral adipose tissue volume increases from 1.0 to 3.5 liters. The increase in visceral adipose tissue volume is significantly associated with the presence and magnitude of diabetic dyslipidemia.
Many other published studies support the hypothesis that visceral obesity plays a major role in causing insulin resistance (Lemieux et al., 1996; Boyko et al., 2000; Karter et al., 1996). Goodpaster and his associates (1997) initially reported in a cross-sectional study that insulin resistance correlated with subcuta- neous and thigh muscle fat independently of visceral fat. However, in a follow-up study of a group of patients who had undergone significant weight loss, the improvement in insulin sensitivity correlated with the change in visceral adipose tissue (Figure 3), rather than the change in subcutaneous adipose tissue (Good- paster et al., 1999). Longitudinal studies in Japanese Americans over a j-year period showed that accumulation of visceral adipose tissue predicts the develop- ment of insulin resistance and type 2 diabetes (Boyko et al., 2000). Cross-sectional and longitudinal studies carried out by Despres and colleagues likewise have

268 HAROLD E. LEBOVITZ & MARY ANN BANERJI
TABLE I Dl@rences in Metabolic Projles Between insulin-sensitive
and Insulin-resistant Type 2 Diabetic Patients
Metabolic Parameter Insulin Sensitive Insulin Resistant
Hyperglycemia
Hyperinsulinemia
Central obesity
Diabetic dyslipidemia
? Plasma triglycerides
4 Plasma HDL cholesterol
Small, dense LDL pattern
Pro-coagulant state
? Plasma fibrinogen
‘? Plasma PAI-I
Hypertension
Yes
No
No
No
No
No
No
No
Not ? (?)
Yes
Yes
Yes
Yes
Yes
Yes
Yes
Yes
‘? in normal weight but not in obese
[Table reflects results of studies in Banerji, M.A., and Lebovitz, H.E. Diabetes 38, 784-782, 1989; Banerji, M.A., and Lebovitz, H.E. Diabefes Care 15, 1295-1302, 1992; Banerji, M.A., Chaiken, R.L., Gordon, D., Kral, J.G., and Lebovitz, H.E. Diabefes 44, 141-146, 1995; Banerji, M.A., Lebovitz, J., Chaiken, R.L., Gordon, D., Kral, J.G., and Lebovitz, H.E. Am. J. Physiol. 273, E425E432, 1997; Chaiken, R.L., Banerji, M.A., Pasmantier, R.M., Huey, H., Hirsch, S., and Lebovitz, H.E. Diabefes Care 14, 1036-1042, 1991; Chaiken, R.L., Banerji, M.A., Huey, H., and Lebovitz, H.E. Diabetes 42, 444-449, 1993; Haffner, S.M., Rewers, M., D’Agostino, R. Jr., Selby J., Mykkanen, L., Savage, P.J., Tracy, R., Saad, M.F., and Howard, B.V. Diabetes Care 22,562-568, 1999; Taniguchi, A., Fukushima, M., Sakai, M., Kataoka, K., Miwa, K., Nagata, I., Doi, K., Arakawa, H., Nagasaka, S., Tokuyama, K., and Nakai, Y. Metabolism 49, 1001-1005, 2000.1
shown that insulin resistance and the metabolic syndrome appear to be caused by an increase in visceral adipose tissue mass (Lemieux et al., 1996).
Not all studies have supported the concept that visceral obesity is the cause of insulin resistance (Abate et al., 1995). Several technological reasons can ac- count for the failure of a study to show an independent relationship between visceral adipose tissue mass and insulin resistance. The negative curvilinear rela- tionship between insulin action and visceral adipose tissue volume shown in our studies and implied from the weight loss studies of Goodpaster (Figures 1 and 3) indicate that attempting to measure any relationship in severely obese people

INSULIN RESISTANCE & THIAZOLIDINEDIONES 269
18- I&-
A Women Cl Men
8 8 2- 2- I I I I 1 1 I I I I
1,000 1,000 2,000 2,000 3,000 3,000 4,000 4,000 5,000 5,000 Visceral adipose tissue volume Visceral adipose tissue volume per unit surface area (mL/m*) per unit surface area (mL/m*)
FIG. I. Relationship between visceral adipose tissue volume and insulin action in African- American type 2 diabetic men and women. Visceral adipose tissue volume was determined from multiple CAT scans through the abdominal region by a computer program that integrates the data from individual scans. Insulin sensitivity was determined by the euglycemic-hyperinsulinemic clamp technique. The relationship is highly statistically significant (r = 0.54; P < 0.002) and is clearly curvilinear. [Reprinted with permission from Banerji, M.A., Lebovitz, J., Chaiken, R.L., Gordon, D., KraI, J.G., and Lebovitz, H.E. Am. J. Physiol. 273, E425-E432, 1997.1
would be meaningless, since the slope of the curve is likely to be flat. The use of a single CAT scan or magnetic resonance imaging (MRI) slice may give an imprecise estimate of the total visceral and subcutaneous adipose tissue volumes (Samaras and Campbell, 2000). Finally, it is important to recognize that it is the flux of active substances from the visceral adipose tissue that is likely to be causing the metabolic effects and that volume is a crude estimate of what may be the flux. It is important to note that visceral obesity does have a significant relationship to total obesity. However, there are striking differences among indi- viduals in the percent of their total body fat deposited in their visceral adipose tissue. In our studies, this can vary by as much as three- to four-fold and appears to be genetically determined (Banerji et al., 1995a).
The mechanism by which an increase in visceral adipose mass causes insulin resistance and its associated metabolic and cardiovascular abnormalities has not been clearly defined. It is postulated that insulin resistance results from the direct

270 HAROLD E. LEBOVITZ & MARY ANN BANERJI
18r
A Women (1 Men
” 0 5,000 10,000 15,000 20,000 25,000 Total subcutaneous adipose tissue volume
per unit surface area (mL/m*)
FIG. 2. Lack of relationship between total subcutaneous adipose tissue volume and insulin action in African-American type 2 diabetic men and women Subcutaneous adipose tissue volume was determined from 22 to 24 CAT scans and calculated by a computer program that integrates the data. Insulin sensitivity was determined by the euglycemic-hyperinsulinemic clamp technique. The corre- lation coefficient was 0.24, which was not statistically significant. [Reprinted with permission from Banerji, M.A., Lebovitz, J., Chaiken, R.L., Gordon, D., Kral, J.G., and Lebovitz, H.E. Am. J. Physiol.
273, E425-E432, 1997.1
flux of active factors such as free fatty acids and perhaps tumor necrosis factor alpha (TNFa) from the visceral adipose tissue through the portal vein into the liver and beyond into the peripheral tissues (Figure 4). Abdominal adipose tissue is known to have a high rate of lipolysis and a rapid turnover of free fatty acids (Rebuffe-Strive et al., 1989; Boden, 1996). Increased flux of free fatty acids into the liver increases very-low-density lipoprotein (VLDL) particle synthesis and hepatic triglyceride concentrations (Brunzell and Hokanson, 1999). It therefore would be expected - and, indeed, has been shown -that an increase in visceral adipose tissue mass is associated with an increase in hepatic (Figure 4) as well as intramuscular triglycerides and circulating plasma triglycerides (Banerji et al.,
1995b). Hepatic sensitivity to insulin as well as hepatic clearance of insulin are thought to be reduced by increases in hepatic triglycerides. Free fatty acids and

16 1
14 -
22 - LL go - rip-
E6 u4 - Q!
2-
INSULIN RESISTANCE & THIAZOLIDINEDIONES 271
A Lean control subjects 0 Obese subjects before weight loss a Obese subjects after weight loss
0
0 ’ 0 50 100 150 200 250 300 350 400
Visceral adipose tissue (cm2)
FIG. 3. Relationship between visceral adipose tissue and insulin sensitivity in lean control subjects, obese subjects before weight loss, and the same obese subjects after weight loss. Visceral adipose tissue area was determined as the area in a CAT scan through L4-5. Insulin sensitivity was determined by the euglycemic-hyperinsuhnemic clamp technique. The data show that insulin sensi- tivity changes in a curvilinear fashion in relationship to visceral adipose tissue area. [Data from Goodpaster, B.H., Kelley, D.E., Wing, R.R., Meier, A., and Thaete, F.L. Diabetes 48,839-847, 1999.1
TNFo both have been shown to cause peripheral insulin resistance. The exposure of the liver to these and other products of adipose tissue release is likely to be much greater from visceral that from subcutaneous adipose tissue. Free fatty acids cause insulin resistance in human skeletal muscle by interfering with the effect of insulin ,in increasing Glut-4-mediated glucose transport across the plasma mem- brane (Cline et al., 1999). The molecular mechanism for this interference in insulin action appears to be the consequence of a reduction in insulin receptor substrate-l (IRS-I)-associated phosphatidylinositol 3-kinase (PI-3-kinase) activ- ity (Dresner et al., 1999). It has been suggested that free fatty acids activate an intracellular serine kinase, leading to phosphorylation of serine sites on IRS-l and/or the insulin receptor, reducing their abilities to be activated by tyrosine phosphorylation. The role of TNFa in the pathogenesis of human insulin resis- tance is controversial. Studies in rodents show unequivocally that TNFol is a mediator of insulin resistance. It appears to activate phosphorylases that phospho-

272 HAROLD E. LEBOVITZ & MARY ANN BANERJI
0.15 0.20 0.26 Km
Visceral/total adipose tissue ratio
FIG. 4. Liver fat is highly correlated with visceral adipose tissue volume. [Data from Banerji, M.A., Buckley, M.C., Chaiken, R.L., Gordon, D., Lebovitz, H.E., and Kral, J.G., Ml. J. Obesi& 19, 846-850, 1995.1
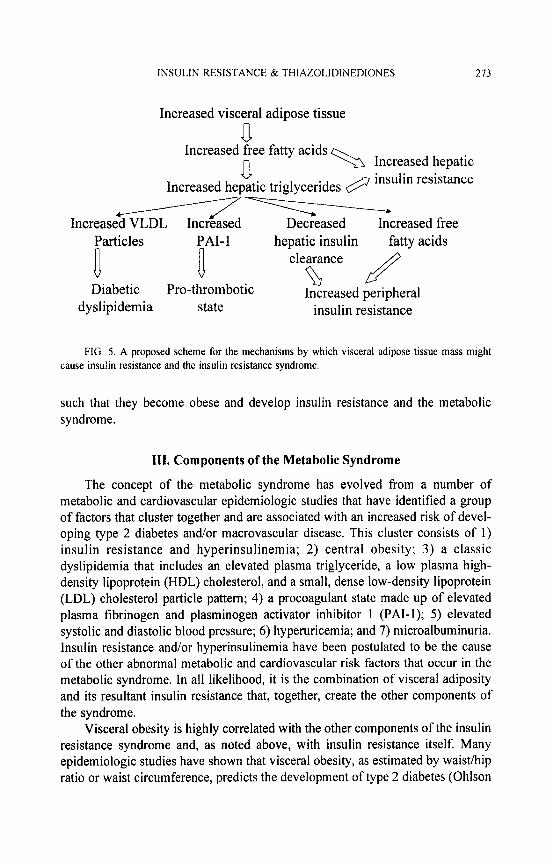
rylate serines on IRS-l and/or PI-3-kinase and reduces their ability to be activated by insulin (Hotamisligil and Spiegelman, 1994). While the direct drainage of high concentrations of free fatty acids into the liver increases hepatic VLDL triglyceride synthesis, causes an increase in hepatic steatosis, and is likely to cause insulin resistance at the level of the hepatocyte, other effects on hepatic function have not been appropriately assessed. An overview of our hypotheses of the mechanisms by which visceral adiposity could cause insulin resistance and the insulin resistance syndrome is outlined in Figure 5.
Another factor that is assuming increasing importance in our attempts to understand the pathogenesis of insulin resistance and the metabolic syndrome is fetal malnutrition. Many epidemiologic studies have shown a significant relation- ship between low birth weight and the subsequent development of type 2 diabetes, insulin resistance, and the metabolic syndrome in later adult life (Barker et al., 1993; Bavdekar et al., 1999; Dabelea et al., 1999). These low birth weight babies have a tendency to be overweight adults. The hypothesis that has been formulated is that fetal malnutrition causes the induction of metabolic pathways in the fetus to maximally conserve nutrients (Phillips et al., 1998). These imprinted pathways then persist throughout the life of the individual. The lifestyle of our current society provides these individuals with excess food and reduced physical activity
INSULIN RESISTANCE & THlAZOLlDINEDlONES 273
Increased visceral adipose tissue
a Increased free fatty acids
n -3 Increased hepatic
Increased hegtic triglycerides @ insulin resistance
-- ncreased VLDL Increased Decreased Increased free
Particles PAI- 1
a a
hepatic insulin fatty acids clearance
LR Diabetic Pro-thrombotic a
Increased peripheral dyslipidemia state insulin resistance
FIG. 5. A proposed scheme for the mechanisms by which visceral adipose tissue mass might cause insulin resistance and the insulin resistance syndrome.
such that they become obese and develop insulin resistance and the metabolic syndrome.
III. Components of the Metabolic Syndrome
The concept of the metabolic syndrome has evolved from a number of metabolic and cardiovascular epidemiologic studies that have identified a group of factors that cluster together and are associated with an increased risk of devel- oping type 2 diabetes and/or macrovascular disease. This cluster consists of 1) insulin resistance and hyperinsulinemia; 2) central obesity; 3) a classic dyslipidemia that includes an elevated plasma triglyceride, a low plasma high- density lipoprotein (HDL) cholesterol, and a small, dense low-density lipoprotein (LDL) cholesterol particle pattern; 4) a procoagulant state made up of elevated plasma fibrinogen and plasminogen activator inhibitor 1 (PAI-1); 5) elevated systolic and diastolic blood pressure; 6) hyperuricemia; and 7) microalbuminuria. Insulin resistance and/or hyperinsulinemia have been postulated to be the cause of the other abnormal metabolic and cardiovascular risk factors that occur in the metabolic syndrome. In all likelihood, it is the combination of visceral adiposity and its resultant insulin resistance that, together, create the other components of the syndrome.
Visceral obesity is highly correlated with the other components of the insulin resistance syndrome and, as noted above, with insulin resistance itself. Many epidemiologic studies have shown that visceral obesity, as estimated by waist/hip ratio or waist circumference, predicts the development of type 2 diabetes (Ohlson

274 HAROLD E. LEBOVITZ & MARY ANN BANERJI
et al., 1985; Okosun et al., 1998), hypertension (Okosun et al., 1998), and cardiovascular disease (Larsson et al., 1984; Lapidus et al., 1984; Rexrode et al., 1998).
IV. Thiazolidinediones: A Class of Agents That Are PPARy Agonists
The thiazolidinediones were discovered during the screening of a number of compounds for lipid-lowering effects. They were noted to decrease hyperglycemia and hyperinsulinemia in several rodent models of insulin resistance. Three thia- zolidinediones have been studied extensively and used clinically in humans: troglitazone, rosiglitazone, and pioglitazone. Troglitazone was introduced first, so more information is available about its effects. Because of severe idiosyncratic liver toxicity leading to hepatic failure and death, troglitazone was removed from the market in March 2000. Rosiglitazone and pioglitazone have been approved for clinical use since the spring and summer of 1999, respectively. The major structural differences in the three thiazolidinediones are in their side chains (Will- son et al., 2000). Troglitazone combines a vitamin E structural moiety with a glitazone moiety. The thiazolidinediones (or glitazones, as they are commonly called) are ligands for a PPAR complex located within the nucleus (Lehmann et al., 1995). The PPAR family consists of three distinct types (PPARa, PPARy, PPARG), each of which has unique functions. All three thiazolidinediones have been shown to have only PPARy agonist activity (Lehmann et al., 1995; Willson et al., 2000). None of them has been shown to have any significant PPAR~L or PPARG activity in binding assays. The three thiazolidinediones have significantly different binding affinities for the PPARy receptor, with rosiglitazone having the greatest binding affinity, troglitazone the least, and pioglitazone intermediate. The binding affinities correlate reasonably well with the therapeutic doses that are effective in treating hyperglycemia in insulin-resistant type 2 diabetes in humans.
The mechanism of action of thiazolidinediones involves their binding to the nuclear PPARy receptor. PPARy receptors are part of a heterodimer that includes an retinoid X receptor (RXR) (Olefsky, 2000). This heterodimer is involved in the control of various aspects of lipid and carbohydrate metabolism. When thia- zolidinediones bind to the PPARy receptor, the heterodimer attaches to the PPARy response elements within the promoter domains of specific target genes and modifies their interactions with co-repressor and coactivator elements. This results in either activation or inhibition of specific gene transcription (Saltiel and Olefsky, 1996; Whitcomb and Saltiel, 1995). PPARy receptors are of two subtypes. PPARy2 is found in high concentrations in adipocytes. Muscle contains PPARyl and its concentration is about 10 to 15 percent that of PPARy receptors in adipose tissue (Kruszynska et al., 1998). PPARy2 is a splice variant of PPARyl containing

INSULIN RESISTANCE & THIAZOLIDINEDIONES 215
30 additional amino-terminal amino acids (Willson et al., 2000). PPARr agonists promote the differentiation of precursor cells to adipocytes as well as promote the differentiation of many other cell types. PPARr receptors are abundant in other cells (e.g., macrophages, endothelium, vascular smooth muscle, colon epithe- lium).
The molecular mechanisms of thiazolidinedione action are quite complex. Recent studies have suggested that the various thiazolidinediones may have dif- ferential effects in some tissues (Walker et al., 1998; Camp et al., 2000). Studies with heterozygous PPARy knockout mice show paradoxical effects to those that would be expected (Kadowaki, 2000; Miles et al., 2000). These mice have normal adipose tissue development and normal glucose metabolism. However, they have an enhanced sensitivity to insulin, rather than the expected insulin resistance. PPARy activation by thiazolidinediones to improve insulin sensitivity and pro- mote adipose cell differentiation must be more complex than previously thought. The potential implications of these data have been reviewed recently by Olefsky (2000).
A. EFFECTS OF THIAZOLIDINEDIONES ON ADIPOSE TISSUE
Specific effects of thiazolidinediones are most dramatic on adipose tissue cell differentiation. Incubation of 3T3 fibroblast cells with thiazolidinediones in tissue culture causes cells to differentiate into adipocytes (Kreutter et al., 1990). This differentiation causes the expression of a number of genes, including those coding for glycerol phosphate dehydrogenase, Glut 4 glucose transporter, fatty acid binding protein aP2, and adipsin (Wu et al., 1998). In obese Zucker rats, admini- stration of troglitazone for 15 days increased the number of small adipocytes approximately four-fold in both subcutaneous and retroperitoneal adipose tissue (Okuno et al., 1998). At the same time, it decreased the number of large adipocytes by approximately 50 percent. These effects were associated with a 2.5-fold in- crease in apoptotic nuclei in retroperitoneal adipose tissue and a reduction in adipose tissue expression of TNFo and leptin. Plasma triglyceride levels were significantly reduced. In humans, rosiglitazone has been shown to increase the differentiation of subcutaneous adipose tissue stem cells into adipocytes but to have no effect on the differentiation of omental (visceral) adipose tissue stem cells into adipocytes (Adams et al., 1997). These effects on adipose tissue are of considerable importance because the presence of so few PPARy receptors in muscle has raised the speculation that the primary effect of PPAR7 activation in decreasing insulin resistance may be secondary to its effects on adipose tissue, rather than a direct effect on muscle. This is unresolved, as there are some data to support a direct action on muscle. A small number of PPAR? receptors are found in muscle (Kruszynska et al., 1998); thiazolidinediones do improve insulin

216 HAROLD E. LEBOVITZ & MARY ANN BANERJI
action on glucose transport in muscle in vitro (Ciaraldi et al., 1990); and thiazolid- inediones improve insulin sensitivity in insulin-resistant transgenic mice in which most adipose tissue has been ablated (Burant et al., 1997). Two human studies of short duration, with a limited number of patients and using CAT or MRI scans, have reported that troglitazone has a differential effect on body fat in type 2 diabetic patients. Mori and colleagues (1999) found that 6 months’ treatment with 400 mg/day increased subcutaneous fat but had either no effect or caused a small decrease in visceral fat mass. Kelly and coworkers (1999) reported that 12 weeks’ treatment with 600 mg daily decreased intra-abdominal fat mass but had no effect on either total fat or subcutaneous fat mass. Preliminary results of our large, ongoing investigation into the effects of rosiglitazone 8 mg daily for six months on body composition in type 2 diabetic patients are shown in Table II. After 6 months of treatment, our first 16 patients had a 2.53-kg mean increase in body weight, Total body fat increased as a result of an increase in subcutaneous adipose tissue mass, No significant change occurred in the visceral adipose tissue mass. Overall, the limited data available on the effects of thiazolidinediones on body composition in humans suggest that the thiazolidinediones cause a modest in- crease in subcutaneous adipose tissue mass but appear to have little or minimal effects on visceral fat mass. The effects on hepatic triglycerides independent of improved glycemic control are unknown.
B. EFFECTS OF THIAZOLIDINEDIONES ON INSULIN RESISTANCE
In animal models of insulin resistance, thiazolidinediones have been shown to be remarkably efficacious in improving insulin sensitivity. They frequently restore insulin sensitivity to normal. When thiazolidinediones have been admin-
TABLE II Effect of 6 Months’ Treatmenr with Rosiglitazone on
Body Composition in 16 Type 2 Diabetic Patients
Parameter Baseline
Weight (kg) 81.8+3.38
BMI (kg/m’) 29.75 k 1.10
Abdominal SQ adipose tissue (liters) 8.69 f 0.91
Visceral adipose tissue (liters) 3.75 f 0.31
Total body fat (percent) 36.06 + 2.82
Total lean body mass (liters) 45.59 it 2.59
Change Significance
2.53 f 0.87 0.011
0.99 f 0.34 0.011
0.68 f 0.3 1 0.046
0.04 f 0.09 0.631
1.05 It 0.62 0.113
0.70 It 0.28 0.026

INSULIN RESISTANCE & THIAZOLIDINEDIONES 277
istered to humans with type 2 diabetes and insulin resistance, the effects in reported studies have been more modest (Saleh er al., 1999; Olefsky, 2000). Insulin action in muscle, as measured by the euglycemic-hyperinsulinemic clamp technique, has been reported to increase anywhere from 30 to 54 percent but usually not into the normal range. Recently, the HOMA (Homeostasis Optimal Model Assessment) model, which assesses insulin resistance from a computer-de- rived model using simultaneously measured fasting plasma glucose and insulin, has been validated as an acceptable method for quantifying insulin action in population-based studies (Haffner et al., 1996; Bonora et al., 2000). We have used this model to analyze the effect of rosiglitazone monotherapy on insulin sensitivity in a large population of type 2 diabetic patients. In this population of patients with mean hemoglobin A lc (HbAlc) of approximately 7.8 percent, rosiglitazone 2 mg twice a day improved insulin sensitivity by 23.9 percent and 4 mg twice a day by 32.5 percent, when compared to the placebo-treated controls (Lebovitz et al., in press).
A major question that remains to be answered is what is the mechanism by which thiazolidinediones decrease insulin resistance? Since a major target of the thiazolidinediones is adipose tissue and the quantity of PPARy receptors in muscle is one tenth that in adipose tissue (Kruszynska et al., 1998) it has been speculated that the improvement in insulin action in muscle is secondary to PPARy action on adipose tissue. Several consequences of PPARy action on adipose tissue could be involved. Thiazolidinediones cause a significant decrease in the release of free fatty acids and TNFcl from adipose tissue. This results in a significant decline in plasma levels of these factors and, as might be expected from their known effects in causing insulin resistance, an improvement in insulin action. The impressive magnitude of suppression of fasting plasma free fatty acids by rosiglitazone treatment of type 2 diabetics is shown by our recent data summarized in Table III. A second and somewhat intriguing possibility is that of a redistribution of adipose tissue mass from the central compartment of visceral, hepatic, and intra- muscular sites to the peripheral subcutaneous depot. Since insulin resistance is mediated by the central pool of adipose tissue, including hepatic and intramuscular triglycerides (Banerji et al., 1995b,1997; Pan et al., 1997) and not by the periph- eral pool, this would reduce insulin resistance. These two mechanisms are not mutually exclusive. As discussed previously, a direct action of thiazolidinediones on muscle cannot be excluded.
The effects of thiazolidinediones in directly improving insulin sensitivity at the level of the liver, as assessed by improvement in insulin-mediated suppression of hepatic glucose production, are significantly less impressive than their effects in improving insulin-mediated glucose muscle uptake by skeletal muscle (Inzuc- chi et al., 1998; Maggs et al., 1998; Yu et al., 1999). Several studies in which type 2 diabetic patients were treated with as much as 400 to 600 mg of troglitazone

278 HAROLD E. LEBOVITZ & MARY ANN BANERJI
TABLE III Effect of 26 Weeks ’ Treatment with Rosiglitazone on Plasma Free Fat@ Acids in Type 2 Diabetic Patients
Mean Decrease with Change with Treatment Baseline (mg/dl) Treatment (mg/dl) Treatment (%)
Placebo 19.0 iz 6.8a -0.9It: 7.6 -4.7
Rosiglitazone, 2 mg twice 19.2 k 7.6 -4.2 f 7.9 -21.9 daily
Rosiglitazone, 4 mg twice 18.5 zt 7.8 -4.5 + 8.0 -24.3 daily
[Data from Lebovitz, H.E., Dole, J.F., Patwardhan, R., Rappaport, E.B., and Freed, M.I. J. Clin. Endocrinol. Metab. 85, in press.] a19.0 mg/dl is approximately 670 pmolll.
per day were unable to show a significant improvement in insulin-mediated suppression of hepatic glucose production (Inzucchi et al., 1998; Maggs et al., 1998). These studies were done using the euglycemic-hyperinsulinemic clamp technique. The lack of a significant effect raises the possibility that the improve- ment in fasting plasma glucose seen during thiazolidinedione treatment of type 2 diabetes is not a primary effect on the liver but may be secondary to some of the other beneficial effects of these drugs.
C. THIAZOLIDINEDIONE EFFECTS ON THE DYSLIPIDEMIA ASSOCIATED WITH TYPE 2 DIABETES AND INSULIN RESISTANCE
The characteristic lipid abnormalities present in type 2 diabetic patients with insulin resistance are an increase in plasma triglycerides and a decrease in plasma HDL cholesterol (Bnmzell and Hokanson, 1999; Stern, 1997). Plasma LDL cho- lesterol concentration is within the range seen in nondiabetics; however, the size and buoyancy of the LDL particle is different in that it is smaller and more dense (Festa et al., 1999). The small, dense LDL particles are more susceptible to oxidation and glycation and penetrate the vascular endothelium more readily. These changes are all associated with an increase in the development of cardio- vascular disease in general and coronary heart disease in particular. Additionally, poor glycemic control causes an increase in VLDL particles, contributing further to the rise in plasma triglycerides.
Treatment of human type 2 diabetic patients with thiazolidinediones amelio- rates many of these lipid abnormalities. Published data from the various U.S. clinical trials with troglitazone demonstrated a consistent 15 to 20 percent de- crease in fasting triglycerides, a variable but approximately 10 percent rise in

INSULIN RESISTANCE & THIAZOLIDINEDIONES 279
plasma LDL cholesterol, and an inconsistent effect on plasma HDL cholesterol (Willson et al., 2000). LDL particle size was found to be increased by troglitazone treatment in one small study (Tack et al., 1998a). Troglitazone treatment has been reported to increase the resistance of LDL cholesterol to oxidation (Noguchi et al., 1996). Data presented in the package prescribing information for pioglitazone show that treating type 2 diabetic patients in the clinical trials with pioglitazone resulted in a small, though statistically insignificant, rise in plasma LDL choles- terol, approximately a 6 percent rise in plasma HDL cholesterol, and a 14 percent decrease in fasting plasma triglyceride, as compared to the placebo-treated control group. Rosiglitazone treatment of type 2 diabetic patients in the clinical trials showed approximately a 9 to 14 percent increase in plasma LDL cholesterol, a 5 to 15 percent increase in plasma HDL cholesterol, and no significant change in fasting plasma triglycerides (Fonseca et al., 2000; Lebovitz et al., in press).
Interpretation of data on the effects of various thiazolidinediones on plasma lipids from several clinical trials is confounded by a number of variables. VLDL particle synthesis is increased when glycemic control is poor. Thus, baseline fasting plasma triglycerides are a function of the degree of hyperglycemia as well as the level of insulin resistance and hyperinsulinemia. When evaluating the effects of different thiazolidinediones on fasting plasma triglycerides, data can be compared only if the baseline hyperglycemia and degree of improvement are comparable and if the baseline fasting plasma triglyceride levels are approxi- mately in the same range. Patient populations with high baseline fasting plasma triglycerides and very poor glycemic control would be expected to show signifi- cant decreases in plasma triglycerides, while those with somewhat lower baseline plasma triglycerides and better baseline glycemic control would be expected to show little change. The interpretation of the changes in LDL cholesterol must consider whether the LDL cholesterol value is calculated by the Friedewald formula or is directly measured and the magnitude of the baseline LDL cholesterol value. Additionally, it is necessary to determine whether the change in plasma LDL cholesterol concentration is a change in the number of LDL particles or in particle size and composition (small, dense vs. large, fluffy). It appears most likely that the subtle differences in effects on plasma lipids reported for the various thiazolidinediones reflect differences in the characteristics of the populations studied, rather than differences in the properties of the drugs. None of the thia- zolidinediones studied have any significant PPARa activity.
Interpretation of the clinical relevance of the thiazolidinedione-mediated changes in plasma lipids is, at best, speculative. The lowering of plasma triglycerides, when elevated, as well as the consistent increase in plasma HDL cholesterol and a decrease in LDL cholesterol/HDL cholesterol ratio would be expected to reduce cardiovascular risk. The rise in plasma LDL cholesterol con- centration should increase cardiovascular risk but is likely to be offset by the

280 HAROLD E. LEBOVITZ & MARY ANN BANERJI
improvement in the LDL particle pattern. The evidence supports the supposition that overall cardiovascular risk would be lower. However, clinical outcome data are essential to answer this key question. This is even more critical, since there are several reports that the thiazolidinediones increase lipoprotein a (Lp(a)) levels.
D. EFFECTS OF THIAZOLIDINEDIONES ON GLYCEMIC CONTROL IN TYPE 2 DIABETIC PATIENTS
A number of peer-reviewed publications have described the effects of trogli- tazone on glycemic control in type 2 diabetic patients. These have been reviewed in detail by Saleh and associates (1999). I will summarize the data briefly, since troglitazone is no longer available for clinical use, but the data do provide a background for evaluating new information on currently available agents. Several studies in which troglitazone was used as monotherapy for the treatment of type 2 diabetic patients who were not adequately controlled on dietary and other aspects of lifestyle management showed that troglitazone was only mildly effec- tive in improving glycemic control (Fonseca et al., 1998; Maggs et al., 1998). When administered to drug-na’ive patients, troglitazone 400 and 600 mg/day caused 0.7 and 1.1 percent absolute decreases in baseline HbAlc values, respec- tively. When troglitazone or placebo was administered to patients who had pre- viously been on sulfonylurea treatment and washed out, troglitazone 400 and 600 mg/day resulted in improved glycemic control, when compared to placebo. How- ever, the baseline HbAlc in all groups rose a minimum of 1 percent, indicating that the doses of troglitazone administered were not able to maintain glycemic control as well as the sulfonylurea drugs that the patients had been taking (Fonseca et al., 1998). In contrast to its relatively weak effect in improving glycemic control as monotherapy, troglitazone, when added to the treatment program of type 2 diabetic patients taking sulfonylureas or insulin, had a very significant effect in lowering HbAlc an additional 1.75 or 1.4 percent, respectively, at the maximal dose of troglitazone administered (Horton et al., 1998; Schwartz et al., 1998). The major lessons concerning use of thiazolidinediones in improving glycemic control in type 2 diabetic patients that were learned from the troglitazone clinical trials were that thiazolidinediones are ineffective unless adequate endogenous insulin secretion is still present. If it is not, then insulin secretion must be stimulated by insulin secretagogues or replaced by some form of exogenous insulin.
Rosiglitazone and pioglitazone appear to be more potent as monotherapies than troglitazone but the same principles apply to their use in improving glycemic control (Lebovitz et al., in press). In order for any of the thiazolidinediones to be effective as monotherapy, endogenous insulin secretion needs to have been pre- served. Monotherapy treatment of type 2 diabetic patients with thiazolidinediones is no more effective in improving glycemic control than is treatment with sulfony- lureas, metformin, or insulin. The main advantages of thiazolidinediones as mono-

INSULIN RESISTANCE & THIAZOLIDINEDIONES 281
therapy reside in their ability to reduce insulin resistance at the same time that they are improving glycemic control. The improvement in insulin resistance results in amelioration of many components of the metabolic syndrome: the dyslipidemia, the procoagulant state, and the hyperinsulinemia (Fonseca et al.,
2000; Lebovitz et al., in press). Additional potential benefits of reducing insulin resistance are preservation of beta-cell function and anti-atherogenic effects on blood vessels (Mykkanen et al., 1997; Berkowitz et al., 1996; Li et al., 2000).
We have participated in studies of the effects of monotherapy treatment of type 2 diabetic patients inadequately controlled by diet and lifestyle changes with rosiglitazone 2 mg twice a day and 4 mg twice a day for 6 months (Lebovitz et
al., in press). The patients selected for this large, multicenter trial were 27 percent drug nafve and 73 percent washed out from a previous therapy. Rosiglitazone 2 mg twice a day and 4 mg twice a day decreased HbA 1 c 0.3 and 0.6 percent from baseline and 1.2 and 1.5 percent from placebo treatment. The decrease in HbA lc observed in the individual patient will depend, in part, on the baseline HbAlc. Patients whose baseline HbA lc is between 9.0 and 10.0 percent are likely to have a decrease of 1.8 percent, while those with a baseline HbA lc between 7.0 and 8.0 percent are more likely to have a decrease from baseline of 0.5 to 0.6 percent. An important issue in treatment with thiazolidinediones is to recognize that it takes about 8 weeks of treatment to maximize the effect on fasting plasma glucose and 14 to 18 weeks on HbA lc. This is likely due to the mechanism of action of these drugs, which involves modifying the constituents and function of the cell. There are relatively few peer-reviewed data on the efficacy of pioglitazone. What are available suggest that, at the appropriate doses (i.e., 30-45 mg/day), it has similar effects to rosiglitazone on glycemic control.
Both rosiglitazone and pioglitazone have been added to the therapeutic pro- grams of type 2 diabetic patients who have had inadequate glycemic regulation on sulfonylurea, metformin, or insulin treatment (Fonseca et al., 2000). In each instance, the large, multicenter studies have shown an additional decrease of 1.0 to 1.5 percent in HbAlc. The additional improvement in glycemic control (a decrease in HbA lc of 0.9 percent from baseline) that occurred when rosiglitazone 2 or 4 mg twice a day was given to type 2 diabetics who had not achieved target glycemic goals on metformin 2.5 g per day supports earlier data that had suggested that metformin and the thiazolidinediones improve insulin action by different mechanisms and in different tissues
Clinical studies with all the thiazolidinediones indicate that the best glycemic responses to monotherapy are observed in type 2 diabetic patients who are 1) diet and lifestyle treatment failures and not previously drug treated; 2) female (usually have an 0.5 percent greater decrease in HbAlc than males); 3) overweight or obese; and 4) with good residual beta-cell function.

282 HAROLD E. LEBOVITZ & MARY ANN BANERJI
E. EFFECTS ON THE PROCOAGULANT STATE
The insulin-resistant state is associated with a number of changes in the coagulation schema that favor thrombosis and interfere with fibrinolysis (Yudkin, 1999; Meigs et al., 2000). This procoagulant state is thought to be a significant factor in the increase in macrovascular disease that occurs in type 2 diabetes. A factor that helps to regulate fibrinolysis is plasminogen activator inhibitor 1 (PAI-1). PAI- interferes with the conversion of plasminogen to plasmin. This substance is synthesized by the liver and endothelial cells. In insulin-resistant states, plasma levels of PAI- are elevated. Treatment of type 2 diabetic patients by troglitazone or rosiglitazone decreases plasma PAI- levels, presumably by decreasing insulin resistance (Saleh et al., 1999; Kato et al., 2000).
F. EFFECTS ON BETA-CELL FUNCTION
One of the major factors causing progressive deterioration of glycemic con- trol in type 2 diabetes is an unrelenting loss of beta-cell function. This deteriora- tion is both functional and structural. The long-term treatment of type 2 diabetic patients with diet, metformin, or sulfonylureas does not alter this progressive loss of beta-cell function. The mechanisms responsible for this deterioration are not known, Several potential mechanisms have been postulated. Insulin resistance could be a significant factor in facilitating beta-cell loss through its continual demand for greater beta-cell function, leading to an increased rate of apoptosis and/or a concomitant increase in amylin secretion and increased amyloid deposits in the pancreatic islets. If either or both of those mechanisms were operative, the reduction of peripheral insulin resistance would be expected to preserve beta-cell function. While only long-term outcome studies can determine definitively whether such treatments will have a positive outcome, there are data indicating that treatment of type 2 diabetic patients with thiazolidinediones will decrease the elevated plasma proinsulin-to-insulin ratio observed in such patients. Some inves- tigators hypothesize that the elevated plasma proinsulin-to-insulin ratio reflects dysfunctional beta-cell processes (Mykkanen et al., 1997) and that improvement in this ratio reflects improved beta-cell function.
G. EFFECTS OF THIAZOLIDINEDIONES ON VASCULAR ENDOTHELIAL AND VASCULAR SMOOTH MUSCLE CELLS
In vitro and in vivo animal studies have suggested that insulin resistance may significantly interfere with normal control of blood vessel vasodilatation, endo- thelial function, and smooth muscle cell proliferation. All of these processes are thought to be important in the pathogenesis of atherosclerosis. A relatively new area of research in thiazolidinedione pharmacology is the role that these agents might have in correcting abnormal vascular endothelial and smooth muscle cell

INSULIN RESISTANCE & THIAZOLIDlNEDIONES 283
abnormalities in insulin-resistant type 2 diabetic patients. Two studies have ad- dressed the question of whether troglitazone treatment would increase the im- paired vasodilatation that occurs in insulin-resistant individuals, Tack and col- leagues (1998b) failed to find any effect of troglitazone 400 mg/day for 8 weeks on impaired, insulin-induced vasodilation in obese, insulin-resistant subjects, even though insulin sensitivity was increased approximately 23 percent. In contrast, Avena and coworkers (1998) found a significant restoration of brachial artery vasodilatation in patients with impaired glucose tolerance and peripheral vascular disease after 4 months of treatment with troglitazone.
Minamikawa and colleagues (1998) have reported that treatment of type 2 diabetic patients with troglitazone 400 mg daily for 6 months resulted in a statis- tically significant reduction in carotid arterial intimal and medial complex thick- ness (IMT), compared to control type 2 diabetic patients. The IMT was measured by a B-mode ultrasound technique. Though HbA lc and serum triglycerides were lowered by troglitazone treatment, there was no correlation between the decrease in IMT and reductions in HbAlc or triglycerides. Since IMT is thought to be a surrogate marker for atherosclerosis, these data have been interpreted as suppor- tive of the concept that thiazolidinediones activate anti-atherogenic processes at the level of the vascular endothelium and smooth muscle cells.
H. THIAZOLIDINEDIONES AND MICROALBUMINURIA
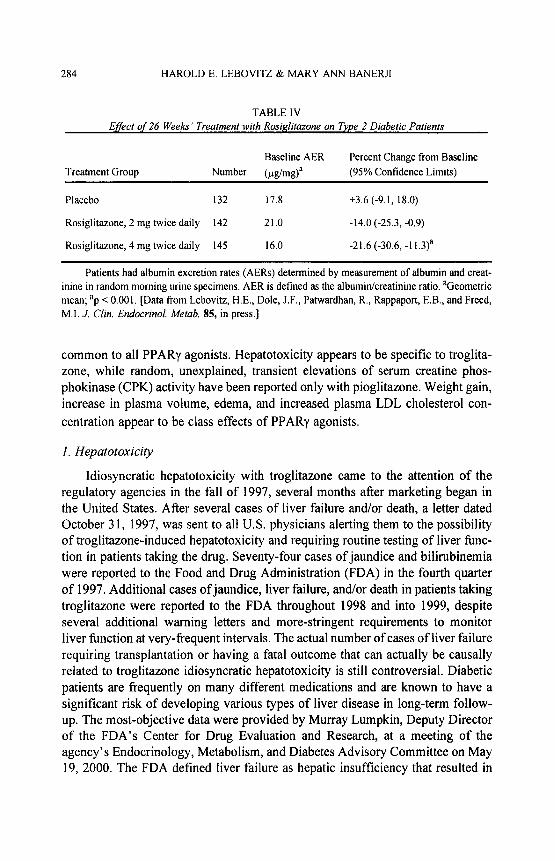
The mesangial cell in the kidney glomerulus is a contactile cell involved in controlling the filtration process. Alterations in mesangial cell function are asso- ciated with microalbuminuria. Since microalbuminuria are associated with insulin resistance (Mykkanen et al., 1998) it is possible the mesangial cell function is affected by insulin resistance. Thiazolidinediones have been shown to decrease urinary albumin excretion and microalbuminuria in type 2 diabetic patients. Table IV shows the results of changes in urinary albumin excretion rates following 6 months treatment with either 2 or 4 mg of rosiglitazone twice a day. A study comparing troglitazone to metformin treatment of type 2 diabetics showed that troglitazone significantly reduced microalbuminuria and metformin did not, de- spite the latter having a greater effect in reducing hyperglycemia (Imano et al., 1998). These data suggest that thiazolidinediones may directly influence me- sangial cell function.
I. SAFETY ISSUES WITH THIAZOLIDINEDIONE THERAPY
Safety issues have and will determine the extent to which thiazolidinediones will be used in the treatment of type 2 diabetes and other insulin-resistant states. Safety issues include those that are unique characteristics of the individual thia- zolidinedione, those that are common to all thiazolidinediones, and those that are
284 HAROLD E. LEBOVITZ & MARY ANN BANERJI
TABLE IV Efect of 26 Weeks’ Treatment with Rosi&tazone on Type 2 Diabetic Patients
Baseline AER Percent Change from Baseline Treatment Group Number (pg/m# (95% Confidence Limits)
Placebo 132 17.8 +3.6 (-9.1, 18.0)
Rosiglitazone, 2 mg twice daily 142 21.0 -14.0 (-25.3, -0.9)
Rosiglitazone, 4 mg twice daily 145 16.0 -21.6 (-30.6, -1 l.3)a
Patients had albumin excretion rates (AERs) determined by measurement of albumin and creat- inine in random morning urine specimens. AER is defined as the albuminkreatinine ratio. sGeometric mean; “p < 0.001. [Data from Lebovitz, H.E., Dole, J.F., Pahwrdhan, R., Rappaport, E.B., and Freed, M.I. J. Clin. Endocrinol. Metab. 85, in press.]
common to all PPARy agonists. Hepatotoxicity appears to be specific to troglita- zone, while random, unexplained, transient elevations of serum creatine phos- phokinase (CPK) activity have been reported only with pioglitazone. Weight gain, increase in plasma volume, edema, and increased plasma LDL cholesterol con- centration appear to be class effects of PPARr agonists.
1. Hepatotoxicity
Idiosyncratic hepatotoxicity with troglitazone came to the attention of the regulatory agencies in the fall of 1997, several months after marketing began in the United States. After several cases of liver failure and/or death, a letter dated October 3 1, 1997, was sent to all U.S. physicians alerting them to the possibility of troglitazone-induced hepatotoxicity and requiring routine testing of liver func- tion in patients taking the drug. Seventy-four cases of jaundice and bilirubinemia were reported to the Food and Drug Administration (FDA) in the fourth quarter of 1997. Additional cases of jaundice, liver failure, and/or death in patients taking troglitazone were reported to the FDA throughout 1998 and into 1999, despite several additional warning letters and more-stringent requirements to monitor liver function at very-frequent intervals. The actual number of cases of liver failure requiring transplantation or having a fatal outcome that can actually be causally related to troglitazone idiosyncratic hepatotoxicity is still controversial. Diabetic patients are frequently on many different medications and are known to have a significant risk of developing various types of liver disease in long-term follow- up. The most-objective data were provided by Murray Lumpkin, Deputy Director of the FDA’s Center for Drug Evaluation and Research, at a meeting of the agency’s Endocrinology, Metabolism, and Diabetes Advisory Committee on May 19, 2000. The FDA defined liver failure as hepatic insufficiency that resulted in

INSULIN RESISTANCE & THIAZOLIDINEDIONES 285
death, liver transplantation, being put on the transplantation waiting list, or recov- ering after clinical hepatic encephalopathy. Based on these criteria, the FDA concluded that 90 cases of liver failure were possibly or probably related to troglitazone therapy during the 36 months that it had been on the market. As a result of this analysis and the availability of rosiglitazone and pioglitazone, both of which appear not to have liver toxicity, the FDA encouraged Parke Davis to withdraw troglitazone from the market, which it did on March 22, 2000.
As the evidence for troglitazone-induced idiosyncratic hepatotoxicity accu- mulated (Gitlin et al., 1998; Herrine and Choudhary, 1999; Vella et al., 1998), the major question that arose was whether this was a class effect of all thiazolid- inediones or perhaps all PPARy agonists or whether it was unique to some aspect of troglitazone structure or metabolism. A number of characteristics of troglita- zone are somewhat unique and suggested that its hepatotoxicity might be so also. Troglitazone combines the glitazone structure with a vitamin E-related moiety. This molecule generates a family of quinone metabolites that are unique among thiazolidinediones. Troglitazone is concentrated 15-20 fold in the liver, compared to plasma levels (Kawai et al., 1997). Troglitazone and its metabolites are secreted into the bile and undergo considerable biliary recirculation, The plasma half-life of troglitazone in humans is 16-34 hours; less than 3 percent is excreted in the urine (Henry, 1997). In vitro troglitazone and its quinone metabolites have been toxic to cultured hepatocytes at concentrations comparable to those achieved in vivo near the normal dose range (Elcock et al., 1999). Finally, the dose of troglitazone required to achieve a therapeutic effect in type 2 diabetic humans is loo-fold greater than, for example, rosiglitazone. During the clinical trials with rosiglitazone and pioglitazone, it was anticipated that they were much less likely to have a troglitazone-like hepatotoxicity.
When troglitazone hepatotoxicity began appearing in type 2 diabetic patients, it was widely publicized that this was totally unexpected and could not have been predicted from the data gathered during the clinical trial. This led to concerns that sample sizes during clinical trials would not be large enough to detect a potential hepatotoxicity in any thiazolidinedione or PPARr agonist being developed. A careful review of the troglitazone clinical trial data and an analysis of the clinical cases of troglitazone hepatotoxicity allow us to identify the risk of hepatotoxicity from such compounds. In the combined North American clinical trials of trogli- tazone, 25 10 patients received troglitazone and 475 received placebo. Elevations of serum alanine aminotransferase (ALT) greater than three times the upper limit of normal were detected in 48 (1.9 percent) of the troglitazone-treated patients and in only three (0.6 percent) of the placebo-treated ones (Watkins and Whit- comb, 1998). Seventeen (0.68 percent) troglitazone-treated patients had an ALT level greater than 10 times the upper limit of normal and five (0.19 percent) had an ALT greater than 20 times the upper limit of normal. Twenty patients had

286 HAROLD E. LEBOVITZ & MARY ANN BANERJI
troglitazone discontinued because of abnormal liver function. Two of those had developed jaundice. Liver function in the 20 patients returned to normal after a mean of 55 days. Liver biopsies were obtained in two patients, one of whom had jaundice. The biopsies were compatible with an idiosyncratic drug reaction. Thus, it is reasonable to conclude that the clinical trials with troglitazone were associated with evidence of a potential problem of hepatotoxicity. That provides some measure of confidence that hepatotoxicity of newer PPARy agonists would likely be detected by a signal in the clinical trials.
The clinical course of the troglitazone hepatotoxicity is unclear. Initial reports suggested that the hepatic reaction occurred within the first few months of therapy and was unlikely to occur in individuals on therapy longer than 1 year (Watkins and Whitcomb, 1998). The FDA data show that new-onset hepatic abnormalities can occur in individuals who were on troglitazone in excess of 1 year. The hepatotoxicity due to troglitazone progresses for a period of time, even after the drug has been discontinued. In most instances, the liver recovers after several weeks to months but, in some individuals, there has been a steady progression to liver failure.
Examination of the clinical trial data presented to the FDA by the rosiglita- zone and pioglitazone sponsors was remarkably devoid of any suggestion of hepatic toxicity. Figure 6 shows that the incidence of serum ALT elevations greater than three times the upper limit of normal in both rosiglitazone- and pioglitazone-treated patients was the same as in their appropriate placebo- or comparator-treated controls. To the present time, more than one million patients have been treated with rosiglitazone and there are no cases of hepatotoxicity in which rosiglitazone has been proven to be the cause (Lebovitz and Salzman, 2000). A similar situation occurs for pioglitazone. The available data indicate that hepatotoxicity is unique to troglitazone and is not a class effect of either thiazolid- inediones or PPARy agonists.
2. Increase in Extracellular Volume and Edema
Clinical trials with all of the thiazolidinediones and the new non-thiazolidi- nedione PPARy agonists have shown small decreases in the hemoglobin and hematocrit of treated patients. This decrease appears to be the consequence of an expansion of the extracellular compartment. Preliminary studies have shown no significant changes in red cell mass in treated patients (Young et al., 1999). The mechanism for expansion of the plasma volume has not been defined. PPARr agonists decrease peripheral resistance and lower diastolic blood pressure approxi- mately 2 to 4 mmHg (Ogihara et al., 1995; Saleh et al., 1999). The increase in the volume of the extracellular compartment could result from potentiation of insulin’s actions to cause vasodilation and to increase sodium resorption. The

INSULIN RESISTANCE & THIAZOLIDINEDIONES 287
Pioglitazone Rosiglitazone Troglitazone
FIG. 6. Incidence of serum alanine aminotransferase elevations greater than three times the upper limit ofnormal in the clinical trials submitted to the FDA by the sponsors oftroglitazone, rosiglitazone, and pioglitazone. The only thiazolidinedione that showed a potential for liver toxicity was troglitazone.
decrease in hemoglobin and hematocrit occurs during the first 12 weeks of treat- ment and the values are stable after 12 weeks.
Peripheral edema has been observed in 4 to 5 percent of patients treated with pioglitazone or rosiglitazone as monotherapy for type 2 diabetes (Table V). Pla- cebo-treated or patients treated with sulfonylureas or metformin had an incidence of peripheral edema of 1 to 2 percent. Combination therapy of thiazolidinediones with insulin has been associated with more-significant rates of edema. For exam- ple, in clinical studies, edema was noted in 7 percent of insulin-treated type 2 diabetic patients and in 15.3 percent of those on pioglitazone plus insulin. The edema that develops during therapy with PPARy agonists is usually mild to moderate and responds to therapy with diuretics. A rare patient, however, may develop quite severe edema that does not respond well to diuretics. In these patients, thiazolidinedione may have to be discontinued. The reasons for the heterogeneous responses are unclear.
A likely related side effect that is receiving considerable attention is the precipitation of congestive heart failure. Although few formal data with compa- rator trials exist, there is a growing clinical awareness that some patients develop congestive heart failure when treated with PPARy agonists. The magnitude and

288 HAROLD E. LEBOVITZ & MARY ANN BANERJI
TABLE V Frequency of Peripheral Edema Reported in Double-blind Clinical Trials with Rosiglitazone
Number withdrawing Therapy Number Percent reporting edema because of edema
Rosiglitazone 2526 4.8 1
Rosiglitazone + metformin 226 2.5 to 3.5 1
Rosiglitazone + sulfonylurea 126 3.0 0
Placebo 601 1.3 1
Metformin 225 2.2 0
Sulfonylureas 626 1.0 0
severity of the problem have not been adequately defined. The impression is that this phenomenon is the consequence of an increase in plasma volume in individu- als who are in borderline heart failure. One- and 2-year echocardiographic studies in type 2 diabetic patients with normal baseline cardiac function taking troglita- zone, rosiglitazone, and pioglitazone have shown no detrimental effects on cardiac function (Ghazzi et al., 1997). Those studies actually demonstrated an improve- ment in overall cardiac output and stroke volume, without an increase in cardiac mass. These data, however, may not apply to individuals who already have some degree of cardiac disease. Additional studies of dynamic cardiac function need to be carried out in individuals with cardiac disease and borderline compensation. An awareness of increasing concern about use of PPAFQ agonists in patients with cardiac disease is exemplified by a recent letter sent to Japanese physicians by that country’s Ministry of Health recommending that pioglitazone not be pre- scribed to patients with heart failure. This was prompted by reports of five patients with congestive heart failure who subsequently experienced nonfatal heart attacks while taking pioglitazone.
3. Body Fat and Weight Gain
Weight gain has been seen in experimental animals and humans treated with thiazolidinediones. The weight gain has two components: an increase in subcuta- neous adipose tissue and an increase in extracellular water. The mechanisms responsible for each have been discussed. The severity of the weight gain in humans appears to be proportional to the level of improvement in glycemic control and is accentuated by drugs that increase the plasma insulin levels. Monotherapy with rosiglitazone for 26 weeks was associated with a mean increase in body

INSULIN RESISTANCE & THIAZOLIDINEDIONES 289
weight of 1.8 kg at the dose of 4 mg per day and 3.5 kg at the dose of 8 mg per day. Similar weight gain was reported in the pioglitazone studies (Table VI). Concurrent therapy of thiazolidinediones with insulin for a year resulted in more weight gain, with an average mean of approximately 4.0 kg. Similar degrees of weight gain accompanied concurrent thiazolidinedione and sulfonylurea therapy. Insufficient data are available to determine whether the weight gain stabilizes after 6 to 12 months or whether it is progressive with time. There are unusual patients who gain large amounts of weight when treated with thiazolidinediones. It then becomes a clinical judgment as to whether the improvement in glycemic control is sufficiently beneficial to justify the magnitude of the weight gain. In any individual patient, it may be difficult to determine the relative contributions that fluid retention vs. an increase in adipose tissue mass make to the weight gain.
4. Potential for Drug Interactions
The thiazolidinediones are metabolized by oxidative cytochrome pathways in the liver. Troglitazone, pioglitazone, and rosiglitazone are metabolized via differ- ent cytochrome pathways. Troglitazone is primarily metabolized by CYP 3A4 (Yamazaki et al., 1999). Additionally, it induces the metabolism of other drugs that are substrates for CYP 3A4. Pioglitazone is metabolized via CYP 3A4, CYP 2C8, and CYP 1Al pathways. Rosiglitazone is predominantly metabolized via CYP 2C8 and to a much-lesser degree by CYP 2C9. More than half of the
TABLE VI
Effect qf Thiazolidinedione Treatment on Weight Gain in Type 2 Diabetic Patients
Gain in weight (kn)
Type of treatment Pioglitazone* Troglitazone Rosiglitazone
Monotherapy 0.5 to 2.8 - 1.6 to 3.5a
With sulfonylurea 1.9 to 2.9 2.6 to 5.9b -
With metformin I.0 - 0.7 to l.9c
With insulin 2.3 to 3.7 I .9 to3.6d -
Data from clinical trials after 6 months of treatment. a2 and 4 mg twice daily [Lebovitz, H.E., Dole, J.F., Patwardhan, R., Rappaport, E.B., and Freed, M.I. J. Clin. Endocrinol. Metab. 85, in press.] b200 and 600 mg daily [Horton, ES., Venable, T.C., Whitehouse, F., Ghazzi, M.N., and Whitcomb, R.W. Diabetes Care 21, 1462-1469, 1998.1 ‘2 and 4 mg twice daily [Fonseca, V., Rosenstock, J., Parwardhan, R., and Salzman, A. J. Am. Med. Assn. 283, 1695-1702, 2000.] d200 and 600 mg daily [Schwartz, S., Raskin, P. Fonseca, V., and Graveline, J.F. N. Engl. J. Med. 338, 861-866, 1998.1 *Pioglitazone patient information.

290 HAROLD E. LEBOVITZ & MARY ANN BANERJI
commonly used drugs are metabolized via the CYP 3A4 pathway. Thus, it would not be unreasonable to suspect that drugs such as troglitazone. which induce and are metabolized via CYP 3A4, would have significant drug-drug interactions with other drugs metabolized via CYP 3A4. Indeed, troglitazone has been shown to induce the metabolism of the oral contraceptive constituents ethinylestradiol, northindrone, and levonorgestrel as well as atorvastatin, terfenadine, and cy- closporin. The potential for drug interactions and alterations in effectiveness and safety need to be considered when two drugs metabolized via CYP 3A4 are administered together.
Co-administration of pioglitazone with warfarin, glipizide, metformin, or digoxin does not change the pharmacokinetic and pharmacodynamic profiles of these drugs. The effect of pioglitazone on induction or inhibition of CYP 3A4 has not been reported. Some data suggest that ketoconizole may inhibit the metabo- lism of pioglitazone.
Because rosiglitazone does not interact with CYP 3A4, it is unlikely to have many drug-drug interactions. In particular, co-administration with rosiglitazone does not alter the metabolism of oral contraceptives or nifedipine. No clinically relevant drug interactions have been found between rosiglitazone and digoxin, metformin, glyburide, ranitidine, or warfarin. The number of drugs metabolized via CYP 2C8 are few; therefore, the chance of drug interactions between rosigli- tazone and other concomitantly given drugs is quite low.
V. Conclusions
Insulin resistance is increasing in our society at a very rapid rate. This is the result of changing lifestyles superimposed upon genetic predisposition. Unfortu- nately, the development of insulin resistance is associated with the development of the insulin resistance syndrome, with its component abnormalities. The devel- opment of the insulin resistance syndrome predisposes individuals to increased risks of developing type 2 diabetes and cardiovascular disease. These detrimental outcomes have stimulated great interest in developing methods to prevent and treat insulin resistance. One such approach is to uncover the specific biochemical pathways responsible for mediating insulin resistance and to develop pharma- cologic agents to block or reverse these pathways. The thiazolidinediones are the first effort in this approach. Treatment of insulin resistance with the thiazolidi- nediones improves insulin action, lowers plasma insulin levels, ameliorates many of the components of the insulin resistance syndrome, and improves glycemic control in type 2 diabetic patients. Studies are underway to determine whether these agents can prevent type 2 diabetes and what their impact will be on the development of cardiovascular disease. Insights from studies on their molecular mechanism of action have provided clues for developing new and perhaps more- effective agents to treat insulin resistance.

INSULIN RESISTANCE & THIAZOLIDINEDIONES 291
REFERENCES
Abate, N., Garg, A., Peshock, R.M., Stray-Gundersen, J., and Grundy, S.M. (1995). J. C/in. Invest. 96, 88-98.
Adams, M., Montague, C.T., Prins, J.B., Holder, J.C., Smith, S.A., Sanders, L., Digby, J.E., Sewter, C.P., Lazer, M.A.,Chatterjee, V.K.K., andO’RahilIy, S. (1997)J. C/in. Invest. 100,3149-3153.
Avena, R., Mitchell, M.E., Nylen, ES., Curry, K.M., and Sidway, A.N. (1998). 1 Vast. Surg. 28, 1024-1032.
Banerji, M.A., and Lebovitz, HE. (1989). Diabetes 38,784-782. Banerji, M.A., and Lebovitz, H.E. (1992). Diabetes Care 15, 1295-1302. Banerji,M.A.,Chaiken,R.L.,Gordon,D.,Kral,J.G.,andLebovitz,H.E.(1995a).Diaberes44,141-146. Banerji, M.A., Buckley, MC., Chaiken, R.L., Gordon, D., Lebovitz, HE, and KraI, J.G. (1995b). Ml.
J. Obesity 19,846-850. Banerji, M.A., Lebowitz, J., Chaiken, R.L., Gordon, D., KraI, J.G., and Lebovitz, H.E. (1997). Am. J.
Physiol. 273, E425-E432. Barker, D.J.P., Hales, C.N., Fall, C.H.D., Osmond, C., Phipps, K., and Clark, P.M.S. (1993). Diabe-
tologia 36,62-67. Bavdekar, A., Yajnik, C.S., FaIl,C.H.D., Bapat, S., Pandit, A.N., Deshpande, V., Bhave, S., KeIIingray,
SD., and Joglekar, C. (1999). Diabetes 48,2422-2429. Berkowitz, K., Peters, R., Kjos, S.L., Goico, J., Marroquin, A., Dunn, M.E., Xiang, A., Azen, S., and
Buchanan, T.A. (1996). Diabetes 45, 1572-1579. Boden, G. (1996). Diabetes 45,3-10. Bonora, E., Saggiani, F., Targher, G., Zenere, M.B., Alberiche, M., Monauni, T., Bonadonna, R.C., and
Muggeo, M. (2000). Diabetes Care 23,57-63. Boyko, E.J., Leonetti, D. I., Fujimoto, W.Y., and Newell-Morris, L. (2000). Diabetes Care 23,465-471. BrunzeII, J.D., and Hokanson, J.E. (1999). Diabetes Care 22(suppI. 3), CIO-C13. Burant, C.F., Sreenan, S., Hirano, K.-I., Tai, T.-A.C., Lohmiller, J., Lukens, J., Davidson, N.0, Ross,
S., and Graves, R.A. (1997). J. C/in. Invest 100,2900-2908. Camp, H.S., Li, O., Wise, SC., Hong, Y.H., Frankowski, C.L., Shen, X., Vanbogelen, R., and Leff, T.
(2000). Diabefes 49, 539-547. Chaiken, R.L., Banerji, MA, Pasmantier, R.M., Huey, H., Hirsch, S., and Lebovitz, H.E. (1991).
Diabetes Care 14, 1036-1042. Chaiken, R.L., Banerji, M.A., Huey, H., and Lebovitz, H.E. (1993). Diabetes 42,444-449. Ciaraldi, T.P., Gilmore, A., Olefsky, J.M., Goldberg, M., and Heidenreich, K.A. (1990). Metabolism
39, 1056-1062. Cline, G.W., Petersen, K.F., Krssak, M., Shen, J., Hundal, R.S., Trajanoski, Z., Inzucchi, S., Dresner,
A., Rothman, D.L., and Shulman, G.I. (1999). N. Engl. J. Med. 341,240-246. Dabelea, D., Imperatore, G., Pettit, D.J., Bennett, P.H., Hanson, R.I., and Knowler, W.C. (1999).
Diabetes Care 22,944-950. Dresner, A,, Laurent, D., Marcucci, M., Griffin, M.E., Dufour, S., Cline, G.W., Slezak, L.A., Andersen,
D.K., Hundal, R.S., Rothman, D.L., Petersen, K.F., and Shulman, G.I. (1999). J. C/in. Invest. 103,253-259.
Elcock, F.J., Lyon, J.J., Hitchcock, J., Morgan, D.G., Bertram, T.A., and Bugelski, P.J. (1999). Diabetes 48(suppl. I), A63.
Festa, A., Hales, C.N., D’Agostino, R. Jr., Howard, B.V., Mykkanen, L., Haffner, SM., and Tracy, R.F. (1999). Diabetes Care 22, 1688-1693.
Fonseca, V.A., Valiquett, T.R., Huang, S. M., Ghazzi, M.N., and Whitcomb, R.W. (1998). J Clin.En- docrinol. Metab. 83,3 169-3 176.
Fonseca, V., Rosenstock, J., Parwardhan, R., andsalzman, A. (2OOO)J. Am. Med. Assn. 283,1695-1702.

292 HAROLD E. LEBOVITZ & MARY ANN BANERJI
Ghazzi, M.N., Perez, J.E., Antonucci, T.K., Driscoll, J.H., Huang, S.M., Faja, B.W., and Whitcomb, R. W. (1997). Diabefes 46,433-439.
Gitlin, N., Julie, N.L., Spurr, C.L., Lim, K.N., and Juarbe, H.M. (1998). Ann. In/em. Med. 129,36-38. Goodpaster, B.H., Thaete, F.L., Simoneau, J.-A., and Kelley, D.E. (1997). Diabetes46, 1579-1585. Goodpaster, B.H., Kelley, D.E., Wing, R.R., Meier, A., and Thaete, F.L. (1999). Diabetes 48,839-847. Groop, L., Ekstrand, A., Forsblom, C., Widen, E., Groop, P.-H., Teppo, A.-M., and Eriksson, J. (1993).
Diabetologia 36,642-647. Haffner, S.M., Kennedy, E., Gonzalez, C. Stern, M.P., and Miettinen, H. (1996). Diabetes Care 19,
1138-l 141. Haffner, SM., Rewers, M., D’Agostino, R. Jr., Selby, J., Mykkanen, L., Savage, P.J., Tracy, R., Saad,
M.F., and Howard, B.V. (1999). Diabetes Care 22,562-568. Henry, R.R. (1997). Endocrinol. Metab. Clin. N. Am. 26,553-575. Herrine, S.K., and Choudhary, C. (1999). Ann. Intern. Med. 130, 163-164. Horton, ES., Venable, T.C., Whitehouse, F., Ghazzi, M.N., and Whitcomb, R.W. (1998). DiabetesCare
21, 1462-1469. Hotamisligil, G.S., and Spiegelman, B.M. (1994). Diabetes 43, 1271-1278. Imano, E., Motomura, M., Kanda, T., Kajimoto, Y., Nakatani, Y., Yamasaki, Y., Nishida, T., Hori, M.,
and Arai, K. (1998). Diabetes Care 21,2135-2139. Inzucchi, S.E., Maggs, D.G., Spollett, G.R., Page, S.L., Rife, F.S., Walton, V., and Shulman G. (1998).
N. Engl. J. Med. 338,867-872. Karter, A.J., Mayer-Davis, E.J., Selby, J.V., D’Agostino, R.B. Jr., Haffner, SM., Sholinsky, P.,
Bergman, R., Saad, M.F., and Hamman, R.F. (1996). Diabetes 45, 1547-1555. Kato, K., Yamada, D., Midorikawa, S., Sato, W., and Watanabe, T. (2000). Metabolism 49,662-665.. Kadowaki, T. (2000). J. Clin. Invest. 106,459-465. Kawai, K., Kawasaki-Tokui, Y., Odaka, T., Tsuruta, F., Kazui, M., Iwabuchi, H., Nakamura, T.,
Kinoshita, T., Ikeda, T., Yoshioka, T., Komai, T., and Nakamura, K. (1997). Arzneimittel-For- schung. 47,356-368.
Kelly, I.R., Walsh, K., Han, T.S., and Lean, M.E.J. (1999). Diabeles Care 22,288-293. Kreutter, D.K., Andrews, K.M., Gibbs, E.M., Hutson, N.J., and Stevenson, R. W. (I 990). Diabetes 39,
1414-1419. Kruszynska, Y.T., Mukherjee, R., Jow, L., Dana, S., Paterniti, J.R., and Olefsky, J.M. (1998). J. Clin.
Invest. 101,543-548. Lapidus, L., Bengtsson, C., Larsson, B., Pennert, K., Rybo, E., and Sjostrom, L. (1984). Br. Med. J.
289, 1257-1261. Larsson, B., Svardsudd, K., Welin, I,., Wilhelmsen, L., Bjomtorp, P., and Tibblin, G. (1984). Br. Med.
J. 288, 1401-1404. Lebovitz, H.E., and Salzman, A. (2000). Diabetes 49(suppl. I), A39. Lebovitz, H.E., Dole, J.F., Patwardhan, R., Rappaport, E.B., and Freed, M.I. (2001). J. Clin. Endocrinol.
Metab. 85, in press. Lehmann, J. M., Moore, L.B., Smith-Oliver, T.A., Wilkison, W.O., Willson, T.M., and Kliewer, S.A.
(1995). J. Biol. Chem. 270, 12953-12956. Lemieux, S., Tremblay, A., Prud’Homme, D., Bouchard, C., Nadeau, A., and Despres, J-P. (1996).
Diabetes Care 19,983-991. Li, A.C., Brown, K.K., Silvestre, M.J., Willson, T.M., Palinski, W., and Glass, C.K. (2000). J. C/in.
Invesf. 106,523-53 I. Maggs, D.G., Buchanan, T.A., Burant,C.F., Cline, G., Gumbiner, B., Hsueh, W.A., Inzucchi, S., Kelley,
D., Nolan, J., Olefsky, J.M., Polonsky, KS., Silver, D., Valiquett, T.R., and Shulman, G.I. (1998). Ann. Inrern. Med. 128, 176-185.
Meigs, J.B., Mittleman, M.A., Nathan, D.M., Tofler, G.H., Singer, D.E., Murphy-Sheehy, P.M., Lipinska, I., D’Agostino, R.B., and Wilson, P.W.F. (2000). J. Am. Med. Assn. 283.221-228.

INSULIN RESISTANCE & THIAZOLIDINEDIONES 293
Miles, P.D.G., Barak, Y., He, W., Evans, R.M., and Olefsky, J.M. (2000). J. Clin. Invest. 105,287-292.
Miniamikawa, J., Tanaka, S., Yamauchi, M., moue, D., and Koshiyama H. (1998). J. Clin. Endocrinol. Metab. 83, 18 IS- 1820.
Mori, Y., Yokoyama, J., Murakawa, Y., Tajima, N., Okada, K., Ikeda Y., and Horikoshi, H. (1999).
Diabetes Care 22,908-912. Mykkanen, L., Haffner, S.M., Hales,N., Ronnemaa,T., and Laakso, M. (1997). Diubetes46,1990-1995. Mykkanen, L., Zaccaro, D.J., Wagenknecht, L.E., Robbins, D.C., Gabriel, M., and Haffner, S.M. (1998).
Diabetes 47,793-800. Noguchi, N., Sakai, H., Kato, Y., Tsuchiya, J., Yamamoto, Y., Niki, E., Horikoshi, H., and KodamaT.
(1996). Atherosclerosrs 123,227-234.
Ogihara, T., Rakugi, H., Ikegami, H., Mikami, H., and Masuo K. (1995). Am. J. Hyperlens. 8,3 16-320. Ohlson, L-O., Larsson, B., Svardsudd, K., Welin, L., Eriksson, H., Wilhelmsen, L., Bjorntorp, I’., and
Tibblin, G. (1985). Diabetes 34, 1055-1058.
Okosun, I.E., Osotimehin, B., Cooper, R. S., Forrester, T., and Rotimi, C.N. (1998). Diabetes Cure 21, 1836-1842.
Okuno, A., Tamemoto, H., Tobe, K., Ueki, K., Mori, Y., lwamoto, K., Umesono, K., Akanuma, Y.,
Fujiwara, T., Horikoshi, H., Yazaki, Y., and Kadowaki T. (1998). J. Clin. Invest. 101, 1354- 1361.
Olefsky, J.M. (2000). J. Clin. invest. 106,467-472. Pan, D.A., Lillioja, S., Kriketos, A.D., Mimer, M.R., Bauer, L.A., Bogardus, C., Jenkins, A.B., and
Storlien, L.H. (1997). Diabetes 46,983-988. Phillips, D.I.W., Barker, D.J.P., Fall,C.H.D., Seckle, J.R., Whorwood, C.B., Wood, P.J., and Walker,
B.R. (1998). J. Clin. Endocrinol. Metab. 83,757-760. Reaven, G.M. (1988). Diabetes 37, 1595-1607. Rebuffe-Strive, K.M., Carey, V.J., OIbe, L., and Bjorntorp, P. (1989). Metabolism 38,453-458. Rexrode, K.M., Carey, V.J., Hennekens, C.H., Walters, E.E., Colditz, G.A., Stampfer, M.J., Willett,
W.C., and Manson, J.E. (1998). J. Am. Med. Assn. 280, 1843-1848. Saleh, Y.M., Mudaliar, S.R., and Henry, R.R. (1999). Diabetes Rev. 7,55-76. Saltiel, A.R., and Olefsky, J.M. (1996). Diabetes 45, 1661-1669. Samaras, K., and Campbell, L.V. (2000). Diabetes Care 23,443-444. Samaras, K., Arden, N., Kelly, P.J., Spector, T.D., Chiano, M.N., and Campbell, L.V. (1998). Dtabefes
Cure 21,2069-2076. Schwartz, S., Raskin, P., Fonseca, V., and Graveline, J.F. (1998). N. Engl. J. Med. 338, 861-866.
Stern, M.P. (1997). In “International Textbook of Diabetes Mellitus,” 2nd edit. (K.G.M.M. Alberti., P.
Zimmet , R.A. DeFronzo, and H. Keen, eds ), pp. 255-283. John Wiley and Sons, Chichester,
UK. Tack, C.J.J., Smits, P., Demacker, P.N.M., and Stalenhoef, A.F.H. (1998a). Diabetes Cure 21,796-797. Tack, C.J., Ong, M.K., Lutterman, J.A., and Smits, P. (1998b). Diubetologiu 41, 569-576. Taniguchi, A., Fukushima, M., Sakai, M., Kataoka, K., Miwa, K., Nagata, I., Doi, K., Arakawa, f-i.,
Nagasaka, S., Tokuyama K., and Nakai, Y. (2000). Metabolism 49, 1001-1005.
Vella, A., de Growen, P.C., and Dinneen, S.F. (1998). Ann. Intern Med. 129, 1080. Walker, A.D., Naderali, E.K., Chattington, P.D., Buckingham, R.E., and Williams, G. (1998). Diabetes
47, 810-814.
Watkins, P.B., and Whitcomb, R.W. (1998). N. Engl. J. Med. 338,916-917. Willson, T.M., Brown, P.J., Sternback, D.D., and Henke, B.R. (2000). J. Med. Chem. 43,527-550. Whitcomb, R.W., and Saltiel, A. R. (1995). Exp. Opin. Invest. Drugs 4, 1299-1309.
Wu, Z., Xie, Y., Morrison, R.F., Bucher, N.L.R., and Farma, S.R. (1998). J. Clin. Invest. 101,22-32. Yamazaki, H., Shibata, A., Suzuki, M., Nakajima, M., Shimada, N., Guengerich, F.P., and Yokoi, T.
( 1999). Drug Metub. Dispos. 27, 1260- 1266.

294 HAROLD E. LEBOVITZ & MARY ANN BANERJI
Young, M.M., Squassante, L., Werner, J., van Marie, S.P., Dogterom, P., and Johnkman, J.H. (1999). Eur. J. Clin. Pharmacol. 55, 101-104.
Yu, J.G., Kruszynska, Y.T., Mulford, M.I., and Olefsky, J.M. (1999). Diabetes 48,2414-2421. Yudkin, J.S. (1999). Diabetes Care 22(suppl. 3), C25-C30. Zavaroni, I., Bonora, E., Pagliara, M., Dall’Aglio, E., Luchetti, L., Buonanno, G., Bonati, P.E.,
Bergonzani, M., Gnudi, L., Passeri, M., and Reaven, Cl. (1989). N. Engl. J. Med. 320,702-706.
Copyright © 2022 FDOKUMEN