Exercise and diet enhance fat oxidation and reduce insulin resistance in older obese adults
29
Exercise and diet enhance fat oxidation and reduce insulin resistance in older obese adults Thomas P.J. Solomon 1 , Sakita N. Sistrun 2 , Raj K. Krishnan 2 , Luis F. Del Aguila 2 , Christine M. Marchetti 2 , Susan M. O’Carroll 1 , Valerie B. O’Leary 1 , and John P. Kirwan 1, 3, 4 1 Department of Pathobiology, Lerner Research Institute, Cleveland Clinic, Cleveland, Ohio; 2 Noll Physiological Research Center, Penn State University, University Park, Pennsylvania; 3 Department of Gastroenterology/Hepatology, Cleveland Clinic, Cleveland, Ohio; 4 Department of Nutrition, Case Western Reserve University School of Medicine, Cleveland, Ohio ADDRESS CORRESPONDENCE TO: John P. Kirwan Ph.D. Department of Pathobiology Lerner Research Institute Cleveland Clinic 9500 Euclid Avenue / NE-40 Cleveland, OH 44195 Telephone: 216-444-3412 Fax: 216-636-1493 Email: [email protected] Running title: Exercise and Fat Oxidation Page 1 of 29 Articles in PresS. J Appl Physiol (March 6, 2008). doi:10.1152/japplphysiol.00890.2007 Copyright © 2008 by the American Physiological Society.
-
Upload
independent -
Category
Documents
-
view
2 -
download
0
Transcript of Exercise and diet enhance fat oxidation and reduce insulin resistance in older obese adults
Exercise and diet enhance fat oxidation and reduce insulin resistance in older obese adults
Thomas P.J. Solomon1, Sakita N. Sistrun2, Raj K. Krishnan2, Luis F. Del Aguila2, Christine M.
Marchetti2, Susan M. O’Carroll1, Valerie B. O’Leary1, and John P. Kirwan1, 3, 4
1 Department of Pathobiology, Lerner Research Institute, Cleveland Clinic, Cleveland, Ohio; 2 Noll Physiological Research Center, Penn State University, University Park, Pennsylvania;3 Department of Gastroenterology/Hepatology, Cleveland Clinic, Cleveland, Ohio;4 Department of Nutrition, Case Western Reserve University School of Medicine, Cleveland, Ohio
ADDRESS CORRESPONDENCE TO:
John P. Kirwan Ph.D.
Department of Pathobiology
Lerner Research Institute
Cleveland Clinic
9500 Euclid Avenue / NE-40
Cleveland, OH 44195
Telephone: 216-444-3412
Fax: 216-636-1493
Email: [email protected]
Running title: Exercise and Fat Oxidation
Page 1 of 29 Articles in PresS. J Appl Physiol (March 6, 2008). doi:10.1152/japplphysiol.00890.2007
Copyright © 2008 by the American Physiological Society.
2
ABSTRACT
Older, obese, and sedentary individuals are at high risk of developing diabetes and cardiovascular
disease. Exercise training improves metabolic anomalies associated with such diseases, but the effects of
caloric restriction in addition to exercise in such a high risk group are not known. Changes in body
composition and metabolism during a lifestyle intervention were investigated in twenty three older, obese
men and women (aged 66 ± 1 years, BMI 33.2 ± 1.4 kg.m-2) with impaired glucose tolerance. All
volunteers undertook twelve weeks of aerobic exercise training (5 days per week for 60 min @ 75%
VO2max) with either normal caloric intake (eucaloric group, 1901 ± 277 kcal.day-1, n = 12) or a reduced-
calorie diet (hypocaloric group, 1307 ± 70 kcal.day-1, n = 11), as dictated by nutritional counseling. Body
composition (decreased fat mass; maintained fat-free mass), aerobic fitness (VO2max), leptinemia, insulin
sensitivity, and intramyocellular lipid accumulation (IMCL) in skeletal muscle improved in both groups (P
< 0.05). Improvements in body composition, leptin and basal fat oxidation were greater in the hypocaloric
group. Following the intervention there was a correlation between the increase in basal fat oxidation and
the decrease in IMCL (r = -0.53, P = 0.04). In addition, basal fat oxidation was associated with circulating
leptin after (r = 0.65, P = 0.0007), but not before the intervention (r = 0.05, P = 0.84). In conclusion, these
data show that exercise training improves resting substrate oxidation and creates a metabolic milieu that
appears to promote lipid utilization in skeletal muscle, thus facilitating a reversal of insulin resistance. We
also demonstrate that leptin sensitivity is improved, but that such a trend may rely on reducing caloric
intake in addition to exercise training.
Key Words: obesity, leptin, substrate oxidation, insulin sensitivity
Page 2 of 29
3
INTRODUCTION
Skeletal muscle oxidative capacity is impaired in obese individuals, predisposing them to further
weight gain and insulin resistance (16), and increasing the risk of developing type 2 diabetes (T2DM) and
associated macrovascular complications (24, 35). Aging is also associated with impaired substrate
utilization and insulin resistance, probably due to a sedentary lifestyle and elevated body fat causing
impaired mitochondrial function (13, 22, 26, 30). Therefore older, obese, impaired glucose tolerant (IGT)
cohorts are at high risk of developing metabolic diseases.
Aerobic exercise training improves oxidative capacity and insulin sensitivity in younger and older
obese and/or IGT/T2DM individuals (8, 14, 15, 20, 36). Caloric restriction interventions also exhibit
similar improvements in insulin sensitivity; yet such findings are inconsistent, and the impact on substrate
metabolism is less clear (27, 32). The main drawback of hypocaloric weight-loss interventions is that fat-
free mass, a major determinant of substrate utilization, in particular basal fat oxidation, is also often
reduced (8, 15). Aging is associated with negative nitrogen balance and therefore older adults are at
increased risk for developing sarcopenia (25). Exercise promotes protein synthesis rates which may help
maintain fat-free mass in older individuals. Therefore, a weight loss program that includes exercise may
be favorable to optimally improve insulin sensitivity and substrate metabolism in an older, obese, IGT
population, thus reducing such a group’s already high risk of developing macrovascular complications.
Impaired insulin action mainly occurs in obesity due to accumulation of intracellular fatty acid
derivatives. However, adipocytokines are also documented to play a role. Circulating concentrations of
leptin have been shown to be positively related to fat mass and inversely related to insulin sensitivity (33).
Leptin is involved in satiety, via a hypothalamic signaling pathway (10), and in substrate metabolism, via
direct peripheral tissue action (23). However, it has been demonstrated that leptin can increase fat
oxidation (23), illustrating a paradox: it is possible that, in obesity, leptin resistance may arise (34). The
relationship between leptin and fat oxidation was investigated in this study. In addition to leptin, another
adipocytokine, adiponectin, has also been shown to be related to insulin sensitivity and substrate
Page 3 of 29
4
metabolism (37, 41). Therefore the relationship between adiponectin and fat oxidation was also measured
in this study.
Currently, in older obese IGT individuals, it is unknown whether the combination of exercise
training with a hypocaloric diet is more effective at improving factors associated with metabolic disease
when compared to a similar exercise regime with a eucaloric macronutrient intake. This study serves to
investigate such differences. It was hypothesized that exercise plus caloric restriction would improve
insulin sensitivity and substrate metabolism to a greater extent than exercise training alone as a result of
greater weight loss, particularly fat mass.
EXPERIMENTAL PROCEDURES
Subjects
Twenty three older, obese, IGT (fasting plasma glucose > 5.6 mmol.l-1 and 2 h oral glucose
tolerance test (OGTT) glucose concentration between 7.8 and 11.1 mmol.l-1) volunteers were recruited
from the general population to take part in a twelve week exercise training intervention, whilst consuming
either a eucaloric or a hypocaloric diet. Medical screening excluded individuals with heart, kidney, liver,
intestinal, and pulmonary diseases, or those taking medications for hypertension, diabetes, or other
obesity-related conditions. All volunteers were sedentary, and had been weight stable for six months prior
to the study. The study was approved by the Institutional Review Board, and all subjects provided written
informed consent in accordance with our guidelines for the protection of human subjects.
Intervention
Volunteers were divided into two BMI-matched groups: a eucaloric group (n = 12: four male, eight
female; age = 66 ± 1 years; BMI = 34.7 ± 1.6 kg.m-2) and a hypocaloric group (n = 11: three male, eight
female; age = 67 ± 1 years; BMI = 33.6 ± 1.3 kg.m-2). Both groups undertook 60 min of supervised
moderate-intensity aerobic exercise (treadmill walking/cycle ergometry/stationary rowing) at 75% of
maximal oxygen uptake capacity five days a week (Monday to Friday) for twelve weeks. Dietary records
Page 4 of 29
5
were collected for three days prior to the study, and individual nutritional counseling was provided weekly
to monitor caloric intake. The eucaloric group were instructed to continue their typical dietary intake
throughout the study, whilst the hypocaloric group were instructed to reduce their daily energy intake by
~500 kcal. Several anthropometric and metabolic measures were taken pre- and post-intervention as
described below during a three day inpatient stay at the General Clinical Research Centre.
Body composition
Height was measured to the nearest 1.0 cm without shoes. Body weight was measured to the nearest
0.1 kg with the subject wearing their underclothing and a hospital gown. Waist circumference (WC) was
measured midway between the lower rib margin and iliac crest to the nearest 1.0 cm. Body density was
determined by hydrostatic weighing and body fat mass was calculated using Siri equations as previously
described (29).
Aerobic fitness
Each subject performed an incremental treadmill exercise test to determine their maximal oxygen
consumption (VO2max). The speed was set between 2-4 mph and the incline of the treadmill was
increased 2.5% every two minutes until fatigue. Exhaled air was collected and concentrations of O2 and
CO2 were measured using an electrochemical O2 analyzer (Applied Electrochemistry, S-3A) and infrared
CO2 analyzer (Beckman LB-2) respectively. Maximum aerobic capacity was achieved when at least two
of the following criteria were achieved: (i) a plateau in VO2, (ii) a heart rate within 10 beats.min-1 of age-
predicted maximum, and/or (iii) a respiratory exchange ratio > 1.0. Due to the acute effects of exercise on
insulin sensitivity, the time period between the VO2max test and the euglycemic clamp was always at least
48 h. Post-intervention VO2max testing was performed the morning following the clamp procedure.
Basal substrate metabolism
On day 2 of the inpatient stay, following a twelve hour overnight fast, subjects were awakened at
0600 hours and taken by wheelchair to void and to be weighed, and then reclined in a semi-darkened,
Page 5 of 29
6
thermoneutral (22 ± 1oC) environment under a clear plastic hood (Brooks Instruments, Hatfield, PA) for
30 min for indirect calorimetry measurements, as previously described (40). The molar ratio of O2
consumed to CO2 produced was used to derive a measure of the relative amounts of substrate that were
being oxidized (respiratory quotient, RQ). The Weir equation was used to calculate resting energy
expenditure (39), and substrate oxidation rates were calculated according to Frayn (7). Timed urinary
nitrogen excretion measurements were also made for estimates of protein oxidation rates (7). In brief,
urine was collected from 0600 hours until completion of the calorimetry measures. Total volume and time
of collection was recorded and aliquots were analyzed for urea nitrogen (Roche Modular Diagnostics,
Indianapolis, IN).
Insulin sensitivity
On the final morning of the inpatient stay a hyperinsulinemic euglycemic clamp was performed as
previously described (5, 19). Following an overnight fast, subjects voided morning urine and were
weighed. An 18 gauge polyethylene catheter was inserted into an antecubital vein for the infusion of
glucose (20% dextrose) and insulin. A second 20 gauge polyethylene catheter was inserted in retrograde
fashion into a dorsal hand vein, and the hand was warmed in a heated box (~65oC) for sampling of
arterialized venous blood. After collection of baseline blood samples (5 ml), a percutaneous biopsy of the
vastus lateralis muscle was obtained using the Bergstrom needle technique, as previously described (19).
A primed 40 mU.m-2.min-1 insulin infusion commenced at t = 0 min followed by a two hour variable
glucose infusion intended to maintain plasma glucose concentrations at 5 mmol.l-1. Arterialized blood
samples (0.5 ml) were collected every 5 min for plasma glucose determination (Beckman Instruments,
Fullerton, CA) so as to make continuous adjustments to the glucose infusion rate in order to maintain
euglycemia. Insulin sensitivity was calculated as the mean glucose metabolized (clamp M) over the last 30
min period of the clamp, expressed as mg.kgFFM-1.min-1. A pre-clamp blood sample was also drawn for
the measurement of plasma leptin by radioimmunoassay (Linco Research, St. Charles, MO), and plasma
adiponectin by ELISA (R&D Systems, Minneapolis, MN).
Page 6 of 29
7
Skeletal muscle histology
Muscle mounts (n = 14: 7 hypocaloric, 7 eucaloric) obtained from the vastus lateralis biopsy were
stored at -70oC to be later analyzed for intramuscular lipid content (IMCL). IMCL was measured by a
semi-quantitative method using the Oil-Red-O (ORO) technique as previously described by Goodpaster et
al. (2000) (9). In brief, 10 µm cryosections were mounted on glass slides, air-dried, and immersed in an
ORO (Sigma, St Louis, MO) solution (36 mg ORO, 12 ml 2-propanol, 8 ml dH2O) for 10 min. Slides were
rinsed thoroughly in dH2O, allowed to dry, then fixed under a cover slip using Glycergel mounting
medium (DAKO, Carpinteria, CA), and sealed using an acrylic polymer. Slides were viewed under a light
microscope using 40X objective and bright field settings (Olympus BX61, Melville, NY), and digital
images were captured (Hamamatsu Orca-ER, Bridgewater, NJ). Images were viewed and analyzed in
grayscale format using NIH Image software (http://rsb.info.nih.gov/nih-image/). Quantification of IMCL
was performed by identifying ORO-stained areas with staining intensity of <150 arbitrary grayscale units.
This was repeated on five fields of view (750 x 550 pixels; 1 pixel = 0.18 µm2) per subject, and the mean
cross-sectional muscle fiber area and mean lipid-stained area were calculated. Intramyocellular lipid
accumulation was normalized for changes in fiber surface area: lipid surface area divided by fiber area
multiplied by 100 (= lipid accumulation index [LAI, %]).
Statistics
Statistical analyses were carried out using Statview (SAS Institute, NC, USA), and all data are
expressed as mean ± S.E.M. Normality of each variable was assessed using the Kolmorgorov-Smirnov
test. Variables deviating from normal distributions (plasma leptin concentrations) were natural log-
transformed (ln) prior to statistical analysis. Between-group (eucaloric vs. hypocaloric) comparisons for
all variables were analyzed using two-way (group*time) repeated measures ANOVA. Tukey post hoc tests
were applied to significant group*time interactions. Bivariate correlations were used to examine
relationships between pre- to post-study changes (∆) in basal fat oxidation, clamp M, and ln leptin with
other variables. Additionally, separate bivariate analyses were also applied to variables at baseline, and to
Page 7 of 29
8
variables following the intervention (e.g. baseline leptin vs. baseline fat oxidation, and post-intervention
leptin vs. post-intervention fat oxidation). This was carried out to identify changes in relationships as a
result of the intervention. Statistical significance was accepted at P < 0.05.
RESULTS
Dietary intake
During the twelve week intervention the eucaloric group consumed a similar daily caloric load
(1901 ± 277 vs. 1866 ± 231 kcal.day-1; P = 0.87) and macronutrient composition to their existing diet. The
hypocaloric group consumed approximately 33% fewer calories during the study compared to their
existing diet (1307 ± 70 vs. 1964 ± 164 kcal.day-1; P = 0.008), during which there was also a shift toward
reduced fat intake (30 ± 1 vs. 25 ± 1 %) and increased carbohydrate intake (51 ± 2 vs. 57 ± 1 %).
Body composition
Both study groups exhibited significant weight loss, improvements in BMI, and reductions in body
fat mass and waist circumference between baseline and post-study measures (Table 1), but, as expected,
weight, BMI, and fat mass showed greater changes in the hypocaloric group. Fat-free mass did not change
in either group (Table 1; P > 0.05).
Basal substrate metabolism
Table 3 indicates changes in basal substrate metabolism measured at rest following an overnight
fast. The RQ was decreased equally in both groups (P = 0.03), whereas basal fat oxidation was
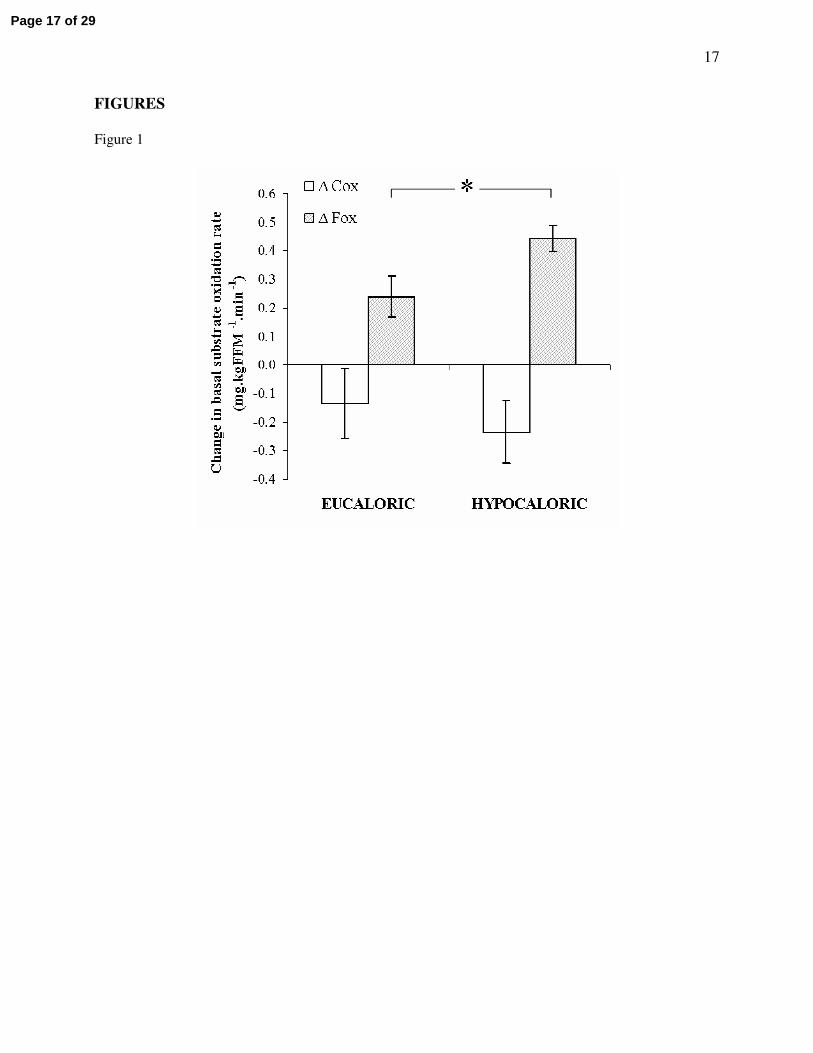
significantly improved in the hypocaloric group only (38.4 ± 12.8% increase; P = 0.02). Figure 1 displays
the change in basal carbohydrate and fat oxidation following the intervention in each group, illustrating a
larger improvement in basal fat oxidation in the hypocaloric group (P = 0.03). Analysis of the change in
basal fat oxidation between groups also revealed a statistically significant difference, showing a greater
increase in the hypocaloric group (P = 0.05). No changes in energy expenditure, or carbohydrate and
protein oxidation rates were found as a result of the interventions.
Page 8 of 29

9
Aerobic fitness
VO2max increased similarly in both groups (Table 1; eucaloric: 10.6 ± 3.0% increase, P = 0.003;
hypocaloric: 11.8 ± 5.7% increase, P = 0.04).
Insulin sensitivity
Glucose metabolized during the hyperinsulinemic euglycemic clamp was improved by similar
amounts in both groups (Table 1; eucaloric: 55.1 ± 19.0% increase, P = 0.03; hypocaloric: 65.1 ± 14.4%
increase, P = 0.001 respectively).
Leptin and Adiponectin
Pre-intervention plasma leptin concentrations were similar between groups (Table 1). Leptin
concentrations decreased in both groups following the intervention, with a larger reduction seen in the
hypocaloric group (31.6 ± 6.0% decrease vs. 12.2 ± 3.8%. decrease). Analysis of plasma adiponectin
concentrations did not reveal any effect of time or trial (Table 1; P > 0.05).
IMCL
Following the exercise training intervention, intramuscular lipids (LAI, %) decreased by 25.9 ± 12.4
and 34.3 ± 17.6% in the eu- and hypocaloric groups respectively (two-way ANOVA, effect of time P =
0.04; Table 2). No group differences were found (P = 0.66).
Correlation analyses
The majority of measured variables demonstrated no group*time interactions following analysis,
therefore, because it appeared that changes with time were occurring independent of caloric consumption,
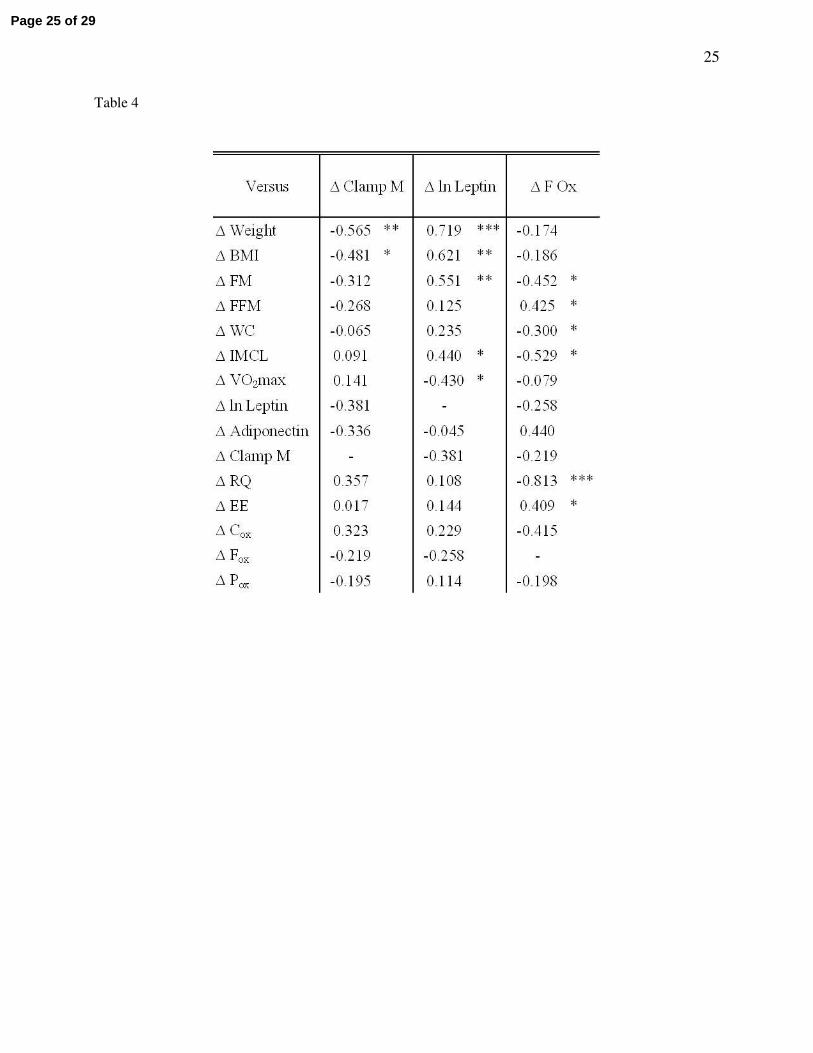
data from the eucaloric and hypocaloric groups were pooled for correlation analyses. Table 4 indicates
that changes in clamp M, leptin, and basal fat oxidation were mostly related to changes in body
composition. Changes in clamp M were not found to be related to changes in leptin or basal fat oxidation,
nor were changes in leptin found to be related to changes in basal fat oxidation. There was a significant
Page 9 of 29

10
association between the change in IMCL and the changes in basal fat oxidation (r = -0.53, P = 0.04; Table
4, Figure 2) and circulating leptin (r = 0.44, P = 0.05; Table 4). There was also a trend for a correlation
between the change in circulating adiponectin and basal fat oxidation (r = 0.44, P = 0.05). In addition,
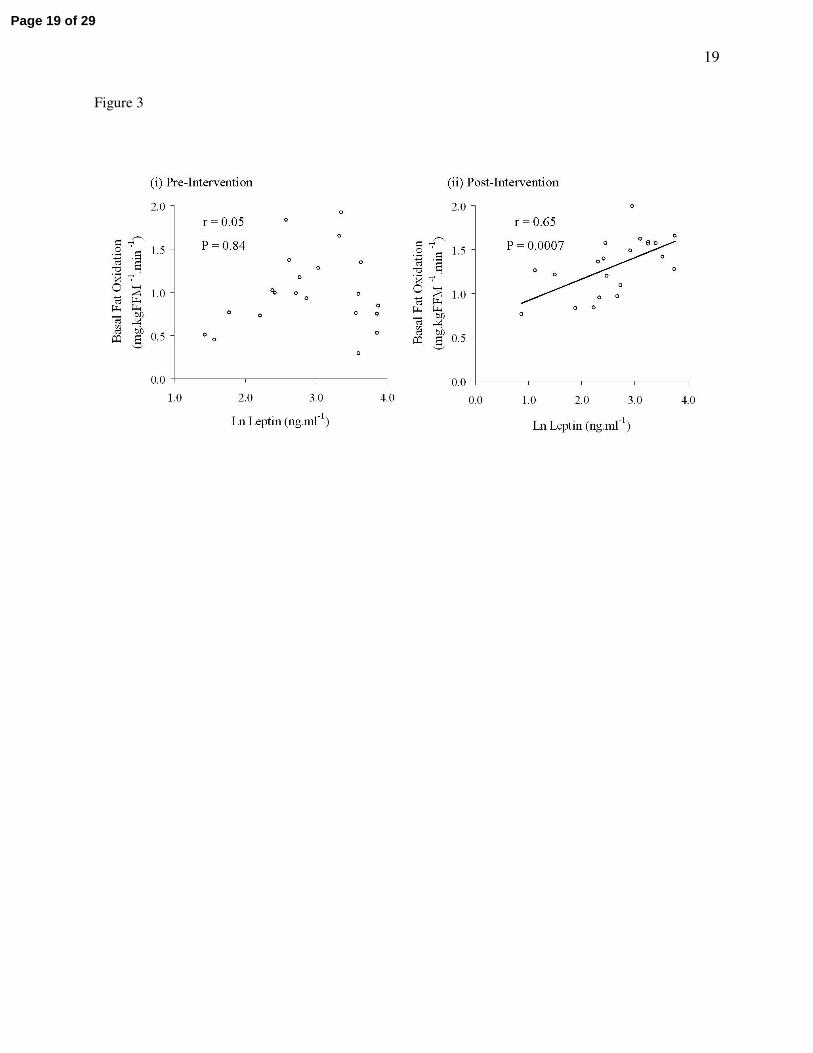
Figure 3 illustrates that following the intervention a strong relationship developed between leptin and
basal fat oxidation post-study (r = 0.65, P = 0.0007) that was not present at baseline (r = 0.046, P = 0.84).
In a separate analysis of eu- and hypocaloric groups, this post-study relationship between leptin and basal
fat oxidation was greatest in the hypocaloric group (hypocaloric vs. eucaloric: r = 0.79, P = 0.005 vs. r =
0.58, P = 0.08).
DISCUSSION
The main finding of this study is that a twelve week aerobic exercise training intervention improves
body composition (weight, fat mass, waist circumference), aerobic fitness (VO2max), leptinemia,
intramuscular lipid accumulation (IMCL), and insulin sensitivity (clamp M) in older, obese, previously
sedentary, IGT individuals, independent of total daily caloric consumption; but that improvement in basal
fat oxidation is dependent on caloric restriction in addition to exercise. In addition, the changes in IMCL
were related to improvements in basal fat oxidation and leptinemia. Furthermore, although changes in
basal fat oxidation were not found to be related to changes in insulin sensitivity, a positive relationship
between basal fat oxidation and plasma leptin developed post-intervention, suggesting an improvement in
leptin sensitivity. This trend was more pronounced when caloric restriction was undertaken in addition to
exercise training. Similar findings in younger obese cohorts have been published by Goodpaster et al. (8)
and He et al. (11) who found a relationship between fat utilization and insulin sensitivity, therefore our
work suggests a possible age-related dissociation of these two variables.
Weight loss via reductions in fat mass lowers systemic free-fatty acid appearance into the
circulation, thus reducing free-fatty acid availability to skeletal muscle tissue (2). In insulin resistant
muscle, as found in older, obese, IGT individuals, where basal fat oxidation is impaired, this will limit the
Page 10 of 29
11
accumulation of intramuscular lipids and other fatty acid derivatives known to interfere with insulin
signaling (21). IMCL content has been described to be elevated in insulin resistant patients (38), yet it
appears that these two variables may disassociate following exercise training (4). In this study, we
demonstrate reduced IMCL post-intervention, which, although not directly related to insulin sensitivity,
was associated with changes in fat oxidation and circulating leptin. It has been suggested that decreased
IMCL with increased rates of basal fat oxidation reduces reliance on plasma free-fatty acids and increases
utilization of intramuscular lipid pools (31). Thus, from our data, we can speculate that reductions in
IMCL in our subjects following exercise training may be due to an increase in IMCL utilization. These
changes occur independently of caloric intake, suggesting that exercise is the key component of the
intervention.
The addition of an exercise stimulus to caloric restriction regimes also upregulates skeletal muscle
capillarization and mitochondrial density (12), and activates enzymes involved in fatty acid transport and
oxidation (17, 18). Therefore it seems likely that exercise training plus caloric restriction would lead to
greater improvements in substrate metabolism and insulin sensitivity than exercise training alone.
However, this current study indicates that, despite larger changes in body composition and leptinemia
following a hypocaloric exercise training regime, improvements in insulin sensitivity appear to be driven
by exercise per se, independent of caloric intake. Alternatively, it is possible that insulin sensitivity
reached a peak improvement in these individuals, one that can be achieved by caloric restriction or by
exercise. To clarify a potential “ceiling effect” in these older obese subjects, the addition of a hypocaloric
non-exercising cohort would be useful. Also, compared to a eucaloric exercise training regime, greater
improvements in basal fat oxidation were seen in our hypocaloric exercise group, despite similar
improvements in maximal aerobic capacity. To explain this finding, it is possible that the improvements in
body composition, insulin sensitivity, and leptin seen in the eucaloric group were below a threshold that
would extrapolate to an improvement in whole body substrate utilization. However, because insulin
Page 11 of 29

12
sensitivity changed equally between groups, it is unlikely that this contributes to the different changes
seen in substrate oxidation. This concept therefore merits further attention in future studies.
Reduced fat mass leads to improvements in plasma adipocytokine concentrations. Such adipose-
derived molecules have direct effects on insulin signaling and substrate utilization (23, 33). Here we
demonstrate reduced post-intervention circulating leptin concentrations. Further to this, our data
demonstrate that a state of leptin resistance existed in our older, obese, IGT cohort, shown by the lack of
correlation between leptin and basal fat oxidation (Figure 3). However, as a result of the exercise training
interventions, leptin sensitivity was improved, particularly in the hypocaloric group (hypocaloric vs.
eucaloric: R = 0.790, P = 0.005 vs. R = 0.579, P = 0.08), suggesting that exercise plus caloric restriction is
required to increase fat oxidation via a leptin-mediated pathway in older, obese, IGT individuals. Leptin
has been shown to upregulate fat oxidation via an AMPK-related pathway (23). Other data also indicate
that leptin fails to upregulate fat oxidation in obese humans when compared to age- and gender-matched
lean individuals, providing further evidence of a defect in leptin signaling in obesity (34). To our
knowledge, no data on the effects of exercise training upon leptin-induced fat oxidation exist in older
obese IGT humans; however, it has been shown that an exercise training regime can upregulate ACC
activity (a leptin-sensitive enzyme) and fat oxidation in lean, middle-aged individuals (31). These
observations suggest a direction for future work. In this study, we demonstrate that the change in
circulating leptin is related to the improvement in IMCL. This is of particular mechanistic interest, as the
improvement in leptin sensitivity as a result of the lifestyle intervention may upregulate AMPK-related fat
oxidation pathways, increasing intramuscular lipid utilization. Adiponectin is another adipocytokine
implicated with insulin sensitivity and substrate oxidation. Analysis showed no effect of exercise or
caloric consumption upon circulating plasma adiponectin. This finding strengthens the evidence that
changes in plasma leptin concentrations as a result of diet and exercise are involved in the changes in
levels of intramyocellular lipid and basal fat oxidation. However, the currently available data on exercise
training, diet and adiponectin, whilst limited, are quite conflicting (1, 3, 28). This is an area that certainly
Page 12 of 29
13
warrants further investigation when considering adiponectin’s potential effect on substrate utilization and
insulin sensitivity (37, 41).
A limitation of the present study is that we did not study a hypocaloric non-exercising group. This
would further control the study by isolating the effects of weight loss per se on the measured metabolic
variables. Additionally, the majority of the volunteers were female, and the small number of males
recruited precluded any gender-difference analyses. Although subjects were postmenopausal, which
would rule out the effects of estrogen on body composition and substrate metabolism, gender differences
have been reported with leptin responses and action (6). Future work should attempt to establish potential
gender differences in aging to ascertain optimal sex-specific lifestyle interventions. Despite this, clear
improvements in body composition, insulin sensitivity, and basal fat metabolism were seen, factors that
are of great importance to an old, obese, IGT group in reducing their risk of developing cardiovascular
disease. In addition, weight loss was not associated with loss of fat-free mass, suggesting that regular
aerobic exercise may have a beneficial impact upon the state of sarcopenia and osteopenia that develops in
such age groups. Maintaining metabolic function and mobility via the preservation of muscular and
skeletal strength is of particular importance to an older, obese group, thus regular exercise prescription is
sensible. In addition, it is important to note that eleven (three eucaloric, eight hypocaloric) of the twenty
three volunteers were no longer classified as IGT (FPG > 5.6 mmol.l-1) following the intervention. FPG is
a strong predictor of diabetes progression, and so, this study shows that just twelve weeks of lifestyle
intervention is enough to greatly reduce disease risk in older, obese individuals, and to normalize glucose
tolerance in approximately 50% of participants.
The major take home message of this study is that regular moderate-intensity aerobic exercise is the
driving force behind improvements in insulin sensitivity when older, obese, and previously sedentary IGT
individuals follow an exercise and diet regime. Despite greater changes in body composition following a
calorie-restricted exercise intervention, such changes did not extrapolate to greater changes in insulin
sensitivity when compared to a eucaloric exercise intervention. The loss of body fat mass in addition to
Page 13 of 29
14
the maintenance of fat-free mass is of importance to older cohorts. Such changes were demonstrated in
this study. We also document that older, obese, IGT individuals exhibit leptin resistance with respect to
basal fat oxidation, and that exercise training improves leptin sensitivity independent of caloric intake.
This is a novel insight into the understanding of the onset of metabolic disease in obese sedentary groups.
Further work in this area is warranted to identify the mechanistic pathways.
Page 14 of 29
15
ACKNOWLEDGMENTS
The authors wish to thank the volunteers for their outstanding dedication and effort. We wish to
acknowledge the nursing/dietary staff of the General Clinical Research Center and the
technical/engineering staff and students who helped with the implementation of the study and assisted
with data collection. This research was supported by NIH grants AG12834 (JPK), and GCRC grants MO1
RR10732, RR00080, and RR018390.
Page 15 of 29
16
FIGURE LEGENDS
Figure 1 – Changes in basal substrate metabolism
Twenty three older, obese, and previously sedentary IGT individuals followed a twelve week
aerobic exercise training intervention, combined with either a eucaloric (~1900 kcal.day-1) or a
hypocaloric (~1300 kcal.day-1) diet. Basal fat oxidation showed a larger improvement in the hypocaloric
group (∆ Fox: *, P = 0.03). No differences in the change in basal carbohydrate oxidation were found (∆
Cox: P = 0.87). Data represents mean ± S.E.M.
Figure 2 – Relationship between intramyocellular lipid and basal fat oxidation
Data from the two study groups were pooled for correlation analyses. The data indicate that in older,
obese, sedentary, IGT individuals the decrease in intramyocellular lipid (delta IMCL) and the increase in
basal fat oxidation (delta basal Fox) as a result of the exercise training intervention were related (r = -0.53,
P = 0.04).
Figure 3 – Relationships between plasma leptin and basal fat oxidation
Data from the two study groups were pooled for correlation analyses. Raw plasma leptin
concentration data deviated from a normal distribution and so was natural log (ln) transformed for
statistical analysis. Panel (i) illustrates that in older, obese, sedentary, IGT individuals no relationship
existed between plasma leptin and basal fat oxidation (r = 0.05, P = 0.84). Panel (ii) shows that following
the twelve week exercise training regime, a significant relationship between plasma leptin and basal fat
oxidation was present (r = 0.65, P = 0.0007).
Page 16 of 29
17
FIGURES
Figure 1
Page 17 of 29

18
Figure 2
Page 18 of 29
19
Figure 3
Page 19 of 29

20
TABLE LEGENDS
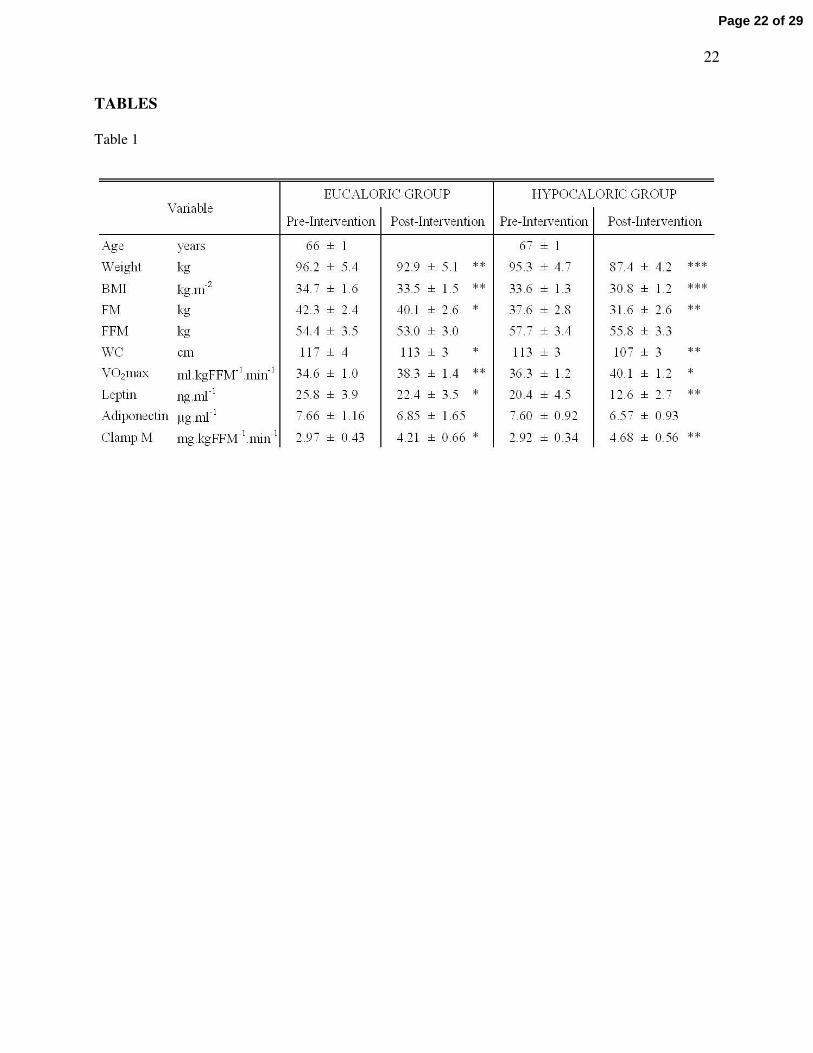
Table 1 - Body composition, aerobic fitness, leptinemia, and insulin sensitivity
Volunteers underwent a twelve week aerobic exercise training intervention with either a eucaloric
(~1900 kcal.day-1) or a hypocaloric (~1300 kcal.day-1) diet. Significant differences from baseline are
represented by * (P < 0.05), ** (P < 0.01), and *** (P < 0.001). Group*time interactions were found with
weight, BMI, FM, and leptin (all P < 0.05). BMI is body mass index; FM is fat mass; FFM is fat-free
mass; WC is waist circumference; VO2max is maximal oxygen uptake during exhaustive exercise; Clamp
M is the mean glucose disposal rate during the last 30 min of a hyperinsulinemic euglycemic clamp. Data
represents mean ± S.E.M.
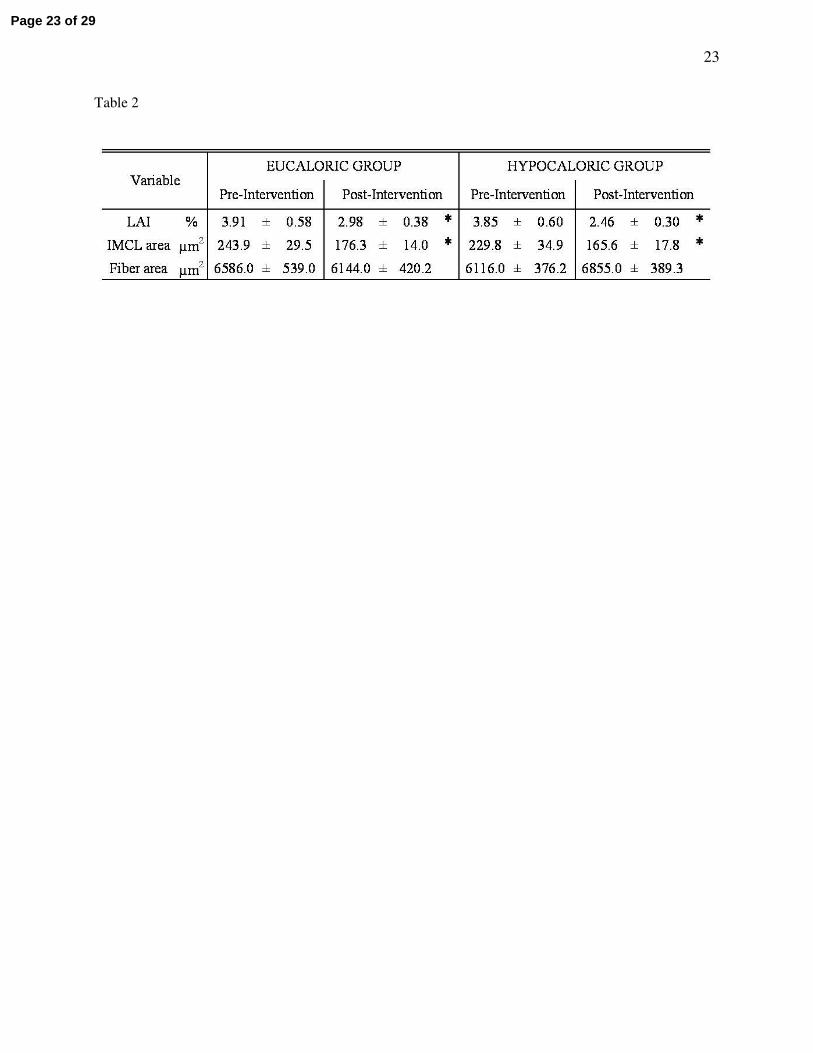
Table 2 – Intramyocellular lipid
Study groups are described in Table 1. IMCL is intramuscular lipid. LAI is the lipid accumulation
index, i.e. the mean percentage area of an individual skeletal muscle fiber that stains for lipid. * represents
a statistically significant difference from the Pre-Intervention value (P < 0.05). Data represents mean ±
S.E.M.
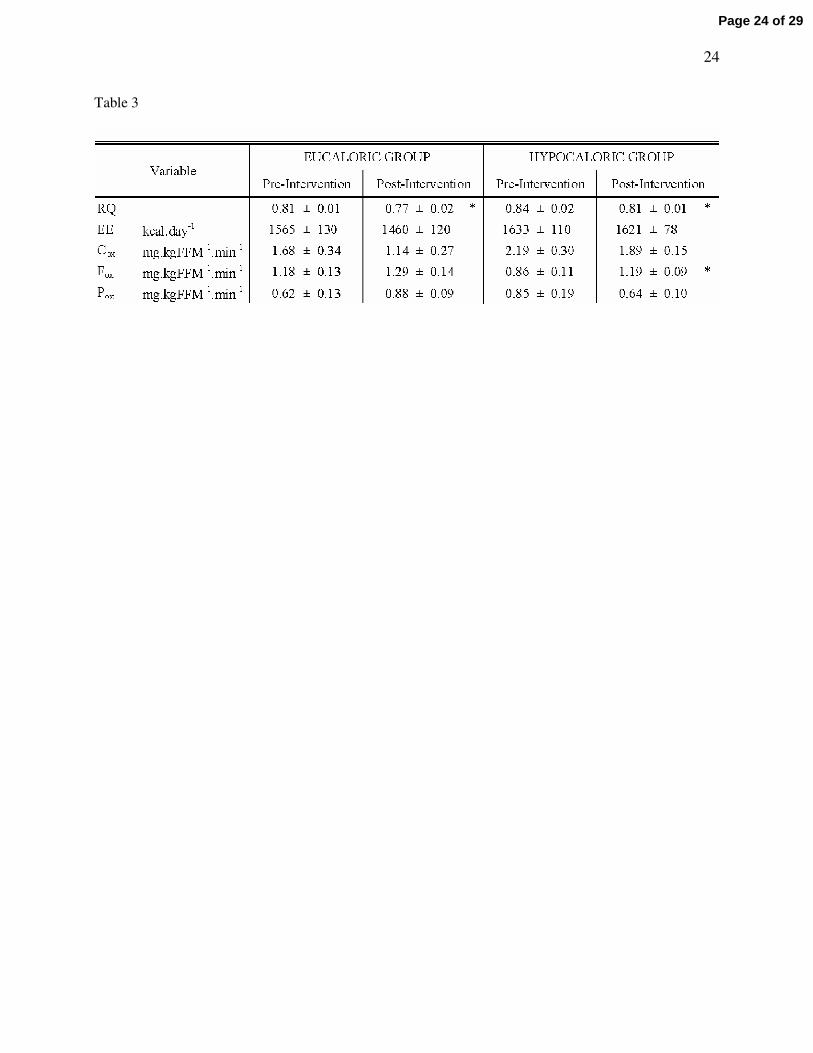
Table 3 - Basal substrate metabolism
The study groups are as described in Table 1. Significant differences from baseline are represented
by * (P < 0.05). No group*time interactions were found (P > 0.05). RQ is respiratory quotient; EE is
energy expenditure; Cox is basal carbohydrate oxidation; Fox is basal fat oxidation; Pox is basal protein
oxidation. Data represents mean ± S.E.M.
Table 4 - Bivariate correlation analyses
Due to the lack of group*time interactions in the majority of variables, it was assumed that the
exercise training was driving the changes independent of caloric intake; therefore, the intervention groups
Page 20 of 29

21
were pooled for correlation analyses. Values shown are Pearson’s product moment correlation
coefficients (r-values) for relationships between changes in variables (∆) during the twelve week exercise
training intervention. Significant correlations are represented by * (P < 0.05), ** (P < 0.01), and *** (P <
0.001). Raw plasma leptin concentration data were natural log transformed (ln leptin) for statistical
analysis.
Page 21 of 29
22
TABLES
Table 1
Page 22 of 29
23
Table 2
Page 23 of 29
24
Table 3
Page 24 of 29
25
Table 4
Page 25 of 29

26
REFERENCES
1. Abbasi F, Chang SA, Chu JW, Ciaraldi TP, Lamendola C, McLaughlin T, Reaven GM, and
Reaven PD. Improvements in insulin resistance with weight loss, in contrast to rosiglitazone, are not
associated with changes in plasma adiponectin or adiponectin multimeric complexes. Am J Physiol Regul
Integr Comp Physiol 290: R139-144, 2006.
2. Blaak EE, Wolffenbuttel BHR, Saris WHM, Pelsers MMAL, and Wagenmakers AJM.
Weight Reduction and the Impaired Plasma-Derived Free Fatty Acid Oxidation in Type 2 Diabetic
Subjects. 2001, p. 1638-1644.
3. Bluher M, Bullen JW, Jr., Lee JH, Kralisch S, Fasshauer M, Kloting N, Niebauer J, Schon
MR, Williams CJ, and Mantzoros CS. Circulating adiponectin and expression of adiponectin receptors
in human skeletal muscle: associations with metabolic parameters and insulin resistance and regulation by
physical training. J Clin Endocrinol Metab 91: 2310-2316, 2006.
4. Bruce CR, Kriketos AD, Cooney GJ, and Hawley JA. Disassociation of muscle triglyceride
content and insulin sensitivity after exercise training in patients with Type 2 diabetes. Diabetologia 47:
23-30, 2004.
5. DeFronzo RA, Tobin JD, and Andres R. Glucose clamp technique: a method for quantifying
insulin secretion and resistance. Am J Physiol 237: E214-223, 1979.
6. Flanagan DE, Vaile JC, Petley GW, Phillips DI, Godsland IF, Owens P, Moore VM,
Cockington RA, and Robinson JS. Gender differences in the relationship between leptin, insulin
resistance and the autonomic nervous system. Regulatory Peptides 140: 37-42, 2007.
7. Frayn KN. Calculation of substrate oxidation rates in vivo from gaseous exchange. J Appl
Physiol 55: 628-634, 1983.
8. Goodpaster BH, Katsiaras A, and Kelley DE. Enhanced fat oxidation through physical activity
is associated with improvements in insulin sensitivity in obesity. Diabetes 52: 2191-2197, 2003.
9. Goodpaster BH, Theriault R, Watkins SC, and Kelley DE. Intramuscular lipid content is
increased in obesity and decreased by weight loss. Metabolism 49: 467-472, 2000.
10. Halaas JL, Gajiwala KS, Maffei M, Cohen SL, Chait BT, Rabinowitz D, Lallone RL, Burley
SK, and Friedman JM. Weight reducing effects of the plasma protein encoded by the obese gene.
Science 269: 543-546, 1995.
11. He J, Goodpaster BH, and Kelley DE. Effects of weight loss and physical activity on muscle
lipid content and droplet size. Obes Res 12: 761-769, 2004.
12. Holloszy JO, and Coyle EF. Adaptations of skeletal muscle to endurance exercise and their
metabolic consequences. J Appl Physiol 56: 831-838, 1984.
Page 26 of 29

27
13. Horber FF, Gruber B, Thomi F, Jensen EX, and Jaeger P. Effect of sex and age on bone mass,
body composition and fuel metabolism in humans. Nutrition 13: 524-534, 1997.
14. Katzel LI, Bleecker ER, Colman EG, Rogus EM, Sorkin JD, and Goldberg AP. Effects of
weight loss vs aerobic exercise training on risk factors for coronary disease in healthy, obese, middle-aged
and older men. A randomized controlled trial. Jama 274: 1915-1921, 1995.
15. Kelley DE, Goodpaster BH, Wing RR, and Simoneau JA. Skeletal muscle fatty acid
metabolism association with insulin resistance, obesity, and weight loss. Am J Physiol 277: E1130-E1141,
1999.
16. Kelley DE, and Mandarino LJ. Fuel selection in human skeletal muscle in insulin resistance: a
reexamination. Diabetes 49: 677-683, 2000.
17. Kiens B. Effect of endurance training on fatty acid metabolism: local adaptations. Med Sci Sports
Exerc 29: 640-645, 1997.
18. Kiens B, Essen-Gustavsson B, Christensen NJ, and Saltin B. Skeletal muscle substrate
utilization during submaximal exercise in man: effect of endurance training. J Physiol 469: 459-478, 1993.
19. Kirwan JP, del Aguila LF, Hernandez JM, Williamson DL, O'Gorman DJ, Lewis R, and
Krishnan RK. Regular exercise enhances insulin activation of IRS-1 associated PI3-kinase in human
skeletal muscle. J Appl Physiol 88: 797-803, 2000.
20. Kirwan JP, Kohrt WM, Wojta DM, Bourey RE, and Holloszy JO. Endurance exercise
training reduces glucose-stimulated insulin levels in 60- to 70-year old men and women. J Gerontol 48:
M84-90, 1993.
21. Krebs M, and Roden M. Molecular mechanisms of lipid-induced insulin resistance in muscle,
liver and vasculature. Diabetes Obes Metab 7: 621-632, 2005.
22. Melanson KJ, Saltzman E, Russell RR, and Roberts SB. Fat oxidation in response to four
graded energy challenges in younger and older women. Am J Clin Nutr 66: 860-866, 1997.
23. Minokoshi Y, Kim YB, Peroni OD, Fryer LG, Muller C, Carling D, and Kahn BB. Leptin
stimulates fatty-acid oxidation by activating AMP-activated protein kinase. Nature 415: 339-343, 2002.
24. Mokdad AH, Ford ES, Bowman BA, Dietz WH, Vinicor F, Bales VS, and Marks JS.
Prevalence of obesity, diabetes, and obesity-related health risk factors, 2001. JAMA 289: 76-79, 2003.
25. Morley JE, Baumgartner RN, Roubenoff R, Mayer J, and Nair KS. Sarcopenia. J Lab Clin
Med 137: 231-243, 2001.
26. Nagy TR, Goran MI, Weinsier RL, Toth MJ, Schutz Y, and Poehlman ET. Determinants of
basal fat oxidation in healthy Caucasians. J Appl Physiol 80: 1743-1748, 1996.
27. Nicklas BJ, Rogus EM, and Goldberg AP. Exercise blunts declines in lipolysis and fat oxidation
after dietary-induced weight loss in obese older women. Am J Physiol 273: E149-E155, 1997.
Page 27 of 29
28
28. O'Leary VB, Jorett AE, Marchetti CM, Gonzalez F, Phillips SA, Ciaraldi TP, and Kirwan
JP. Enhanced adiponectin multimer ratio and skeletal muscle adiponectin receptor expression following
exercise training and diet in older insulin-resistant adults. Am J Physiol Endocrinol Metab 293: E421-427,
2007.
29. O'Leary VB, Marchetti CM, Krishnan RK, Stetzer BP, Gonzalez F, and Kirwan JP.
Exercise-induced reversal of insulin resistance in obese elderly is associated with reduced visceral fat. J
Appl Physiol 100: 1584-1589, 2006.
30. Ryan AS. Insulin resistance with aging: effects of diet and exercise. Sports Med 30: 327-346,
2000.
31. Schrauwen P, van Aggel-Leijssen DPC, Hul G, Wagenmakers AJM, Vidal H, Saris WHM,
and van Baak MA. The effect of a 3-month low-intensity endurance training program on fat oxidation
and acetyl-CoA carboxylase-2 expression. 51: 2220-2226, 2002.
32. Schutz Y, Tremblay A, Weinsier RL, and Nelson KM. Role of fat oxidation in the long-term
stabilization of body weight in obese women. Am J Clin Nutr 55: 670-674, 1992.
33. Segal KR, Landt M, and Klein S. Relationship between insulin sensitivity and plasma leptin
concentration in lean and obese men. Diabetes 45: 988-991, 1996.
34. Steinberg GR, Parolin ML, Heigenhauser GJ, and Dyck DJ. Leptin increases FA oxidation in
lean but not obese human skeletal muscle: evidence of peripheral leptin resistance. Am J Physiol
Endocrinol Metab 283: E187-192, 2002.
35. Sullivan PW, Morrato EH, Ghushchyan V, Wyatt HR, and Hill JO. Obesity, inactivity, and
the prevalence of diabetes and diabetes-related cardiovascular comorbidities in the U.S., 2000-2002.
Diabetes Care 28: 1599-1603, 2005.
36. Toledo FG, Menshikova EV, Ritov VB, Azuma K, Radikova Z, Delany J, and Kelley DE.
Effects of Physical Activity and Weight Loss on Skeletal Muscle Mitochondria and Relationship to
Glucose Control in Type 2 Diabetes Mellitus. Diabetes Epub ahead of print: 2007.
37. Tschritter O, Fritsche A, Thamer C, Haap M, Shirkavand F, Rahe S, Staiger H, Maerker E,
Haring H, and Stumvoll M. Plasma adiponectin concentrations predict insulin sensitivity of both glucose
and lipid metabolism. Diabetes 52: 239-243, 2003.
38. van Loon LJ, Koopman R, Manders R, van der Weegen W, van Kranenburg GP, and
Keizer HA. Intramyocellular lipid content in type 2 diabetes patients compared with overweight sedentary
men and highly trained endurance athletes. Am J Physiol Endocrinol Metab 287: E558-565, 2004.
39. Weir JBV. New methods for calculating metabolic rate with special reference to protein
metabolism. J Physiol 109: 1-9, 1949.
Page 28 of 29
29
40. Williamson DL, and Kirwan JP. A single bout of concentric resistance exercise increases basal
metabolic rate 48 hours after exercise in healthy 59-77-year-old men. J Gerontol A Biol Sci Med Sci 52:
M352-355, 1997.
41. Yamauchi T, Kamon J, Minokoshi Y, Ito Y, Waki H, Uchida S, Yamashita S, Noda M, Kita
S, Ueki K, Eto K, Akanuma Y, Froguel P, Foufelle F, Ferre P, Carling D, Kimura S, Nagai R, Kahn
BB, and Kadowaki T. Adiponectin stimulates glucose utilization and fatty-acid oxidation by activating
AMP-activated protein kinase. Nat Med 8: 1288-1295, 2002.
Page 29 of 29