Attenuation of inflammation and cellular stress-related pathways maintains insulin sensitivity in...
13
RESEARCH ARTICLE Attenuation of inflammation and cellular stress-related pathways maintains insulin sensitivity in obese type I interleukin-1 receptor knockout mice on a high-fat diet Baukje de Roos 1 , Vanessa Rungapamestry 2 , Karen Ross 1 , Garry Rucklidge 1 , Martin Reid 1 , Gary Duncan 1 , Graham Horgan 3 , Sinead Toomey 2 , John Browne 2 , Christine E. Loscher 2 , Kingston H. G. Mills 4 and Helen M. Roche 2 1 Rowett Institute of Nutrition and Health, University of Aberdeen, Aberdeen, UK 2 Nutrigenomics Research Group, UCD Conway Institute, School of Public Health & Population Science, University College Dublin, Dublin, Ireland 3 Biomathematics and Statistics Scotland, Rowett Research Institute, Aberdeen, UK 4 Immune Regulation Research Group, School of Biochemistry and Immunology, Trinity College Dublin, Dublin, Ireland Received: September 25, 2008 Revised: February 27, 2009 Accepted: March 6, 2009 The development of insulin resistance in the obese is associated with chronic, low-grade inflammation. We aimed to identify novel links between obesity, insulin resistance and the inflammatory response by comparing C57BL/6 with type I interleukin-1 receptor knockout (IL-1RI À/À ) mice, which are protected against diet-induced insulin resistance. Mice were fed a high-fat diet for 16 wk. Insulin sensitivity was measured and proteomic analysis was performed on adipose, hepatic and skeletal muscle tissues. Despite an equal weight gain, IL-1RI À/À mice had lower plasma glucose, insulin and triacylglycerol concentrations, compared with controls, following dietary treatment. The higher insulin sensitivity in IL-1RI À/À mice was associated with down-regulation of antioxidant proteins and proteasomes in adipose tissue and hepatic soluble epoxide hydrolase, consistent with a compromised inflammatory response as well as increased glycolysis and decreased fatty acid b-oxidation in their muscle. Their lower hepatic triacylglycerol concentrations may reflect decreased flux of free fatty acids to the liver, decreased hepatic fatty acid-binding protein expression and decreased lipogenesis. Correlation analysis revealed down- regulation of classical biomarkers of ER stress in their adipose tissue, suggesting that disruption of the IL-1RI-mediated inflammatory response may attenuate cellular stress, which was asso- ciated with significant protection from diet-induced insulin resistance, independent of obesity. Keywords: Cellular stress / Inflammation / Insulin resistance / Inter-organ proteomics / Type I interleukin-1 receptor 1 Introduction Obesity is associated with chronic, low-grade inflammation that has been implicated in the development of insulin resistance and type II diabetes mellitus (T2DM). The inflammatory response may be triggered, and reside Abbreviations: A.U., arbitrary units; EET, epoxyeicosatrieonic acid; FABP, fatty acid-binding protein; HOMA, homeostasis model assessment for insulin resistance; IL-1RI À/À , type I interleukin-1 receptor knockout; MCP-1, chemokine monocyte chemotactic protein-1; NFjB p65, nuclear factor-kappa B p65; PDK, pyruvate dehydrogenase kinase; PLS-DA, partial least squares-discriminant analysis; QUICKI, quantitative insulin sensitivity check index; sEH, soluble epoxide hydrolase; SMP30, senescence marker protein 30; T2DM, type II diabetes mellitus; TAG, triacylglycerol; TNF, tumour necrosis factor; WAT, white adipose tissue These authors contributed equally to this work. Correspondence: Dr. Baukje de Roos, University of Aberdeen, Rowett Institute of Nutrition & Health, Greenburn Road, Bucks- burn, Aberdeen AB21 9SB, UK E-mail: [email protected] Fax: 144-1224-716629 & 2009 WILEY-VCH Verlag GmbH & Co. KGaA, Weinheim www.proteomics-journal.com 3244 Proteomics 2009, 9, 3244–3256 DOI 10.1002/pmic.200800761
-
Upload
independent -
Category
Documents
-
view
0 -
download
0
Transcript of Attenuation of inflammation and cellular stress-related pathways maintains insulin sensitivity in...
RESEARCH ARTICLE
Attenuation of inflammation and cellular stress-related
pathways maintains insulin sensitivity in obese type I
interleukin-1 receptor knockout mice on a high-fat diet
Baukje de Roos1�, Vanessa Rungapamestry2�, Karen Ross1, Garry Rucklidge1, Martin Reid1,Gary Duncan1, Graham Horgan3, Sinead Toomey2, John Browne2, Christine E. Loscher2,Kingston H. G. Mills4 and Helen M. Roche2
1 Rowett Institute of Nutrition and Health, University of Aberdeen, Aberdeen, UK2 Nutrigenomics Research Group, UCD Conway Institute, School of Public Health & Population Science,
University College Dublin, Dublin, Ireland3 Biomathematics and Statistics Scotland, Rowett Research Institute, Aberdeen, UK4 Immune Regulation Research Group, School of Biochemistry and Immunology, Trinity College Dublin, Dublin,
Ireland
Received: September 25, 2008
Revised: February 27, 2009
Accepted: March 6, 2009
The development of insulin resistance in the obese is associated with chronic, low-grade
inflammation. We aimed to identify novel links between obesity, insulin resistance and the
inflammatory response by comparing C57BL/6 with type I interleukin-1 receptor knockout
(IL-1RI�/�) mice, which are protected against diet-induced insulin resistance. Mice were fed a
high-fat diet for 16 wk. Insulin sensitivity was measured and proteomic analysis was performed
on adipose, hepatic and skeletal muscle tissues. Despite an equal weight gain, IL-1RI�/� mice
had lower plasma glucose, insulin and triacylglycerol concentrations, compared with controls,
following dietary treatment. The higher insulin sensitivity in IL-1RI�/�mice was associated with
down-regulation of antioxidant proteins and proteasomes in adipose tissue and hepatic soluble
epoxide hydrolase, consistent with a compromised inflammatory response as well as increased
glycolysis and decreased fatty acid b-oxidation in their muscle. Their lower hepatic triacylglycerol
concentrations may reflect decreased flux of free fatty acids to the liver, decreased hepatic fatty
acid-binding protein expression and decreased lipogenesis. Correlation analysis revealed down-
regulation of classical biomarkers of ER stress in their adipose tissue, suggesting that disruption
of the IL-1RI-mediated inflammatory response may attenuate cellular stress, which was asso-
ciated with significant protection from diet-induced insulin resistance, independent of obesity.
Keywords:
Cellular stress / Inflammation / Insulin resistance / Inter-organ proteomics / Type I
interleukin-1 receptor
1 Introduction
Obesity is associated with chronic, low-grade inflammation
that has been implicated in the development of insulin
resistance and type II diabetes mellitus (T2DM). The
inflammatory response may be triggered, and reside
Abbreviations: A.U., arbitrary units; EET, epoxyeicosatrieonic
acid; FABP, fatty acid-binding protein; HOMA, homeostasis
model assessment for insulin resistance; IL-1RI�/�, type I
interleukin-1 receptor knockout; MCP-1, chemokine monocyte
chemotactic protein-1; NFjB p65, nuclear factor-kappa B p65;
PDK, pyruvate dehydrogenase kinase; PLS-DA, partial least
squares-discriminant analysis; QUICKI, quantitative insulin
sensitivity check index; sEH, soluble epoxide hydrolase;
SMP30, senescence marker protein 30; T2DM, type II diabetes
mellitus; TAG, triacylglycerol; TNF, tumour necrosis factor; WAT,
white adipose tissue
�These authors contributed equally to this work.
Correspondence: Dr. Baukje de Roos, University of Aberdeen,
Rowett Institute of Nutrition & Health, Greenburn Road, Bucks-
burn, Aberdeen AB21 9SB, UK
E-mail: [email protected]
Fax: 144-1224-716629
& 2009 WILEY-VCH Verlag GmbH & Co. KGaA, Weinheim www.proteomics-journal.com
3244 Proteomics 2009, 9, 3244–3256DOI 10.1002/pmic.200800761
predominantly, in adipose tissue, although other metaboli-
cally critical sites may also be involved as the disease
progresses [1]. However, much remains to be discovered
about the role of adipocytes in inflammation [2]. The
macrophage-inflammatory response in white adipose tissue
(WAT) may be a general phenomenon associated with
morbid fat-mass expansion, as demonstrated by significant
regulation of macrophage and inflammatory genes in the
WAT of obese mice [3]. A key question is what proportion of
these inflammatory genes are causally linked to particular
metabolic outcomes [2].
Growing evidence indicates a correlation, and possibly a
causative relationship, between inflammation and insulin
resistance in T2DM. Mice lacking the tumour necrosis
factor-a (TNF-a) ligand, the p55 TNF receptor, or monocyte
chemotactic protein-1 (MCP-1), are partially protected from
obesity-induced insulin resistance [4, 5], although the
contributory role of MCP-1 in dysregulation of metabolic
function has been disputed [6]. Furthermore, macrophage
and inflammatory genes were up-regulated before an
increase in circulating insulin levels, indicating that
macrophage activities occur after the increase in adiposity,
but before insulin resistance [7]. It is currently unknown
how the inflammatory response initiated in WAT ultimately
causes systemic insulin resistance, but it may involve lipo-
lysis. TNF-a directly decreases insulin sensitivity and
increases lipolysis in murine and human adipocytes [8, 9].
Moreover, free fatty acids activate immune cells that may
infiltrate hypertrophic adipose tissue via an up-regulation
of Toll-like receptors 2 and 4, and c-Jun-N-terminal
kinase-dependant stress and pro-inflammatory signalling
pathways [10].
In this study, we explored novel links between obesity,
plasma lipids, insulin resistance, hepatic weight and fat
accumulation, focusing on the adipose tissue, liver and
muscle proteome in type I interleukin-1 receptor I (IL-1RI)
knockout mice. IL-1 is a potent mediator of innate inflam-
mation [11], which exerts its biological functions viathe IL-1RI. The expression of the IL-1R and IL-1b is
elevated in visceral adipose tissue of obese subjects [12].
Therefore, IL-1RI represents a potential target that
mediates the pro-inflammatory, insulin resistant state
associated with diet-induced obesity. Thus the IL-1RI�/�
mouse model presents the ideal context to explore the
interaction between the innate inflammatory process and
insulin sensitivity within three organs that play a key role in
insulin resistance.
2 Materials and methods
2.1 Animals and diets
IL-1RI�/� (C57BL/6 background sourced from Jackson
Laboratories), and C57BL/6 control (purchased from
Harlan) 6-wk old male mice were held at the BioResources
Unit of Trinity College Dublin (Ireland) under specific
pathogen-free conditions. Ethical approval was obtained
from the Trinity College Dublin Ethics Committee and mice
were maintained according to the regulations of the
European Union and the Irish Department of Health that
govern the use of animals in research. Seven IL-1RI�/� and
eight C57BL/6 control mice were each fed a high-fat diet
(60% Kcal from fat; Research Diets, New Brunswick, NJ,
USA) for 16 wk. Body weight was recorded at the start and
end of dietary intervention. Following dietary treatment, a
fasting blood sample was taken and animals were culled by
CO2 inhalation. Liver, skeletal muscle from the hind leg and
epididymal WAT were harvested, frozen in liquid nitrogen,
and stored at �801C.
2.2 Plasma analysis
Plasma glucose, insulin, NEFA and triacylglycerol (TAG)
concentrations were measured using commercially available
kits, as for serum [13]. Fasting plasma insulin and glucose
concentrations were used to calculate the biomarker insulin
resistance from the homoeostasis model assessment for
insulin resistance (HOMA) ((glucose0� insulin0)/22.5) [14].
The biomarker insulin sensitivity was calculated from
the revised quantitative insulin sensitivity check index
(QUICKI) (1/(log insulin0 1 log glucose0 1 log NEFA0))
[15]. Plasma adiponectin and IL-6 concentrations were
determined using Mouse Quantikine Elisa kits (R & D
Systems, MN, USA).
2.3 Tissue weight, and lipid and adipophilin analysis
Total hepatic lipids were extracted using the method of
Folch as described by us previously [16]. For TAG analysis,
the lipid fraction was re-suspended in chloroform:methanol
(2:1) and 10 mg of lipid was dried under a stream of
nitrogen in a separate tube and re-suspended in 5 mL
ethanol. TAG levels were analysed in quadruplicate
by a commercial kit according to the manufacturer’s
instructions (Thermoelectron triglyceride kit, Lab medics,
Manchester, UK), using a glycerol standard (Sigma, UK).
Hepatic adipophilin in cytosolic protein homogenates was
measured by an in-house ELISA using a specific polyclonal
antibody (Fitzgerald Industries International, Concord,
MA, USA) [16]. The weight of the adipose tissue was also
recorded.
2.4 Separation and identification of proteins
Adipose tissue protein homogenates were prepared from
epididymal fat depots (300–500 mg per animal) by homo-
genisation in 1 mL of lysis buffer (7 M urea, 2 M thiourea,
4% CHAPS, 2% Ampholite, pH 3–10) and centrifugation at
Proteomics 2009, 9, 3244–3256 3245
& 2009 WILEY-VCH Verlag GmbH & Co. KGaA, Weinheim www.proteomics-journal.com
200� g for 5 min. The supernatant was carefully transferred
to a Beckman microfuge tube without disrupting the over-
lying layer of lipid and then centrifuged at 226 000� g and
201C for 30 min (Beckman TL-100). Protein was determined
from the resulting supernatant using the RC/DC protein
assay (Bio-Rad, Hemel Hempstead, UK) and 100mg of the
protein was loaded per 2-D gel. Cytosolic hepatic protein
homogenates were prepared from each animal [17, 18] and
300 mg of hepatic protein was loaded per 2-D gel. Skeletal
muscle protein homogenates were prepared from the hind-
leg muscles (approximately 200 mg per animal), as described
for hepatic tissue [17, 18], after grinding the frozen tissue to
a powder in liquid nitrogen and 300 mg of protein was loaded
per 2-D gel.
Proteins were separated by 2-D gel electrophoresis using
one 2-D gel per tissue sample per animal, as described
previously [17, 18] with the following modifications. Bio-Rad
IPG strips (pH 5–8 for liver and adipose tissue and pH 3–10
for muscle) were used for the separation of proteins in the
first dimension. Gels were stained using the flamingo
fluorescent stain (Bio-Rad) and analysed using PDQuest 2-DAnalysis Software, version 7.1.1 (Bio-Rad, Hercules, CA,
USA). Spot densities were normalised using the local
regression model within the PDQuest software. Spots with
densities that significantly contributed to the treatment
effects were excised from the SDS-PAGE gels using the
EXQuestTM Spot Cutter (Bio-Rad). These proteins were
trypsinised using a protocol of the MassPrep Station
(Micromass) and analysed by MALDI-TOF and by electro-
spray LC-MS/MS as described previously [17–19]. The
MS/MS spectra of peptide fragments were forwarded the
MASCOT search engine version 2.1 (http://www.ma-
trixscience.com) for database searching, using the following
search criteria for Mus musculus: allowance of 0 or 1 missed
cleavages, trypsin as digestion enzyme, carbamidomethyl
modification of cystein, methione oxidation as partial
modification and charged state as MH1, as described
previously [19].
2.5 Western blot analysis of adipose tissue nuclear
factor-kappa B p65 (NF-jB P65) and hepatic
soluble epoxide hydrolase (sEH)
As indicators of an altered tissue-specific inflammatory
response to support our proteomics data, adipose tissue
NF-kB P65 (in four IL-1RI�/� samples and three C57BL/6
control samples) and hepatic sEH protein levels (in five
IL-1RI�/� samples and six C57BL/6 control samples) were
analysed by Western blot as described previously [17], with
the following modifications. Cytosolic protein (8 mg) was
loaded for 1-D gel electrophoresis. Following transfer of
protein onto nitrocellulose membranes, the latter were
blocked using 5% BSA in TBS with 0.05% Tween and
incubated overnight at 41C with anti-NF-kB P65 (Santa
Cruz, CA, USA; 1:500) or anti-sEH (Santa Cruz; 1:1000)
antibodies diluted in 3% BSA. Membranes were also probed
with anti-actin antibody (1:1000) to ascertain equal loading
of protein. Membranes were washed with TBS with 0.05%
Tween and incubated with peroxidase conjugate anti-rabbit
antibody (Sigma; 1:5000) for 2 h at room temperature.
After further washing, immunoreactive protein complexes
were visualised using a chemiluminescent reagent
(Supersignals West Pico Chemiluminescent Substrate,
Pierce, IL, USA). Membranes were exposed to film for
1–10 min and processed using an Agfa X-ray processor.
Protein bands were quantified by densitometry, using the
TINA software version 2.09c (Raytest, Straubenhardt,
Germany), and protein levels were expressed as arbitrary
units (A.U.).
2.6 Gene expression analysis of TNF-a and MCP-1 in
epididymal fat
Total RNA was extracted from epididymal fat using Trizol
Reagent (Invitrogen, Paisley, UK). The concentration was
adjusted to 50 ng/mL and the RNA samples were stored at
�801C. Single stranded cDNA was prepared using the High
Capacity cDNA Archive kit (Applied Biosystems, Warring-
ton, UK). Labelled probes and primers for TNF-a and
MCP-1 were obtained from Applied Biosystems. The relative
concentration of both genes was determined using the
standard curve approach with an external reference gene
(GAPDH) [13].
2.7 Statistical analysis
Data were presented as means7SD (n 5 7–8). Unpaired
t-tests were performed on plasma parameters and protein
spot data, and p-values o0.05 were considered statistically
significant. Data which were not normally distributed were
log-transformed before analysis. Principal component
analysis was performed after unit variance scaling of the
data, and partial least squares-discriminant analysis
(PLS-DA) was performed on centred data in SIMCA-P1
version 10.5.0.0 (Umetrics, UK). Protein spots with a
substantial positive or negative contribution to the outcome
were identified from the loading plots [16–18]. Analysis of
correlations between plasma measurements, and adipose
tissue, hepatic and muscle proteins was performed with
Pearson correlation coefficients. The analysis of multiple
hypotheses testing was done by determining the false
discovery rate, using the method of Storey & Tibshirani [20].
q-values estimate the probability that a significant correla-
tion is false positive. For example, a q-value of 0.05
indicates that we should expect that 5 out of 100 associations
that were tested significant are in fact false positive.
A network of significant pair-wise interactions was
constructed using the spring embedded algorithm in
Cytoscape 2.4.1.
3246 B. de Roos et al. Proteomics 2009, 9, 3244–3256
& 2009 WILEY-VCH Verlag GmbH & Co. KGaA, Weinheim www.proteomics-journal.com
3 Results
3.1 Food intake, body weight and the metabolic
profile
Food intake did not differ between the intervention groups
(data not shown). Both groups gained similar body weight
after 16 wk on the high-fat diet (19.777.2 g in IL-1RI�/�mice
and 23.274.4 g in control mice, p40.05). IL-1RI�/� mice,
compared with control animals, had significantly
lower plasma TAG (0.6270.15 versus 0.8970.16 mmol/L,
po0.01), NEFA (574.58734.42 versus 775.63788.69mmol/L,
po0.001), and glucose (5.8270.46 versus 8.0570.73 mmol/L,
po0.001) concentrations. After the high-fat diet, HOMA, an
index of insulin resistance, was improved in obese IL-1RI�/�
mice compared with their obese control counterparts
(9.0973.77 versus 18.1376.54, po0.01). Revised QUICKI, an
index of insulin sensitivity, was improved in the IL-1RI�/�
group compared with control mice (0.2070.01 versus0.1870.01, po0.0001). Plasma IL-6 concentrations were
significantly lower (737.67780.81 versus 1454.9782.87 pg/
mL, po0.05), whereas adiponectin concentrations were
higher (9609.57833.08 versus 7665.67609.8 ng/mL, po0.05)
in IL-1RI�/� mice, compared with controls.
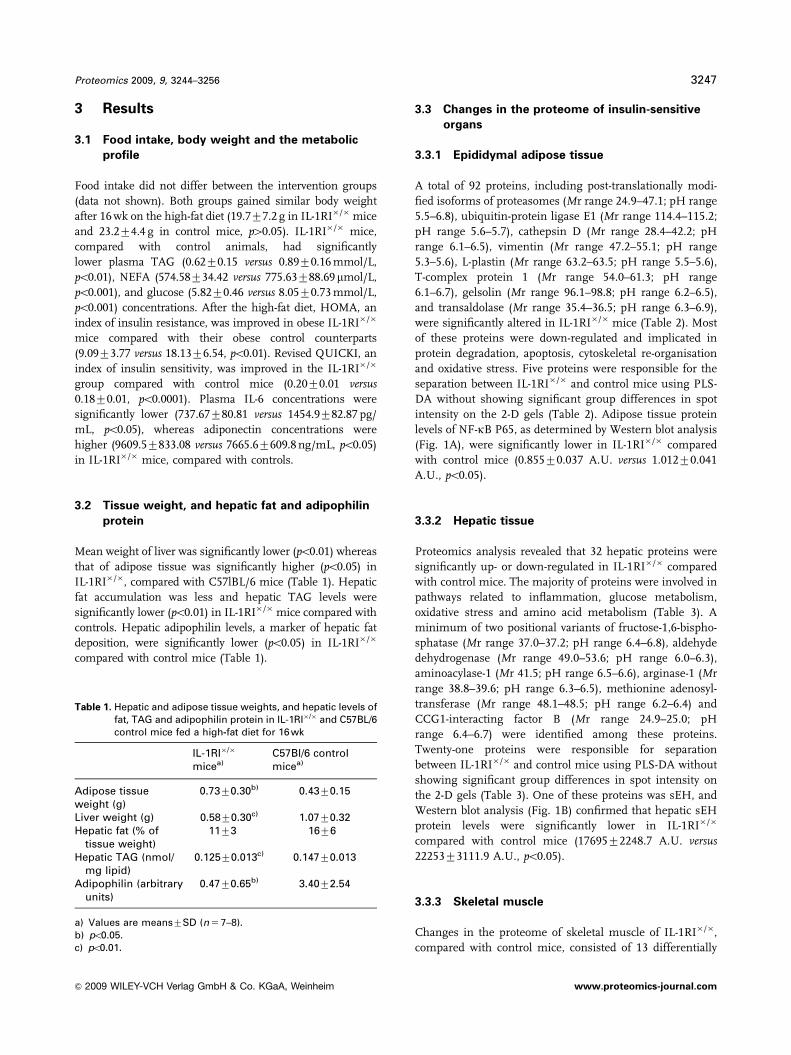
3.2 Tissue weight, and hepatic fat and adipophilin
protein
Mean weight of liver was significantly lower (po0.01) whereas
that of adipose tissue was significantly higher (po0.05) in
IL-1RI�/�, compared with C57lBL/6 mice (Table 1). Hepatic
fat accumulation was less and hepatic TAG levels were
significantly lower (po0.01) in IL-1RI�/�mice compared with
controls. Hepatic adipophilin levels, a marker of hepatic fat
deposition, were significantly lower (po0.05) in IL-1RI�/�
compared with control mice (Table 1).
3.3 Changes in the proteome of insulin-sensitive
organs
3.3.1 Epididymal adipose tissue
A total of 92 proteins, including post-translationally modi-
fied isoforms of proteasomes (Mr range 24.9–47.1; pH range
5.5–6.8), ubiquitin-protein ligase E1 (Mr range 114.4–115.2;
pH range 5.6–5.7), cathepsin D (Mr range 28.4–42.2; pH
range 6.1–6.5), vimentin (Mr range 47.2–55.1; pH range
5.3–5.6), L-plastin (Mr range 63.2–63.5; pH range 5.5–5.6),
T-complex protein 1 (Mr range 54.0–61.3; pH range
6.1–6.7), gelsolin (Mr range 96.1–98.8; pH range 6.2–6.5),
and transaldolase (Mr range 35.4–36.5; pH range 6.3–6.9),
were significantly altered in IL-1RI�/� mice (Table 2). Most
of these proteins were down-regulated and implicated in
protein degradation, apoptosis, cytoskeletal re-organisation
and oxidative stress. Five proteins were responsible for the
separation between IL-1RI�/� and control mice using PLS-
DA without showing significant group differences in spot
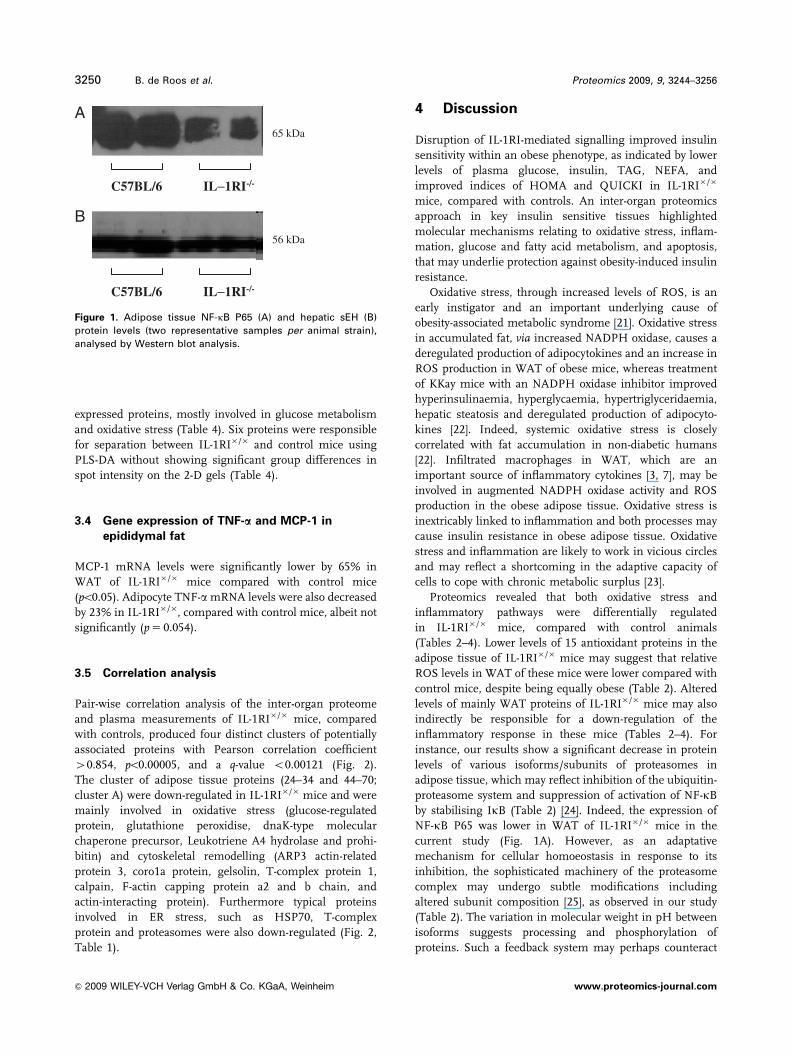
intensity on the 2-D gels (Table 2). Adipose tissue protein
levels of NF-kB P65, as determined by Western blot analysis
(Fig. 1A), were significantly lower in IL-1RI�/� compared
with control mice (0.85570.037 A.U. versus 1.01270.041
A.U., po0.05).
3.3.2 Hepatic tissue
Proteomics analysis revealed that 32 hepatic proteins were
significantly up- or down-regulated in IL-1RI�/� compared
with control mice. The majority of proteins were involved in
pathways related to inflammation, glucose metabolism,
oxidative stress and amino acid metabolism (Table 3). A
minimum of two positional variants of fructose-1,6-bispho-
sphatase (Mr range 37.0–37.2; pH range 6.4–6.8), aldehyde
dehydrogenase (Mr range 49.0–53.6; pH range 6.0–6.3),
aminoacylase-1 (Mr 41.5; pH range 6.5–6.6), arginase-1 (Mr
range 38.8–39.6; pH range 6.3–6.5), methionine adenosyl-
transferase (Mr range 48.1–48.5; pH range 6.2–6.4) and
CCG1-interacting factor B (Mr range 24.9–25.0; pH
range 6.4–6.7) were identified among these proteins.
Twenty-one proteins were responsible for separation
between IL-1RI�/� and control mice using PLS-DA without
showing significant group differences in spot intensity on
the 2-D gels (Table 3). One of these proteins was sEH, and
Western blot analysis (Fig. 1B) confirmed that hepatic sEH
protein levels were significantly lower in IL-1RI�/�
compared with control mice (1769572248.7 A.U. versus2225373111.9 A.U., po0.05).
3.3.3 Skeletal muscle
Changes in the proteome of skeletal muscle of IL-1RI�/�,
compared with control mice, consisted of 13 differentially
Table 1. Hepatic and adipose tissue weights, and hepatic levels offat, TAG and adipophilin protein in IL-1RI�/� and C57BL/6control mice fed a high-fat diet for 16 wk
IL-1RI�/�
micea)C57Bl/6 controlmicea)
Adipose tissueweight (g)
0.7370.30b) 0.4370.15
Liver weight (g) 0.5870.30c) 1.0770.32Hepatic fat (% of
tissue weight)1173 1676
Hepatic TAG (nmol/mg lipid)
0.12570.013c) 0.14770.013
Adipophilin (arbitraryunits)
0.4770.65b) 3.4072.54
a) Values are means7SD (n 5 7–8).b) po0.05.c) po0.01.
Proteomics 2009, 9, 3244–3256 3247
& 2009 WILEY-VCH Verlag GmbH & Co. KGaA, Weinheim www.proteomics-journal.com

Table 2. Changes in the proteome of epididymal adipose tissue, stratified by function, of IL-1RI�/� mice compared with C57BL/6 controlmice following a high-fat diet for 16 wk
SSP Accession Identity protein % of controla) p-value q-value
Oxidative stress and inflammation
4106 BC019410.1 Lysophospholipase 1 0.000 0.0183206 P14901 Heme oxygenase (decyclizing) 6 0.034 0.1291402 AK003217.1 Thioredoxin domain-containing protein 4 14 0.017 0.0923309 Q62086 Paraoxonase 2 20 0.002 0.0426 P14069 Calcyclin 33 0.049 0.1384602 Q8C2F4 Glucose-regulated protein 58 kD 50 0.012 0.0803005 P29391 Ferritin light chain 1 53 0.006 0.0545101 AK005031.1 Peroxiredoxin 4 54 0.019 0.1011905 Q5NCS5 Heat shock protein 4 54 0.041 0.1335102 P11352 Glutathione peroxidase 63 0.012 0.0793701 P38647 dnaK-type molecular chaperone precursor 65 0.031 0.1305704 P24527 Leukotriene A4 hydrolase 66 0.011 0.0743203 P67770 Prohibitin 68 0.010 0.0744101 AK008734.1 Dual specificity protein phosphatase 73 0.022 0.1084803 Q9CQN1 Trap 1 protein 81 0.035 0.126
Protein degradation
1503 Q8BUP7 Proteasome (prosome, macropain) 26S subunit, ATPase 3 15 0.039 0.1292901 P52482 Ubiquitin-protein ligase E1 31 0.015 0.0892902 P52482 Ubiquitin-protein ligase E1 36 0.010 0.0733201 Q06323 Proteasome activator complex subunit 1 54 0.001 0.0373102 Q8BK27 Proteasome subunit beta type-4 57 0.010 0.0724501 Q8VDM4 Proteasome 26S subunit, ATPase 2 58 0.001 0.0385404 Q8VDM4 26S proteasome non-ATPase regulatory subunit 2 60 0.059 0.1523303 AK009955.1 COP9 signalosome complex subunit 4 61 0.003 0.0423207 AK008514.1 Similar to proteasome activator complex subunit 1 69 0.014 0.0854408 AK005083.1 Proteasome 26S subunit, ATPase 2b) 83 0.176 0.236
Cytoskeletal integrity
8 AK007994.1 Coactosin 5 0.003 0.0431702 Q61233 L-plastin 8 0.004 0.0411503 P20152 Vimentin 15 0.039 0.1291701 P14733 Lamin B1 16 0.000 0.0121206 P62046 Calponin homology domain 24 0.001 0.0361609 P31001 Desmin 28 0.017 0.0922309 Q61276 Skeletal muscle alpha-actin mRNA 30 0.036 0.1261704 Q61233 L-plastin 39 0.016 0.090504 P20152 Vimentin 39 0.028 0.1251504 Q99KJ8 Dynactin 50 kD subunit 39 0.038 0.1283505 BC005557.1 ARP3 actin related protein 3 48 0.003 0.0435606 O89053 Coro1a protein 48 0.006 0.0551601 P20152 Vimentin 50 0.011 0.0742304 Q5RKN9 Capping protein muscle Z-line, alpha 1 51 0.005 0.0513803 A32621 Gelsolin 57 0.002 0.0404804 A32621 Gelsolin 61 0.006 0.0545502 Q8BQW4 GTPase-activating protein rhoGAP homolog 62 0.006 0.0533613 P80316 T-complex protein 1 64 0.002 0.0396301 Q91YR1 Actin monomer-binding protein twinfilin-1 64 0.032 0.1303304 P47754 F-actin cappin protein alpha-2 subunit 68 0.028 0.1234604 P80316 T-complex protein 1 68 0.035 0.1275604 P80314 T-complex protein 1 70 0.031 0.1312103 O88456 Calpain 72 0.003 0.0413204 Q923G3 F-actin capping protein beta chain 72 0.028 0.1246702 O88342 Actin-interacting protein 1b) 72 0.153 0.220
Apoptosis
2102 P10605 Cathepsin B 2 0.034 0.1283210 P18242 Cathepsin D 2 0.035 0.127
3248 B. de Roos et al. Proteomics 2009, 9, 3244–3256
& 2009 WILEY-VCH Verlag GmbH & Co. KGaA, Weinheim www.proteomics-journal.com
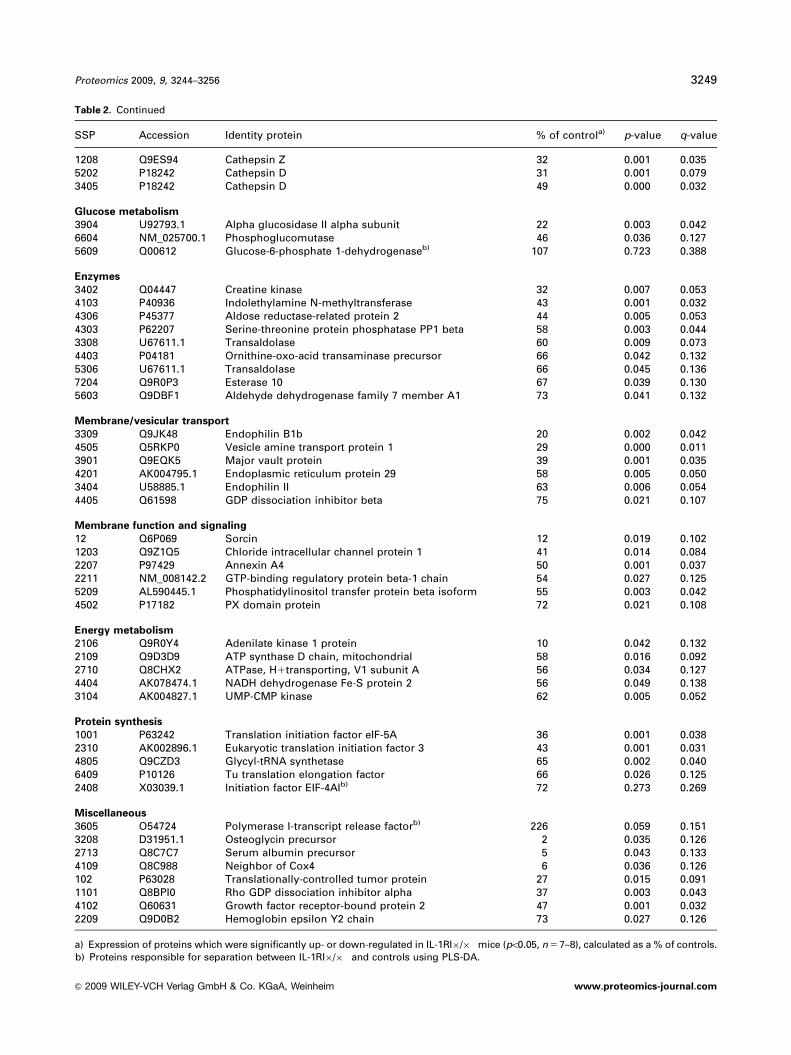
Table 2. Continued
SSP Accession Identity protein % of controla) p-value q-value
1208 Q9ES94 Cathepsin Z 32 0.001 0.0355202 P18242 Cathepsin D 31 0.001 0.0793405 P18242 Cathepsin D 49 0.000 0.032
Glucose metabolism
3904 U92793.1 Alpha glucosidase II alpha subunit 22 0.003 0.0426604 NM_025700.1 Phosphoglucomutase 46 0.036 0.1275609 Q00612 Glucose-6-phosphate 1-dehydrogenaseb) 107 0.723 0.388
Enzymes
3402 Q04447 Creatine kinase 32 0.007 0.0534103 P40936 Indolethylamine N-methyltransferase 43 0.001 0.0324306 P45377 Aldose reductase-related protein 2 44 0.005 0.0534303 P62207 Serine-threonine protein phosphatase PP1 beta 58 0.003 0.0443308 U67611.1 Transaldolase 60 0.009 0.0734403 P04181 Ornithine-oxo-acid transaminase precursor 66 0.042 0.1325306 U67611.1 Transaldolase 66 0.045 0.1367204 Q9R0P3 Esterase 10 67 0.039 0.1305603 Q9DBF1 Aldehyde dehydrogenase family 7 member A1 73 0.041 0.132
Membrane/vesicular transport
3309 Q9JK48 Endophilin B1b 20 0.002 0.0424505 Q5RKP0 Vesicle amine transport protein 1 29 0.000 0.0113901 Q9EQK5 Major vault protein 39 0.001 0.0354201 AK004795.1 Endoplasmic reticulum protein 29 58 0.005 0.0503404 U58885.1 Endophilin II 63 0.006 0.0544405 Q61598 GDP dissociation inhibitor beta 75 0.021 0.107
Membrane function and signaling
12 Q6P069 Sorcin 12 0.019 0.1021203 Q9Z1Q5 Chloride intracellular channel protein 1 41 0.014 0.0842207 P97429 Annexin A4 50 0.001 0.0372211 NM_008142.2 GTP-binding regulatory protein beta-1 chain 54 0.027 0.1255209 AL590445.1 Phosphatidylinositol transfer protein beta isoform 55 0.003 0.0424502 P17182 PX domain protein 72 0.021 0.108
Energy metabolism
2106 Q9R0Y4 Adenilate kinase 1 protein 10 0.042 0.1322109 Q9D3D9 ATP synthase D chain, mitochondrial 58 0.016 0.0922710 Q8CHX2 ATPase, H1transporting, V1 subunit A 56 0.034 0.1274404 AK078474.1 NADH dehydrogenase Fe-S protein 2 56 0.049 0.1383104 AK004827.1 UMP-CMP kinase 62 0.005 0.052
Protein synthesis
1001 P63242 Translation initiation factor eIF-5A 36 0.001 0.0382310 AK002896.1 Eukaryotic translation initiation factor 3 43 0.001 0.0314805 Q9CZD3 Glycyl-tRNA synthetase 65 0.002 0.0406409 P10126 Tu translation elongation factor 66 0.026 0.1252408 X03039.1 Initiation factor EIF-4AIb) 72 0.273 0.269
Miscellaneous
3605 O54724 Polymerase I-transcript release factorb) 226 0.059 0.1513208 D31951.1 Osteoglycin precursor 2 0.035 0.1262713 Q8C7C7 Serum albumin precursor 5 0.043 0.1334109 Q8C988 Neighbor of Cox4 6 0.036 0.126102 P63028 Translationally-controlled tumor protein 27 0.015 0.0911101 Q8BPI0 Rho GDP dissociation inhibitor alpha 37 0.003 0.0434102 Q60631 Growth factor receptor-bound protein 2 47 0.001 0.0322209 Q9D0B2 Hemoglobin epsilon Y2 chain 73 0.027 0.126
a) Expression of proteins which were significantly up- or down-regulated in IL-1RI�/� mice (po0.05, n 5 7–8), calculated as a % of controls.b) Proteins responsible for separation between IL-1RI�/� and controls using PLS-DA.
Proteomics 2009, 9, 3244–3256 3249
& 2009 WILEY-VCH Verlag GmbH & Co. KGaA, Weinheim www.proteomics-journal.com
expressed proteins, mostly involved in glucose metabolism
and oxidative stress (Table 4). Six proteins were responsible
for separation between IL-1RI�/� and control mice using
PLS-DA without showing significant group differences in
spot intensity on the 2-D gels (Table 4).
3.4 Gene expression of TNF-a and MCP-1 in
epididymal fat
MCP-1 mRNA levels were significantly lower by 65% in
WAT of IL-1RI�/� mice compared with control mice
(po0.05). Adipocyte TNF-a mRNA levels were also decreased
by 23% in IL-1RI�/�, compared with control mice, albeit not
significantly (p 5 0.054).
3.5 Correlation analysis
Pair-wise correlation analysis of the inter-organ proteome
and plasma measurements of IL-1RI�/� mice, compared
with controls, produced four distinct clusters of potentially
associated proteins with Pearson correlation coefficient
40.854, po0.00005, and a q-value o0.00121 (Fig. 2).
The cluster of adipose tissue proteins (24–34 and 44–70;
cluster A) were down-regulated in IL-1RI�/� mice and were
mainly involved in oxidative stress (glucose-regulated
protein, glutathione peroxidise, dnaK-type molecular
chaperone precursor, Leukotriene A4 hydrolase and prohi-
bitin) and cytoskeletal remodelling (ARP3 actin-related
protein 3, coro1a protein, gelsolin, T-complex protein 1,
calpain, F-actin capping protein a2 and b chain, and
actin-interacting protein). Furthermore typical proteins
involved in ER stress, such as HSP70, T-complex
protein and proteasomes were also down-regulated (Fig. 2,
Table 1).
4 Discussion
Disruption of IL-1RI-mediated signalling improved insulin
sensitivity within an obese phenotype, as indicated by lower
levels of plasma glucose, insulin, TAG, NEFA, and
improved indices of HOMA and QUICKI in IL-1RI�/�
mice, compared with controls. An inter-organ proteomics
approach in key insulin sensitive tissues highlighted
molecular mechanisms relating to oxidative stress, inflam-
mation, glucose and fatty acid metabolism, and apoptosis,
that may underlie protection against obesity-induced insulin
resistance.
Oxidative stress, through increased levels of ROS, is an
early instigator and an important underlying cause of
obesity-associated metabolic syndrome [21]. Oxidative stress
in accumulated fat, via increased NADPH oxidase, causes a
deregulated production of adipocytokines and an increase in
ROS production in WAT of obese mice, whereas treatment
of KKay mice with an NADPH oxidase inhibitor improved
hyperinsulinaemia, hyperglycaemia, hypertriglyceridaemia,
hepatic steatosis and deregulated production of adipocyto-
kines [22]. Indeed, systemic oxidative stress is closely
correlated with fat accumulation in non-diabetic humans
[22]. Infiltrated macrophages in WAT, which are an
important source of inflammatory cytokines [3, 7], may be
involved in augmented NADPH oxidase activity and ROS
production in the obese adipose tissue. Oxidative stress is
inextricably linked to inflammation and both processes may
cause insulin resistance in obese adipose tissue. Oxidative
stress and inflammation are likely to work in vicious circles
and may reflect a shortcoming in the adaptive capacity of
cells to cope with chronic metabolic surplus [23].
Proteomics revealed that both oxidative stress and
inflammatory pathways were differentially regulated
in IL-1RI�/� mice, compared with control animals
(Tables 2–4). Lower levels of 15 antioxidant proteins in the
adipose tissue of IL-1RI�/� mice may suggest that relative
ROS levels in WAT of these mice were lower compared with
control mice, despite being equally obese (Table 2). Altered
levels of mainly WAT proteins of IL-1RI�/� mice may also
indirectly be responsible for a down-regulation of the
inflammatory response in these mice (Tables 2–4). For
instance, our results show a significant decrease in protein
levels of various isoforms/subunits of proteasomes in
adipose tissue, which may reflect inhibition of the ubiquitin-
proteasome system and suppression of activation of NF-kB
by stabilising IkB (Table 2) [24]. Indeed, the expression of
NF-kB P65 was lower in WAT of IL-1RI�/� mice in the
current study (Fig. 1A). However, as an adaptative
mechanism for cellular homoeostasis in response to its
inhibition, the sophisticated machinery of the proteasome
complex may undergo subtle modifications including
altered subunit composition [25], as observed in our study
(Table 2). The variation in molecular weight in pH between
isoforms suggests processing and phosphorylation of
proteins. Such a feedback system may perhaps counteract
56 kDa
C57BL/6 IL−1RI-/-
65 kDa
C57BL/6 IL−1RI-/-
A
B
Figure 1. Adipose tissue NF-kB P65 (A) and hepatic sEH (B)
protein levels (two representative samples per animal strain),
analysed by Western blot analysis.
3250 B. de Roos et al. Proteomics 2009, 9, 3244–3256
& 2009 WILEY-VCH Verlag GmbH & Co. KGaA, Weinheim www.proteomics-journal.com
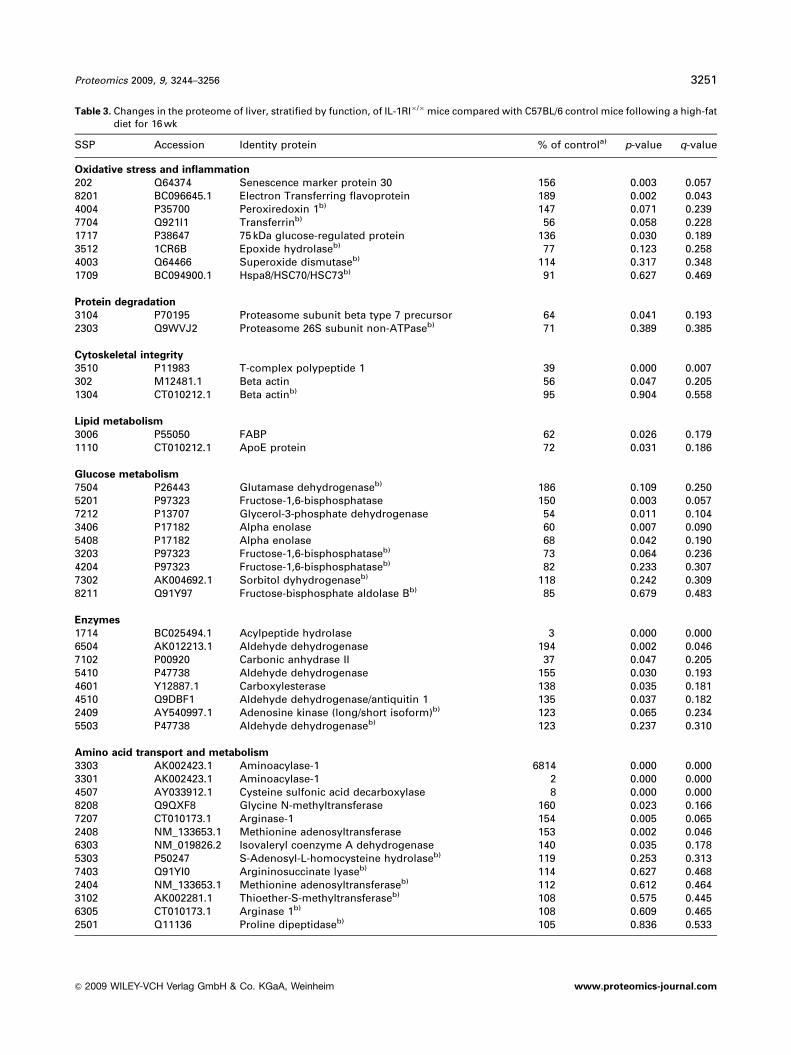
Table 3. Changes in the proteome of liver, stratified by function, of IL-1RI�/�mice compared with C57BL/6 control mice following a high-fatdiet for 16 wk
SSP Accession Identity protein % of controla) p-value q-value
Oxidative stress and inflammation
202 Q64374 Senescence marker protein 30 156 0.003 0.0578201 BC096645.1 Electron Transferring flavoprotein 189 0.002 0.0434004 P35700 Peroxiredoxin 1b) 147 0.071 0.2397704 Q921I1 Transferrinb) 56 0.058 0.2281717 P38647 75 kDa glucose-regulated protein 136 0.030 0.1893512 1CR6B Epoxide hydrolaseb) 77 0.123 0.2584003 Q64466 Superoxide dismutaseb) 114 0.317 0.3481709 BC094900.1 Hspa8/HSC70/HSC73b) 91 0.627 0.469
Protein degradation
3104 P70195 Proteasome subunit beta type 7 precursor 64 0.041 0.1932303 Q9WVJ2 Proteasome 26S subunit non-ATPaseb) 71 0.389 0.385
Cytoskeletal integrity
3510 P11983 T-complex polypeptide 1 39 0.000 0.007302 M12481.1 Beta actin 56 0.047 0.2051304 CT010212.1 Beta actinb) 95 0.904 0.558
Lipid metabolism
3006 P55050 FABP 62 0.026 0.1791110 CT010212.1 ApoE protein 72 0.031 0.186
Glucose metabolism
7504 P26443 Glutamase dehydrogenaseb) 186 0.109 0.2505201 P97323 Fructose-1,6-bisphosphatase 150 0.003 0.0577212 P13707 Glycerol-3-phosphate dehydrogenase 54 0.011 0.1043406 P17182 Alpha enolase 60 0.007 0.0905408 P17182 Alpha enolase 68 0.042 0.1903203 P97323 Fructose-1,6-bisphosphataseb) 73 0.064 0.2364204 P97323 Fructose-1,6-bisphosphataseb) 82 0.233 0.3077302 AK004692.1 Sorbitol dyhydrogenaseb) 118 0.242 0.3098211 Q91Y97 Fructose-bisphosphate aldolase Bb) 85 0.679 0.483
Enzymes
1714 BC025494.1 Acylpeptide hydrolase 3 0.000 0.0006504 AK012213.1 Aldehyde dehydrogenase 194 0.002 0.0467102 P00920 Carbonic anhydrase II 37 0.047 0.2055410 P47738 Aldehyde dehydrogenase 155 0.030 0.1934601 Y12887.1 Carboxylesterase 138 0.035 0.1814510 Q9DBF1 Aldehyde dehydrogenase/antiquitin 1 135 0.037 0.1822409 AY540997.1 Adenosine kinase (long/short isoform)b) 123 0.065 0.2345503 P47738 Aldehyde dehydrogenaseb) 123 0.237 0.310
Amino acid transport and metabolism
3303 AK002423.1 Aminoacylase-1 6814 0.000 0.0003301 AK002423.1 Aminoacylase-1 2 0.000 0.0004507 AY033912.1 Cysteine sulfonic acid decarboxylase 8 0.000 0.0008208 Q9QXF8 Glycine N-methyltransferase 160 0.023 0.1667207 CT010173.1 Arginase-1 154 0.005 0.0652408 NM_133653.1 Methionine adenosyltransferase 153 0.002 0.0466303 NM_019826.2 Isovaleryl coenzyme A dehydrogenase 140 0.035 0.1785303 P50247 S-Adenosyl-L-homocysteine hydrolaseb) 119 0.253 0.3137403 Q91YI0 Argininosuccinate lyaseb) 114 0.627 0.4682404 NM_133653.1 Methionine adenosyltransferaseb) 112 0.612 0.4643102 AK002281.1 Thioether-S-methyltransferaseb) 108 0.575 0.4456305 CT010173.1 Arginase 1b) 108 0.609 0.4652501 Q11136 Proline dipeptidaseb) 105 0.836 0.533
Proteomics 2009, 9, 3244–3256 3251
& 2009 WILEY-VCH Verlag GmbH & Co. KGaA, Weinheim www.proteomics-journal.com

the reported suppression of GLUT4 by proteasome inhibi-
tion in adipocytes [26] to maintain insulin sensitivity in
obese IL-1RI�/� mice.
Furthermore, many cytoskeletal proteins were down-
regulated in the adipose tissue of these mice and may
suggest cytoskeletal remodelling and apoptosis [27], possibly
due to cell death of macrophages and monocytes [28],
leading to a decreased inflammatory response within the
adipose tissue of the mice. Interestingly, transcriptomic
analyses of WAT in obese human subjects showed a
Table 3. Continued
SSP Accession Identity protein % of controla) p-value q-value
Energy metabolism
2003 BC017684.1 UMP-CMP kinase 48 0.018 0.140
Coagulation
106 P48036 Annexin V 25 0.004 0.066
Unknown function
3004 Q8VCR7 CCG1-interacting factor B 0 0.000 0.0002004 Q8VCR7 CCG1-interacting factor B 286 0.000 0.0013504 Q63836 Selenium binding protein 2 262 0.033 0.1833206 AK088123.1 Hypothetical protein without homologyb) 63 0.057 0.2293205 AK088123.1 Hypothetical protein without homology 66 0.018 0.1443001 AK002535.1 s-Adenosyl-L-methionine dependent methyl transferase 75 0.019 0.144
a) Expression of proteins which were significantly up- or down-regulated in IL-1RI�/� mice (po0.05, n 5 7–8), calculated as a % of controls.b) Proteins responsible for separation between IL-1RI�/� and controls using PLS-DA.
Table 4. Changes in the proteome of skeletal muscle, stratified by function, of IL-1RI�/�mice compared with C57BL/6 control mice followinga high-fat diet for 16 wk
SSP Accession Identity protein % of controla) p-value q-value
Oxidative stress
3605 P10639 Thioredoxin reductaseb) 51 0.332 0.6552702 BC066191.1 Heat shock protein 8 76 0.046 0.5492103 Q99LX0 Similar to DJ-1 proteinb) 86 0.724 0.751
Glycolysis, gluconeogenesis and b-oxidation of fatty acids
2607 Q8R339 E2 component of pyruvate dehydrogenase complex 3 0.003 0.2047508 BC086640.1 Glucose phosphate isomerase 1 23 0.003 0.1752101 Q9R0Y5 Adenylate kinase isoenzyme 1 (myokinase)b) 165 0.068 0.6164406 O55137 Acyl-CoA thioestserase 1b) 42 0.057 0.5711301 BC040100.1 NagDb) 45 0.126 0.6463406 Q8VC63 Pyruvate dehydrogenase kinase, isoenzyme 2b) 63 0.501 0.6558205 AF029843.1 Phosphoglycerate mutase 2 69 0.045 0.571
Energy metabolism
6701 BC094462.1 Aconitase 2, mitochondrial 287 0.003 0.2448504 NM_001126.2 Adenylosuccinate synthase 34 0.029 0.483
Coagulation
205 P48036 Annexin V 18 0.023 0.455
Miscellaneous
4403 P50247 Adenosylhomocysteinase 2 0.002 0.222101 P20801 Troponin C 14 0.004 0.1732413 P60843 Eukaryotic initiation factor 4A-I 25 0.009 0.2432406 Q60854 Proteinase inhibitor Spi3 35 0.005 0.1653303 AK005050.2 Similar to dimeric dihydrodiol dehydrogenase 36 0.010 0.2442602 AJ251461.1 P2X4c receptor subunit 49 0.047 0.535
a) Expression of proteins which were significantly up- or down-regulated in IL-1RI�/� mice (po0.05, n 5 7–8), calculated as a % of controls.b) Proteins responsible for separation between IL-1RI�/� and controls using PLS-DA.
3252 B. de Roos et al. Proteomics 2009, 9, 3244–3256
& 2009 WILEY-VCH Verlag GmbH & Co. KGaA, Weinheim www.proteomics-journal.com

significant up-regulation of genes related to extracellular
matrix constituents, including members of the integrin
family, which highlighted the pathological relevance of extra-
cellular matrix in connecting local inflammatory phenomena to
the alteration of WAT metabolic functions in human obesity
[29]. Taken together, these differential changes in protein levels
indicate that the NF-kB pathway could be attenuated in adipose
tissue of IL-1RI�/�mice to cause a compromised inflammatory
response. Indeed, gene expression of MCP-1 was significantly
lower in adipose tissue of IL-1RI�/� mice, which also had
decreased insulin resistance and hepatic TAG, compared with
control mice. This agrees with the finding that MCP-1 knockout
mice show extensive reduction in insulin resistance, hepatic
steatosis and macrophage accumulation in adipose tissue
following a high-fat diet, and suggests that MCP-1 may link
obesity and insulin resistance through induction of an inflam-
matory response in adipose tissue [30]. Decreased levels of
hepatic sEH protein levels in IL-1RI�/� mice in the present
study may provide another link between inflammation and
insulin resistance. sEH is responsible for the conversion of the
bioactive epoxyeicosatrieonic acids (EET) to their corresponding
‘‘inactive’’ diols [31], and down-regulation of sEH protein may
thus indicate decreased degradation of EET. EET are potent anti-
inflammatory lipid mediators that can inhibit IkB kinase,
preventing IkB degradation and maintaining NF-kB in an
inactive state [32]. In addition, EET may beneficially affect
insulin sensitivity, as sEH activity was elevated in livers of
alloxan- and streptozotoin-diabetic male Fischer-344 rats [33].
Oxidative stress also underlies the pathophysiology of
hepatic steatosis [34], which is commonly associated with
early clinical features of the metabolic syndrome such as
obesity, T2DM and dyslipidaemia. The histological and
metabolic hallmark feature of hepatic steatosis is the accu-
mulation of TAG in the liver [35]. In the current study,
hepatic tissue of IL-1RI�/� mice had significantly lower
TAG levels than control mice, despite being equally obese.
This indicates that selective mechanisms, not necessarily
related to obesity per se, are associated with accumulation of
hepatic TAG. Such mechanisms may include an increased
flux of free fatty acids to the liver, increased de novo lipo-
genesis and a decrease in clearance of TAG through
impairment in b-oxidation or VLDL assembly. Indeed, the
IL-1RI�/� mice had significantly lower plasma levels of
NEFA compared with control mice. The higher adipose
73
72
2
71345
6
7
8
50
59
69
249
70
13
12
2021
22
23
161411
1910
15 17
35
18
36
414338 3937
42
2827
32
30
312944
33
34
75
78
77
79 817674
80
55
6364
47
25
56
68
4846
26
65
5760
49
45
6667
21=E – serum albumin precursor22=E – indolethylamine N-methyltransferase23=E – serine threonine protein phosphatase PP1β24=E - gelsolin25=L – not identified26=E – phosphatidyl inositol transfer protein β27=E – annexin A428=E – esterase 1029=E – F-actin capping protein α230=E – actin-interacting protein31=E – glutathione peroxidase32=E – hemoglobin epsilon Y2 chain33=E – dual specificity protein phosphatase34=E – coro1a protein35=E – cathepsin D36=E – 26S proteasome non-ATPase regulatory subunit 237=E – actin monomer-binding protein twinfillin-138=E – aldose reductase-related protein 239=E – ferritin light chain 140=E – growth factor receptor-bound protein 2
61=E – glycyl-tRNA synthetase62=E - transaldolase63=E – GDP dissociation inhibitor β64=E – leukotriene A4 hydrolase65=E – trap 1 protein66=E – GTPase activaing protein rhoGAP homolog67=E – transaldolase68=E – T-complex protein 169=E – Tu tranlation elongation factor70=E – cathepsin Z71=E – chloride intracellular channel protein 172=E – α-glucosidase II α73=M – similar to DJ-1 protein
41=E – ATP synthase D chain42=E – proteasome subunit beta type-443=E – eukaryotic tranlation initiation factor 344=E – ARP3 actin related protein 345=E – endophilin 246=E – UMP-CMP kinase47=E – T-complex protein 148=E – calpain49=E – dnaK-type molecular chaperone precursor50=E – glucose-related protein 58kD51=E – T-complex protein 152=E – endoplasmic reticulum protein 2953=E – transaldolase54=E – proteasome 26S subunit, ATPas e 255=E – F-actin capping protein β chain56=E – COP9 signalosome complex subunit 457=E – prohibitin58=E – proteasome activator complex subunit 159=E – ornithine-oxo-acid transaminase precursor60=E – PX domain protein
1=E – rho GDP dissociation inhibitor α2=E - proteasome 26S subunit, ATPase 33=E – thioredoxin domain-containing protein 44=M – acylCoA thioesterase 15=E – calponin homology domain6=E – lamin B17=M – thioredoxin reductase8=L - weight9=E – L-plastin
10=S - glucose11=L – CCG1-interacting factor B12=M – troponin C13=S - NEFA14=S – IL-615=E – COP9 signalosome complex subunit 416=E - lysophospholipase17=L – acylpeptide hydrolase18=L - CCG1-interacting factor B19=L – aminoacylase 120=L – cysteine sulfonic acid decarboxylase
61
515352
6258
1
40
54
>200% >150% >100% <100% <75% <50%
Figure 2. Correlation plot illustrating pair-wise correlations (Pearson correlation coefficient 40.854, po0.00005 and q-value o0.00121)
between plasma measurements and adipose, hepatic and skeletal muscle tissue proteins, which were significantly altered in IL-1RI�/�,
compared with control mice, after a high-fat diet for 16 wk. Protein expression in IL-1RI�/� mice is expressed as a percentage of that in
control mice, with red or blue shaded nodes denoting significant up- or down-regulation in IL-1RI�/� mice, compared with controls,
respectively. E 5 epididymal adipose tissue, L 5 liver, M 5 muscle, P 5 plasma.
Proteomics 2009, 9, 3244–3256 3253
& 2009 WILEY-VCH Verlag GmbH & Co. KGaA, Weinheim www.proteomics-journal.com

tissue weight of IL-1RI�/� mice in our study, that agrees
with previous reports of increased WAT mass on disruption
of IL-1 signalling [36, 37], may indicate an increased
buffering capacity for NEFA, resulting in less accumulation
of lipids in the liver of these animals. Moreover, down-
regulation of hepatic fatty acid-binding protein (FABP) in
IL-1RI�/�, compared with control mice, supports a
decreased lipid accumulation into hepatocytes because liver
FABP�/� mice are protected from diet-induced obesity and
hepatic steatosis, compared with C57BL/6J mice [38].
IL-1RI�/� mice also showed lower levels of hepatic glycerol-
3-phosphate dehydrogenase, which may indicate a lower
need for glycerol moieties from carbohydrates for hepatic denovo lipogenesis in these animals. Interestingly, hepatic
senescence marker protein 30 (SMP30) levels were signifi-
cantly increased in IL-1RI�/� compared with control mice.
SMP30, a calcium-binding protein that decreases with
aging, has been suggested to protect cells from apoptosis.
Lowered SMP30 in mice causes accumulation of hepatic
TAG and cholesterol, suggesting that SMP30 may have a
profound role in preventing hepatic lipid accumulation
during aging [39]. The association between hepatic TAG and
insulin resistance is well established, with a potential
causative role for accumulation of hepatic TAG in insulin
resistance [40]. This is consistent with the finding of lower
hepatic lipid accumulation in IL-1RI�/� mice, which were
protected against the development of insulin resistance,
compared with controls in our study (Table 1).
Changes in expression of proteins involved in glucose
metabolism occurred in the three organs studied, which may
explain the improved insulin sensitivity and glycaemic
control in IL-1RI�/� mice. For example, decreased levels of
a-glucosidase in adipose tissue and the overall down-regula-
tion of hepatic fructose-1,6-bisphosphatase in IL-1RI�/� mice
suggests delayed carbohydrate digestion and reduced gluco-
neogenesis, which has been associated with improved
glycaemic control [41]. Differential expression of the three
isoforms of hepatic fructose-1,6-bisphosphatase, with similar
molecular masses but an estimated pH range coverage of
6.1–6.5, may reflect cAMP-mediated regulation of this
enzyme by phosphorylation in favour of improved insulin
sensitivity in IL-1RI�/� mice. Furthermore, both adipose
tissue and hepatic a-enolases were decreased in these mice,
whereas up-regulation of this enzyme in the liver was asso-
ciated with increased insulin resistance in Apoe�/� mice [17].
There was also evidence of increased glycolysis and
insulin sensitivity in the muscle of IL-1RI�/� mice,
where pyruvate dehydrogenase kinase isoenzyme 2 (PDK2)
protein was significantly lower, compared with the control
group. This enzyme selectively inhibits pyruvate dehy-
drogenase, a mitochondrial enzymatic complex that
catalyses the oxidative phosphorylation of pyruvate to acetyl
CoA, which prevents muscle from catabolising carbohydrates
and gluconeogenesis precursors [42]. PDK is activated
by fatty acids through increased levels of acetyl CoA [43],
and inhibited by pyruvate [44] and insulin [45]. Increased
PDK activity via an increased lipid/fatty acid oxidation [46]
or insufficient down-regulation of PDK mRNA in insulin-
resistant individuals [45] has been implicated in the patho-
genesis of insulin resistance and non-insulin-dependant
diabetes mellitus in obese subjects. The significantly lower
PDK2 levels in IL-1RI�/� mice suggests that metabolism
was in favour of glucose oxidation at the cost of fat utilisation
in our study. Indeed, acyl-CoA thioesterase 1, which
hydrolyses CoA esters of various lengths to free fatty
acids and CoA-SH and may play an important role in
maintaining appropriate CoA-SH levels during periods of
increased b-oxidation and fatty acid overload [47], was
significantly lower in IL-1RI�/� mice. This protein has been
used as an indicator of b-oxidation [17, 18], and rates of fatty
acid b-oxidation were probably lower in IL-1RI�/� compared
with control mice.
It has been proposed that activation of the pro-inflam-
matory pathway could be a primary mechanism for obesity-
associated insulin resistance [23], as TNF-a is elevated in
adipose tissue and blood from obese rodents, and neutrali-
sation of TNF-a improves insulin sensitivity in these
animals [48]. Under the defined conditions of our study,
inflammatory mediators in adipose tissue may trigger
insulin resistance independent of other factors, such as
obesity. It may be that disruption of IL-1 signalling attenu-
ates ER stress in the adipose tissue. The ER is a key site
where metabolic signals are detected, integrated and trans-
mitted as stress signals, and ER stress may activate c-Jun-N-
terminal kinase and contribute to insulin resistance [49]. ER
stress also activates IKK [50] and may thus represent a
common mechanism for activation of these two stress/
inflammatory signalling pathways. Both dietary and genetic
obesity increases ER stress in adipose and hepatic tissue
[49], leading to the activation of a coordinated adaptive
program called the unfolded protein response. In response
to the accumulation of unfolded proteins in the ER, the rate
of general translation initiation is attenuated by phosphor-
ylation of eIF2a, expression of ER resident protein chaper-
ones and foldases is induced, the ER compartment
proliferates, and ER-associated degradation by the 26S
proteasome system is activated to eliminate the irreparably
misfolded proteins [51]. When the pro-survival efforts are
exhausted due to persistent oxidative stress, ER stress-rela-
ted apoptosis commences [52]. Correlation analysis of
changes in adipose tissue, hepatic and muscle proteins,
and plasma biomarkers of insulin sensitivity and
inflammation, showed an interesting pattern within the
largest cluster of correlated proteins (Fig. 2, cluster A),
which consisted almost exclusively of adipose tissue
proteins and predominantly relate to the regulation of ER
stress. The concerted down-regulation of these proteins,
which are mainly involved in the unfolded protein response
machinery (HSP70, T-complex protein and proteasomes)
and oxidative stress (glutathione peroxidase I, leukotriene
A4 hydrolase, HSP70, Trap 1, prohibitin and dual specificity
protein phosphatase), suggests that the improved insulin
3254 B. de Roos et al. Proteomics 2009, 9, 3244–3256
& 2009 WILEY-VCH Verlag GmbH & Co. KGaA, Weinheim www.proteomics-journal.com

sensitivity in IL-1RI�/� mice was partly associated with less
cellular stress in their adipose tissue, compared with control
mice.
In conclusion, inter-organ proteomic analysis coupled
with correlation analysis with plasma biomarkers of insulin
sensitivity, indicated a role of attenuated cellular/oxidative
stress and inflammation and decreased hepatic fat accu-
mulation as major mechanisms underlying protection
against obesity-induced insulin resistance in mice with
impaired IL-1 signalling. The higher insulin sensitivity in
these mice, compared with controls, may be explained at
least in part by a metabolic shift from fat utilisation to
glucose oxidation in insulin sensitive tissues. Our data
suggest that not obesity per se, but early activation of
inflammation and oxidative stress-related pathways are
likely to contribute to the development of insulin resistance
during a high-fat diet.
This study was funded by Science Foundation Ireland and bythe Scottish Government Rural and Environment Research andAnalysis Directorate (RERAD).
The authors have declared no conflict of interest.
5 References
[1] Hirosumi, J., Tuncman, G., Chang, L., Gorgun, C. Z. et al., A
central role for JNK in obesity and insulin resistance. Nature
2002, 420, 333–336.
[2] Wellen, K. E., Hotamisligil, G. S., Obesity-induced inflam-
matory changes in adipose tissue. J. Clin. Invest. 2003, 112,
1785–1788.
[3] Weisberg, S. P., McCann, D., Desai, M., Rosenbaum, M.
et al., Obesity is associated with macrophage accumulation
in adipose tissue. J. Clin. Invest. 2003, 112, 1796–1808.
[4] Uysal, K. T., Wiesbrock, S. M., Marino, M. W., Hotamisligil,
G. S., Protection from obesity-induced insulin resistance in
mice lacking TNF-alpha function. Nature 1997, 389, 610–614.
[5] Sartipy, P., Loskutoff, D. J., Monocyte chemoattractant
protein 1 in obesity and insulin resistance. Proc. Natl. Acad.
Sci. USA 2003, 100, 7265–7270.
[6] Inouye, K. E., Shi, H., Howard, J. K., Daly, C. H. et al.,
Absence of CC chemokine ligand 2 does not limit obesity-
associated infiltration of macrophages into adipose tissue.
Diabetes 2007, 56, 2242–2250.
[7] Xu, H., Barnes, G. T., Yang, Q., Tan, G. et al., Chronic
inflammation in fat plays a crucial role in the development
of obesity-related insulin resistance. J. Clin. Invest. 2003,
112, 1821–1830.
[8] Hotamisligil, G. S., Murray, D. L., Choy, L. N., Spiegelman,
B. M., Tumor necrosis factor alpha inhibits signaling from
the insulin receptor. Proc. Natl. Acad. Sci. USA 1994, 91,
4854–4858.
[9] Zhang, H. H., Halbleib, M., Ahmad, F., Manganiello, V. C.
et al., Tumor necrosis factor-alpha stimulates lipolysis in
differentiated human adipocytes through activation of
extracellular signal-related kinase and elevation of intra-
cellular cAMP. Diabetes 2002, 51, 2929–2935.
[10] Nguyen, M. T., Favelyukis, S., Nguyen, A. K., Reichart, D.
et al., A subpopulation of macrophages infiltrates hyper-
trophic adipose tissue and is activated by free fatty acids via
Toll-like receptors 2 and 4 and JNK-dependent pathways.
J. Biol. Chem. 2007, 282, 35279–35292.
[11] Thomas, H. E., Irawaty, W., Darwiche, R., Brodnicki, T. C.
et al., IL-1 receptor deficiency slows progression to diabetes
in the NOD mouse. Diabetes 2004, 53, 113–121.
[12] Juge-Aubry, C. E., Somm, E., Chicheportiche, R., Burger, D.
et al., Regulatory effects of interleukin (IL)-1, interferon-
beta, and IL-4 on the production of IL-1 receptor antagonist
by human adipose tissue. J. Clin. Endocrinol. Metab. 2004,
89, 2652–2658.
[13] Moloney, F., Toomey, S., Noone, E., Nugent, A. et al.,
Antidiabetic effects of cis-9, trans-11-conjugated linoleic
acid may be mediated via anti-inflammatory effects in white
adipose tissue. Diabetes 2007, 56, 574–582.
[14] Matthews, D. R., Hosker, J. P., Rudenski, A. S., Naylor, B. A.
et al., Homeostasis model assessment: insulin resistance and
beta-cell function from fasting plasma glucose and insulin
concentrations in man. Diabetologia 1985, 28, 412–419.
[15] Perseghin, G., Caumo, A., Caloni, M., Testolin, G. et al.,
Incorporation of the fasting plasma FFA concentration into
QUICKI improves its association with insulin sensitivity in
nonobese individuals. J Clin. Endocrinol. Metab. 2001, 86,
4776–4781.
[16] Arbones-Mainar, J. M., Ross, K., Rucklidge, G. J., Reid, M.
et al., Extra virgin olive oils increase hepatic fat accumula-
tion and hepatic antioxidant protein levels in APOE
(�/�)() mice. J. Proteome. Res. 2007, 6, 4041–4054.
[17] de Roos, B., Rucklidge, G., Reid, M., Ross, K. et al., Diver-
gent mechanisms of cis9, trans11-and trans10, cis12-
conjugated linoleic acid affecting insulin resistance and
inflammation in apolipoprotein E knockout mice: a proteo-
mics approach. FASEB J. 2005, 19, 1746–1748.
[18] de Roos, B., Duivenvoorden, I., Rucklidge, G., Reid, M. et al.,
Response of apolipoprotein E�3-Leiden transgenic mice to
dietary fatty acids: combining liver proteomics with
physiological data. FASEB J. 2005, 19, 813–815.
[19] de Roos, B., Geelen, A., Ross, K., Rucklidge, G. et al., Iden-
tification of potential serum biomarkers of inflammation
and lipid modulation that are altered by fish oil supple-
mentation in healthy volunteers. Proteomics 2008, 8,
1965–1974.
[20] Storey, J. D., Tibshirani, R., Statistical significance for
genomewide studies. Proc. Natl. Acad. Sci. USA 2003, 100,
9440–9445.
[21] Houstis, N., Rosen, E. D., Lander, E. S., Reactive oxygen
species have a causal role in multiple forms of insulin
resistance. Nature 2006, 440, 944–948.
[22] Furukawa, S., Fujita, T., Shimabukuro, M., Iwaki, M. et al.,
Increased oxidative stress in obesity and its impact
on metabolic syndrome. J. Clin. Invest. 2004, 114,
1752–1761.
Proteomics 2009, 9, 3244–3256 3255
& 2009 WILEY-VCH Verlag GmbH & Co. KGaA, Weinheim www.proteomics-journal.com
[23] Hotamisligil, G. S., Inflammation and metabolic disorders.
Nature 2006, 444, 860–867.
[24] Wojcik, C. and Di Napoli, M., Ubiquitin-proteasome system
and proteasome inhibition: new strategies in stroke ther-
apy. Stroke 2004, 35, 1506–1518.
[25] Naujokat, C., Fuchs, D., Berges, C., Adaptive modification
and flexibility of the proteasome system in response to
proteasome inhibition. Biochim. Biophys. Acta 2007, 1773,
1389–1397.
[26] Miller, R. S., Diaczok, D., Cooke, D. W., Repression of GLUT4
expression by the endoplasmic reticulum stress response in
3T3-L1 adipocytes. Biochem. Biophys. Res. Commun. 2007,
362, 188–192.
[27] Solary, E., Eymin, B., Droin, N., Haugg, M., Proteases,
proteolysis, and apoptosis. Cell Biol. Toxicol. 1998, 14,
121–132.
[28] Bodles, A. M., Varma, V., Yao-Borengasser, A., Phanavanh,
B. et al., Pioglitazone induces apoptosis of macrophages in
human adipose tissue. J. Lipid Res. 2006, 47, 2080–2088.
[29] Henegar, C., Tordjman, J., Achard, V., Lacasa, D. et al.,
Adipose tissue transcriptomic signature highlights the
pathological relevance of extracellular matrix in human
obesity. Genome Biol. 2008, 9, R14.
[30] Kanda, H., Tateya, S., Tamori, Y., Kotani, K. et al., MCP-1
contributes to macrophage infiltration into adipose tissue,
insulin resistance, and hepatic steatosis in obesity. J. Clin.
Invest. 2006, 116, 1494–1505.
[31] Node, K., Huo, Y., Ruan, X., Yang, B. et al., Anti-inflamma-
tory properties of cytochrome P450 epoxygenase-derived
eicosanoids. Science 1999, 285, 1276–1279.
[32] Campbell, W. B., New role for epoxyeicosatrienoic acids as
anti-inflammatory mediators. Trends Pharmacol. Sci. 2000,
21, 125–127.
[33] Thomas, H., Schladt, L., Knehr, M., Oesch, F., Effect of
diabetes and starvation on the activity of rat liver epoxide
hydrolases, glutathione S-transferases and peroxisomal
beta-oxidation. Biochem. Pharmacol. 1989, 38, 4291–4297.
[34] Roskams, T., Yang, S. Q., Koteish, A., Durnez, A. et al.,
Oxidative stress and oval cell accumulation in mice and
humans with alcoholic and nonalcoholic fatty liver disease.
Am. J. Pathol. 2003, 163, 1301–1311.
[35] Donnelly, K. L., Smith, C. I., Schwarzenberg, S. J., Jessurun,
J. et al., Sources of fatty acids stored in liver and secreted
via lipoproteins in patients with nonalcoholic fatty liver
disease. J. Clin. Invest. 2005, 115, 1343–1351.
[36] Matsuki, T., Horai, R., Sudo, K., Iwakura, Y., IL-1 plays an
important role in lipid metabolism by regulating insulin
levels under physiological conditions. J. Exp. Med. 2003,
198, 877–888.
[37] Garcia, M. C., Wernstedt, I., Berndtsson, A., Enge, M. et al.,
Mature-onset obesity in interleukin-1 receptor I knockout
mice. Diabetes 2006, 55, 1205–1213.
[38] Newberry, E. P., Xie, Y., Kennedy, S. M., Luo, J. et al.,
Protection against Western diet-induced obesity and hepa-
tic steatosis in liver fatty acid-binding protein knockout
mice. Hepatology 2006, 44, 1191–1205.
[39] Matsuyama, S., Kitamura, T., Enomoto, N., Fujita, T. et al.,
Senescence marker protein-30 regulates Akt activity and
contributes to cell survival in Hep G2 cells. Biochem.
Biophys. Res. Commun. 2004, 321, 386–390.
[40] Samuel, V. T., Liu, Z. X., Qu, X., Elder, B. D. et al.,
Mechanism of hepatic insulin resistance in non-alcoholic
fatty liver disease. J. Biol. Chem. 2004, 279, 32345–32353.
[41] Goke, B., Herrmann-Rinke, C., The evolving role of alpha-
glucosidase inhibitors. Diabetes Metab. Rev. 1998, 14, S31–S38.
[42] Sugden, M. C., Holness, M. J., Therapeutic potential of the
mammalian pyruvate dehydrogenase kinases in the
prevention of hyperglycaemia. Curr. Drug Targets Immune
Endocr. Metabol. Disord. 2002, 2, 151–165.
[43] Kerbey, A. L., Randle, P. J., Cooper, R. H., Whitehouse, S.
et al., Regulation of pyruvate dehydrogenase in rat heart.
Mechanism of regulation of proportions of depho-
sphorylated and phosphorylated enzyme by oxidation of
fatty acids and ketone bodies and of effects of diabetes: role
of coenzyme A, acetyl-coenzyme A and reduced and
oxidized nicotinamide-adenine dinucleotide. Biochem.
J. 1976, 154, 327–348.
[44] Ravindran, S., Radke, G. A., Guest, J. R., Roche, T. E., Lipoyl
domain-based mechanism for the integrated feedback
control of the pyruvate dehydrogenase complex by
enhancement of pyruvate dehydrogenase kinase activity.
J. Biol. Chem. 1996, 271, 653–662.
[45] Majer, M., Popov, K. M., Harris, R. A., Bogardus, C. et al.,
Insulin downregulates pyruvate dehydrogenase kinase
(PDK) mRNA: potential mechanism contributing to
increased lipid oxidation in insulin-resistant subjects. Mol.
Genet. Metab. 1998, 65, 181–186.
[46] Randle, P. J., Priestman, D. A., Mistry, S. C., Halsall, A.,
Glucose fatty acid interactions and the regulation of glucose
disposal. J. Cell Biochem. 1994, 55, 1–11.
[47] Hunt, M. C., Solaas, K., Kase, B. F., Alexson, S. E., Char-
acterization of an acyl-coA thioesterase that functions as a
major regulator of peroxisomal lipid metabolism. J. Biol.
Chem. 2002, 277, 1128–1138.
[48] Hotamisligil, G. S., Shargill, N. S., Spiegelman, B. M.,
Adipose expression of tumor necrosis factor-alpha: direct
role in obesity-linked insulin resistance. Science 1993, 259,
87–91.
[49] Ozcan, U., Cao, Q., Yilmaz, E., Lee, A. H. et al., Endoplasmic
reticulum stress links obesity, insulin action, and type 2
diabetes. Science 2004, 306, 457–461.
[50] Hung, J. H., Su, I. J., Lei, H. Y., Wang, H. C. et al., Endo-
plasmic reticulum stress stimulates the expression of
cyclooxygenase-2 through activation of NF-kappaB and
pp38 mitogen-activated protein kinase. J. Biol. Chem. 2004,
279, 46384–46392.
[51] Wu, J., Kaufman, R. J., From acute ER stress to physiolo-
gical roles of the Unfolded Protein Response. Cell Death
Differ. 2006, 13, 374–384.
[52] Malhotra, J. D., Kaufman, R. J., Endoplasmic reticulum
stress and oxidative stress: a vicious cycle or a
double-edged sword? Antioxid. Redox Signal. 2007, 9,
2277–2293.
3256 B. de Roos et al. Proteomics 2009, 9, 3244–3256
& 2009 WILEY-VCH Verlag GmbH & Co. KGaA, Weinheim www.proteomics-journal.com