LIFESPAN PSYCHOLOGY: Theory and Application to Intellectual Functioning
Upload
fundacaochampalimaudCategory
view
1download
0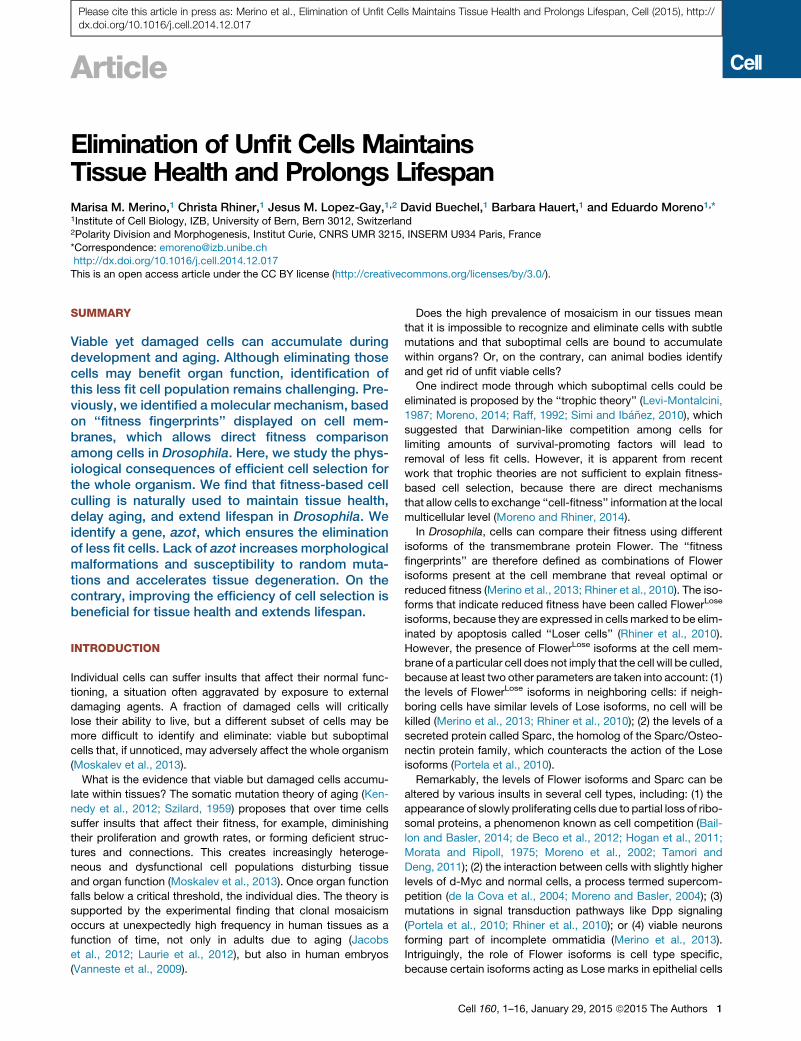
Please cite this article in press as: Merino et al., Elimination of Unfit Cells Maintains Tissue Health and Prolongs Lifespan, Cell (2015), http://dx.doi.org/10.1016/j.cell.2014.12.017
Article
Elimination of Unfit Cells MaintainsTissue Health and Prolongs LifespanMarisa M. Merino,1 Christa Rhiner,1 Jesus M. Lopez-Gay,1,2 David Buechel,1 Barbara Hauert,1 and Eduardo Moreno1,*1Institute of Cell Biology, IZB, University of Bern, Bern 3012, Switzerland2Polarity Division and Morphogenesis, Institut Curie, CNRS UMR 3215, INSERM U934 Paris, France
*Correspondence: [email protected]://dx.doi.org/10.1016/j.cell.2014.12.017
This is an open access article under the CC BY license (http://creativecommons.org/licenses/by/3.0/).
SUMMARY
Viable yet damaged cells can accumulate duringdevelopment and aging. Although eliminating thosecells may benefit organ function, identification ofthis less fit cell population remains challenging. Pre-viously, we identified a molecular mechanism, basedon ‘‘fitness fingerprints’’ displayed on cell mem-branes, which allows direct fitness comparisonamong cells in Drosophila. Here, we study the phys-iological consequences of efficient cell selection forthe whole organism. We find that fitness-based cellculling is naturally used to maintain tissue health,delay aging, and extend lifespan in Drosophila. Weidentify a gene, azot, which ensures the eliminationof less fit cells. Lack of azot increases morphologicalmalformations and susceptibility to random muta-tions and accelerates tissue degeneration. On thecontrary, improving the efficiency of cell selection isbeneficial for tissue health and extends lifespan.
INTRODUCTION
Individual cells can suffer insults that affect their normal func-
tioning, a situation often aggravated by exposure to external
damaging agents. A fraction of damaged cells will critically
lose their ability to live, but a different subset of cells may be
more difficult to identify and eliminate: viable but suboptimal
cells that, if unnoticed, may adversely affect the whole organism
(Moskalev et al., 2013).
What is the evidence that viable but damaged cells accumu-
late within tissues? The somatic mutation theory of aging (Ken-
nedy et al., 2012; Szilard, 1959) proposes that over time cells
suffer insults that affect their fitness, for example, diminishing
their proliferation and growth rates, or forming deficient struc-
tures and connections. This creates increasingly heteroge-
neous and dysfunctional cell populations disturbing tissue
and organ function (Moskalev et al., 2013). Once organ function
falls below a critical threshold, the individual dies. The theory is
supported by the experimental finding that clonal mosaicism
occurs at unexpectedly high frequency in human tissues as a
function of time, not only in adults due to aging (Jacobs
et al., 2012; Laurie et al., 2012), but also in human embryos
(Vanneste et al., 2009).
Does the high prevalence of mosaicism in our tissues mean
that it is impossible to recognize and eliminate cells with subtle
mutations and that suboptimal cells are bound to accumulate
within organs? Or, on the contrary, can animal bodies identify
and get rid of unfit viable cells?
One indirect mode through which suboptimal cells could be
eliminated is proposed by the ‘‘trophic theory’’ (Levi-Montalcini,
1987; Moreno, 2014; Raff, 1992; Simi and Ibanez, 2010), which
suggested that Darwinian-like competition among cells for
limiting amounts of survival-promoting factors will lead to
removal of less fit cells. However, it is apparent from recent
work that trophic theories are not sufficient to explain fitness-
based cell selection, because there are direct mechanisms
that allow cells to exchange ‘‘cell-fitness’’ information at the local
multicellular level (Moreno and Rhiner, 2014).
In Drosophila, cells can compare their fitness using different
isoforms of the transmembrane protein Flower. The ‘‘fitness
fingerprints’’ are therefore defined as combinations of Flower
isoforms present at the cell membrane that reveal optimal or
reduced fitness (Merino et al., 2013; Rhiner et al., 2010). The iso-
forms that indicate reduced fitness have been called FlowerLose
isoforms, because they are expressed in cells marked to be elim-
inated by apoptosis called ‘‘Loser cells’’ (Rhiner et al., 2010).
However, the presence of FlowerLose isoforms at the cell mem-
brane of a particular cell does not imply that the cell will be culled,
because at least two other parameters are taken into account: (1)
the levels of FlowerLose isoforms in neighboring cells: if neigh-
boring cells have similar levels of Lose isoforms, no cell will be
killed (Merino et al., 2013; Rhiner et al., 2010); (2) the levels of a
secreted protein called Sparc, the homolog of the Sparc/Osteo-
nectin protein family, which counteracts the action of the Lose
isoforms (Portela et al., 2010).
Remarkably, the levels of Flower isoforms and Sparc can be
altered by various insults in several cell types, including: (1) the
appearance of slowly proliferating cells due to partial loss of ribo-
somal proteins, a phenomenon known as cell competition (Bail-
lon and Basler, 2014; de Beco et al., 2012; Hogan et al., 2011;
Morata and Ripoll, 1975; Moreno et al., 2002; Tamori and
Deng, 2011); (2) the interaction between cells with slightly higher
levels of d-Myc and normal cells, a process termed supercom-
petition (de la Cova et al., 2004; Moreno and Basler, 2004); (3)
mutations in signal transduction pathways like Dpp signaling
(Portela et al., 2010; Rhiner et al., 2010); or (4) viable neurons
forming part of incomplete ommatidia (Merino et al., 2013).
Intriguingly, the role of Flower isoforms is cell type specific,
because certain isoforms acting as Lose marks in epithelial cells
Cell 160, 1–16, January 29, 2015 ª2015 The Authors 1
40hr APF40hr APF
24hr ACI24hr ACI
MergeGFP
GFP
44hr APF
MergeDAPI
U V
dsRed MergeDAPI
wt
azot
::dsR
edU
ASp3
5U
ASfw
eLose
-B
UAS
fweLo
se-B
UAS
brin
ker
48hr ACI 48hr ACI
48hr ACI 48hr ACI
24hr ACI 24hr ACI
24hr ACI 24hr ACI
40µm
40µm
40µm
40µm
40µm
40µm
MergeGFP
dsRed
B C
D
E F
G H
I
J K
L M
A
O P
azot::dsRed
azot promoter ~3 Kb:: dsRedazot
Azot::dsRed
Azot::dsRed
Azot::dsRed
Azot::dsRed
MergeGFP
Azot::dsRed
wt
tub>dmyc
tub>dmyc
UASbrinker
UASfweLose-B
Supercompe��on
Loser clones
Homogeneous loseU
ASla
cZ
MergeGFP
MergeGFP
40µm
act>UASfweLose-B
44hr APF
WtSupercompe�tors
Loser
Q R
S
Azot::dsRed MergeGFP
MergeGFP
Azot::dsRed
Mouse flower
act>UASmfwe-3
azot
{KO
; gfp
}az
ot::d
sRed
40µm
40µm
Neuronal culling
T
X Y
MergeDAPI
10µm
10µm
UAS
mfw
e3U
ASm
fwe3
UASmfwe3
flp
STOP
UAS
Gal4dmyctubulinα1
hsp70gfp
N
W
Founder line
5᾿arm gfpa�R
loxP
Homologous recombina�on
3᾿arm5᾿arm white+
a�P
loxP
loxP 3᾿arm
lo x P5᾿arm white+
a�P
loxP
loxP 3᾿arm
3᾿arm
azot5᾿arm 3᾿arm
Genomic context
azot{KO; gfp} Engineered mutant allele
flp
STOP
UAS
Gal4cd2ac�n
hsp70gfp
WtLoser
flpUAS
Gal4
hsp70 gfp
ac�n
(legend on next page)
2 Cell 160, 1–16, January 29, 2015 ª2015 The Authors
Please cite this article in press as: Merino et al., Elimination of Unfit Cells Maintains Tissue Health and Prolongs Lifespan, Cell (2015), http://dx.doi.org/10.1016/j.cell.2014.12.017

Please cite this article in press as: Merino et al., Elimination of Unfit Cells Maintains Tissue Health and Prolongs Lifespan, Cell (2015), http://dx.doi.org/10.1016/j.cell.2014.12.017
(Rhiner et al., 2010) are part of the fitness fingerprint of healthy
neurons (Merino et al., 2013). Therefore, an exciting picture
starts to appear, in which varying levels of Sparc and different
isoforms of Flower are produced by many cell types, acting as
direct molecular determinants of cell fitness.
Here, we aimed to clarify how cells integrate fitness informa-
tion in order to identify and eliminate suboptimal cells. Subse-
quently, we analyzed what are the physiological consequences
of efficient cell selection for the whole organism.
RESULTS
Azot Is Expressed in Cells Undergoing NegativeSelectionIn order to discover the molecular mechanisms underlying cell
selection in Drosophila, we analyzed genes transcriptionally
induced using an assay where WT cells (tub>Gal4) are outcom-
peted by dMyc-overexpressing supercompetitors (tub>dmyc)
(Figure 1D) due to the increased fitness of these dMyc-overex-
pressing cells (Rhiner et al., 2010). The expression of CG11165
(Figure S1A available online) was strongly induced 24 hr (hr) after
the peak of flower and sparc expression (Figure S1B). In situ hy-
bridization revealed that CG11165 mRNA was specifically de-
tected in Loser cells that were going to be eliminated from
wing imaginal discs due to cell competition (Figure S1C). The
gene, which we named ahuizotl (azot) after a multihanded Aztec
creature selectively targeting fishing boats to protect lakes
(Reeves, 2006), consists of one exon. azot’s single exon encodes
for a four EF-hand-containing cytoplasmic protein of the canon-
ical family (Figures S1D and S1E) that is conserved, but unchar-
acterized, in multicellular animals (Figure S1A).
To monitor Azot expression, we designed a translational re-
porter resulting in theexpressionofAzot::dsRedunder thecontrol
of the endogenous azot promoter in transgenic flies (Figure 1A).
Azot expression was not detectable in most wing imaginal discs
under physiological conditions in the absence of competition
(Figures 1B and 1C). We next generated mosaic tissue of two
clonal populations, which are known to trigger competitive
interactions resulting in elimination of otherwise viable cells. Cells
with lower fitness were created by confronting WT cells with
dMyc-overexpressing cells (Figures 1E–1H) (Moreno and Basler,
2004), bydownregulatingDppsignaling (Morenoet al., 2002) (Fig-
ures 1I–1K), by overexpressing FlowerLose isoforms (Rhiner et al.,
2010) (Figures 1L and1M), in cellswith reducedWgsignaling (Fig-
ure S1F) (Vincent et al., 2011), by suppressing Jak-Stat signaling
(Rodrigues et al., 2012) in subgroups of cells (Figure S1G) or by
generating Minute clones (Lolo et al., 2012; Morata and Ripoll,
Figure 1. Azot Is Expressed during Cell Selection of Viable Unfit Cells
(A–M) Expression analysis of Azot during different types of cell competition. For
clones (green, marked with GFP) of several genotypes. DAPI is in blue. The fol
background (black) and WT cells marked with GFP (green). Clones were genera
(black) and WT cells marked with GFP (green) expressing in addition to the P35 c
generated as shown in (I) and overexpressing brinker (UASbrinker) (J and K), fwe
(Q and R) Twenty-four hour ACI.
(N–P, S, and T) General overexpression of UASfweLose-B and UASmfwe3 using th
(U–Y) Pupal retinas at different developmental time points. (U and V) Expression
after pupa formation (APF) (U and V). (W) Genomic engineering strategy used fo
driven by the azot promoter in azot{KO; gfp}, 44 hr APF, DAPI (blue, Y).
1975; Simpson, 1979) (Figure S1H). Azot expression was not
detectable in nonmosaic tissue of identical genotype (Figures
1N–1P; Figures S1I and S1J), nor in control clones overexpress-
ing UASlacZ (Figure S1K). On the contrary, Azot was specifically
activated in all tested scenarios of cell competition, specifically in
the cells undergoing negative selection (‘‘Loser cells’’) (Figures
1D–1M). Azot expression was not repressed by the caspase in-
hibitor protein P35 (Figures 1G and 1H).
Because Flower proteins are conserved in mammals (Petrova
et al., 2012), we decided to test if they are also able to regulate
azot. Mouse Flower isoform 3 (mFlower3) has been shown to
act as a ‘‘classical’’ Lose isoform, driving cell elimination when
expressed in scattered groups of cells (Petrova et al., 2012), a
situation where azot was induced in Loser cells (Figures 1Q
and 1R) but is not inducing cell selection when expressed ubiq-
uitously a scenario where azot was not expressed (Figures 1S
and 1T). This shows that the mouse FlowerLose isoforms function
in Drosophila similarly to their fly homologs.
Interestingly, azot is not a general apoptosis-activated gene
because its expression is not induced upon eiger, hid, or bax
activation, which trigger cell death (Fuchs and Steller, 2011;
Gaumer et al., 2000) (Figures S1L–S1N). Azot was also not ex-
pressed during elimination of cells with defects in apicobasal po-
larity (Figure S1O) or undergoing epithelial exclusion-mediated
apoptosis (dCsk) (Figures S1P and S1Q) (Vidal et al., 2006).
Next, we analyzed if azot is expressed during the elimination of
peripheral photoreceptors in the pupal retina, a process medi-
ated by Flower-encoded fitness fingerprints (Merino et al.,
2013). Thirty-six to 38 hr after pupal formation (APF), when Flow-
erLose-B expression begins in peripheral neurons (Merino et al.,
2013), we could not detect Azot expression in the peripheral
edge (Figures S1R–S1U). At later time points (40 and 44 hr
APF), Azot expression is visible and restricted to the peripheral
edge where photoreceptor neurons are eliminated (Figures 1U
and 1V). This expression was confirmed with another reporter
line, azot{KO; gfp}, where gfpwas directly inserted at the azot lo-
cus using genomic engineering techniques (Huang et al., 2009)
(Figures 1W–1Y).
From these results, we conclude that Azot expression is acti-
vated in several contexts where suboptimal and viable cells are
normally recognized and eliminated.
Azot Is Required to Eliminate Loser Cells and UnwantedNeuronsTo understand Azot function in cell elimination, we generated
azot knockout (KO) flies, whereby the entire azot gene was
deleted (Figure 1W). Next, we analyzed Azot function using
all pictures, Azot::dsRed reporter (A) is in red, and merges show outcompeted
lowing genotypes were analyzed: (B and C) azot:dsRed and (D–F) tub>dmyc
ted as shown in (D) and analyzed 48 hr ACI. (G and H) tub>dmyc background
aspase inhibitor (UASp35). Forty-eight hourr ACI. (I–M) Flip-out clones (green)Lose-B (UASfweLose-B) (L and M), or mfwe3 (UASmfwe3).
e actin promoter as shown in (N).
analysis of Azot (red), using Azot::dsRed, in peripheral photoreceptors at 40 hr
r the generation of azot knockout (KO) flies. (X and Y) GFP expression (green)
Cell 160, 1–16, January 29, 2015 ª2015 The Authors 3
04080
120160
DAPIαHid
01020304050
05
101520
050
100150200
N=1
0
44hr APF44hr APF
05
1015202530
Clon
e N
°/ cl
one
N°l
acZ
Clea
ved
Casp
ase-
3 GP
F+ ce
lls w
t VS
azo
t-/-
Clon
e ar
ea p
erce
ntag
e
Clon
e N
°/ cl
one
azot
+/+
00.40.81.21.6
2xazot 3xazot 2xazot 3xazot
24hr ACI 48hr ACI
**
Loser cells
azot
+/+
azot activationCulling of loser cells
Persistence of loser cellsNo azot activationLoser cells
T
N=1
0
N=1
5
N=1
4
**
N=1
4
K
azot
+/+
a zot
-/-
10µmTUNEL
G H
UAS
mfw
e3
azot +/+
72hr ACI 72hr ACI
azot +/-
GFP GFP
R S
X
48hr ACI 48hr ACI
azot +/+; azot +
GFP GFP
V W
azot +/+
40µm
azot -/-
72hr ACI72hr ACI
40µm
A B
C
% T
UN
EL-p
osi�
ve c
ells
GFPDAPI
GFPDAPI
0
50
100
150
200
N=2
7
N=3
8
N=3
4
N=1
8
**
**
72hr ACI 72hr ACI
N=1
5
N=1
5
N=1
5
N=1
5
40µm
E F
wt
tub>dmyc tub>dmyc
Supercompe��on
44hr APF
DAPI
Neuronal cullingN
=11
N=1
0
N=1
5
Loser clones
72hr ACI
**
72hr ACI
40µm 40µm
wt wt
tub>dmyc tub>dmyc
wtwt
40µm 40µm
T U
UASmfwe3
TUNELDAPI DAPI
αHid
10µm
10µm
44hr APF44hr APF
72hr ACI
40µm
GFPDAPI
tub>dmyc N=2
2
N=3
8tub›
dmyc
›Gal
4
azot -/- ; azot +/+N
=11
N=1
4
% H
id-p
osi�
ve c
ells
azot +/+
tub>dmyc
DAPIDAPI
CD
L
Supercompe��on
I J
10µm
**
tub›
dmyc
›Gal
4
020406080
100120
48hr ACI
N=3
0
N=3
0
M N
O P
20µm
20µm
azot
-/- Pr
obab
ility
of
Hid
expr
essio
n/cl
one
Supercompe��onαHid Q
Clon
e N
°/ cl
one
azot
+/+
GFP
44hr APF
10µm
azot
-/-
a zot
+/+
(legend on next page)
4 Cell 160, 1–16, January 29, 2015 ª2015 The Authors
Please cite this article in press as: Merino et al., Elimination of Unfit Cells Maintains Tissue Health and Prolongs Lifespan, Cell (2015), http://dx.doi.org/10.1016/j.cell.2014.12.017
Please cite this article in press as: Merino et al., Elimination of Unfit Cells Maintains Tissue Health and Prolongs Lifespan, Cell (2015), http://dx.doi.org/10.1016/j.cell.2014.12.017
dmyc-induced competition. In the absence of Azot function,
loser cells were no longer eliminated (Figures 2A–2F), showing
a dramatic 100-fold increase in the number of surviving clones
(Figures 2B and 2E). Loser cells occupied more than 20% of
the tissue 72 hr after clone induction (ACI) (Figures 2B and 2F).
Moreover, using azot{KO; gfp} homozygous flies (that express
GFP under the azot promoter but lack Azot protein), we found
that loser cells survived and showed accumulation of GFP
(Figures S2A and S2B). From these results, we conclude that
azot is expressed by loser cells and is essential for their
elimination.
In addition, clone removal was delayed in an azot heterozy-
gous background (50-fold increase, 15%) (Figures 2E and 2F),
compared to control flies with normal levels of Azot (1-fold,
1%) (Figures 2A, 2E, and 2F). Cell elimination capacity was fully
restored by crossing two copies of Azot::dsRed into the azot�/�
background (0.5-fold, 0.2%) demonstrating the functionality of
the fusion protein (Figures 2C, 2E, and 2F). Silencing azot with
two different RNAis was similarly able to halt selection during
dmyc-induced competition (Figures S2C–S2P). Next, in order
to determine the role of Azot’s EF hands, we generated and over-
expressed amutated isoform of Azot (Pm4Q12) carrying, in each
EF hand, a point mutation known to abolish Ca2+ binding (Maune
et al., 1992). Although overexpression of wild-type azot in nega-
tively selected cells did not rescue the elimination (Figures S2E,
S2I, S2L, and S2P), overexpression of the mutant AzotPm4Q12
reduced cell selection (Figures S2H, S2I, S2O, and S2P), func-
tioning as a dominant-negative mutant. This shows that Ca2+
binding is important for Azot function. Finally, staining for
apoptotic cells corroborated that the lack of Azot prevents cell
elimination, because cell death was reduced 8-fold in mosaic
epithelia containing loser cells (Figure 2D).
Next, we analyzed the role of azot in elimination of peripheral
photoreceptor neurons in the pupal retina using homozygous
azot KO flies (Figures 2G–2L). Pupal retinas undergoing photore-
ceptor culling (44 hr APF) of azot+/+ and azot�/� flies were stained
for the cell death marker TUNEL (Figures 2G and 2I) and the pro-
apoptotic factor Hid (Figures 2H and 2J). Consistent with the
expression pattern of Azot, the number of Hid and TUNEL-pos-
itive cells was dramatically decreased in azot�/� retinas (Figures
2I–2L) compared to azot+/+ retinas (Figures 2G, 2H, 2K, and 2L).
Those results showed that Azot was required to induce cell
death and Hid expression during neuronal culling. Therefore,
we tested if that was also the case in the wing epithelia during
dmyc-induced competition. We found that Hid was expressed
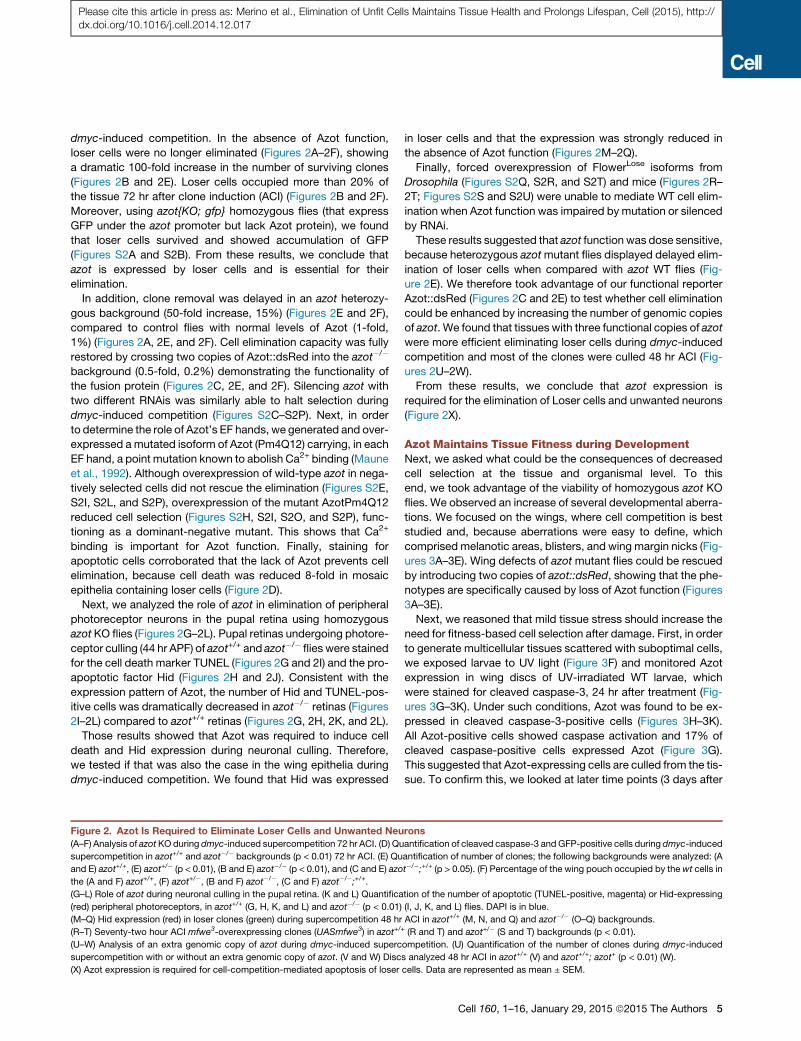
Figure 2. Azot Is Required to Eliminate Loser Cells and Unwanted Neu
(A–F) Analysis of azotKOduring dmyc-induced supercompetition 72 hr ACI. (D) Qu
supercompetition in azot+/+ and azot�/� backgrounds (p < 0.01) 72 hr ACI. (E) Qu
and E) azot+/+, (E) azot+/� (p < 0.01), (B and E) azot�/� (p < 0.01), and (C and E) azo
the (A and F) azot+/+, (F) azot+/�, (B and F) azot�/�, (C and F) azot�/�;+/+.(G–L) Role of azot during neuronal culling in the pupal retina. (K and L) Quantifica
(red) peripheral photoreceptors, in azot+/+ (G, H, K, and L) and azot�/� (p < 0.01)
(M–Q) Hid expression (red) in loser clones (green) during supercompetition 48 hr
(R–T) Seventy-two hour ACI mfwe3-overexpressing clones (UASmfwe3) in azot+/
(U–W) Analysis of an extra genomic copy of azot during dmyc-induced superc
supercompetition with or without an extra genomic copy of azot. (V and W) Disc
(X) Azot expression is required for cell-competition-mediated apoptosis of loser
in loser cells and that the expression was strongly reduced in
the absence of Azot function (Figures 2M–2Q).
Finally, forced overexpression of FlowerLose isoforms from
Drosophila (Figures S2Q, S2R, and S2T) and mice (Figures 2R–
2T; Figures S2S and S2U) were unable to mediate WT cell elim-
ination when Azot function was impaired by mutation or silenced
by RNAi.
These results suggested that azot function was dose sensitive,
because heterozygous azotmutant flies displayed delayed elim-
ination of loser cells when compared with azot WT flies (Fig-
ure 2E). We therefore took advantage of our functional reporter
Azot::dsRed (Figures 2C and 2E) to test whether cell elimination
could be enhanced by increasing the number of genomic copies
of azot. We found that tissues with three functional copies of azot
were more efficient eliminating loser cells during dmyc-induced
competition and most of the clones were culled 48 hr ACI (Fig-
ures 2U–2W).
From these results, we conclude that azot expression is
required for the elimination of Loser cells and unwanted neurons
(Figure 2X).
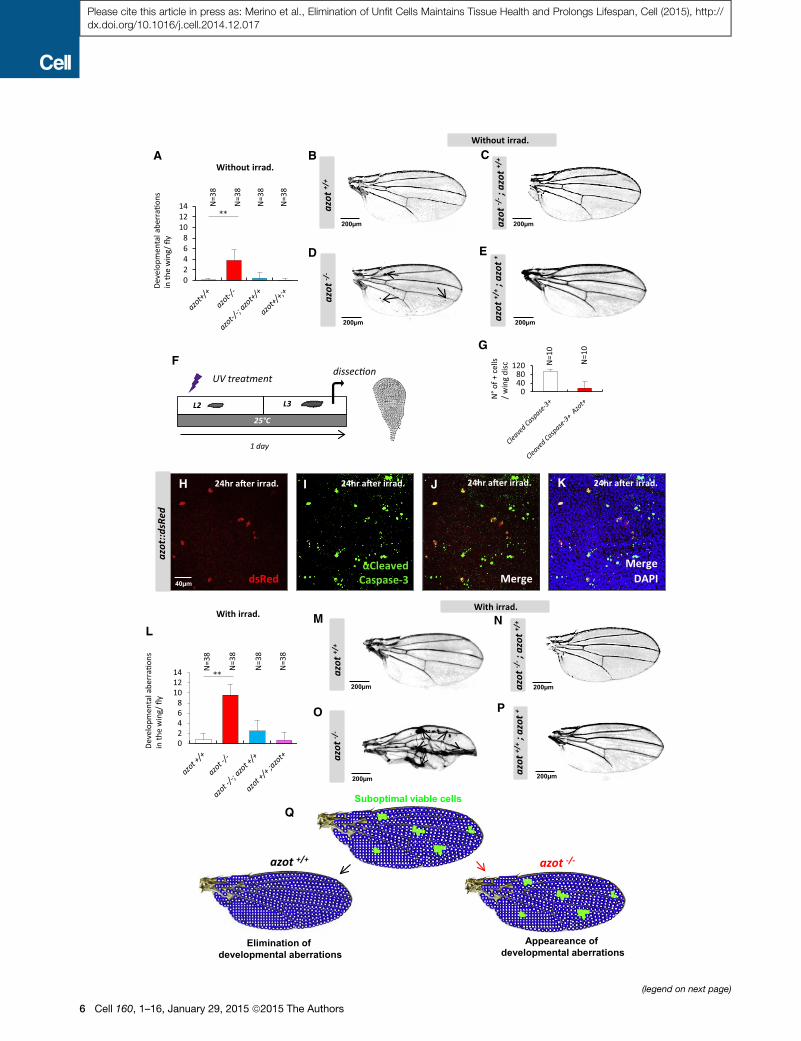
Azot Maintains Tissue Fitness during DevelopmentNext, we asked what could be the consequences of decreased
cell selection at the tissue and organismal level. To this
end, we took advantage of the viability of homozygous azot KO
flies. We observed an increase of several developmental aberra-
tions. We focused on the wings, where cell competition is best
studied and, because aberrations were easy to define, which
comprised melanotic areas, blisters, and wing margin nicks (Fig-
ures 3A–3E). Wing defects of azot mutant flies could be rescued
by introducing two copies of azot::dsRed, showing that the phe-
notypes are specifically caused by loss of Azot function (Figures
3A–3E).
Next, we reasoned that mild tissue stress should increase the
need for fitness-based cell selection after damage. First, in order
to generate multicellular tissues scattered with suboptimal cells,
we exposed larvae to UV light (Figure 3F) and monitored Azot
expression in wing discs of UV-irradiated WT larvae, which
were stained for cleaved caspase-3, 24 hr after treatment (Fig-
ures 3G–3K). Under such conditions, Azot was found to be ex-
pressed in cleaved caspase-3-positive cells (Figures 3H–3K).
All Azot-positive cells showed caspase activation and 17% of
cleaved caspase-positive cells expressed Azot (Figure 3G).
This suggested that Azot-expressing cells are culled from the tis-
sue. To confirm this, we looked at later time points (3 days after
rons
antification of cleaved caspase-3 and GFP-positive cells during dmyc-induced
antification of number of clones; the following backgrounds were analyzed: (A
t�/�;+/+ (p > 0.05). (F) Percentage of the wing pouch occupied by the wt cells in
tion of the number of apoptotic (TUNEL-positive, magenta) or Hid-expressing
(I, J, K, and L) flies. DAPI is in blue.
ACI in azot+/+ (M, N, and Q) and azot�/� (O–Q) backgrounds.+ (R and T) and azot+/� (S and T) backgrounds (p < 0.01).
ompetition. (U) Quantification of the number of clones during dmyc-induced
s analyzed 48 hr ACI in azot+/+ (V) and azot+/+; azot+ (p < 0.01) (W).
cells. Data are represented as mean ± SEM.
Cell 160, 1–16, January 29, 2015 ª2015 The Authors 5
02468
101214
02468
101214
Deve
lopm
enta
l abe
rra�
ons
in th
e w
ing/
fly
N=3
8
N=3
8
N=3
8
N=3
8
azot
+/+
25°C
L2 L3
1 day
dissec�onUV treatment
azot
-/- ;
azo
t +/+
azot
-/-
A B C
D
F
L
Q
N
P
azot +/+ azot -/-
Suboptimal viable cells
Appeareance ofdevelopmental aberrations
Elimination ofdevelopmental aberrations
azot
+/+
; azo
t +E
azot
+/+
M
azot
-/- ;
azo
t +/+
a zot
-/-
azot
+/+
; azo
t +O
G
**
**
N=3
8
N=3
8
N=3
8
N=3
8
Without irrad.
Deve
lopm
enta
l abe
rra�
ons
in th
e w
ing/
fly
With irrad.
Without irrad.
With irrad.
200µm 200µm
200µm 200µm
200µm 200µm
200µm 200µm
24hr a�er irrad.H I J K
azot
::dsR
ed
04080
120 N=1
0
N=1
0
N°o
f + c
ells
/ win
g di
sc
24hr a�er irrad. 24hr a�er irrad. 24hr a�er irrad.
MergeDAPI
αCleaved Caspase-3dsRed Merge40µm
(legend on next page)
6 Cell 160, 1–16, January 29, 2015 ª2015 The Authors
Please cite this article in press as: Merino et al., Elimination of Unfit Cells Maintains Tissue Health and Prolongs Lifespan, Cell (2015), http://dx.doi.org/10.1016/j.cell.2014.12.017
Please cite this article in press as: Merino et al., Elimination of Unfit Cells Maintains Tissue Health and Prolongs Lifespan, Cell (2015), http://dx.doi.org/10.1016/j.cell.2014.12.017
irradiation; Figure S3A) and found that the increase in Azot-pos-
itive cells was no longer detectable (Figures S3B–S3D). The elim-
ination of azot-expressing cells after UV irradiation required azot
function, because cells revealed by reporter azot{KO; gfp}, that
express GFP instead of Azot, persisted in wing imaginal discs
from azot-null larvae (Figures S3E–S3G). We therefore tested if
lack of azot leads to a faster accumulation of tissue defects dur-
ing organ development upon external damage. We irradiated
azot�/� pupae 0 stage (Figures 3L–3P) and compared the num-
ber of morphological defects in adult wings to those in nonirradi-
ated azot KO flies (Figures 3A–3E). We found that aberrations
increased more than 2-fold when compared to nonirradiated
azot�/� flies (Figures 3L–3P).
In order to functionally discriminate whether azot belongs
to genes regulating apoptosis in general or is dedicated to
fitness-based cell selection, we examined if azot silencing
prevented Eiger/TNF-induced cell death (GMR-Gal4,UASeiger)
(Figures S3H–S3N). Inhibiting apoptosis (UASp35) or eiger
(UASRNAieiger) rescued eye ablation, whereas azot silencing
and overexpression of AzotPm4Q12 did not (Figures S3I–S3N).
Furthermore, azot silencing did not impair apoptosis during geni-
talia rotation (Figures S3O–S3R) (Suzanne et al., 2010) or cell
death of epithelial precursors in the retina (Figures S3S–S3V)
(Wolff and Ready, 1991).
The results showed above highlight the consequences of
nonfunctional cell-quality control within developing tissues
(Figure 3Q).
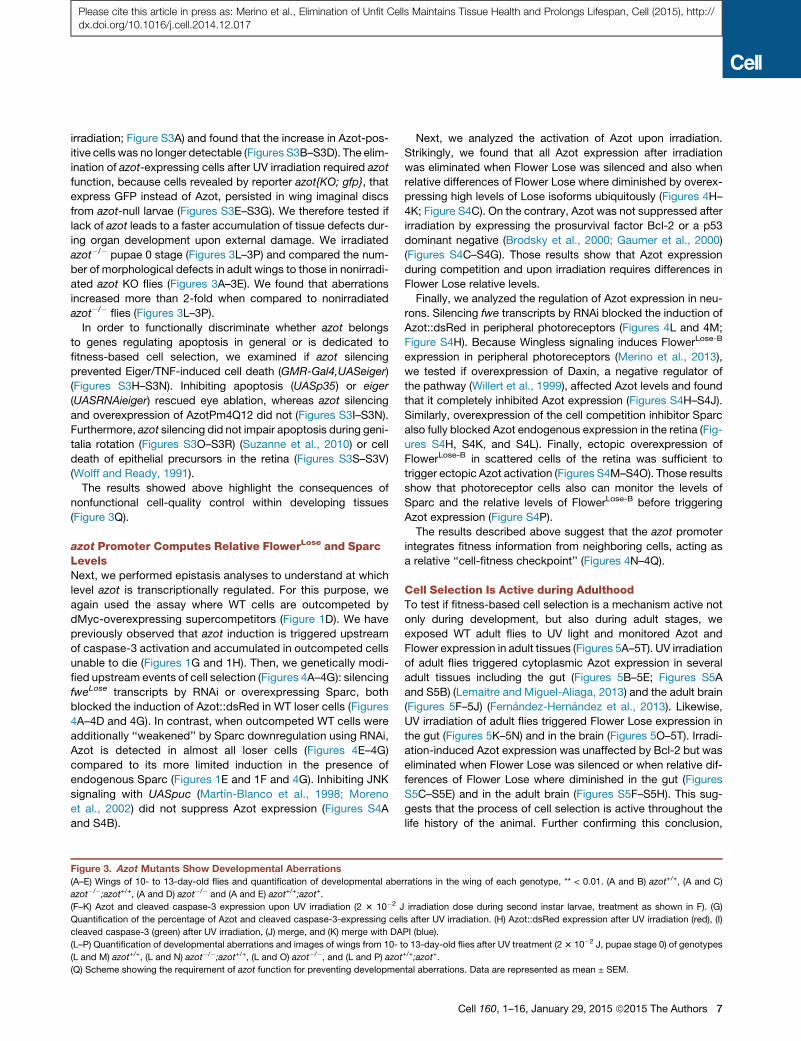
azot Promoter Computes Relative FlowerLose and SparcLevelsNext, we performed epistasis analyses to understand at which
level azot is transcriptionally regulated. For this purpose, we
again used the assay where WT cells are outcompeted by
dMyc-overexpressing supercompetitors (Figure 1D). We have
previously observed that azot induction is triggered upstream
of caspase-3 activation and accumulated in outcompeted cells
unable to die (Figures 1G and 1H). Then, we genetically modi-
fied upstream events of cell selection (Figures 4A–4G): silencing
fweLose transcripts by RNAi or overexpressing Sparc, both
blocked the induction of Azot::dsRed in WT loser cells (Figures
4A–4D and 4G). In contrast, when outcompeted WT cells were
additionally ‘‘weakened’’ by Sparc downregulation using RNAi,
Azot is detected in almost all loser cells (Figures 4E–4G)
compared to its more limited induction in the presence of
endogenous Sparc (Figures 1E and 1F and 4G). Inhibiting JNK
signaling with UASpuc (Martın-Blanco et al., 1998; Moreno
et al., 2002) did not suppress Azot expression (Figures S4A
and S4B).
Figure 3. Azot Mutants Show Developmental Aberrations
(A–E) Wings of 10- to 13-day-old flies and quantification of developmental abe
azot�/�;azot+/+, (A and D) azot�/� and (A and E) azot+/+;azot+.
(F–K) Azot and cleaved caspase-3 expression upon UV irradiation (2 3 10�2 J
Quantification of the percentage of Azot and cleaved caspase-3-expressing cel
cleaved caspase-3 (green) after UV irradiation, (J) merge, and (K) merge with DA
(L–P) Quantification of developmental aberrations and images of wings from 10- t
(L and M) azot+/+, (L and N) azot�/�;azot+/+, (L and O) azot�/�, and (L and P) azot
(Q) Scheme showing the requirement of azot function for preventing developmen
Next, we analyzed the activation of Azot upon irradiation.
Strikingly, we found that all Azot expression after irradiation
was eliminated when Flower Lose was silenced and also when
relative differences of Flower Lose where diminished by overex-
pressing high levels of Lose isoforms ubiquitously (Figures 4H–
4K; Figure S4C). On the contrary, Azot was not suppressed after
irradiation by expressing the prosurvival factor Bcl-2 or a p53
dominant negative (Brodsky et al., 2000; Gaumer et al., 2000)
(Figures S4C–S4G). Those results show that Azot expression
during competition and upon irradiation requires differences in
Flower Lose relative levels.
Finally, we analyzed the regulation of Azot expression in neu-
rons. Silencing fwe transcripts by RNAi blocked the induction of
Azot::dsRed in peripheral photoreceptors (Figures 4L and 4M;
Figure S4H). Because Wingless signaling induces FlowerLose-B
expression in peripheral photoreceptors (Merino et al., 2013),
we tested if overexpression of Daxin, a negative regulator of
the pathway (Willert et al., 1999), affected Azot levels and found
that it completely inhibited Azot expression (Figures S4H–S4J).
Similarly, overexpression of the cell competition inhibitor Sparc
also fully blocked Azot endogenous expression in the retina (Fig-
ures S4H, S4K, and S4L). Finally, ectopic overexpression of
FlowerLose-B in scattered cells of the retina was sufficient to
trigger ectopic Azot activation (Figures S4M–S4O). Those results
show that photoreceptor cells also can monitor the levels of
Sparc and the relative levels of FlowerLose-B before triggering
Azot expression (Figure S4P).
The results described above suggest that the azot promoter
integrates fitness information from neighboring cells, acting as
a relative ‘‘cell-fitness checkpoint’’ (Figures 4N–4Q).
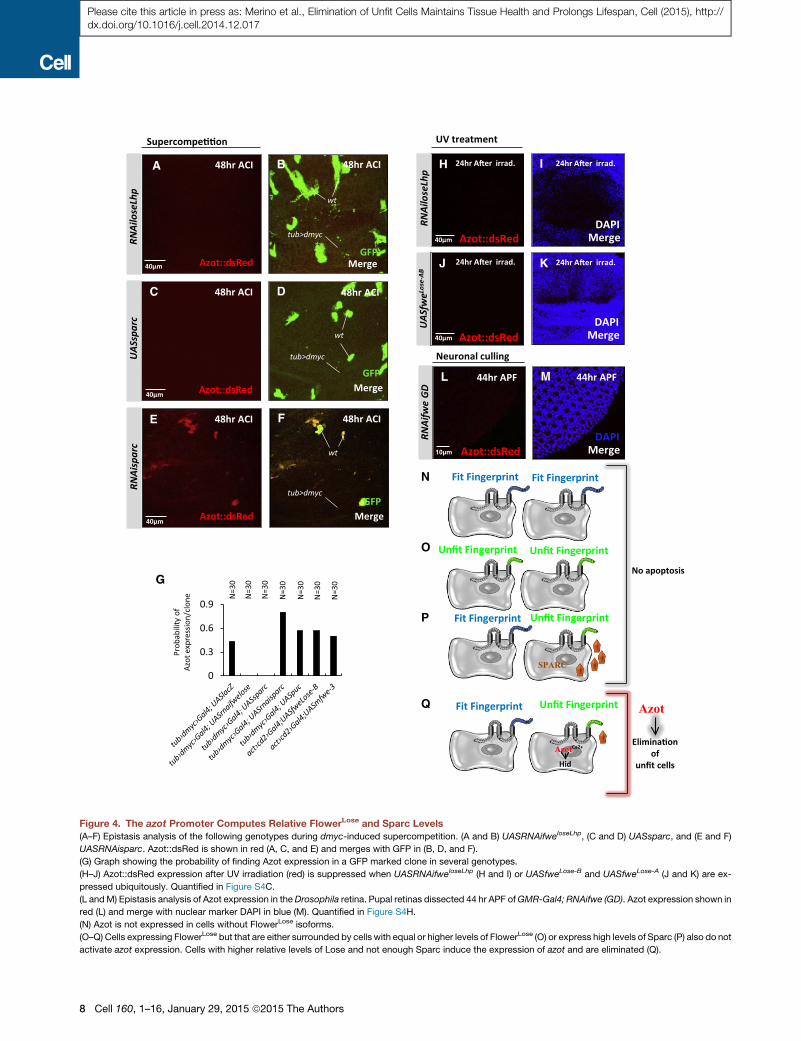
Cell Selection Is Active during AdulthoodTo test if fitness-based cell selection is a mechanism active not
only during development, but also during adult stages, we
exposed WT adult flies to UV light and monitored Azot and
Flower expression in adult tissues (Figures 5A–5T). UV irradiation
of adult flies triggered cytoplasmic Azot expression in several
adult tissues including the gut (Figures 5B–5E; Figures S5A
and S5B) (Lemaitre and Miguel-Aliaga, 2013) and the adult brain
(Figures 5F–5J) (Fernandez-Hernandez et al., 2013). Likewise,
UV irradiation of adult flies triggered Flower Lose expression in
the gut (Figures 5K–5N) and in the brain (Figures 5O–5T). Irradi-
ation-induced Azot expression was unaffected by Bcl-2 but was
eliminated when Flower Lose was silenced or when relative dif-
ferences of Flower Lose where diminished in the gut (Figures
S5C–S5E) and in the adult brain (Figures S5F–S5H). This sug-
gests that the process of cell selection is active throughout the
life history of the animal. Further confirming this conclusion,
rrations in the wing of each genotype, ** < 0.01. (A and B) azot+/+, (A and C)
irradiation dose during second instar larvae, treatment as shown in F). (G)
ls after UV irradiation. (H) Azot::dsRed expression after UV irradiation (red), (I)
PI (blue).
o 13-day-old flies after UV treatment (23 10�2 J, pupae stage 0) of genotypes+/+;azot+.
tal aberrations. Data are represented as mean ± SEM.
Cell 160, 1–16, January 29, 2015 ª2015 The Authors 7
Merge
E
GFP
RNAi
lose
Lhp
UAS
spar
cRN
Aisp
arc
40μm
A B
C D
F
Azot::dsRed MergeGFP
MergeGFP
Supercompe��on
48hr ACI48hr ACI
48hr ACI48hr ACI
48hr ACI48hr ACI
wt
tub>dmyc
wt
tub>dmyc
tub>dmyc
wt
Azot::dsRed
Azot::dsRed
Unfit Fingerprint
Fit FingerprintN
P
O
Q
Unfit Fingerprint
Fit Fingerprint
Fit Fingerprint
No apoptosis
Azot
Unfit Fingerprint
SPARC
Azot
Fit Fingerprint Unfit Fingerprint
Hid
Ca2+
0
0.3
0.6
0.9
Prob
abili
ty o
f Az
ot e
xpre
ssio
n/cl
one N
=30
N=3
0
N=3
0
N=3
0
N=3
0
N=3
0
N=3
0
RNAi
fwe
GD
Azot::dsRed MergeDAPI
44hr APF 44hr APF
Neuronal culling
G
UV treatment
24hr A�er irrad.
24hr A�er irrad. 24hr A�er irrad.
24hr A�er irrad.
J K
H I
L M
RNAi
lose
Lhp
UAS
fweLo
se-A
B
40μm
40μm
40μm
40μm MergeDAPI
MergeDAPI
Azot::dsRed
Azot::dsRed
10µm
Elimina�on of
unfit cells
Figure 4. The azot Promoter Computes Relative FlowerLose and Sparc Levels
(A–F) Epistasis analysis of the following genotypes during dmyc-induced supercompetition. (A and B) UASRNAifweloseLhp, (C and D) UASsparc, and (E and F)
UASRNAisparc. Azot::dsRed is shown in red (A, C, and E) and merges with GFP in (B, D, and F).
(G) Graph showing the probability of finding Azot expression in a GFP marked clone in several genotypes.
(H–J) Azot::dsRed expression after UV irradiation (red) is suppressed when UASRNAifweloseLhp (H and I) or UASfweLose-B and UASfweLose-A (J and K) are ex-
pressed ubiquitously. Quantified in Figure S4C.
(L andM) Epistasis analysis of Azot expression in theDrosophila retina. Pupal retinas dissected 44 hr APF ofGMR-Gal4; RNAifwe (GD). Azot expression shown in
red (L) and merge with nuclear marker DAPI in blue (M). Quantified in Figure S4H.
(N) Azot is not expressed in cells without FlowerLose isoforms.
(O–Q) Cells expressing FlowerLose but that are either surrounded by cells with equal or higher levels of FlowerLose (O) or express high levels of Sparc (P) also do not
activate azot expression. Cells with higher relative levels of Lose and not enough Sparc induce the expression of azot and are eliminated (Q).
8 Cell 160, 1–16, January 29, 2015 ª2015 The Authors
Please cite this article in press as: Merino et al., Elimination of Unfit Cells Maintains Tissue Health and Prolongs Lifespan, Cell (2015), http://dx.doi.org/10.1016/j.cell.2014.12.017

25°C
dissec�on
1 day
UV treatment
24hr A�er irrad.
40µm
40µm MergeDAPI
dsRed
dsRed
F
A
B C
D E
50µm
G H
I J
10µm
10µm GFP
azot
::dsR
ed
24hr A�er irrad.
azot
::dsR
ed
MergeDAPI
MergeDAPI
MergeDAPI
GFP
DAPI
24hr A�er irrad. 24hr A�er irrad.
24hr A�er irrad. 24hr A�er irrad.
40µm
40µm
MergeDAPI
MergeDAPI
K
M
L
N
GFP
GFP
azot
{KO
; gfp
}az
ot{K
O; g
fp}
24hr A�er irrad. 24hr A�er irrad. 24hr A�er irrad.
RFP
O P Q
R S T
FweLo
se-A
- GFP
FweLo
se-B
-RFP
FweLo
se- A
-GFP
FweLo
se-B
- RFP
FweLo
se-A
-GFP
FweLo
se-B
- RFP
FweLo
se-A
-GFP
FweLo
se-B
-RFP
RFP
RFP
GFPRFP
GFPRFP
MergeDAPI
MergeDAPI
20µm
20µm
F
10µm
Figure 5. Expression of Flower Isoforms and Azot in Adult Flies with and without UV Irradiation
(A–E) Expression analysis of Azot (red, B and D) in the midgut without (B and C) and with (D and E) UV-irradiation treatment (as shown in A); (C) and (E) show
merges with DAPI.
(F–J) Expression analysis of Azot using reporter line azot{KO; gfp} in the adult brain without (G and H) and after (I and J) UV-irradiation treatment merges with DAPI
in (H and J).
(K–T) Expression analysis of Flower Lose isoforms Lose A (green) and Lose B (red) (flower Lose-A-GFP, flower Lose-B-RFP). (K and M) In the midgut without (K
and L) and with (M and N) UV-irradiation treatment. (L and N) merges with DAPI. Inset in (M) shows FweLose-A and FweLose-B expression at higher magnification.
(O–T) Expression of Flower Lose isoforms in the adult brain without (O–Q) and after (R–T) UV irradiation, merges with DAPI in (Q and T).
Please cite this article in press as: Merino et al., Elimination of Unfit Cells Maintains Tissue Health and Prolongs Lifespan, Cell (2015), http://dx.doi.org/10.1016/j.cell.2014.12.017
Azot function was essential for survival after irradiation, because
more than 99% of azot mutant adults died 6 days after irradia-
tion, whereas only 62.4% of WT flies died after the same treat-
ment (Figure S5I). The percentage of survival correlated with
the dose of azot because adults with three functional copies of
azot had higher median survival and maximum lifespan than
WT flies, or null mutant flies rescued with two functional azot
transgenes (Figure S5J).
Those results show that in adult tissues external damage can
induce cell-fitness deficits.
Role of Cell Selection during AgingLack of cell selection could affect the whole organism by two
nonexclusive mechanisms. First, the failure to detect precancer-
ous cells, which could lead to cancer formation and death of the
individual. Second, the time-dependent accumulation of unfit
Cell 160, 1–16, January 29, 2015 ª2015 The Authors 9
020406080
100120
0 2 4 6 8 1012141618202224262830
azot +/+
azot -/-; +/+
azot -/-
azot +/+; +
Lifespan analysis 29°C
GenotypeMedian survival
(d)
% Median survival
difference
Max.lifespan
% Max. lifespan
difference
Log-Rankp
azot +/+ 16.3 0% 24 0% -
azot -/-; +/+ 18.2 12% 24 0% >0.05
azot -/- 7.8 -52.14% 18 -25% <0.001
azot +/+; + 25.1 54% 28 17% <0.001
X
01234567
01234567
01234567
N°o
f neu
rode
gene
ra�v
e va
cuol
es/
N°n
euro
dege
nera
�ve
vacu
oles
azo
t+/+
1 d
ay
1 day 7 days 14 days
N°o
f neu
rode
gene
ra�v
e va
cuol
es/
N°n
euro
dege
nera
�ve
vacu
oles
azo
t+/+
1 d
ay
N° o
f neu
rode
gene
ra�v
e va
cuol
es/
N°n
euro
dege
nera
�ve
vacu
oles
azo
t+/+
1 d
ay
N O P
**
**
**
**
**
%Su
rviv
ors
Day
YLifespan
70µm
Posterior
Anterior
1da
y7
days
14 d
ays
azot +/+ azot -/- ; azot +/+azot -/- azot +/+; azot +
10µm
A
B C D E
F G H I
J K L M
Q R
S T
U V
012345678
14 days
N°o
f GFP
-pos
i�ve
cells
/ N
°of G
FP-p
osi�
ve c
ells
1 da
y
azot{KO; gfp}
MergeDAPIGFP
MergeDAPI
GFP
MergeDAPI
W
10µm 10µm 10µm 10µm
10µm 10µm 10µm
10µm 10µm 10µm
10µm
10µm
10µm
10µm GFP
(legend on next page)
10 Cell 160, 1–16, January 29, 2015 ª2015 The Authors
Please cite this article in press as: Merino et al., Elimination of Unfit Cells Maintains Tissue Health and Prolongs Lifespan, Cell (2015), http://dx.doi.org/10.1016/j.cell.2014.12.017
Please cite this article in press as: Merino et al., Elimination of Unfit Cells Maintains Tissue Health and Prolongs Lifespan, Cell (2015), http://dx.doi.org/10.1016/j.cell.2014.12.017
but viable cells could lead to accelerated tissue and organ
decay. We therefore tested both hypotheses.
It has been previously shown that cells with reduced levels for
cell polarity genes like scrib or dlg are eliminated but can give rise
to tumors when surviving (Igaki et al., 2009; Parisi et al., 2014;
Tamori et al., 2010). We therefore checked if azot functions as
a tumor suppressing mechanism in those cells (Figures S6A–
S6M). Elimination of dlg and scrib mutant cells was not affected
by RNAi against azot (Figures S6D–S6M) or when Azot function
was impaired by mutation (Figures S6N–S6R), in agreement
with the absence of azot induction in these mutant cells (Figures
S1O and S6A–S6C). However, azot RNAi or the same azot
mutant background efficiently rescued the elimination of clones
with reduced Wg signaling (Vincent et al., 2011) (Figures S6J–
S6M, S6Q, and S6R).
Moreover, the high number of suboptimal cells produced by
UV treatment did not lead to tumoral growth in azot-null back-
ground (Figures S3E–S3G). Thus, tumor suppression mecha-
nisms are not impaired in azotmutant backgrounds, and tumors
are not more likely to arise in azot-null mutants.
Second, we tested whether the absence of azot accelerates
tissue fitness decay in adult tissues. We focused on the adult
brain, where neurodegenerative vacuoles develop over time
and can be used as a marker of aging (Liu et al., 2012). We
compared the number of vacuoles appearing in the brain of
flies lacking azot (azot�/�), WT flies (azot+/+), flies with one extra
genomic copy of the gene (azot+/+; azot+), and mutant flies
rescued with two genomic copies of azot (azot�/�;azot+/+).For all the genotypes analyzed, we observed a progressive in-
crease in the number and size of vacuoles in the brain over time
(Figures 6A–6P; Figure S6S). Interestingly, azot�/� brains
showed higher number of vacuoles compared to control flies
(azot+/+ and azot�/�;azot+/+) and a higher rate of vacuole accu-
mulation developing over time (Figures 6N–6P). In the case of
flies with three genomic copies of the gene (azot+/+; azot+),
vacuole number tended to be the lowest (Figures 6E, 6I, and
6M–6P).
Next, we analyzed the cumulative expression of azot during
aging of the adult brain. We detected positive cells as revealed
by reporter azot{KO; gfp}, in homozygosis, that express GFP
instead of Azot. We observed a time-dependent accumulation
of azot-positive cells (Figures 6Q–6W).
From this, we conclude that azot is required to prevent tissue
degeneration in the adult brain and lack of azot showed signs of
accelerated aging. This suggested that azot could affect the
longevity of adult flies (Figures 6X and 6Y). We found that flies
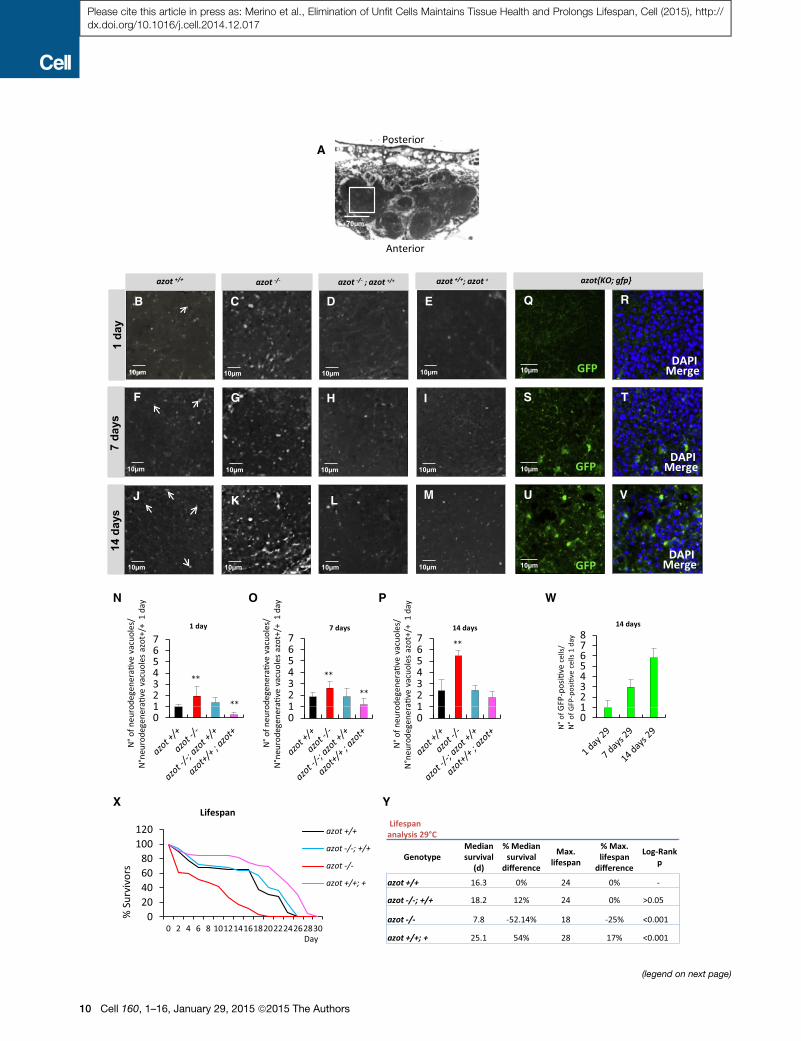
Figure 6. azot Is Required to Prevent Tissue Degeneration in the Adult
(A–P) Brain integrity studies over time. (A) Axial plane of Drosophila WT brain c
brain, counterstained with toluidine blue, showing degenerative vacuoles (white d
azot+/+, and (4) azot+/+; azot+. (N–P) Number of neurodegenerative vacuoles. (N) N
(azot+/+ n = 14, azot�/� [p < 0.01] n = 8, azot�/�;azot+/+ n = 16 and azot+/+; azot+ [p
at 29�C (azot+/+ n = 16, azot�/� [p < 0.01] n = 16, azot�/�;azot+/+ n = 7 and azot+/+; a
14 days at 29�C (azot+/+ n = 7, azot�/� [p < 0.01] n = 3, azot�/�;azot+/+ n = 10 an
(Q–V) Azot-positive cells (green, GFP) in azot{KO; gfp} homozygous flies after 1 d
(W) Number of Azot-positive cells per brain area (503 50 mm) in azot{KO; gfp} hom
(X) Lifespan studies of the same four genotypes at 29�C.(Y) Lifespan values, including median survival and maximum lifespan, for the fou
Data are represented as mean ± SEM.
lacking azot (azot�/�) had a shortened lifespan with a median
survival of 7.8 days, which represented a 52% decrease when
compared to WT flies (azot+/+), and a maximum lifespan of
18 days, 25% less than WT flies (azot+/+). This effect on lifespan
was azot dependent because it was completely rescued by intro-
ducing two functional copies of azot (Figures 6X and 6Y). On the
contrary, flies with three functional copies of the gene (azot+/+;
azot+) showed an increase in median survival and maximum life-
span of 54% and 17%, respectively.
In conclusion, azot is necessary and sufficient to slow down
aging, and active selection of viable cells is critical for a long life-
span in multicellular animals.
Death of Unfit Cells Is Sufficient and Required forMulticellular Fitness MaintenanceOur results show the genetic mechanism through which cell se-
lection mediates elimination of suboptimal but viable cells. How-
ever, using flip-out clones and MARCM (Lee and Luo, 2001), we
found that Azot overexpression was not sufficient to induce cell
death in wing imaginal discs (Figures S6T–S6Y). Because Hid is
downstream of Azot, we wondered whether expressing Hid un-
der the control of the azot regulatory regions could substitute for
Azot function.
In order to test this hypothesis, we replaced the whole
endogenous azot protein-coding sequence by the cDNA of
the proapoptotic gene hid (azot{KO; hid} flies; see Figure 7A).
In a second strategy, the whole endogenous azot protein-cod-
ing sequence was replaced by the cDNA of transcription factor
Gal4, so that the azot promoter can activate any UAS driven
transgene (azot{KO; Gal4} flies (Figure 7B). We then compared
the number of morphological aberrations in the adult wings of
six genotypes: first, homozygous azot{KO; Gal4} flies that
lacked Azot; second, azot{KO; hid} homozygous flies that ex-
press Hid with the azot pattern in complete absence of Azot;
third, azot+/+ WT flies as a control; and finally three genotypes
where the azot{KO; Gal4} flies were crossed with UAShid, UAS-
sickle, another proapoptotic gene (Srinivasula et al., 2002), or
UASp35, an apoptosis inhibitor. In the case of UASsickle flies,
we introduced a second azot mutation to eliminate azot func-
tion. Interestingly, the number of morphological aberrations
was brought back to WT levels in all the situations where the
azot promoter was driving proapoptotic genes (azot{KO; hid},
azot{KO; Gal4} 3 UAShid, azot{KO; Gal4} 3 UASsickle, see
Figures 7A–7J) with or without irradiation. On the contrary,
expressing p35 with the azot promoter was sufficient to pro-
duce morphological aberrations despite the presence of one
Brain and to Promote Lifespan
ounterstained with toluidine blue. (B–M) Magnification images of the central
ots) of the following four genotypes over time: (1) azot+/+, (2) azot�/�, (3) azot�/�;umber of degenerative vacuoles per brain area (703 70 mm) after 1 day at 29�C< 0.01] n = 11). (O) Number of degenerative vacuoles per brain area after 7 days
zot+ [p < 0.01] n = 20). (P) Number of degenerative vacuoles per brain area after
d azot+/+; azot+ n = 7).
ay (Q and R), 7 days (S and T), and 14 days (U and V) at 29�C. DAPI is in blue.
ozygous flies after 1 day (n = 11), 7 days (n = 15), and 14 days (n = 18) at 29�C.
r genotypes.
Cell 160, 1–16, January 29, 2015 ª2015 The Authors 11
0
50
100
150
0 4 8 121620242832364044485256606572
azot+/+
azot-/-
azot+/+; +
azot{KO; hid}
0 5 10 15 20
azot{KO; Gal4}/azot- ;UAS-sickle
azot{KO; Gal4}/azot+ ;UAS-hid
azot{KO; hid}/azot{KO; hid}
azot{KO;Gal4}/azot{KO; Gal4}
azot+/+
0 5 10 15 20
azot{KO; Gal4}/azot- ;UAS-sickle
azot{KO; Gal4}/azot+ ;UAS-hid
azot{KO; hid}/azot{KO; hid}
azot{KO;Gal4}/azot{KO; Gal4}
azot+/+
T
azot
{KO
; hid
}
Elimination of suboptimal cellsTargeted CullingSuboptimal cells
0
50
100
150
0 4 8 12 16 20 24 28 32 36 40 44
azot{KO; hid}
azot-/-
Lifespan analysis 29°C
GenotypeMedian survival
(d)
% Median survival
difference
Max. lifespan
% Max. lifespan
difference
Log-Rankp
azot -/- 12.1 0% 24 0% -
azot{KO; hid} 27.2 124.74% 34 41.6% <0.001
azot{KO; Gal4}/ azot{KO; Gal4}
azot{KO;hid}/ azot{KO;hid}
azot{KO; Gal4}/ azot- ; UASsickle
azot{KO; Gal4}
****
CD
E
F
G H
I
J
200µm
200µm
200µm
200µm
200µm
200µm
KL
O
A
azot{KO; Gal4}/ azot- ; UASsickle
B
N=36
N=34
N=44
N=41
N=43
N=38
N=43
N=41
N=39
N=38
%Su
rviv
ors
Day
Without irrad. With irrad. Without irrad. With irrad.
5᾿arm a�R
loxP 3᾿arm hid
azot{KO; hid}
Lifespan
Developmental aberra�ons in the wing/ fly
azot{KO;hid}/ azot{KO;hid}
azot{KO; Gal4}/ azot{KO; Gal4}
%Su
rviv
ors
Lifespan
Day
MN
Lifespananalysis 25°C
GenotypeMedian survival
(d)
% Median survival
difference
Max. lifespan
% Max. lifespan
difference
Log-Rankp
azot +/+ 34.2 0% 58 0% -
azot -/- 25.9 -24.27% 40 -31.04% <0.001
azot +/+; + 53 54.97% 65 12.06% <0.001
azot{KO; hid} 56 63.74% 72 24.13% <0.001
5᾿arm a�R
loxP 3᾿arm Gal4
Tissue health Long lifespan
(legend on next page)
12 Cell 160, 1–16, January 29, 2015 ª2015 The Authors
Please cite this article in press as: Merino et al., Elimination of Unfit Cells Maintains Tissue Health and Prolongs Lifespan, Cell (2015), http://dx.doi.org/10.1016/j.cell.2014.12.017
Please cite this article in press as: Merino et al., Elimination of Unfit Cells Maintains Tissue Health and Prolongs Lifespan, Cell (2015), http://dx.doi.org/10.1016/j.cell.2014.12.017
functional copy of azot (Figures S7A–S7H). Likewise, p35-ex-
pressing flies (azot{KO; Gal4}/azot+; UASp35) did not survive
UV treatments (Figure S7I), whereas a percentage of the flies
expressing hid (26%) or sickle (28%) in azot-positive cells
were able to survive (Figure S7I).
From this, we conclude that specifically killing those cells
selected by the azot promoter is sufficient and required to pre-
vent morphological malformations and provide resistance to
UV irradiation.
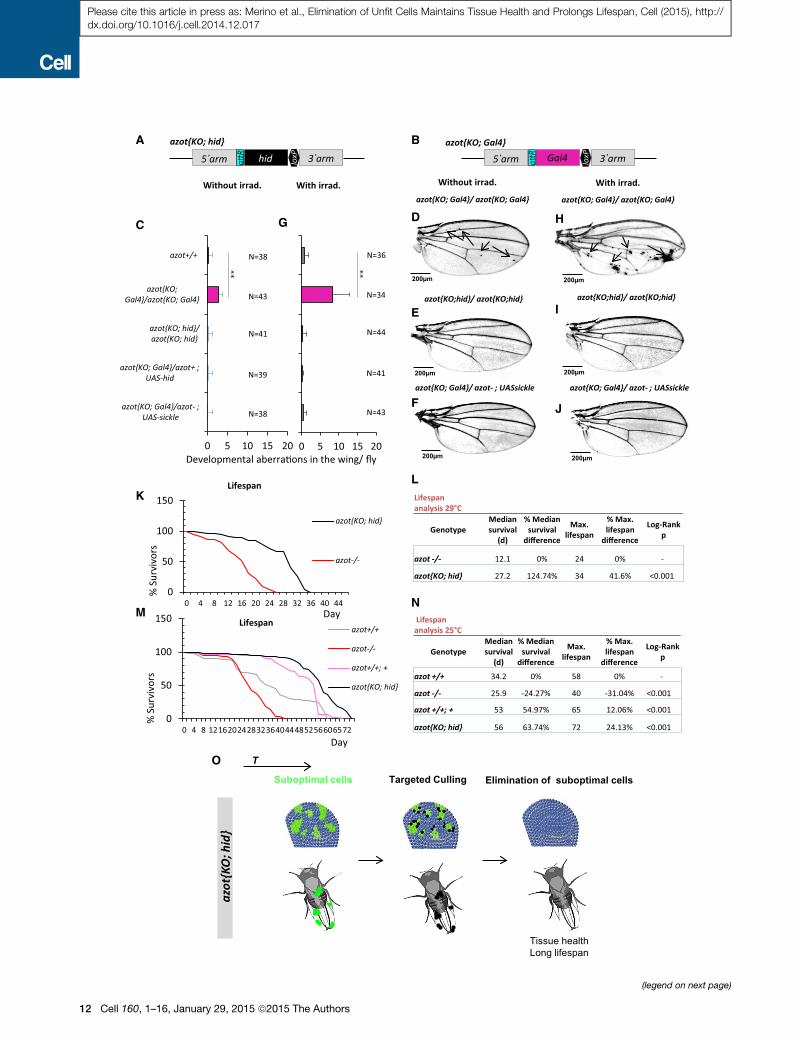
Death of Unfit Cells Extends LifespanNext, we checked if the shortened longevity observed in azot�/
� flies could be also rescued by killing azot-expressing cells
with hid in the absence of Azot protein. We found that azot
{KO; hid} homozygous flies had dramatically improved lifespan
with a median survival of 27 days at 29�C, which represented
a 125% increase when compared to azot�/� flies, and a
maximum lifespan of 34 days, 41% more than mutant flies (Fig-
ures 7K and 7L).
Similar results were obtained at 25�C (Figures 7M and 7N).
We found that flies lacking azot (azot�/�) had a shortened
lifespan with a median survival of 25 days, which represented
a 24% decrease when compared to WT flies (azot+/+), and
a maximum lifespan of 40 days, 31% less than WT flies
(azot+/+). On the contrary, flies with three functional copies of
the gene (azot+/+; azot+) or flies where azot is replaced by hid
(azot{KO; hid} homozygous flies) showed an increase in median
survival of 54% and 63% and maximum lifespan of 12% and
24%, respectively.
Finally, we tested the effects of dietary restriction on longevity
of those flies (Partridge et al., 2005) (Figures S7J and S7K). We
found that dietary restriction could extend both the median sur-
vival and themaximum lifespan of all genotypes (Figures S7J and
S7K). Interestingly, dietary restricted flies with three copies of the
gene azot showed a further increase inmaximum lifespan of 35%
(Figure S7K). This shows that dietary restriction and elimination
of unfit cells can be combined to maximize lifespan.
In conclusion, eliminating unfit cells is sufficient to increase
longevity, showing that cell selection is critical for a long lifespan
in Drosophila.
DISCUSSION
Here, we show that active elimination of unfit cells is required to
maintain tissue health during development and adulthood. We
Figure 7. Culling Azot-Expressing Cells Is Sufficient and Required for
(A and B) Knockin (KI) schemes (A) azot{KO; Gal4} and (B) azot{KO;hid}.
(C–F)Wings from 10- to 13-day-old flies and quantification of developmental aberr
{KO; Gal4}, (C and E) azot{KO;hid}/azot{KO;hid}, (C and F) azot{KO; Gal4}/azot�
(G–J) Wings from 10- to 13-day-old flies and quantification of developmental abe
10�2 J administered during pupal stage 0.
(K and L) Comparative lifespan studies of genotypes azot{KO;hid}/azot{KO;hid} a
(L) Median and maximum survival of genotypes azot{KO;hid}/azot{KO;hid} and a
(M and N) Lifespan studies at 25�C of the following four genotypes: (1) azot+/+, (2
maximum survival of the four genotypes.
(O) Scheme showing that specifically killing Azot-expressing cells with the gener
and rescue azot mutant phenotypes.
Data are represented as mean ± SEM.
identify a gene (azot), whose expression is confined to subopti-
mal or misspecified but morphologically normal and viable cells.
When tissues become scattered with suboptimal cells, lack of
azot increases morphological malformations and susceptibility
to random mutations and accelerates age-dependent tissue
degeneration. On the contrary, experimental stimulation of azot
function is beneficial for tissue health and extends lifespan.
Therefore, elimination of less fit cells fulfils the criteria for a hall-
mark of aging (Lopez-Otın et al., 2013).
Although cancer and aging can both be considered conse-
quences of cellular damage (Greaves and Maley, 2012; Lopez-
Otın et al., 2013), we did not find evidence for fitness-based
cell selection having a role as a tumor suppressor in Drosophila.
Our results rather support that accumulation of unfit cells affect
organ integrity and that, once organ function falls below a critical
threshold, the individual dies.
We find Azot expression in awide range of ‘‘less fit’’ cells, such
as WT cells challenged by the presence of ‘‘supercompetitors,’’
slow proliferating cells confronted with normal proliferating cells,
cells with mutations in several signaling pathways (i.e., Wingless,
JAK/STAT, Dpp), or photoreceptor neurons forming incomplete
ommatidia. In order to be expressed specifically in ‘‘less fit’’
cells, the transcriptional regulation of azot integrates fitness in-
formation from at least three levels: (1) the cell’s own levels of
FlowerLose isoforms, (2) the levels of Sparc, and (3) the levels of
Lose isoforms in neighboring cells. Therefore, Azot ON/OFF
regulation acts as a cell-fitness checkpoint decidingwhich viable
cells are eliminated. We propose that by implementing a cell-
fitness checkpoint, multicellular communities became more
robust and less sensitive to several mutations that create viable
but potentially harmful cells. Moreover, azot is not involved in
other types of apoptosis, suggesting a dedicated function,
and—given the evolutionary conservation of Azot—pointing to
the existence of central cell selection pathways in multicellular
animals.
EXPERIMENTAL PROCEDURES
In Situ Hybridization
We followed the protocol described in Rhiner et al. (2010). Probe sequences
are available upon request.
Drosophila Genetics
Stocks and crosses were kept at 25�C in standardmedia. The following stocks
were used: ywf;tub > dmyc > Gal4/Cyo;UASgfp; azot::dsRed/TM6B; GMR-
Gal4; azot::dsRed/TM6B; ywf;tub > dmyc > Gal4,azot�/Cyo;UASgfp; ywf;tub
Multicellular Fitness Maintenance
ations of the following five genotypes: (C) azot+/+, (C and D) azot{KO; Gal4}/azot
;UASsickle, and (C) azot{KO; Gal4}/azot+ ;UAShid.
rrations after UV irradiation of the same five genotypes. Irradiation dose of 23
nd azot�/� at 29�C.zot�/�.) azot�/�, (3) azot+/+; azot+, and (4) azot{KO;hid}/azot{KO;hid}. (N) Median and
al proapoptotic factor Hid is sufficient to prevent morphological malformations
Cell 160, 1–16, January 29, 2015 ª2015 The Authors 13
Please cite this article in press as: Merino et al., Elimination of Unfit Cells Maintains Tissue Health and Prolongs Lifespan, Cell (2015), http://dx.doi.org/10.1016/j.cell.2014.12.017
> dmyc > Gal4,azot�/Cyo;UASrfp; ywf;act > y+ > gal4,azot�/Cyo;UASgfp;ywf;act > y+ > Gal4/Cyo;UASRNAiazot; azot{KO;gfp}; azot{KO;hid}; azot{KO;
Gal4}; UASbrk;act > cd2 > Gal4,UASgfp/TM6B; act > y+ > Gal4,UASgfp;azot::
dsRed/TM6B; w;flowerUbi-YFP,flowerLose-A-GFP,flowerLose-B-RFP; ywf;
Ubigfp,MinuteFRT42/Cyo; ywf;FRT42/Cyo; hsFlp,UAS-CD8-GFP;GAL80 FRT
40A/Cyo;tub > G4/TM6B; ywFlp;armZFRT40A/Cyo;MKRS/TM6B; ywf;patched-
Gal4; apterous-Gal4; GMR-Gal4,UASeiger; RNAifweLoselhp (Merino et al.,
2013); ywf;UASmfwe3; ywf;UASsparc/TM6B; UASfweLose-B; UASfweLose-A;
UASfweLose-A,UASfweLose-B; UASp35; UASpuckered; UASdAxin/TM3; UAShid;
UASsickle; UASbax; UASbcl2; UASp53DN; UASRNAifweGD; UASRNAis
parc(16678); UASRNAiazotGD(18166); UASRNAiazotKK(102353); UASRNAis
cribble(Bloomington); UASRNAidlg(Bloomington); UASRNAihopscotch(Bloo-
mington); UASRNAieigerGD; ywf;Cyo/if;UASazot/TM6B; ywf;Cyo/if;UASazot-
HA/TM6B; ywf;Cyo/if;UASazotpm4Q12/TM6B; ywf; UASlacZ; and UASCSK-IR.
Clone Induction
Flip-out clones were generated after heat shock at 37�C between 5 and
15 min. For ubiquitous expression experiments larvae were subjected to
45 min heat shock for all cells to perform flip-out and activate Gal4 under
the control of the actin promoter (act>Gal4).
Azot Reporter: azot::dsRed
The genomic region 3 kb upstream plus the full exon was cloned in pRe-
dStinger vector using XbaI and KpnI restriction sites. Primer sequences are
available upon request.
Overexpressing Constructs
cDNA of azot was fully sequenced and subcloned into the pUASattB vector
using XbaI and KpnI restriction sites. In order to generate N- and C-terminal
HA-tagged forms, the respective cDNAs were amplified with primers contain-
ing the HA sequence and subcloned into KpnI and XbaI sites of pUASattB.
Primer sequences are available upon request.
Azotpm4Q12
Site-directed mutagenesis was used to create point mutations that changed
glutamic acid (E) to glutamine (Q) as shown in Figure S1A. Primer sequences
are available upon request.
Azot Knockout Generation
We followed the genomic engineering strategy described in Huang et al.
(2009); homologous regions are shown in (Figure 1A). Primer sequences are
available upon request.
Knockin Generation
Knockout founder line (Figure 2A) was used for the generation of knockin flies
as described in Huang et al. (2009). cDNA of gfp, hid, andGal4was used for the
generation of azot{KO; gfp}, azot{KO; hid}, and azot{KO; Gal4} knockin lines.
Primer sequences are available upon request.
Immunohistochemistry
Standard immunohistochemistry protocol was used for antibody detection
(Rhiner et al., 2010). For the generation of specific antibodies against Azot,
N-terminal peptide MEDISHEERVLILDTFR was used to immunize rabbits.
Anti-Wingless (ms, 1:50) was from DSHB, anti-caspase-3 (rabbit, 1:100)
was from Cell Signaling Technology, anti-KDEL (rabbit, 1;100) was from Ab-
cam, anti-cytochrome c (mouse, 1:800) was from BD Pharmingen, anti-Hid
(rabbit, 1:50) and anti-HA (rat, 1:250) were from Roche, and anti-bGal
(mouse, 1:200) was from Promega. TUNEL staining performed as described
(Lolo et al., 2012). Confocal images acquired with Leica SP2 and SP5
microscopes.
UV Treatments
Treatments were performed using a UV Stratalinker 2400 machine (UV-B
254 nm). Adult flies were subjected to 2 3 10�2 J dose of UV irradiation
when they were 1–3 days old and analyzed for Azot and Flower isoform
expression 24 hr later. For lifespan experiments after irradiation, a dose of 5
3 10�2 J was used. Larvae and pupae were subjected to 2 3 10�2 J dose of
14 Cell 160, 1–16, January 29, 2015 ª2015 The Authors
UV irradiation, and Azot expression or developmental aberrations were
analyzed.
Longevity Assays
Cohorts of 100 female flies (1–3 days old) of the same genetic background
were collected and kept at 29�C or 25�C on standard food (3.4 l water,
280 g maize, 36 g agar, 120 g yeast, 300 g sugar syrup, 32 g potassium, 6 g
methyl, 20 ml propionic acid). Surviving flies were counted every 2 days (He
and Jasper, 2014).
Dietary Restriction Assays
Cohorts of 100 female flies (1–3 days old) were collected and kept at 29�C on
water-diluted standard food (one to one). Surviving flies were counted every
2 days.
Brain Studies
Brain Integrity
Adult flies kept at 29�C of the selected time points and genotypes were
analyzed for the appearance of neurodegenerative vacuoles over time in the
central brain as previously described (Kretzschmar et al., 1997).
Azot Expression
Adult flies azot{KO; gfp}/azot{KO; gfp} were kept at 29�C. The selected time
points were analyzed for the number of GFP-positive cells in the central brain.
Statistical Analysis
For the rescue assay using azot KO in supercompetition (Figure 2E), rescue
assay in supercompetition with azot RNAi and overexpression of the protein
(Figures S2J–S2P), the rescue assay of clones with apicobasal defects and
the clones with deficient Wg signaling (Figures S6N–S6R), and brain integrity
studies over time (Figures 6A–6P), the data were analyzed with the K indepen-
dent samples test. The post hoc DMS test was then used to detect significant
differences.
For the caspase-positive cells in azot+/+ and azot�/�background (Figure 2D),
the rescue assay in overexpression of Flowerlose isoforms (Figures 2R–2T; Fig-
ure S2T), and azot overexpression in clones (Figures S6T–S6Y), all data were
analyzed with two independent samples test (Mann-Whitney U test). Levene
test was used to analyze number of cleaved caspase-3-positive cells, rescue
assay of FlowerLose isoforms, and number of azot-overexpressing clones.
For the quantification of the number of developmental aberrations before
and after irradiation treatment in azot+/+, azot+/�, and azot�/�, and azot�/�;azot+/+ background (Figures 3A–3E, 3L–3P, 7C–7J, and S7A–S7H), data
were analyzed with the K independent samples test (Levene), and Levy-Tukey
was used for post hoc analyses.
In the rescue assay in supercompetition using RNAi (24 hr ACI) (Figures
S2C–S2I), the data were analyzed with ANOVA test.
In the quantification of eye size in apoptosis assay (Figures S3H–S3N), the
data were analyzed with ANOVA. Bonferroni post hoc test was used to detect
significant differences among genotypes.
For the functional assays of azot in retinas (Figures 2G–2L), azot dose sen-
sitive (Figures 2U–2W), rescue assay in overexpression of mouse flower3 iso-
form (Figure S2U), and rescue assay of clones with apicobasal defects, and
clones with deficient Wg signaling by azot RNAi (Figures S6D–S6M), all data
were analyzed with Student’s t test.
For the lifespan analysis (Figures 6X, 7K, 7M, and S7J), the log-rank test was
used to study significant differences among the genotypes.
SUPPLEMENTAL INFORMATION
Supplemental Information includes seven figures and can be found with this
article online at http://dx.doi.org/10.1016/j.cell.2014.12.017.
ACKNOWLEDGMENTS
We thank H. Bellen, H. Stocker, M. Vidal, H. Ryoo, A. Bergmann, B. Mignotte,
M. Portela, VDRC, and Hybridoma bank and Bloomington for flies and anti-
bodies; CONSOLIDER consortium for injecting flies; and members of our lab-
oratory for comments on the manuscript. Work in our laboratory is funded by
Please cite this article in press as: Merino et al., Elimination of Unfit Cells Maintains Tissue Health and Prolongs Lifespan, Cell (2015), http://dx.doi.org/10.1016/j.cell.2014.12.017
the European Research Council, Swiss National Science Foundation, Josef
Steiner Cancer Research Foundation, the bilateral Japanese-Swiss ST, and
Swiss Cancer League.
Received: June 20, 2014
Revised: September 26, 2014
Accepted: November 24, 2014
Published: January 15, 2015
REFERENCES
Baillon, L., and Basler, K. (2014). Reflections on cell competition. Semin. Cell
Dev. Biol. 32, 137–144.
Brodsky, M.H., Nordstrom,W., Tsang, G., Kwan, E., Rubin, G.M., and Abrams,
J.M. (2000). Drosophila p53 binds a damage response element at the reaper
locus. Cell 101, 103–113.
de Beco, S., Ziosi, M., and Johnston, L.A. (2012). New frontiers in cell compe-
tition. Developmental dynamics 241, 831–841.
de la Cova, C., Abril, M., Bellosta, P., Gallant, P., and Johnston, L.A. (2004).
Drosophila myc regulates organ size by inducing cell competition. Cell 117,
107–116.
Fernandez-Hernandez, I., Rhiner, C., and Moreno, E. (2013). Adult neurogen-
esis in Drosophila. Cell Rep. 3, 1857–1865.
Fuchs, Y., and Steller, H. (2011). Programmed cell death in animal develop-
ment and disease. Cell 147, 742–758.
Gaumer, S., Guenal, I., Brun, S., Theodore, L., and Mignotte, B. (2000). Bcl-2
and Bax mammalian regulators of apoptosis are functional in Drosophila. Cell
Death Differ. 7, 804–814.
Greaves, M., and Maley, C.C. (2012). Clonal evolution in cancer. Nature 481,
306–313.
He, Y., and Jasper, H. (2014). Studying aging in Drosophila. Methods 68,
129–133.
Hogan, C., Kajita, M., Lawrenson, K., and Fujita, Y. (2011). Interactions
between normal and transformed epithelial cells: their contributions to tu-
mourigenesis. Int. J. Biochem. Cell Biol. 43, 496–503.
Huang, J., Zhou, W., Dong, W., Watson, A.M., and Hong, Y. (2009). From the
cover: directed, efficient, and versatile modifications of the Drosophila
genome by genomic engineering. Proc. Natl. Acad. Sci. USA 106, 8284–8289.
Igaki, T., Pastor-Pareja, J.C., Aonuma, H.,Miura, M., and Xu, T. (2009). Intrinsic
tumor suppression and epithelial maintenance by endocytic activation of
Eiger/TNF signaling in Drosophila. Dev. Cell 16, 458–465.
Jacobs, K.B., Yeager, M., Zhou, W., Wacholder, S., Wang, Z., Rodriguez-San-
tiago, B., Hutchinson, A., Deng, X., Liu, C., Horner, M.J., et al. (2012). Detect-
able clonal mosaicism and its relationship to aging and cancer. Nat. Genet. 44,
651–658.
Kennedy, S.R., Loeb, L.A., and Herr, A.J. (2012). Somatic mutations in aging,
cancer and neurodegeneration. Mech. Ageing Dev. 133, 118–126.
Kretzschmar, D., Hasan, G., Sharma, S., Heisenberg, M., and Benzer, S.
(1997). The swiss cheesemutant causes glial hyperwrapping and brain degen-
eration in Drosophila. The Journal of neuroscience 17, 7425–7432.
Laurie, C.C., Laurie, C.A., Rice, K., Doheny, K.F., Zelnick, L.R., McHugh, C.P.,
Ling, H., Hetrick, K.N., Pugh, E.W., Amos, C., et al. (2012). Detectable clonal
mosaicism from birth to old age and its relationship to cancer. Nat. Genet.
44, 642–650.
Lee, T., and Luo, L. (2001). Mosaic analysis with a repressible cell marker
(MARCM) for Drosophila neural development. Trends Neurosci. 24, 251–254.
Lemaitre, B., and Miguel-Aliaga, I. (2013). The digestive tract of Drosophila
melanogaster. Annu. Rev. Genet. 47, 377–404.
Levi-Montalcini, R. (1987). The nerve growth factor 35 years later. Science 237,
1154–1162.
Liu, N., Landreh, M., Cao, K., Abe,M., Hendriks, G.J., Kennerdell, J.R., Zhu, Y.,
Wang, L.S., and Bonini, N.M. (2012). The microRNA miR-34 modulates ageing
and neurodegeneration in Drosophila. Nature 482, 519–523.
Lolo, F.N., Casas-Tinto, S., and Moreno, E. (2012). Cell competition time line:
winners kill losers, which are extruded and engulfed by hemocytes. Cell Rep.
2, 526–539.
Lopez-Otın, C., Blasco, M.A., Partridge, L., Serrano, M., and Kroemer, G.
(2013). The hallmarks of aging. Cell 153, 1194–1217.
Martın-Blanco, E., Gampel, A., Ring, J., Virdee, K., Kirov, N., Tolkovsky, A.M.,
andMartinez-Arias, A. (1998). puckered encodes a phosphatase thatmediates
a feedback loop regulating JNK activity during dorsal closure in Drosophila.
Genes Dev. 12, 557–570.
Maune, J.F., Klee, C.B., and Beckingham, K. (1992). Ca2+ binding and confor-
mational change in two series of point mutations to the individual Ca(2+)-bind-
ing sites of calmodulin. J. Biol. Chem. 267, 5286–5295.
Merino, M.M., Rhiner, C., Portela, M., and Moreno, E. (2013). ). ‘‘Fitness finger-
prints’’ mediate physiological culling of unwanted neurons in Drosophila. Curr.
Biol. 23, 1300–1309.
Morata, G., and Ripoll, P. (1975). Minutes: mutants of Drosophila autono-
mously affecting cell division rate. Dev. Biol. 42, 211–221.
Moreno, E. (2014). Cancer: Darwinian tumour suppression. Nature 509,
435–436.
Moreno, E., and Basler, K. (2004). dMyc transforms cells into super-competi-
tors. Cell 117, 117–129.
Moreno, E., and Rhiner, C. (2014). Darwin’s multicellularity: from neurotrophic
theories and cell competition to fitness fingerprints. Curr. Opin. Cell Biol. 31C,
16–22.
Moreno, E., Basler, K., and Morata, G. (2002). Cells compete for decapenta-
plegic survival factor to prevent apoptosis in Drosophila wing development.
Nature 416, 755–759.
Moskalev, A.A., Shaposhnikov, M.V., Plyusnina, E.N., Zhavoronkov, A., Bu-
dovsky, A., Yanai, H., and Fraifeld, V.E. (2013). The role of DNA damage and
repair in aging through the prism of Koch-like criteria. Ageing Res. Rev. 12,
661–684.
Parisi, F., Stefanatos, R.K., Strathdee, K., Yu, Y., and Vidal, M. (2014). Trans-
formed epithelia trigger non-tissue-autonomous tumor suppressor response
by adipocytes via activation of Toll and Eiger/TNF signaling. Cell Rep. 6,
855–867.
Partridge, L., Piper, M.D., andMair, W. (2005). Dietary restriction in Drosophila.
Mech. Ageing Dev. 126, 938–950.
Petrova, E., Lopez-Gay, J.M., Rhiner, C., and Moreno, E. (2012). Flower-defi-
cient mice have reduced susceptibility to skin papilloma formation. Dis. Model.
Mech. 5, 553–561.
Portela, M., Casas-Tinto, S., Rhiner, C., Lopez-Gay, J.M., Domınguez, O., Sol-
dini, D., and Moreno, E. (2010). Drosophila SPARC is a self-protective signal
expressed by loser cells during cell competition. Dev. Cell 19, 562–573.
Raff, M.C. (1992). Social controls on cell survival and cell death. Nature 356,
397–400.
Reeves, H.M. (2006). Sahagun’s ‘‘Florentine codex,’’ a little known Aztecan
natural history of the Valley of Mexico. Arch. Nat. Hist. 33, 302–321.
Rhiner, C., Lopez-Gay, J.M., Soldini, D., Casas-Tinto, S., Martın, F.A., Lombar-
dıa, L., and Moreno, E. (2010). Flower forms an extracellular code that reveals
the fitness of a cell to its neighbors in Drosophila. Dev. Cell 18, 985–998.
Rodrigues, A.B., Zoranovic, T., Ayala-Camargo, A., Grewal, S., Reyes-Robles,
T., Krasny, M., Wu, D.C., Johnston, L.A., and Bach, E.A. (2012). Activated
STAT regulates growth and induces competitive interactions independently
of Myc, Yorkie, Wingless and ribosome biogenesis. Development 139,
4051–4061.
Simi, A., and Ibanez, C.F. (2010). Assembly and activation of neurotrophic fac-
tor receptor complexes. Dev. Neurobiol. 70, 323–331.
Simpson, P. (1979). Parameters of cell competition in the compartments of the
wing disc of Drosophila. Dev. Biol. 69, 182–193.
Srinivasula, S.M., Datta, P., Kobayashi, M., Wu, J.W., Fujioka, M., Hegde, R.,
Zhang, Z., Mukattash, R., Fernandes-Alnemri, T., Shi, Y., et al. (2002). ). sickle,
Cell 160, 1–16, January 29, 2015 ª2015 The Authors 15
Please cite this article in press as: Merino et al., Elimination of Unfit Cells Maintains Tissue Health and Prolongs Lifespan, Cell (2015), http://dx.doi.org/10.1016/j.cell.2014.12.017
a novel Drosophila death gene in the reaper/hid/grim region, encodes an IAP-
inhibitory protein. Curr. Biol. 12, 125–130.
Suzanne, M., Petzoldt, A.G., Speder, P., Coutelis, J.B., Steller, H., and Noselli,
S. (2010). ). Coupling of apoptosis and L/R patterning controls stepwise organ
looping. Curr. Biol. 20, 1773–1778.
Szilard, L. (1959). On the Nature of the Aging Process. Proc. Natl. Acad. Sci.
USA 45, 30–45.
Tamori, Y., and Deng, W.M. (2011). Cell competition and its implications for
development and cancer. Journal of genetics and genomics 38, 483–495.
Tamori, Y., Bialucha, C.U., Tian, A.G., Kajita, M., Huang, Y.C., Norman, M.,
Harrison, N., Poulton, J., Ivanovitch, K., Disch, L., et al. (2010). Involvement
of Lgl and Mahjong/VprBP in cell competition. PLoS Biol. 8, e1000422.
16 Cell 160, 1–16, January 29, 2015 ª2015 The Authors
Vanneste, E., Voet, T., Le Caignec, C., Ampe, M., Konings, P., Melotte, C., De-
brock, S., Amyere, M., Vikkula, M., Schuit, F., et al. (2009). Chromosome insta-
bility is common in human cleavage-stage embryos. Nat. Med. 15, 577–583.
Vidal, M., Larson, D.E., and Cagan, R.L. (2006). Csk-deficient boundary cells
are eliminated from normal Drosophila epithelia by exclusion, migration, and
apoptosis. Dev. Cell 10, 33–44.
Vincent, J.P., Kolahgar, G., Gagliardi, M., and Piddini, E. (2011). Steep differ-
ences in wingless signaling trigger Myc-independent competitive cell interac-
tions. Dev. Cell 21, 366–374.
Willert, K., Logan, C.Y., Arora, A., Fish, M., and Nusse, R. (1999). A Drosophila
Axin homolog, Daxin, inhibits Wnt signaling. Development 126, 4165–4173.
Wolff, T., and Ready, D.F. (1991). Cell death in normal and rough eye mutants
of Drosophila. Development 113, 825–839.

Supplemental Information
Minute+/-
RNAi
hops
cotc
h
αAzot
L
F G
UAS
daxi
n
act>cd2>Gal4,UASgfp
RRRRRRRRRRRRRRRRRRRRRRRRRRRRRRRRRRRRRRRRRRRRRRRNNNNNNNNNNNNNNNNNNNNNNNNNNAAAAAAAAAAAAAAAAAAAAAAAAAAAAAAAAAAA
NNNNNNNNNNNNNNNNiiiiiiiiiiiiiiiiiiiiiiiiiiihhhhhhhhhhhhhhhhhhhhhhhhhhhhhh
ooooooooooooooooooooooooooooooooooooooooopppppppppppppppppppppppppppppppppppppppppppppppppppssssssssssssssssssssssssssssssssssssssssssssscccccccccccccccccccccccccccccccccc
ototototototototototottotottotototottotttototttototttottttttttototoooooooooooooooooocccccccccccccccccccccccccccccccccccccccccccccccccccccccchhhhhhhhhhhhhhhhhhhhhhhhhhhhhhhhhhhhhh
I
J
UAS
daxi
n
act>y>Gal4,UASgfp act>Gal4,UASgfp
act>Gal4,UASgfp LLLLK
UAS
lacZ
L
UAS
hid
UAS
eige
r
M
O P ptc>Gal4,UASgfp
UAS
CSK-
IR
Q
act>y>Gal4,UASgfp act>y>Gal4,UASgfp act>y>Gal4,UASgfp
UAS
daxi
n
UAS
CSK-
IR
40µm
40µm 40µm GFP
40µm
40µm
40µm 40µm 40µm
40µm
an�sense azot
B
GFP
0h 12h 24h 48hazot 0 0.15 -0.09 0.65fwe 0 0.62 0.76 0.5sparc 0 0.88 0.59 0.64
-0.20
0.20.40.60.8
1
Chan
ge o
f exp
ress
ion
(x-fo
ld) C
B
ptc>Gal4,UASgfp
A
AZO
T FA
MIL
Y PR
OTE
INS
MergeGFP
MergeGFP
MergeGFP
Azot::dsRed
Azot::dsRed
Azot::dsRedGFP
Azot::dsRedGFP
Azot::dsRedGFP
Azot::dsRedGFP
Supercompe��on
act>y>Gal4,UASgfp
Azot::dsRedGFP
UAS
bax
40µm
H
N
38hr APF38hr APF36hr APF36hr APF
DAPIMerge
DAPIMergeAzot::dsRed Azot::dsRed
R S T U
10µm 10µm 10µm 10µm
hsf;act>Gal4; UASazotHA
D E
αHA MergeDAPI
5µm
40µm 20µm
RNAi
scrib
ble
act>y>Gal4,UASgfp
Azot::dsRedGFP
E Q AZOTPM4Q12
(legend on next page)
Cell 160, 1–16, January 29, 2015 ª2015 The Authors S1

Figure S1. Azot Is Conserved throughout Evolution and Is Expressed in a Subset of Loser Cells in Cell Competition Scenarios, Related to
Figure 1
(A) Alignment of Azot showing conservation in multicellular animals including humans. Point mutations highlighted for the generation of the pm4Q12 Azot mutant.
(B) Expression profile of different genes induced upon Supercompetition based on microarray data published in Rhiner et al., 2010.
(C) In situ analysis of azot RNA in dmyc-induced supercompetition, azot RNA probe (red), WT clones (green). Arrows show cells expressing azot RNA.
(D and E) HA-tagged Azot protein overexpressed in wing imaginal disc cells with act-Gal4 driver is mainly cytoplasmic, anti-HA in red (D) and merged with DAPI
(E).
(F–U) Expression analysis of Azot. Flip-out overexpressing clones of UASdaxin (Azot::dsRed, red) (F) and RNAihopscotch (Azot::dsRed, red) (G). (H) Minute
heterozygous clones anti-Azot antibody (red). (I and J) Wing imaginal discs ubiquitously expressing Daxin and GFP (act < Gal4; UASdaxin; UASgfp), (I)
Azot::dsRed and merged with GFP (J). (K–O) Flip-out clones marked with GFP and overexpressing: (K) UASlacZ, (L) UAShid, (M) UASeiger, (N) UASbax, and (O)
RNAiscribble. Azot expression revealed with Azot::dsRed from (K)–(O). (P and Q) patched-Gal4; UASgfp; UASCSK-IR, (red, Azot::dsRed). (R–U) Images of pupal
retinas at different developmental time points. Expression analysis of Azot (red), using Azot::dsRed, in peripheral photoreceptors at different time points: 36hr
after pupa formation (APF) (R and S) and 38hr APF (T and U).
S2 Cell 160, 1–16, January 29, 2015 ª2015 The Authors
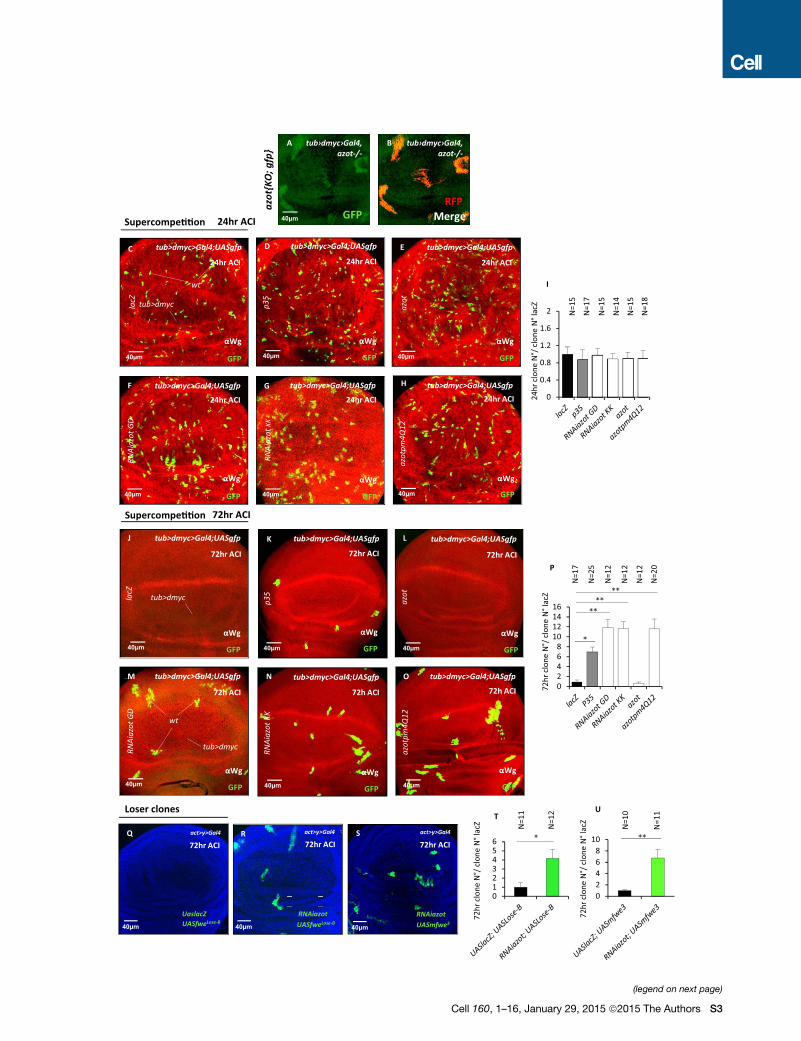
M tub>dmyc>Gal4;UASgfp
lacZ
J tub>dmyc>Gal4;UASgfp
αWg
GFP40µm
72hr ACI
p35
K tub>dmyc>Gal4;UASgfp
αWg
GFP40µm
72hr ACI
azot
L tub>dmyc>Gal4;UASgfp
αWg
GFP40µm
72hr ACI
MMMMMMMMM ttttttttttttububububububbubububuubuububuu >>>>>>>>>>>dddddddddddddddddmmmmmmmmddddddddddddddd yyyyyyyyyycccccccccccc>>>>>>>>>>>>>>GGGGGGGGGGGGGGGGGaaaaaaaaaaaaaaaaaaaallllllllllll444444444llll ;;;;;;;;;44444 UUUUUUUUUASASASASASASAAAAUUUUUUUUUU ggggggggffffffggggggg pppppffffffffff
RNAi
azot
GD
αWg
GFP40µm
RNAi
azot
KK
tub>dmyc>Gal4;UASgfp
αWg
GFP40µm
72h ACI
azot
pm4Q
12
O tub>dmyc>Gal4;UASgfp
αWg
GFP40µm
72h ACI
M N
P
0123456 *
N=1
1
N=1
2
R
02468
10 **
N=1
1
N=1
0U
0
0.4
0.8
1.2
1.6
2 N=1
5
N=1
5
N=1
7
N=1
5
N=1
8
N=1
4
24hr
clon
e N
°/ cl
one
N°l
acZ
G
40µm
p35
D
αWg
tub>dmyc>Gal4;UASgfp
GFP40µm
24hr ACI
GGGGGGGGG
44440µ40µ040µ40µ440 mmmmmm
RNAi
azot
GD
F
αWg
tub>dmyc>Gal4;UASgfp
GFP40µm
24hr ACI
RNAi
azot
KK
G
αWg
tub>dmyc>Gal4;UASgfp
GFP40µm
24hr ACIaz
ot
E
αWg
tub>dmyc>Gal4;UASgfp
GFP40µm
24hr ACI
H
αWg
tub>dmyc>Gal4;UASgfp
GFP40µm
24hr ACI
lacZ
C
αWg
tub>dmyc>Gal4;UASgfp
GFP40µm
24hr ACI
S
RNAiazot
act>y>Gal4
UASmfwe340µm
72hr ACI
NNNNNNNNNNNNNNNNN==============1
111111111111111111111111111
NNNNNNNNNNNNNNNNNNNN==================1
22212121212121212222111111111
RRRRRRRRRRRRRRRRR
RNAiazotUASfweLose-B
R act>y>Gal4
40µm
72hr ACIact>y>Gal4Q
UASfweLose-B40µm
72hr ACI
UaslacZ
02468
10121416
*
**
****
72hr
clon
e N
°/ cl
one
N°l
acZ
N=1
7
N=1
2
N=2
5
N=1
2
N=2
0
N=1
2
I
Supercompe��on 24hr ACI
Supercompe��on 72hr ACI
Loser clones
azot
pm4Q
12
72hr
clon
e N
°/ cl
one
N°l
acZ
72hr
clon
e N
°/ cl
one
N°l
acZT
N=1
1
N=1
2
tub>dmyc>Gal4;UASgfp
wt
tub>dmyc
wt
tub>dmyc
tub>dmyc
72h ACI
A B
azot
{KO
; gfp
}
tub›dmyc›Gal4, azot-/-
GFPRFP
Merge40µm
tub›dmyc›Gal4, azot-/-
(legend on next page)
Cell 160, 1–16, January 29, 2015 ª2015 The Authors S3

Figure S2. Azot Downregulation in Loser Cells during Cell Competition, Related to Figure 2
(A and B) tub>dmyc background (black) and WT cells marked with RFP (red) in azot{KO; gfp} homozygous background 72hr ACI.
(C–I) Images of wing imaginal discs 24hr ACI in dmyc-induced supercompetition of the following genotypes (C) UASlacZ, (D) UASp35, (E) UASazot, (F) RNAiazot
GD, (G) RNAiazot KK, (H) UASazotpm4Q12 (red, anti-Wingless), and quantification of number of clones at 24hr ACI (I).
(J–P) Quantification and images of WT clones in supercompetition of the following genotypes 72hr after ACI (anti-Wingless, red): (J) UASlacZ, (K) UASp35 (p <
0.05), (L) UASazot, (M) RNAiazot GD (p < 0.01), (N) RNAiazot KK (p < 0.01), and (O) UASazotpm4Q12 (p < 0.01) (red, anti-Wingless).
(Q–U) Flower Lose overexpressing clones (Q and T) UASfweLose-B; UASlacZ, (R and T) UASfweLose-B; RNAiazot (p < 0.05), (S and U) UASmfwe3; RNAiazot (p <
0.01). RNAiazot GD line was used. Data are represented as mean ± SEM.
S4 Cell 160, 1–16, January 29, 2015 ª2015 The Authors

UASlacZ
Gmr>Gal4
UASp35 RNAieiger
GGGGGGGGGGGGmmmmmmmmrrrrrrr>>>>>>>>>>>>>rrr GGGGGGGGGGGGGGGGGGGGGGGGGGGaaaaaaaaaaaaaaaaaaallllllllllllllllll44444444444444444444444444lllllllllll
RNAiazot GD UUUUUUUUUUUUUAAAAAAAAAAAAAAAAUUUUUUUUUUU SSSSSSSSSSSSSSSSSSSSSSSSSSSSSSSSSSpppppppppppppppppppppppSSSSSSS 33333333333333333333333333333333333333333333333355555555555555555555555555555555555555555555555555RNAiazot KK RRRRRRRRRRRRRRRRRRRRRRRRRRNNNNNNNNNNNNNNNNNNNNNNNNNNNNAAAAAAAAAAAAAAAAAAAAAAAAAAAAAAANNNNNNNNNNNNNNNNNNNN iiiiiiiiiiiiiiiiiiiiiiiiiiiiiiiiiiiiieeeeeeeeeeeeeeeeeeeeeeeeeeeeeeeeeeeeeeeeeeeeeeeeeeeeeeeeeeeeeeeeeeeeeiiiiiiiiiiiiiiiiiiiii iiiiiiiiiiiiiiiiiiiiiggggggggggggggggggggggggggggggggggggggggggggggiiiiiiiiiii eeeeeeeeeeeeeeeeeeeeeeeeeeerrrrrrrrrrrrrrrrrrrrrrrrrrrrrrrrrrrrrrrrrrrrrrrrrrrrrrrrrUASazotpm4Q120
500000
1000000
1500000
2000000
2500000
3000000
lacZ
P35
RNAi
eige
rRN
Aiaz
ot G
DRN
Aiaz
ot K
Kaz
otpm
4Q12
Eye area (pixels)
GM
R>G
al4,
UASe
iger
*
**
en>G
al4 UASlacZ UASp35 RNAiazot GD RNAiazot KK
TUNELElav
Genitalia
Analia
T V
N
TUNELElav
RNAiazot
N=1
5
H I J
K L M
O P Q R
TUNEL
RNAiazotU
TUNEL
UASlacZS
GM
R>G
al4
UASlacZ UASp35 RNAieiger
Genitalia GenitaliaGenitalia
AnaliaAnalia Analia
10µm 10µm 10µm 10µm
25°C3 days Egg-Laying L3
6 days
dissec�onUV treatment
40µm
40µm
MergeDAPIDAPI
A
E
F GC D
B
GFP
azot promoter 3 Kb :: dsRedazot 5᾿arm 3᾿armloxP 3᾿armgfpa�
R
loxP
azot::dsRed
azot{KO; gfp}
dsRed
azot
::dsR
ed
azot
{KO
; gfp
}40µm
(legend on next page)
Cell 160, 1–16, January 29, 2015 ª2015 The Authors S5

Figure S3. Azot Is Required to Eliminate a Subset of Cells after Irradiation but Is Not a General Proapoptotic Factor, Related to Figure 3
(A–G) Azot positive cells detected in wing imaginal discs after UV-treatment (2x10�2J, 3 days after egg laying as shown in A). (B–D) Azot::dsRed functional
reporter (B). Expression in the wing imaginal disc is shown in red (C) andmerge with DAPI (blue, D). (E–G) azot{KO; gfp} reporter in homozygosis (E). Expression in
the wing imaginal disc is shown in green (F) and merge with DAPI (blue, G).
(H–N) Images ofDrosophila eyes and quantification of eye area (pixels), inducing apoptosis withGMR-Gal4, UASeiger in the following genotypes: (H)UASlacZ, (I)
UASp35, (J) RNAieiger, (K) RNAiazot GD, (L) RNAiazot KK, (M) UASazotpm4Q12 and quantification, (N) (* < 0.05 and ** < 0.01).
(O–R) Genitalia rotation assay, using engrailed>Gal4 driver with the following genotypes: (O) UASlacZ, (P) UASp35, (Q) RNAiazot GD, (R) RNAiazot KK.
(S–V) images of Drosophila retina 24hr APF stained for TUNEL (magenta, S and U) and pan-neuronal marker Elav (green, T and V) of the following genotypes: (S
and T) GMR-Gal4; UASlacZ and (U and V) GMR-Gal4; RNAiazot.
Data are represented as mean ± SEM.
S6 Cell 160, 1–16, January 29, 2015 ª2015 The Authors

020406080
100120
N=1
2
N=1
5
N=8
N=1
1
H
012345
N=1
1
N=1
3
44hr APF
44hr APF44hr APF
44hr APF
Photoreceptor FweLose-B
ac�vates AzotPhotoreceptor FweLose-B
dies
M N O
GMR-Gal4
10µm
I J
act>y>G4 UASgfp; UASfweLose-B
UAS
daxi
n
Photoreceptor FweUbiFweLose-A
+ Photoreceptor FweLose-B
GFP
P
UAS
spar
c
K L
10µm
10µm
Azot::dsRed
Azot::dsRed
% A
zot-
posi�
ve c
ells
/re
�na
field
DAPIMerge
DAPIMerge
Azot::dsRedDAPI
MergeGFP
Neuronal culling
MergeGFP
48hr ACI48hr ACI
40μm Azot::dsRed
UAS
puc wt
tub>dmyc
A B
Supercompe��on
UAS
bcl2
UAS
p53D
N
Azot::dsRedAzot::dsRed
24hr A�er irrad. 24hr A�er irrad. 24hr A�er irrad. 24hr A�er irrad.
DAPIMerge
DAPIMerge
D F G
UV treatment
E
Azot
–pos
i�ve
cel
ls/Az
ot-p
osi�
ve c
ells
wild
type N=1
4
N=9
N=1
0
C
hsflp; act>Gal4
44hr APF 44hr APF 44hr APF
40µm 40µm
(legend on next page)
Cell 160, 1–16, January 29, 2015 ª2015 The Authors S7

Figure S4. Regulation and Function of Azot, Related to Figure 4
(A and B) Epistasis analysis UASpuc during dmyc induced supercompetition Azot::dsRed is shown in red (A) and merges with GFP in (B).
(C–G) Azot::dsRed expression after UV-irradiation (red) is not suppressed when UASbcl2 and UASp53DN are overexpressed ubiquitously with actin-Gal4. DAPI
in blue.
(H–O) Quantification and epistasis analysis of azot in the retina. (H) Graph showing the probability of Azot expression in each genotype.
(I–L) Images of Drosophila retinas 44hr APF of the following genotypes: (I and J) GMR-Gal4; UASdaxin and (K and L) GMR-Gal4; UASsparc. Azot expression is
shown in red (I and K) and merges with DAPI are shown in (J and L).
(M–O) hsflp; act > y+STOP > Gal4, UASgfp;UASfweLose-B. GFP clones (green, M), Azot::dsRed (red, N) and merge with DAPI nuclear marker in (O).
(P) Scheme representing Azot-mediated elimination of peripheral photoreceptors.
Data are represented as mean ± SEM.
S8 Cell 160, 1–16, January 29, 2015 ª2015 The Authors
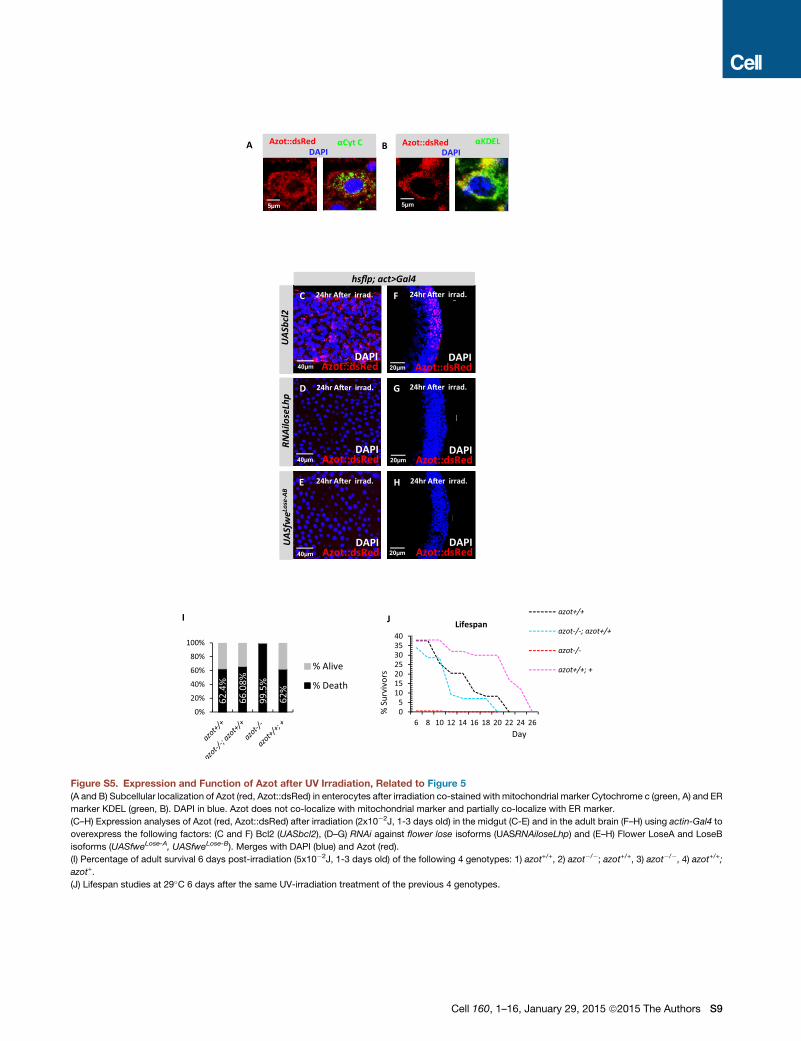
0%
20%
40%
60%
80%
100%
% Alive
% Death
62.4
%
66.0
8%
99.5
%
62%
05
10152025303540
6 8 10 12 14 16 18 20 22 24 26
azot+/+
azot-/-; azot+/+
azot-/-
azot+/+; +
I J
%Su
rviv
ors
Day
Lifespan
αCyt CDAPI
αKDELAzot::dsRedDAPI
Azot::dsRed
Azot::dsRedDAPI
24hr A�er irrad.
24hr A�er irrad.
24hr A�er irrad.
UAS
bcl2
A B
᾿
F
MergeDAPI
C
G
H
᾿
G
HHHHHHHHHHHHHHHHHHHHH
F24hr A�er irrad.
24hr A�er irrad.
24hr A�er irrad.
D
E
F
G
H
UAS
fweLo
se-A
BRN
Ailo
seLh
p
40µm
40µm
40µm
Azot::dsRedDAPI
Azot::dsRedDAPI
Azot::dsRedDAPI
Azot::dsRedDAPI
Azot::dsRedDAPI
20µm
20µm
20µm
5µm 5µm
hsflp; act>Gal4
Figure S5. Expression and Function of Azot after UV Irradiation, Related to Figure 5
(A and B) Subcellular localization of Azot (red, Azot::dsRed) in enterocytes after irradiation co-stained with mitochondrial marker Cytochrome c (green, A) and ER
marker KDEL (green, B). DAPI in blue. Azot does not co-localize with mitochondrial marker and partially co-localize with ER marker.
(C–H) Expression analyses of Azot (red, Azot::dsRed) after irradiation (2x10�2J, 1-3 days old) in the midgut (C-E) and in the adult brain (F–H) using actin-Gal4 to
overexpress the following factors: (C and F) Bcl2 (UASbcl2), (D–G) RNAi against flower lose isoforms (UASRNAiloseLhp) and (E–H) Flower LoseA and LoseB
isoforms (UASfweLose-A, UASfweLose-B). Merges with DAPI (blue) and Azot (red).
(I) Percentage of adult survival 6 days post-irradiation (5x10�2J, 1-3 days old) of the following 4 genotypes: 1) azot+/+, 2) azot�/�; azot+/+, 3) azot�/�, 4) azot+/+;azot+.
(J) Lifespan studies at 29�C 6 days after the same UV-irradiation treatment of the previous 4 genotypes.
Cell 160, 1–16, January 29, 2015 ª2015 The Authors S9
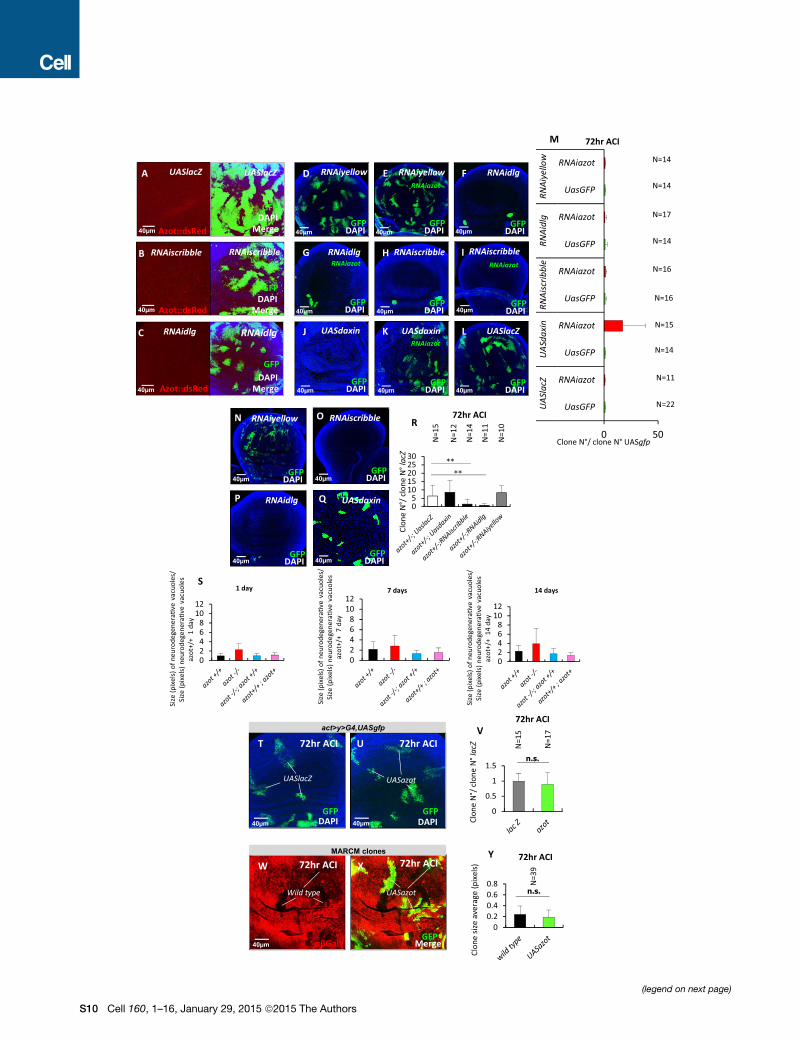
Azot::dsRed
Azot::dsRed
Azot::dsRed
GFPDAPI
GFPDAPI
GFPDAPI
GFPDAPI
GFPDAPI
GFPDAPI
GFPDAPI
GFPDAPI
GFPDAPI
GFPDAPI
GFPDAPIGFP
DAPI
GFPDAPI
0 50
UasGFP
RNAiazot
UasGFP
RNAiazot
UasGFP
RNAiazot
UasGFP
RNAiazot
UasGFP
RNAiazot
UAS
lacZ
UAS
daxi
nRN
Aisc
ribbl
eRN
Aidl
gRN
Aiye
llow
72hr ACI
00.20.40.60.8 N
=39
0
0.5
1
1.5n.s.
N=1
7
N=1
5
T U
UASlacZ UASazot
72hr ACIact>y>G4,UASgfp
72hr ACI
40µm 40µm Clon
e N
°/ cl
one
N°l
acZ
GFPDAPI
GFPDAPI
72hr ACI
MARCM clones
72hr ACI 72hr ACI
UASazotWild type
Clon
e siz
e av
erag
e (p
ixel
s)
GFPαβGal Merge
W XY
02468
1012
02468
1012
02468
1012
Size
(pix
els)
of n
euro
dege
nera
�ve
vacu
oles
/ Si
ze (p
ixel
s) n
euro
dege
nera
�ve
vacu
oles
az
ot+/
+ 1
day
Size
(pix
els)
of n
euro
dege
nera
�ve
vacu
oles
/ Si
ze (p
ixel
s) n
euro
dege
nera
�ve
vacu
oles
az
ot+/
+ 7
day
Size
(pix
els)
of n
euro
dege
nera
�ve
vacu
oles
/ Si
ze (p
ixel
s) n
euro
dege
nera
�ve
vacu
oles
az
ot+/
+ 1
4 da
y
S1 day 7 days 14 days
RNAiazot
RNAiazot
RNAiyellow RNAidlg
RNAiazotRNAiscribble
RNAiazot
RNAidlg RNAiscribble
᾿UASlacZ
RNAiscribble
RNAidlg
UASlacZ
RNAiscribble
RNAidlg
A RNAiyellow
UASdaxin UASdaxin UASlacZ
B
C
D E F
G H I
J K L
Clone N°/ clone N° UASgfp
MergeDAPI
MergeDAPI
MergeDAPI
GFP
GFP
GFP
72hr ACI
N=14
N=14
N=17
N=14
N=16
N=16
N=15
N=14
N=11
N=22
M
RNAidlg05
1015202530
**
**N
=12
N=1
5
N=1
4
N=1
1
N=1
0
Clon
e N
°/ cl
one
N°l
acZ
RNAiscribbleRNAiyellow
UASdaxin
N O
P Q
U
72hr ACIR
V
n.s.
40µm
40µm
40µm
40µm
40µm
40µm
40µm
40µm
40µm
40µm
40µm
40µm
40µm
40µm
40µm
40µm
40µm
(legend on next page)
S10 Cell 160, 1–16, January 29, 2015 ª2015 The Authors
Figure S6. Expression and Functional Analysis of azot in Cell Cloneswith Defects in Apicobasal Polarity, Vacuole Size, andClone Analysis for
azot Overexpression, Related to Figure 6
All images are wing imaginal discs dissected in third instar larvae.
(A–C) Expression analysis of Azot (48hr ACI) of the following genotypes: hsflp; act > y+STOP > Gal4,UASgfp; UASlacZ (A), hsflp; act > y+STOP > Gal4,UASgfp;
RNAiscribble (B) and hsflp; act > y+STOP > Gal4,UASgfp; RNAidlg (C). Azot expression is shown in red, GFP clones in green.
(D–M) RNAi-mediated silencing of azot in clones with defects in apico-basal polarity and clones deficient for Wg signaling. Quantification and images of GFP
marked clones from the following genotypes: (D and M) hsflp; act > y+STOP > Gal4; RNAiyellow (E andM) hsflp; act > y+STOP > Gal4; RNAi azot; RNAiyellow, (F
andM) hsflp; act > y+STOP >Gal4; RNAidlg, (G andM) hsflp; act > y+STOP >Gal4; RNAiazot; RNAidlg, (H andM) hsflp; act > y+STOP >Gal4; RNAiscribble, (I and
M) hsflp; act > y+STOP > Gal4; RNAiazot; RNAiscribble, (J and M) hsflp; act > y+STOP > Gal4; UASdaxin, (K and M) hsflp; act > y+STOP > Gal4;RNAiazot;
UASdaxin (p < 0.01) and (L and M) hsflp; act > y+STOP > Gal4; UASlacZ. All clones analyzed 72hr ACI.
(N–R) Survival analysis of clones with defects in apico-basal polarity and clones deficient for Wg signaling in azot mutant heterozygote background. Number of
GFP marked clones 72hr ACI of the following genotypes: (N,R) hsflp; act > y+STOP > Gal4,UASgfp,azot-; RNAiyellow, (O,R) hsflp; act > y+STOP > Ga-
l4,UASgfp,azot-; RNAiscribble (p < 0.01), (P,R) hsflp; act > y+STOP > Gal4,UASgfp,azot-; RNAidlg (p < 0.01) and (Q and R) hsflp; act > y+STOP > Ga-
l4,UASgfp,azot-; UASdaxin.
(S) Vacuole size over time of the following 4 genotypes: 1) azot+/+, 2) azot�/�, 3) azot�/�; azot+/+, and 4) azot+/+; azot+. Size of degenerative vacuoles (pixels) after
1 day at 29�C (azot+/+ n = 29, azot�/�N = 31, azot�/�;azot+/+ N = 23 and azot+/+; azot+ N = 21). Size (pixels) of degenerative vacuoles per brain area after 7 days at
29�C (azot+/+ N = 32, azot�/� N = 23, azot�/�;azot+/+ N = 16 and azot+/+; azot+ N = 39). Size (pixels) of degenerative vacuoles per brain area after 14 days at 29�C(azot+/+ N = 34, azot�/� N = 34, azot�/�;azot+/+ N = 22 and azot+/+; azot+ N = 31).
(T–V) Images of wing imaginal discs dissected in third instar larvae and quantification of GFP marked clones. (T, U) Wing discs of the following genotypes: hsflp;
act > y+STOP>Gal4, UASgfp;UASlacZ (T) and hsflp; act > y+STOP >Gal4, UASgfp;UASazot (U) 72hr ACI. Clones shown in green (GPF) and nuclear marker DAPI
in blue. (V) Graph showing the quantification of the number of clones 72hr ACI. No significant differences were found (student’s t test, p > 0.05).
(W–Y) Images of wing imaginal discs dissected in third instar larvae and quantification of clone size using the MARCM technique. (W and X) Wing discs 72hr ACI.
Size of the clones shown in green (GPF) overexpressing UASazot were compared to MARCM twin clones (black), anti-bGal (red, W) and merge with GFP (X). (Y)
Graph showing the quantification of the size of clones 72hr ACI. No significant differences were found (student’s t test, p > 0.05).
Data are represented as mean ± SEM.
Cell 160, 1–16, January 29, 2015 ª2015 The Authors S11
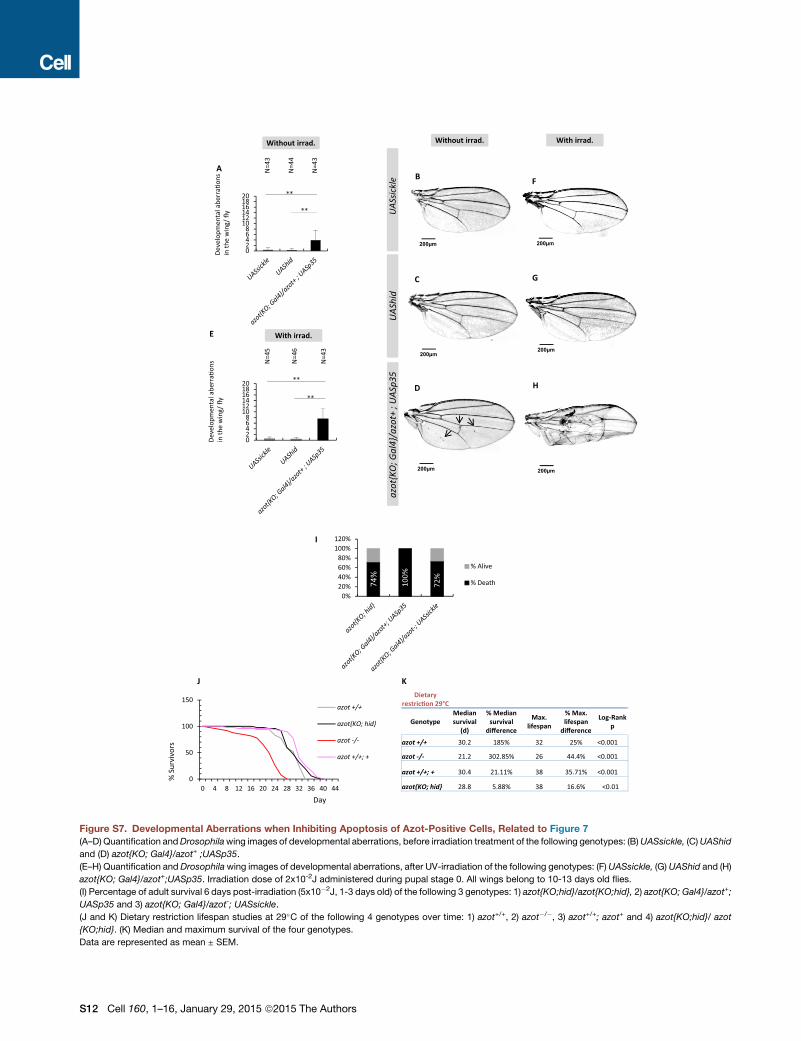
0
50
100
150
0 4 8 12 16 20 24 28 32 36 40 44
azot +/+
azot{KO; hid}
azot -/-
azot +/+; +
02468
101214161820
02468
101214161820
UAS
sickl
eU
AShi
daz
ot{K
O; G
al4}
/ azo
t+ ;
UAS
p35
**
**
**
AB F
C G
D H
E
200µm 200µm
200µm 200µm
200µm 200µm
N=4
6
N=4
5
N=4
3
Deve
lopm
enta
l abe
rra�
ons
in th
e w
ing/
fly
Deve
lopm
enta
l abe
rra�
ons
in th
e w
ing/
fly
N=4
4
N=4
3
N=4
3
**
J K
0%20%40%60%80%
100%120%
% Alive
% Death74%
72%
100%
I
Dietaryrestric�on 29°C
GenotypeMedian survival
(d)
% Median survival
difference
Max. lifespan
% Max. lifespan
difference
Log-Rankp
azot +/+ 30.2 185% 32 25% <0.001
azot -/- 21.2 302.85% 26 44.4% <0.001
azot +/+; + 30.4 21.11% 38 35.71% <0.001
azot{KO; hid} 28.8 5.88% 38 16.6% <0.01
%Su
rviv
ors
Day
Without irrad. With irrad.
With irrad.
Without irrad.
Figure S7. Developmental Aberrations when Inhibiting Apoptosis of Azot-Positive Cells, Related to Figure 7(A–D) Quantification andDrosophilawing images of developmental aberrations, before irradiation treatment of the following genotypes: (B)UASsickle, (C)UAShid
and (D) azot{KO; Gal4}/azot+ ;UASp35.
(E–H) Quantification and Drosophilawing images of developmental aberrations, after UV-irradiation of the following genotypes: (F)UASsickle, (G) UAShid and (H)
azot{KO; Gal4}/azot+;UASp35. Irradiation dose of 2x10⁻²J administered during pupal stage 0. All wings belong to 10-13 days old flies.
(I) Percentage of adult survival 6 days post-irradiation (5x10�2J, 1-3 days old) of the following 3 genotypes: 1) azot{KO;hid}/azot{KO;hid}, 2) azot{KO; Gal4}/azot+;
UASp35 and 3) azot{KO; Gal4}/azot-; UASsickle.
(J and K) Dietary restriction lifespan studies at 29�C of the following 4 genotypes over time: 1) azot+/+, 2) azot�/�, 3) azot+/+; azot+ and 4) azot{KO;hid}/ azot
{KO;hid}. (K) Median and maximum survival of the four genotypes.
Data are represented as mean ± SEM.
S12 Cell 160, 1–16, January 29, 2015 ª2015 The Authors
Copyright © 2022 FDOKUMEN