Stability of Physical Activity across the Lifespan
14
http://hpq.sagepub.com/ Journal of Health Psychology http://hpq.sagepub.com/content/13/8/1092 The online version of this article can be found at: DOI: 10.1177/1359105308095963 2008 13: 1092 J Health Psychol Chandra A. Reynolds Howard S. Friedman, Leslie R. Martin, Joan S. Tucker, Michael H. Criqui, Margaret L. Kern and Stability of Physical Activity across the Lifespan Published by: http://www.sagepublications.com can be found at: Journal of Health Psychology Additional services and information for http://hpq.sagepub.com/cgi/alerts Email Alerts: http://hpq.sagepub.com/subscriptions Subscriptions: http://www.sagepub.com/journalsReprints.nav Reprints: http://www.sagepub.com/journalsPermissions.nav Permissions: http://hpq.sagepub.com/content/13/8/1092.refs.html Citations: at SAGE Publications on March 7, 2011 hpq.sagepub.com Downloaded from
-
Upload
independent -
Category
Documents
-
view
3 -
download
0
Transcript of Stability of Physical Activity across the Lifespan

http://hpq.sagepub.com/Journal of Health Psychology
http://hpq.sagepub.com/content/13/8/1092The online version of this article can be found at:
DOI: 10.1177/1359105308095963
2008 13: 1092J Health PsycholChandra A. Reynolds
Howard S. Friedman, Leslie R. Martin, Joan S. Tucker, Michael H. Criqui, Margaret L. Kern andStability of Physical Activity across the Lifespan
Published by:
http://www.sagepublications.com
can be found at:Journal of Health PsychologyAdditional services and information for
http://hpq.sagepub.com/cgi/alertsEmail Alerts:
http://hpq.sagepub.com/subscriptionsSubscriptions:
http://www.sagepub.com/journalsReprints.navReprints:
http://www.sagepub.com/journalsPermissions.navPermissions:
http://hpq.sagepub.com/content/13/8/1092.refs.htmlCitations:
at SAGE Publications on March 7, 2011hpq.sagepub.comDownloaded from

1092
Stability of PhysicalActivity across theLifespanHOWARD S. FRIEDMANUniversity of California, Riverside, USALESLIE R. MARTINLa Sierra University, USAJOAN S. TUCKERRAND Corporation, USAMICHAEL H. CRIQUIUniversity of California, San Diego, USAMARGARET L. KERN & CHANDRA A.REYNOLDSUniversity of California, Riverside, USA
Abstract
Physical activity is associated withvarious health-relevant psychosocialand physiological processes, butactivity stability across extended timeperiods is inadequately understood.This lifespan longitudinal cohort studyexamined activity levels of 723 malesand 554 females. Associations acrosstime were computed and structuralequation modeling compared a onefactor model and a simplex model.Results showed activity levels aresomewhat stable from childhoodthrough middle and late adulthood.Further, a simplex model provided abetter fit than a one factor model.Successful models and interventionsto improve health will likely require amore nuanced, pattern-sensitiveunderstanding of physical activityacross time.
Journal of Health PsychologyCopyright © 2008 SAGE PublicationsLos Angeles, London, New Delhi,Singapore and Washington DCwww.sagepublications.comVol 13(8) 1092–1104DOI: 10.1177/1359105308095963
COMPETING INTERESTS : None declared.
ADDRESS . Correspondence should be directed to:HOWARD S. FRIEDMAN, Department of Psychology, 900 University Ave,University of California, Riverside, CA 92521, USA. [email:[email protected]]
Keywords
� exercise� gender differences� lifespan patterns� physical activity
at SAGE Publications on March 7, 2011hpq.sagepub.comDownloaded from

THERE IS little doubt that physically active peopleare at lower risk for disease and premature mortal-ity. Yet the complexity of influences, coupled withlimited lifespan data, means the causal pathways arestill not well understood. Physical activity is associ-ated with a host of complex contemporaneous andensuing psychosocial, behavioral, and physiologicalprocesses that are characteristic of or lead to betterhealth (US Department of Health and HumanServices (USDHHS), 1996). First, physical activitycan help control ongoing disease processes like car-diovascular disease and diabetes (Gregg, Gerzoff,Caspersen, Williamson, & Venkat Narayan, 2003;Pedersen & Saltin, 2006), such as by reducing sym-pathetic nervous system activation and stabilizingblood sugar levels; but people with incipient diseasemay have more difficulty staying active. Second,physical activity can affect precursors of goodhealth such as normal blood pressure, weight, andblood lipid levels (Pedersen & Saltin, 2006;Whelton et al., 2002); yet the reverse can also betrue, with unhealthy precursor conditions like obe-sity affecting the likelihood of being physicallyactive (Schmitz et al., 2002; USDHHS, 1996).Third, physical activity may have salutary effects onmood and on factors related to social integration(Mutrie & Faulkner, 2004); in turn, people who areless likely to become depressed and who are wellintegrated into their communities are generallyhealthier (de Bourdeauhuij & Sallis, 2002; Schaie,House, & Blazer, 1992). Again, causal links arecomplex, as depression and isolation can signifi-cantly affect physical activity levels and otherhealth behaviors. Fourth, physical activity may be asign of a robust organism, as opposed to one that isbiologically or behaviorally impaired. Variousunderlying factors (‘third variables’) such as ahearty constitution may affect both activity andhealth, or detrimental processes may affect bothactivity levels and likelihood of illness. Thus, thevarious interrelations and feedback loops amongphysical activity and health remain poorly under-stood (Salmon, Owen, Crawford, Bauman, & Sallis,2003), especially in terms of individual patternsacross long periods of time.Currently, public health policy and government
actions endeavor to increase levels of physicalactivity in the general population (Kahn et al.,2002). For example, teenagers may be encouragedto watch less television and be more active. Yetthere is limited evidence that large media cam-paigns, school campaigns, or community-based
interventions will necessarily improve the health ofthe population in the long term (Kahn et al., 2002;King, Stokols, Talen, Brassington, & Killingsworth,2002). Such broad attempts can backfire, be ineffec-tive, or have unintended consequences over time.For example, in the US government campaigns tolimit fat consumption, a lean and trim populationdid not result (Friedman, 2003; Taubes, 2001;Wilfley & Brownell, 1994); instead, as the govern-ment educated the public about fat intake, the aver-age person became more obese, for a variety ofreasons that are not fully understood. This suggeststhat greater attention should be directed towardindividual patterns, as a complement to epidemio-logical investigations. The current study employslifespan data to examine patterns of physical activ-ity from childhood through early old age. A keyquestion involves whether physical activity is a rel-atively stable personal characteristic rather thanmostly a consequence of one’s shifting socio-envi-ronmental surroundings. That is, if individuals aretraveling along relatively stable pathways of activ-ity, then that information should not be ignoredwhen designing exercise interventions and whencreating theoretical models of physical activity andhealth.More needs to be known about the lifelong pat-
terns of physical activity. Various methods havebeen used to lay the groundwork for understandingactivity patterns and stability, but usually thesestudies have spanned relatively short to mediumperiods of time (e.g. Anderssen et al., 1996;Caspersen, Pereira, & Curran, 2000; Glenmark,Hedberg, & Jansson, 1994; Sallis, 2000). Mostcommonly, activity is tracked across two or threetime points, using Pearson or Spearman correlationcoefficients, kappa statistics, and multiple regres-sion β-estimates of coefficient stability. Trackinghas been assessed across childhood into adoles-cence (e.g. Anderssen, Wold, & Torsheim, 2005;Janz, Burns, & Levy, 2005), from adolescence intoyoung adulthood (e.g. Boreham et al., 2004; Telamaet al., 2005; Trudeau, Laurencelle, & Shepard,2004), and during a seven-year period of adulthood(de Bourdeauhuji, Sallis, & Vandelanotte, 2002).Other methods for considering activity stabilityinclude using baseline characteristics to predictphysical activity and fitness several years later (e.g.Glenmark et al., 1994; Hillsdon, Brunner, Guralnik,& Marmot, 2005; Kuh & Cooper, 1992) and relat-ing current activity with retrospective accounts ofearlier activity levels (e.g. Frändin, Mellström,
FRIEDMAN ET AL.: PHYSICAL ACTIVITY STABILITY
1093
at SAGE Publications on March 7, 2011hpq.sagepub.comDownloaded from

Dundh, & Grimby, 1995; Hirvensalo, Lintenen, &Rantanen, 2000; Taylor, Blair, Cummings, Wun, &Malina, 1999). Retrospective recall may be biasedby current activity levels (Lissner, Potischman,Troiano, & Bengtsson, 2004). Prospective studieslinking all these time periods are now needed.Three models of physical activity trajectories are
easily distinguished. In an independence model, onemostly ignores past activities and assumes that theindividual’s current biopsychosocial state is key tounderstanding current level of activity. This modelis implicitly assumed by various approaches andintervention studies that do not attend to past activ-ity patterns or individual trajectories. In a one fac-tor model, some persons are generally predisposedto be more active than others; that is, a single factoror orientation accounts for much of the individualdifferences in activity levels across long periods oftime. A ‘jocks versus nerds’ conceptualization fitsthis model, with one group generally more active. Ina simplex model, current physical activity is mostrelated to activity during the previous decade or so,but is less predictive across longer time periods.This third model requires attention to long-term tra-jectories, but places more weight on the recent pastin order to best understand activity and optimizeinterventions. The present study formally comparesthese three models.As has been the case in many areas of research,
much of the existing long-term physical activity liter-ature reports only on men. Such a focus not only lim-its generalizing to women, but also limits theunderstanding of processes (Paffenbarger et al.,1994). Women generally differ from men on psycho-logical issues such as concerns with body image, andon biological issues such as body fat and exercise-relevant hormones. Therefore, this study also ascer-tains whether activity patterns vary by gender.
Method
ParticipantsThe data were derived from the Terman Life-CycleStudy begun by Lewis Terman in 1922 (Friedman etal., 1995; Terman et al., 1925). The sample was orig-inally comprised of 1528 bright, mostly middleclass, mostly white boys and girls who were nomi-nated by their teachers as ‘gifted’and whowere testedto have an IQ of at least 135, and so the sample inher-ently controls for certain socio-demographic influ-ences. Participants were followed throughout their
lives, with assessments occurring every five to 10years. The current study, approved by the universityInstitutional Review Board for Human Subjects,used data from the 1922, 1936, 1940, 1950, 1960,1972, and 1977 assessments. To be consistent withprior studies and include a single-decade, school-agecohort, participants born before 1904 or after 1915were excluded (N = 155). (Auxiliary analyses thatincluded those participants did not substantiallychange the results.) Additionally, individuals whodied or were lost to follow-up prior to 1936 wereexcluded (N = 96), leaving a final sample of 1277participants (723 males, 554 females). Missing datareduced the N in certain analyses. Although the sam-ple is not fully representative of the population atlarge and should not be carelessly generalized, noother detailed, lifelong studies of these matters exist,and there is no reason to suspect that findings wouldnot be informative about long-term patterns of phys-ical activity in a middle class cohort.
MeasuresRelevant data were originally collected by Termanand his associates at each assessment, but questionswere not asked specifically about ‘aerobic exerciseand physical activity’, as might be done today.Indeed, modern notions of aerobic exercise wereunknown. Nevertheless, variables exist that can beused to assess each individual’s likelihood ofinvolvement in physical activity at each time frame.Any unreliabilities of measurement reduce the like-lihood of finding associations.
Childhood energy level (1922 ratings byadults) In 1922, parents and teachers rated the par-ticipant on a number of traits, and parents reported ontheir children’s current activities. We created a scaleof high energy and physical activity, involving prefer-ence for games requiring lots of exercise, preferencefor playing outdoors, and rated physical energy on a 1to 13 scale (see Friedman et al., 1993 for furtherdetails of the ratings by parents and teachers).
Childhood activity and interests (1922) In1922, parents listed participants’ ‘hobbies or enter-prises’, and the first three mentions were recordedand coded (see below). Additionally, participantsindicated on a 1 to 5 scale (1 = dislike it very much,5 = like it very much) how much they enjoyed play-ing games that require lots of exercise. These ratingswere averaged to indicate childhood interest in beingphysically active.
JOURNAL OF HEALTH PSYCHOLOGY 13(8)
1094
at SAGE Publications on March 7, 2011hpq.sagepub.comDownloaded from

Adult physical activity (1936, 1940, 1950,1960, and 1972) Beginning in 1936, partici-pants freely listed: ‘Avocational activities and hob-bies in recent years (such as sports, music, art,writing, aviation, photography, collections, garden-ing, wood work, etc.)’. The first four mentions wererecorded and coded to create dichotomous and con-tinuous measures of activity and intensity for eachyear (see section on coding, below).
Older age activity (1977) In 1977, when par-ticipants were, on average, 67 years old, individualswere asked about their level of participation in var-ious activities. The information gathered at thisassessment was different from that of earlier adultassessments in that activities were listed for the sub-jects (as opposed to free-response) and subjectsindicated whether they currently participated ineach activity ‘never’, ‘seldom’, ‘occasionally’, or‘frequently’. Responses were coded (see below) andaveraged to create a total older age activity score.The 1977 sample was smaller than the earlier sam-ples from this project, as a number of participantshad died by this point or were otherwise unavailableto complete the questionnaires.
Coding For the 1922, 1936, 1940, 1950, 1960,and 1972 assessments, three trained judgesassigned a dichotomous activity score to each par-ticipant, indicating whether or not he or shereported engaging in at least one activity involvingsubstantial exertion (e.g. tennis, hiking). Thisdichotomous categorization removes the possibilitythat an individual who listed several different phys-ical activities, but who did each only occasionally,would receive a higher score than someone whodiligently pursued only one or two such activities.The inter-rater reliabilities (mean phi) were: PA1922: ϕ = .92; PA 1936: ϕ = .95; PA 1940: ϕ = .95;PA 1950: ϕ = .94; PA 1960: ϕ = .92 and PA 1972:ϕ = .95. In addition, three trained judges rated thelevel of activity required for pastimes on a 0 to 6scale (0 = no activity, 1 = little energy required foractivity, 6 = highly active). Responses were thenscored and summed to create an overall activityintensity score for that year (in 1922 the first threementions were used; in 1936, 1940, 1950, 1960,and 1972 the first four mentions were used).Highly physical activities included active or com-petitive sports (e.g. baseball, football, track, tennis)and outdoor activities (e.g. horseback riding, hunt-ing, fishing, bicycling). Moderate activities
included active hobbies such as woodworking, gar-dening, carpentry, folk dancing, and ballroomdancing. Sedentary activities included hobbiessuch as card play, board games, stamp collecting,reading, sewing, studying, and activities thatinvolved leaving the home but no vigorous exercise(e.g. attending the theater, religious activities, andclub meetings). The average inter-rater reliabilitiesfor the activity scales were: 1922 activity (parent-rated): r = .85; 1936 activity: r = .78; 1940 activity:r = .78; 1950 activity: r = .84; 1960 activity: r =.82; and 1972 activity: r = .85. As there was no wayto ascertain frequency of participation in variousactivities, such measures are probably not as reli-able as a contemporaneous daily measure of activ-ity and may underestimate effects.For the 1977 assessment, we identified five cate-
gories of activities rated as requiring a high level ofphysical activity. These were: (1) competitive sports;(2) noncompetitive physical sports; (3) working onactive hobbies (includes gardening); (4) homerepairs and maintenance; and (5) physical self-improvement (diet & exercise). Scoring for each cat-egory ranged from 0 (never) to 3 (frequently) andindividual scores were computed based on the aver-age of these five items (inter-rater reliability = .94).
Statistical analysesDescriptive information and correlational analyses(Pearson, point-biserial, or phi, as appropriate)were computed to ascertain the associations ofphysical activity levels among childhood energy(1922), dichotomous indicators of physical activity(1922, 1940, 1950, 1960, 1972), activity intensity(1922, 1936, 1940, 1950, 1960, 1972), and olderage activity (1977).To consider stability of activity intensity across
adulthood (1936 through 1972), a one factormodel and a simplex model were compared usingstructural equation modeling methods. In the onefactor model, an overall physical activity trait dri-ves physical activity behavior at different mea-surement occasions; observed differences acrosstime are due to measurement errors and randomvariation, separate from time (Marsh, 1993). Incontrast, a simplex model is applicable in a longi-tudinal series where the factor variance is carriedfrom occasion to occasion, new sources of variancecontribute at each occasion, and correlationsdecrease with increasing distance between timepoints (Guttman, 1954; Jöreskog, 1970). Specifically,a quasi-Weiner simplex model with equal error
FRIEDMAN ET AL.: PHYSICAL ACTIVITY STABILITY
1095
at SAGE Publications on March 7, 2011hpq.sagepub.comDownloaded from

variances was estimated, which is most appropri-ate when measurements include a degree of error(Jöreskog, 1970, 1979). (Constraining error vari-ances to equality is a more restrictive model thatcan be estimated when the units of measurementare the same across all occasions; Jöreskog, 1979.)To best represent the transmission and incomingvariances across the years, latent dummy variableswere added to create approximately evenly spacedfive year intervals.Descriptive and correlational analyses were per-
formed using SAS 9.1 software, and SEMmodelingwas performed using Mx 1.55 software (Neale,Boker, Xie, & Maes, 2004). Mx allows missing datato be handled by estimating a structured model ofthe means from the raw data, provided that goodstart values are defined (Neale et al., 2004). Toobtain proper start values, covariances among thefive adult physical activity variables were computedfrom the complete cases (with activity ratingsacross all five (1936–1972) measurement occa-sions; N = 491), and the two competing modelswere estimated and compared. Estimated valueswere then used as start values for the structuredmeans model, using the raw data from all cases(N = 1277).Several fit indices were used to assess model fit.
Chi-square is one of the most commonly used indi-cators, but it is relatively sensitive to sample size(Loehlin, 2004), therefore several other indiceswere also considered. RMSEA (root mean squareerror approximation index) is a population-basedmodel that is not affected by sample size, and offersconfidence intervals. A RMSEA fit of less than .08is considered good and .08 to .10 is acceptable. TheAIC (Akaike’s Information Criteria) estimatesmodel fit while adjusting for parsimony. In Mx,AICis calculated as χ² – 2 d.f. (Neale et al., 2004);smaller values indicate a better fit. The RMSEA andAIC were compared to determine the better fittingmodel, as the two models were not nested.
Results
The participants were, on average, born in 1910(SD = 2.89 years), and were 11 years old at thefirst assessment. Data were available for 1157participants in 1922, 922 participants in 1936, 1031participants in 1940, 1144 participants in 1950, 968participants in 1960, 793 participants in 1972, and712 participants in 1977.
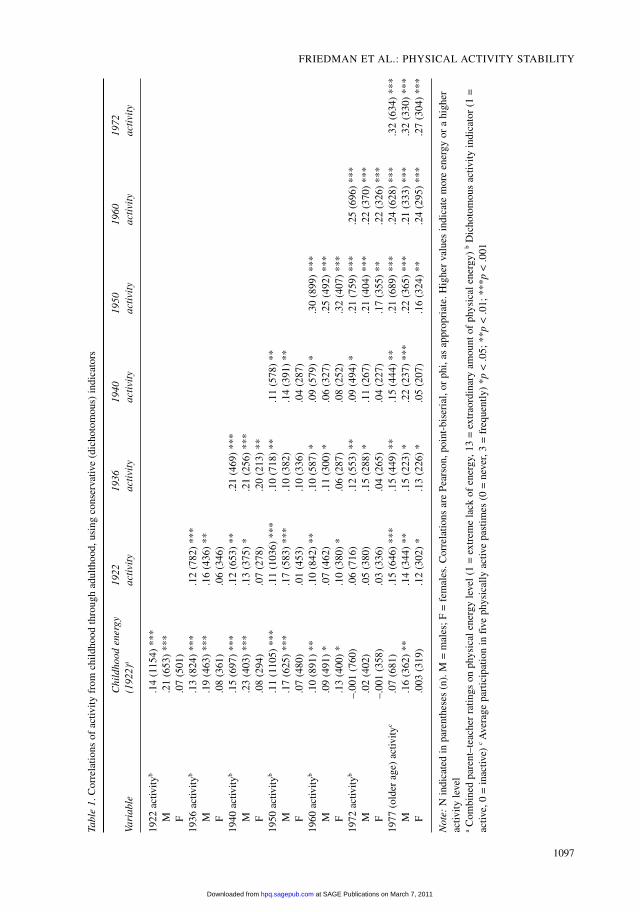
Associations from childhoodthrough the lifespanFirst, to test the independence model, we investigatedwhether energy and activity levels evidence somedegree of stability from childhood through olderadulthood by examining the associations amongchildhood energy, the dichotomous indicators ofactivity, and older age activity. The inter-correlationsare shown in Table 1 (Pearson, point-biserial, or phi,as appropriate). As can be seen, there is some consis-tency of physical activity levels throughout the lifes-pan. Interestingly, even parental ratings of energy andactivities around age 11 (in 1922) were predictive ofself-reported avocational activity decades later (seefirst two columns of correlations). For example, theparents’ ratings of their boys’ energy levels in 1922was correlated rpb = .17 (N = 625, p < .001) with ourcodings of their avocational activities in 1950.Because the various assessments were originallydesigned as measures of interests, characteristics,and hobbies rather than as precise measures of activ-ity, there is considerable unreliability of measure-ment; further, there are situational constraints onactivities reported. Thus, the true inter-correlations ofphysical activity across the lifespan are likely consid-erably higher. This finding of some stability inenergy or activity levels has not been previouslydemonstrated with full prospective lifespan data.We then considered the associations for activity
intensity, using the more specific rating scores foreach activity mentioned. These inter-correlationsare displayed in Table 2. Ratings generally followedthe same patterns as the dichotomous indicators ofactivity. Childhood energy and activity ratings cor-related with adult activity.
Stability of activity: Comparing onefactor and simplex modelsAn examination of the inter-item correlations sug-gests a simplex model; that is, there were generallyhigher correlations for activity measured at closerpoints in time. Note that these are contemporaneousmeasures at each time period, not subject to retro-spective biases. To test the longitudinal associationsover time, structural equation modeling (SEM) wasused to compare a one factor model and a simplexmodel using activity intensity scores from 1936,1940, 1950, 1960, and 1972. Across these periods,491 participants (39.5%) completed all five mea-surement occasions, 359 participants completedfour occasions, 205 completed three occasions,
JOURNAL OF HEALTH PSYCHOLOGY 13(8)
1096
at SAGE Publications on March 7, 2011hpq.sagepub.comDownloaded from
FRIEDMAN ET AL.: PHYSICAL ACTIVITY STABILITY
1097
Table1.Correlationsofactivityfrom
childhoodthroughadulthood,usingconservative(dichotomous)indicators
Childhood
energy
1922
1936
1940
1950
1960
1972
Variable
(1922)
aactivity
activity
activity
activity
activity
activity
1922activity
b.14(1154)***
M.21(653)***
F.07(501)
1936activity
b.13(824)***
.12(782)***
M.19(463)***
.16(436)**
F.08(361)
.06(346)
1940activity
b.15(697)***
.12(653)**
.21(469)***
M.23(403)***
.13(375)*
.21(256)***
F.08(294)
.07(278)
.20(213)**
1950activity
b.11(1105)***
.11(1036)***
.10(718)**
.11(578)**
M.17(625)***
.17(583)***
.10(382)
.14(391)**
F.07(480)
.01(453)
.10(336)
.04(287)
1960activity
b.10(891)**
.10(842)**
.10(587)*
.09(579)*
.30(899)***
M.09(491)*
.07(462)
.11(300)*
.06(327)
.25(492)***
F.13(400)*
.10(380)*
.06(287)
.08(252)
.32(407)***
1972activity
b–.001(760)
.06(716)
.12(553)**
.09(494)*
.21(759)***
.25(696)***
M.02(402)
.05(380)
.15(288)*
.11(267)
.21(404)***
.22(370)***
F–.001(358)
.03(336)
.04(265)
.04(227)
.17(355)**
.22(326)***
1977(olderage)activity
c.07(681)
.15(646)***
.15(449)**
.15(444)**
.21(689)***
.24(628)***
.32(634)***
M.16(362)**
.14(344)**
.15(223)*
.22(237)***
.22(365)***
.21(333)***
.32(330)***
F.003(319)
.12(302)*
.13(226)*
.05(207)
.16(324)**
.24(295)***
.27(304)***
Note:Nindicatedinparentheses(n).M=males;F=females.CorrelationsarePearson,point-biserial,orphi,asappropriate.Highervaluesindicatemoreenergyorahigher
activitylevel
aCombinedparent–teacherratingsonphysicalenergylevel(1=extremelackofenergy,13=extraordinaryamountofphysicalenergy)bDichotomousactivityindicator(1=
active,0=inactive)
cAverageparticipationinfivephysicallyactivepastimes(0=never,3=frequently)*p<.05;**p<.01;***p<.001
at SAGE Publications on March 7, 2011hpq.sagepub.comDownloaded from

JOURNAL OF HEALTH PSYCHOLOGY 13(8)
1098
Table2.Inter-correlationsofactivityintensitylevel,usingthecumulativeintensityratingsrequiredforeachactivity
Variable
12
34
56
78
9
1.1922Childhoodenergy
a1.00(1228)
M1.00(698)
F1.00(530)
2.1922intensity
b.15(1148)***
1.00(1157)
M.14(647)***
1.00(655)
F.16(501)***
1.00(502)
3.Childinterest(1922)c
.65(1090)***
.12(1028)***
1.00(1100)
M.66(620)***
.13(580)**
1.00(627)
F.65(470)***
.13(448)**
1.00(473)
4.1936intensity
d.07(895)*
.07(846)*
.09(804)*
1.00(922)
M.09(516)*
.06(484)
.15(464)**
1.00(530)
F.05(379)
.08(362)
–.003(340)
1.00(392)
5.1940intensity
d.11(987)***
.07(934)*
.09(888)**
.41(781)***
1.00(1031)
M.13(561)**
.09(530)*
.11(507)**
.48(450)***
1.00(584)
F.10(426)*
.05(404)
.06(381)
.30(331)***
1.00(447)
6.1950intensity
d.07(1101)*
.01(1037)
.08(988)**
.27(834)***
.37(953)***
1.00(1144)
M.12(623)**
.04(585)
.16(560)***
.31(474)***
.38(540)***
1.00(644)
F.005(478)
.01(452)
–.04(428)
.21(360)***
.37(413)***
1.00(500)
7.1960intensity
d.04(930)
–.01(880)
.01(845)
.19(722)***
.26(824)***
.20(684)***
1.00(968)
M.02(517)
.01(487)
–.004(471)
.23(402)***
.25(456)***
.36(516)***
1.00(537)
F.09(413)
.03(393)
.02(374)
.12(320)*
.26(368)***
.32(416)***
1.00(431)
(Continued)
at SAGE Publications on March 7, 2011hpq.sagepub.comDownloaded from

130 completed two occasions, and 92 completedone occasion.First, we evaluated the two models using com-
plete cases (N = 491). Although both the one factorand simplex models fit the data significantly betterthan the null (or independence) model (∆χ2(9) =282.69 and 314.10, respectively, both ps < .001), thefit of the one factor model was inadequate (RMSEA= .11 (95% confidence interval .08, .15)). The sim-plex model did provide a good fit to the data(RMSEA = .00 (.00, .06)). Using the AIC criteria,the simplex model was by far the best fitting model(AICnull = 290.48; AIC1 factor = 25.79; AICsimplex =–5.62). Figure 1 shows the paths and path estimatesfor the one factor model, and Figure 2 shows thepaths and path estimates for the simplex model.Second, the one factor and simplex models were
estimated separately for males and females, usingcomplete cases (Nmales = 265 and Nfemales = 226). Formales, the one factor model again failed to provide agood fit (RMSEA = .15 (.11, .20); AIC = 24.81),whereas the simplex model did provide a good fit(RMSEA = .04 (.00, .10); AIC = –2.82). For females,both the one factor and simplex models provided anacceptable fit to the data (RMSEA1 factor = .05(.00, .11), AIC1 factor = –2.58; RMSEAsimplex = .00 (.00,.09), AICsimplex = –5.59), but the simplex model wassuperior to the one factor model, as indicated by theRMSEA and AIC values (also note that the RMSEAupper 95% confidence interval for the one factormodel is greater than .10, suggesting a suboptimal fit).Third, models of the structured mean values and
covariances were estimated by including the rawdata from all non-missing responses (N = 1277).(Detailed descriptive information, model fit indices,and expected variances for complete and incom-plete cases are available from the author uponrequest.) Resulting pathway estimates did not varysignificantly between the complete and incompletecases, and estimates were consistent with completecase values for both males and females. This indi-cates that the data were not biased by the patternsdisplayed by the complete cases. Overall, the pat-tern of results suggests that new variance entered ateach time point, reflecting new sets of influences(e.g. health or illness, changes in hobbies or occu-pations, greater leisure time).
Discussion
Interventions that increase levels of physical activ-ity in the short term in the general population are
FRIEDMAN ET AL.: PHYSICAL ACTIVITY STABILITY
1099
Table2.(Continued)
Variable
12
34
56
78
9
8.1972intensity
d–.03(760)
.03(718)
.01(686)
.09(600)*
.36(932)***
.23(759)***
.28(720)***
1.00(793)
M–.02(402)
.06(381)
.01(365)
.15(321)**
.26(366)***
.23(405)***
.33(383)***
1.00(419)
F–.03(358)
–.02(337)
.002(321)
.01(279)
.14(318)*
.22(354)***
.23(337)***
1.00(374)
9.1977(olderage)activity
e.07(681)
.05(649)
.12(619)**
.16(543)***
.20(620)***
.30(687)***
.29(649)***
.32(634)***
1.00(712)
M.16(362)**
.08(347)
.21(329)***
.27(288)***
.22(328)***
.34(365)***
.31(344)***
.35(330)***
1.00(375)
F.00(319)
.09(302)
.01(290)
.03(255)
.21(292)***
.23(322)***
.21(305)***
.28(304)***
1.00(337)
Note:Nindicatedinparentheses(n).M=males;F=females.Highervaluesindicatemoreenergyorhigherenergyintensity
aCombinedparent–teacherratingsonphysicalenergylevel(1=extremelackofenergy,13=extraordinaryamountofphysicalenergy)
bParentfree-responseofchild’shobbiesandactivities(sum
offirstthreementions,0=noenergyrequiredforactivity,6=highlevelofenergyrequiredforactivity)
cChildratingofinterestinphysicallyactivepastimes(1=dislikeverymuch,5=likeverymuch)
dParticipantfree-responseofinterestsandactivities(sum
offirstfourmentions,0=noenergyrequiredforactivity,6=highlevelofenergyrequiredforactivity)
eAverageparticipationinfivephysicallyactivepastimes(0=never,3=frequently)
*p<.05;**p<.01;***p<.001
at SAGE Publications on March 7, 2011hpq.sagepub.comDownloaded from

sometimes seen as a proxy to increasing long-termhealth and longevity, but such inferences are notvalid if the effects are not long-lasting and the rele-vant causal mechanisms are not affected. The mul-tiple pathways linking activity and health, and thecomplexities of human health, should provoke asubtle and nuanced approach that acknowledgesindividual differences. The question addressed inthis study was whether there is consistency in phys-ical activity levels from childhood through youngand middle adulthood and into old age, and whetherconsistency is better captured by a single generalfactor or a simplex model.Despite the limits of an archival cohort study, sig-
nificant associations emerged across nearly sixdecades. Active, energetic children tended tobecome active, energetic adults, and in turn tendedto remain active. Precise causal pathways remainunknown, but it may be prudent to consider tem-peramental factors (genetics, hormones, and earlydevelopment) or personality factors (individual dif-ferences in biopsychosocial patterns of responding)to better understand adult inactivity and design bet-ter interventions aimed at young, middle-aged, andolder adults. Just as a health professional would not
ignore a life-long predisposition to obesity or heartdisease when designing an intervention for theseconditions, life pathways of physical activity shouldalso be carefully considered when designing activ-ity interventions.In addition to rejecting the idea that physical activ-
ity can be independently considered at each stage oflife, our coding and analyses of the lifespan Termandata support a simplex model. That is, it is notenough to know that some individuals are and tend toremain more active than others; rather, it is better toknow their activity levels in the past decade or so.Nevertheless, it is remarkable that childhood energylevels and activity interests are somewhat predictiveof activity-relevant hobbies many decades later.In terms of gender, the patterns of findings were
generally similar for males and females, parallelingresults others have found for activity in elderly menand women (Langer, Klauber, Criqui, & Barrett-Connor, 1994), but there were some larger correla-tions for males; this may have been due to therestrictions on the physical activity of females dur-ing the 20th century, ranging from traditional gen-der roles (with greater constraints on recreationalactivities) to childrearing duties.
JOURNAL OF HEALTH PSYCHOLOGY 13(8)
1100
activity
act36 act40 act50 act60 act72
E36 E40 E50 E60 E72
1.00
A362.15
A402.71
A503.23
A602.30
A721.61
Ve3613.74
Ve4015.95
Ve5014.45
Ve6015.81
Ve7216.45
Figure 1. Path estimates for one factor model, complete cases (N = 491).
at SAGE Publications on March 7, 2011hpq.sagepub.comDownloaded from

FRIEDMAN ET AL.: PHYSICAL ACTIVITY STABILITY
1101
Figure2.Pathestimatesforsimplexmodel,completecases(N=491).
Act
1936
act3
6
b2 1.32
b3 0.87
b3 0.87
Va1
6.23
E1
A1
Ve
12.1
2
Act
1940
act4
0
Va2
0.08
E2
A2
Ve
12.1
2
Act
45
1.00
Act
1950
act5
0
Va3
5.85
E3
A3
Ve
12.1
2
Act
1960
act6
0
Va4
3.32
E4
A4
Ve
12.1
2
Act
1972
act7
2
Va5
2.39
E5
A5
Ve
12.1
2
b4 0.79
b4 0.79
Act
55
1.00
b5 0.81
b5 0.81
Act
65
1.00
at SAGE Publications on March 7, 2011hpq.sagepub.comDownloaded from

JOURNAL OF HEALTH PSYCHOLOGY 13(8)
1102
Few lifespan longitudinal studies of individualdifferences are based on a true random sample ofthe population, for a variety of reasons of focus,cost, availability, and time frame; the importantquestion of generality that arises should not bewhether any results are fully generalizable (sincethey usually are not); rather, the focus should be onthe likely limits on generality, and the purposes forwhich the results are best employed. The homoge-neous nature of this sample on intelligence obvi-ously restricts the range on intellect, but ourpublished studies of the past decade show that thereis a more than adequate range of most individualdifferences. The Terman data cannot be directlygeneralized and used for precise estimates of popu-lation effect sizes. Nevertheless, the finding of con-sistency in activity patterns (despite unreliabilitiesof measurement) is likely true throughout the popu-lation and suggests that adolescents and youngadults already differ from each other in stable waysrelevant to physical activity across the full lifespan.This has not been previously documented acrosssuch a long time period.Because the links among physical activity and var-
ious biopsychosocial factors are complex, the presentresults provide a backdrop for more detailed media-tional analyses of activity and health. It is well estab-lished that physical activity can be a cause, aconsequence, and a correlate of a host of healthy andunhealthy states, traits, and behaviors at differentpoints in life. Future research might focus more onthe long-term pathways to better or worse health, therole played by physical activity in various stages oflife, and the processes of these pathways (Friedman,2007). The present study, spanning nearly sixdecades, suggests there are very long-term consisten-cies in levels of physical activity, a finding that likelyhas implications for understanding the complexcausal interrelations of physical activity and health.
References
Anderssen, N., Jacobs, D. R., Jr, Sidney, D. R., Bild, D. E.,Sternfeld, B., Slattery, M. L., & Lewis, B. (1996).Stability, change and secular trends in physical activitypatterns in young adults: A 7-year longitudinal follow-up in CARDIA. American Journal of Epidemiology,143, 351–362.
Anderssen, N., Wold, B., & Torsheim, T. (2005). Trackingof physical activity in adolescence. Research Quarterlyfor Exercise and Sport, 76, 119–129.
Boreham, C., Robson, P. J., Gallagher, A. M., Cran, G. W.,Savage, J. M., & Murray, L. J. (2004). Tracking of
physical activity, fitness, body composition and dietfrom adolescence to young adulthood: The young heartsproject, Northern Ireland. International Journal ofBehavioral Nutrition and Physical Activity, 1, 14[online].
Caspersen, C. J., Pereira, M. A., & Curran, K. M. (2000).Changes in physical activity patterns in the UnitedStates by sex and cross-sectional age. Medicine andScience in Sports & Exercise, 32, 1601–1609.
De Bourdeauhuij, I., & Sallis, J. (2002). Relative contribu-tion of psychosocial variables to the explanation ofphysical activity in three population-based adult sam-ples. Preventive Medicine: An International JournalDevoted to Practice & Theory, 34, 279–288.
De Bourdeaudhuij, I., Sallis, J., & Vandelanotte, C.(2002). Tracking and explanation of physical activity inyoung adults over a seven-year period. ResearchQuarterly for Exercise & Sport, 73, 376–385.
Frändin, K., Mellström, D., Dundh, V., & Grimby, G.(1995). A life span perspective on patterns of physicalactivity and functional performance at the age of 76.Gerontology, 41, 109–120.
Friedman, H. S. (2003). Healthy life-style across the life-span:The heck with the Surgeon General! In J. Suls & K.Wallston (Eds.), Social psychological foundations of healthand illness (pp. 3–21). Boston, MA: Blackwell Publishing.
Friedman, H. S. (2007). Personality, disease, and self-healing. In H. S. Friedman & R.C. Silver (Eds.),Foundations of health psychology (pp. 172–199). NewYork: Oxford University Press.
Friedman, H. S., Tucker, J. S., Schwartz, J. E., Tomlinson-Keasey, C., Martin, L. R., Wingard, D. L., & Criqui, M.H. (1995). Psychosocial and behavioral predictors oflongevity: The aging and death of the ‘Termites’.American Psychologist, 50, 69–78.
Friedman, H. S., Tucker, J., Tomlinson-Keasey, C.,Schwartz, J., Wingard, D., & Criqui, M. H. (1993).Does childhood personality predict longevity? Journalof Personality and Social Psychology, 65, 176–185.
Glenmark, B., Hedberg, G., & Jansson, E. (1994).Prediction of physical activity in adulthood by physicalcharacteristics, physical performance, and physicalactivity in adolescence: An 11 year follow-up study.European Journal of Applied Physiology, 69, 530–538.
Gregg, E. W., Gerzoff, R. B., Caspersen, C. J. Williamson,D. F., & Venkat Narayan, K. M. (2003). Relationship ofwalking to mortality among US adults with diabetes.Archives of Internal Medicine, 163, 1440–1447.
Guttman, L. (1954). A new approach to factor analysis:The radix. In P. F. Lazarsfeld (Ed.),Mathematical think-ing in the social sciences (pp. 258–348). New York:Columbia University Press.
Hillsdon, M. M., Brunner, E. J., Guralnik, J. M., &Marmot, M. G. (2005). Prospective study of physicalactivity and physical function in early old age.American Journal of Preventive Medicine, 28,245–250.
at SAGE Publications on March 7, 2011hpq.sagepub.comDownloaded from

Hirvensalo, M., Lintenen, T., & Rantanen, T. (2000). Thecontinuity of physical activity: A retrospective andprospective study among older people. ScandinavianJournal of Medicine Science in Sports, 10, 37–41.
Janz, K. F., Burns, T. L., & Levy, S. M. (2005). Trackingof activity and sedentary behaviors in childhood: TheIowa bone development study. American Journal ofPreventive Medicine, 29, 171–178.
Jöreskog, K. G. (1970). Estimation and testing of simplexmodels. British Journal of Mathematical and StatisticalPsychology, 23, 121–145.
Jöreskog, K. G. (1979). Analyzing psychological data bystructural analysis of covariance matrices. In K. G.Jöreskog & S. Sörbom (Eds.), Advances in factor analy-sis and structural equation models (pp. 45–100).Cambridge, MA: Abt Books.
Kahn, E. B., Ramsey, L. T., Brownson, R. C., Heath, G.W., Howze, E. H., & Powell, K. E. et al. (2002). Theeffectiveness of interventions to increase physical activ-ity: A systematic review. American Journal ofPreventive Medicine, 22, 73–106.
King, A. C., Stokols, D., Talen, E., Brassington, G. S., &Killingsworth, R. (2002). Theoretical approaches to thepromotion of physical activity: Forging a transdisciplinaryparadigm. American Journal of Preventive Medicine[Special Issue: Innovative approaches to understandingand influencing physical activity], 23, 15–25.
Kuh, J., & Cooper, C. (1992). Physical activity at 36 years:Patterns and childhood predictors in a longitudinalstudy. Journal of Epidemiology and Community Health,46, 114–119.
Langer, R. D., Klauber, M. R., Criqui, M. H., & Barrett-Connor, E. L. (1994). Exercise and survival in the veryold. American Journal of Geriatric Cardiology, 3, 24–34.
Lissner, L., Potischman, N., Troiano, R., & Bengtsson, C.(2004). Recall of physical activity in the distant past:The 32-year follow-up of the prospective populationstudy of women in Göteborg, Sweden. AmericanJournal of Epidemiology, 159, 304–307.
Loehlin, J. C. (2004). Latent variable models: An intro-duction to factor, path, and structural analysis, 4th edn.New Jersey: Lawrence Erlbaum Associates.
Marsh, H. W. (1993). Stability of individual differences inmultiwave panel studies: Comparison of simplex mod-els and one-factor models. Journal of EducationalMeasurement, 30, 157–183.
Mutrie, N., & Faulkner, G. (2004). Physical activity:Positive psychology in motion. In P. A. Linley & S.Joseph (Eds.), Positive psychology in practice (pp.146–164). New Jersey: Wiley.
Neale, M., Boker, S., Xie, G., & Maes, H. (2004). Mx:Statistical modeling (Version 1.55), Richmond, VA.
Paffenbarger, R. S., Kampert, J. B., Lee, I., Hyde, R. T.,Leung, R. W., &Wing, A. L. (1994). Changes in physical
activity and other lifeway patterns influencing longevity.Medicine & Science in Sports & Exercise, 26, 857–865.
Pedersen, B. K., & Saltin, B. (2006). Evidence for pre-scribing exercise as therapy in chronic disease.Scandinavian Journal of Medicine and Science inSports, 16, 3–63.
Sallis, J. F. (2000). Age-related decline in physical activ-ity: A synthesis of human and animal studies. Medicineand Science in Sports & Exercise, 32, 1598–1600.
Salmon, J., Owen, N., Crawford, D., Bauman, A., &Sallis, J. F. (2003). Physical activity and sedentarybehavior: A population-based study of barriers, enjoy-ment, and preference. Health Psychology, 22, 178–188.
Schaie, K. W., House, J. S., & Blazer, D. (Eds.). (1992).Aging, health behaviors, and health outcomes.Hillsdale, NJ: Lawrence Erlbaum Associates.
Schmitz, K. H., Lytle, L. A., Phillips, G. A., Murray,D. M., Birnbaum, A. S., & Kubik, M. Y. (2002).Psychosocial correlates of physical activity and seden-tary leisure habits in young adolescents: The TeensEating for Energy and Nutrition at School study.Preventive Medicine: An International Journal Devotedto Practice & Theory, 34, 266–278.
Taubes, G. (2001). The soft science of dietary fat. Science,291, 2536–2545.
Taylor, W. C., Blair, S. N., Cummings, S. S., Wun, C. C., &Malina, R. M. (1999). Childhood and adolescent physicalactivity patterns and adult physical activity.Medicine andScience in Sports & Exercise, 31, 118–123.
Telama, R., Yang, X., Vikari, J., Välimäki, I., Wanne, O.,& Raitakari, O. (2005). Physical activity from child-hood to adulthood: A 21-year tracking study. AmericanJournal of Preventive Medicine, 28, 267–273.
Terman, L. M., Baldwin, B. T., Bronson, E., DeVoss, J. C.,Fuller, F., Goodenough, F. L. et al. (1925). Genetic stud-ies of genius, I: Mental and physical traits of a thousandgifted children. Stanford, CA: Stanford University Press.
Trudeau, F., Laurencelle, L., & Shepard, R. J. (2004).Tracking of physical activity from childhood to adult-hood. Medicine and Science in Sports & Exercise, 36,1937–1943.
US Department of Health and Human Services (USD-HHS). (1996). Physical activity and health: A report ofthe Surgeon General. Washington, DC: US Departmentof Health and Human Services.
Whelton, P. K., He, J., Appel, L. J., Cutler, J. A., Havas, S.,Kotchen, T.A. et al. (2002). Primary prevention of hyper-tension: Clinical and public health advisory from thenational high blood pressure education program. Journalof the American Medical Association, 288, 1882–1888.
Wilfley, D. E., & Brownell, K. D. (1994). Physical activ-ity and diet in weight loss. In R. K. Dishman (Ed.),Advances in exercise adherence (pp. 361–393).Champaign, IL: Human Kinetics Publishers.
FRIEDMAN ET AL.: PHYSICAL ACTIVITY STABILITY
1103
at SAGE Publications on March 7, 2011hpq.sagepub.comDownloaded from

HOWARD S. FRIEDMAN, PhD (Principal Investigator,Grant AG08825 from the National Institute onAging) is Distinguished Professor of Psychologyat the University of California, Riverside. Parts ofthe data derive from the Terman Life-Cycle Study,begun by Lewis Terman. This article is one of aseries developed from a large-scale, multi-year,multidisciplinary project on lifespan predictors ofhealth and longevity, and although all relevantfindings are included in each article to the extentfeasible, the complexity, scope, and diversity offocus precludes simple integration. Reviews ormeta-analyses using these findings should consultour related articles, dating from 1993. Also notethat sample sizes may change somewhat fromarticle to article as old data are refined, new dataare gathered or located, participants die, or timeperiods change.
LESLIE R. MARTIN, PhD is Professor of Psychologyat La Sierra University.
JOAN S. TUCKER, PhD is Behavioral Scientist at theRAND Corporation.
MICHAEL H. CRIQUI, MD, MPH is Professor ofMedicine, and Professor of Family and PreventiveMedicine at the University of California, San Diego.
MARGARET L. KERN, MA is a graduate student inpsychology at the University of California,Riverside.
CHANDRA A. REYNOLDS, PhD (Principal Investigatorof NIA grant AG027001), is Associate Professor ofPsychology at the University of California,Riverside.
JOURNAL OF HEALTH PSYCHOLOGY 13(8)
1104
Author biographies
at SAGE Publications on March 7, 2011hpq.sagepub.comDownloaded from