Predatory Sedentism": Intimidation and Intensification in the Nigerian Savanna
Upload
independentCategory
view
1download
0
T. Vange et al, International Journal of Advances in Agricultural Science and Technology,
Vol.2 Issue. 2, February- 2014, pg. 01-14 ISSN: 2348-1358
© 2014, IJAAST All Rights Reserved, www.ijaast.com 1
Stability Analysis of Six Improved Sorghum
Genotypes across Four Environments in the Southern
Guinea Savanna Agroecological Zone of Nigeria
T. Vange1, Ango, I. Nache.
2, D.K. Adedzwa
2
1Department of Plant Breeding and Seed Science
2Department of Crop Production
University of Agriculture, Makurdi, Nigeria
Corresponding Authors email: [email protected], tvange@uam,edu.ng
Abstract
Six sorghum genotypes from the Institute for Agric Research Zaria were evaluated for stability
study in four environments in the Southern Guinea Savanna in the 2009 & 2010 cropping
seasons using Randomized Complete Block Designs (RCBD) with four replications in each of
the locations. Analysis of Variance was carried out for each set of data collected and where
significant difference was observed, mean separations was done using Duncan Multiple
Range test. The regression coefficient (b) of Finlay and Wilkinson (1966), ecovalence (W2)
and mean squares of deviation from regression (S2d) of Eberhart and Russel (1966) were used
as stability parameters. The highest yield genotype was SSV2006019 (6.06t/ha) while the least
yield was SSV2006043 (4.02t/ha), based on the stability parameters, Genotypes SSV2006019,
SSV2006039 and SSV2006040 with ecovalence values of 0.28, 0.003 and 0.14 and b values of
0.99, 0.84 and 1.01 respectively appeared to be stable and adapted to the test environments
while SSV2006002 and SSV2006006 with yield values of 4.82 and 4.47t/ha respectively
appears to be good for poor environments.
Keywords: Stability Analysis, Ecovariance, Sorghum, Nigeria, Yield
Introduction
Sorghum (Sorghum bicolior (L) Moench) commonly called Guinea corn is one of the cereal
crops grown in the savanna regions of Nigeria for human, livestock and poultry feeding. Sorghum
T. Vange et al, International Journal of Advances in Agricultural Science and Technology,
Vol.2 Issue. 2, February- 2014, pg. 01-14 ISSN: 2348-1358
© 2014, IJAAST All Rights Reserved, www.ijaast.com 2
is the fourth most important cereal crop in the world after wheat, maize, and rice respectively
(Dogget, 1988). Its cultivation ranks first among maize, rice, wheat, and millet in Nigeria and
occupies approximately 46% of the total land area devoted to the growing of cereals (FAO, 1982
and Alhassan, 1986) and accounts for about 50% of the total cereal production including rice,
maize, millet, and wheat (Obilana et al, 1984). Sorghum is indigenous to semi arid tropics of
Africa; it is an annual grass that is extremely drought tolerant, making it an excellent choice for arid
and dry areas. Sorghum has special adaptations to weather extremes and is a very stable source of
nutrition to millions of Africans, (Dewer, 2003). It accounts for about 45 million hectares in the
world with Asia as the leading continent with 19.6 million hectares followed by Africa with 15.7
million hectares (Dendy, 1995, Acquaah, 2003). In Nigeria, sorghum production has risen from
about 4.795 metric tons in 1989 to 6.197 metric tons in 2002 and 8.0 metric tons in 2004 (Aba et. al
2007). This he thinks is because of the increased use of the crop in various Agro-based industries
which has increased its demand over the current production. The grain is mostly used for food
purposes (55%), consumed in the form of flat breads and porridges (thick or thin) the Stover is an
important source of dry season maintenance rations for livestock, especially in Northern Sahel
savanna where the bulk of ruminant livestock is found, (Alhassan, 1989).
Sorghum is cultivated in all of the Savanna of Nigeria. The crop is versatile and hardy being
adapted to highly varying environments, from the derived/wet savanna through the vast Guinea
savanna into the dry Sudan savanna and semi-arid and Sahel regions in Nigeria, thus the crop is
cultivated virtually in all parts of the country. Sorghum can be grown on a wide range of soil types
ranging from sandy loams, through the vartisols and the ferruginous soils.
T. Vange et al, International Journal of Advances in Agricultural Science and Technology,
Vol.2 Issue. 2, February- 2014, pg. 01-14 ISSN: 2348-1358
© 2014, IJAAST All Rights Reserved, www.ijaast.com 3
Millions of people consume sorghum in their daily diets as staple food in the savanna
regions. Currently, 90% to 95% of the crop produced in Nigeria is consumed directly as human
food with varietal preferences varying from place to place. Sorghum is mainly used in the form of
flour or paste processed in to two main dishes; “Tuwo and „‟akamu”, in Nigeria. Other dishes
include fried snacks, steam dumplings and other boiled or roasted snack food. „‟Kunu zaki” is an
important drink that is made from sorghum which cools thirst very fast, “burkutu”-a local beer
commonly consumed in most of the „middle belt‟ of Nigeria is made from sorghum. The stalk of
the crop is used for building and for fencing, as a source of fuel for cooking and staking of yams
and the fodder is used for feeding farm animal. The grains of some varieties are used in industrial
ventures such as poultry feed, pharmaceuticals and for the production of malt and beer in the malt
and brewing industry respectively.
Sorghum is a very important cereal in the semi-arid areas of the tropics and sub-tropics
including Nigeria. Generally, the area of sorghum cultivation has increased over the years
(Aribissalla, 1989). However the average yield trends are downwards. Paramount the yield reducing
factors are predominant cultivation of inherently; low yielding varieties, poor soil fertility, non
adaptable varieties and striga infestation. Thus exploitation of stability study through Genotype X
Environment interaction will to a large extent help to identify promising genotypes in specific
environment thereby bringing increase in the yield of sorghum.
Stability in performance is one of the most desirable properties of a genotype to be released
as a variety for wide cultivation. Singh and Chaudhary (1977) proposed multilocational trials over a
number of years. They proposed two tools for assessing stability of a crop which are; regression
T. Vange et al, International Journal of Advances in Agricultural Science and Technology,
Vol.2 Issue. 2, February- 2014, pg. 01-14 ISSN: 2348-1358
© 2014, IJAAST All Rights Reserved, www.ijaast.com 4
coefficient (b), and the mean square deviations from linear regression. A variety with unit
regression coefficient (b=1) and the deviation not significantly different from zero (S2d= 0) is said
to be a stable genotype. Aba et al (1995) reported that the association of variable traits and their
relative contribution to yield constituents is the basic requirement in selection for improvement of a
crop.
David et al (1995), in his work on yield of wheat emphasized that “yield is a function of the
number of spikes per unit area, number of grains per spike and grain weight/size. They showed that
spikes per unit area, are of the yield component with which variation in grain yield is most closely
associated.
Materials and methods
Field experiments were conducted during the 2009 and 2010 cropping seasons in four (4)
locations within the Southern Guinea Savanna, namely; the Teaching and Research farms of the
following Institutions; Nuhu Bamali Polytechnic, School of Agriculture, Samaru Kataf, Kaduna
state, Kaduna State College of Education Gidan Waya, Kafanchan, Kaduna state, Nassarawa State
College of Agriculture, Lafia, Nassarawa State, and University of Agriculture Makurdi, Benue
state. Generally the locations fall within the Southern Guinea Savanna Agro-ecological zone of
Nigeria, the research locations are in four local Government Areas of three states; Benue,
Nassarawa and Kaduna states of Nigeria; (Makurdi, Lafia, Jema‟a and Zangon Kataf Local
Government Areas respectively).
T. Vange et al, International Journal of Advances in Agricultural Science and Technology,
Vol.2 Issue. 2, February- 2014, pg. 01-14 ISSN: 2348-1358
© 2014, IJAAST All Rights Reserved, www.ijaast.com 5
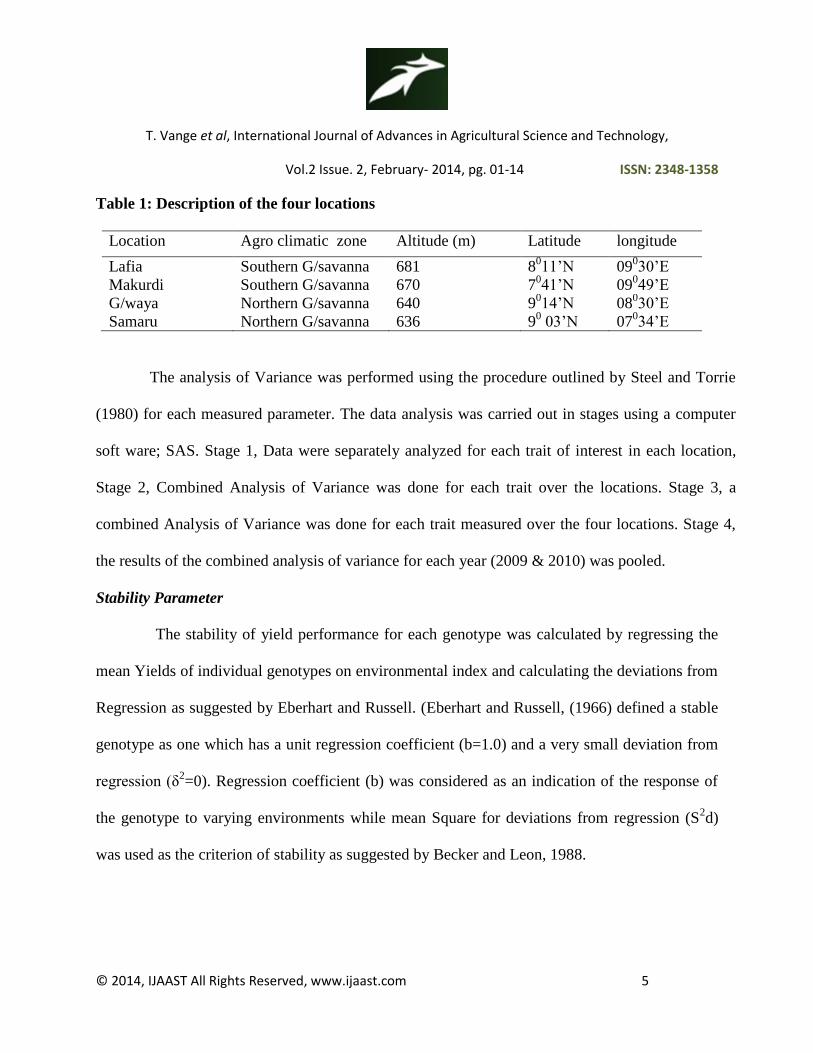
Table 1: Description of the four locations
Location Agro climatic zone Altitude (m) Latitude longitude
Lafia Southern G/savanna 681 8011‟N 09
030‟E
Makurdi Southern G/savanna 670 7041‟N 09
049‟E
G/waya Northern G/savanna 640 9014‟N 08
030‟E
Samaru Northern G/savanna 636 90 03‟N 07
034‟E
The analysis of Variance was performed using the procedure outlined by Steel and Torrie
(1980) for each measured parameter. The data analysis was carried out in stages using a computer
soft ware; SAS. Stage 1, Data were separately analyzed for each trait of interest in each location,
Stage 2, Combined Analysis of Variance was done for each trait over the locations. Stage 3, a
combined Analysis of Variance was done for each trait measured over the four locations. Stage 4,
the results of the combined analysis of variance for each year (2009 & 2010) was pooled.
Stability Parameter
The stability of yield performance for each genotype was calculated by regressing the
mean Yields of individual genotypes on environmental index and calculating the deviations from
Regression as suggested by Eberhart and Russell. (Eberhart and Russell, (1966) defined a stable
genotype as one which has a unit regression coefficient (b=1.0) and a very small deviation from
regression (δ2=0). Regression coefficient (b) was considered as an indication of the response of
the genotype to varying environments while mean Square for deviations from regression (S2d)
was used as the criterion of stability as suggested by Becker and Leon, 1988.

T. Vange et al, International Journal of Advances in Agricultural Science and Technology,
Vol.2 Issue. 2, February- 2014, pg. 01-14 ISSN: 2348-1358
© 2014, IJAAST All Rights Reserved, www.ijaast.com 6
Stability measures
Stability regression techniques were used to characterized genotypic adaptability
through the use of the following statistics;
Varietal mean,
Regression coefficient (b)
Deviation from regression (δ2)
Ecovalence (W2) (Ecovariance)
Coefficient of variation (CV %)
Coefficient of determination (R2)
The statistics for the measure of genotypic stability are defined as follows;
Genotype mean, i=-
Genotypic variance si2
=
Coefficient of variation, CV% = )x100
Ecovalence, Wi2= (Ỳij -Ỳi-Ỳj +Y)
Shukla‟s (1972) stability variance, (δ2) =
Where;
SS (GE) =∑iWi2=∑i∑j(
2
Ỳij= observed mean of genotype in environment j
Ỳi= mean over environments for genotype j ∑j Ỳij/q
Ỳ= grand mean of all observations=∑i∑jỲij/pq
q =number of environments
p = number of genotypes
T. Vange et al, International Journal of Advances in Agricultural Science and Technology,
Vol.2 Issue. 2, February- 2014, pg. 01-14 ISSN: 2348-1358
© 2014, IJAAST All Rights Reserved, www.ijaast.com 7
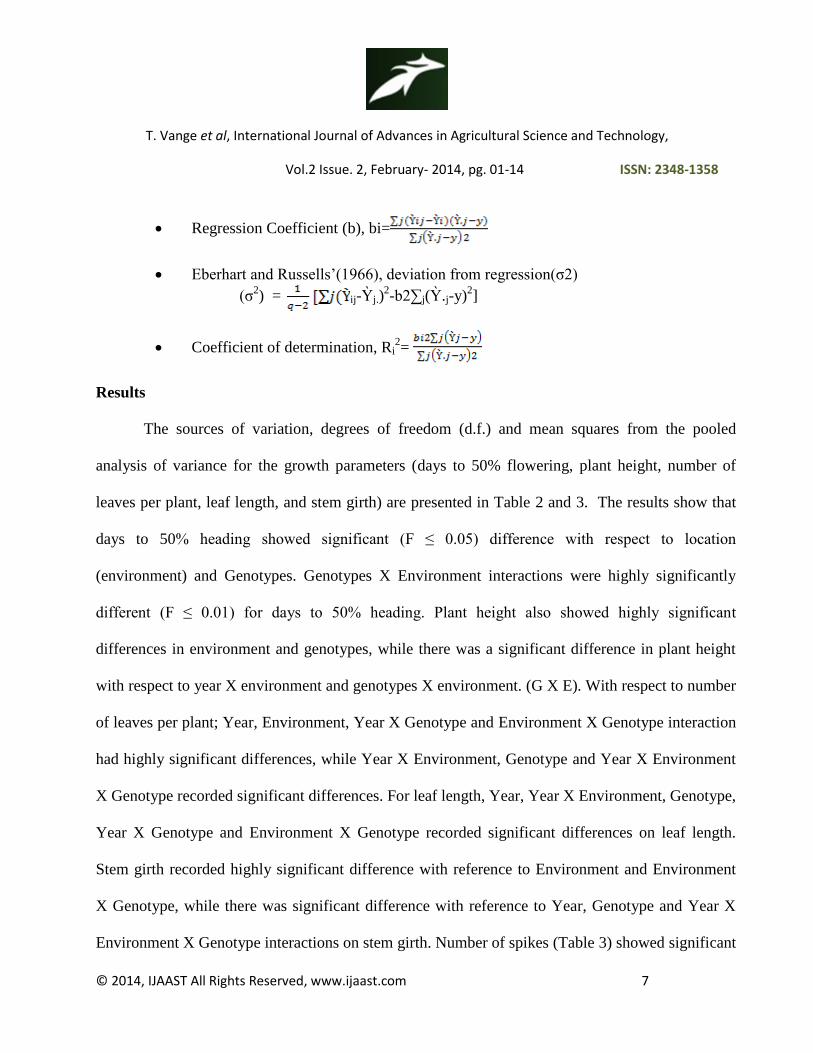
Regression Coefficient (b), bi=
Eberhart and Russells‟(1966), deviation from regression(σ2)
(σ2) = ij-Ỳj.)
2-b2∑j(Ỳ.j-y)
2]
Coefficient of determination, Ri2=
Results
The sources of variation, degrees of freedom (d.f.) and mean squares from the pooled
analysis of variance for the growth parameters (days to 50% flowering, plant height, number of
leaves per plant, leaf length, and stem girth) are presented in Table 2 and 3. The results show that
days to 50% heading showed significant (F ≤ 0.05) difference with respect to location
(environment) and Genotypes. Genotypes X Environment interactions were highly significantly
different (F ≤ 0.01) for days to 50% heading. Plant height also showed highly significant
differences in environment and genotypes, while there was a significant difference in plant height
with respect to year X environment and genotypes X environment. (G X E). With respect to number
of leaves per plant; Year, Environment, Year X Genotype and Environment X Genotype interaction
had highly significant differences, while Year X Environment, Genotype and Year X Environment
X Genotype recorded significant differences. For leaf length, Year, Year X Environment, Genotype,
Year X Genotype and Environment X Genotype recorded significant differences on leaf length.
Stem girth recorded highly significant difference with reference to Environment and Environment
X Genotype, while there was significant difference with reference to Year, Genotype and Year X
Environment X Genotype interactions on stem girth. Number of spikes (Table 3) showed significant
T. Vange et al, International Journal of Advances in Agricultural Science and Technology,
Vol.2 Issue. 2, February- 2014, pg. 01-14 ISSN: 2348-1358
© 2014, IJAAST All Rights Reserved, www.ijaast.com 8
differences on Year and Year X Environment interaction and highly significant difference on
Environment, Genotype and Environment X Genotype interaction. Panicle weight had significant
difference with reference to Year and showed highly significant difference with reference to the
Environment, Genotype and Environment X Genotype. With reference to 1000 seed weight, the
result showed highly significant differences on the Environment, Genotype and Environment X
Genotype interactions. The result also showed significant differences with reference to Year and
Environment on Chaff weight, while Environment X Genotype interaction showed highly
significant difference with reference to Chaff weight. For grain yield (Table 3) the result revealed
significant differences with reference to Year and Genotype and highly significant differences with
respect to the Environment and Environment X Genotype interactions.
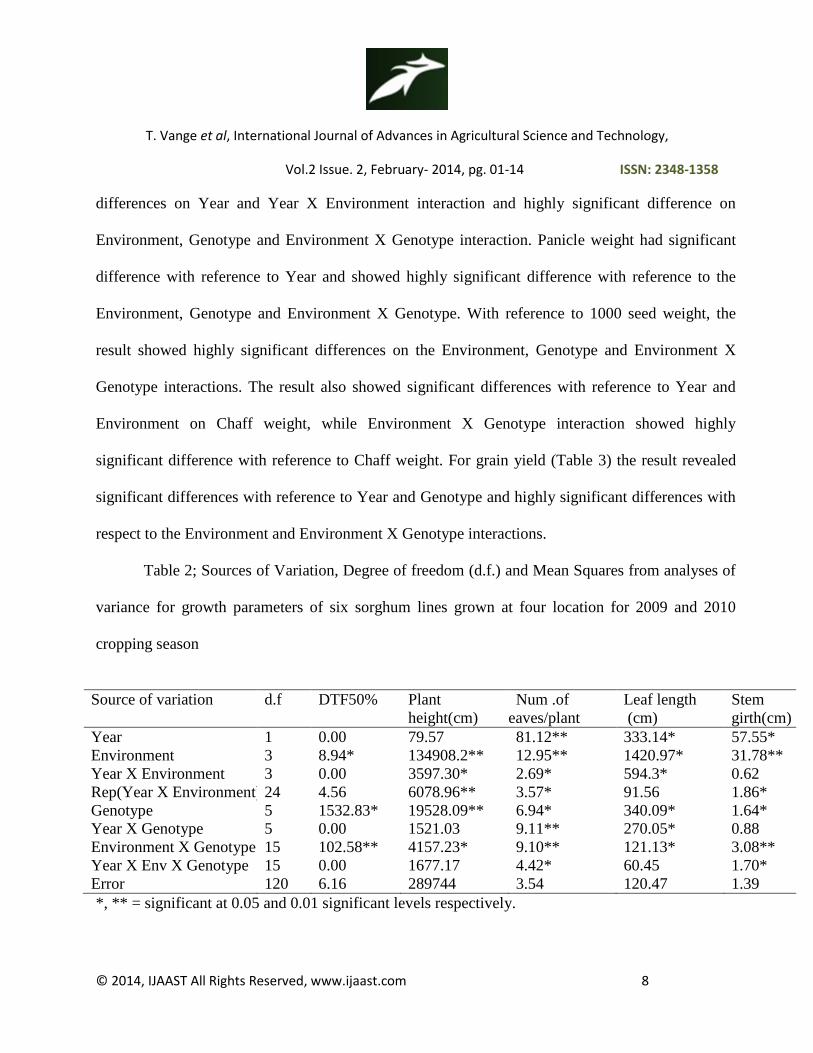
Table 2; Sources of Variation, Degree of freedom (d.f.) and Mean Squares from analyses of
variance for growth parameters of six sorghum lines grown at four location for 2009 and 2010
cropping season
Source of variation d.f DTF50% Plant
height(cm)
Num .of
leaves/plant
Leaf length
(cm)
Stem
girth(cm)
Year 1 0.00 79.57 81.12** 333.14* 57.55*
Environment 3 8.94* 134908.2** 12.95** 1420.97* 31.78**
Year X Environment 3 0.00 3597.30* 2.69* 594.3* 0.62
Rep(Year X Environment) 24 4.56 6078.96** 3.57* 91.56 1.86*
Genotype 5 1532.83* 19528.09** 6.94* 340.09* 1.64*
Year X Genotype 5 0.00 1521.03 9.11** 270.05* 0.88
Environment X Genotype 15 102.58** 4157.23* 9.10** 121.13* 3.08**
Year X Env X Genotype 15 0.00 1677.17 4.42* 60.45 1.70*
Error 120 6.16 289744 3.54 120.47 1.39
*, ** = significant at 0.05 and 0.01 significant levels respectively.
T. Vange et al, International Journal of Advances in Agricultural Science and Technology,
Vol.2 Issue. 2, February- 2014, pg. 01-14 ISSN: 2348-1358
© 2014, IJAAST All Rights Reserved, www.ijaast.com 9
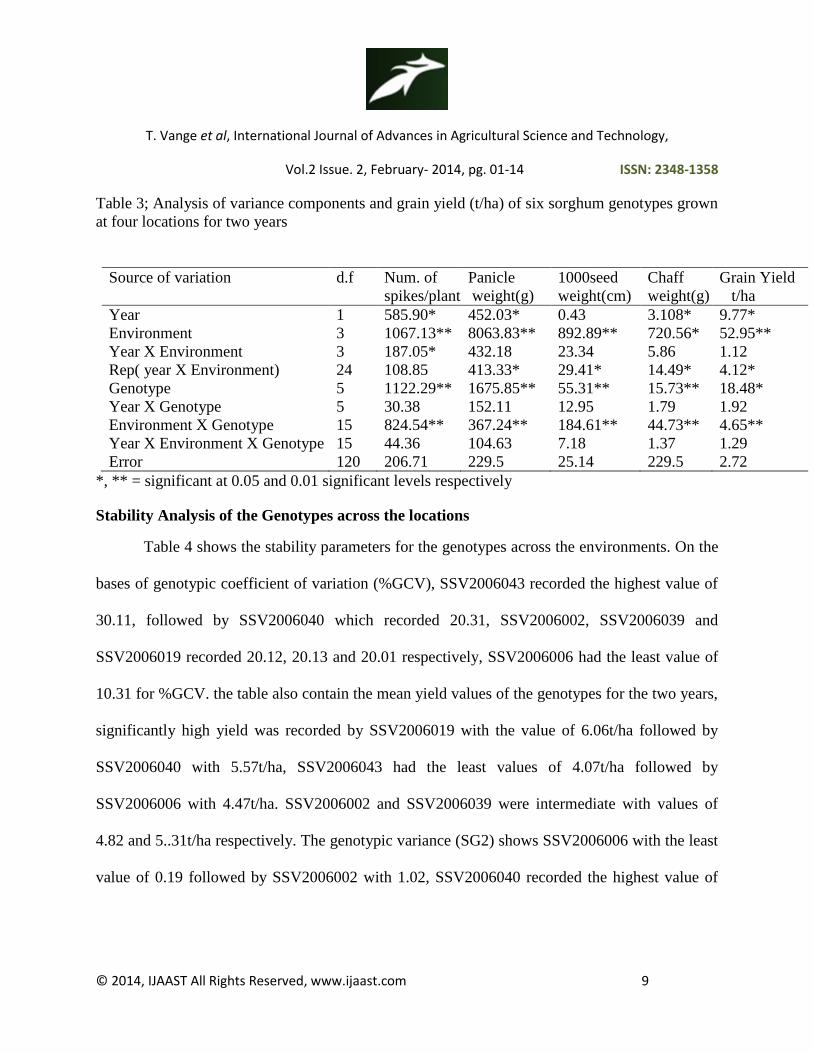
Table 3; Analysis of variance components and grain yield (t/ha) of six sorghum genotypes grown
at four locations for two years
Source of variation d.f Num. of
spikes/plant
Panicle
weight(g)
1000seed
weight(cm)
Chaff
weight(g)
Grain Yield
t/ha
Year 1 585.90* 452.03* 0.43 3.108* 9.77*
Environment 3 1067.13** 8063.83** 892.89** 720.56* 52.95**
Year X Environment 3 187.05* 432.18 23.34 5.86 1.12
Rep( year X Environment) 24 108.85 413.33* 29.41* 14.49* 4.12*
Genotype 5 1122.29** 1675.85** 55.31** 15.73** 18.48*
Year X Genotype 5 30.38 152.11 12.95 1.79 1.92
Environment X Genotype 15 824.54** 367.24** 184.61** 44.73** 4.65**
Year X Environment X Genotype 15 44.36 104.63 7.18 1.37 1.29
Error 120 206.71 229.5 25.14 229.5 2.72
*, ** = significant at 0.05 and 0.01 significant levels respectively
Stability Analysis of the Genotypes across the locations
Table 4 shows the stability parameters for the genotypes across the environments. On the
bases of genotypic coefficient of variation (%GCV), SSV2006043 recorded the highest value of
30.11, followed by SSV2006040 which recorded 20.31, SSV2006002, SSV2006039 and
SSV2006019 recorded 20.12, 20.13 and 20.01 respectively, SSV2006006 had the least value of
10.31 for %GCV. the table also contain the mean yield values of the genotypes for the two years,
significantly high yield was recorded by SSV2006019 with the value of 6.06t/ha followed by
SSV2006040 with 5.57t/ha, SSV2006043 had the least values of 4.07t/ha followed by
SSV2006006 with 4.47t/ha. SSV2006002 and SSV2006039 were intermediate with values of
4.82 and 5..31t/ha respectively. The genotypic variance (SG2) shows SSV2006006 with the least
value of 0.19 followed by SSV2006002 with 1.02, SSV2006040 recorded the highest value of
T. Vange et al, International Journal of Advances in Agricultural Science and Technology,
Vol.2 Issue. 2, February- 2014, pg. 01-14 ISSN: 2348-1358
© 2014, IJAAST All Rights Reserved, www.ijaast.com 10
1.97 followed by SSV2006043 and SSV2006039 with 1.46 and 1.45 respectively while
SSV2006019 was intermediate with value of 1.05.
Ecovalence (W2) showed SSV2006006 recorded 0.09, SSV2006039 recorded 0.003, and
SSV2006019 recorded the highest value of 0.28 followed by SSV2006043 with 0.26, while
SSV2006002 and SSV2006040 were intermediate with 0.13 and 0.14 respectively. With respect
to stability variance (σ2), SSV2006019 recorded the highest value of 0.16 followed by
SSV2006002 and SSV2006040 with values of 0.05 and 0.051 respectively. SSV2006043
recorded the least value of -0.02 followed by SSV2006039 with-0.023, SSV2006006 recorded
intermediate values of 0.030.
The regression slope (b) shows SSV2006006 had 1.51, SSV2006040 with 1.01,
SSV2006019 recorded 0.99, and SSV2006043 recorded 0.67 followed by SSV2006002 which
had 0.76. Deviation from mean squares shows SSSV2006019 with 1.43 followed by
SSV2006040, SSV2006006 showed a value of -16.02 followed by SSV2006039 with -4.46
followed SSV2006002 with -2.71. The coefficient of determination is shown in table 4,
SSV2006043 have the highest value of 0.0005 followed by SSV2006002 with 0.0004 and
SSV2006006 with 0.0004 also, the least value was from SSV2006019 had 0.0003 while
SSV2006039 and SSV2006040 were intermediate with the value of 0.0003 each.

T. Vange et al, International Journal of Advances in Agricultural Science and Technology,
Vol.2 Issue. 2, February- 2014, pg. 01-14 ISSN: 2348-1358
© 2014, IJAAST All Rights Reserved, www.ijaast.com 11
Table 4; Stability parameters and mean values for grain yield of sorghum genotypes grown at four
locations in two years.
Stability parameters Sorghum lines
SS
V200600
2
SS
V2006006
SS
V2006019
SS
V2006039
SS
V2006040
SS
V2006043
Mean yield t/ha 4.82 4.47 6.06 5.31 5.57 4.07
Genotypic variance(SG2) 1.02 0.19 1.05 1.45 1.97 1.46
Ecovalence (W2) 0.13 0.09 0.28 0.003 0.14 0.26
Genotypic coefficient of f
variation((%GCV)
20.12 10.31 20.13 20.01 20.31 30.11
Stability variance (σ2) 0.050 0.030 0.160 -0.023 0.051 -0.02
Regression slope (b) 0.76 1.51 0.99 0.84 1.01 0.67
Deviation mean square (δ2) -2.71 -16.02 1.403 -4.46 0.65 -0.59
Coefficient of determination (R2) .0004 .0004 .0002 .0003 .0003 .0005
Standard error (SE) ±1.95 ±1.55 ±2.03 ±2.11 ±2.83 ±1.48
Deviation from Regression 0.070 0.610 0.660 0.690 1.660 2.180
Discussion
The analysis of variance of the data showed that the difference among the genotypic
mean yield was statistically significant, therefore stability analysis was performed for grain yield
using regression coefficient (Finlay and Wilkinson, 1963), Genotypic Variance, Ecovalence,
Genotypic Coefficient of variation, Stability Variance and the mean squares of deviation from
regression (S2d) (Eberhart and Russell, 1966).
Stability Measure
The mean yield of all the sorghum genotypes at each location was used as an estimate of
the environmental yield. Mean yield ranged from 6.53t/ha for Lafia, to 4.22t/ha for Samaru. The
T. Vange et al, International Journal of Advances in Agricultural Science and Technology,
Vol.2 Issue. 2, February- 2014, pg. 01-14 ISSN: 2348-1358
© 2014, IJAAST All Rights Reserved, www.ijaast.com 12
soil structure, texture, fertility and rain fall might have contributed towards this variation.
Adeyemo and Fakorede, (1990), Malik et al, (1989) implicated these environmental factors in
their studies. Thus testing genotypes over different locations differing in unpredictable
environmental variation is a suitable approach for selecting stable genotypes (Eberhart and
Russell, 1966).
The mean squares indicated highly significant differences for genotypes and environments
indicating that there were tangible differences among the environments as well as the genotypes.
Also genotype x environment interaction was significant showing that the relative performances
of the genotypes were significantly affected by varying environmental conditions. Abba and
Showemimo, (2000), Yan and Hunt, (2001), Poelman, (1959) reported variously significant
genotype x environment interactions on sorghum seed per head, head length, grain weight per
head, 1000 seed weight, stem girth, and number of seed per head. They observed that yield
stability is expected since most of the measured characters are directly and significantly
correlated to yield. The significant genotype x environment effects for the characters underlines
the importance of breeding for stable yield in sorghum plants. Similarly in the present study,
most of the sorghum growth traits showed significant genotype x environment interaction effects
including grain yield.
The highest yield genotype was SSV2006019 (6.06t/ha) while the least yield was
SSV2006043 (4.02t/ha), based on the stability parameters, Genotypes SSV2006019, SSV2006039
and SSV2006040 with ecovalence values of 0.28, 0.003 and 0.14 and b values of 0.99, 0.84 and
T. Vange et al, International Journal of Advances in Agricultural Science and Technology,
Vol.2 Issue. 2, February- 2014, pg. 01-14 ISSN: 2348-1358
© 2014, IJAAST All Rights Reserved, www.ijaast.com 13
1.01 respectively appeared to be stable and adopted to the test environments while SSV2006002
and SSV2006006 with yield values of 4.82 and 4.47t/ha respectively appears to be good for poor
environments.
References
Aba, D. A, Showemimo, F.A and Yeye M. (1995) Genotype X Environment in sorghum (Sorghum
bicolor (L) moench) trial. Paper presented at the 7th annual conference of botanical society of
Nigeria. ABU Zaria.
Aba, D.A., Alhassan, U. and Yeye, M.Y. (2007). Genetic Diversity among Nigerian Elite Sorghum lines
for malting. Journal of Arid Agriculture. Vol.17, 1-5.
Acquaah, G. (2005). Principle of crop production, theory, techniques and technology. Prentice Hall,
Upper Saddle River, NJ.
Adeyemo M.O and Fakorede M.A.B (1990). Stability and environmental responses of top cross hybrids,
varietal hybrids and open pollinating cultivars of maize.Turrialba. 40(3d) 288-303.
Aldrich, S.R, (1945), Maturity measurements in corn an indication that grain development continues after
premature cutting. Agron.J. 35; 667-680.
Alhassan, W.S., (1989) the potentials of sorghum straw as livestock feed in Nigeria. Paper presented at a
symposium on the current status potential of industrial uses of sorghum in Nigeria. Kano Dec,
15th 6
th
Alhassan, W.S., Enoche, O.W and Adu, I.F (1986), Influence of graded levels of cotton seed cakes
supplementation on nutritive value of cereal straw fed to sheep and goats, J. of Animal Prod. Res.
6; 39-53
Aribissala, W.A, (1989), Simplified classification of cultivated sorghums. Crop Sc. J. 11; 162-166
Becker. H.C and Leon J (1988), Stability analysis in plant breeding. Plant breeding.101, 1-23.
Benue State Agricultural Development Project,(2000). Agricultural Recommendations for Benue state.
Extension Bulletin No.3.
Chaudhary, B. D and Singh, R. K. (1976), Biometrical methods in Quantitative Genetic Analysis 253-
280.
Chaudhary, B.R and Joshi, P, (2001), Genetic diversity in advanced derivatives of Brassica interspecific
hybrids. Euphytica, 121, 1-7
T. Vange et al, International Journal of Advances in Agricultural Science and Technology,
Vol.2 Issue. 2, February- 2014, pg. 01-14 ISSN: 2348-1358
© 2014, IJAAST All Rights Reserved, www.ijaast.com 14
David, A., Van Sand Ford and Henry, U. (1995), Inheritance of tillering in a winter wheat population.
Crop science 35. 1566-1569.
Dendy,D.A.V, (1995). Sorghum and Millet; chemistry and technology. American association of cereals
Chemist. St.Paul MN.
Dewar.J, (2003). Influence of malting on sorghum grain protein. CSIR. Environmental. Long man
scientific and technical Co. Ltd. pp 200-209.
Dogget, H. (1988), Sorghum, Longman scientific and Technical Co.Ltd. Pp250-256
Eberhart, S.A., and Russell, W.A, (1966) stability parameters for comparing varieties. Crop sci.6:36-
40pp.
FAO., (1982) Food and Agriculture organization year book, vol.36. FAO Rome.
Finlay, K.W., Wilkinson G.N, (1963), the analysis of adaptation in a plant breeding program. Aust. J.
Agric. Res. 14, 742-754.
Malik, I., A. Ali, M. Saleem and G.R, Tahir., (1989), Yield Stability of induced early maturing mutant of
Mung bean (Vigna radiate) and their use in a multiple cropping system. Field crop Research.
20(4), 251-259,
Obilana, A.T (1984), Sorghum crop improvement in cropping scheme meeting, notes on cereal research
program.IAR-ABU Samaru, Zaria, Nigeria.
Poelman, J.M., (1959), Breeding field crops, Avi, publishing company 29-53pp.
SAS/STAT software, version 9.2 of the SAS systems for windows. Copy right @(2008), SAS institute
inc.2008, cary, N C USA.
Singh, R. K. and B. D. Choudhary,(1979). Biometrical Methods in Quantitative Genetic Analysis.
Revised ed. Kalyani Publishers, New Delhi. pp. 57.
Steel R.G.D., and Torie, J.H., (1980), Principles and procedure of statistics. A biometrical approach. M.C
Graw-Hill N.Y 195-233pp.
Vange, T., and Elutede, A.O.,(2004), Forecasting low land rice (Oriza stiva) panicle grain yield from
plant characteristics measurement under rain fed conditions in southern Guinea savanna of Benue
state. J. of sustainable Tropical Agricultural Research.10: 122-127.
Yan W., and Hunt, L.A.,(2001), Interpretation of genotype X Environmental interaction for winter wheat
yields in Ontario. Crop sci. 41(1): 19-25.
Copyright © 2022 FDOKUMEN