Computational Studies Across Catalysis
147
HAL Id: tel-01727176 https://tel.archives-ouvertes.fr/tel-01727176 Submitted on 8 Mar 2018 HAL is a multi-disciplinary open access archive for the deposit and dissemination of sci- entific research documents, whether they are pub- lished or not. The documents may come from teaching and research institutions in France or abroad, or from public or private research centers. L’archive ouverte pluridisciplinaire HAL, est destinée au dépôt et à la diffusion de documents scientifiques de niveau recherche, publiés ou non, émanant des établissements d’enseignement et de recherche français ou étrangers, des laboratoires publics ou privés. Computational Studies Across Catalysis Carine Michel To cite this version: Carine Michel. Computational Studies Across Catalysis. Theoretical and/or physical chemistry. Ecole Normale Supérieure de Lyon, 2016. tel-01727176
-
Upload
khangminh22 -
Category
Documents
-
view
1 -
download
0
Transcript of Computational Studies Across Catalysis
HAL Id: tel-01727176https://tel.archives-ouvertes.fr/tel-01727176
Submitted on 8 Mar 2018
HAL is a multi-disciplinary open accessarchive for the deposit and dissemination of sci-entific research documents, whether they are pub-lished or not. The documents may come fromteaching and research institutions in France orabroad, or from public or private research centers.
L’archive ouverte pluridisciplinaire HAL, estdestinée au dépôt et à la diffusion de documentsscientifiques de niveau recherche, publiés ou non,émanant des établissements d’enseignement et derecherche français ou étrangers, des laboratoirespublics ou privés.
Computational Studies Across CatalysisCarine Michel
To cite this version:Carine Michel. Computational Studies Across Catalysis. Theoretical and/or physical chemistry. EcoleNormale Supérieure de Lyon, 2016. �tel-01727176�

HABILITATION À DIRIGER DES RECHERCHES
Présentée le 8 juin 2016
En vue d’obtenir l’Habilitation à diriger des Recherches
de l’Ecole Normale Supérieure de Lyon
Par Carine MICHEL
Computational StudiesAcross Catalysis
Les Membres du Jury sont :
Pr. Núria López RapporteurPr. Anastassia Alexandrova RapporteurDr. Dorothée Berthomieux RapporteurPr. Anne Milet MembrePr. Christophe Coutanceau MembreDr. Philippe Marion MembreDr. Philippe Sautet Membre

2 ∑

ABSTRACT
My research activities focus on the theoretical study of chemical re-activity catalysis and green chemistry. Based on models and simu-lations and strong collaborations with experimentalists, this researchaims at establishing structure/catalytic activity relationships to promotea rational and efficient development of new catalysts in homogeneouscatalysis, heterogeneous catalysis and electrocatalysis. My main am-bition is to improve the models and methodologies beyond their limitsto provide a better understanding. For instance, with a simple micro-solvation effect, I could rationalize the impact of the water solvent onthe activity of metallic catalysts for the levulinic acid conversion into�-valerolactone. Solvent effects are even more crucial in electrocatal-ysis as shown recently on the CO2 electroactivation. Thus, developingsolvatation models for heterogeneous interfaces is a clear milestone forthe coming years. Another challenge will be the constant improvementof the quality of the model of the catalyst in its steady state.
i

ii ∑

MERCI ! THANKS!
Mes recherches se sont construites au grès de rencontres marquantesqui m’ont fait progressée aussi bien scientifiquement qu’humainement.
Première rencontre fondamentale, celle qui restera toujours ma chef,Pr. Anne Milet qui m’a initié à la recherche, à la chimie théorique, àl’art de la collaboration et aux arcanes du monde universitaire. Deux-ième rencontre, Pr. Evert Jan Baerends, qui m’a fait confiance en melaissant ’trouver un nouveau sujet’ et monter une collaboration. Je penseà lui à chaque article que j’écris, lui qui m’a appris à écrire pour "mes"lecteurs. Enfin, mes derniers guides, Françoise Delbecq et PhilippeSautet, qui m’ont accueillie au Laboratoire de Chimie et surtout quim’ont accompagnée dans le monde fascinant de la Catalyse. Merci àeux deux pour leur patience, leur bienveillance, pour les échanges richeset passionnés, pour tout.
Je ne sais pas travailler seule, ces travaux de recherche sont tous lefruit de collaborations, que ce soit avec d’autres théoriciens aux com-pétences complémentaires ou avec des expérimentateurs de différentsdomaines. A chaque collaboration, de belles rencontres, des amitiés quise construisent. Rassembler autour d’un projet commun des collabo-rateurs est pour moi un moteur fort, et je suis très heureuse que celase concrétise à travers le projet Tanopol. A tous mes collaborateurs,passés, présents et même futurs, merci!
Et surtout, cette habilitation s’est construite grâce aux étudiants quim’ont fait confiance et ils sont nombreux. De ma première stagiaire,Lise Morlet à Stephan Steinmann, post-doc recruté au CNRS, j’ai unepensée pour chacun, que chacun trouve sa voie! Tous m’ont appris
iii

iv ∑
à leur manière à accompagner, encadrer, guider sur le chemin de laRecherche. J’essaie à mon tour d’être une "bonne chef" et c’est un ap-prentissage de chaque jour! Merci à tous pour votre confiance et surtout. . . votre patience!
Le travail de recherche ne peut se faire sans le groupe de ChimieThéorique, membres passés et présents, le Laboratoire et tous ceux en"soutien à la recherche", du pôle de gestion aux informaticiens, du Lab-oratoire de Chimie aux services de l’ENS de Lyon et du CNRS, merci àtous pour votre soutien!
Pour finir, mon infinie reconnaissance à mes proches, amis, famille.Nicolas, Mathilde, Romane, merci!

CONTENTS
Introduction 3
1 Methodology 5
2 Single site catalysis 112.1 Oxidation of alkanes . . . . . . . . . . . . . . . . . . 122.2 Oxidation of alcohols . . . . . . . . . . . . . . . . . . 162.3 Coupling of CO2 and ethylene using Ni-Based systems 172.4 Amination of alcohols . . . . . . . . . . . . . . . . . . 182.5 What’s next? . . . . . . . . . . . . . . . . . . . . . . 18
3 Heterogeneous Catalysis 453.1 Complex reaction networks . . . . . . . . . . . . . . . 473.2 Effect of water solvent . . . . . . . . . . . . . . . . . 503.3 What’s next? . . . . . . . . . . . . . . . . . . . . . . 55
4 Electrocatalysis 954.1 Computational hydrogen electrode . . . . . . . . . . . 964.2 Inclusion of the potential . . . . . . . . . . . . . . . . 1004.3 What’s next? . . . . . . . . . . . . . . . . . . . . . . 100
5 Perspectives 123
Curriculum Vitae 127
Publication List 135
1

2 ∑CONTENTS

INTRODUCTION
My research activities focus on the theoretical study of chemical reac-tivity catalysis and green chemistry. Based on models and simulationsand strong collaborations with experimentalists, this research aims at es-tablishing structure/catalytic activity relationships to promote a rationaland efficient development of new catalysts. Nowadays, this approach isessential to ensure an efficient development of novel catalysts that aremore efficient and less polluting. I applied it in homogeneous catalysis,in heterogeneous catalysis and electrocatalysis, as reported in the threecorresponding chapters.
3

4 ∑CONTENTS
My main interest is the development of novel catalysts in the ever-growing domain of the conversion of biomass into platform moleculesneeded to advance the sustainable production of fuels and base chem-icals. In this domain, solvent effects can manifest in numerous ways,such as explicit participation in the mechanism (e.g., water-mediatedproton transfer) and the reaction rate constant (e.g., via electrostaticsdue to solvent re-organization). Solvent effects are even more crucial inelectrocatalysis. This account pushed us to propose to include solventeffects based on micro-solvation and more recently on a force-field de-velopment and free energy perturbation (Music project).
This manuscript is divided into chapters dedicated to Methodologyand then to different kinds of catalysis (homogeneous and single sitecatalysts, supported metallic catalysts, electrocatalysts). Each chapterdedicated to catalysis includes a summary of my research activities anda short selection of my articles. I have co-authored the references indi-cated in blue and red, the latter being also including at the end of thechapter. The last chapter is a synthesis of my research perspectives. Inappendix, my curriculum vitae and a list of my peer-reviewed publica-tions.
1
METHODOLOGY
My research is focused on the modeling of catalytic cycles of varioussystems. The first step is to evaluate the energetic and the structuresof the plausible intermediate and transition states along the catalyticcycle but also along potential side routes that could deactivate the cat-alyst. The evaluation of these reaction pathways require to make sev-eral choices: (i) choice of the model (ii) choice of the methodology tocompute the energies. Those choices are intrinsically interconnectedsince the most accurate methods are generally not affordable for themost accurate models. I mostly use the Density Functional Theory(DFT) as a good trade-off between cost and accuracy. At the crossingpoint between molecular chemistry and solid state physics, the studyof molecules adsorbed at metallic surfaces are challenging to describeaccurately and still highly rely on the use of the Generalized Gradi-ent Approximation (GGA), now often including dispersion correction(Grimme D32, dDsC7,8 or non-local functionals3). A recent bench-mark on the adsorption of insaturated molecules on Pt(111) againstsingle crystal adsorption calorimetry SCAC experiments demonstratesthat optPBE and PBE-DdSc are the best approaches we can afford now-days for this kind of system.11 In metallic heterogeneous catalysis, themetallic nanoparticles are described using a periodic finite slab of themost compact facet (typically a p(3x3) cell of a four layers slab). Thesolvent is generally modeled as a continuum model9 when available1,5
and by including few water molecules in a simple micro-solvation ap-
5
6 ∑Methodology
proach. More advanced models for describing the metal/water inter-face require methodological development. I have also collaborated withR. Bulo who is developing adaptive QM/MM approaches.10 However,those methods are not mature yet to tackle complex catalytic systems,especially for heterogeneous metallic systems. We are currently work-ing on development of novel strategies based on free energy perturba-tion to obtain solvation free energies, combined with the developmentof better force field for water/platinum interface (Music project).
Once the Gibbs free energy profiles are computed, we need efficienttools to extract the predicted variations in activity or selectivity. Thedata could be input to a micro-kinetics model to include the effect ofconcentration and get the turn-over frequency and the selectivity.6 Thereaction profile of a catalytic reaction can also be easily interpreted us-ing the energetic span framework that relates the energetic span of aprofile to the turn over frequency (TOF) of the catalyst.4 In short, therate-determining transition state is not necessarily the highest in energyof the reaction profile since this is not invariant with the choice of thestarting point in the cycle. It is neither the one corresponding to theelementary step with the highest activation energy. To determine therate determining transition state, one has to first compute the energydifference �E between each intermediate I and transition state TS inthe forward direction:
�E = E(TS)� E(I) if TS appears after I
�E = E(TS)� E(I) +�Gr
if TS appears before I
The rate determining transition state and the rate determining inter-mediate are the ones that maximize �E. And the corresponding �E isthe energetic span of the catalytic cycle. Those concepts are illustratedin Figure 1.1 and Figure 1.2.

∑Methodology 7
Figure 1.1: A typical Gibbs energy profile for the conversion of re-actants into products catalyzed by a heterogeneous catalyst with anexothermic Gibbs free energy. In this typical case, the adsorption ofthe reactants (R*) is followed by the highest transition state in energy.This step is exergonic, yielding to the intermediate Int1 that is stronglystabilized by the surface. The stability of this intermediate clearly con-trols the overall kinetics. This first step is followed by the step withthe higher activation energy of the profile. The subsequent intermediateInt2 is weakly stabilized by the surface and is quickly converted intothe product P* through the rate determining transition state.

8 ∑Methodology
Figure 1.2: A typical Gibbs energy profile for the catalytic conversionof reactants into products catalyzed by a heterogeneous catalyst with anexothermic Gibbs free energy. In this typical case, the rate determiningintermediate is Int, the rate determining transition state is TS1 and theenergetic span is given by �E = E(TS1)� E(Int) +�G
r
∑Methodology 9
Bibliography
[1] Fishman, M.; Zhuang, H. L.; Mathew, K.; Dirschka, W.; Hen-nig, R. G. Phys. Rev. B 2013, 87, 245402.
[2] Grimme, S.; Antony, J.; Ehrlich, S.; Krieg, H. J. Chem. Phys.2010, 132.
[3] Klimeš, J. c. v.; Bowler, D. R.; Michaelides, A. Phys. Rev. B:Condens. Matter 2011, 83, 195131.
[4] Kozuch, S.; Shaik, S. Acc. Chem. Res. 2011, 44, 101–110, PMID:21067215.
[5] Mathew, K.; Sundararaman, R.; Letchworth-Weaver, K.;Arias, T. A.; Hennig, R. G. J. Chem. Phys. 2014, 140.
[6] Medford, A. J.; Shi, C.; Hoffmann, M. J.; Lausche, A. C.;Fitzgibbon, S. R.; Bligaard, T.; Nørskov, J. K. Catal. Lett. 2015,145, 794–807.
[7] Steinmann, S. N.; Corminboeuf, C. J. Chem. Theory Comput.2011, 7, 3567.
[8] Steinmann, S. N.; Corminboeuf, C. J. Chem. Phys. 2011, 134.
[9] Tomasi, J.; Mennucci, B.; Cammi, R. Chem. Rev. 2005, 105,2999–3094, PMID: 16092826.
[10] Bulo, R. E.; Michel, C.; Fleurat-Lessard, P.; Sautet, P. Journal ofChemical Theory and Computation 2013, 9, 5567–5577.
[11] Gautier, S.; Steinmann, S. N.; Michel, C.; Fleurat-Lessard, P.;Sautet, P. Physical Chemistry Chemical Physics 2015, 17,28921–28930.

10 ∑Methodology

2
SINGLE SITE CATALYSIS
Introduction
After a PhD dedicated to mechanistic studies of molecular systems, Ihave chosen to work on homogeneous catalysts under the supervisionof Pr.Evert Jan Baerends in Amsterdam. There, I focused on C�H ox-idation, working on two different systems, leading to the publication ofthree articles.24, 22,25
Since then, I keep a research activity in this domain, in particularin collaboration with Rhodia and then Solvay (which tookover Rhodiafew years ago). Thanks to the support of Solvay, Prokopis Andrikopou-los was hired for 18 months as a postdoc to work on the screening ofhomogeneous catalysts for the alkane oxidation.21 Later, Wenping Guowas hired as a postdoc to work in collaboration with the E2P2L, a joinlaboratory between Solvay and the CNRS set in Shanghai, China. Hefocused on two reactions: (i) the CO2/ethylene reductive coupling23 (ii)the amination of alcohols. Those reactions were also considered in het-erogeneous catalysis, see later.
More recently, I have also started to work on the catalytic cleavageof C�C bond in lignin models in collaboration with T. Baker (uOttawa)and P. Fleurat-Lessard (Université de Bourgogne) in the context of theLIA Funcat. Last, I have been recently involved in the long-term collab-oration between Philippe Sautet and Christophe Copéret (ETH Zurich)on the understanding of single site heterogeneous catalysts for metathe-
11

12 ∑Single site catalysis
sis reaction, at the cross-section between homogeneous and heteroge-neous catalysis.
2.1 Oxidation of alkanes
The activation of C�H bonds in alkanes is central to several impor-tant industrial processes to upgrade petroleum derivatives into alcohols,alkenes and carbonyls. A typical example is the oxidation of the cy-clohexane into cyclohexanol, the first step to nylon-6. This major in-dustrial reaction is also one of the less efficient ones: in most cases,O2 from air is used as a final oxidant and the oxidation is catalyzed bycobalt or manganese derivatives at high temperature (160°C) in the K-Aprocess.10,13
In fine chemistry, most of the oxidant are still based on chromium ormanganese used in stoichiometric quantities and thus leading to the pro-duction of large quantities of toxic salt. The development of novel cata-lysts based preferentially on transition metals opens the road to greenerprocesses that are less demanding in energy and less polluting regardingthe production of toxic salts. Two majors challenges have to be faced inthis domain: (i) ensure the stability of the catalyst in those highly oxida-tive conditions (ii) avoid the over-oxidation when this is needed whileit is generally favored. oxidant The C�H activation can be performedusing either homogeneous or heterogeneous catalysts based on transi-tion metals. In both cases, a better comprehension of the mechanismis essential to a rational development of novel modern catalysts. Thosereactions involve the transfer of electron from the target to the catalystand then from the reduced catalyst to the final oxidant.
The oxidation reactions catalyzed by transition metals are mostlybelieved to follow a radical mechanism.11 However, experimental stud-ies of the Fenton reaction have questioned this dogma and demon-strated the crucial role of the high spin Fe(IV)��O moiety.4 Thosestudies were at the origin of a long-term project on this reaction lead

∑Single site catalysis 13
by Pr. E.J. Baerends. The C�H oxidation in alkane can be cat-alyzed by the Fe(IV)��O entity following a rebound mechanism in twosteps, as show in Figure 2.1. The C�H bond is activated by the elec-trophilic Fe(IV)��O, leading to a carbon radical intermediate togetherwith Fe(III)�OH. Then a rebound step results in the oxidized product(alcohol) and the reduced catalyst (Fe(II)).
Figure 2.1: Main steps involved in the oxidation of C�H bond by theFe(IV)��O moiety.
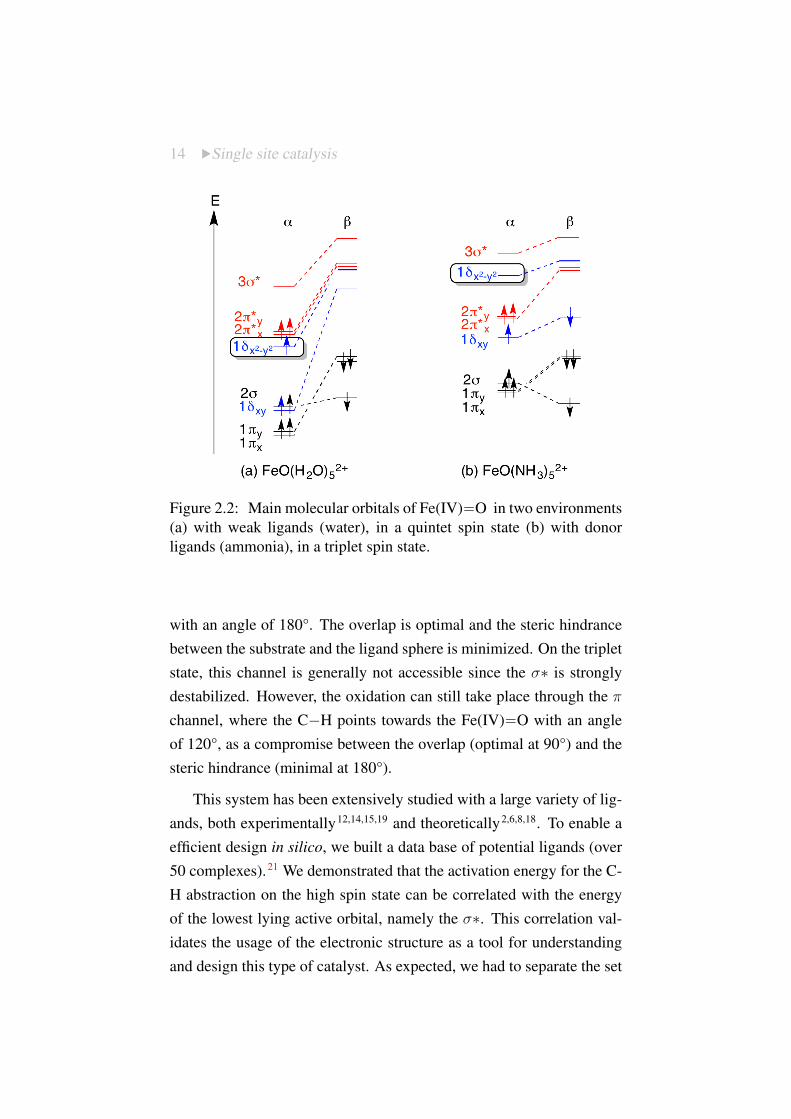
Since the catalyst acts as an electrophile, its oxidative ability liesin its lower active acceptor molecular orbital. To establish which or-bital controls the activity, one of the key aspects is the spin state of theFe(IV)��O. Two spin sates are generally accessible: the triplet state andthe quintet state. The spin gap varies with the ligand field. Weaker lig-ands such as water favors the high spin state while stronger ligands suchas ammonia destabilizes more the �
x
2+y
2 orbital and favors the tripletstate (see Figure 2.2). The change in the spin state results in a reductionof the exchange stabilization of the ↵ spin-orbitals. In the quintet state,the lowest acceptor orbital is the � ⇤ (↵). It is pushed up in energy uponthe replacement of weak ligands by stronger ligands as a result of twophenomena: the destabilizing stronger field and the reduction of the ex-change. Then, in the triplet state, the lowest acceptor orbital is not anymore the � ⇤ (↵) but the ⇡ ⇤ (�).
In a nutshell, depending on the ligand, two different spin states areaccessible, with two different electronic configurations. They lead totwo different reactive channels for the C�H bond cleavage. The corre-sponding transition states are represented in Figure 2.3. The quintet spinstate opens the � channel, where the C�H points towards the Fe(IV)��O
14 ∑Single site catalysis
Figure 2.2: Main molecular orbitals of Fe(IV)��O in two environments(a) with weak ligands (water), in a quintet spin state (b) with donorligands (ammonia), in a triplet spin state.
with an angle of 180°. The overlap is optimal and the steric hindrancebetween the substrate and the ligand sphere is minimized. On the tripletstate, this channel is generally not accessible since the �⇤ is stronglydestabilized. However, the oxidation can still take place through the ⇡
channel, where the C�H points towards the Fe(IV)��O with an angleof 120°, as a compromise between the overlap (optimal at 90°) and thesteric hindrance (minimal at 180°).
This system has been extensively studied with a large variety of lig-ands, both experimentally12,14,15,19 and theoretically2,6,8,18. To enable aefficient design in silico, we built a data base of potential ligands (over50 complexes).21 We demonstrated that the activation energy for the C-H abstraction on the high spin state can be correlated with the energyof the lowest lying active orbital, namely the �⇤. This correlation val-idates the usage of the electronic structure as a tool for understandingand design this type of catalyst. As expected, we had to separate the set

∑Single site catalysis 15
Figure 2.3: Transition state structures for the C�H cleavage as pro-moted by the Fe(IV)��O moiety in two different environments (a) withwater ligands, in a quintet spin state (b) with ammonia ligands, in atriplet spin state.
according to the total charge of the complex since the orbital energiesvary considerably with the electric field. In addition, we had to sepa-rate the monodentate ligands from the multidentate ones: for a given�⇤ orbital energy, the Fe(IV)��O is more active when coordinated bya multidentate ligand than with several monodentates. The solvent canalso tune the activity, a too high dielectric constant being detrimental.As a result of this study, we were able to propose to use (i) non-polarsolvent (the target alkane), (ii) polydentate ligands with weak coordina-tion sites (oxygen based) to ensure a high spin state, to our experimentalpartners in Solvay. 21
This Fe(IV)��O moiety is wide-spread. It can also be found in sev-eral enzymes such as P4503 and TauD16 and is postulated being theactive center in some zeolites.7 The screening in silico of the activityof M(H2O)2+
n , M=V,. . . ,Cu, shows that Fe is indeed special. Its appearsthat the number of 3d electrons in Fe(IV) is optimal to ensure that the⇡⇤ and �⇤ are low lying in energy but not filled up yet with electrons,

16 ∑Single site catalysis
that would increase the repulsion with the electrons of the �(C-H). 24
2.2 Oxidation of alcohols
The team of Pr. Reedijk has proposed a simple system based onCuBr2(Bipy)�TEMPO catalyst that is efficient and selective: while thesecondary alcohols are not oxidized, primary alcohols are converted se-lectively into the corresponding aldehyde.5 After a detailed study ofthe solvent effect, the counter-ions, etc, they have proposed a reactionmechanism involving a copper (II) center, coordinated by the TEMPOradical, the alcoholate and the bipyridine. In this case, the substrate ispostulated to be oxidized by a Cu-coordinated TEMPO· radical. How-ever, in the oxidation of alcohols, others postulate that the substrate isoxidized by uncoordinated TEMPO+.17
In collaboration with the group of Pr. Reedijk, we have performeda theoretical study of this catalytic cycle in collaboration with P. Belan-zoni et E.J. Baerends that refined this initial proposition.22,25 In the keystep, the copper (II) activates the TEMPO radical by a partial oxidation,favoring the proton transfer from the primary alcoholate to the nitro-gen of the TEMPO as shown in Figure 2.4. Based on a careful analysisof the electronic structure, we claimed that this Cu(bipy)2+/TEMPOcocatalyst system can be best viewed as electrophilic attack on the al-cohol C�H↵ bond by coordinated TEMPO+. This mechanism com-bines elements of the Semmelhack mechanism (oxidation of TEMPOto TEMPO+) and the Sheldon proposal (in the coordination sphere ofCu). The chemio-selectivity is ensured by the four methyl groups thatsurround the nitrogen. Those results open the door to a rational designof novel ligands that link the bipyridine and the TEMPO, for a catalystthat could be more efficient and easier to graft.

∑Single site catalysis 17
Figure 2.4: Key structure for the selective oxidation of CH3CH2OHinto CH3CHO as catalyzed by TEMPO - Cu(II)(bipy) system.
2.3 Coupling of CO2
and ethylene usingNi-Based systems
CO2 is a inert molecule, with a completely oxidized carbon. Its uti-lization as a C1 fragment, for instance to be coupled with an unsatu-rated molecule such as ethylene, requires strongly reducing conditions.In collaboration with Solvay, we focused on two strategies: (i) elec-trochemical activation (ii) using strong reductants such as complexedbased on Ni(0). In the later case, the major difficulty is to turn thisstœchiometric process into a catalytic one. The product is a very sta-ble nickel lactone. By addition of methyl iodide as an electrophile inlarge excess, the methylacrylate can then be recovered and the yield wastuned with different amine and phosphine ligands1,9 Based on an hybridapproach in collaboration with Pr. X. Xu, Shanghai, we demonstratedthat the choice of ligand has little effect on the main productive pathway.However, it has a significant influence on side reactions, which competewith the productive pathway and are detrimental to methyl acrylate for-mation. Finally, the need for a very large overstoichiometry of MeIfor a good yield of methyl acrylate is explained by the lower polarity

18 ∑Single site catalysis
of MeI, which avoids the stabilization of nonproductive intermediates.The nature of the limiting intermediates has been validated by compar-ing calculated and experimental vibrational spectra.23
2.4 Amination of alcohols
Wenping Guo worked also on the amination of alcohols catalyzed byaluminium triflate salts in collaboration with experimentalists from theE2P2L laboratory in Shanghai, China. The reaction mechanism is sim-ple. It is based on the nucleophilic substitution of the alcohol by theamine, catalyzed by the Lewis acid to favor the C�O rupture. The typi-cal benchmark reaction in the domain is the amination of benzyl alcoholby aniline. Our DFT study demonstrated that the catalyst has a highlylabile coordination sphere that is completed by both reactants and prod-ucts. Once the structure of the catalyst assessed, we focused on theimpact of the solvent and the nature of the alcohol and the amine, themain target being the amination of aliphatic alcohol by ammonia.
2.5 What’s next?
My research activities in the understanding of single sites catalysts willcontinue along two lines of research, both in collaboration with re-known experimental groups: (i) the lignin valorization with Pr. TomBaker, uOttawa in the context of the LIA Funcat (ii) characterization oftungsten supported catalysts for metathesis with Pr. Christophe Copéret,ETH Zurich, and Pr. Olga Safonova, Paul Scherrer Institute, Zurich, inthe context of the SNF-ANR Mascat.
2.5.1 Lignin valorization
The controlled depolymerization of the lignin part is currently highlychallenging and limits the potential of this feedstock as a source of

∑Single site catalysis 19
aromatics. The complexity lies in the high structural heterogeneityof lignin. This polymer is based on several monomers that are linkedthrough various types of bonds. This is illustrated in 2.5. The ratio ofmonomers and the occurrence of a given type of link depends on thesource (softwood, hardwood, etc.).20
Figure 2.5: A typical lignin polymer and the three common monolig-nols
The main idea is to design homogeneous catalysts that would se-lectively perform the oxidative cleavage of the C�C bond in the �-O-4 linkage, the most abundant in lignin. In the group of Tom Baker,they characterize the catalytic activity of vanadium-oxo complexes toselectively cleave the C�C bond (and not the ether bond) in modelmolecules. The mechanism is still rather speculative and a better un-derstanding would favor a rational design of those catalysts. In linewith our previous studies in the domain, we hope to provide guidelinesin a near future.

20 ∑Single site catalysis
2.5.2 Metathesis
Industrial heterogeneous alkene metathesis catalysts are based on sup-ported Mo and W oxides and contain very low concentrations of activesites (typically below 1%). These sites are presumably formed underoperating conditions from dispersed metal oxo species, and they havebeen proposed to correspond to oxo alkylidene species. Despite their in-dustrial use, the low activity in these catalysts – by comparison to theirhomogeneous homologues –raise several important questions: what isthe structure of the active sites, how are they formed, what are the nec-essary structural features for surface sites to become active, and finallyhow to tune catalysts preparation to increase the density of active sitesin order to increase the efficiency of the process.
To address these questions we suggest an original approach basedon the in situ characterization of the surface (active) sites at themolecular level at the precursor stage and during the catalytic event(in situ/operando), using in particular X-ray absorption fine structure(XAFS) and Raman spectroscopies combined with first principle den-sity functional theory (DFT) calculation.
Bibliography
[1] Bruckmeier, C.; Lehenmeier, M. W.; Reichardt, R.; Vagin, S.;Rieger, B. Organometallics 2010, 29, 2199–2202.
[2] Cho, K.-B.; Kim, E. J.; Seo, M. S.; Shaik, S.; Nam, W. Chem.Eur. J. 2012, 18, 10444–10453.
[3] Denisov, I. G.; Makris, T. M.; Sligar, S. G.; Schlichting, I. Chem.Rev. 2005, 105, 2253–2277.
[4] Ensing, B.; Buda, F.; Blöchl, P.; Baerends, E. J. Angew. Chem.Int. Ed. 2001, 40, 2893–2895.

∑Single site catalysis 21
[5] Gamez, P.; Arends, I. W.; Reedijk, J.; Sheldon, R. A. Chem.Commun. 2003, 2414–2415.
[6] Geng, C. Y.; Ye, S. F.; Neese, F. Angew. Chem. Int. Ed. 2010, 49,5717–5720.
[7] Gonzalez-Olmos, R.; Holzer, F.; Kopinke, F. D.; Georgi, A. Appl.Catal., A 2011, 398, 44–53.
[8] Kazaryan, A.; Baerends, E. J. ACS Catal. 2015, 5, 1475–1488.
[9] Lee, S. Y. T.; Cokoja, M.; Drees, M.; Li, Y.; Mink, J.; Her-rmann, W. A.; Kühn, F. E. ChemSusChem 2011, 4, 1275–1279.
[10] Li, H.; She, Y.; Wang, T. Frontiers of Chemical Science and En-gineering 2012, 6, 356–368.
[11] Limberg, C. Angew. Chem. Int. Ed. 2003, 42, 5932–5954.
[12] McDonald, A. R.; Guo, Y.; Vu, V. V.; Bominaar, E. L.;Munck, E.; Que, L. Chem. Sci. 2012, 3, 1680–1693.
[13] Musser, M. T. Ullmann’s Encyclopedia of Industrial Chemistry;Wiley-VCH Verlag GmbH & Co. KGaA, 2000.
[14] Nam, W. Acc. Chem. Res. 2015, 48, 2415–2423, PMID:26203519.
[15] Nam, W.; Lee, Y.-M.; Fukuzumi, S. Acc. Chem. Res. 2014, 47,1146–1154, PMID: 24524675.
[16] Price, J. C.; Barr, E. W.; Tirupati, B.; Bollinger, J. M.; Krebs, C.Biochemistry (Mosc.) 2003, 42, 7497–7508.
[17] Semmelhack, M.; Schmid, C. R.; Cortes, D. A.; Chou, C. S. J.Am. Chem. Soc. 1984, 106, 3374–3376.

22 ∑Single site catalysis
[18] de Visser, S. P.; Rohde, J.-U.; Lee, Y.-M.; Cho, J.; Nam, W. Co-ord Chem Rev 2013, 257, 381 – 393, A Tribute to Edward I.Solomon on his 65th Birthday: Part 2.
[19] Wang, D.; Ray, K.; Collins, M. J.; Farquhar, E. R.; Frisch, J. R.;Gomez, L.; Jackson, T. A.; Kerscher, M.; Waleska, A.;Comba, P.; Costas, M.; Que, L. Chem. Sci. 2013, 4, 282–291.
[20] Zakzeski, J.; Bruijnincx, P. C. A.; Jongerius, A. L.; Weckhuy-sen, B. M. Chem. Rev. 2010, 110, 3552–3599.
[21] Andrikopoulos, P. C.; Michel, C.; Chouzier, S.; Sautet, P. ACSCatalysis 2015, 5, 2490–2499 .
[22] Belanzoni, P.; Michel, C.; Baerends, E. J. Inorganic Chemistry2011, 50, 11896–11904 .
[23] Guo, W.; Michel, C.; Schwiedernoch, R.; Wischert, R.; Xu, X.;Sautet, P. Organometallics 2014, 33, 6369–6380, .
[24] Michel, C.; Baerends, E. J. Inorganic Chemistry 2009, 48, 3628–3638 .
[25] Michel, C.; Belanzoni, P.; Gamez, P.; Reedijk, J.; Baerends, E. J.Inorganic Chemistry 2009, 48, 11909–11920 .

What Singles out the FeO2+ Moiety? A Density-Functional Theory Studyof the Methane-to-Methanol Reaction Catalyzed by the First RowTransition-Metal Oxide Dications MO(H2O)p
2+, M ) V-Cu
Carine Michel and Evert Jan Baerends*
Theoretische Chemie, Vrije UniVersiteit Amsterdam, De Boelelaan 1083,1081 HV Amsterdam, The Netherlands
Received November 1, 2008
Metaloxo species are often postulated as key active species in oxidative catalysis. Among all, the quintet FeO2+
moiety is particularly widespread and active: aliphatic C-H bonds undergo hydroxylation easily through aH-abstraction/O-rebound mechanism. The high electrophilicity of quintet FeO2+ originates from its electronic structure:a low lying vacant σ* can accept electronic density from the aliphatic C-H bond. What singles out this quintetFeO2+? Its lowest vacant acceptor orbital energy? its shape (σ* vs π*)? or has its biological importance moresimply arisen from the high iron abundance? To answer those questions, we have performed density-functionaltheory calculations to study systematically the methane-to-methanol reaction catalyzed by MO(H2O)p
2+ complexes(M ) V, Cr, Mn, Fe, Co, p ) 5 and M ) Ni, Cu, p ) 4) in gas phase. We show here that the lower the MO2+
acceptor orbital lies in energy, the lower the H-abstraction barrier is in general. However, a σ* acceptor orbital ismuch more efficient than a π* acceptor orbital for a given energy. Finally, we found that indeed, the FeO2+ moietyis particularly efficient but also CoO2+ and MnO2+ could be good candidates to perform C-H hydroxylation.
Introduction
Homogeneous catalytic oxidation processes have attractedmuch attention for years for several reasons:1 (1) they areone of the most challenging processes to bring to satisfactorypeformance (yield, selectivities, sustainability, etc.); (2) theexisting processes often leave room for considerable im-provement; (3) involved mechanisms are quite complex(multiple pathways, multiple spin states); (4) they haveextensive applications in various areas from fine chemicalproduction2 to waste degradation or bleaching.3
Currently, the main challenge is the development of greenoxidative processes. To reach this goal, the stoichiometricoxidant has to be efficient, benign, and easily accessible.Dioxygen from air or hydrogen peroxide are the favoriteones, but they cannot oxidize directly and selectively alkanesinto more valuable functionalized products such as alcohols,
esters, aldehydes, ketones, and others.1,4 Among all, theselective conversion of methane into various oxidizedproducts, such as methanol and acetic acid, is particularlychallenging: methane is the most abundant and unreactivehydrocarbon, a cheap raw material, and a greenhouse gas.New mild green selective routes to convert methane intovaluable products could contribute to sustainable routes tomethanol or other oxidized products and also to methods tolower its present concentration in the atmosphere. A widelyused strategy in this field is to use transition metal complexesas catalysts together with a stoichiometric oxidant, such asdioxygen or peroxides. For instance, iron derivatives are usedin Fenton-like processes in bleaching.5,6 Manganese is a well-known key ingredient of the Jacobsen-Katsuki catalyst toperform alkene epoxidation.7 And now, (salen)manganesecomplexes can also perform asymmetric oxidation of the σC-H bond.8 Last but not least, vanadium complexes such
* To whom correspondence should be addressed. E-mail:[email protected].
(1) Barton, D.; Martell, A.; Sawyer, D.; Sheldon, R.; van Santen, R.Catalytic Oxidation: Principles and Applications; World Scientific:Singapore, 1995.
(2) Caron, S.; Dugger, R. W.; Gut Ruggeri, S.; Ragan, J. A.; Brown Ripin,D. H. Chem. ReV. 2006, 106, 2943–2989.
(3) Hage, R.; Lienke, A. Angew. Chem., Int. Ed. 2006, 45, 206–222.
(4) Simandi, L. Catalytic ActiVation of Dioxygen by Metal Complexes;Kluwer Academic Publishers: Dordrecht, 1992.
(5) Fenton, H. J. H. Chem. News 1876, 190.(6) Pignatello, J. J.; Oliveros, E.; MacKay, A. Crit. ReV. EnViron. Sci.
Technol. 2006, 36, 1–84.(7) Katsuki, T. Coord. Chem. ReV. 1995, 140, 189–214.(8) Katsuki, T. Synlett 2003, 3, 281–297.
Inorg. Chem. 2009, 48, 3628-3638
3628 Inorganic Chemistry, Vol. 48, No. 8, 2009 10.1021/ic802095m CCC: $40.75 © 2009 American Chemical SocietyPublished on Web 03/20/2009
∑Single site catalysis 23
Reprinted with permission from Inorg. Chem. 2009, 48, 3628-3638Copyright 2009 American Chemical Society
as amadavine derivatives can perform a single-pot conversionof methane into acetic acid in the presence of potassiumperoxodisulphate (K2S2O8).9-11 In all those examples, thepostulated active species is the MOn+ moiety: FeO2+ inFenton-like processes, MnO3 + in Jacobsen-Katsuki epoxi-dation,12 VO2+ in amadavine derivatives.
The most widely spread MOn+ moiety is the oxoiron(IV)(ferryl ion) FeO2+, well established in hydroxylating aliphaticC-H bonds.13 A well-known example is the active centerin heme iron enzymes such as cytochrome P450.14-17 Thereis also evidence of such a reactive moiety for some non-heme enzymes,18,19 for iron containing zeolites,20,21 forbiomimetic complexes,22 or for the Fenton reaction.23-25
This noticeable wide range of use, from enzymes to zeolitecatalysts, leads us to the following question: What singlesout FeO2+?
First of all, iron is the most abundant transition metal inthe Earth’s crust, easily accessible and cheap.26 This mayexplain why it is the most widespread co-factor of enzymesinvolved in oxidative processes for instance. But the mainreason may lie also in the reactivity of the FeO2+ moiety.The C-H hydroxylation by the FeO2+ moiety is generally
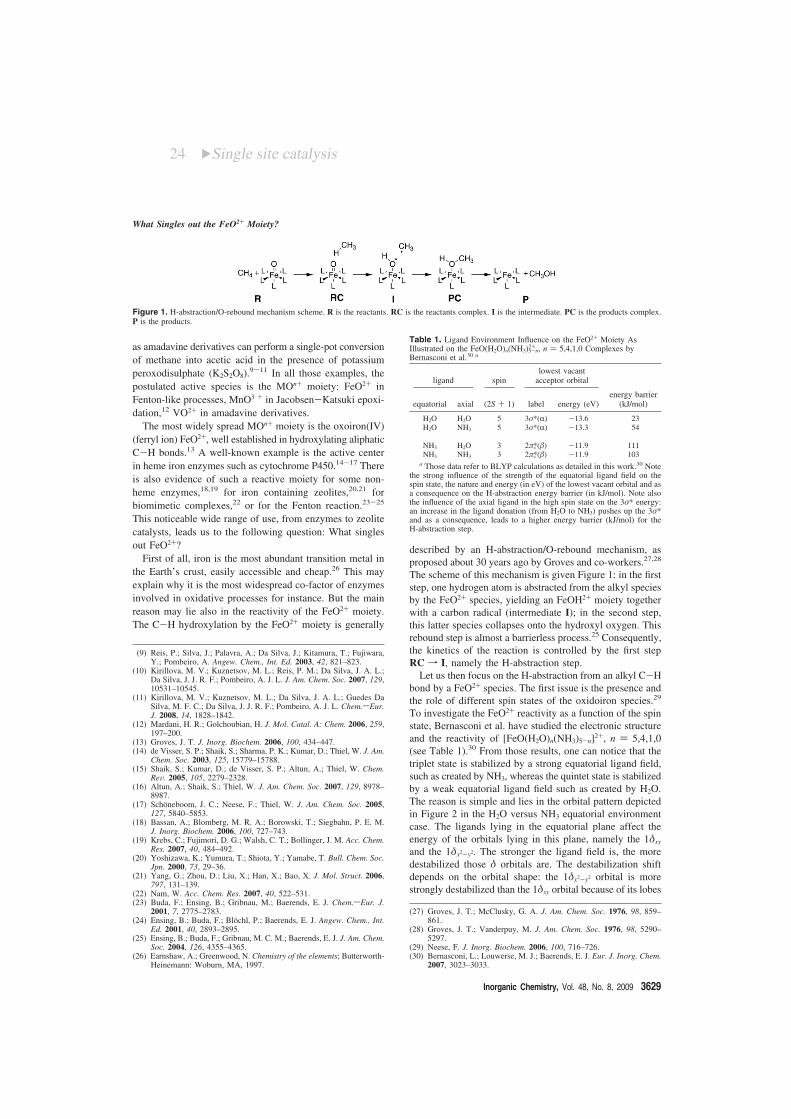
described by an H-abstraction/O-rebound mechanism, asproposed about 30 years ago by Groves and co-workers.27,28
The scheme of this mechanism is given Figure 1: in the firststep, one hydrogen atom is abstracted from the alkyl speciesby the FeO2+ species, yielding an FeOH2+ moiety togetherwith a carbon radical (intermediate I); in the second step,this latter species collapses onto the hydroxyl oxygen. Thisrebound step is almost a barrierless process.25 Consequently,the kinetics of the reaction is controlled by the first stepRC f I, namely the H-abstraction step.
Let us then focus on the H-abstraction from an alkyl C-Hbond by a FeO2+ species. The first issue is the presence andthe role of different spin states of the oxidoiron species.29
To investigate the FeO2+ reactivity as a function of the spinstate, Bernasconi et al. have studied the electronic structureand the reactivity of [FeO(H2O)n(NH3)5-n]2+, n ) 5,4,1,0(see Table 1).30 From those results, one can notice that thetriplet state is stabilized by a strong equatorial ligand field,such as created by NH3, whereas the quintet state is stabilizedby a weak equatorial ligand field such as created by H2O.The reason is simple and lies in the orbital pattern depictedin Figure 2 in the H2O versus NH3 equatorial environmentcase. The ligands lying in the equatorial plane affect theenergy of the orbitals lying in this plane, namely the 1δxy
and the 1δx2-y2. The stronger the ligand field is, the moredestabilized those δ orbitals are. The destabilization shiftdepends on the orbital shape: the 1δx2-y2 orbital is morestrongly destabilized than the 1δxy orbital because of its lobes
(9) Reis, P.; Silva, J.; Palavra, A.; Da Silva, J.; Kitamura, T.; Fujiwara,Y.; Pombeiro, A. Angew. Chem., Int. Ed. 2003, 42, 821–823.
(10) Kirillova, M. V.; Kuznetsov, M. L.; Reis, P. M.; Da Silva, J. A. L.;Da Silva, J. J. R. F.; Pombeiro, A. J. L. J. Am. Chem. Soc. 2007, 129,10531–10545.
(11) Kirillova, M. V.; Kuznetsov, M. L.; Da Silva, J. A. L.; Guedes DaSilva, M. F. C.; Da Silva, J. J. R. F.; Pombeiro, A. J. L. Chem.sEur.J. 2008, 14, 1828–1842.
(12) Mardani, H. R.; Golchoubian, H. J. Mol. Catal. A: Chem. 2006, 259,197–200.
(13) Groves, J. T. J. Inorg. Biochem. 2006, 100, 434–447.(14) de Visser, S. P.; Shaik, S.; Sharma, P. K.; Kumar, D.; Thiel, W. J. Am.
Chem. Soc. 2003, 125, 15779–15788.(15) Shaik, S.; Kumar, D.; de Visser, S. P.; Altun, A.; Thiel, W. Chem.
ReV. 2005, 105, 2279–2328.(16) Altun, A.; Shaik, S.; Thiel, W. J. Am. Chem. Soc. 2007, 129, 8978–
8987.(17) Schoneboom, J. C.; Neese, F.; Thiel, W. J. Am. Chem. Soc. 2005,
127, 5840–5853.(18) Bassan, A.; Blomberg, M. R. A.; Borowski, T.; Siegbahn, P. E. M.
J. Inorg. Biochem. 2006, 100, 727–743.(19) Krebs, C.; Fujimori, D. G.; Walsh, C. T.; Bollinger, J. M. Acc. Chem.
Res. 2007, 40, 484–492.(20) Yoshizawa, K.; Yumura, T.; Shiota, Y.; Yamabe, T. Bull. Chem. Soc.
Jpn. 2000, 73, 29–36.(21) Yang, G.; Zhou, D.; Liu, X.; Han, X.; Bao, X. J. Mol. Struct. 2006,
797, 131–139.(22) Nam, W. Acc. Chem. Res. 2007, 40, 522–531.(23) Buda, F.; Ensing, B.; Gribnau, M.; Baerends, E. J. Chem.sEur. J.
2001, 7, 2775–2783.(24) Ensing, B.; Buda, F.; Blochl, P.; Baerends, E. J. Angew. Chem., Int.
Ed. 2001, 40, 2893–2895.(25) Ensing, B.; Buda, F.; Gribnau, M. C. M.; Baerends, E. J. J. Am. Chem.
Soc. 2004, 126, 4355–4365.(26) Earnshaw, A.; Greenwood, N. Chemistry of the elements; Butterworth-
Heinemann: Woburn, MA, 1997.
(27) Groves, J. T.; McClusky, G. A. J. Am. Chem. Soc. 1976, 98, 859–861.
(28) Groves, J. T.; Vanderpuy, M. J. Am. Chem. Soc. 1976, 98, 5290–5297.
(29) Neese, F. J. Inorg. Biochem. 2006, 100, 716–726.(30) Bernasconi, L.; Louwerse, M. J.; Baerends, E. J. Eur. J. Inorg. Chem.
2007, 3023–3033.
Figure 1. H-abstraction/O-rebound mechanism scheme. R is the reactants. RC is the reactants complex. I is the intermediate. PC is the products complex.P is the products.
Table 1. Ligand Environment Influence on the FeO2+ Moiety AsIllustrated on the FeO(H2O)n(NH3)5-n
2+ , n ) 5,4,1,0 Complexes byBernasconi et al.30 a
ligand spinlowest vacant
acceptor orbital
equatorial axial (2S + 1) label energy (eV)energy barrier
(kJ/mol)
H2O H2O 5 3σ*(R) -13.6 23H2O NH3 5 3σ*(R) -13.3 54
NH3 H2O 3 2πx*($) -11.9 111NH3 NH3 3 2πx*($) -11.9 103
a Those data refer to BLYP calculations as detailed in this work.30 Notethe strong influence of the strength of the equatorial ligand field on thespin state, the nature and energy (in eV) of the lowest vacant orbital and asa consequence on the H-abstraction energy barrier (in kJ/mol). Note alsothe influence of the axial ligand in the high spin state on the 3σ* energy:an increase in the ligand donation (from H2O to NH3) pushes up the 3σ*and as a consequence, leads to a higher energy barrier (kJ/mol) for theH-abstraction step.
What Singles out the FeO2+ Moiety?
Inorganic Chemistry, Vol. 48, No. 8, 2009 3629
24 ∑Single site catalysis

pointing toward the ligands. When the destabilization is largeenough, the 1δx2-y2(R) becomes then so high-lying that itloses its electron in favor of the 1δxy($), the complex switchesfrom a high spin state (quintet) to a low spin state (triplet).
Thus, the spin state is essentially controlled by the strengthof the equatorial field through the differential δ orbital desta-bilization. What about the reactivity? It has already beenemphasized that the capability of the FeO2+ moiety to promoteH-abstraction is directly connected to its electrophilicity: theC-H bond breaking is induced by electron donation from thisC-H bond into a low lying empty molecular orbital of theFeO2+ species. This low lying empty orbital which acceptselectronic density from the substrate is the lowest acceptormolecular orbital. It can be different from the lowest unoccupiedmolecular orbital (LUMO). Indeed, because of the hindranceof equatorial ligands, 1δx2-y2 and 1δxy orbitals cannot acceptdensity from the substrate C-H bond, but they can be theLUMO. The nature and the energy level of the lowest acceptororbital depends on the spin state of this electrophilic species asillustrated by the [FeO(H2O)n(NH3)5-n]2+, n ) 5, 4, 1, 0 cases(see Table 1 and Figure 2). In a high spin configuration, theLUMO is the 1δxy($) orbital. The strong exchange field of thefour unpaired R electrons stabilizes significantly the R orbitals.As a consequence, the σ*(R) orbital is lying below the 2π*($)orbitals. It is the lowest acceptor orbital: it will accept electrondonation from the C-H bond during the H-abstraction step. Inthe low spin configuration, the exchange field stabilization isweaker; hence, the 2πx
*($) orbital is both the LUMO and thelowest acceptor orbital. As seen previously, the strength of theequatorial ligand field controls the relative position of the 1δenergy levelssfrom which follow the spin state and the natureof the lowest acceptor orbital. It also controls the global positionof the energy levels of the π and σ orbitals. Indeed, donatingligands such as NH3 induce a global stronger destabilization ofthose orbitals and as a consequence they reduce the FeO2+
electrophilicity. To conclude, the choice of the equatorial ligandsis crucial. A weak ligand field strongly enhances the electro-philicty of the FeO2+ moiety: (1) orbitals are relatively low lyingin energy, (2) the high spin state stabilizes the lowest lyingvacant orbital (3σ*(R)) by the strong exchange field.
Last but not least, what about the influence of the axialligand field? The axial ligand may affect the molecularorbitals lying along the z axis, namely the σ and π orbital.Indeed, according to Bernasconi et al.,30 a stronger σ-donat-ing ligand pushes up the 3σ*. Thus, the electrophilicity ofthe FeO2 is reduced, the H-abstraction energy barrier ishigher. For instance, replacing H2O by NH3 in axial positionof the FeO(H2O)5
2+ complex leads to a higher lying 3σ*(R)(from -13.6 eV to -13.3 eV) and a higher energy barrier(from 23 to 54 kJ/mol) (see Table 1). This effect can beused to tune the reactivity of a FeO2+ complex in high spinconfiguration.30,31
In summary: (1) a wide range of transition metals can beused to perform oxidation reactions; (2) the FeO2+ moietyis a widespread active species in alkyl hydroxylation, fromzeolites to enzymes; (3) the strong reactivity of the high spinFeO2+ moiety results from its electronic structure: the lowlying 3σ*(R) vacant orbital is responsible for its strongelectrophilicity, making it accept electrons even from poordonating entities such as aliphatic C-H bonds. We thusunderstand the role of the ligand environment on thereactivity of the FeO2+ species. In this article, we will focuson the role of the metal. We present here an extensive studyin gas phase of the methane-to-methanol reaction catalyzedby the first row transition-metal oxide-dications MO(H2O)p
2+
(M ) V, Cr, Mn, Fe, Co, p ) 5 and M ) Ni, Cu, p ) 4).The electronic structure analysis together with the reactivescheme for each complex allow us to discuss the relativeimportance of the vacant 3σ* compared with the vacant 2π*and to highlight the great importance of the “d count” onthe reactivity of those complexes.
Method
Level of Theory. All the calculations have been performed usingthe ADF (Amsterdam Density Functional) package,32-35 using theOPBE density functional.36,37 This functional has been chosen forits performance in describing close-lying spin states, in particularin iron complexes.38 In the ADF code, the electronic orbitals arewritten in terms of Slater-type orbitals (STO). We use a triple-%basis set with two polarization functions for the C, O, and H atomsand a quadruple zeta basis set with three polarization functions forthe transition metal atoms, as available in the ADF library ofstandard basis sets. Additionally, the calculations were correctedfor relativistic effects using the zero-order regular approximation(ZORA) approach.39,40 When needed, the frequencies are computed
(31) Bernasconi, L.; Baerends, E. J. Eur. J. Inorg. Chem. 2008, 1672–1681.
(32) Bickelhaupt, F.; Baerends, E. ReV. Comp. Chem. 2000, 15, 1–86.(33) Baerends, E. J.; Ellis, D. E.; Ros, P. Chem. Phys. 1973, 2, 41–51.(34) Velde, G. T.; Bickelhaupt, F. M.; Baerends, E. J.; Guerra, C. F.; Van
Gisbergen, S. J. A.; Snijders, J. G.; Ziegler, T. J. Comput. Chem. 2001,22, 931–967.
(35) SCM, ADF2006.01; Theoretical Chemistry,Vrije Universiteit Amster-dam: The Netherlands, 2006; http://www.scm.com/.
(36) Perdew, J. P.; Burke, K.; Ernzerhof, M. Phys. ReV. Lett. 1997, 78,1396.
(37) Cohen, A. J.; Handy, N. C. Mol. Phys. 2001, 99, 607–615.(38) Swart, M.; Ehlers, A.; Lammertsma, K. Mol. Phys. 2004, 102, 2467–
2474.(39) van Lenthe, E.; Baerends, E. J.; Snijders, J. G. J. Chem. Phys. 1994,
101, 9783–9792.(40) van Lenthe, E.; Ehlers, A.; Baerends, E. J. J. Chem. Phys. 1999, 110,
8943–8953.
Figure 2. Simplified molecular orbital diagram for FeO2+ moiety in twodifferent ligand environments: a weak equatorial ligand field environment(H2O; left panel) favors the quintet spin state; a strong equatorial ligandfield (NH3; right panel) favors the triplet spin state. The most importantorbitals are in color. The spin state is mainly controlled by the δ orbitals(in blue) whereas the reactivity is mainly controlled by the σ* orbital (highspin configuration) or the π* orbitals (low spin configuration) (in red).
Michel and Baerends
3630 Inorganic Chemistry, Vol. 48, No. 8, 2009
∑Single site catalysis 25

analytically. All the transition state structures have been character-ized by the presence of an imaginary frequency.
Chosen Systems. To better understand the reactivity of the MO2+
moiety toward aliphatic C-H bonds, it is crucial to take into accountits ligand environment. Indeed, as seen in the Introduction, itinfluences the electronic structure and the spin state of the MO2+
moiety, hence its reactivity toward a C-H bond. To study theinfluence of the metal, we have chosen to study a hydrated MO2+
moiety.First, the presence of ligands prevents methane from interacting
directly with the transition metal. For the bare oxo MO+ in gasphase, Shiota and Yoshizawa propose for instance a reactantcomplex OM-CH4
+ where the methane interacts directly with themetal and an intermediate HOM-CH3
+, which exhibits a metal-car-bon bond.41 Such a mechanism is strongly disadvantaged if themetal is surrounded by ligands.25
In our study of the influence of the “d count” on the reactivityof the MO2+ moiety, we have chosen to focus on the first rowtransition metal series, from vanadium to copper. The chosensystems are then the MO(H2O)p
2+ complexes (M ) V, Cr, Mn, Fe,Co, Ni, Cu). They can be divided into two groups according to thenumber p of water molecules in the first solvation shell of the MO2+
moiety.• p ) 5: for M ) V, Cr, Mn, Fe, Co, the MO(H2O)5
2+ complexis pseudo-octahedral, keeping almost the same geometry along theseries. The MdO distance is slightly increasing from 1.54 Å to1.59 Å when going from V to Co. The metal-water distances arebetween 2.05 Å and 2.15 Å in general (see the iron case in Figure4 and Table 2).
• p ) 4: for M ) Ni, Cu, the MO(H2O)42+ complex presents a
strongly distorted trigonal bipyramid geometry coordination, theoxo group lying in the trigonal plane (see Figure 5 and Table 2).Some species along the reaction path can afford an extra watermolecule such as NiO(H2O)4
2+ in high spin state (2S + 1 ) 5).However, most of the species along the reaction path cannot affordan extra water molecule in their coordination sphere: all attemptsto optimize the geometry of NiO(H2O)4
2+ in low spin state orCuO(H2O)4
2+ in both spin states result in the dissociation of onemetal-water bond. We therefore keep in all cases the coordinationshell constant at four water molecules along the entire reaction path.
Results and Discussion
First, we will focus on the electronic structure of the MO2+
moiety in the MO(H2O)p2+ complexes. Then, we will expose
the reaction scheme of the methane hydroxylation catalyzedby those complexes. Those results will provide us some cluesto answer the questions raised in the introduction: what isthe relative importance of the vacant 3σ* compared with thevacant 2π* orbital? what is the importance of the “d count”on the reactivity of the MO2+ species? what singles outFeO2+?
Electronic Structure of the MO2+ Moiety. The electronicstructure of the MO(H2O)p
2+ complex is reported in Table3. All along the series, the M-O bonding results from thefilling of the 1π and 2σ orbitals, which are M3d-O2p bondingorbitals. From V to Fe, each added electron occupies an extraR orbital, stabilized by the exchange field: 1δx2-y2(R) in thechromium complex, 2πx
*(R) in the manganese complex,2πy
*(R) in the iron complex. As a consequence, the spin stateincreases regularly from doublet to quintet. Then, the nextstep is cobalt. Whereas the spin state of the bare oxo complexCoO2+ is a sextet, the extra electron occupies a $ orbital(1δxy($)) in the CoO(H2O)5
2+ complex, leading to a quartet(41) Shiota, Y.; Yoshizawa, K. J. Am. Chem. Soc. 2000, 122, 12317–12326.
Figure 3. 2πx*(R) (left side) and 3σ(R)* (right side) molecular orbitals of
the MnO(H2O)52+ (top) and FeO(H2O)5
2+ (bottom) in the ground state.
Figure 4. Structure of FeO(H2O)52+, high spin state. Distances are given
in angstrom. See Table 2 for data on angles.
Table 2. Geometrical Data for MO(H2O)p2+, M ) Fe and p ) 5, M )
Ni, Cu and p ) 4 in Their Ground Statea
angle Fe Ni Cu
O1-M-O2 87.8 93.0 107.7O1-M-O3 92.7 87.8 94.6O1-M-O4 168.5 129.4 91.1O1-M-O5 95.0 110.3 108.0O1-M-O6 85.0
O2-M-O3 178.9 165.8 157.1O2-M-O4 87.2 85.9 87.2O2-M-O5 90.6 97.4 88.3O2-M-O6 90.3
O3-M-O4 91.9 82.6 87.6O3-M-O5 90.3 95.6 89.2O3-M-O6 88.8
O4-M-O5 95.5 119.9 160.7O4-M-O6 84.5
O4-M-O5 179.1a Angles are in degree. See Figure 4 and Figure 5 for notations.
What Singles out the FeO2+ Moiety?
Inorganic Chemistry, Vol. 48, No. 8, 2009 3631
26 ∑Single site catalysis

spin state for the ground state. Then, in nickel and copper,the extra electron occupies successively the 3σ*(R) and the1δx2-y2($), leading to two complexes with all 3d R orbitalsfilled.
We have already emphasized in the Introduction theimportance of the lowest lying acceptor orbital for theelectrophilic properties of the FeO2+ moiety. Along thisseries, it can be either a σ* orbital or a π* orbital. Theseorbitals are illustrated with plots of the 3σ*(R) and the2π*(R) for Mn and Fe complexes in Figure 3.
Table 4 gives some properties of the lowest vacant 3σ*,the lowest vacant 2π*, and the LUMO (which may or maynot be the 2π* or 3σ*): energy, spin, composition in termsof d metal and p oxygen percentage (%dM and %pO). InFigure 6, we plot the most important molecular orbitalenergies as a function of the metal: 2π*(R), 3σ*(R), 1δxy($),
1δx2-y2($), 2π*($), and 3σ*($) (in order of increasing energy).From this table and Figure 6, the first striking fact is thatthe molecular orbital energy decreases when the atomicnumber of M increases: it is due to the higher nuclear chargealong the series. A closer analysis of those results leads usto divide the studied complexes into three groups accordingto the lowest vacant orbital:
M ) V, Ce, Mn. In this group, the lowest acceptor orbitalis a 2π*(R) orbital. It is also the LUMO.
M ) Fe, Co. In this group, the lowest acceptor orbital isthe 3σ*(R) orbital. In the iron case, it differs from the LUMO(1δxy($)), for Co, it is the LUMO.
M ) Cu, Ni. In this group, the lowest acceptor orbital isa 2π*($)* orbital. In the nickel case, it differs from theLUMO (1δx2-y2($)), for Cu, it is the LUMO.
Figure 5. Structures of MO(H2O)42+, M ) Ni, Cu, high spin state. Distances
are given in angstrom. See Table 2 for data on angles.
Table 3. Spin State (2S + 1) and Electronic Configuration of theGround State of MO(H2O)p
2+ (for M ) V, Cr, Mn, Fe, Co, p ) 5; for M) Ni, Cu, p ) 4)
metal spin (2S + 1) configuration
V 2 (2σ)2 (1πx)2 (1πy)2 1δxy
Cr 3 (2σ)2 (1πx)2 (1πy)2 1δxy 1δx2-y2
Mn 4 (2σ)2 (1πx)2 (1πy)2 1δxy 1δx2-y2 2πx*
Fe 5 (2σ)2 (1πx)2 (1πy)2 1δxy 1δx2-y2 2πx* 2πy*Co 4 (2σ)2 (1πx)2 (1πy)2 (1δxy)2 1δx2-y2 2πx* 2πy*
Ni 5 (2σ)2 (1πx)2 (1πy)2 (1δxy)2 1δx2-y2 2πx* 2πy* 3σ*Cu 4 (2σ)2 (1πx)2 (1πy)2 (1δxy)2 (1δx2-y2)2 2πx* 2πy* 3σ*
Table 4. Selected Vacant Molecular Orbitals (Energy in eV) for theGround State of MO(H2O)p
2+ (for M ) V, Cr, Mn, Fe, Co, p ) 5; for M) Ni, Cu, p ) 4)a
LUMO lowest vacant 3σ* lowest vacant 2π*
metal label E spin %dM %pO E spin %dM %pO E
V 2π*(R) -12.2 R 45 20 -10.1 R 64 29 -12.2Cr 2π*(R) -13.8 R 44 25 -12.0 R 44 32 -13.8Mn 2π*(R) -14.8 R 43 32 -13.2 R 34 59 -14.8
Fe δxy($) -14.3 R 40 36 -13.9 $ 50 35 -13.2Co 3σ*(R) -14.5 R 42 30 -14.5 $ 47 47 -14.1
Ni 1δx2-y2($) -15.7 $ 26 18 -14.8 $ 63 18 -15.4Cu 2π*($) -16.3 $ 36 18 -15.8 $ 16 58 -16.3
a The molecular orbital spin is provided together with its compositionin terms of d metal orbitals percentage (%dM) and p oxygen orbitals (%pO)percentage.
Figure 6. Energies of molecular orbitals of interest (in eV) for the studiedcomplexes (MO(H2O)p
2+, M ) V, Cr, Mn, Fe, Co, p ) 5; for M ) Ni, Cu,p ) 4). As a guide to the eye, we connect the same orbitals with a line thatis solid for R orbitals and dashed for $ orbitals. For the sake of simplicity,πx and πy are not distinguished. The LUMO orbital is highlighted by ablack circle.
Michel and Baerends
3632 Inorganic Chemistry, Vol. 48, No. 8, 2009
∑Single site catalysis 27

Let us consider the electronic structure within each group.
V, Cr, Mn. A schematic orbital energy diagram of thisgroup is given Figure 7. From V to Mn, each added electronoccupies an extra R orbital, stabilized by the exchange field:1δx2-y2(R) in Cr complex, 2πx
*(R) in Mn complex. The spinstate increases from doublet to quartet.
Along this group, very few crossings of energy levelsoccur. The most noticeable one is the crossing of the 2πx
*(R)level from below the 1δx2-y2(R) level in the vanadiumcomplex to above the 1δx2-y2(R) level in the chromiumcomplex. For the sake of simplicity, we only represent theorbital ordering for the Cr and Mn cases in the simplifiedorbital energy diagram of Figure 7. The consequence of thisswap is that even with one more R electron in the chromiumcomplex, the lowest acceptor orbital is the same (2πx
*(R)) inboth the V and Cr complexes.
Thus, in this group, the lowest vacant acceptor orbital,which is also the LUMO, is a 2π*(R) orbital, namely the2πx
*(R) orbital for V and Cr and the 2πy*(R) for Mn. Two
factors have to be taken into account to predict the electro-philicity of the MO2+ moiety: the energy of the lowest vacantorbital, ε2π*(R), and its oxygen p orbital contribution, %pO.Generally speaking, the lower the acceptor orbital lies inenergy and the higher the %pO is, the more electrophilic theMO2+ will be: they are both in favor of a large electronicdonation from the C-H bond into the MO2+ acceptor orbital.Within the series (V, Cr, Mn), ε2π*(R) is strongly decreasing(from -12.2 eV to -14.8 eV) while %pO is stronglyincreasing (from 29% to 59%), see Figure 6 and Table 4.So, from V to Mn, the MO(H2O)5
2+ complex should be moreand more efficient in performing H-abstraction from methane.
Previous studies have demonstrated the high reactivity ofthe FeO(H2O)5
2+ complex. The lowest acceptor orbital ofthis complex is the 3σ*(R), lying at -13.9 eV. Thus, on thebasis of the energy level of the lowest acceptor orbital, oneshould expect the Mn complex to be even more efficientthan the Fe complex. However, the nature of the lowestacceptor orbital differs (2π*(R) versus 3σ*(R)). In the 2π*case, the overlap efficiency requires sideways approach,
leading to steric hindrance of the incoming organic substratemolecule (e.g., CH4) with the equatorial water ligands. Thiscompetition may reduce the Mn complex oxidative activity.
Fe, Co. A schematic orbital energy diagram is given inFigure 8. From Mn to Fe, the extra electron goes into the2πy
*(R), leading to the expected high spin configuration(quintet) for the FeO(H2O)5
2+ complex. In the CoO(H2O)52+
complex case, the extra electron occupies a $ orbital, leadingto a quartet spin state for the ground state.42 Thus, for bothiron and cobalt, the 2π*(R) is doubly occupied and the lowestacceptor orbital is the 3σ*(R) orbital. We have alreadypointed out that the two main parameters which can controlthe electrophilicity of the complex are the energy and the2pO contribution of the lowest lying vacant orbital. The3σ*(R) energy and the 2pO contribution are similar in bothcomplexes: the cobalt complex 3σ*(R) lies 0.6 eV belowthe iron complex 3σ*(R) (see Figure 6), but its pO contribu-tion is slightly less favorable (30% vs 36%), see Table 4.Previous studies have demonstrated the high reactivity ofFeO(H2O)5
2+ complex. Even if cobalt has been used muchless than iron in oxidative processes, it is clear that cobaltcomplexes should be as reactive as iron complexes, if notmore so.
Ni, Cu. A schematic molecular diagram is given in Figure9. We have already set apart those two complexes becauseof a reduced number of water ligands in the coordinationshell. They can also be distinguished through their electronicstructure. All the R orbitals of interest are occupied: from
(42) Cobalt is the only case where the spin state of the complexMO(H2O)p
2+ differs from the spin state of the bare oxo MO2+.
Figure 7. Simplified molecular orbital diagram of MO(H2O)52+, M ) V,
Cr, Mn. The black spins represent the occupation in the vanadium case.For the chromium complex, the supplementary spin (here in blue) occupiesthe 1δx2-y2(R) orbital. Then, for the manganese complex, the second extraelectron (here in red) occupies the 2πx*(R) orbital. For the sake of simplicity,we have not shown here the crossing between 2πx*(R) and the δx2-y2 whenswitching from the vanadium to the chromium complex. The mainconsequence of the energy levels crossing is that the LUMO in bothcomplexes is the 2πx*(R) molecular orbital.
Figure 8. Simplified molecular orbital diagram of MO(H2O)52+, M ) Fe,
Co. The black spins represent the occupation in the manganese case. Forthe iron complex, the supplementary spin (here in blue) occupies the 2πy
*(R)orbital. Then, for the cobalt complex, the second extra electron (here inred) occupies the 1δxy($) orbital.
Figure 9. Simplified molecular orbital diagram of MO(H2O)42+, M ) Ni,
Cu. The black spins represent the occupation in the cobalt case. For thenickel complex, the supplementary spin (here in blue) occupies the 3σ*(R)orbital. Then, for the copper complex, the second extra electron (here inred) occupies the 1δx2-y2($) orbital.
What Singles out the FeO2+ Moiety?
Inorganic Chemistry, Vol. 48, No. 8, 2009 3633
28 ∑Single site catalysis

cobalt to nickel complex, the extra electron occupies the3σ*(R) leading to a quintet spin state. Then, from nickel tocopper, the extra electron is added into the 1δx2-y2 orbital.Thus, in both complexes, the lowest lying acceptor orbitalis a 2π*($). As seen previously, the energy and thecomposition of this 2π*($) orbital determine the electrophi-licity of the complex. In the copper complex, the 2π*($)lies at a lower energy (-16. eV vs -15.4 eV) and its 2pO
contribution is larger (58% vs 18%) than in the nickelcomplex. So, we can assume that this complex may be morereactive than the Ni complex to perform alkyl hydroxylation.
Anyway, both Ni and Cu complexes seem very promisingto promote C-H oxidation based on the lowest vacant orbitalenergy level (at least 1 eV lower than the iron one). Thenature of the lowest acceptor orbital (2π*($)) may reducethe efficiency of those complexes because of the overlap/steric hindrance of the water ligands upon the sidewaysapproach of a substrate molecule, which is required foroptimal overlap with 2π* orbitals. The lower number ofwater molecules should however reduce the impact of thiscompetition. However, very little is known about the stabilityof those complexes as active intermediates in oxidativecatalysis.
Along the Series. The energy of the lowest acceptororbital and its 2pO orbital contribution are a bit less favorablein Fe and Co complex than in the Mn or Cu complex.However, for iron and cobalt, the lowest acceptor orbital isthe 3σ*(R), not a 2π* orbital. As noted, the overlap betweenthe acceptor orbital and the C-H bonding orbital may belower with a 2π* orbital than with a 3σ* orbital because ofthe steric hindrance of the ligands. Thus, no conclusion canbe drawn yet concerning the H-abstraction capability of allthese complexes. To investigate further the MO(H2O)p
2+
reactivity toward the C-H bond, we have made an extensivestudy of the intermediates and transition states involved inthe CH4 + MO(H2O)p
2+ f M(H2O)p2+ + CH3OH reaction.
Mechanism. Overview. In Table 5, data concerning theR f P reaction are collected: energetic cost ∆E ) E(P) -E(R), spin state of the reactants R, spin state of the productsP. Except in the vanadium case, this reaction is exoenergetic.The energetic cost decreases from V (149.1 kJ/mol) to Cu(-302.4 kJ/mol) and is particularly low in the Mn case
(-206.8 kJ/mol). Moreover, this reaction implies a spincrossing, except for iron and cobalt.
This reaction follows a rebound mechanism (see Figure1).25 First, one hydrogen atom is abstracted from thesubstrate, here CH4. This yields intermediate I (MOH-(H2O)p
2+ + ·CH3. Then, the carbon radical ·CH3 can collapseonto the hydroxo group to yield the product complex PC(M(OHCH3)(H2O)p
2+). The energy profile of those steps isgiven in Figure 10 for the V, Cr and Mn complexes, in Figure11 for the Fe and Co complexes, and in Figure 12 for the Niand Cu complexes.
The rebound step is relatively uninteresting, being verysmooth. Data concerning this step are collected in Table 6:spin evolution, energetic cost ∆E2 ) E(P) - E(I), energybarrier ∆ETS2
q , C-O distance and MOC angle in the transitionstate structure. This step is highly exoenergetic in all cases.It is a non-activated process or with very low activationbarrier ∆ETS2
q . Thus, we will mainly focus on the H-abstraction step, which controls the reaction kinetics. Wewill put in evidence the strong link between the activationenergy ∆ETS1
q , and the transition state structure (TS1) on onehand and the lowest lying acceptor orbital of the MO(H2O)p
2+
complex on the other hand. In the previous section, we havediscussed the electronic structure of the MO(H2O)p
2+ com-plexes. To supplement this, we have also performed adetailed study of the electronic structure of the H-abstractiontransition state structures (TS1) thanks to a fragment interac-tion analysis. We have chosen to focus on the interactionbetween two fragments43 in the transition state geometry:(i) the fragment MO(H2O)p
2+ (ii) the fragment CH4. The
Table 5. Studied Reaction: MO(H2O)p2+ + CH4fM(H2O)p
2+ + CH3OH,i.e., R f Pa
spin (2S + 1)
metal R P ∆E (kJ/mol)
V 2 4 149.1Cr 3 5 -46.0Mn 4 6 -206.8
Fe 5 5 -119.1Co 4 4 -153.8
Ni 5 3 -218.8Cu 4 2 -302.4
a For each metal, this table gives the spin state of the reactant R andproduct P ground state and ∆E, the energetic cost of the reaction (in kJ/mol).
Figure 10. Energy profile (in kJ/mol) for the methane to methanolconversion catalyzed by MO(H2O)5
2+, M ) V, Cr, Mn. Dashed line standsfor the high spin mechanism and continuous line for the low spinmechanism. Along the reaction coordinate, the following species have beencharacterized: the reactants MO(H2O)5
2+ and CH4 (R); the reactant complex[MO(H2O)5
2+, CH4] (RC); the transition state corresponding to theH-abstraction step (TS1); the intermediate [MOH(H2O)5
2+ · · · ·CH3], (I); thetransition state corresponding to the rebound step (TS2); the productcomplex MCH3OH(H2O)5
2+ (PC); the products M(H2O)52+ and CH3OH
(P).
Michel and Baerends
3634 Inorganic Chemistry, Vol. 48, No. 8, 2009
∑Single site catalysis 29

gross population of the interesting fragment molecularorbitals in the transition state structure TS1 are given in Table8. The overlaps between the σC-H orbital of the stretched
C-H bond and the 2π* and 3σ* orbitals of the complexesare given in Table 9.
Data related to the H-abstraction step are collected in Table7: spin state evolution, energetic cost (∆E1), and activationenergy barriers (∆ETS1
q ), selected geometrical data of thetransition state structures (TS1). We have also added somekey features of the electronic structure of the reactantMO(H2O)p
2+.As we already noticed, this series can be divided into three
groups according to the lowest acceptor orbital of theMO(H2O)p
2+ complex. We keep this subdivision to discussthe mechanism of the reaction CH4 + MO(H2O)p
2+ fM(H2O)p
2+ + CH3OH. Before entering the discussion of thethree groups we note that the calculated transition barriersare for gas phase reactions, and therefore much lower than
(43) The orbitals of the fragments are obtained in spin restricted calculationson the fragments with the geometries they have in the transition state.The orbital occupations have been enforced to yield electronicstructures for the fragments that conform to the situation in thecomplex.
Figure 11. Energy profile (in kJ/mol) for the methane to methanolconversion catalyzed by MO(H2O)5
2+, M ) Fe, Co. Dashed line stands forthe high spin mechanism and continuous line for the low spin mechanism.Along the reaction coordinate, the following species have been characterized:the reactants MO(H2O)5
2+ and CH4 (R); the reactant complex [MO(H2O)52+,
CH4] (RC); the transition state corresponding to the H-abstraction step(TS1); the intermediate [MOH(H2O)5
2+ · · · ·CH3] (I); the transition statecorresponding to the rebound step (TS2); the product complexMCH3OH(H2O)5
2+ (PC); the products M(H2O)52+ and CH3OH (P).
Figure 12. Energy profile (in kJ/mol) for the methane to methanolconversion catalyzed by MO(H2O)4
2+, M ) Ni, Cu. Dashed line stands forthe high spin mechanism and continuous line for the low spin mechanism.Along the reaction coordinate, the following species have been characterized:the reactants MO(H2O)4
2+ and CH4 (R); the reactant complex [MO(H2O)42+,
CH4] (RC); the transition state corresponding to the H-abstraction step(TS1); the intermediate [MOH(H2O)5
2+ · · · ·CH3] (I); the transition statecorresponding to the rebound step (TS2); the product complexMCH3OH(H2O)4
2+ (PC); the products M(H2O)42+ and CH3OH (P).
Table 6. Data for the Rebound Step: I f PCa
spin state
metal I PC ∆E2 (kJ/mol) ∆ETS2q (kJ/mol) C-O (Å) MOC (deg)
V 2 4 -37.3 7.5 2.12 140Cr 3 6 -187.5Mn 6 6 -249.5 0 3.33 173
Fe 5 5 -194.9 0 2.59 135Co 4 4 -173.1 6.6 3.00 159
Ni 3 3 -331.1Cu 2 2 -363.2
a For each metal, this table gives the spin state (2S +1) of I and PCground state and the energetic cost of the reaction ∆E2 ) E(PC) - E(I) (inkJ/mol). It provides also the activation energy ∆ETS2
q (kJ/mol), the COdistance (in Å), and the MOC angle (in degree) in the transition statestructure TS2.
Table 7. Studied Reaction: RC f Ia
spin statelowest vacantacceptor MO
metal RC I∆E1
(kJ/mol)∆ETS1
q
(kJ/mol)C-H(Å)
O-H(Å)
MOH(deg) label
energy(eV)
V 2 2 196.3 198.9 1.76 1.04 128 2π*(R) -12.2Cr 3 3 76.3 84.9 1.39 1.17 125 2π*(R) -13.8Mn 4 6 -44.7 9.7 1.34 1.20 126 2π*(R) -14.8
Fe 5 5 0.7 9.2 1.25 1.32 179 3σ*(R) -13.9Co 4 4 -35.0 11.7 1.34 1.19 177 3σ*(R) -14.5
Ni 5 5 4.1 14.5 1.38 1.20 123 2π*($) -15.4Cu 4 4 -2.5 6.8 1.30 1.28 125 2π*($) -16.3
a For each metal, this table gives the spin state (2S +1) of RC and I(ground states) and the energetic cost ∆E1 of the reaction (in kJ/mol). Itprovides also the activation energy ∆ETS1
q , the OH distance (in Å) and theMOH angle (in degree) in the transition state structure TS1. The last twocolumns are a reminder of the key data concerning the lowest vacantacceptor molecular orbital: label and energy (in eV).
Table 8. Fragment Analysis of the Transition State Structure TS1 forEach Complex MO(H2O)p
2 + (M ) V, Cr, Mn, Fe, Co, p ) 5; for M )Ni, Cu, p ) 4)a
R $
metal 2πx* 2πy* 3σ* σC-H 2πx* 2πy* 3σ* σC-H
V 0.43 0.40 0.02 0.28 0.05 0.05 0.02 0.89+0.43 +0.40 +0.02 -0.72 +0.05 +0.05 +0.02 -0.11
Cr 0.99 0.67 0.02 0.46 0.03 0.06 0.02 0.91+0.99 +0.67 +0.02 -0.54 +0.03 +0.06 +0.02 -0.09
Mn 0.74 0.96 0.04 0.43 0.09 0.03 0.03 0.91+0.74 -0.04 +0.04 -0.57 +0.09 +0.03 +0.03 -0.09
Fe 0.97 0.97 0.51 0.63 0.01 0.01 0.14 0.87-0.03 -0.03 +0.51 -0.37 +0.01 +0.01 +0.14 -0.13
Co 0.99 0.99 0.67 0.43 0.04 0.04 0.10 0.88-0.01 -0.01 +0.67 -0.57 +0.04 +0.04 +0.10 -0.12
Ni 0.97 0.97 0.98 0.94 0.29 0.34 0.09 0.37-0.03 -0.03 -0.02 -0.06 +0.29 +0.34 +0.09 -0.63
Cu 0.97 0.98 0.99 0.96 0.48 0.16 0.07 0.41-0.03 -0.02 -0.01 -0.04 +0.48 +0.16 +0.07 -0.59
a The two fragments are MO(H2O)p2+ and CH4. In this table, the gross
populations of the relevant fragment molecular orbitals are given: the 2π*and 3σ* of the complex and the σC-H of the methane. In italic, the differencebetween the integer gross population in the isolated fragment and the grosspopulation in the transition state. The orbitals have been defined in spinrestricted calculations on the isolated fragments in the geometry they havein TS1.
What Singles out the FeO2+ Moiety?
Inorganic Chemistry, Vol. 48, No. 8, 2009 3635
30 ∑Single site catalysis
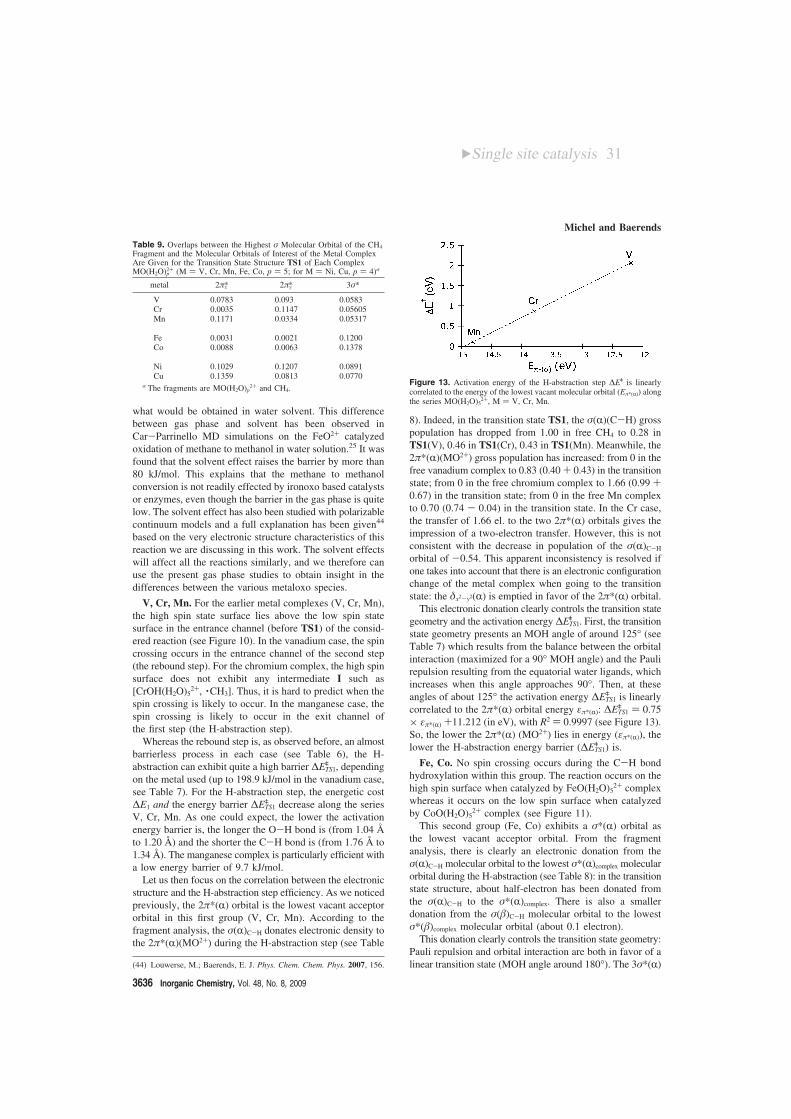
what would be obtained in water solvent. This differencebetween gas phase and solvent has been observed inCar-Parrinello MD simulations on the FeO2+ catalyzedoxidation of methane to methanol in water solution.25 It wasfound that the solvent effect raises the barrier by more than80 kJ/mol. This explains that the methane to methanolconversion is not readily effected by ironoxo based catalystsor enzymes, even though the barrier in the gas phase is quitelow. The solvent effect has also been studied with polarizablecontinuum models and a full explanation has been given44
based on the very electronic structure characteristics of thisreaction we are discussing in this work. The solvent effectswill affect all the reactions similarly, and we therefore canuse the present gas phase studies to obtain insight in thedifferences between the various metaloxo species.
V, Cr, Mn. For the earlier metal complexes (V, Cr, Mn),the high spin state surface lies above the low spin statesurface in the entrance channel (before TS1) of the consid-ered reaction (see Figure 10). In the vanadium case, the spincrossing occurs in the entrance channel of the second step(the rebound step). For the chromium complex, the high spinsurface does not exhibit any intermediate I such as[CrOH(H2O)5
2+, ·CH3]. Thus, it is hard to predict when thespin crossing is likely to occur. In the manganese case, thespin crossing is likely to occur in the exit channel ofthe first step (the H-abstraction step).
Whereas the rebound step is, as observed before, an almostbarrierless process in each case (see Table 6), the H-abstraction can exhibit quite a high barrier ∆ETS1
q , dependingon the metal used (up to 198.9 kJ/mol in the vanadium case,see Table 7). For the H-abstraction step, the energetic cost∆E1 and the energy barrier ∆ETS1
q decrease along the seriesV, Cr, Mn. As one could expect, the lower the activationenergy barrier is, the longer the O-H bond is (from 1.04 Åto 1.20 Å) and the shorter the C-H bond is (from 1.76 Å to1.34 Å). The manganese complex is particularly efficient witha low energy barrier of 9.7 kJ/mol.
Let us then focus on the correlation between the electronicstructure and the H-abstraction step efficiency. As we noticedpreviously, the 2π*(R) orbital is the lowest vacant acceptororbital in this first group (V, Cr, Mn). According to thefragment analysis, the σ(R)C-H donates electronic density tothe 2π*(R)(MO2+) during the H-abstraction step (see Table
8). Indeed, in the transition state TS1, the σ(R)(C-H) grosspopulation has dropped from 1.00 in free CH4 to 0.28 inTS1(V), 0.46 in TS1(Cr), 0.43 in TS1(Mn). Meanwhile, the2π*(R)(MO2+) gross population has increased: from 0 in thefree vanadium complex to 0.83 (0.40 + 0.43) in the transitionstate; from 0 in the free chromium complex to 1.66 (0.99 +0.67) in the transition state; from 0 in the free Mn complexto 0.70 (0.74 - 0.04) in the transition state. In the Cr case,the transfer of 1.66 el. to the two 2π*(R) orbitals gives theimpression of a two-electron transfer. However, this is notconsistent with the decrease in population of the σ(R)C-H
orbital of -0.54. This apparent inconsistency is resolved ifone takes into account that there is an electronic configurationchange of the metal complex when going to the transitionstate: the δx2-y2(R) is emptied in favor of the 2π*(R) orbital.
This electronic donation clearly controls the transition stategeometry and the activation energy ∆ETS1
q . First, the transitionstate geometry presents an MOH angle of around 125° (seeTable 7) which results from the balance between the orbitalinteraction (maximized for a 90° MOH angle) and the Paulirepulsion resulting from the equatorial water ligands, whichincreases when this angle approaches 90°. Then, at theseangles of about 125° the activation energy ∆ETS1
q is linearlycorrelated to the 2π*(R) orbital energy επ*(R): ∆ETS1
q ) 0.75× επ*(R) +11.212 (in eV), with R2 ) 0.9997 (see Figure 13).So, the lower the 2π*(R) (MO2+) lies in energy (επ*(R)), thelower the H-abstraction energy barrier (∆ETS1
q ) is.
Fe, Co. No spin crossing occurs during the C-H bondhydroxylation within this group. The reaction occurs on thehigh spin surface when catalyzed by FeO(H2O)5
2+ complexwhereas it occurs on the low spin surface when catalyzedby CoO(H2O)5
2+ complex (see Figure 11).This second group (Fe, Co) exhibits a σ*(R) orbital as
the lowest vacant acceptor orbital. From the fragmentanalysis, there is clearly an electronic donation from theσ(R)C-H molecular orbital to the lowest σ*(R)complex molecularorbital during the H-abstraction (see Table 8): in the transitionstate structure, about half-electron has been donated fromthe σ(R)C-H to the σ*(R)complex. There is also a smallerdonation from the σ($)C-H molecular orbital to the lowestσ*($)complex molecular orbital (about 0.1 electron).
This donation clearly controls the transition state geometry:Pauli repulsion and orbital interaction are both in favor of alinear transition state (MOH angle around 180°). The 3σ*(R)(44) Louwerse, M.; Baerends, E. J. Phys. Chem. Chem. Phys. 2007, 156.
Table 9. Overlaps between the Highest σ Molecular Orbital of the CH4Fragment and the Molecular Orbitals of Interest of the Metal ComplexAre Given for the Transition State Structure TS1 of Each ComplexMO(H2O)p
2+ (M ) V, Cr, Mn, Fe, Co, p ) 5; for M ) Ni, Cu, p ) 4)a
metal 2πx* 2πy* 3σ*
V 0.0783 0.093 0.0583Cr 0.0035 0.1147 0.05605Mn 0.1171 0.0334 0.05317
Fe 0.0031 0.0021 0.1200Co 0.0088 0.0063 0.1378
Ni 0.1029 0.1207 0.0891Cu 0.1359 0.0813 0.0770
a The fragments are MO(H2O)p2+ and CH4.
Figure 13. Activation energy of the H-abstraction step ∆Eq is linearlycorrelated to the energy of the lowest vacant molecular orbital (Eπ*(R)) alongthe series MO(H2O)5
2+, M ) V, Cr, Mn.
Michel and Baerends
3636 Inorganic Chemistry, Vol. 48, No. 8, 2009
∑Single site catalysis 31

lies lower in energy in the cobalt case than in the iron case(-14.5 eV vs -13.9 eV). The energy barriers (∆ETS1
q ) areclose (11.7 kJ/mol vs 9.2 kJ/mol). Furthermore, if onecompares with the first group (V, Cr, Mn), the energy barrier∆ETS1q is particularly low given that the lowest acceptor orbital
energies for, for example, the Cr and Mn complexes, areclose to those of the Fe and Co complexes. For instance,the iron complex lowest vacant acceptor orbital energy(-13.9) is very close to the chromium complex one (-13.8eV) whereas the energy barrier ∆ETS1
q is much lower: 9.2kJ/mol versus 84.9 kJ/mol. This huge difference in oxidativecapability for a given lowest vacant orbital energy resultsfrom the difference in the nature of the lowest vacant orbital.In the chromium case, it is a 2π* orbital whereas in the ironcase, it is a 3σ*. During the electronic donation from theC-H bond into this lowest vacant acceptor orbital, the orbitalinteraction competes with the Pauli repulsion resulting fromthe water ligands. In both cases, the Pauli repulsion isminimized for an 180° angle whereas the orbital interactionstabilization is optimal for an angle of 90° in the chromiumcase and 180° in the iron case. The synergy between thestrong orbital interaction stabilization and a reduced Paulirepulsion leads to an highly efficient iron complex whereasthe disfavorable competition between those two terms leadsto a less efficient chromium complex. So, the efficiency ofthe high spin FeO2+ arises from the energy and theorientation of the acceptor orbital, the 3σ*(R). According tothis study, the high spin CoO2+ should be as efficient as thehigh spin FeO2+, exhibiting the same acceptor orbital.
Ni, Cu. For these late metal complexes, the high spinsurface lies below the low spin surface in the entrancechannel of the oxidative process (see Figure 12). Then, thishigh spin state is highly destabilized once the H-abstractionhas been carried out: no structure could be optimized forthe intermediate species PC (MCH3OH(H2O)4
2+). On theother hand, the low spin surface is highly reactive in bothcases. It lies much higher in energy than the high spinsurface. The reactant complex RC is even higher in energythan the isolated molecules. However, once the CH4-Odistance is small enough (<3 Å), the oxidation of the C-Hbond occurs without any barrier, yielding the very stablespecies MCH3OH(H2O)4
2+. As a consequence, the spincrossing occurs necessarily before the rebound step, but itis hard to say when exactly.
Let us focus now on the high spin surface reactivity. Letus remember that this last group (Ni, Cu) is characterizedfirst by a different coordination environment, four watermolecules instead of five, and second by a π*($) orbital asthe lowest vacant acceptor orbital. Once again, the fragmentanalysis demonstrates that the lowest acceptor orbitals,namely, here the π*($) orbitals, accept electronic densityfrom the σC-H$ orbital (around 0.6 electron, see Table 8).In this group, the donation from the σ(R)C-H orbital to someacceptor molecular orbital of the complex is not feasible:all the R acceptor molecular orbitals are occupied.
The σC-H$f2π*x,y$ donation clearly controls the transitionstate geometry. Similarly to the V, Cr, Mn group, where alsodonation into 2π* prevails, the TS1 geometry presents anMOH angle of around 125° (see Table 7), resulting fromthe balance between orbital interaction (optimal for 90°) andPauli repulsion (mimimal for 180°). Furthermore, thisdonation also controls the H-abstraction energy barrier(∆ETS1
q ): the lower the 2π*($) lies in energy, the lower ∆ETS1q
is. But given the very low energy of the acceptor orbitals inthis group, particularly in the Cu complex (-16.3 eV), onemight have expected an even lower barrier than the low onewe have obtained (14.5 kJ/mol for Ni, 6.8 kJ/mol for Cu),or even a barrierless process. An explanation may be thelarger Pauli repulsion due to all the occupied R orbitals ofthe metal complex. Nevertheless, if such species could begenerated, they would be highly reactive.
Summary: π* versus σ* Control along the Series. TheMO2+ electrophilicity can be quantified through the H-abstraction energy barrier: the lower ∆ETS1
q is, the moreelectrophilic the MO2+ moiety is. We have seen previouslythat the H-abstraction step can be controlled by the electrondonation from the σC-H orbital into the lowest vacant acceptororbital, namely, the lowest 2π* or the 3σ*(R). In the firstand the last group (V, Cr, Mn and Ni, Cu), the MO2+
electrophilicity is under 2π* control whereas in the Fe andCo cases, the MO2+ electrophilicity is under 3σ*(R) control.Let us analyze further the differences between 2π* and3σ*(R) control.
Under the 2π* control, the lower the 2π* orbital lies inenergy, the more electrophilic the MO2+ moiety is. In thefirst group, ε2π*(R) and ∆ETS1
q are even linearly correlated (seeFigure 13). In the last group, the MO2+ electrophilicity iscontrolled by the 2π*($): the lower it is, the lower theH-abstraction barrier is. Given the low 2π*($) energy ε2π*($)
for the Ni and Cu complexes, the H-abstraction energy barrier∆ETS1
q is higher than one might have expected. However, aswe have already seen, the R orbitals are fully occupied.Hence, the donation from the σ(R)C-H orbital to some 3d-based R acceptor molecular orbital of the complex is notfeasible. Futhermore, we can divide the Pauli repulsion intotwo terms: (1) the Pauli repulsion generated by the interactionof occupied substrate orbitals with MO2+ occupied molecularorbitals, and (2) the Pauli repulsion with the ligands. Fromthe first group (V, Cr, Mn) to the last one (Ni, Cu), the firstterm is increased by the greater number of electrons on MO2+
whereas the second term is decreased (only 4 ligands insteadof 5). From the energy barriers ∆ETS1
q one would infer thatthe larger Pauli repulsion with the MO2+ electrons in thelast group than in the first one outweighs the reduced Paulirepulsion with the ligands. To conclude, under 2π* control,the electrophilicity is directly correlated to the 2π* energyonly for a given Pauli repulsion.
Under 3σ*(R) control, which applies in the case of the Feand Co complexes, the low energy barrier (around 10 kJ/mol) is striking. The orbital energy of the lowest vacantacceptor orbital of the iron complex is pretty close to theone of the chromium complex, whereas the energy barrier
What Singles out the FeO2+ Moiety?
Inorganic Chemistry, Vol. 48, No. 8, 2009 3637
32 ∑Single site catalysis

is quite different: 9.2 kJ/mol in the iron case versus 84.9kJ/mol in the chromium case. If we would apply thecorrelation between activation energy ∆ETS1
q and the control-ling orbital energy as obtained in the first group (Figure 13),we would obtain an activation barrier of 75.8 kJ/mol insteadof 9.2 kJ/mol in the iron case. This is also true for the cobaltcomplex: for the H-abstraction step we would obtain anactivation barrier of 32.3 kJ/mol instead of 11.7 kJ/mol.Obviously, when the reaction is performed under 3σ*(R)control it is much more efficient. The σ* controlled reactionspresent lower barriers than the π* controlled reactions for agiven orbital energy thanks to the combination of two effects:(1) the Pauli repulsion with the ligands is lower in the lineargeometry, and (2) the orbital overlap is larger (see Table 9).
Conclusions
In this work, we have systematically studied the methane-to-methanol reaction catalyzed by the first row transition-metal complexes MO(H2O)p
2+. This reaction follows arebound mechanism in two steps: (1) H-abstraction leadingto a MOH2+ species, and (2) carbon radical collapse ontothis species. The first step is the kinetic controlling step forall the studied complexes. The activation barrier and thetransition state geometry of this H-abstraction step aredirectly correlated to the nature of lowest acceptor orbital.The main results are as follows: (1) the σ* controlledH-abstraction reactions present linear transition states andπ* controlled H-abstraction reactions present bent transitionstates, (2) the σ* controlled reactions present lower activationbarriers than the π* controlled reactions for a given lowestacceptor orbital energy, and (3) the activation barrier isdirectly correlated to the lowest vacant orbital energyprovided the Pauli repulsion remains the same (same numberof ligands, similar number of electrons) and provided thelowest acceptor orbital remains of the same type (σ* or π*).So, now we can answer the question raised in the Introduc-tion. Iron is so special because of the nature of its lowestacceptor orbital: a low lying 3σ*(R), which is particularlyefficient in promoting the H-abstraction step according toour results. However, the Fe complex does not emerge fromthis study as the only one. According to our results, the cobaltcomplex should be as efficient as iron for the Fentonchemistry under the proper experimental conditions. Indeed,cobalt-based compounds have already been used successfullyin oxidation of cyclohexane45-47 and even in decompositionof organic dyes.48
Finally, this study leads on to other questions. For instance,what is the ligand environment effect in the cobalt complex?We have seen in the introduction that a nitrogen equatorialenvironment induces a less favorable low spin state and lessreactive species in the iron case. Preliminary tests on thecobalt system indicate the effect to be in the same direction,but Cobalt seems to be less sensitive to those environmentaleffects. The CoO(NH3)5
2+ complex is high spin (quartet). Itslowest acceptor orbital is still the 3σ*(R)(ε3σ*(R) ) -12.4eV). The H-abstraction step energy barrier is still quite low(∆E1
† ) 77.1 kJ/mol), though much higher than forCoO(H2O)5
2+ (11.7 kJ/mol).Another question concerns the charge effect. Let us take
two isoelectronic complexes: FeO(H2O)52+ and MnO(H2O)5
+.The electronic structures of those two complexes are verysimilar: same spin state (quintet), same lowest acceptororbital (3 σ*(R)). However, the charge decrease from theFe to the Mn complex induces orbitals lying higher in energy:ε3σ*(R) (FeO(H2O)5
2+) ) -13.9 eV and ε3σ*(R) (MnO(H2O)5+)
) -6.7 eV. As expected, the activation barrier of theH-abstraction step catalyzed by MnO(H2O)5
+ is much higherthan the one catalyzed by FeO(H2O)5
2+ (∆E1† (Mn) ) 105.3
kJ/mol vs ∆E1† (Fe) ) 9.2 kJ/mol. The late transition metal
complexes should be less sensitive to this charge effect.Indeed, with a lowest acceptor orbital lying at -9.7 eV, theCuO(H2O)3
+ complex seems to be a promising active species.CuO+ has already been postulated in some enzymes andbiologically relevant systems as an possible intermediate.49,50
These and other points will be the subject of furtherinvestigations.
Acknowledgment. Support by the National ResearchSchool Combination “Catalysis by Design” is gratefullyacknowledged.
IC802095M
(45) Pokutsa, A. P.; Sheparovich, R. B.; Zaborovskii, A. B.; Kopylets, V. I.Kinet. Catal. 2002, 43, 691–697.
(46) Pokutsa, A. P.; Zaborovskii, A. B.; Sheparovich, R. B.; Kopylets, V. I.;Maksim-Lutsik, D. S. Kinet. Catal. 2003, 44, 121–128.
(47) Tong, J.; Zhen, L.; Xia, C. J. Mol. Catal. A: Chem. 2005, 231, 197–203.
(48) Chen, W. X.; Lu, W. Y.; Yao, Y. Y.; Xu, M. H. EnViron. Sci. Technol.2007, 41, 6240–6245.
(49) Kamachi, T.; Kihara, N.; Shiota, Y.; Yoshizawa, K. Inorg. Chem. 2005,44, 4226–4236.
(50) Pitie, M.; Boldron, C.; Pratviel, G. AdV. Inorg. Chem. 2006, 58, 77–1330.
Michel and Baerends
3638 Inorganic Chemistry, Vol. 48, No. 8, 2009
∑Single site catalysis 33

In Silico Screening of Iron-Oxo Catalysts for CH Bond CleavageProkopis C. Andrikopoulos,† Carine Michel,† Sandra Chouzier,‡ and Philippe Sautet*,†
†University of Lyon, CNRS, Laboratoire de Chimie, UMR5182, ENS de Lyon, 69364 Lyon, France‡Research and Innovation Centre Lyon, Solvay Polyamide and Intermediates, 69192 Saint-Fons, France
*S Supporting Information
ABSTRACT: Inspired by oxidation enzymes such as P450 and TauD, severalgroups have based their research on the iron−oxo moiety in the field of alkanespartial oxidation. Still, the controlled cleavage and oxidation of the aliphatic C−Hbond remains a prized goal in chemistry. We present here a computationalmethodology to predict the comparative reactivity of iron−oxo complexes for thisprocess from linear relations based on the sole electronic structure of the reactantstate. The efficient correlation of the C−H activation barrier to a simple butintuitive molecular orbital descriptor enables the design of ligands that permit lowbarrier C−H abstraction steps and the fast screening of novel potential complexes.The activation of the catalyst by a multidentate effect is also evidenced. Weanticipate this study to improve the rational design of hydrocarbon oxidationcatalysts.KEYWORDS: alkane partial oxidation, methane, iron-oxo complex, activation energy, molecular orbital descriptor
■ INTRODUCTIONIron complexes are gradually moving to the forefront of thefield of alkane activation.1−5 These have been inspired byanalogue processes in biological systems,6 where FeIVOactive sites are responsible for the activity such as thecytochrome-P450 compound-I7 or the intermediate J of taurinedioxygenase (TauD).8 In order for iron complexes to cross overto useful applications in industry, an effort in documenting andpredicting their properties in a consistent manner has to beimplementeda task that is undertaken here by theoreticalmeans.The high spin FeIVO intermediate is a strong electrophile
that can abstract a hydrogen atom from an alkane. A reboundstep follows, that forms the C−O bond and leads to thecorresponding alcohol.9 Certain patterns have emerged fromthe number of iron−oxo complexes that have been recentlyexamined. The C−H abstraction step is expected to be crucialin the full oxidation cycle, the overall kinetics being correlatedto the strength of the C−H bond of various substrates.10 ThepKa of the Fe
IV−OH intermediate is also essential to the overallactivity as demonstrated recently in cytochrome P450.11 Inother words, the driving force for the C−H activation by theFeIVO moiety is given by the difference between the energyof the C−H bond to be broken (BDECH) and the energy of theO−H bond to be formed (BDEOH). De Visser has rationalizedthose trends on a family of seven Fe-oxo complexes using DFTcalculations: the height of the hydrogen abstraction barrier ofpropene is linearly correlated to the reaction energy, ΔH =BDECH − BDEOH.
12 This approach has been generalizedrecently in a meta-analysis of 13 computational studies onhydrogen abstraction by iron and manganese oxo complexesdemonstrating the importance of the reaction driving force.13
This correlation between the barrier height and the reactionenergy is known as the Bell−Evans−Polanyi principle.14Since the pioneering works of K. Fukui15 and R. Hoffmann,16
the importance of the interactions between the molecularorbitals of the reagents, and mainly between the frontierorbitals, is well-known as a key parameter governing reactivity.In the CH abstraction step, the proton transfer to the oxo-oxygen is coupled to an electron transfer from the σ(CH) ofthe alkane substrate to the lowest vacant acceptor orbital of theelectrophilic FeIVO group.17,18 The qualitative role of severalparameters was underlined for this interaction from theelectronic structure calculations of octahedral FeIVOcomplexes.19−23 Shaik and co-workers stressed the influenceof the overlap between the alkane σ(CH) and the acceptororbitals on the complex to determine the structure of thetransition state. Baerends and co-workers noted the crucialimportance of the energy of the acceptor orbital. On a set offour model complexes with water as equatorial ligands, theywere able to modulate the energy of the acceptor orbital by thenature of the axial ligand and modify the calculated barriers.However, to the best of our knowledge, those qualitativeanalyses were not transformed into a detailed and predictivecorrelation between the C−H abstraction barrier and a well-defined electronic structure parameter of the initial complex.Such a correlation would supplement the existing ones derivedfrom the BEP principle providing a fundamental and easydescriptor of the FeIVO activity.
Received: July 12, 2014Revised: March 10, 2015Published: March 10, 2015
Research Article
pubs.acs.org/acscatalysis
© 2015 American Chemical Society 2490 DOI: 10.1021/cs500996kACS Catal. 2015, 5, 2490−2499
34 ∑Single site catalysis
Reprinted with permission from ACS Catal. 2015, 5, 2490-2499Copyright 2015 American Chemical Society.

The possible spin states of d4 FeIVO intermediates are S =0, 1, or 2 depending on the ligand field. The singlet state (S =0) is generally very unstable and will not be considered here,the ground state of the complexes being either the triplet (S =1, called here low spin (LS) for simplicity) or quintet state (S =2, called here high spin (HS)). In the presence of strongenough donor ligands, (typically nitrogen based), octahedralFeIVO intermediates have a triplet low spin (LS) state, thelowest acceptor orbital being generally the so-called β−π*(antibonding combination of dxz(Fe)/dyz(Fe) and px(O)/py(O) in the β manifold; see Figure 1a). The corresponding
reaction channel is the LS-π path. The proton transfer iscoupled to the electron transfer from the σ(CH) of the alkaneto the π*(FeIVO). This electronic interaction requires aperpendicular orientation between the CH bond and theFeIVO bond, leading to a bended transition state.24 In the HSstate, two types of possible acceptor orbitals are competing,defining two reaction channels: the β−π* and the so-calledα−σ* (antibonding combination of dz2(Fe) and pz(O) in the αspin manifold of molecular orbitals).25 The β−π* opens a HS-πpath, similar to the LS-π path. The α−σ* orbital is generally thelowest acceptor orbital on the FeIVO fragment due to theconsiderable electron exchange stabilization of the α molecularorbitals manifold in the S = 2 configuration.26 This α−σ*acceptor orbital opens a HS-σ path, where the electronicinteractions lead to a linear transition state, the CH and theFeO bonds being collinear. This alignment favors thefrontier orbital overlap27 and reduces the Pauli repulsionbetween the alkane and the ligands.23 These reaction channelshave been described in more details in recent reviews.18,28,29
Later in the text, the α−σ* will be noted simply as σ* and theβ−π*, simply as π*.This active HS-σ path can be reached by weakening the
ligand field and a common strategy is to reduce the number ofdonor ligands in the equatorial plane. One approach is to createa trigonal bipyramidal configuration at the iron with the oxo-
oxygen along the axis of the pyramid and three nitrogen typeligands in the equatorial plane, while one N atom holds theother axial position.30,31 This configuration ensures a high spinground state (Figure 1b) that is preserved along the hydrogenabstraction step. Another strategy to reach the most active stateis the spin crossover from a low spin (S = 1) ground state to ahigh spin (S = 2) excited state in a two-state reactivitymechanism popularized by Schroder, Shaik, and Schwarz.32 Anindication of its energetic cost is provided by the HS−LSadiabatic gap. The lowest energy path for the reaction is thendetermined by a comparison of the barrier of the LS-π pathagainst the sum of the HS-σ path barrier and the spin gap.The working hypothesis of the present paper asserts that the
C−H abstraction barrier and the lowest acceptor orbital energyof the initial FeO complex are correlated: the lower theacceptor orbital energy, the lower the energy barrier would be.For a high spin ground state complex, the barrier will be relatedto the energy of the σ* acceptor orbital (HS-σ path). For a lowspin ground state, the barrier will be related to the energy of theπ* orbital (LS-π path). In this latter case, the high spin S = 2excited state will also be considered. Its σ* energy will berelated to the corresponding HS barrier to compare themultistate reactivity with the LS-π path. These basic qualitativeeffects were outlined in the original works by Baer-ends19−21,27,33 and Shaik.18,26,32 The work presented here willdemonstrate how these can be expanded into a valuable tool forcatalyst prediction employing an extensive set combining modeland realistic catalysts to establish a correlation between theactivation energy and the energy of the lowest acceptor orbital(σ* for the HS path and π* for the LS path).
■ RESULTSIn order to test this hypothesis and demonstrate thecorrelation, a large data set of iron-oxo complexes was chosen,shown in Figures 2 and 3 (see also the XYZ coordinates in theSupporting Information (SI)). The choice of systems was madefrom popular ligands from the literature,5 porphyrin com-plexes,3 iron ligands from chemical databases, and simple modelsystems, while methane was the chosen substrate. Since thefocus of the paper is on the influence of the ligand, the substratewas not changed. A conscious effort was made to obtain adiverse set of ligands that span the whole range of lowestacceptor orbital energies. The first set, shown in Figure 2, iscomprised of complexes with a total charge of 2+. This setmixes model complexes designed to rationalize trends (1−12,23−28) and also complexes selected from the literature (13−22, 19−38)5 to provide a direct comparison with experiments.This set includes a variety of complexes with mainly N donors:cyclams (TMC 34−36),34,35 bicyclic bispidine ligands (32,33),36 tripodal ligands motifs with pyridyl (TPA 17), guanidine(TMG3tren 18), amino (Me6-TREN 22), or benzimidazole(Me3NTB 37) groups,37,38 EDTA (38), etc. Those complexesare included, as is customary, without the counterions thatwould balance the total charge and in some cases, complete themetal coordination.30
The second set (Figure 3) covers neutral complexes, selectedfrom the literature5 or derived from commercially availableligands and Fe complexes. Complexes belonging to the firstgroup can be shifted to the second group by including theomitted counterions. The influence of those counterions can bequite complex39 and will not be covered extensively in thisstudy. The division in two sets is required since the energyrange of the acceptor orbitals differs according to the charge
Figure 1. Frontier molecular orbitals of (a) an octahedral Fe-oxocomplex in a low spin configuration including the interaction with theequatorial (in the x, y plane) and axial (along the z axis) ligands. In thehigh spin configuration, the down-spin electron from the δ orbital ispromoted to the dx2−y2 orbital, resulting to a total of four unpairedelectrons and (b) a trigonal bipyramidal Fe−oxo complex in a highspin configuration. In this simplified representation up and down spinorbitals are shown with the same energy.
ACS Catalysis Research Article
DOI: 10.1021/cs500996kACS Catal. 2015, 5, 2490−2499
2491
∑Single site catalysis 35

(−14 to −8 eV and −6 to −2 eV for 2+ charged and neutralcomplexes, respectively). Other popular ligands could beincorporated, such as the negatively charged pyrrolide or ureaones,40,41 provided an extensive complex set is constructed fortheir respective charge group, similarly to the 2+ and neutralsets presented here.The “reactant complex” state, where methane is loosely
oriented toward the oxo oxygen (typically 2−3 Å apart) and thetransition state structures were then determined to compute theactivation barriers EACT(LS-π path) and EACT(HS-σ path). Inorder to accurately compare HS-σ and LS-π paths, reliablepredicted spin gaps are required (EGAP). The chosencombination of OPTX (exchange) and PBEc (correlation)functionals with the Dunning’s correlation consistent basis setsemployed here is known to perform well in this respect.42 Forexample, in comparison to CCSD(T) calculations performedby Shaik and co-workers on penta-ammoniated iron oxo
(complex 6 here),43 the quintet-triplet spin gap is estimatedaccurately (1.3 kcal·mol−1) while the LS-π and HS-σ barriersare not as underestimated as with the popular hybrid B3LYPfunctional.A clear correlation was obtained for the first group (1−38,
charge 2+) for the HS-σ path between the activation energy forCH bond dissociation on the HS oxo complexes and the energyof the lowest acceptor σ*(FeO) orbital (HS-σ path, blackand blue symbols in Figure 4). Crosses and diamonds signifywhether the HS-σ path is associated with a ground or excitedstate of the initial complex, respectively. From the presence ofthe 2+ charge, the energy of the σ*(FeO) orbital can bequite low, lower than the HOMO energy of methane in gasphase. However, the HOMO of methane is markedly stabilizedin the reactant complex, where it is in the field of the dication,and its energy is again below that of the σ* acceptor orbital.Evidently, the correlation can be directly applied in order to
Figure 2. Structure of the complexes with an overall positive charge of 2 included in the first correlation plot. 1−12 is the subset of complexes withmonodentate ligands, and the drawing includes the position of the FeO moiety. 13−38 is the subset of polydentate ligands. The position of theFeO group is not included for clarity. Atoms coordinated to Fe in the equatorial position are shown in blue, while those in the axial position are inred.
ACS Catalysis Research Article
DOI: 10.1021/cs500996kACS Catal. 2015, 5, 2490−2499
2492
36 ∑Single site catalysis

obtain the total barrier when dealing with HS ground states,which constitute the majority on this set, or combined with theLS-HS gap, (ideally, with a calculated minimum energy crossing
point (MECP)), when dealing with LS ground states. Twosubsets of linear relations clearly emerge, and they correspondto different types of ligands.The first subset (black, 1−12) shows an R2 value of 0.97, a
slope of 38, and a mean absolute deviation (MAD) of 4 kJ·mol−1. In this set, all ligands are monodentate. Models 13−38in Figure 4 (blue) form the second trend-line which is almostparallel to the previous one with a slope of 33, an R2 value of0.90, and an MAD of 11 kJ·mol−1. All ligands are herepolydentate with three to six coordination sites. In particular,15−18, 20−25, and 37 are forming with the FeO moiety acomplex of trigonal bipyramidal geometry.Overall, the two trend lines reveal a close-fitting linear
relation between the energy of the acceptor σ* orbital and theactivation energy. The activation energy of the LS-π path pointsare also included as a function of the energy of the π* for thelow spin ground state complexes 5, 6, 14, and 29−36 (reddiamonds). A meaningful correlation cannot be obtained herebetween the activation energy on the LS-π path and the π*acceptor orbital energy. The typical bended transition stateprobably induces a larger variation in the steric hindrancecontribution to the activation barrier. For instance, in theTMC−CH3CN (35) complex, the cyclam scaffold hinders themethane approach, leading to a FeOH angle 132° while in theN4Py (29), the FeOH angle is smaller (121°), indicating alower steric hindrance. Despite a similar π* energy, theiractivation energy differs by 49 kJ·mol−1.For the second group of neutral complexes (39−55), a
correlation of the same nature is obtained for the HS-σ path,shown in Figure 5 with black symbols and line. The complexesin this set are less uniform than those of the previous group andshow a narrower orbital energy range than for the 1−38 group(∼3 eV).The heme Fe−oxo complexes with a Cl axial ligand included
here (models 47−51) that originate from a FeIII bare site
Figure 3. Neutral complexes included in the second correlation plot. All drawings here include the approximate position of the FeO moiety.
Figure 4. Correlation between the energy of the σ* orbital of the Fe−oxo complex in electronvolts (x-axis) and the barrier height of the C−H abstraction step in kilojoules per mole (y-axis) for models 1−38(HS-σ path). Two subsets are distinguished: (1−12) in black and(13−38) in blue. Crosses indicate complexes with a high spin groundstate (quintet), while diamonds indicate those with a low spin (triplet).In addition, for the FeO complexes with a LS ground state, theactivation energy for C−H abstraction along the LS-π path is alsoplotted as a function of the energy of the π* orbital (red diamonds)even if in this case no correlation appears.
ACS Catalysis Research Article
DOI: 10.1021/cs500996kACS Catal. 2015, 5, 2490−2499
2493
∑Single site catalysis 37

display the typical ligand radical configuration OFeIV(Por•+)-(Cl−) and hence correspond to a quartet ground state (calledlow spin here) and a sextet high spin excited state. Remarkably,the nonheme complexes 43 and 45 that also originate from aFeIII bare site attain a similar configuration OFeIV(L•+).While in heme containing systems the LUMO is typicallylocated mainly on the heme, and in 43−45 it is located on theligand, the C−H abstraction will be initiated normally throughthe acceptor orbital FeIVO(π*) or FeIVO(σ*).26 Thisallows heme containing systems to be included in thecorrelation.The transition state structures of this neutralgroup display Fe−O−H angles much lower than 150° (see SITable S2) typical of a π-path motif. However, the orbitalanalysis of those transition state structures reveals that theforming bonding orbitals are of substantial σ* character (e.g.,35% σ* for the HOMO the transition state structure of 46 witha Fe−O−H angle of 137.5°) which explains their correlationpreference with the σ* energy levels.No distinct monodentate/polydentate lines are established in
this correlation since only one model is exclusively mono-dentate (39). Despite the high heterogeneity of the set, thequality of the correlation is also of high standard with an R2
value of 0.87 and an MAD of 5 kJ·mol−1.For several of the low spin ground state models, the relation
between the energy of their respective π* orbital and theactivation energy along the low spin PES (LS-π path) is alsoincluded in the neutral correlation plot (Figure 5, red). Incontrast with the case of the charge 2+ complexes, a goodcorrelation is also obtained here. As mentioned before, topredict the minimum energy pathway, one would only have tocompute the spin gap between the two spin variants and thencompare the activation barriers obtained from the linearrelation on the two spin PESs, simply from the calculation of
the energies of the HS state σ* orbital and the LS state π*orbital. In the case of the LS path, although most of thecomplexes show large activation energy in the right part ofFigure 5, some of them counterintuitively yield a small barrier(41, 45, and even 43). This shows that, if the π* orbital is lowenough, the LS-π pathway in the case of neutral systems canalso provide efficient systems for CH activation (we again stressthat by LS we mean quartet/triplet cases).The correlations in Figures 4 and 5 illustrate that not only
high spin ground state complexes (shown as crosses) can beexpected to lie along the linear relation but also high spinexcited states (shown as diamonds), isomers, regardless of theirrelative stability (54 and 55), bimetallic complexes (41), heme-containing systems, inferring that iron-oxo orbitals facilitate theelectron transfer to the porphyrin ring (46−51), and, asmentioned before, complexes with radical ligands (43, 45, 47−51; see Tables S1, S2, and S3 in the SI for details).
■ DISCUSSIONThese correlations provide, on both sets of ligands, a fastprediction of the H-abstraction activation energy EACT(HS-σpath) on the S = 2 potential energy surface and in the case ofthe neutral molecules also for EACT(LS-π path) on the S = 1potential energy surface. The MAD for the activation energyranges between 4 and 11 kJ·mol−1, which is reasonably low fora first screening of a large potential set of ligands, provided thatthey correspond to the same charge for the (L)FeIVOcomplex. This translates into a deviation of ∼0.3 eV for thecharacteristic orbital energy (σ* or π*) of the Fe−oxo complex,and hence the approach cannot discriminate cases whereacceptor orbital energies are too close.For the +2 charge complexes, the correlation provides the
C−H activation barrier in the quintet (HS) spin manifold, butthis is the overall barrier only if the reactant complex is a spinquintet. For triplet complexes (diamonds in Figure 4), the spingap should be added, since spin−orbit coupling should yield ahigh probability for spin inversion and open the two statereactivity mechanism.32 The correlation provides the activityorder between two complexes only if the change in HS barriersdominates the variations in spin-gap. In the opposite case wherethe spin-gap variation dominates, reactivity prediction is out ofreach of our correlations.The division of the charge 2+ catalysts in two correlation
subsets (monodentate/multidentate) is remarkable and was notunderlined before. It shows that the energy of the σ* orbital isnot the only criterion governing the CH dissociation energy.For a given value of the σ* energy, the presence of themultidentate scaffold tends to lower the activation energy by∼25 kJ·mol−1. In the case of independent monodentate ligands,Fe is close to the plane of the equatorial ligands, in a ratherperfect geometry. This is not the case for the multidentateligands where the constraint imposed by the scaffold preventsthe coordinating atoms to occupy their optimal position in theequatorial plane (see the SI). As a result the Fe and equatorialligand show a pyramid shape, the ligands being bent away fromthe oxo group, and this distortion is often stronger in the TSthan in the reactant state (see Table S1, S2, and S3 in the SI).In other words, the FeIVO unit is pulled out above this plane(see also SI Figure S2). The correlations presented stem fromthe dominating two electron interaction between the C−Hoccupied orbital and the Fe-oxo acceptor orbital. The four-electron interaction between occupied states on methane andon the ligands is however non-negligible. Upon its approach,
Figure 5. Correlation between the energy of the σ* orbital of the Fe−oxo complex in electronvolts (x-axis) and the barrier height of the C−H abstraction step in kilojoules per mole (y-axis) for models 39−55,shown in black with all complexes considered in the high spin state(HS-σ path). Crosses indicate complexes with a high spin ground state(sextet/quintet), while diamonds those with a low spin (quartet/triplet). The correlation between the barrier height of the C−Habstraction step (on the low spin surface) and the energy of the π* ofcertain low spin ground state models is also included with reddiamonds and line (LS-π path).
ACS Catalysis Research Article
DOI: 10.1021/cs500996kACS Catal. 2015, 5, 2490−2499
2494
38 ∑Single site catalysis

methane feels less Pauli repulsion from the pyramidal FeOwith multidentate ligands than from complexes with mono-dentate ligands and this leads to a more favorable transitionstate energy at a given σ* energy. This effect will depend on themultidentate ligand which gives more scatter in the multi-dentate line (13−38) than in the case of the model complexes(1−12). The use of a multidentate ligand is also known toincrease the catalyst stability by reduction of the ligand lability.Thus, using a multidentate scaffold is essential to improve thedesign of FeIVO catalysts as it provides gains in stability andactivity at once.These correlations have been established with the OPBE
exchange correlation functional and in the gas phase. It isimportant to assess their general character. For practical reasonsthis has been performed on the subset of complexes 1−12 andon the HS surface. A second functional has been tested,B3LYP-D, and it also provides a clear linear relation. However,if the existence of a correlation between acceptor orbital energyand activation energy is general, the slope and offset aredependent on the chosen functional (see SI Figure S4). Thesecond method-related question concerns the influence ofsolvent. The implicit PCM method has been considered forthree different solvents (cyclohexane, acetonitrile, and water),and the resulting activation energy/acceptor orbital energyrelations are shown in Figure 6. A linear relation of high quality
holds for each choice of solvent. The solvent simply shields thepositive charge, so that the σ* orbital energy is less stabilized,the effect being smaller with cyclohexane with low dielectricconstant and saturating for acetonitrile/water. The proposedlinear relation hence still holds in the presence of a solvent, andthe slope is unchanged within error bars. At the same time, thesolvent increases the C−H activation barrier for a given ligand,and the effect is stronger for highly polar solvents. This explainsthe preference for a low polarity solvent, like the alkane itself,for alkane partial oxidation with Fe−oxo complexes. This effect
is however dependent on the choice of ligand, since this choiceaffects the electrostatic properties of the complex, the barrierfor 10 being increased by only 20 kJ·mol−1 between vacuumand water, while that of 7 is increased by 77 kJ·mol−1. Hencethe reactivity order between various ligands is dependent on thechoice of solvent, e.g. 7 is more reactive than 9 and 10 incycloxexane but less reactive in acetonitrile.Therefore, once calibrated with a few points, such relations
represent a practical way to evaluate the activation barrier onthe HS surface, with several exchange correlation functionalsand solvent polarities, since it only requires to calculate theenergy of the σ* orbital in the Fe−oxo complex. It has also astrong potential to be extended to other catalytic reactions.Beyond this numerical aspect, the linear relation also
provides simple chemical insight since it allows us to link theCH bond dissociation activation energy for a given spin statewith a simple quantity, the energy of the lower lying acceptororbital of the FeIVO catalyst, for which we have manyguidelines from molecular orbital theory. The energy of thisorbital is simply related with the electronic character of theligands, electron donating ligands pushing it to higher energyand electron withdrawing ones in contrast lowering its energy,and hence yielding a lower barrier for CH activation. This cangive simple and powerful design ideas to the chemists.This effect is clearly illustrated on the first subgroup of the
first set (models 1−12, black line). Weakly donating H2Oligands are progressively substituted by stronger amine typedonors (1−8), shifting up the σ*(FeO) orbital. From theshape of the dz2(Fe) orbital, the substitution of the axial ligandis more effective than that of the equatorial ones as alreadydiscussed in the literature44 and nicely illustrated experimen-tally on a cyclam series.45
As indicated in the introduction, a BEP type linear relationhas been proposed earlier on a set of Fe and Mn oxocomplexes, linking the H abstraction barrier to the reactionenergy ΔE.12,13 In the present paper, the reactivity descriptor isnot the total reaction energy, but an electronic structureparameter: the energy of the (initially vacant) acceptor orbitalof the Fe−oxo complex. Although both types of relations arepotentially interesting, one advantage of the present approach isthat as said just above, molecular orbital theory gives usqualitative tools to predict the variation of the σ* energy as afunction of the type of ligands.These correlations have been established with GGA
exchange correlation functionals (OPBE mainly, and B3LYP-D in one case) that have already proven a reasonable accuracyfor the electronic structure and catalytic reactivity ofcoordination complexes. To the best they would reproducethe DFT energy and hence cannot perform better than thesefor the comparison with experimental results. In addition, theintrinsic error forbids distinguishing ligands that yield similarenergy for the acceptor orbital, in a window of 0.3 eV, and caseswhere the complex is not high spin add the complication of thespin-gap. Some of the mentioned complexes are comprised ofmodel ligands and this type of ligand searches should ideally beperformed in tandem with experimental work. Hence, we willnow discuss how the results from the linear relations comparewith experimental data on the reactivity of iron oxo complexes.Such a comparison should optimally be performed bycomparing to measured reaction rates.The guanidyl ligand series (18−20) nicely demonstrates how
the modulation of the donor properties of the ligand enables totune the reactivity, in the case of complexes with charge +2 and
Figure 6. Correlation between the energy of the σ* orbital of thereactant in electronvolts (x-axis) and the barrier height of the C−Habstraction step in kilojoules per mole (y-axis) for models 1−12 (HS-σpath), demonstrating the solvation effect. Green crosses and line referto cyclohexane (ε = 2.02), red to acetonitrile (ε = 35.69), and blue towater (ε = 78.36) implicit solvent calculations. The gas phasecalculations are recalled for comparison with black crosses and line.
ACS Catalysis Research Article
DOI: 10.1021/cs500996kACS Catal. 2015, 5, 2490−2499
2495
∑Single site catalysis 39

with a HS quintet ground state. From TMG3tren (18) toTMG2dien−CH3CN (20), one arm of the ligand is removedand a solvent molecule CH3CN occupies the vacant equatorialcoordination site. The change for a weaker donor ligand pullsdown the energy of the σ* orbital by 0.47 eV and activates theFeIVO core. The HS barrier is here the global C−Hactivation barrier and is reduced by 18 kJ·mol−1, in agreementwith the experimental gain in the kinetic constant, by a factor of630 for 9,10-dihydroanthracene.37 A further activation can berealized by the removal of CH3CN solvent molecule (19).Again, the σ* orbital is stabilized (by 0.4 eV) and the activationbarrier is reduced by an extra 17 kJ·mol−1.The reactivity of the Fe-oxo complex with benzimidazol 37
has been evaluated in the same conditions as 18 and 20, and itwas found to be 100 to 3000 times more reactive than 18.38
The Fe−oxo complex initially coordinates a solvent CH3CNand is low spin (S = 1), but it is likely that the solvent moleculedeparts to form the reactive trigonal bipyramidal high spin (S =2) complex. Compared to 18, 37 reduces the donor capacity ofthe equatorial N groups, which move the σ* orbital 0.9 eV tolower energy. As a result the barrier on the HS surface ismarkedly reduced, in relation with the experimental result.The cyclam family (34−36) remains on the charge 2+ case
but shows a LS triplet ground state. The contraction of thescaffold with one carbon less in TMC-13 (36) than in TMC-14(34) has little influence on the energy of the σ* orbital, nor onthe spin-gap (see SI Table S1). Experiment however showsthat, if acetonitrile is used as solvent, the iron−oxo complexwith 34 accepts a solvent molecule in axial position (noted35).46 The strong effect of a donor ligand in axial discussedabove pushes the σ* orbital to higher energy by 1.5 eV andhence, following the linear relation, strongly increases the C−Hdissociation barrier on the HS surface. In principle the spin-gapfrom triplet to quintet in the reactant complex should be addedto obtain the global barrier, but the effect is large enough (90kJ·mol−1) here to allow a direct conclusion. The contracted ringof 36 is too narrow to allow the coordination of acetonitrile andthe axial position remains vacant, hence keeping a low σ*orbital and a high reactivity. This is in good agreement withexperiment where the complex TMC-13 (36) is much morereactive than that with TMC-14 (34) in acetonitrile. From ourlinear relations one can suggest a further modification in thecyclam family 34−36. In addition to the ring contraction toremove the acetonitrile, one can also play on the nature of thedonor atom, replacing nitrogen by oxygen hence leading to aza-crown ether (13, 14).The comparison of the reactivity of a low spin and a high
spin complex should be done with care. 20 and 29 have beenexperimentally studied in similar conditions, and 20 is 15−30times more active than 29, depending on the substrate. Figure 4indicates that 20 presents a σ* orbital 0.8 eV higher in energyand, following the linear relation, a barrier of 139 kJ·mol−1 onthe HS surface, 37 kJ·mol−1 larger than that of 29. This couldseem in disagreement with the experiment, but disregards thefact that 29 is a low spin complex. The barrier on the LS surfaceis calculated at 147 kJ·mol−1, and the promotion from the LS tothe HS state for the reactant costs 52 kJ·mol−1, which puts theglobal barrier through the HS TS at 154 kJ·mol−1. Hence 29 iscalculated to be less active than 20, well in line with themeasured reactivity.Recently, the oxidative properties of a series of N5 ligands
have been investigated experimentally by varying the N-donorgroups (pyridyl, bispidine, or amino, 29−33).47 Charge 2+
octahedral Fe-oxo complexes are obtained and their groundstate is a triplet. The five points fall very close to the linear fit ofFigure 4, but the corresponding σ* energies only differ by amaximum of 0.25 eV (less than the error related uncertainty forthe σ* energies of 0.3 eV) and points 30, 32, and 33 almostoverlap. The range in calculated activation energies on the HSsurface is hence also small (EACT = 102−113 kJ·mol−1). Inaddition since the complex are low-spin, the spin gap should beadded to the HS activation energy to obtain the globalactivation energy. In fact, the variation of the triplet-quintetenergy gaps is much larger than that of the HS barriers andcontrols the relative activity (EGAP = 26−52 kJ·mol−1). Hence,we are here clearly at the limit of applicability of the method.For instance, the two bicyclic bispidine (32, 33) have almostthe same HS barrier around 110 kJ·mol−1. The observed greateractivity of 33 lies in the spin gap, 15 kJ·mol−1 smaller than thatof 32. Similarly, 31 is 10 times more active than 29, while theHS barriers are 106 and 102 kJ·mol−1, respectively. The correctorder in barriers is retrieved after addition of the spin gaps toobtain the global barriers, respectively 142 and 154 kJ·mol−1.For this family of low spin complexes, the reactivity is notcontrolled by the energy of the σ* orbital (since changes aresmall) but rather by variations in the spin gaps and possibleinfluence of the second coordination sphere.48
The last comparison with experiment will focus on the set ofneutral complexes. Synthetic porphyrins were among the firstcomplexes to be involved in the biomimetic C−H oxidationeffort.3 First generation iron porphyrins (FeIIITPPCl, 48)perform well for various partial oxidation reactions, such as thecyclohexane to cyclohexanol conversion.49 Our approach(Figure 5) fittingly predicts the superiority of the TPP(tetraphenylporphyrin) and TDCPP (tetrakis (2, 6-dichlorophenyl)porphyrin) (48 and 49, respectively) over theTMP (tetramesitylporphyrin) type (50).50−52 The axial ligandeffect in porphyrins is known to differ from the nonhemecomplexes: a stronger donor leads to a greater activity.53 Theinduced variations of reactivity have been shown to correlatemainly with the stability of the intermediate and the ease of therebound step.49 Those effects are out of reach of our simplescreening approach based on the electronic structure of theFeO complex.In final, it is important to underline that comparisons with
experiments have to be considered carefully as a relevant articleby Nam and co-workers demonstrates,54 since yields andalcohol to ketone ratios depend profoundly on the respectiveconditions, such as the type of solvent used, the amount andkind of oxidant, and the manner the various counterionsinteract with the metal center. Nevertheless, if one keeps inmind the limited accuracy in acceptor orbital energy (0.3 eV)and the fact that these correlations mainly apply to the HSenergy surface, the above comparisons validate our approach.As a consequence, these correlations have a potential for the
design of optimal ligands, specifically tuned to minimize the C−H activation energy using Fe−oxo complexes. A strategy tolower the reaction barrier can be, for example, to replacestrongly electron donor trimethylamine ligands by imineligands in the equatorial plane as illustrated on simple modelsystems (22 → 24 → 23). An even more efficient approach isto act on the axial ligand and to replace it by a noncoordinatingcarbon atom (i.e., 22 → 27). This switches from a tetradentateto a tridentate ligand and blocks the axial position of thecomplex, yielding a strong reduction of both the σ* energy andthe CH activation barrier. These two strategies can be
ACS Catalysis Research Article
DOI: 10.1021/cs500996kACS Catal. 2015, 5, 2490−2499
2496
40 ∑Single site catalysis
combined and this leads to an optimal model complex with apredicted barrierless C−H abstraction in vacuum (28, EACT: 0.3kJ·mol−1) and hence a low barrier in cyclohexane. Hence, fromthe analysis of the first set of complexes (2+ charge), severalguidelines can be extracted to design efficient nonhemeoxidation catalysts based on the FeIVO moiety. One shouldtry to reach a high-spin FeIVO active species with a low lyingσ* orbital combining (i) a weak equatorial ligand field, using inparticular a tridentate ligand, and (ii) the weakest possible axialligand field, blocking the axial site with noncoordinating carbon,for instance.To propose potential efficient oxidation catalysts, one can
also target the neutral oxo complexes of the second set (Figure3) extracted from literature such as heme-complexes50−52 orderived from commercially available Fe complexes. Such achoice of neutral complexes avoids spurious effects ofcounterions. The porphyrin complexes included in this workare found in the right section of the correlation plot (Figure 5,46−51) with computed barriers for the C−H dissociation stepof over 100 kJ·mol−1. The computational screening and theproposed σ* energy descriptor however underlines much moreefficient systems and predicts the complexes found well to theleft on the correlation line (e.g., 41, 42, 45, 52) as primecandidates for the task. Following the strategies extracted fromthe model systems analysis, they exhibit a weak equatorialligand field, no ligand in the axial position and a firstcoordination sphere replete by the multidentate ligand. Thehigh activity of these complexes is a prediction from our studysince to our knowledge they have not yet been tested for alkanepartial oxidation yet. A potential limitation is that thesecomplexes also correspond often to weak metal ligandinteractions (see SI Figures S3a and b) so that their stabilitymight be an issue. They might appear only as short-livedintermediates in the catalytic cycle. However, some possiblecandidates combine a reasonable stability and good activity.Complex 45 derived from FeIII−citrate, specifically triedbecause of the resemblance with 26−28, is the most stable ofthe neutral set by virtue of its strongly donating carboxylategroups. However, it also combines a trigonal equatorial ligandsphere and an axial site being blocked by a noncoordinatingcarbon in a multidentate ligand. Therefore, its low-spin groundstate exhibits a low-lying π* that opens the LS path with areasonable activation barrier (EACT = 77 kJ·mol−1). Interest-ingly, this path is more active than the two-state scenario (spincrossing and HS-transition state). This potential catalystdemonstrates that design strategies could also target the LSpath efficiently using the correlation we have established here.Next, the very simple FeII−oxalate complex (52), provided thatno extra strong ligand could coordinate Fe in the reactionmedia, or the associated dimer (41) seem to be other verypromising catalysts. The reasonable stability of the FeIVO-oxalate is combined with good activity (EACT = 87 kJ·mol−1),enrooted in an HS ground state and a low-lying σ*. It would beof great interest to test those candidates experimentally. Then,the potential synthetic modifications of those complexes couldbe tested primarily in silico using the correlation presented inthis article. These potential catalysts have been evaluated in theabsence of solvent. Our model study (Figure 6) howeverindicates that a solvent with low dielectric constant and weakcoordinating capabilities, as cyclohexane, is the best choice,while acetonitrile, frequently used in the literature, might not bethe optimal solvent due to its ligand capability.
■ CONCLUSIONClear linear relations have been demonstrated between theactivation energy for C−H dissociation on the HS (sextet/quintet) energy surface and the σ* acceptor orbital of the initial(L)FeIVO complex. In addition for the neutral LS oxocomplexes (quartet/triplet) a relation between π* acceptororbital and activation energy on the low-spin surface also holds.Although initially established for the OPBE functional, theselinear relations have a general character, however the relationparameters (slope and offset) can depend on the choice offunctional and on the solvent. Comparison with experimentsvalidate the concept, although these comparisons have to beperformed with care due to the uncertainty in acceptor orbitalenergy, to potential two-state reactivity, and to the influence ofthe solvent. The correlation trend-lines included here can hencebe used as a powerful tool for the rational design of iron−oxocatalysts for C−H activation. The barrier prediction error lies inthe 4−11 kJ·mol−1 range, an accuracy that is attained by therobustness of the correlation and the wide range of the data set.The approach described has a twofold advantage, assisting theligand design process in the lab and allowing for very fastscreening of potential candidate models that are commerciallyavailable. In addition, it links the reactivity with simplemolecular orbital concepts that can be applied at no cost forthe generation of potential ligand candidates.Molecular orbital descriptors hence appear to be more than a
qualitative analysis tools but they can be transformed inquantitative relations providing key insights for the rationalexploration of potentially efficient ligands and catalysts.
■ METHODSAll calculations were performed using the Gaussian 09program.55 Unless stated otherwise, they were performed inthe gas-phase and refer to zero Kelvin temperature and ideal gasconditions, which may be different from room temperatureexperiments in a solution. The DFT functional employed is theOPBE, comprised by the Handy’s OPTX modification ofBecke’s exchange functional (O)56 and the 1996 correlationfunctional of Perdew, Burke, and Ernzerhof (PBE).57 For anadditional DFT functional, see the SI Figure S4. Dunning’scorrelation consistent basis sets where utilized as follows: forthe Fe, Cl atoms, the triple-ζ (cc-pVTZ) was employed, whilefor the C, H, N, and O atoms this was the double-ζ cc-pVDZ.58
Transition state optimizations were performed using the Bernyalgorithm59 and resulted in a structure with a single imaginaryfrequency that corresponded to the expected methane C−Hbond stretch and was followed by intrinsic reaction coordinatecalculations (IRC60) to verify the link to the expected reactantsand products. For many complexes (such as 8, 15, and 22), itwas possible to locate both the HS-σ and HS-π path transitionstates, while for others the σ*−π* energy gap was large enoughto be prohibitive for locating the energetically disfavored π-path. All barrier values reported are calculated with respect tothe “reactant complex” on the same spin surface as the relevanttransition state. When a “low spin, LS” complex is mentioned inthe text, this indicates a state lying on the triplet/quartetsurface, while “high spin, HS” in the quintet/sextet, as perusual. The solvation method utilized is the PCM method asimplemented in Gaussian 09.61−63 It should also be stressedthat the work presented here only focuses on the FeIVOunstable intermediates of the catalytic cycle. The reported spingaps (SI Tables S1−S3) should not be confused with, and
ACS Catalysis Research Article
DOI: 10.1021/cs500996kACS Catal. 2015, 5, 2490−2499
2497
∑Single site catalysis 41

might radically differ, from their respective FeII/FeIII bare sitespin gaps that are reported experimentally.
■ ASSOCIATED CONTENT*S Supporting InformationThe following file is available free of charge on the ACSPublications website at DOI: 10.1021/cs500996k.
Geometric and energy data, additional correlation plotsand counterion effects, Cartesian coordinates of opti-mized structures, and spin densities (PDF)
■ AUTHOR INFORMATIONCorresponding Author*E-mail: [email protected] authors declare no competing financial interest.
■ ACKNOWLEDGMENTSP.C.A. acknowledges Solvay for the financial support. We alsothank the PSMN at ENS de Lyon for computational resources.
■ REFERENCES(1) Solomon, E. I.; Brunold, T. C.; Davis, M. I.; Kemsley, J. N.; Lee,S.-K.; Lehnert, N.; Neese, F.; Skulan, A. J.; Yang, Y.-S.; Zhou, J. Chem.Rev. 2000, 100 (1), 235−350.(2) Borovik, A. S. Chem. Soc. Rev. 2011, 40, 1870−1874.(3) Costas, M. Coord. Chem. Rev. 2011, 255, 2912−2932.(4) Talsi, E. P.; Bryliakov, K. P. Coord. Chem. Rev. 2012, 256, 1418−1434.(5) McDonald, A. R.; Que, L., Jr. Coord. Chem. Rev. 2013, 257, 414−428 and references therein. .(6) Hohenberger, J.; Ray, K.; Meyer, K. Nat. Commun. 2012, 3, 720−733.(7) Rittle, J.; Green, M. T. Science 2010, 330, 933−937.(8) Price, J. C.; Barr, E. W.; Tirupati, B.; Bollinger, J. M., Jr.; Krebs, C.Biochemistry 2003, 42, 7497−7508.(9) Groves, J. T. J. Inorg. Biochem. 2006, 100, 434−447.(10) Cho, K.; Leeladee, P.; McGown, A. J.; DeBeer, S.; Goldberg, D.P. J. Am. Chem. Soc. 2012, 134, 7392−7399.(11) Yosca, T.; Rittle, J.; Krest, C. M.; Onderko, E. L.; Silakov, A.;Calixto, J. C.; Behan, R. K.; Green, M. T. Science 2013, 342, 825−829.(12) de Visser, S. P. J. Am. Chem. Soc. 2010, 132, 1087−1097.(13) Saouma, C. T.; Mayer, J. M. Chem. Sci. 2014, 5, 21−31.(14) Evans, M. G.; Polanyi, M. Trans. Faraday Soc. 1938, 34, 11−24.(15) Fukui, K.; Yonezawa, T.; Shingu, H. J. Chem. Phys. 1952, 20,722−725.(16) Woodward, R. B.; Hoffmann, R. Angew. Chem., Int. Ed. Engl.1969, 8, 781−853.(17) Mayer, J. M. Acc. Chem. Res. 2011, 44, 36−46.(18) Usharani, D.; Janardanan, D.; Li, C.; Shaik, S. Acc. Chem. Res.2013, 46, 471−482.(19) Buda, F.; Ensing, B.; Gribnau, M. C. M.; Baerends, E. J. Chem. -Eur. J. 2001, 7, 2775−2783.(20) Buda, F.; Ensing, B.; Gribnau, M. C. M.; Baerends, E. J. Chem. -Eur. J. 2003, 9, 3436−3444.(21) Louwerse, M. J.; Baerends, E. J. Phys. Chem. Chem. Phys. 2007, 9,156−166.(22) Decker, A.; Clay, M. D.; Solomon, E. I. J. Inorg. Biochem. 2007,100, 697−706.(23) Ye, S.; Neese, F. Proc. Natl. Acad. Sci. U. S. A. 2011, 108, 1228−1233.(24) Decker, A.; Rohde, J.-U.; Klinker, E. J.; Wong, S. D.; Que, L., Jr.;Solomon, E. I. J. Am. Chem. Soc. 2007, 129, 15983−15996.(25) Srnec, M.; Wong, S. D.; England, J.; Que, L., Jr.; Solomon, E. I.Proc. Natl. Acad. Sci. U. S. A. 2012, 109, 14326−14331.(26) Shaik, S.; Chen, H.; Janardanan, D. Nat. Chem. 2011, 3, 19−27.
(27) Michel, C.; Baerends, E. J. Inorg. Chem. 2009, 48, 3628−3638.(28) Ye, S.; Geng, C.-Y.; Shaik, S.; Neese, F. Phys. Chem. Chem. Phys.2013, 15, 8017−830.(29) Srnec, M.; Dong, S. D.; Solomon, E. I. Dalton Trans. 2014, 43,17567−17577.(30) Britovsek, G. J. P.; England, J.; White, A. J. P. Inorg. Chem. 2005,44, 8125−8134.(31) England, J.; Martinho, M.; Farquhar, E. R.; Frisch, J. R.;Bominaar, E. L.; Munck, E.; Que, L., Jr. Angew. Chem., Int. Ed. 2009,48, 3622−3626.(32) Schroder, D.; Shaik, S.; Schwarz, H. Acc. Chem. Res. 2000, 33,139−145.(33) Bernasconi, L.; Baerends, E. J. Eur. J. Inorg. Chem. 2008, 10,1672−1681.(34) Rohde, J.-U.; In, J.; Lim, M. H.; Brennessel, W. W.; Bukowski,M. R.; Stubna, A.; Munck, E.; Nam, W.; Que, L., Jr. Science 2003, 299,1037−1039.(35) Hong, S.; So, H.; Yoon, H.; Cho, K.-B.; Lee, Y.-M.; Fukuzumi,S.; Nam, W. Dalton Trans. 2013, 42, 7842−7845.(36) Wang, D.; Ray, K.; Collins, M. J.; Farquhar, E. R.; Frisch, J. R.;Gomez, L.; Jackson, T. A.; Kerscher, M.; Waleska, A.; Comba, P.;Costas, M.; Que, L., Jr. Chem. Sci. 2013, 4, 282−291.(37) England, J.; Guo, Y.; Van Heuvelen, K. M.; Cranswick, M. A.;Rohde, G. T.; Bominaar, E. L.; Munck, E.; Que, L., Jr. J. Am. Chem. Soc.2011, 133, 11880−11883.(38) Seo, M. S.; Kim, N. H.; Cho, K.-B.; So, J. E.; Park, S. K.;Clemancey, M.; Garcia-Serres, R.; Latour, J.-M.; Shaik, S.; Nam, W.Chem. Sci. 2011, 2, 1039−1045.(39) Chen, H.; Lai, W.; Shaik, S. J. Phys. Chem. Lett. 2010, 1, 1533−1540.(40) Bigi, J. P.; Harman, W. H.; Lassalle-Kaiser, B.; Robles, D. M.;Stich, T. A.; Yano, J.; Britt, R. D.; Chang, C. J. J. Am. Chem. Soc. 2012,134, 1536−1542.(41) Lacy, D. C.; Gupta, R.; Stone, K. L.; Greaves, J.; Ziller, J. W.;Hendrich, M. P.; Borovik, A. S. J. Am. Chem. Soc. 2010, 132, 12188−12190.(42) Guell, M.; Luis, J. M.; Sola, M.; Swart, M. J. Phys. Chem. A 2008,112, 6384−6391.(43) Janardanan, D.; Usharani, D.; Chen, H.; Shaik, S. J. Phys. Chem.Lett. 2011, 2, 2610−2617.(44) Bernasconi, L.; Louwerse, M. J.; Baerends, E. J. Eur. J. Inorg.Chem. 2007, 19, 3023−3033.(45) de Visser, S. P.; Rohde, J.-U.; Lee, Y.-M.; Choc, J.; Nam, W.Coord. Chem. Rev. 2013, 257, 381−393.(46) Hong, S.; Hee, S.; Yoon, H.; Cho, K.-B.; Lee, Y.-M.; Fukuzumi,S.; Nam, W. Dalton Trans. 2013, 42, 7842−7845.(47) Wang, D.; Ray, K.; Collins, M. J.; Farquhar, E. R.; Frisch, J. R.;Gomez, L.; Jackson, T. A.; Kerscher, M.; Waleska, A.; Comba, P.;Costas, M.; Que, L., Jr. Chem. Sci. 2013, 4, 282−291.(48) Sahu, S.; Widger, L. R.; Quesne, M. G.; de Visser, S. P.;Matsumura, H.; Moenne-Loccoz, P.; Siegler, M. A.; Goldberg, D. P. J.Am. Chem. Soc. 2013, 135, 10590−10593.(49) Takahashi, A.; Yamaki, D.; Ikemura, K.; Kurahashi, T.; Ogura,T.; Hada, M.; Fujii, H. Inorg. Chem. 2012, 51, 7296−7305.(50) Groves, J. T.; Nemo, T. E.; Myers, R. S. J. Am. Chem. Soc. 1979,101, 1032−1033.(51) Khavasi, H. R.; Davarani, S. S. H.; Safari, N. J. Mol. Catal. A:Chem. 2002, 188, 115−122.(52) Iamamoto, Y.; Assis, M. D.; Ciuffi, K. J.; Sacco, H. C.; Iwamoto,L.; Melo, A. J. B.; Nascimento, O. R.; Prado, C. M. C. J. Mol. Catal. A:Chem. 1996, 109, 189−200.(53) Kang, Y.; Chen, H.; Jeong, Y. J.; Lai, W.; Bae, E. H.; Shaik, S.;Nam, W. Chem. - Eur. J. 2009, 15, 10039−10046.(54) Cho, K.; Kim, E. J.; Seo, M. S.; Shaik, S.; Nam, W. Chem. - Eur. J.2012, 18, 10444−10453.(55) Frisch, M. J. Gaussian 09, Revision A.02; Gaussian, Inc.,Wallingford CT, 2009; full citation in the SI.(56) Hoe, W. M.; Cohen, A.; Handy, N. C. Chem. Phys. Lett. 2001,341, 319−328.
ACS Catalysis Research Article
DOI: 10.1021/cs500996kACS Catal. 2015, 5, 2490−2499
2498
42 ∑Single site catalysis

(57) Perdew, J. P.; Burke, K.; Ernzerhof, M. Phys. Rev. Lett. 1996, 77,3865−3868.(58) Dunning, T. H., Jr. J. Chem. Phys. 1989, 90, 1007−1023.(59) Schlegel, H. B. J. Comput. Chem. 1982, 3, 214−218.(60) Hratchian, H. P.; Schlegel, H. B. J. Chem. Theory Comput. 2005,1, 61−69.(61) Scalmani, G.; Frisch, M. J. J. Chem. Phys. 2010, 132, 114110−15.(62) Improta, R.; Barone, V.; Scalmani, G.; Frisch, M. J. J. Chem.Phys. 2006, 125, 054103−9.(63) Improta, R.; Scalmani, G.; Frisch, M. J.; Barone, V. J. Chem.Phys. 2007, 127, 074504−9.
ACS Catalysis Research Article
DOI: 10.1021/cs500996kACS Catal. 2015, 5, 2490−2499
2499
∑Single site catalysis 43

44 ∑Single site catalysis

3
OXYGENATES CONVERSION BY
METALLIC HETEROGENEOUS
CATALYSTS
My main research line as a CNRS researcher is dedicated to the conver-sion of biomass-derived molecules into chemicals by metallic heteroge-neous catalysts.
A typical target is the conversion of glycerol into various chemicalsof interests such as 1,2-propanediol, 1,3-propanediol, lactic acid etc.This target nicely illustrates the two main challenges that we face tomodel such systems: (i) complexity of the reaction networks ; (ii) com-plexity of the catalytic system. I worked on this system for years, in col-laboration with experimentalists in catalysis (C. Pinel and M. Besson,Lyon, France). I started working in the domain with F. Auneau, aPhD student who was combining modeling and experiments during hisproject on the hydrogenolysis of glycerol. This first collaboration wascontinued with the ANR Galac project and the PhD of J. Zaffran, thatwas mainly dedicated to the design fast methodologies to screen in sil-ico the catalytic activity of metals towards polyol dehydrogenation. Itopens the door to the efficient screening of the large reaction networksof higher polyols, the target of our current ANR Music project (1PhDand 1 post Doc) in collaboration with D. Vlachos, uDelaware, USA andA. Goetz, UCSD, USA.
45

46 ∑Heterogeneous Catalysis
In most cases, the conversion of biomass derived molecules is donein liquid phase, usually using water as a solvent. This solvent canconsiderably affects the catalytic activity of metallic supported cata-lysts1,14,21 Thus, the inclusion of water is a necessity to properly modeland understand the behavior of those catalysts. Based on a simplemicro-solvation approach, we were able to interpret the influence of wa-ter in two different contexts (i) the oxidation of alcohols on Pt, duringthe master project of S. Chibani.27 (ii) the hydrogenation of levulinicacid as a first step toward �-valerolactone in collaboration with A. Rup-pert (Lodz, Poland).32 Finally, based on this model, we were able toexplain why Ruthenium is widely used in biomass valorisation and notin gas phase reactions.31 Those studies demonstrate the needs for bettermethods to described the reactivity at metal/liquid water interfaces, anaspect that is central to the ANR Music in collaboration with A. Goetz,San Diego.
I have recently enlarged my research to the amination of alcohols byammonia in collaboration with Solvay and the E2P2 Lab in Shanghai,China. During his PhD, A. Dumon focused on the later. He demon-strated that one of the reactant (ammonia) strongly modify the catalyticrelative activity of Ni and Pd metallic catalysts. T. Wang has just starteda screening in silico based on the combination of scaling relations, BEPrelations and micro-kinetics. He is also working on the deactivationprocesses of Ni under the reactive conditions (Shapes project).
Asolventnother important aspect in green chemistry is to avoid touse H2 and favors the hydrogen transfer from sustainable feedstock. Incollaboration with A. Ruppert, Lodz, Poland, we are currenlty workingon the hydrogen transfer from formic acid to levulinic acid to generate�-valerolactone. We first considered the impact of the preparation ofRu-based catalysts on the overall activity33 We are now considering al-loying as a strategy to overcome the intrinsic limitations of monometal-lic systems.

∑Heterogeneous Catalysis 47
3.1 Complex reaction networks
Glycerol is a tri-ol that can be directly obtained by vegetable oil trans-esterification or by transformation of cellulose. It is an interesting plat-form molecule, not only per se but also as a typical model of morecomplex polyols that are more up-stream in the cellulose valorisa-tion.8,10,19,23 This small triol is a typical example of the challenges thatcatalysis has to overcome to produce chemicals for industry with highyield and high selectivity.15 With three alcohols function, two at the ter-minal positions and one at the central position of the C3 molecule, therequired chemioselectivity is difficult to achieve for a heterogeneouscatalyst. In addition, the extension of the reaction network and the reac-tion conditions impede a deep understanding of the activity at a molec-ular level, a necessary step for a rational design. Some steps of thereaction network are catalyzed by the metal supported catalyst whileothers are solution equilibria that are sensitive to the pH, the solventetc. Even the surface reactions might be impacted by the solution. Andneither experiments, neither simulations can provide a complete pictureof the reactive events occurring at the water/catalyst interface in thoserange of pressure and temperature.
Glycerol can be converted in various interesting chemicals depend-ing on the type of catalysts. We focused on hydrogenolysis conditions.In our case, the target polyol is reduced using a pressure of dihydro-gene (around 50 bar) at a mid-range temperature (180°C) in alkalinewater using a supported Rh catalyst. While the initial target was the1,3-propanediol (1,3-PDO), our collaborators (F. Auneau, IRCELyon)obtained mainly the 1,2-propanediol (1,2PDO) and the lactic acid (LA).The production of LA came as a surprise and this product became ourtarget as an interesting platform in the biobased chemical industry.6 Inthose conditions, the initial step was highly debated, being either a de-hydrogenation or a dehydration. Based on our periodic DFT calcula-tions at the GGA level, we were able to propose a reaction mechanismthat starts with the dehydrogenation of glycerol on its terminal position,
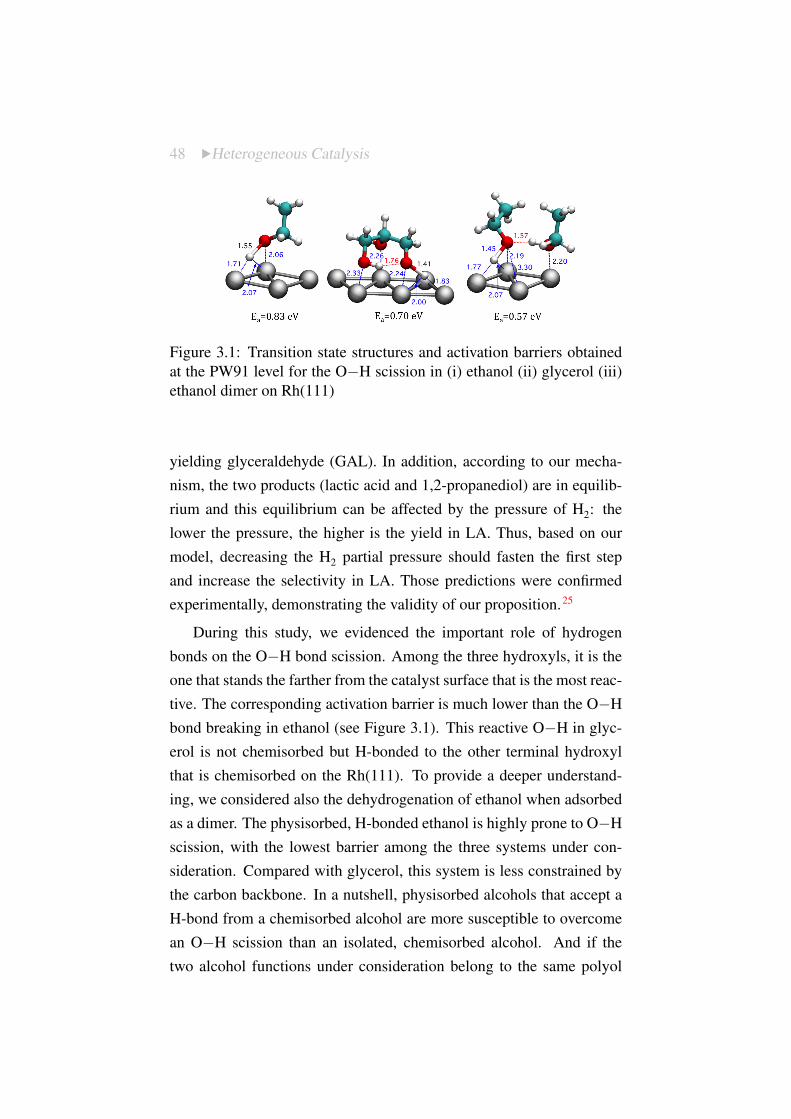
48 ∑Heterogeneous Catalysis
Figure 3.1: Transition state structures and activation barriers obtainedat the PW91 level for the O�H scission in (i) ethanol (ii) glycerol (iii)ethanol dimer on Rh(111)
yielding glyceraldehyde (GAL). In addition, according to our mecha-nism, the two products (lactic acid and 1,2-propanediol) are in equilib-rium and this equilibrium can be affected by the pressure of H2: thelower the pressure, the higher is the yield in LA. Thus, based on ourmodel, decreasing the H2 partial pressure should fasten the first stepand increase the selectivity in LA. Those predictions were confirmedexperimentally, demonstrating the validity of our proposition.25
During this study, we evidenced the important role of hydrogenbonds on the O�H bond scission. Among the three hydroxyls, it is theone that stands the farther from the catalyst surface that is the most reac-tive. The corresponding activation barrier is much lower than the O�Hbond breaking in ethanol (see Figure 3.1). This reactive O�H in glyc-erol is not chemisorbed but H-bonded to the other terminal hydroxylthat is chemisorbed on the Rh(111). To provide a deeper understand-ing, we considered also the dehydrogenation of ethanol when adsorbedas a dimer. The physisorbed, H-bonded ethanol is highly prone to O�Hscission, with the lowest barrier among the three systems under con-sideration. Compared with glycerol, this system is less constrained bythe carbon backbone. In a nutshell, physisorbed alcohols that accept aH-bond from a chemisorbed alcohol are more susceptible to overcomean O�H scission than an isolated, chemisorbed alcohol. And if thetwo alcohol functions under consideration belong to the same polyol

∑Heterogeneous Catalysis 49
molecule, then, this H-bond assistance is partially compensated by abackbone constraint.29
Then, we started to enlarge our scope to other metals such as Irid-ium.26 However, to open the door to a screening in silico, it was neces-sary to develop screening tools for dehydrogenation reactions of polyolsprovided the extensiveness of the corresponding reaction network. Wefocused on the Bronsdet-Evans-Polyani (BEP) relations for the C�Hand O�H bond scissions in (poly)-alcohols on a series of transitionmetals. BEP relations aim at correlating the kinetics with the thermody-namics of a series of elementary steps. Several choices can be made torepresent the kinetics (activation energy, energy of the transition staterelative to a reference) and the thermodynamics (reaction energy, en-ergy of the initial or final state relative to the reference). Those relationsare classically used to relieve the computational burden of optimizinga high number of transition states. We started assessing the commit-ted error when using various types of Bronsdet-Evans-Polyani (BEP)relations for the C�H and O�H bond scissions in simple alcohols onRh(111). We demonstrated that the quality of a BEP relation dependson the choices made to cluster the elementary steps and to represent therelation. With an adequate choice, an accurate linear energy relation-ship is obtained for the O�H and C�H bond breaking on Rh(111). Wethen show that this relation can then be used for a fast prediction of thereactivity of glycerol on Rh(111) with a systematic deviation of 0.1 eVthat can be imputed to intramolecular effects occurring in glycerol.34
Upon the extension to a series of transition metals, (Co, Ni, Ru, Rh,Pd, Ir, and Pt), we kept the separation of the elementary steps in twosets: (i) O�H scission (ii) C�H scission. Then, for each set, a singlelinear relation can be constructed for all metals together on the basisof the original Brønsted-Evans-Polanyi formulation with a mean abso-lute error smaller than 0.1 eV. In addition, a close statistical analysisdemonstrates that errors stemming from such predictive models are notuniform along the set of metals and of chemical reactions that is con-sidered opening the road to a better control of error propagation.35

50 ∑Heterogeneous Catalysis
3.2 Effect of water solvent
Once we have evidenced the impact of hydrogen bonds on the O�Hscission on Rh(111), a question raises naturally: what is the role ofwater solvent on the catalytic performance of metal supported catalysts?
To better understand how general is this assistance by hydrogenbond on the O�H breaking, we have systematically analyzed this re-active event in three systems: (i) a single water molecule, chemisorbedon the metallic surface (ii) a physisorbed water molecule, that ac-ceptes a H-bond from a chemisorbed water molecule respectively(iii)a chemisorbed water molecule, that donates a H-bond to a physisorbedwater molecule. The last two systems correspond to the two possibilitiesof O�H scission in a water dimer adsorption on a metallic surface. Ona series of transition metals (Ru, Co, Rh, Ir, Ni, Pd, Pt), the scission ofthe O�H is always easier in the physisorbed water.30 This bond scissionis all the more easy that the metal is oxophilic, the lower barrier beingobtained on Ru(0001) and the higher on Pt(111). This assistance can beillustrated plotting the activation energy �E‡ in function of the reactionenergy �E. Since the O�H scission is a very early reaction, this repre-sentation is more conclusive based on the reverse reaction, namely theformation of water from OH and H.

∑Heterogeneous Catalysis 51
Figure 3.2: Activation energy �E‡ of the O�H bond formation in func-tion of the reaction energy �E (in eV) on the compact plane of a se-ries of transition metals. +, x, and * display the data points and solidlines the linear regression for (i) a single water molecule, chemisorbedon the metallic surface (ii) a physisorbed water molecule, that ac-ceptes a H-bond from a chemisorbed water molecule respectively(iii)a chemisorbed water molecule, that donates a H-bond to a physisorbedwater molecule. Adapted from 30
52 ∑Heterogeneous Catalysis
We developed a simple model to catch the water solvent influence onthe catalytic events, based on a micro-solvation model. A chemisorbedwater mimics the hydrated surface. We considered the dehydrogenationof ethanol on two metallic surfaces, the oxophilic Rh(111) and the non-oxophilic Pt(111), and compared their activity with the correspondinghydrated surfaces, H2O-Rh(111) and H2O-Pt(111). In each case, twopathways are accessible: (i) the alkyl path, starting with the C�H bondscission that yields a hydroxyalkyl intermediate (ii) the alkoxy path,starting with the O�H bond scission, yielding an alkoxy intermediate.A contrasted picture emerges. The presence of water on Rh(111) dras-tically changes its activity. With the stabilization of the O�H scission,the reaction path is changed towards the generation of the alkoxy inter-mediate and the overall process exhibits a lower effective barrier than onRh(111). On H2O-Pt(111), the stabilization of the O�H scission transi-tion state is not sufficient to switch to the alkoxy pathway. In addition,the initial C�H bond scission of the productive path is slightly pushedup in energy, reducing the overall catalytic activity. As a conclusion,the dehydrogenation of alcohol is expected to be activated on oxophilicmetals and slightly deactivated on non-oxophilic ones.28

∑Heterogeneous Catalysis 53
Figure 3.3: Reaction pathways for the dehydrogenation of ethanol toacetaldehyde on Rh(111), H2O-Rh(111), Pt(111) and H2O-Pt(111) sur-faces. In straight line, the alkoxy path, in dashed line, the alkyl path.The reference energy is the clean slab or the hydrated slab and theethanol isolated in gas phase. The produced hydrogen is consideredas chemisorbed at an infinite distance. Adapted from 28
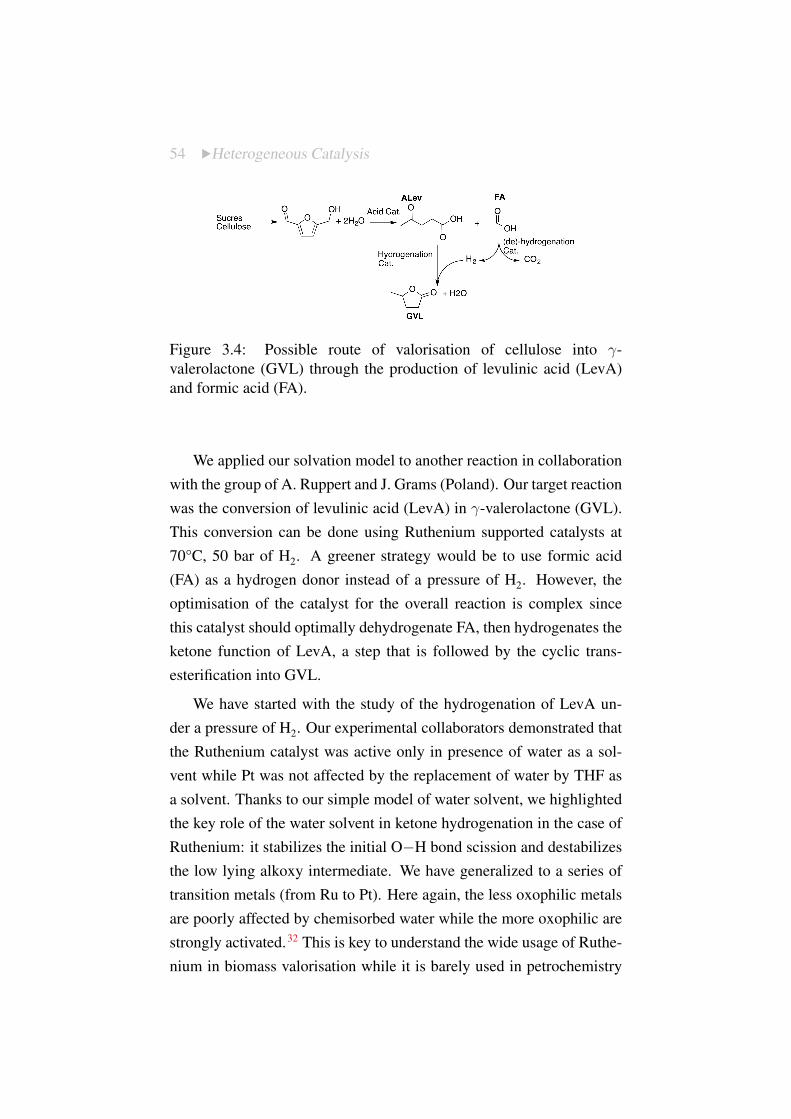
54 ∑Heterogeneous Catalysis
Figure 3.4: Possible route of valorisation of cellulose into �-valerolactone (GVL) through the production of levulinic acid (LevA)and formic acid (FA).
We applied our solvation model to another reaction in collaborationwith the group of A. Ruppert and J. Grams (Poland). Our target reactionwas the conversion of levulinic acid (LevA) in �-valerolactone (GVL).This conversion can be done using Ruthenium supported catalysts at70°C, 50 bar of H2. A greener strategy would be to use formic acid(FA) as a hydrogen donor instead of a pressure of H2. However, theoptimisation of the catalyst for the overall reaction is complex sincethis catalyst should optimally dehydrogenate FA, then hydrogenates theketone function of LevA, a step that is followed by the cyclic trans-esterification into GVL.
We have started with the study of the hydrogenation of LevA un-der a pressure of H2. Our experimental collaborators demonstrated thatthe Ruthenium catalyst was active only in presence of water as a sol-vent while Pt was not affected by the replacement of water by THF asa solvent. Thanks to our simple model of water solvent, we highlightedthe key role of the water solvent in ketone hydrogenation in the case ofRuthenium: it stabilizes the initial O�H bond scission and destabilizesthe low lying alkoxy intermediate. We have generalized to a series oftransition metals (from Ru to Pt). Here again, the less oxophilic metalsare poorly affected by chemisorbed water while the more oxophilic arestrongly activated.32 This is key to understand the wide usage of Ruthe-nium in biomass valorisation while it is barely used in petrochemistry

∑Heterogeneous Catalysis 55
(gas phase reactions).31 Building up on this study, we switched to thetotal reaction. During the hydrogen transfer from FA to LevA, the sur-face formate is so stable that it blocks at least partially the active sitesfor the subsequent reaction (LevA hydrogenation).33
According to our model, Pt catalysts should be insensitive to thechoice of the solvent and exhibit the same activity in absence and inpresence of water. However, the addition of water has been shown to in-crease noticeably the oxidation kinetics of aliphatic alcohols catalyzedby platinum-supported catalyst.27 To relieve this apparent contradiction,we have to recall that the experimental conditions differ strongly. So far,we worked in the context of hydrogenation/hydrogenolysis, i.e. undera pressure of hydrogen or eventually of an inert gas. Under oxidativeconditions, the reaction is performed is presence of O2, the final oxi-dant. In those conditions, the splitting of O2 is the key step impactedby the absence or presence of water. The reaction O + H2O ��! 2 OHis known to occur easily on Pt(111)5,12, yielding an hydroxylated plat-inum surface, OH�Pt. The dehydrogenation is greatly facilitated onOH�Pt compared with H2O�Pt and Pt. In a nutshell, the presence ofsurface hydroxyls is required to perform the oxidation of alcohols usinga Platinum based catalyst and this can be achieved only in presence ofO2 and water.27
3.3 What’s next?
3.3.1 Screening of reaction networks
To tackle the great challenge of screening the extensive reaction net-works of polyol transformation, we aimed at developing efficient strate-gies based on a hierarchy of methods. The complete network is screenedbased on a combination of scaling relations based on group additivityand BEP relations. Then, both the kinetics and the thermochemistry canbe related directly to few descriptors such as the atomic adsorptions of

56 ∑Heterogeneous Catalysis
C, O and H. A sensitivity analysis of the micro-kinetic model build onthis extensive network selects the most sensitive steps that need to berefined with more advanced models, including the complete evaluationof the elementary step at the DFT level. This will be achieved on polyolreactivity in collaboration with D. Vlachos, USA, in the project Music.
3.3.2 Better solvation models
With a very simple model, we already demonstrated the key role of co-adsorbed water. This micro-solvation can be completed by the inclusionof a continuum model of the bulk water as implemented by Hennig andco-workers in VASPsol for instance.7 So far, the impact of the contin-uum is rather limited to few meV on the reaction energies and activationenergies we considered so far. The next step is to build more completemodels that describe explicitly water molecules. It is the aim of ourcollaboration with A. Goetz, USA in the project Music. This frame-work will open the door to more advanced simulations that should beable to tackle key questions in the domain of biomass valorisation. Forinstance, the oxidation of alcohols using O2 as a final oxidant alwaysrequire a base in a stoichiometric amount, generating a salt instead ofthe wanted carboxylic acid. This is a strong limitation of this strat-egy since the subsequence hydrolysis yields an equivalent of undesiredwaste.3,13,18 to better understand the synergetic between the metal (typ-ically Au or Au-Pd, Au-Pt alloys) and the base (NaOH) requires newmethodological advances to include the water solvent.
3.3.3 From alcohols to aromatics
The ligno-cellulosic biomass is composed of carbohydrate polymers(cellulose and hemicellulose) and aromatic polymers (lignin). So far,lignin was considered as too recalcitrant to be used as a feedstock, de-spite its strong content in aromatics. As shown in 2.5, it is a highlyheterogeneous polymer, increasing the challenge of a selective produc-
∑Heterogeneous Catalysis 57
tion of chemical from this feedstock. The conversion of lignin-derivedaromatics is one of our next targets in biomass valorization using metal-lic supported catalysts. In this context, R. Réocreux dedicates his PhDproject to the C�C and C�O cleavages in lignin-derived aromatics as apotential source of aromatic compounds in collaboration with J. Giorgi,uOttawa.
3.3.4 Beyond the monometallic supported catalyst
My research was dedicated to supported monometallic catalysts that canbe usually nicely modeled using a simple slab model of the most stablefacet ((111) or (0001)). To open new directions of design, it is key toprobe several manners to tune the catalytic activity. A first possibilityis to analyze the alloying of two transition metals.2,8 This will be ourstrategy in the amination of alcohols but also in the hydrogen transfertfrom formic acid to levulinic acid, yielding �-valerolactone.22, 33 An-other possibility to tune a catalyst is to play with the exposed facet.11,20
We have recently studied how the conditions of preparation of metallicparticles can affect the nature of the most exposed facet. Our theoreti-cal approach allows us to predict the influence of the concentration ofthe shaping agent on the Cobalt nanoparticles shape.24 An intermediateconcentration yields to rods that expose mainly the (10.0) facet, whereternary sites are not present anymore. Being able to control the shapeallows us to establish structure/activity relation. This will be addresssoon in the project Tanopol. Another clear way to tune a catalyst ac-tivity is to play on co-adsorbant and modifiers.15 We have shown thatthe generation of surface hydroxyl is essential in polyols oxidation cat-alyzed by Pt.27 Similarly, we are currently focusing on the influence ofco-adsorbed ammonia on the amination of alcohol (PhD projet of A.Dumon). The shaping agent used to tune the shape of the nanoparti-cle may also affect the catalytic activity, as already demonstrated bythe group of Medlin9,17 and others.4 A better understanding of thoseco-adsorption effects is still required. In all those ways of modifying a

58 ∑Heterogeneous Catalysis
catalyst, the atomistic simulations can sustain a rational design.16
Bibliography
[1] Akpa, B. S.; D’Agostino, C.; Gladden, L. F.; Hindle, K.; Man-yar, H.; McGregor, J.; Li, R.; Neurock, M.; Sinha, N.; Stitt, E. H.;Weber, D.; Zeitler, J. A.; Rooney, D. W. J. Catal. 2012, 289, 30–41, CH, OH.
[2] Alonso, D. M.; Wettstein, S. G.; Dumesic, J. A. Chem. Soc. Rev.2012, 41, 8075–8098.
[3] Besson, M.; Gallezot, P.; Pinel, C. Chem. Rev. 2014, 114, 1827–1870.
[4] Chen, K.; Wu, H. T.; Hua, Q.; Chang, S. J.; Huang, W. X. Phys.Chem. Chem. Phys. 2013, 15, 2273–2277.
[5] Clay, C.; Haq, S.; Hodgson, A. Phys. Rev. Lett. 2004, 92, 046102.
[6] Dusselier, M.; Van Wouwe, P.; Dewaele, A.; Makshina, E.;Sels, B. F. Energy & Environmental Science 2013, 6, 1415–1442.
[7] Fishman, M.; Zhuang, H. L.; Mathew, K.; Dirschka, W.; Hen-nig, R. G. Phys. Rev. B 2013, 87, 245402.
[8] Gallezot, P. Chem. Soc. Rev. 2012, 41, 1538–1558.
[9] Kahsar, K. R.; Schwartz, D. K.; Medlin, J. W. J. Am. Chem. Soc.2014, 136, 520–526.
[10] Kobayashi, H.; Fukuoka, A. Green Chem. 2013, 15, 1740–1763.
[11] Lee, I.; Zaera, F. Top. Catal. 2013, 56, 1284–1298.
[12] Lew, W.; Crowe, M. C.; Karp, E.; Campbell, C. T. J. Phys. Chem.C 2011, 115, 9164.

∑Heterogeneous Catalysis 59
[13] Liu, S.-S.; Sun, K.-Q.; Xu, B.-Q. Acs Catalysis 2014, 4, 2226–2230.
[14] McManus, I.; Daly, H.; Thompson, J. M.; Connor, E.;Hardacre, C.; Wilkinson, S. K.; Bonab, N. S.; ten Dam, J.; Sim-mons, M. J. H.; Stitt, E. H.; D’Agostino, C.; McGregor, J.; Glad-den, L. F.; Delgado, J. J. J. Catal. 2015, 330, 344–353.
[15] Medlin, J. W. ACS Catal. 2011, 1, 1284–1297.
[16] Norskov, J. K.; Bligaard, T.; Rossmeisl, J.; Christensen, C. H.Nat. Chem. 2009, 1, 37–46.
[17] Pang, S. H.; Schoenbaum, C. A.; Schwartz, D. K.; Medlin, J. W.Nat. Comm. 2013, 4, 2448.
[18] Rodriguez, A. A.; Williams, C. T.; Monnier, J. R. Catalysis Let-ters 2015, 145, 750–756.
[19] Ruppert, A. M.; Weinberg, K.; Palkovits, R. Angew. Chem. Int.Ed. 2012, 51, 2564–2601.
[20] Van Santen, R. A. Acc. Chem. Res. 2009, 42, 57–66.
[21] Wan, H. J.; Vitter, A.; Chaudhari, R. V.; Subramaniam, B. J.Catal. 2014, 309, 174–184.
[22] Wright, W. R. H.; Palkovits, R. ChemSusChem 2012, 5, 1657–1667.
[23] Zhou, C. H.; Zhao, H.; Tong, D. S.; Wu, L. M.; Yu, W. H. Catal.Rev. - Sci. Eng. 2013, 55, 369–453.
[24] Ait Atmane, K.; Michel, C.; Piquemal, J.-Y.; Sautet, P.; Beau-nier, P.; Giraud, M.; Sicard, M.; Nowak, S.; Losno, R.; Viau, G.Nanoscale 2014, 6, 2682–2692, .
[25] Auneau, F.; Michel, C.; Delbecq, F.; Pinel, C.; Sautet, P.Chemistry-a European Journal 2011, 17, 14288–14299, .

60 ∑Heterogeneous Catalysis
[26] Auneau, F.; Sadr Arani, L.; Besson, M.; Djakovitch, L.;Michel, C.; Delbecq, F.; Sautet, P.; Pinel, C. Topics in Cataly-sis 2012, 55, 474–479, .
[27] Chibani, S.; Michel, C.; Delbecq, F.; Pinel, C.; Besson, M. Catal-ysis Science and Technology 2012, 3, 339–350 .
[28] Loffreda, D.; Michel, C.; Delbecq, F.; Sautet, P. Journal of Catal-ysis 2013, 308, 374–385 .
[29] Michel, C.; Auneau, F.; Delbecq, F.; Sautet, P. ACS Catalysis2011, 1, 1430–1440 .
[30] Michel, C.; Göltl, F.; Sautet, P. Physical Chemistry ChemicalPhysics 2012, 14, 15286–15290 .
[31] Michel, C.; Gallezot, P. ACS Catalysis 2015, 5, 4130–4132 .
[32] Michel, C.; Zaffran, J.; Ruppert, A. M.; Matras-Michalska, J.;Jedrzejczyk, M.; Grams, J.; Sautet, P. Chemical Communications2014, 50, 12450–12453 .
[33] Ruppert, A. M.; Jedrzejczyk, M.; Sneka-Platek, O.; Keller, N.;Dumon, A. S.; Michel, C.; Sautet, P.; Grams, J. Green Chemistry2016, –.
[34] Zaffran, J.; Michel, C.; Auneau, F.; Delbecq, F.; Sautet, P. ACSCatalysis 2014, 4, 464–468, .
[35] Zaffran, J.; Michel, C.; Delbecq, F.; Sautet, P. Journal of PhysicalChemistry C 2015, 119, 12988–12998, .

DOI: 10.1002/chem.201101318
Unravelling the Mechanism of Glycerol Hydrogenolysis over RhodiumCatalyst through Combined Experimental–Theoretical Investigations
Florian Auneau,[a, b] Carine Michel,[b] FranÅoise Delbecq,*[b] Catherine Pinel,*[a] andPhilippe Sautet[b]
Introduction
In the actual context of shortage of petroleum resources,biomass is considered a renewable alternative for fuels andchemical substitution. More importantly, the chemical trans-formation of bio-resources has a reduced impact on green-house gas emissions compared to petroleum-dependent in-dustrial processes. Glycerol, obtained as a co-product of thetransesterification of vegetable oils to produce bio-diesel, isa potential building block to be processed in bio-refiner-ies.[1,2] The valorisation of this abundant C3-platform mole-cule has been intensively implemented experimentally alongseveral routes.[3–5] Its heterogeneously catalysed transforma-tion into important value-added products such as acroleinthrough dehydration,[6] glycerol esters or ethers throughesterification or etherification,[7] 1,2-propanediol (12-PDO)[8]
or 1,3-propanediol (13-PDO)[9–12] through hydrogenolysisand oxidation products such as glyceric acid or dihydroxya-
cetone[13–15] has been targeted over recent years. Due to itsavailability, glycerol has also been envisaged as a potentialsource of renewable fuels through, for instance, aqueous-phase reforming.[16]
Glycerol hydrogenolysis in the presence of metallic cata-lysts has always been challenging because of selectivity con-siderations under the moderate to high hydrogen pressuresusually employed (0.1 to more than 100 bar). PDO-selectiveformation is usually the aim, and it is consequently necessa-ry to avoid C!C bond ruptures, which lead to undesired C1and C2 cracking products such as ethylene glycol, ethanol,methane, methanol and carbon dioxide. Historically, first at-tempts with Co, Ni Raney, Cu Raney, Cu, Ru, Rh, Ir and Ptcatalysts were conducted by Montassier et al.[17,18] The addi-tion of a second metal was proven to be useful to enhancethe selectivity into 12-PDO, for instance, in the case of Cu!chromite,[8] Cu!Ag,[19] Ru!Cu[20] or Ru!Pt.[21] More recently,important works allowed significant improvements in the se-lective hydrogenolysis into 13-PDO with Ir!Re[9] or Pt!Re.[10]
The glycerol transformation into PDO is formally a dehy-dration coupled to a hydrogenation: glycerol+H2!PDO+H2O. Dehydration is known to be strongly sensitiveto the pH medium, whereas hydrogenation is expected to bedependent on the gas-phase atmosphere composition as wellas on the nature of the catalyst. Thus, both the pH solutionand the atmosphere composition may be key parameters tocontrol the selectivity of the glycerol conversion into PDOin the presence of a metallic catalyst.
Indeed, the pH of the solution influences the activities ofvarious metal catalysts. On the one hand, acidic co-catalystshave shown good abilities to accelerate reaction rates andobtain at the same time good selectivity into 12-PDO, as
Abstract: We report herein a detailedand accurate study of the mechanismof rhodium-catalysed conversion ofglycerol into 1,2-propanediol and lacticacid. The first step of the reaction isparticularly debated, as it can be eitherdehydration or dehydrogenation. It isexpected that these elementary reac-tions can be influenced by pH varia-tions and by the nature of the gasphase. These parameters were conse-
quently investigated experimentally.On the other hand, there was a lack ofknowledge about the behaviour ofglycerol at the surface of the metalliccatalyst. A theoretical approach on amodel Rh ACHTUNGTRENNUNG(111) surface was thus imple-
mented in the framework of densityfunctional theory (DFT) to describethe above-mentioned elementary reac-tions and to calculate the correspond-ing transition states. The combinationof experiment and theory shows thatthe dehydrogenation into glyceralde-hyde is the first step for the glyceroltransformation on the Rh/C catalyst inbasic media under He or H2 atmos-phere.
Keywords: density functional calcu-lations · lactic acid · propanediol ·reaction mechanisms · rhodium
[a] F. Auneau, Dr. C. PinelUniversit! de Lyon, Institut de Recherchessur la Catalyse et l"Environnement de LyonIRCELYON, Universit! Lyon I, CNRS, UMR52562, Avenue Albert Einstein69626 Villeurbanne Cedex (France)Fax: (+33) 4-72-44-53-99E-mail : [email protected]
[b] F. Auneau, Dr. C. Michel, Dr. F. Delbecq, Dr. P. SautetUniversit! de Lyon, CNRS, Institut de Chimie de LyonENS Lyon, Laboratoire de Chimie, UMR CNRS 518246 All!e d"Italie, 69364 Lyon Cedex 07 (France)Fax: (+33) 4-72-72-88-60E-mail : [email protected]
Supporting information for this article is available on the WWWunder http://dx.doi.org/10.1002/chem.201101318.
# 2011 Wiley-VCH Verlag GmbH & Co. KGaA, Weinheim Chem. Eur. J. 2011, 17, 14288 – 1429914288
∑Heterogeneous Catalysis 61

evidenced by the group of Tomishige et al.[22–25] On theother hand, as initially reported by Montassier et al., the CuRaney activity is increased in alkaline conditions.[17] Howev-er, the distribution of the products is strongly affected withthe appearance of lactic acid (LA) and the decreased yieldfor cracking products such as ethylene glycol (EG) com-pared to neutral pH. These trends were confirmed for othercatalytic systems, namely, carbon-supported Pt, Ru, PtRuand AuRu catalysts.[26,27] In addition, the formation offormic acid (FA) and gaseous species was reported. The ap-pearance of oxidation products such as LA and FA underreductive conditions raises questions about the underlyingmechanism.
As expected, the role of the gas-phase atmosphere is alsodebated. Recently, glycerol conversion toward 12-PDO (to-gether with EG) was carried out by D"Hondt et al. in theabsence of added hydrogen with a Pt/NaY catalyst.[28] Mon-tassier"s group had originally mentioned for a Cu Raney cat-alyst that the reaction rate of glycerol transformation into12-PDO and EG at neutral pH was poorly affected by thepresence or absence of hydrogen, whereas LA was onlyformed in low amounts in both cases (<1 %).[17] These re-ports are astonishing at first sight: they demonstrate the fea-sibility of the hydrodeoxygenation of glycerol under inert at-mosphere, whereas, as said before, glycerol conversion intoPDO should require the presence of hydrogen. This raisesagain questions about the mechanism. The hydrodeoxygena-tion of glycerol under inert atmosphere has not been investi-gated systematically since these results, though some studieshave dealt with this interesting issue.[8,21,29–32]
All these parameters (second metal, pH and gas-phasecomposition) have a pronounced influence on the reactivity.The simple picture of a hydrogenation coupled to dehydra-tion is not sufficient to understand all the experimental re-sults. In particular, the first step of the reaction is still underdebate. It has been proposed to be a dehydration, or moresurprisingly, under H2 atmosphere a dehydrogenation(Scheme 1). The dehydration has been proposed for copper-based[33] catalysts, including copper–zinc[34] and copper–chro-mite[8] catalysts. Noble metals are also concerned with thisdehydration mechanism, as shown with ruthenium carbon-based catalysts in the presence of an acidic co-cata-lyst.[22–25,32] However, the mechanism originally suggested byMontassier et al.[17] puts forward the dehydrogenation as thefirst step of the reaction in neutral water and alkaline condi-
tions with a copper Raney catalyst. It was also supported byHawley et al.[35] and reported for carbon-based Ru, Pt, PtRuand AuRu catalysts in alkaline conditions.[26, 27] Nevertheless,the exact mechanism still remains in question, as dehydra-tion and dehydrogenation can occur simultaneously, for in-stance, with platinum supported on alumina catalysts togeth-er with reforming processes.[30] For this kind of catalyst, notonly the support but also the platinum metal is shown toplay a role in the dehydration of glycerol.[29] Recently, it wasdemonstrated that even for copper–zinc catalysts, tradition-ally associated with the dehydration mechanism, dehydro-genation takes place on the metallic copper.[31] Concerningrhodium, this metal has often been associated with the dehy-dration mechanism in past studies either in association withan acidic co-catalyst[36] or with the assistance of rhenium.[37]
The interpretation of this complex system would benefitfrom a better comprehension of surface phenomena from afundamental point of view. For this aim, theoretical model-ling appears as a useful complementary tool to experiments.Some of us have already investigated from density function-al theory (DFT) calculations the adsorption of glycerol andits dehydration intermediates at the surfaces of Ni ACHTUNGTRENNUNG(111), Rh-ACHTUNGTRENNUNG(111) and Pd ACHTUNGTRENNUNG(111) to identify the key points that control theselectivity of the hydrogenolysis reaction.[38] The adsorptionand reactivity of other small oxygenated compounds such asmethanol[39–45] (MeOH) or ethanol[46–56] (EtOH) on themodel surfaces of transition metals can also provide helpfulclues. Despite the tremendous number of works realiseduntil now, only a few have performed a mixed experimentaland theoretical approach (using DFT) to gain further in-sights into the reactivity of glycerol. This is the case forDavis, Neurock and their co-workers[57] who have consid-ered the oxidation mechanism of glycerol in alkaline aque-ous conditions by using Au, Pd and Pt catalysts on varioussupports (TiO2 and C). The theoretical part focused on theoxidation of ethanol into acetic acid on Au ACHTUNGTRENNUNG(111) and PtACHTUNGTRENNUNG(111)assisted by surface-bonded hydroxide species in liquidwater. In the direct line of our experimental investigationson glycerol hydrogenolysis into PDO,[12,58] we focus here onthe glycerol hydrogenolysis over an Rh/C catalyst in alkalinesolution. We report in detail the behaviour of this catalyst asa function of various reaction parameters. In particular, wehave observed the concomitant formation of hydrogenolysis(12-PDO) and oxidation (LA) products under both reduc-tive and inert atmospheres. This raises the question: Is thisprocess really a hydrogenolysis? To arrive at an answer, weaim at a better comprehension of the elementary steps ofthe reaction. The first step is of particular interest, as it canbe either dehydration or dehydrogenation. We have focusedon the energy profiles of these two competitive first steps,dehydrogenation and dehydration with theoretical DFT cal-culations performed on a model rhodium RhACHTUNGTRENNUNG(111) surface.We gather here our experimental results together with thetheoretical results to gain a better insight into the unexpect-ed processes that occur during the glycerol conversion andto provide a unified picture of the reaction mechanism.
Scheme 1. Glycerol transformation into 12-PDO and LA.
Chem. Eur. J. 2011, 17, 14288 – 14299 # 2011 Wiley-VCH Verlag GmbH & Co. KGaA, Weinheim www.chemeurj.org 14289
FULL PAPER
62 ∑Heterogeneous Catalysis

Experimental Results
First, we detail the behaviour of the 0.7 % Rh/C catalyst wehave prepared as a function of various reaction parameterssuch as solution pH and gas-atmosphere composition. Wefocus in particular on their influence on the products distri-bution and the kinetics. Then we provide the gas-phase anal-ysis and check the stability of the reaction products.
Catalytic tests : Table 1 shows how the pH of the solutioncan impact the conversion and the product distribution inthe presence of rhodium-based catalyst. At neutral pH
under hydrogen atmosphere, almost no glycerol was con-verted (<2 %) in 12 h, and only some traces of 12-PDO (<1 % yield) were analysed. The reaction rate increases withthe alkalinity of the glycerol solution to give 12-PDO butalso LA as the major products. The best conversion reachedis nonetheless still low (23% after 12 h). Moreover, glyceral-dehyde (GAL) was observed (together with glyceric acid) atneutral pH, whereas acetol was not observed regardless ofthe pH (Scheme 1).
Interestingly, a catalytic transformation of glycerol alsohappens in the absence of hydrogen when glycerol comesinto contact with the metallic catalyst at basic pH (Table 2).The conversion is even surprisingly higher under He (55 %)than under H2 (22 %). Moreover, the product distribution isstrongly modified upon atmospheric change. Whereas 12-PDO is the major product under H2, LA becomes the majorproduct under inert He atmosphere (its yield is multipliedby 5). However, it is striking that 12-PDO, which is theproduct of the hydrogenolysis reaction (hence requiring Hatoms to be formed), is still produced under He (with ayield reduced by 50 % relative to the reaction under H2). Inaddition, when performing the reaction in water at neutral
pH under He, the conversion of glycerol was less than 1 %after 12 h and traces of GAL (together with glyceric acid),pyruvaldehyde, acetol and 12-PDO were detected.
Kinetic study : A kinetic study was implemented to analysethe evolution of the reaction. The glycerol conversion pro-file (Figure 1) is very different under He or H2 atmosphere.Glycerol reacts indeed faster under He than under H2, andafter 24 h reaction, the glycerol is almost totally convertedunder He (91 %), whereas half (49%) of the initial glycerolis still present under H2. The initial activity of the reaction is0.8 mol min!1 molRh
!1 under hydrogen and 3.3 molmin!1 molRh
!1 under helium (hence larger by a factor of 4).The evolution of the yields as a function of the conversionprovides information about product formation, stability andreactivity. From the beginning, the product yield increaseslinearly along the conversion for 12-PDO and LA, regard-less of the type of atmosphere (Figure 2). This indicates thatLA and 12-PDO are the primary products of the reaction.
Data can be extracted from the kinetic study to comparethe distribution of products at similar glycerol conversion(Table 3). After 24 h, 49 % conversion is obtained under50 bar H2, thus yielding 22 % 12-PDO and 15 % LA. UnderHe, similar conversion (46%) is achieved after 6 h. LA isclearly the major product with a 20 % yield; the 12-PDOproduction reaches only 3 % yield.
Gas-phase analysis : Gas-phase analysis has been motivatedby the increase of the pressure in the reactor along time atconstant temperature under inert atmosphere (Figure 3).The pressure rises rapidly at the very beginning of the reac-tion but evolves more gradually after 100 min. There istherefore generation of gaseous species, and it is importantto identify these compounds. Under hydrogen atmosphere,the initial increase in pressure is interestingly slower thanunder helium, and rapidly (20 min) the pressure starts to de-crease, thereby indicating hydrogen consumption. The finalgas-phase composition reflects the observed pressure evolu-
Table 1. Influence of the pH on the reactivity.[a]
Entry Solvent Conv.[%]
Mass balance[%][b]
Yield [%]12-PDO LA Others[c]
1 H2O 2 100 <1 0 e2 NaOH 0.1 m 11 96 4 5 23 NaOH 1m 23 100 9 9 5
[a] Conditions: glycerol (6 mL, 5 wt %) in solvent, SPR16, 50 bar H2,453 K, 12 h. [b] TOC analysis. [c] Others including EG, 13-PDO, formicacid (FA), EtOH, MeOH, acetol, acetic acid (AA).
Figure 1. Glycerol conversion over reaction time: glycerol (100 mL,5 wt %) in NaOH 1m, Hastelloy autoclave equipped with a Teflon pot,50 bar H2/30 bar He, 453 K.
Table 2. Gas-phase influence on reactivity of glycerol in alkaline condi-tions.[a]
EntryGas
Conv.[%]
Mass balance[%][b]
Yield [%]12-PDO LA Others[c]
1 He 55 94 4 25 262 H2 22 100 9 5 8
[a] Conditions: glycerol (100 mL, 5 wt %) in NaOH 1 m, Hastelloy auto-clave equipped with a Teflon pot, 50 bar H2/30 bar He, 453 K, 8 h.[b] TOC analysis after 24 h reaction. [c] Others including EG, 1,3-PDO,FA, EtOH, MeOH, acetol, AA.
www.chemeurj.org # 2011 Wiley-VCH Verlag GmbH & Co. KGaA, Weinheim Chem. Eur. J. 2011, 17, 14288 – 1429914290
F. Delbecq, C. Pinel et al.
∑Heterogeneous Catalysis 63
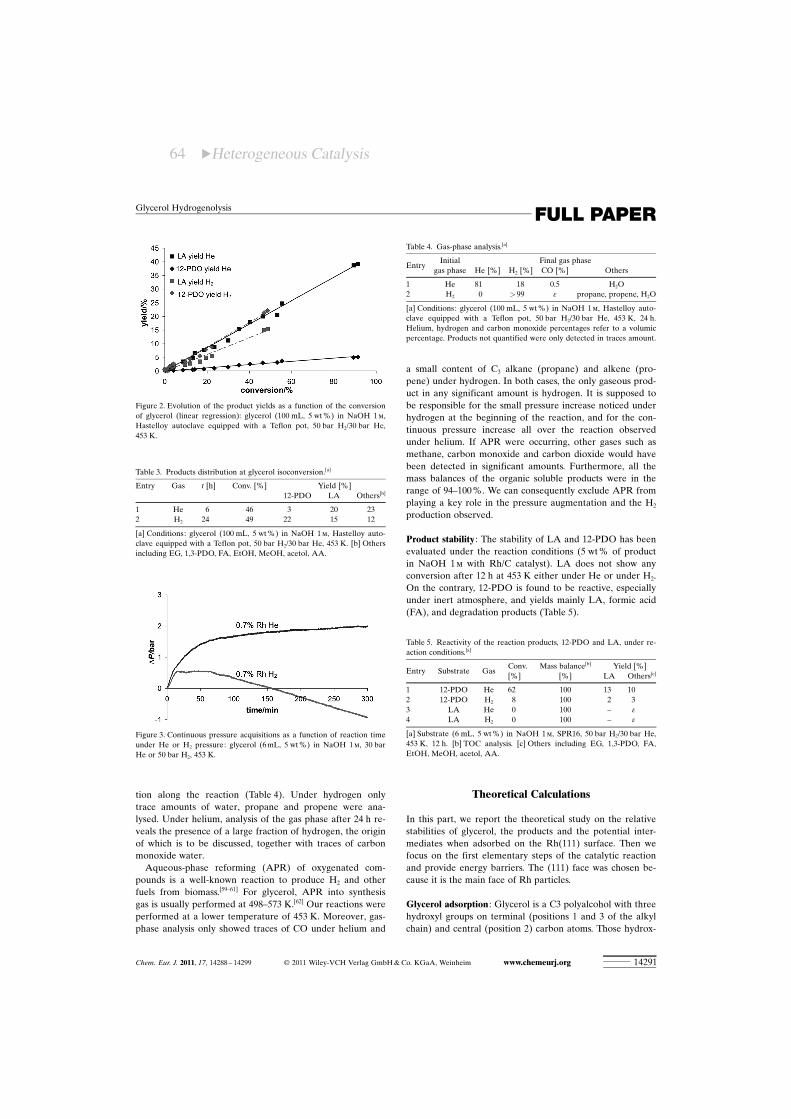
tion along the reaction (Table 4). Under hydrogen onlytrace amounts of water, propane and propene were ana-lysed. Under helium, analysis of the gas phase after 24 h re-veals the presence of a large fraction of hydrogen, the originof which is to be discussed, together with traces of carbonmonoxide water.
Aqueous-phase reforming (APR) of oxygenated com-pounds is a well-known reaction to produce H2 and otherfuels from biomass.[59–61] For glycerol, APR into synthesisgas is usually performed at 498–573 K.[62] Our reactions wereperformed at a lower temperature of 453 K. Moreover, gas-phase analysis only showed traces of CO under helium and
a small content of C3 alkane (propane) and alkene (pro-pene) under hydrogen. In both cases, the only gaseous prod-uct in any significant amount is hydrogen. It is supposed tobe responsible for the small pressure increase noticed underhydrogen at the beginning of the reaction, and for the con-tinuous pressure increase all over the reaction observedunder helium. If APR were occurring, other gases such asmethane, carbon monoxide and carbon dioxide would havebeen detected in significant amounts. Furthermore, all themass balances of the organic soluble products were in therange of 94–100 %. We can consequently exclude APR fromplaying a key role in the pressure augmentation and the H2
production observed.
Product stability : The stability of LA and 12-PDO has beenevaluated under the reaction conditions (5 wt % of productin NaOH 1 m with Rh/C catalyst). LA does not show anyconversion after 12 h at 453 K either under He or under H2.On the contrary, 12-PDO is found to be reactive, especiallyunder inert atmosphere, and yields mainly LA, formic acid(FA), and degradation products (Table 5).
Theoretical Calculations
In this part, we report the theoretical study on the relativestabilities of glycerol, the products and the potential inter-mediates when adsorbed on the Rh ACHTUNGTRENNUNG(111) surface. Then wefocus on the first elementary steps of the catalytic reactionand provide energy barriers. The (111) face was chosen be-cause it is the main face of Rh particles.
Glycerol adsorption : Glycerol is a C3 polyalcohol with threehydroxyl groups on terminal (positions 1 and 3 of the alkylchain) and central (position 2) carbon atoms. Those hydrox-
Table 3. Products distribution at glycerol isoconversion.[a]
Entry Gas t [h] Conv. [%] Yield [%]12-PDO LA Others[b]
1 He 6 46 3 20 232 H2 24 49 22 15 12
[a] Conditions: glycerol (100 mL, 5 wt %) in NaOH 1 m, Hastelloy auto-clave equipped with a Teflon pot, 50 bar H2/30 bar He, 453 K. [b] Othersincluding EG, 1,3-PDO, FA, EtOH, MeOH, acetol, AA.
Figure 3. Continuous pressure acquisitions as a function of reaction timeunder He or H2 pressure: glycerol (6 mL, 5 wt %) in NaOH 1m, 30 barHe or 50 bar H2, 453 K.
Table 4. Gas-phase analysis.[a]
EntryInitial Final gas phase
gas phase He [%] H2 [%] CO [%] Others
1 He 81 18 0.5 H2O2 H2 0 >99 e propane, propene, H2O
[a] Conditions: glycerol (100 mL, 5 wt %) in NaOH 1 m, Hastelloy auto-clave equipped with a Teflon pot, 50 bar H2/30 bar He, 453 K, 24 h.Helium, hydrogen and carbon monoxide percentages refer to a volumicpercentage. Products not quantified were only detected in traces amount.
Table 5. Reactivity of the reaction products, 12-PDO and LA, under re-action conditions.[a]
Entry Substrate GasConv.[%]
Mass balance[b] Yield [%][%] LA Others[c]
1 12-PDO He 62 100 13 102 12-PDO H2 8 100 2 33 LA He 0 100 – e4 LA H2 0 100 – e
[a] Substrate (6 mL, 5 wt %) in NaOH 1m, SPR16, 50 bar H2/30 bar He,453 K, 12 h. [b] TOC analysis. [c] Others including EG, 1,3-PDO, FA,EtOH, MeOH, acetol, AA.
Figure 2. Evolution of the product yields as a function of the conversionof glycerol (linear regression): glycerol (100 mL, 5 wt %) in NaOH 1 m,Hastelloy autoclave equipped with a Teflon pot, 50 bar H2/30 bar He,453 K.
Chem. Eur. J. 2011, 17, 14288 – 14299 # 2011 Wiley-VCH Verlag GmbH & Co. KGaA, Weinheim www.chemeurj.org 14291
FULL PAPERGlycerol Hydrogenolysis
64 ∑Heterogeneous Catalysis

yl groups will be respectively designated as terminal andcentral hydroxyl groups in the following. Glycerol exhibitsnumerous stable conformations in the gas phase.[63,64] Themost stable one has been re-optimised with our method togive the lowest conformation in energy represented inFigure 4 (left panel) and to show two internal hydrogen
bonds. Glycerol can adopt several adsorption modes on theRhACHTUNGTRENNUNG(111) surface.[38] The optimal structure (Figure 4, rightpanel) shows two oxygen atoms adsorbed atop sites of Rhand one hydrogen bond from the adsorbed terminal hydrox-yl group to the other terminal hydroxyl, farther from thesurface. The corresponding adsorption energy is Eads =!0.60 eV. It is higher than the typical adsorption energy ofmonoalcohols ("!0.40 eV).[51]
Stability of products and intermediates on the RhACHTUNGTRENNUNG(111) sur-face : Experimentally, glycerol can be converted into twoproducts: 1,2-propanediol (12-PDO) and lactic acid (LA).In the gas phase, the corresponding reactions can be formal-ly written [Eqs. (1) and (2)]:
GlycerolþH2 ! 12-PDOþH2O ð1Þ
Glycerol! LAþH2 ð2Þ
From a thermodynamic point of view, the first reaction isexothermic (DEreact(1) =!1.00 eV), whereas the second oneis almost athermic (DEreact(2)=0.03 eV). On the surface, thesituation is reversed. Indeed, the previous chemical reac-tions can be rewritten in the following manner, taking intoaccount the dissociated character of H2 and H2O on Rh ACHTUNGTRENNUNG(111)[Eqs. (3) and (4)]:
Glycerolþ 2 H! 12-PDOþHþOH ð3Þ
Glycerol! LAþ 2 H ð4Þ
When considering each species being adsorbed on RhACHTUNGTRENNUNG(111)at low coverage, both reactions are exothermic but the for-mation of LA is strongly favoured by 0.71 eV (DEreact(3)=!0.16 eV and DEreact(4)=!0.87 eV, Figure 5).
Two pathways are plausible to convert glycerol into theseproducts. They differ by the first step that can consist of
Figure 4. Most stable conformations of glycerol in the gas phase and onthe Rh ACHTUNGTRENNUNG(111) surface. Black, white, dark grey and light grey spheres corre-spond to C, H, O and Rh atoms, respectively. Hydrogen bonds are repre-sented in dashed dark grey lines. Bond lengths are expressed in $.Colour version of the figure is available in the Supporting Information(Figure S3).
Figure 5. Relative stabilities of intermediates and reaction products adsorbed onto the Rh ACHTUNGTRENNUNG(111) surface. Dashed lines and continuous lines stand for dehy-dration and dehydrogenation paths. All the products and atoms considered are adsorbed on the slab. Energies are given in eV. The reference energytaken here is the glycerol adsorbed at the Rh ACHTUNGTRENNUNG(111) surface plus two isolated hydrogen adsorbed at the RhACHTUNGTRENNUNG(111) surface.
www.chemeurj.org # 2011 Wiley-VCH Verlag GmbH & Co. KGaA, Weinheim Chem. Eur. J. 2011, 17, 14288 – 1429914292
F. Delbecq, C. Pinel et al.
∑Heterogeneous Catalysis 65

either dehydration or dehydrogenation. We report inFigure 5 the relative stability of the reaction intermediateswhen adsorbed onto the RhACHTUNGTRENNUNG(111) surface.
Through the dehydration path, glycerol can first lead totwo different enols almost isoenergetic on RhACHTUNGTRENNUNG(111): 1) thepropene-2,3-diol, namely, Enol 1; or 2) the propene-1,3-diol,namely, Enol 2. On Rh ACHTUNGTRENNUNG(111) the C=C bond is coordinated ina p mode and a terminal hydroxyl group is bound to the sur-face (Figure 6). The conversion of Enol 2 into 13-PDO
through hydroxypropanaldehyde has not been considered,since 13-PDO is not seen in the experiment. Enol 1 can berearranged further in acetol (DE=!0.09 eV) and thenacetol can be hydrogenated into 12-PDO (DE =0.54 eV).Acetol can also be dehydrogenated toward pyruvaldehyde(PAL) (DE=!0.59 eV), finally giving LA by an intramolec-ular Cannizzaro reaction under basic conditions (DE=0.42 eV).
Considering the dehydrogenation path, glycerol leads firstto dihydroxyacetone (DHA) or glyceraldehyde (GAL). Inthe gas phase, DHA is more stable than GAL by 0.17 eVbut those two compounds are almost isoenergetic once ad-sorbed at an RhACHTUNGTRENNUNG(111) slab. Both molecules are adsorbedwith a lateral interaction of the C=O bond with the surface(Figure 6). Whereas DHA cannot easily undergo a furtherdehydration step, GAL can be dehydrated into an enol(Enol 3, with a very exothermic reaction, DE=!0.73 eV)that rearranges into PAL (Figure 5). Then LA is reached byan intramolecular Cannizzaro reaction, whereas 12-PDO re-sults from a double hydrogenation through acetol.
Thus, the main difference between the two routes lies inthe nature of the first step. Dehydration, dehydrogenationand enol rearrangements into ketone or aldehyde are exo-thermic on the surface. On the contrary, C=O bonds hydro-genation steps and LA formation are endothermic.
Glycerol dehydrogenation path : The two possible productsGAL and DHA result from successive C!H and O!H bondruptures on the Rh surface. We describe first the structuresof the four mono-dehydrogenated intermediates and theeight transition-state (TS) structures. Then we report thefour possible reaction paths.
Intermediate and transition-state structures : The first X!Hbond scission can take place at the central (CHc) or termi-nal (CHt) carbon atom, or at the central (OHc) or terminal(OHt) oxygen atom that leads to alkyl intermediates (IntCHc,IntCHt) and alkoxy intermediates (IntOHc and IntOHt), respec-tively (Figure 7). Both alkyl intermediates are bound to the
Rh atoms through the mono-dehydrogenated carbon atomand both the terminal hydroxyl groups. The IntCHc inter-mediate is more stable than the IntCHt by 0.17 eV, which is inagreement with the greater stability of secondary carbonradicals relative to primary ones. Conversely, alkoxy inter-mediates structures differ: in IntOHc, the alkoxy in adsorbedin a ternary site, whereas it is adsorbed at a top site inIntOHt. This can explain the greater stability of IntOHc (by0.19 eV) since methoxy is preferentially adsorbed at a terna-ry site rather than at a top site by 0.39 eV. For IntOHt, the ad-sorption of the hydroxyl group and the position of the inter-nal hydrogen bonds constrain the alkoxy to be in its less-stable position. The structures of the transition states for thefirst and the second dehydrogenation steps are shown inFigure 8 and Figure 9, respectively. The label of the TS forthe second hydrogenation is built by concatenating the
Figure 6. Structures of Enol 1 (propene-2,3-diol), Enol 2 (propene-1,3-diol), DHA and GAL chemisorbed onto the Rh ACHTUNGTRENNUNG(111) surface. Black,white, dark grey and light grey spheres correspond to C, H, O and Rhatoms, respectively. Dashed dark grey lines represent hydrogen bonds.Colour version of the figure is available in the Supporting Information(Figure S4).
Figure 7. Structure of mono-dehydrogenated intermediates on RhACHTUNGTRENNUNG(111).Black, white, dark grey and light grey spheres correspond to C, H, O andRh atoms respectively. Dashed dark grey lines represent hydrogen bonds.IntCHt, IntCHc, IntOHt and IntOHc are the mono-dehydrogenated intermedi-ates that resulting respectively from terminal C!H (CHt), central C!H(CHc), terminal O!H (OHt) and central O!H (OHc) bond ruptures inglycerol. The displayed structures are the ones after hydrogen diffusionaway from the intermediate, that is without the co-adsorbed hydrogenatom. Energies are in eV. The reference energy taken here is the glyceroladsorbed at the Rh ACHTUNGTRENNUNG(111) surface. Bond lengths are expressed in $.Colour version of the figure is available in the Supporting Information(Figure S5).
Chem. Eur. J. 2011, 17, 14288 – 14299 # 2011 Wiley-VCH Verlag GmbH & Co. KGaA, Weinheim www.chemeurj.org 14293
FULL PAPERGlycerol Hydrogenolysis
66 ∑Heterogeneous Catalysis

name of bonds dissociated in the first step and in the secondstep. TS structures can be divided into two categories: 1) TSof the C!H bond rupture are characterised by a triangleconfiguration Rh/C/H, the bond being broken onto an atopsite 2) TS of the O!H bond rupture are characterised by aoxygen at a top site and a hydrogen atom in a neighbouringbridge position.
Reaction paths : Figure 10 illustrates the glycerol dehydro-genation pathways to GAL and DHA. The reference is theenergy of adsorbed glycerol. GAL results from the succes-sive C!H and O!H bond scissions at the terminal positionof glycerol. Depending on the order of those two dissocia-tions, two pathways are possible: 1) the alkoxy path starts
with the terminal O!H bond scission to lead to IntOHt andcontinues with the terminal C!H bond scission or 2) thealkyl path starts with the terminal C!H bond scission tolead to IntCHt and continues with the terminal OH bond scis-sion. Similarly, two routes yield DHA through glycerol de-hydrogenation at the central position: 1) the alkoxy paththrough IntOHc and 2) the alkyl path through IntCHc. The twointermediates dehydrogenated at the central position aremore stable on the surface than the corresponding terminalones by around 0.2 eV. IntOHc is even the most stable one(!0.32 eV). In addition, the O!H bond scission at the cen-tral position has the lowest activation barrier (Eact =0.67 eV)among the four possible initial dissociations, thereby makingIntOHc the most probable intermediate. However, from
Figure 8. Structure of the transition states for the first step of glycerol de-hydrogenation on Rh ACHTUNGTRENNUNG(111). Black, white, dark grey and light grey spherescorrespond to C, H, O and Rh atoms, respectively. Dashed dark greylines represent hydrogen bonds. Bonds implicated in the TS are repre-sented in light grey. Energies are in eV. The reference energy taken hereis the glycerol adsorbed at the Rh ACHTUNGTRENNUNG(111) surface. Bond lengths are ex-pressed in $. Colour version of the figure is available in the SupportingInformation (Figure S6).
Figure 9. Structure of the transition states for the second step of glyceroldehydrogenation on Rh ACHTUNGTRENNUNG(111). Black, white, dark grey and light greyspheres correspond to C, H, O and Rh atoms. Dashed dark grey linesrepresent hydrogen bonds. Bonds implied in the TS are represented inlight grey. Energies are in eV. The reference energy taken here is theglycerol adsorbed at the Rh ACHTUNGTRENNUNG(111) surface. Bond lengths are expressed in$. Colour version of the figure is available in the Supporting Information(Figure S7).
Figure 10. Energy profiles [eV] for the dehydrogenation reaction paths of glycerol toward glyceraldehyde (GAL) and dihydroxyacetone (DHA) forma-tion. The reference energy taken here is the glycerol adsorbed at the Rh ACHTUNGTRENNUNG(111) surface (Figure 4). GAL and DHA structures on the surface can be seenin Figure 6. The straight line is the alkoxy route along which the mono-dehydrogenated intermediates are IntOHt and IntOHc (Figure 7). The dashed line isthe alkyl route along which the mono-dehydrogenated intermediates are IntCHt and IntCHc (Figure 7). Structures of transition states of first and secondsteps are displayed Figure 8 and Figure 9, respectively.
www.chemeurj.org # 2011 Wiley-VCH Verlag GmbH & Co. KGaA, Weinheim Chem. Eur. J. 2011, 17, 14288 – 1429914294
F. Delbecq, C. Pinel et al.
∑Heterogeneous Catalysis 67

IntOHc, the following C!H bond dissociation is unfavourable,the central C!H bond being oriented towards the vacuum(Figure 7). To take advantage of the metal catalyst activa-tion, an Rh!Ot bond (2.28 $) has to be broken and the cen-tral oxygen has to switch from a stabilising hollow site to atop site (see IntOHc in Figure 7 and TSOHc!CHc in Figure 9).The associated energy barrier is the highest computed forC!H and O!H bond dissociations in glycerol (Eact = 1.16 eV,Figure 10). Consequently, the alkoxy route that leads toDHA is kinetically slow. Given the lower stability of the ter-minal intermediates, the OH bond rupture at the terminalposition is surprisingly the second-lowest activation barrier(Eact =0.70 eV). Then it is easily followed by the CHt bondscission with a low energy barrier (Eact =0.55 eV, Figure 10).Thus, the alkoxy route that leads to GAL is the most favour-able route kinetically. Moreover, the alkyl route that leadsto GAL is also competitive: the CHt barrier is only 0.07 eVhigher than the OHt barrier and the second dissociationtransition state CHt!OHt is only 0.05 eV lower in energythan OHt!CHt. Besides, the alkyl route that leads to DHArequires the crossing of higher barriers and is less probable.To conclude, GAL is the major dehydrogenation productand it is mainly obtained through the alkoxy route.
Glycerol dehydration path : The dehydration of an alcoholcatalysed by a metallic surface is a two-step process: C!Hbond scission followed or preceded by the adjacent C!Obond scission. Wang et al. have shown that the C!H dissoci-ation comes first when dehydrating ethanol at a Rh ACHTUNGTRENNUNG(111)surface.[50] According to their work, the initial C!O bondrupture is reported to be difficult (Eact = 1.76 eV), whereasthe initial C!H bond rupture is accessible (Eact =0.52 eV).Conversely, the C!O bond rupture as a second step fromthe mono-dehydrogenated CH3CHOH species is easy (Eact =0.42 eV). Thus, we have considered the dehydration of glyc-erol by adopting the following route: C!H scission followedby C!O scission.
Intermediates and transition-state structures : This processshares the first step with the alkyl routes of the dehydrogen-ation process (see above). The TS structures of the CO rup-ture are provided in Figure 11. The dissociating hydroxylgroup is adsorbed onto a top site of the surface, and is al-ready distant from the forming enol, as the CO bond lengthis 2.11 $ in both TS structures.
Reaction paths : As already said, the glycerol dehydrationcan lead to two different enols: 1) Enol 1 (central C!Hbond followed by terminal CO scission) or 2) Enol 2 (termi-nal C!H bond followed by central CO scission). Figure 12shows the corresponding reaction pathways. The TS of theCO scission are rather high in energy: 0.95 eV at the termi-nal position, 0.86 eV at the central position with respect toadsorbed glycerol. Consequently, the main dehydrationroute is CHt!COc for which both barriers are lower, thusleading to Enol 2.
Figure 11. Structure of the transition states for the second step of glyceroldehydration (C!O bond cleavage) on Rh ACHTUNGTRENNUNG(111). Black, white, dark greyand light grey spheres correspond to C, H, O and Rh atoms. Dasheddark grey lines represent hydrogen bonds. Bonds implied in the TS arerepresented in light grey. Bond lengths are expressed in $. Colour ver-sion of the figure is available in the Supporting Information (Figure S8).
Figure 12. Energy profiles [eV] for the dehydration reaction path of glycerol toward Enol 1 and Enol 2 formation. Enol 1 and Enol 2 structures can beseen in Figure 6. The reference energy taken here is the glycerol adsorbed at the RhACHTUNGTRENNUNG(111) surface (Figure 4). The mono-dehydrogenated intermediatesare IntCHt and IntCHc, which are displayed in Figure 7. Structures of transition states of first and second steps are shown in Figure 8 and Figure 11, respec-tively.
Chem. Eur. J. 2011, 17, 14288 – 14299 # 2011 Wiley-VCH Verlag GmbH & Co. KGaA, Weinheim www.chemeurj.org 14295
FULL PAPERGlycerol Hydrogenolysis
68 ∑Heterogeneous Catalysis

Discussion
The glycerol transformation into propanediols (PDOs) isgenerally performed in basic or acidic media in the presenceof a metal catalyst under hydrogenolysis conditions: 12-PDO is usually the main product. This transformation is for-mally a dehydration coupled to a hydrogenation reaction.Consequently, dehydration is commonly envisaged as thefirst step of the reaction. The corresponding mechanism isrepresented in Scheme 2 in black. The glycerol dehydrationyields an enol (Enol 1, propen-1,2-diol) in equilibrium withacetol. Then this ketone is hydrogenated at the metal cata-lyst into 12-PDO.
As seen in the Results Section, glycerol yields the expect-ed 12-PDO in the presence of an Rh/C catalyst at basic pHunder hydrogenolysis conditions (P(H2)=50 bar) but it alsoyields an oxidation product, the lactic acid (LA) with aslightly lower yield (Table 2, entry 2). This product could beobtained by the dehydrogenation of acetol into pyruvalde-hyde (PAL), followed by a Cannizzaro reaction into LA(Scheme 2, additional path in grey). Moreover, when chang-ing the atmosphere from reductive to inert, both productsare still obtained but with a reversed selectivity (Table 2,entry 1). Thus, even in absence of H2, 12-PDO can be pro-duced. This questions the mechanism of glycerol hydroge-nolysis previously described.
In the literature, an alternative mechanism has been pro-posed by Montassier et al.,[17] starting with a dehydrogena-tion step, unfamiliar under hydrogenolysis conditions. Thisalternative route is represented in Scheme 3 in the particularcase of Rh/C catalyst in basic media. The glyceraldehyde(GAL) formed by the dehydrogenation of glycerol is dehy-drated into PAL. Finally, this intermediate is successivelyhydrogenated into acetol and 12-PDO. LA can be easily ob-tained by a Cannizzaro reaction from PAL. Dihydroxyace-tone is often reported as another dehydrogenation productof glycerol, but dehydration is difficult in this case becauseof the absence of adjacent carbons that bear H and OHgroups.
Gathering experimental and theoretical results, we willfirst discuss the nature of the first step, dehydrogenationversus dehydration. Then we will focus on the product selec-
tivity (LA and 12-PDO) depending on the nature of the at-mosphere.
Dehydration versus dehydrogenation : The glycerol conver-sion and the pH increase together, and this is often associat-ed with a dehydration mechanism. However, one shouldnote that the basic media is essential in both mechanismswe examine here at different steps: the Cannizzaro reactionthat leads to LA from PAL in both routes, the initial glycer-ol dehydration step in the dehydration mechanism and thedehydration of GAL into Enol 3 in the dehydrogenationmechanism.
To test the feasibility of the glycerol dehydration, glycerolwas introduced in sodium hydroxide under He without cata-lyst. No conversion is observed after 24 h. This means that ifthe dehydration occurs, the metal catalyst and sodium hy-droxide are both required and that there would be an assis-tance of the metal.[38]
The key intermediates, GAL, PAL and acetol, are notstable in a molar solution of sodium hydroxide at room tem-perature. Their detection requires performing the experi-ments in neutral or acidic solution. When reacting glycerolin water (pH 6.5) in the presence of the Rh/C catalyst, avery low glycerol conversion is reached and traces of 12-PDO are observed, whatever the atmosphere. Under H2 at-mosphere, traces of GAL (together with glyceric acid) areseen, whereas acetol is not detected. Under helium atmos-phere, traces of GAL (together with glyceric acid), PAL andacetol are detected. GAL is a key intermediate in the dehy-drogenation route only, whereas PAL and acetol are expect-ed to be key intermediates in both routes. Following thoseexperiments, dehydrogenation seems to be the first step ofglycerol deoxygenation into 12-PDO and LA. But oneshould wonder whether these findings could be extrapolatedto the reaction in alkaline conditions.
In the operating conditions, we observed an initial in-crease of pressure (Figure 3) whatever the atmosphere.However, under hydrogen atmosphere, a decreasing pres-
Scheme 2. Dehydration mechanism usually proposed for the glycerol con-version into 1,2-propanediol (12-PDO). In grey, an extension can beeasily proposed from acetol to lead to the lactic acid (LA).
Scheme 3. Proposed mechanism of glycerol conversion into lactic acid(LA) and 1,2-propanediol (12-PDO) starting with a dehydrogenationstep.
www.chemeurj.org # 2011 Wiley-VCH Verlag GmbH & Co. KGaA, Weinheim Chem. Eur. J. 2011, 17, 14288 – 1429914296
F. Delbecq, C. Pinel et al.
∑Heterogeneous Catalysis 69

sure follows. Analysis of the gas phase indicates that theonly gas produced in significant amount is H2. It is conse-quently reasonable to attribute the pressure variations to H2
production and consumption. Since APR is excluded underour conditions, there is necessarily a dehydrogenation stepthat occurs. Now there is a potential H2 source in bothmechanisms. H2 is obviously produced from glycerol if dehy-drogenation is the first step. If the dehydration is the firststep, acetol can be another possible source of H2 by dehy-drogenation into PAL (Scheme 2), which is thermodynami-cally favoured (Figure 5). However, under hydrogen atmos-phere, the pressure increases and then decreases and themain product is 12-PDO. According to the dehydrogenationmechanism (Scheme 3), the first step produces one equiva-lent of GAL and of H2. Later, the formation of 12-PDO in-volves the consumption of two equivalents of H2, whichleads to the further decrease in the pressure. Along the al-ternative dehydration route (Scheme 2), H2 production andconsumption steps are not sequential as in the previous dis-cussion, but are parallel and initiate from acetol. Conse-quently, the initial increase of hydrogen pressure would beobserved only if LA is the main product. Now, under hydro-gen, the hydrogenation product, 12-PDO, is the dominantone at all stages of the reaction. Thus, the dehydrationmechanism appears incompatible with the transient forma-tion of H2.
The influence of the atmosphere on the conversion ratehas also to be pointed out. The glycerol hydrodeoxygenationis actually found to be significantly faster under helium thanunder hydrogen-gas pressure: the catalyst is initially almostfour times more active (Figure 1). According to the dehy-drogenation mechanism, this can be explained by the rever-sibility of the initial dehydrogenation step. Under H2 atmos-phere, the high H2 pressure inhibits the glycerol dehydro-genation. On the contrary, under He atmosphere, the equi-librium is inverted, thereby favouring a faster glycerol con-version. If we consider now the alternative mechanism thatis initiated by a dehydration step, the production of the keyintermediate acetol should not depend on the H2 pressure.Hence the rate of transformation of glycerol should not de-crease under H2 compared to He, but only the selectivityshould be modified, with more 12-PDO and less LA pro-duced under H2. Hence, the dehydration mechanism seemsto be again incompatible with the experimental results.
Let us now look at the conclusions from the DFT calcula-tions. The glycerol dehydration on model Rh ACHTUNGTRENNUNG(111) surfaceleads to two enols, Enol 1 and Enol 2, to yield 12-PDO and13-PDO, respectively, after isomerisation and hydrogenationsteps (Figure 5). Those two enol intermediates are isoener-getic on the metal catalyst and more stabilised than the de-hydrogenation intermediates, GAL and DHA. Thermody-namically, dehydration is hence favoured over dehydrogena-tion on the surface. If we now look at the reaction barriers,the formation of Enol 1 goes through transition states ofhigher energies (0.83, 0.95 eV, Figure 12) than the reactionpath to Enol 2 (0.77, 0.86 eV, Figure 12). Thus, Enol 2 is thekinetically favoured intermediate on the dehydration route.
It would lead by hydrogenation to 13-PDO, in contradictionwith the experimental selectivity. Alternatively, the dehydro-genation path can be considered. Two routes are possible,the alkyl route and the alkoxy route, depending on the firstbond rupture, C!H or O!H. Obviously, the first dehydro-genation step of the alkyl routes (C!H rupture) is commonwith the dehydration. However, the C!H bond ruptureshave higher barriers (0.83, 0.77 eV) than the alternative O!H bond ruptures (0.67, 0.70 eV). In addition, when startingwith the terminal hydroxyl scission (OHt!CHt route), thefirst dissociation is the rate-limiting step (Figure 10). Conse-quently, the dehydrogenation (overall barrier of 0.70 eV) isfavoured kinetically compared with dehydration (overallbarrier of 0.86 eV) and leads to GAL by means of an OHt!CHt route.
To sum up, the combination of experiment and theoryshows that dehydrogenation into GAL is the first step forthe glycerol transformation on the Rh/C catalyst in basicmedia under He or H2 atmosphere.
LA and 12-PDO selectivity : The proposed mechanism issummarised in Scheme 3. Glycerol is dehydrogenated intoGAL. Then, its subsequent dehydration into Enol 3 is ther-modynamically favoured on the surface (Ereac =!0.73 eV),as shown from DFT calculations. The isomerisation ofEnol 3 into PAL is straightforward, and then a double hy-drogenation into 12-PDO or a Cannizzaro reaction to yieldLA can occur. From our experimental results, PAL conver-sion into LA is irreversible, whereas PAL hydrogenationinto 12-PDO is an equilibrium. Indeed, LA is stable underour experimental conditions (Table 5, entries 3 and 4),whereas 12-PDO is mainly converted into LA under He.Those final steps control the product selectivity dependingon the atmosphere.
Under a hydrogen atmosphere, the main product is the12-PDO since the equilibrium is displaced towards the hy-drogenation direction (Table 5, entry 2). Moreover, the PALhydrogenation into acetol and then 12-PDO is probablyfaster than the Cannizzaro reaction into LA under H2 pres-sure, hence the 12-PDO being the main product.
Under helium atmosphere, the pressure increases continu-ously, thereby leading to a significant concentration of hy-drogen in the gas phase at the end of the reaction. As al-ready noted, hydrogen production is ensured by the glyceroldehydrogenation. However, the H2 partial pressure is muchlower than under H2 atmosphere. Therefore, all the hydro-genation/dehydrogenation equilibria are displaced towardsdehydrogenation. This contributes to the H2 pressure in-crease but also to the diminution of the 12-PDO yield andto the increase of the LA yield (Table 5). Since the forma-tion of LA is irreversible under the reaction conditions, thisis the main product under He atmosphere.
In a nutshell, the product distribution is controlled by thehydrogenation/dehydrogenation equilibria, and hence by thenature of the atmosphere. Under H2, the hydrogenation ofthe intermediates into 12-PDO is favoured, whereas underneutral atmosphere, the transformation of PAL into LA by
Chem. Eur. J. 2011, 17, 14288 – 14299 # 2011 Wiley-VCH Verlag GmbH & Co. KGaA, Weinheim www.chemeurj.org 14297
FULL PAPERGlycerol Hydrogenolysis
70 ∑Heterogeneous Catalysis

a Canizzaro reaction is the main path since 12-PDO is po-tentially dehydrogenated.
Conclusion
The association of the experimental and theoretical pointsof view has provided a deep insight into the rhodium-cata-lysed transformation of glycerol into 1,2-propanediol (12-PDO) and lactic acid (LA). We have particularly focused onthe determination of the first step of the reaction, as therewas a need to decide between the dehydration and the de-hydrogenation mechanisms. Although the conversion andthe pH increase together, which could be tentatively associ-ated with a dehydration mechanism, some clues appearedexperimentally in favour of the dehydrogenation route. Weestablished that switching the nature of the gas phase from areductive to an inert atmosphere increased the reaction rate.It must be underlined that under inert atmosphere, althoughthe products distribution was sharply impacted in favour ofLA formation, a significant amount of 12-PDO was ob-tained together with the production of hydrogen. The theo-retical investigations on glycerol dehydrogenation and dehy-dration at a model RhACHTUNGTRENNUNG(111) surface with density functionaltheory allowed us to distinguish between the two reactionpaths. Dehydrogenation was found to be kinetically fav-oured at the surface over dehydration. In addition, glyceral-dehyde (GAL) was found to be the favoured intermediateover dihydroxyacetone (DHA). The dehydrogenation ofglycerol into GAL has thus been evidenced as the majorphenomenon that initiates the hydrodeoxygenation mecha-nism on rhodium catalyst. Furthermore, key experimentalresults such as the transient production of H2 in the gasphase and the influence of the nature of the atmosphere (H2
or He) on the reaction rate are fully explained by the pro-posed mechanism, whereas they cannot be explained fromthe alternative route initiated by a dehydration step. Wehave hence revisited Montassier"s dehydrogenation mecha-nism by highlighting the surface phenomena and by showingfrom the mixed experimental and theoretical study that de-hydrogenation and not dehydration is the first step of the re-action.
Experimental Section
Catalyst preparation and characterisation : The rhodium catalyst support-ed on carbon was prepared by cationic exchange (see the Supporting In-formation). The effective Rh weight loading determined by ICP analysiswas 0.7 wt %. XRD analysis furnished little information, given the amor-phous nature of the carbon support. The absence of intense Rh peaks ledus to think that Rh particles are well dispersed (Figure S1 in the Support-ing Information). TEM analysis confirmed this forecast; the picturescould be seen (Figure S2 in the Supporting Information): the Rh/C cata-lyst shows small, well-dispersed nanoparticles (2–3 nm).
Catalytic tests and analysis : Initial screening of catalysts was conductedusing a Slurry Phase Reactor 16 (AMTEC) for 12 h with glycerol (6 mL,5 wt %) in solvent (H2O or NaOH 1 m), 30 mg catalyst, 1000 rpm. The re-actors were purged three times with 20 bar helium, heated at 453 K
(unless another temperature is specified) and pressurised at 30 bar if thereaction was performed under helium. If the reaction was run under hy-drogen, the pressure was adjusted to 50 bar. For the kinetic study, the re-action was performed in a 200 mL stainless steel autoclave equipped witha graphite-stabilised Teflon container. Samples of the reaction mediumwere taken out regularly and analysed by HPLC using a CarboSep 107Hcolumn (0.5 mL min!1 of 0.005 n H2SO4, T=40 8C). 13-PDO, 12-PDO,ethylene glycol, 1-propanol, 2-propanol, ethanol, methanol, acetol, lacticacid, formic acid, acetic acid, glyceraldehyde and glyceric acid were ana-lysed. Total organic carbon (TOC) was also measured using a ShimadzuTOC-5050A analyser. The difference between TOC measured and TOCconcentration introduced into the reactor gave an estimation of gaseousproducts (CO, CO2, H2 and so on) formed during the reaction. Gas phasewas collected in a gas bag at the end of the reaction and analysed using aGC-MS (Agilent Technologies, 5975C) instrument equipped with Alumi-na, Poraplot U and 5 $ molecular sieve columns and thermal-conductivi-ty detectors. Backflush injectors were used for Poraplot U and 5 $ mo-lecular sieve columns.
Computational details : Periodic density functional theory (DFT) calcula-tions have been carried out using the Vienna Ab Initio Simulation Pro-gram (VASP).[65] The exchange-correlation energy and potential were cal-culated within the generalised gradient approximation (Perdew–Wang 91functional).[66] A tight convergence of the plane-wave expansion was ob-tained with a cutoff of 400 eV. The electron–ion interactions were de-scribed by the projector augmented method (PAW) introduced byBlçch[67] and adapted by Kresse and Joubert.[68] The Rh ACHTUNGTRENNUNG(111) surface ismodelled by a 3% 3 surface supercell that contains a slab of four layersand a vacuum of five equivalent metal layers (11.10 $). A Monkhorst–Pack mesh of 3% 3 % 1 k points was used for the 2D Brillouin zone inte-gration.[69]
The adsorption of the molecules was realised on the upper side of theslab. The two bottom layers of the slab were kept frozen in the bulk posi-tions, whereas the uppermost layers and the molecule were free to relax.The adsorption energy Eads is calculated as the difference between theenergy of the adsorption complex and that of the bare surface plus themolecule in the gas phase. A negative energy means a stabilising adsorp-tion. The reaction energy Ereact is defined as the difference between theenergy of the product and the energy of the reactant. A negative energymeans that the reaction is exothermic, whereas a positive energy meansthat the reaction is endothermic. Reactions paths have been studied bycombining Nudge Elastic Band (NEB) procedures[70] together with ourlocal reaction path generator OpenPath[71] and the dimer method.[72]
Then transition-state structures have been optimised with a quasi-Newton algorithm and characterised by a single imaginary frequency.The activation energy Eact is specified as the difference between theenergy of the TS and the energy of the reactant. Extended calculationswith a 4% 4 unit cell, a five-layer slab with a 3 % 3 unit cell, and takinginto account the dipole correction have been performed, without affect-ing notably the activation barriers values and the TS structures (Table S1in the Supporting Information), hence validating the model initiallychosen.
Acknowledgements
We are indebted to the EU (Topcombi contract no. NMP2-CT2005–515792) for financial support. F.A. acknowledges the French Minister ofResearch and Education for a PhD grant. Pascale Mascunan and No&lleChristin, Mimoun Aouine, FranÅoise Bosselet and Chantal Lorentz areacknowledged for their assistance (ICP analysis, TEM, XRD and gas-phase analysis, respectively). Paul Fleurat-Lessard is acknowledged forproviding the OpenPath program. We are grateful to PSMN, to GENCI(CINES/IDRIS, project x2010075609) and to CINECA for computer fa-cilities and helpful assistance.
www.chemeurj.org # 2011 Wiley-VCH Verlag GmbH & Co. KGaA, Weinheim Chem. Eur. J. 2011, 17, 14288 – 1429914298
F. Delbecq, C. Pinel et al.
∑Heterogeneous Catalysis 71

[1] B. Sels, E. D"Hondt, P. Jacobs in Catalysis for Renewables: FromFeed Stock to Energy Production (Eds.: G. Centi, R. A. van Santen),Wiley-VCH, Weinhem, 2007, p. 223.
[2] M. Pagliaro, M. Rossi The Future of Glycerol: New Uses of a Versa-tile Raw Material, RSC Publishing, Cambridge, 2008.
[3] C.-H. Zhou, J. N. Beltramini, Y.-X. Fan, G. Q. Lu, Chem. Soc., Rev.2008, 37, 527 –549.
[4] A. Behr, J. Eilting, K. Irawadi, J. Leschinski, F. Lindner, GreenChem. 2008, 10, 13– 30.
[5] M. Pagliaro, R. Ciriminna, H. Kimura, M. Rossi, C. Della Pina,Angew. Chem. 2007, 119, 4516 –4522; Angew. Chem. Int. Ed. 2007,46, 4434 –4440.
[6] B. Katryniok, S. Paul, V. Belliere-Baca, P. Rey, F. Dumeignil, GreenChem. 2010, 12, 1922 –1925.
[7] J. Barrault, F. Jerome, Eur. J. Lipid Sci. Technol. 2008, 110, 825 –830.[8] M. A. Dasari, P.-P. Kiatsimkul, W. R. Sutterlin, G. J. Suppes, Appl.
Catal. A 2005, 281, 225 –231.[9] Y. Nakagawa, Y. Shinmi, S. Koso, K. Tomishige, J. Catal. 2010, 272,
191 – 194.[10] O. M. Daniel, A. DeLaRiva, E. L. Kunkes, A. K. Datye, J. A. Dume-
sic, R. J. Davis, ChemCatChem 2010, 2, 1107 –1114.[11] L.-Z. Qin, M.-J. Song, C.-L. Chen, Greem Chem. 2010, 12, 1466 –
1472.[12] J. Chaminand, L. Djakovitch, P. Gallezot, P. Marion, C. Pinel, C.
Rosier, Green Chem. 2004, 6, 359 – 361.[13] Y. Shen, S. Zhang, H. Li, Y. Ren, H. Liu, Chem. Eur. J. 2010, 16,
7368 – 7371.[14] W. C. Ketchie, M. Murayama, R. J. Davis, J. Catal. 2007, 250, 264 –
273.[15] R. Garcia, M. Besson, P. Gallezot, Appl. Catal. A 1995, 127, 165 –
176.[16] R. R. Davda, J. W. Shabaker, G. W. Huber, R. D. Cortright, J. A.
Dumesic, Appl. Catal. B 2005, 56, 171 –186.[17] C. Montassier, D. Giraud, J. Barbier, J.-P. Boitiaux, Bull. Soc. Chim.
Fr. 1989, 2, 148 – 155.[18] C. Montassier, J. C. M!n!zo, L. C. Hoang, C. Renaud, J. Barbier, J.
Mol. Catal. 1991, 70, 99–110.[19] J. Zhou, L. Guo, X. Guo, J. Mao, S. Zhang, Green Chem. 2010, 12,
1835 – 1843.[20] T. Jiang, Y. Zhou, S. Liang, H. Liu, B. Han, Green Chem. 2009, 11,
1000 – 1006.[21] D. Roy, B. Subramaniam, R. V. Chaudhari, Catal. Today 2010, 156,
31– 37.[22] Y. Kusunoki, T. Miyazawa, K. Kunimori, K. Tomishige, Catal.
Commun. 2005, 6, 645 –649.[23] T. Miyazawa, Y. Kusunoki, K. Kunimori, K. Tomishige, J. Catal.
2006, 240, 213 –221.[24] T. Miyazawa, S. Koso, K. Kunimori, K. Tomishige, Appl. Catal. A
2007, 318, 244 –251.[25] T. Miyazawa, S. Koso, K. Kunimori, K. Tomishige, Appl. Catal. A
2007, 329, 30–35.[26] E. P. Maris, R. J. Davis, J. Catal. 2007, 249, 328 – 337.[27] E. P. Maris, W. C. Ketchie, M. Murayama, R. J. Davis, J. Catal. 2007,
251, 281 –294.[28] E. D"Hondt, S. Van de Vyver, B. F. Sels, P. A. Jacobs, Chem.
Commun. 2008, 6011 – 6012.[29] I. Gandarias, P. L. Arias, J. Requies, M. B. G'emez, J. L. G. Fierro,
Appl. Catal. B 2010, 97, 248 –256.[30] A. Wawrzetz, B. Peng, A. Hrabar, A. Jentys, A. A. Lemonidou, J. A.
Lercher, J. Catal. 2010, 269, 411 –420.[31] S. Wang, Y. Zhang, H. Liu, Chem. Asian J. 2010, 5, 1100 –1111.[32] S. Bolado, R. E. TreviÇo, M. T. Garc(a-Cubero, G. Gonz)lez-Benito,
Catal. Commun. 2010, 12, 122 –126.[33] Z. Huang, F. Cui, H. Kang, J. Chen, X. Zhang, C. Xia, Chem. Mater.
2008, 20, 5090 –5099.[34] S. Wang, H. Liu, Catal. Lett. 2007, 117, 62– 67.
[35] K. Wang, M. C. Hawley, T. D. Furney, Ind. Eng. Chem. Res. 1995,34, 3766 –3770.
[36] I. Furikado, T. Miyazawa, S. Koso, A. Shimao, K. Kunimori, K. To-mishige, Green Chem. 2007, 9, 582 –588.
[37] Y. Shinmi, S. Koso, T. Kubota, Y. Nakagawa, K. Tomishige, Appl.Catal. B 2010, 94, 318 –326.
[38] D. Coll, F. Delbecq, Y. Aray, P. Sautet, Phys. Chem. Chem. Phys.2011, 13, 1448 –1456.
[39] G.-C. Wang, Y.-H. Zhou, Y. Morikawa, J. Nakamura, Z.-S. Cai, X.-Z. Zhao, J. Phys. Chem. B 2005, 109, 12431 – 12442.
[40] I. N. Remediakis, F. Abild-Pedersen, J. K. Nørskov, J. Phys. Chem. B2004, 108, 14535 –14540.
[41] Y.-H. Zhou, P.-H. Lv, G.-C. Wang, J. Mol. Catal. A 2006, 258, 203 –215.
[42] C. J. Zhang, P. Hu, J. Chem. Phys. 2001, 115, 7182 –7186.[43] G. C. Wang, Y. H. Zhou, J. Nakamura, J. Chem. Phys. 2005, 122,
044707 – 1–044707 –8.[44] D. Cao, G. Q. Lu, A. Wieckowski, S. A. Wasileski, M. Neurock, J.
Phys. Chem. B 2005, 109, 11622 –11633.[45] S. Sakong, C. Sendner, A. Gross, J. Mol. Struct. 2006, 771, 117 – 122.[46] P. Ferrin, D. Simonetti, S. Kandoi, E. Kunkes, J. A. Dumesic, J. K.
Nørskov, M. Mavrikakis, J. Am. Chem. Soc. 2009, 131, 5809 –5815.[47] Y. Choi, P. Liu, J. Am. Chem. Soc. 2009, 131, 13054 –13061.[48] H.-F. Wang, Z.-P. Liu, J. Am. Chem. Soc. 2008, 130, 10996 –11004.[49] H.-F. Wang, Z.-P. Liu, J. Phys. Chem. C 2007, 111, 12157 –12160.[50] J.-H. Wang, C. S. Lee, M. C. Lin, J. Phys. Chem. C 2009, 113, 6681 –
6688.[51] M.-M. Yang, X.-H. Bao, W.-X. Li, J. Phys. Chem. C 2007, 111,
7403 – 7410.[52] R. Alcal), M. Mavrikakis, J. A. Dumesic, J. Catal. 2003, 218, 178 –
190.[53] Y.-W. Chen, J.-J. Ho, J. Phys. Chem. C 2009, 113, 6132 –6139.[54] H.-L. Chen, S.-H. Liu, J.-J. Ho, J. Phys. Chem. B 2006, 110, 14816 –
14823.[55] V. Pallassana, M. Neurock, J. Catal. 2002, 209, 289 –305.[56] E. Vesselli, A. Baraldi, G. Comelli, S. Lizzit, R. Rosei, ChemPhys-
Chem 2004, 5, 1133 – 1140.[57] B. N. Zope, D. D. Hibbitts, M. Neurock, R. J. Davis, Science 2010,
330, 74 –78.[58] M. Besson, L. Djakovitch, P. Gallezot, C. Pinel, A. Salameh, M. Vo-
spernik in Catalysis of Organic Reactions, (Ed.: M. L. Prunier),Chemical Industries, Boca Raton, 2009, p. 313.
[59] R. D. Cortright, R. R. Davda, J. A. Dumesic, Nature 2002, 418, 964 –967.
[60] G. W. Huber, J. A. Dumesic, Catal. Today 2006, 111, 119 –132.[61] G. W. Huber, R. D. Cortright, J. A. Dumesic, Angew. Chem. 2004,
116, 1575 –1577; Angew. Chem. Int. Ed. 2004, 43, 1549 –1551.[62] R. Soares, D. Simonetti, J. A. Dumesic, Angew. Chem. 2006, 118,
4086 – 4089; Angew. Chem. Int. Ed. 2006, 45, 3982 –3985.[63] R. Chelli, F. L. Gervasio, C. Gellini, P. Procacci, G. Cardini, V.
Schettino, J. Phys. Chem. A 2000, 104, 11220 – 11222.[64] C. S. Callam, S. J. Singer, T. L. Lowary, C. M. Hadad, J. Am. Chem.
Soc. 2001, 123, 11743 –11754.[65] G. Kresse, J. Hafner, Phys. Rev. B 1993, 47, 558 – 561.[66] J. P. Perdew, Y. Wang, Phys. Rev. B 1992, 45, 13244 – 13249.[67] P. E. Blçchl, Phys. Rev. B 1994, 50, 17953 – 17979.[68] G. Kresse, D. Joubert, Phys. Rev. B 1999, 59, 1758 –1775.[69] H. J. Monkhorst, J. D. Pack, Phys. Rev. B 1976, 13, 5188 – 5192.[70] D. Sheppard, R. Terrell, G. Henkelman, J. Chem. Phys. 2008, 128,
134106 – 1–134106 –10.[71] P. Fleurat-Lessard, P. Dayal, A chemist view on reaction path deter-
mination, to be published. Freely available at: http://forge.cpb.ens-lyon.fr/redmine/projects/openpath/wiki/WikiEnglish.
[72] G. Henkelman, H. Jonsson, J. Chem. Phys. 1999, 111, 7010 – 7022.
Received: April 29, 2011Revised: August 18, 2011
Published online: November 8, 2011
Chem. Eur. J. 2011, 17, 14288 – 14299 # 2011 Wiley-VCH Verlag GmbH & Co. KGaA, Weinheim www.chemeurj.org 14299
FULL PAPERGlycerol Hydrogenolysis
72 ∑Heterogeneous Catalysis

Linear Energy Relations As Predictive Tools for Polyalcohol CatalyticReactivityJeremie Zaffran, Carine Michel, Florian Auneau, Francoise Delbecq, and Philippe Sautet*
Universite de Lyon, CNRS and Ecole Normale Superieure of Lyon, 46 Allee d’Italie, 69364 Lyon Cedex 07, France
*S Supporting Information
ABSTRACT: Molecules extracted from biomass can be complex, andcomputing their reactivity on a catalyst is a real challenge for theoreticalchemistry. We present herein a method to predict polyalcohol reactivity inheterogeneous catalysis. We start from a set of simple alcohol molecules, and weshow that an accurate linear energy relationship can be constructed from DFTcalculations for the O−H and C−H dehydrogenation reactions. We then showthat this relation can then be used for a fast prediction of the reactivity ofglycerol. Compared with pure DFT calculations, our method provides results ofgood accuracy with a systematic deviation of ∼0.1 eV. We were able to provethat this deviation is caused mainly by intramolecular effects occurring inglycerol and not in simpler molecules.
KEYWORDS: Brønsted−Evans−Polanyi type relationships, glycerol, polyols, biomass, monoalcohols, dehydrogenation, DFT
Molecules extracted from biomass set new challenges forheterogeneous catalysis and require the design of
improved catalysts.1,2 The cellulosic fraction of biomass isconstituted of polyalcohols, which can be transformed tovaluable products (chemicals or fuels) by various types ofchemical reactions (dehydrogenation, hydrogenolysis, dehy-dration, ...).3 These polyalcohols are associated with a largespace of geometric configurations, and they can be involved in acomplex network of serial or parallel reactions, which renderthe study of their reactivity with a solid catalyst complex andtedious. The calculation of their reactions at metal surfacesrequires quantum chemical methods to properly describe bond-breaking and bond-forming steps, but these methods are tooheavy for a fast exploration of complex reaction networks. It ishence of utmost importance to design methods that are ofsimilar accuracy to quantum chemical approaches but can allowa fast screening of multiple elementary steps.In this work, we show that transition state energies and
reaction barriers for polyalcohols can be efficiently predictedfrom linear relationships of Brønsted−Evans−Polanyi (BEP)type, linking the desired kinetics quantities with more easilyaccessible adsorption energy or reaction energy data, which areestablished here using a set of monoalcohol molecules. Here,we use glycerol as a prototype polyalcohol, and we focus ondehydrogenation reactions on a Rh catalyst, hence involving theC−H and O−H bond-breaking processes. Indeed, it has beendemonstrated that dehydrogenation is the first step for glyceroltransformation on a Rh catalyst, under H2 gas pressure or underHe.4 Even if one restrains the reactivity of glycerol todehydrogenation processes, many pathways are possible by acombination of elementary acts dealing with CH/OH groups incentral/terminal positions. In addition, glycerol can adopt a
very large number of configurations in the gas phase5 and on asurface.6 It is unclear if the most stable configuration will be themost reactive one, and probing all configurations/pathwayswith first principle approaches such as DFT is, hence, a verytedious and computer-intensive task.The idea of simple and fast evaluation of activation barriers
from reaction thermodynamic data traces back to thepioneering work of Brønsted,7 Bell,8 Evans, and Polanyi,9 asdetailed in a recent review.10 These correlations were initiallyused to compare molecular reactivity and, in a later stage, tomodel the kinetics of chemical reactions. They have beenapplied to heterogeneous catalysis reactions by several authors;however, two alternative methods were considered. Althoughsome authors correlated activation energy with reactionenergy,11−14 in a traditional BEP style, others proposed tocorrelate the transition state energy with the energy of theinitial or the final state of the reaction, a method later referredto as transition state scaling (TSS).15−19 Only a few paperscompare the merits of both correlation methods.20,21 Thesituation remains confused on this point because for a singletype of correlation, different definitions were used. In thispaper, we will explore both TSS (with eight possibledefinitions) and BEP (with four definitions) correlations toclarify their comparison.A general catalytic elementary step is shown in Scheme 1.
The step starts from the initial state minimum, IS; progressesthrough the transition state, TS; and finishes at the final state
Received: November 11, 2013Revised: December 17, 2013
Letter
pubs.acs.org/acscatalysis
© XXXX American Chemical Society 464 dx.doi.org/10.1021/cs4010503 | ACS Catal. 2014, 4, 464−468
∑Heterogeneous Catalysis 73
Reprinted with permission from ACS. Catal. 2014, 4, 464-468. Copyright 2014 American Chemical Society.

minimum, FS. The principle of the BEP analysis is to explorethe correlation behavior when plotting the activation (or theTS) energy versus the reaction (or FS) energy for a givensample of such reaction steps. The definition of IS and FS is notabsolute because it depends on the direction chosen for thereaction. In our case, one can define the direction from thereaction itself, bond dissociation (diss), or association (assoc).Another possibility is to select the direction on an energycriterion, such as for each step choosing the endothermic(endo) or exothermic (exo) direction. This defines four typesof BEP analysis, expressing the correlation between theactivation energy, E‡ = ETS − EIS, and the reaction energy,ΔE = EFS − EIS. TSS relations correlate intrinsic TS and FSenergies so that a reference energy is needed. We use as areference a state in which all surface fragments are consideredin gas phase, and the most stable spin state was chosen in thecase of radicals. A TSS relation is, hence, defined by a direction(diss/assoc or exo/endo), a choice of thermodynamic state(either IS or FS), and a choice for the energy reference (againIS or FS). Our general notation is diss.IS/IS, where the lastsymbol defines the energy reference. Clearly, diss.IS/IS andassoc.FS/FS are identical definitions, such as exo.FS/FS andendo.IS/IS, so that only diss and exo directions will be kept.Eight types of TSS are then defined.The existence and the quality of the correlation will be
studied on a sample of simple alcohol molecules that aredisplayed in Scheme 2. Six molecules have been chosen with
several substitution levels and a mixture of primary andsecondary alcohols. For each of them, OH and CH bonddissociations have been considered, with a further distinctionbetween CH bonds in the α or β position with respect to theOH. First and second dehydrogenation reactions have beenconsidered so that a set of dehydrogenated products is formedof various chemical natures (radicals, carbonyls, enols). In total,the sampling set contains 29 bond activations (12 CHα, 7CHβ, and 10 OH, see the Supporting Information (SI)).If we first select the diss.FS/FS, exo.FS/IS, and BEP.diss
forms of correlation, which have been previously used in theliterature,11−21 the 29 points ETS/EFS or E
‡/ΔE are displayed inFigure 1. A clear and high-quality linear relation is seen. Thestatistical analysis of the deviations between DFT values andlinear relation values are shown for each correlation as box plotson the inserts of Figure 1. We also report the mean absoluteerror (MAE) and the maximum error (MAX). Error is definedas “DFT value − linear relation value”. The three chosencorrelation definitions give very similar error distributions forthe three subsets CHα/CHβ/OH, in a range from ∼−0.1 to+0.1 eV. This attests to the good quality of these relationships,which is confirmed by a MAE on the order of 0.05 eV (seeTable 1) in each case. Note that the range of data is smaller forthe BEP definition, giving a less visually appealing correlation(and a larger confidence interval for the slope of the linearrelation; see the SI) for a similar distribution of errors. Let ushighlight in addition that splitting the sample into three subsetsconsiderably lowers the errors of the linear model, as shown bythe MAE/MAX analysis, which is almost divided by 2.Furthermore, predicting CHα/CHβ/OH by a model estab-lished with all the points together leads to nonnegligiblesystematic errors (see SI Figure S2), significantly degrading theprediction.From this analysis of the sampling set, the three selected
types of correlations are of equivalent and high quality, and theerror values after a separation in the three types of bonds issmall (MAE ∼ 0.05 eV), which is very encouraging for a use ofthese correlations in predicting reactivity. A similar result wasobtained for all 12 types of correlations considered, as seen inFigure 2. When taking all bonds together, only small variationsare seen in the MAE between the methods, and hence, all 12should be evaluated as being of the same general quality (error∼ 0.08 eV). Separation of the set in each type of dissociatedbond (CHα/CHβ/OH) again lowers the error, showingfluctuations around 0.05 eV for the various methods. None,however, is consistently better than the other ones, even if forthe specific case of CHβ dissociation BEP are more accuratethan TSS (for box plots, see SI Figure S3). The main point hereis to clearly stress that TSS and BEP type relations have asimilar (and high) merit,19 at least for Rh catalysts and thechosen family of monoalcohol molecules.Our results also show that the choice of the direction of the
reaction (either on a chemical or energy base) or of thereference (for TSS modes) is not determinant for the result.This is, of course, reassuring for the robustness of thecorrelation concept and its usage for a wide range of systemsand reactions. The BEP formulation has some practicaladvantages because the correlated quantities are more directlylinked with reaction thermodynamics and kinetics so thattrends can more clearly be caught and so that the slope (alsocalled the transfer coefficient) has a simple interpretation interms of early or late character of the transition state.
Scheme 1. General Scheme of a Surface Catalytic ElementaryStepa
aETS, EIS, and EFS are energies of the transition state, the initial state,and the final state, respectively. E‡ and ΔE are activation and reactionenergies, respectively.
Scheme 2. Sample of Molecules Used to Establish the BEPType Relationshipsa
aHere are depicted the six monoalcohol molecules generating the 29elementary CH and OH dissociation steps included for theconstruction of the linear relations.
ACS Catalysis Letter
dx.doi.org/10.1021/cs4010503 | ACS Catal. 2014, 4, 464−468465
74 ∑Heterogeneous Catalysis

Now that we have established these correlations on themonoalcohol sample set, we turn to the central question: Canwe use them to predict the reactivity of glycerol, chosen as aprototype polyalcohol? We have considered all first and secondC−H and OH bond dissociations of glycerol on Rh(111). Notethat in the case of glycerol, all CH bonds are in α of an OHgroup. For simplicity, we focus here on only the threecorrelation modes already selected for Figure 3 (diss.FS/FS,exo.FS/IS, and BEP.diss), but a complete analysis is provided inthe SI (see Figure S4). We calculated the most stable initial andfinal states for first and second hydrogenation processes on
glycerol on Rh(111) and determined the TS linking them. Notethat for some reaction steps, we included several TS and theircorresponding reactants and products (associated with differentconformations of glycerol) to improve the reliability of ourstatistical analysis (see glycerol structures in the SI and FigureS5).The 31 (18 C−H and 13 O−H dissociations) points for
glycerol are shown in Figure 3, together with their associatedlinear relation in black and with the correlation lines previouslyestablished for the monoalcohol family (in red). This graphclearly shows that the correlation established with themonoalcohol family is already a good model to predict thetransition state energy or the activation energy for glycerol. Theanalysis of the deviation between the points for glycerol and the(red) line from the monoalcohol family quantifies this result(see box plots in Figure 3 and Table 2).Notice that in this case, we also present the mean signed
error (MSE), which is nonzero here because the linear relationis not associated with the sample considered for glycerol. Onecan clearly notice a systematic deviation, the prediction lineunderestimating the activation energy (on average, by 0.1 eV)for the CH bonds and overestimating it (by 0.1 eV) for the OHbonds. We will see the consequence of this systematic error onthe predictive potential of the method later. The MAE is veryclose to this MSE and, hence, remains small (∼0.1 eV for allthree definitions). The error is, hence, reasonably increasedwith respect to the sampling set, and this gives predictive powerto the approach. Points corresponding to metastable config-urations of glycerol follow the linear relation within givenstatistical errors, although the most stable thermodynamic state
Figure 1. Linear relations constructed from first and seconddehydrogenation steps of the six monoalcohol molecules of Scheme1 on Rh(111). Three definitions of the correlation are considered: □,×, and + are the DFT calculated values for CHα, CHβ, and OHrespectively; and full, dashed, and mixed lines are the correspondinglinear relations. At the bottom right corner of each graph, the box plotsdepict the corresponding error distribution. Red crosses signal meanabsolute errors (MAE).
Table 1. Error Analysis for Monoalcohol BEP TypeRelationshipsa
TSS-diss.FS/FS TSS-exo.FS/IS BEP.diss
MAE MAX MAE MAX MAE MAX
all 0.09 0.23 0.08 0.17 0.07 0.18CHα 0.03 0.06 0.03 0.09 0.03 0.07CHβ 0.04 0.09 0.06 0.07 0.01 0.02OH 0.06 0.11 0.05 0.15 0.05 0.10
aHere is presented the error analysis (mean absolute error, MAE;maximal absolute error, MAX) for the 29 CH and OH dissociationelementary steps of the considered monoalcohols family on Rh(111).The correlation can be established from the global sample (all), orsubfamilies can be considered for each type of chemical bond activated(CHα, CHβ, OH).
Figure 2. Comparison of the 12 considered definitions for thecorrelations (grouped into 8 TSS and 4 BEP types). MAE is given forthe linear relation considering the 3 subsets (CHα/CHβ/OH)separately and the whole set (“All”) of monoalcohol dehydrogenationreactions.
ACS Catalysis Letter
dx.doi.org/10.1021/cs4010503 | ACS Catal. 2014, 4, 464−468466
∑Heterogeneous Catalysis 75

is not always strictly associated with the most stable TS (seeFigure S5 in the SI). Again, the two TSS and the BEPapproaches have a very similar performance in terms of error.This can be generalized to all 12 correlation types considered inthis paper, as shown in Figure S4 in the SI. All definitions give asimilar error distribution, with an especially narrow range forthe BEP case for OH dissociation and a larger error for the TSSinvolving the initial state as variable for the CH activation.
The capability to reasonably predict the catalytic reactivity ofglycerol from that of simple alcohols is not a straightforwardresult, and it opens several perspectives. Generally speaking, toour knowledge, the use of BEP-type relations on simplemolecules to predict multifunctional ones has not beendemonstrated. It has been proposed, however, to predict theinfluence of substituents in the case of the hydrogenation ofunsaturated aldehydes.22 There are many reasons why glycerolreactivity might be different from that of simple alcohols. Thepresence of terminal and central OH/CH is equivalent toprimary and secondary alcohols, both of which are in thesampling set. One key difference, however, is the presence inglycerol of intramolecular hydrogen bonds that assist the OHdissociation for the H bond acceptor OH.23 The DFT-calculated TS energy will, hence, be lower for glycerol than forthe monoalcohol sample, hence explaining the ∼-0.1 eVsystematic error. This effect appears clearly if one considerssome water-assisted reactions in the case of dehydrogenation ofmonoalcohols.As a simpler H-bonded system, we considered ethanol,
interacting with a chemisorbed water molecule through a H-bond, ethanol being the H-bond acceptor.22 In thisconfiguration, the OH bond scission in ethanol is modified,and the corresponding points are shifted toward the glycerolline in the BEP plots (see Figure S6 in the SI). In contrast, thepositive systematic error seen for the CH bond dissociation isnot related to the H bond effect. It stems from the constraintsthat neighboring OH groups in glycerol exert on glycerol. Byinteracting with the metal surface, they make the adsorbedmolecule more rigid; hence, hindering the formation of theoptimal C−H transition structure and increasing its energy withrespect to the freer situation of monoalcohol sample. However,these effects are not very marked, and on average, the predictivepotential remains good.In the following, we will consider some examples of glycerol
dehydrogenation elementary steps focusing on selectivityissues, that is, on the comparison of the barriers betweendifferent paths from a given intermediate. This is a severe test insituations for which DFT barriers are close and will highlightthe cases in which a prediction is valid and those for which theaccuracy might be insufficient. Scheme 3 presents two examplesfor glycerol or its hydrogenated intermediate on a Rh(111)surface and compares DFT calculated barriers (below arrow)with those predicted by three correlations built from themonoalcohol family (above arrows). The comparison betweenCH and OH dissociation (first line) is especially difficultbecause the systematic deviation in the prediction is different,with an overestimation for OH and an underestimation for CH,and because here, the DFT barrier difference is small. Themethod is, hence, not able to correctly grasp the preferredreaction.The second elementary reaction starts from dehydrogenated
glycerol at the terminal carbon and compares two further OHdissociation steps. The systematic deviation is eliminatedbecause similar reactions are compared and the random errorremains, which is inherent to any statistical model. Errors rangenow between ∼-0.1 and ∼+0.1 eV, which is similar to theresults obtained for simple alcohols. In addition, the differencebetween barriers obtained from the correlations (0.13−0.22eV) being large enough to safely predict that the reaction onthe right, forming glyceraldehyde, is favored.We, hence, showed that linear energy relations established
for a sample of monoalcohol molecules on Rh can efficiently be
Figure 3. Linear relations constructed from first and seconddehydrogenation steps of glycerol on Rh(111). Three definitions ofthe correlation are considered: □ and × are the DFT calculated valuesfor CH and OH bonds, respectively, and full and mixed lines are thecorresponding linear relations. In red are recalled the linear relationsobtained in the case of the monoalcohol set for the CHα (full line)and the OH (mixed line) bonds. At the bottom right corner of eachgraph, the box plots depict the corresponding error distributionsbetween the data points and the (red) monoalcohol linear relations.Red crosses signal mean signed errors.
ACS Catalysis Letter
dx.doi.org/10.1021/cs4010503 | ACS Catal. 2014, 4, 464−468467
76 ∑Heterogeneous Catalysis

applied to the prediction of reaction barriers for polyalcoholmolecules, such as glycerol with a statistical mean absolute errorof ∼0.1 eV. Coupled with other approaches that simplify theevaluation of the adsorption energy of large molecules, as groupadditivity24 or scaling relations,25 this opens a fast and powerfulexploration of the complex mechanisms and of the kinetics forthe catalytic transformation of molecules extracted frombiomass. Small deviations occur from the presence ofintramolecular H bonds in the polyalcohol molecule, under-estimating (respectively overestimating) the barrier for CH(respectively OH) and, hence, favoring CH dissociation versusOH in the predicted values. It would be certainly important todevelop methods to estimate this systematic deviation betweenthe set of CH or OH dissociation steps for glycerol versusmonoalcohols because this would allow us to implement acorrection on the data and to improve the prediction whencomparing dehydrogenation at CH and OH on the polyalcohol.Although this analysis has been performed on a Rh(111)surface, the conclusions should not be specific to that systemand extend to other faces or metal, as already proposed forother reaction steps.18,20 Immediate perspectives aim atgeneralizing this behavior to other bond cleavages, such asC−C or C−O; other metals; and other types of molecularsystems extracted from biomass, such as lignin.
■ ASSOCIATED CONTENT*S Supporting InformationComputational methods and elements of statistics, additionaltables and schemes, list of reactions and their correspondingstructures used to get the relationships. This material isavailable free of charge via the Internet at http://pubs.acs.org.
■ AUTHOR INFORMATIONCorresponding Author*E-mail: [email protected].
NotesThe authors declare no competing financial interest.
■ ACKNOWLEDGMENTSWe thank PSMN at ENS Lyon, IDRIS-CNRS, and CINES forcomputational resources. We also acknowledge the support ofANR through the GALAC Project (ANR-10-CD2I-011).
■ REFERENCES(1) Huber, G. W.; Chheda, J. N.; Barrett, C. J.; Dumesic, J. A. Science2005, 308, 1446−1450.(2) Chheda, J. N.; Huber, G. W.; Dumesic, J. A. Angew. Chem., Int.Ed. 2007, 46, 7164−7183.(3) Ruppert, A.; Weinberg, K.; Palkovits, R. Angew. Chem., Int. Ed.2012, 51, 2564−2601.(4) Auneau, F.; Michel, C.; Delbecq, F.; Pinel, C.; Sautet, P. Chem.Eur. J. 2011, 17, 14288−14299.(5) Callam, C. S.; Singer, S. J.; Lowary, T. L.; Hadad, C. M. J. Am.Chem. Soc. 2001, 123, 11743−11754.(6) Coll, D.; Delbecq, F.; Aray, Y.; Sautet, P. Phys. Chem. Chem. Phys.2011, 13, 1448−1456.(7) Brønsted, J. N. Chem. Rev. 1928, 5, 231−338.(8) Bell, R. P. Proc. R. Soc. London, Ser. A 1936, 154, 414−429.(9) Evans, M. G.; Polanyi, M. Trans. Faraday Soc. 1938, 34, 11−23.(10) Van Santen, R. A.; Neurock, M.; Shetty, S. G. Chem. Rev. 2010,110, 2005−2048.(11) Pallassana, V.; Neurock, M. J. Catal. 2000, 191, 301−317.(12) Liu, Z. P.; Hu, P. J. Chem. Phys. 2001, 115, 4977−4980.(13) Michaelides, A.; Liu, Z. P.; Zhang, C. J.; Alavi, A.; King, D. A.;Hu, P. J. Am. Chem. Soc. 2003, 125, 3704−3705.(14) Wang, H. F.; Liu, Z. P. J. Am. Chem. Soc. 2008, 130, 10996−11004.(15) Logadottir, A.; Rod, T.; Nørskov, J. K.; Hammer, B.; Dahl, S.;Jacobsen, C. J. H. J . Catal. 2001, 197, 229−231.(16) Alcala, R.; Mavrikakis, M.; Dumesic, J. A. J. Catal. 2003, 218,178−190.(17) Loffreda, D.; Delbecq, F.; Vigne, F.; Sautet, P. Angew. Chem., Int.Ed. 2009, 48, 8978−8980.(18) Chen, Y.; Vlachos, D. G. J. Phys. Chem. C 2010, 114, 4973−4982.(19) Liu, B.; Greeley, J. J. Phys. Chem. C 2011, 115, 19702−19709.(20) Wang, S.; Petzold, V.; Tripkovic, V.; Kleis, J.; Howalt, J. G.;Slulason, E.; Fernandez, E. M.; Hvolbaek, B.; Jones, G.; Toftelund, A.;Falsig, H.; Bjorketun, M.; Studt, F.; Abild-Pedersen, F.; Rossmeisl, J.;Nørskov, J. K.; Bligaard, T. Phys. Chem. Chem. Phys. 2011, 13, 20760−20765.(21) Sutton, J. E.; Vlachos, D. G. ACS Catal. 2012, 2, 1624−1634.(22) Laref, S.; Delbecq, F.; Loffreda, D. J. Catal. 2009, 265, 35−42.(23) Michel, C.; Auneau, F.; Delbecq, F.; Sautet, P. ACS Catal. 2011,1, 1430−1440.(24) Salciccioli, M.; Chen, Y.; Vlachos, D. G. J. Phys. Chem. C 2010,114, 20155−20166.(25) Abild-Pedersen, F.; Greeley, J.; Studt, F.; Rossmeisl, J.; Munter,T. R.; Moses, P. G.; Skulason, E.; Bligaard, T.; Nørskov, J. K. Phys. Rev.Lett. 2007, 99, 016105.
Table 2. Error Analysis for the Prediction of Glycerol Reactivitya
TSS-diss.FS/FS TSS-exo.FS/IS BEP.diss
MSE MAE MAX MSE MAE MAX MSE MAE MAX
CH +0.13 0.13 0.28 +0.13 0.13 0.29 +0.11 0.13 0.25OH −0.11 0.12 0.24 −0.09 0.10 0.28 −0.13 0.13 0.20
aHere is presented the error analysis for predicting glycerol reactivity on Rh(111) from the monoalcohol linear energy relationship using the threemain definitions: MSE, mean signed error; MAE, mean absolute error; and MAX, maximal absolute error.
Scheme 3. Prediction of Activation Energies for GlycerolDehydrogenationa
aThe first line describes two possible paths for the first dissociationstarting from glycerol, and the second line describes two probableroutes for the second step starting from “radical 1”. The value beloweach arrow is the activation energy predicted by DFT, and the threevalues above are the activation energies predicted from threedefinitions of the monoalcohol linear energy relationship (TSS-diss.FS/FS, TSS-exo.FS/IS, BEP.diss).
ACS Catalysis Letter
dx.doi.org/10.1021/cs4010503 | ACS Catal. 2014, 4, 464−468468
∑Heterogeneous Catalysis 77

This journal is c The Royal Society of Chemistry 2012 Catal. Sci. Technol.
Cite this: DOI: 10.1039/c2cy20363d
On the key role of hydroxyl groups in platinum-catalysed alcoholoxidation in aqueous mediumw
Siwar Chibani,za Carine Michel,*a Francoise Delbecq,a Catherine Pinelb andMichele Besson*b
Received (in CYZUR) 29th May 2012, Accepted 10th August 2012
DOI: 10.1039/c2cy20363d
In the aerobic selective oxidation of alcohols in aqueous medium in a batch reactor, it was
observed that the addition of water to dioxane solvent (10–50 vol%) substantially increased the
activity of a Pt/C catalyst. Periodic density functional theory (DFT) calculations were carried out
to compare the reactivity of alcohols on the bare Pt(111) surface and in the presence of adsorbed
water or hydroxyl groups, to explain the effect of water. The calculations indicate that the
presence of adsorbed hydroxyl groups promotes the catalytic activity by participating directly in
the catalytic pathways and reducing the activation barrier. Good agreement was found between
the experiments in aqueous phase and these calculations. Further, decarbonylation of the
aldehyde may be involved in the deactivation during oxidation of a primary alcohol.
1. Introduction
The selective oxidation of alcohols into the correspondingaldehydes, carboxylic acids and/or carbonyl compounds isone of the most important and useful reactions in the finechemical, pharmaceutical and agrochemical sectors.1–3 Classicaloxidants (stoichiometric quantities of inorganic oxidants suchas permanganates, chromates, hypochlorites, or HNO3),
4 theDess–Martin periodinane,5 or the Swern reagent,6 are oftenused for commercial applications. However, they may be toxicand release large amounts of waste. An attractive clean methodknown for a long time,7 and which has received considerableattention over the years, is aerobic oxidation with a cheapoxidant such as molecular oxygen using metal catalysts. Thesecatalysts can efficiently oxidize alcohols, using oxygen or air togenerate only water as a by-product under mild conditions(40–100 1C), atmospheric or a low pressure, and pH 7–10.Several supported metallic systems (particularly palladium,platinum, ruthenium, and recently gold) on various supportingmaterials have been an area of intense interest and haveemerged as efficient catalysts as described in reviews.8–11
From a practical point of view, the first studies have mostlyconcentrated on the use of water as the solvent for oxidationof carbohydrates over Pt or Pd catalysts.12 However, the poorsolubility in aqueous solution of weakly polar alcohols is acrucial issue for the generalization of this reaction. Thoughthe use of detergents,13 organic solvents,14 scCO2,
15,16 oramphiphilic resin-supported particles of Pd or Pt,17,18 has beenproposed to overcome the difficulty, the choice of the solventremains crucial. Several studies have indicated a promotingeffect of water on the activity in aerobic oxidation of alcoholson metallic catalysts. For instance, we have investigated theoxidation of primary and secondary alcohols which are poorlysoluble in water, and dioxane was used as additional solvent.1- and 2-Octanol were chosen, since, moreover, aliphaticalcohols have been reported as being particularly difficult tooxidize compared with aromatic and allylic alcohols.19 Uponreacting the alcohol in dioxane solvent, only a slow oxidationtook place. In comparison to the dioxane solvent, a significantenhancement in catalytic activity of a Pt/C catalyst wasobserved for both alcohols, by addition of increasing amountsof water to the solvent. The higher the water content, thehigher the activity is. A promoting effect of water was alsorevealed in the oxidation of 1-phenylethanol and a-substitutedpyridinemethanol derivatives over Pt/C and PtBi/C,20 ofbenzyl alcohol over Pd confined in SBA-16,21 Au/TiO2 inxylene,22 or carbon nanotube supported Ru catalysts intoluene.23 The solvent composition also modified the activityof Au–Pd and Au–Pt catalysts in oxidation of n-octyl, cinnamylor benzylic alcohols.24,25
Another major problem in alcohol oxidation is the possiblecatalyst deactivation. Upon comparing 1-octanol and 2-octanol,we noted different reaction profiles with reaction time.19 A severe
aUniversite de Lyon, CNRS, Ecole Normale Superieure de Lyon,46 allee d’Italie, F-69364 Lyon Cedex 07, France.E-mail: [email protected]
bUniversite de Lyon, CNRS, IRCELYON, 2 avenue A. Einstein, F-69626Villeurbanne, France. E-mail: [email protected];Fax: +33 (0)472445399
w Electronic supplementary information (ESI) available. See DOI:10.1039/c2cy20363dz Present address: Laboratoire CEISAM - UMR CNRS 6230,Universite de Nantes, 2 rue de la Houssiniere, BP 92208, 44322 NantesCedex 3, France.
CatalysisScience & Technology
Dynamic Article Links
www.rsc.org/catalysis PAPER
Dow
nloa
ded
on 1
1 Se
ptem
ber 2
012
Publ
ished
on
14 A
ugus
t 201
2 on
http
://pu
bs.rs
c.or
g | d
oi:1
0.10
39/C
2CY
2036
3D
View Online / Journal Homepage
78 ∑Heterogeneous Catalysis

Catal. Sci. Technol. This journal is c The Royal Society of Chemistry 2012
deactivation was observed during 1-octanol oxidation andcomplete conversion was not achieved at 100 1C. In the2-octanol oxidation, full conversion could be attained with totalselectivity to 2-octanone. One reason might be decarbonylation ofthe produced aldehyde resulting in site-blocking by chemisorbedCO and carbonaceous fragments under anaerobic conditions.Spectroscopic studies have shown that the aldehydes formedfrom primary alcohols (1-octanol, cinnamyl alcohol) weredecarbonylated, while the ketones (in particular 2-octanone)were stable.26 Decarbonylation of crotonaldehyde was demon-strated by synchrotron XPS combined with temperature-programmed desorption during oxidation of crotyl alcohol.27
Strongly adsorbed CO could be removed by air.28,29
The exact reaction sequence through which a dehydrogenationmechanism occurs during selective oxidation of alcohols overnoble metal catalysts is still debated. There are still discussionsconcerning the oxidation state of the active metallic sites, theelementary steps, and the involvement of oxygen or water in thereaction mechanism, the reason for the catalyst deactivation.8–11
The generally accepted mechanism for Pt group metals involves adehydrogenation step of the adsorbed alcohol molecule on themetallic sites forming the carbonyl compound. The adsorbedhydrogen becomes oxidized by dissociatively adsorbed oxygento liberate the metallic sites. This was supported by kineticmodelling,30 by the observation that oxygen can be replaced byan H-acceptor,31 or by the fact that the metal catalyst is in areduced state both in the presence and absence of molecularoxygen by measurements of electrode potential,32 or in situX-ray absorption spectroscopy (XAS).33 The direct interactionof surface oxygen species with the adsorbed alcohol (or itspartially dehydrogenated intermediate) has also been proposed,supported by XAS studies that indicate partial oxygen coverageon the metal surface,34 and some kinetic studies revealing aLangmuir–Hinshelwood-type mechanism.35 The major role ofoxygen has also been shown to be the removal of impuritiesfrom the aldehyde degradation on the surface sites.28,29
Clearly, the oxide species and chemisorbed oxygen species atthe surface of the platinum (O2, –OH, H2O) should play animportant role during the oxidation reactions. There are fewdata on how the presence of water at the catalyst–liquidsolution interface can influence the kinetics of the catalyticreaction.36–38 Investigating the reactions at the solid–liquidinterface in the complex solvent environment becomes essen-tial to improve the heterogeneous process and to understandthe mechanism. Computational studies using the densityfunctional theory (DFT) have been undertaken for many yearsto shed light on the mechanisms of alcohols oxidation i.e.dehydrogenation and decomposition on surfaces, in particularof methanol39–45 and ethanol46–49 on Pt(111). Recently, 1- and2-propanol have been also considered.50 Nowadays theexperimental conditions begin to be taken into account inthe calculations, particularly the solvent51 and co-adsorbateson the surface.52–55 To our knowledge, none of the previousworks studied systematically the influence of the presence ofhydroxyl groups or water on the energy of the intermediateson the Pt surface.
The aim of the present study is a further understanding ofthe promotion of the oxidation reaction by water and thepossible poisoning of the active sites:
(i) To further assess the general use of aqueous phasepromotion, the study was extended to some other alcoholsin dioxane–water solvent, such as sterically hindered mentholand borneol.(ii) To gain insight into the nature of the interactions of
adsorbates with the platinum surface in the solvent environ-ment, DFT calculations have been performed. We tried toelucidate the rate-determining step in different environments,including water molecules and co-adsorbates in the calcula-tions to show whether they can enhance the activity of thecatalyst by providing a low energy route for dehydrogenation.We also examined the possible deactivation attributed to
subsequent decarbonylation of the produced aldehyde in thecase of primary alcohols.
2. Experimental details
Pt catalysts supported on a synthetic carbon catalyst (2.8–4.7 wt% Pt) were prepared by impregnation with an aqueoussolution of H2PtCl6, followed by liquid phase reduction withformaldehyde in alkaline medium, as described previously.19
The carbon was prepared by carbonization at 1073 K of aporous polymeric phenolic resin, washing and activation withCO2 at 1123 K with 30% burn-off.56
The oxidation reactions were performed in a 300 mLautoclave reactor made of Hastelloy C with a magneticallydriven stirrer. The reactor was loaded with the feed solution(150 mL, 35–100 mmol L!1) and an appropriate amount ofcatalyst, then sealed, purged with Ar and heated to the desiredtemperature. Air was introduced up to the pressure of 10 barand the reaction started upon applying efficient stirring.Liquid samples were periodically withdrawn from the reactorvia a sample diptube, and analyzed via gas chromatography(GC) equipped with a flame ionization detector (FID) and aHP5 column (30 m " 0.25 mm, 0.25 mm film thickness).
3. Computational details
Periodic density Functional Theory (DFT) calculations have beencarried out using the Vienna Ab Initio Simulation Program(VASP).57 The exchange-correlation energy and potential werecalculated within the generalized gradient approximation (Perdew-Wang 91 functional).58 A tight convergence of the plane-waveexpansion was obtained with a cut-off of 400 eV. The electron–ions interactions were described by the projector augmentedmethod (PAW) introduced by Blochl59 and adapted by Kresseand Joubert.60 The supported platinum catalyst has beenmodelled by a Pt(111) surface using a 3 " 3 supercell of aperiodic slab of four layers and a vacuum of five equivalentmetal layers. A Monkhorst–Pack mesh of 3 " 3 " 1 k pointswas used for the 2D Brillouin zone integration.61 Moleculeshave been adsorbed at the upper side of the slab. Theadsorbates and the two upper layers were free to relax whilethe two bottom layers have been kept frozen in the bulkposition (Pt–Pt distance = 2.82 A). Geometries were convergedup to reach forces less than 0.01 eV A!1.Reaction paths have been studied combining Nudged Elastic
Band (NEB) procedures62,63 together with our local reaction pathgenerator OpenPath64 and the dimer method.65,66 Then, transition
Dow
nloa
ded
on 1
1 Se
ptem
ber 2
012
Publ
ished
on
14 A
ugus
t 201
2 on
http
://pu
bs.rs
c.or
g | d
oi:1
0.10
39/C
2CY
2036
3D
View Online
∑Heterogeneous Catalysis 79

This journal is c The Royal Society of Chemistry 2012 Catal. Sci. Technol.
state (TS) structures have been optimized with a quasi-Newtonalgorithm and characterized by a single imaginary frequency.
The reaction energy DE of the bond scissions is the differencebetween the adsorbed reactant and the two products consideredat infinite distance. The activation energy DEz is specified as thedifference between the energy of the TS and the energy of thereactant. The adsorption energy, Eads, is the difference betweenthe energy of the whole system and the energies of the reactantin gas phase and of the considered surface (Pt, H2O@Pt orOH@Pt). A negative value means stabilization.
The HREEL spectra have been simulated by calculationof the vibration frequencies, following a previous procedure.67
The technique used is based on the numerical calculationof the second derivatives of the potential energy surface withinthe harmonic approach. The force constant matrix is built withfinite differences of the first derivatives of the total energy bygeometrical perturbations of the optimized Cartesian coordinatesof the system. The diagonalization of this matrix provides theharmonic molecular frequencies and the associated harmonicnormal vibration modes. The intensities of the HREELS spectraare estimated by applying the formula given in ref. 67 where theintensities are proportional to the square of the dynamic dipolemoments (derivatives of the dipole moments with respect to agiven normal mode), to a function depending on experimentalparameters and to the inverse of the frequencies.
4. Results and discussion
4.1. Water effects
Experimental results. Previous experiments on oxidation of1- and 2-octanol showed the positive influence of water; withincreasing water contents in dioxane–water solvent, a largeenhancement of the initial reaction rate was observed, asillustrated in Fig. 1.19
In the oxidation of 2-octanol, whereas the catalyst waspoorly active in dioxane, addition of water to the solventgreatly enhanced the reaction rate to attain total conversion to2-octanone within one hour in dioxane–water 50/50 vol%. Theinitial reaction rate in 1-octanol oxidation was also greatlyenhanced even by addition of a low amount of water (dioxane–water 90/10 vol%). Further addition of water (dioxane–water50/50 vol%) did not significantly improve the performances.However, in contrast to the observations with 2-octanol, noneof the reactions could attain completion; after a high initialreaction rate, a severe inhibition was clearly observed andconversion was rapidly limited to ca. 70–75% after 1 h reaction.In dioxane the major product was 1-octanal, while in dioxane–water solvent octanoic acid concentration was the higher.
We further explored the oxidation of some secondaryalcohols. Fig. 2 shows the reaction of menthol and borneol indioxane and different dioxane–water mixtures to the corres-ponding ketone.
In the reactions with these secondary alcohols, the activityof the catalyst was also improved by increasing the waterconcentration. Conversion attained rapidly completion, andno inhibition of the reaction was observed. The selectivity tothe ketone was >95%.
Theoretical results. The target of this theoretical part will beessentially a better understanding of the role of water inpromoting the reaction according to the experimental results.As alcohol models, primary alcohols are represented byethanol (EtOH) while secondary alcohols are represented byisopropanol (iPrOH). As a reference, the reactivity of alcoholsat the bare platinum surface will be provided first. Then, theeffect of the co-adsorption of an oxygen atom will be studied
Fig. 1 Role of water in the aerobic oxidation of 1- and 2-octanol: (a)
2-octanol in dioxane (E) or dioxane–water 80/20 vol% (m) or
dioxane–water 50/50 vol% (’), (b) 1-octanol in dioxane (E), dioxane–
water 90/10 vol% (K), or dioxane–water 50/50 vol% (’). Reaction
conditions: 150 mL 0.1 mol L!1 alcohol, 373 K, 10 bar air, substrate/Pt
molar ratio = 100.
Fig. 2 Evidence of the role of water in the aerobic oxidation of
secondary alcohols to the ketone: (a) menthol in dioxane (E) or
dioxane–water 80/20 vol% (’), (b) borneol in dioxane (E), dioxane–
water 70/30 vol% (m), or dioxane–water 50/50 vol% (+). Reaction
conditions: 150 mL 0.035 mol L!1 alcohol, 373 K, 10 bar air,
substrate/Pt molar ratio = 100.
Dow
nloa
ded
on 1
1 Se
ptem
ber 2
012
Publ
ished
on
14 A
ugus
t 201
2 on
http
://pu
bs.rs
c.or
g | d
oi:1
0.10
39/C
2CY
2036
3D
View Online
80 ∑Heterogeneous Catalysis

Catal. Sci. Technol. This journal is c The Royal Society of Chemistry 2012
to analyse the effect of the O2 atmosphere. Similarly, the effectof the water in the liquid phase will be mimicked by theco-adsorption of a water molecule at the platinum surface.To end, as the reaction O + H2O - 2OH is known to occureasily on Pt(111),68–70 the influence of a co-adsorbed hydroxylwill be also analysed. Finally, in the case of primary alcoholsthe decarbonylation of the resulting aldehyde will be alsoconsidered.
The transformation of the primary alcohol into the aldehydeand of a secondary alcohol into the ketone corresponds to thescission of two bonds: an O–H bond and a C–H bond.Depending on which breaking occurs first, two routes arepossible: (i) route O starting with the O–H bond dissociationand followed by the a-CH bond breaking of the alkoxy,(ii) route C starting with the C–H bond dissociation and thenthe O–H bond breaking. In the following paragraphs, theinfluence of the environment (bare surface, adsorbed H2Oand OH) on these two paths will be discussed for EtOH andthen iPrOH. For the first step, the transition states (TSs) arelabelled after the bond breaking (TSOH and TSCH), and so doesthe subsequent intermediate (IntOH and IntCH). For the secondstep, the TS label is built by concatenating the name of bondsdissociated in the first step and in the second step: for instance,TSOH–CH corresponds to the CH scission as a second step(route O).
EthanolAdsorption. The adsorption of the ethanol molecule at a
Pt(111) surface follows the general mode of alcohols on thissurface: EtOH interacts with the metallic surface through anoxygen lone pair and is consequently adsorbed at a topposition. The adsorption energy is !0.34 eV (33 kJ mol!1)with our calculation parameters, slightly higher than the onecalculated previously, 27 kJ mol!1,48 but smaller than the experi-mental value determined from TPD experiments, 50 kJ mol!1,71
which indicates a weak adsorption.Let us now consider a modified platinum surface. When one
oxygen atom is already adsorbed at the surface, the adsorptionenergy of ethanol adsorbed at a vicinal site is reduced to!0.15 eVand its adsorption geometry is not modified. In other words, anethanol molecule prefers to adsorb at the bare platinum surface orfar from an oxygen atom of the oxygenated one. Thus, theinfluence of oxygen on alcohol reactivity at the Pt(111) surfacewill not be considered further.
When one water molecule is already chemisorbed at thePt(111) surface, the adsorption energy is increased to !0.61 eVwhich means that the presence of chemisorbed water promotesthe ethanol adsorption. In addition, the adsorption geometryis strongly modified. The ethanol molecule does not interactdirectly with the surface through an oxygen lone pair. However,it interacts with the pre-adsorbed water molecule through aH-bond (H# # #O = 1.61 A), the water molecule being theH-bond donor and the ethanol being the H-bond acceptor(Fig. 3). This configuration has been found 0.32 eV more stablethan the co-chemisorption of the two molecules, each one on atop position on a Pt atom. Thus, an ethanol molecule prefers tointeract with the pre-adsorbed water molecule than to bechemisorbed on the Pt(111) surface. This strongly stabilizing
co-adsorption mode has already been described and analysedon Rh(111).54
The hydroxylated surface has an even more surprisingreactivity towards ethanol adsorption. The hydroxyl is consideredto be adsorbed at a top position (only 0.05 eV higher than thebridge position). On such a modified platinum surface, the ethanolis strongly adsorbed (!0.89 eV). It interacts with a neighbourplatinum atom (Pt–O = 2.07 A) and its hydroxyl hydrogen istransferred to the pre-adsorbed hydroxyl group along theadsorption path, leading to the H2O–EtO structure representedin Fig. 4 (O–H = 1.39 and 1.09 A between ethanol and OH,respectively). It is worth noting that EtOH is already partiallyoxidized by the pre-adsorbed hydroxyl. While our work was inprogress, similar results have been published.52 The sametransfer has also been calculated in the case of phenylethanolon a gold catalyst.53
Reaction paths. The co-adsorbed species affects not only theadsorption process but also the reaction paths followed bythe target molecule. As already mentioned, the oxidation ofethanol into acetaldehyde can follow two routes, route O androute C depending on which bond is broken first (OH or CH,respectively).The stationary points along these two routes have been
fully characterized in three cases: (i) bare Pt(111) surface,(ii) H2O@Pt(111) surface and (iii) OH@Pt(111) surface. Atthe bare surface, the TS structure of route C exhibits a classicaltriangular shape for the first scission (TSCH) while the first TSof route O involves four atoms (Fig. 5 and Table 1 for themain geometrical characteristics). The resulting intermediatesIntCH and IntOH are bonded top to a platinum atom throughthe C and O atom, respectively. The next dissociation leads tothe formation of a CQO bond. The TSOH–CH is a five-centrestransition state: two platinum atoms plus the C, O andH atoms aredirectly involved in the TS (Fig. 5) and the resulting acetaldehyde isadsorbed at a top configuration (Pt–O = 2.0 A, the CQO bond
Fig. 4 Structures obtained after adsorption of ethanol and isopro-
panol in the presence of an adsorbed hydroxyl (Eads = !0.89 eV in
both cases).
Fig. 3 Structures of the adsorbed alcohols in the presence of water.
Eads = !0.61 eV for both.
Dow
nloa
ded
on 1
1 Se
ptem
ber 2
012
Publ
ished
on
14 A
ugus
t 201
2 on
http
://pu
bs.rs
c.or
g | d
oi:1
0.10
39/C
2CY
2036
3D
View Online
∑Heterogeneous Catalysis 81
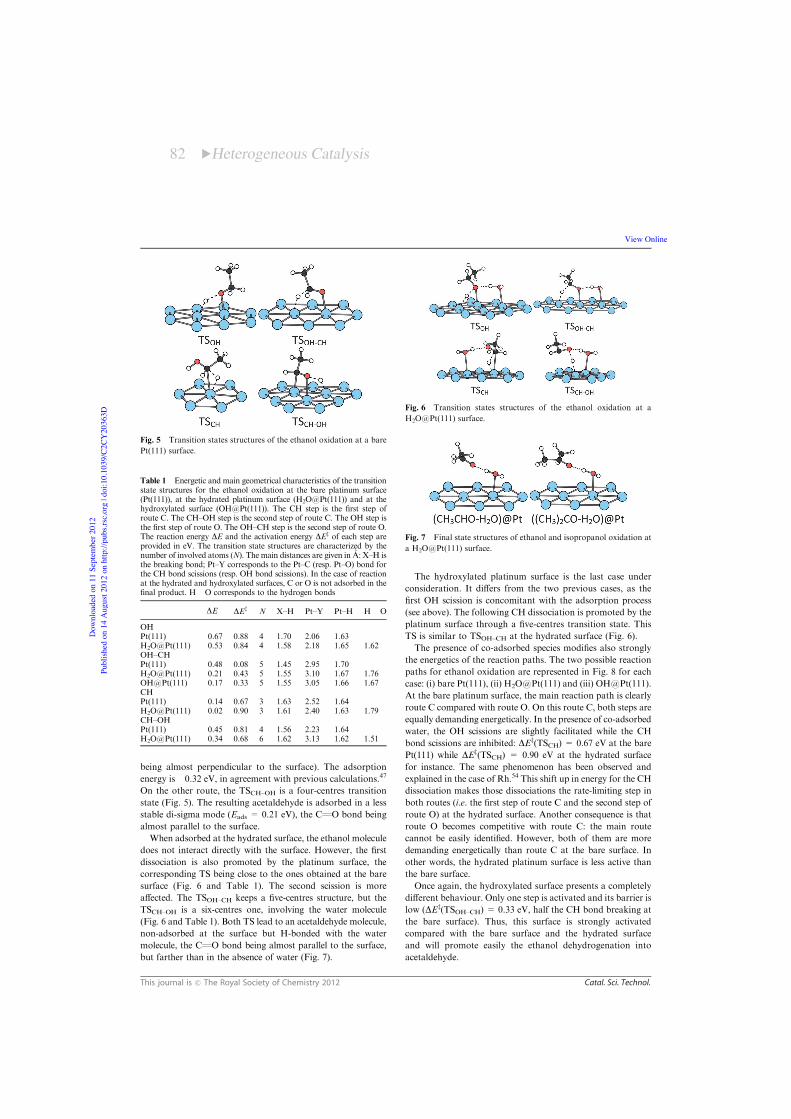
This journal is c The Royal Society of Chemistry 2012 Catal. Sci. Technol.
being almost perpendicular to the surface). The adsorptionenergy is !0.32 eV, in agreement with previous calculations.47
On the other route, the TSCH–OH is a four-centres transitionstate (Fig. 5). The resulting acetaldehyde is adsorbed in a lessstable di-sigma mode (Eads = 0.21 eV), the CQO bond beingalmost parallel to the surface.
When adsorbed at the hydrated surface, the ethanol moleculedoes not interact directly with the surface. However, the firstdissociation is also promoted by the platinum surface, thecorresponding TS being close to the ones obtained at the baresurface (Fig. 6 and Table 1). The second scission is moreaffected. The TSOH–CH keeps a five-centres structure, but theTSCH–OH is a six-centres one, involving the water molecule(Fig. 6 and Table 1). Both TS lead to an acetaldehyde molecule,non-adsorbed at the surface but H-bonded with the watermolecule, the CQO bond being almost parallel to the surface,but farther than in the absence of water (Fig. 7).
The hydroxylated platinum surface is the last case underconsideration. It differs from the two previous cases, as thefirst OH scission is concomitant with the adsorption process(see above). The following CH dissociation is promoted by theplatinum surface through a five-centres transition state. ThisTS is similar to TSOH–CH at the hydrated surface (Fig. 6).The presence of co-adsorbed species modifies also strongly
the energetics of the reaction paths. The two possible reactionpaths for ethanol oxidation are represented in Fig. 8 for eachcase: (i) bare Pt(111), (ii) H2O@Pt(111) and (iii) OH@Pt(111).At the bare platinum surface, the main reaction path is clearlyroute C compared with route O. On this route C, both steps areequally demanding energetically. In the presence of co-adsorbedwater, the OH scissions are slightly facilitated while the CHbond scissions are inhibited: DEz(TSCH) = 0.67 eV at the barePt(111) while DEz(TSCH) = 0.90 eV at the hydrated surfacefor instance. The same phenomenon has been observed andexplained in the case of Rh.54 This shift up in energy for the CHdissociation makes those dissociations the rate-limiting step inboth routes (i.e. the first step of route C and the second step ofroute O) at the hydrated surface. Another consequence is thatroute O becomes competitive with route C: the main routecannot be easily identified. However, both of them are moredemanding energetically than route C at the bare surface. Inother words, the hydrated platinum surface is less active thanthe bare surface.Once again, the hydroxylated surface presents a completely
different behaviour. Only one step is activated and its barrier islow (DEz(TSOH–CH) = 0.33 eV, half the CH bond breaking atthe bare surface). Thus, this surface is strongly activatedcompared with the bare surface and the hydrated surfaceand will promote easily the ethanol dehydrogenation intoacetaldehyde.
Fig. 5 Transition states structures of the ethanol oxidation at a bare
Pt(111) surface.
Table 1 Energetic and main geometrical characteristics of the transitionstate structures for the ethanol oxidation at the bare platinum surface(Pt(111)), at the hydrated platinum surface (H2O@Pt(111)) and at thehydroxylated surface (OH@Pt(111)). The CH step is the first step ofroute C. The CH–OH step is the second step of route C. The OH step isthe first step of route O. The OH–CH step is the second step of route O.The reaction energy DE and the activation energy DEz of each step areprovided in eV. The transition state structures are characterized by thenumber of involved atoms (N). The main distances are given in A: X–H isthe breaking bond; Pt–Y corresponds to the Pt–C (resp. Pt–O) bond forthe CH bond scissions (resp. OH bond scissions). In the case of reactionat the hydrated and hydroxylated surfaces, C or O is not adsorbed in thefinal product. H# # #O corresponds to the hydrogen bonds
DE DEz N X–H Pt–Y Pt–H H# # #O
OHPt(111) 0.67 0.88 4 1.70 2.06 1.63H2O@Pt(111) 0.53 0.84 4 1.58 2.18 1.65 1.62OH–CHPt(111) !0.48 0.08 5 1.45 2.95 1.70H2O@Pt(111) !0.21 0.43 5 1.55 3.10 1.67 1.76OH@Pt(111) !0.17 0.33 5 1.55 3.05 1.66 1.67CHPt(111) !0.14 0.67 3 1.63 2.52 1.64H2O@Pt(111) !0.02 0.90 3 1.61 2.40 1.63 1.79CH–OHPt(111) 0.45 0.81 4 1.56 2.23 1.64H2O@Pt(111) 0.34 0.68 6 1.62 3.13 1.62 1.51
Fig. 6 Transition states structures of the ethanol oxidation at a
H2O@Pt(111) surface.
Fig. 7 Final state structures of ethanol and isopropanol oxidation at
a H2O@Pt(111) surface.
Dow
nloa
ded
on 1
1 Se
ptem
ber 2
012
Publ
ished
on
14 A
ugus
t 201
2 on
http
://pu
bs.rs
c.or
g | d
oi:1
0.10
39/C
2CY
2036
3D
View Online
82 ∑Heterogeneous Catalysis

Catal. Sci. Technol. This journal is c The Royal Society of Chemistry 2012
IsopropanolAdsorption. On the bare surface and the hydrated surface,
the adsorption of iPrOH is similar to that of ethanol, bothgeometrically (Fig. 3) and energetically: Eads = !0.35 eV for thebare surface, Eads = !0.61 eV for the hydrated surface. Theadsorption energy of this secondary alcohol at the hydroxylatedsurface is close to the one of ethanol (!0.89 eV). But the geometrydiffers: the pre-adsorbed OH does not abstract the hydroxylhydrogen of iPrOH and isopropanol adsorbs molecularly,making only a hydrogen bond with OH (see Fig. 4, the O–Hdistances being 1.07 and 1.42 A with iPrO and OH, respec-tively). So, adsorbed on a platinum surface, iPrOH is lessacidic than EtOH.
Reaction paths. The transition states for the differentelementary steps of the isopropanol oxidation are very similarto the ones of ethanol oxidation. They are represented in Fig. S1,
S2 and S3 (ESIw). The reaction energy, the activation energy andthe main geometrical characteristics of the TS of each step arecollected in Table S1 (ESIw). The transition state structures aresimilar to those of ethanol but with longer C–H and Pt–Cdistances due to the steric hindrance, in the case of the firstCH breaking. In the other cases, second CH dissociation orhydrated surface, the bond lengths are not modified because theC(CH3)2 group is farther from the surface. At the bare surface,the final product (acetone) is preferentially adsorbed on-top andthe di-s adsorption mode is 0.6 eV less stable. At the hydratedsurface, acetone is adsorbed through a H-bond with the watermolecule, similarly to acetaldehyde (Fig. 7).The reaction paths for the isopropanol oxidation are shown
in Fig. 9. At the bare surface, route C is the easiest one andconversely, route O is preferred at the hydrated surface. Inboth cases, the two steps are equally energetically demanding.The corresponding transition states energies are lower for the
Fig. 8 Reaction paths of EtOH oxidation into acetaldehyde (CH3CHO): (i) at the bare platinum surface Pt(111), (ii) at the hydrated platinum
surface H2O@Pt(111) and (iii) at the hydroxylated surface OH@Pt(111). Energies are in eV. The reference energy is the isolated EtOH and (i) the
bare platinum surface, (ii) H2O@Pt(111), (iii) OH@Pt(111).
Dow
nloa
ded
on 1
1 Se
ptem
ber 2
012
Publ
ished
on
14 A
ugus
t 201
2 on
http
://pu
bs.rs
c.or
g | d
oi:1
0.10
39/C
2CY
2036
3D
View Online
∑Heterogeneous Catalysis 83

This journal is c The Royal Society of Chemistry 2012 Catal. Sci. Technol.
bare surface than for the hydrated one. Once again, the hydroxy-lated surface is completely different from the bare and hydratedones. As seen in the previous paragraph, isopropanol does notundergo OH dissociation when co-adsorbed with a hydroxyl. Inaddition, even if one tries to enforce a iPrO–H2O configuration, thesystem turns back spontaneously to a iPrOH–OH configuration.This means that route O is not possible for isopropanol at ahydroxylated surface. However, route C is feasible. The activationenergy of the CH scission is only 0.27 eV, the lowest activationenergy found in this complete study. Moreover, the OH bondbreaking occurs simultaneously with the CH scission and acetone,not adsorbed at the surface but making a hydrogen bond withH2O, is obtained directly. In other words, here again the oxidation
of the alcohol at the hydroxylated platinum surface requiresonly one activated step.
Comparison of primary/secondary alcohols. Let us comparenow the isopropanol and ethanol reaction paths. The firstobservation, when Fig. 8 and 9 are compared, is that theglobal oxidation reaction is endothermic for both alcohols, aswell in the gas phase as on the surface, except in the presenceof a hydroxyl group. Nevertheless, the endothermicity isless important in the case of isopropanol. If the Hammondprinciple is valid, this would mean that isopropanol should bemore reactive. However, the reaction is multistep and thekinetics can give different results.
Fig. 9 Reaction paths of the iPrOH oxidation into acetone (CH3)2CHO: (i) at the bare platinum surface Pt(111), (ii) at the hydrated platinum
surface H2O@Pt(111) and (iii) at the hydroxylated surface OH@Pt(111). Energies are in eV. The reference energy is the isolated iPrOH and (i) the
bare platinum surface, (ii) H2O@Pt(111), (iii) OH@Pt(111).
Dow
nloa
ded
on 1
1 Se
ptem
ber 2
012
Publ
ished
on
14 A
ugus
t 201
2 on
http
://pu
bs.rs
c.or
g | d
oi:1
0.10
39/C
2CY
2036
3D
View Online
84 ∑Heterogeneous Catalysis

Catal. Sci. Technol. This journal is c The Royal Society of Chemistry 2012
Ethanol and isopropanol only differ by an extra methyl groupadjacent to the C–O bond. This group increases the bulkiness ofthe C atom that undergoes the C–H dissociation and also thestability of the resulting radical, secondary vs. primary. The twoeffects are opposite. In the case of the first step of route C, wherethe carbon must approach the surface, the strong steric effectprevails over the electronic one and an increase of the barrier by0.14 and 0.28 eV is observed, compared to ethanol, in the case ofthe bare and hydrated surface, respectively. In the case of thesecond CH scission (TSOH–CH), the carbon atom is farther fromthe surface and the electronic effect prevails, leading to a decreaseof the barrier by 0.15 eV, compared to ethanol in the case of thehydrated surface. In the case of the hydroxylated surface, thecarbon atom is also farther from the surface since the finalproduct is directly a non-bonded acetone molecule, and the sameeffect is observed: a decrease of the barrier by 0.06 eV. The OHscission is much less affected by the substitution: the activationenergies DEz(OH) and DEz(CH–OH) are close to the ones forethanol ($0.05 eV).
Depending on the surface under consideration, the conclusionsare different. At the bare surface, route C is preferred for bothalcohols. In the case of isopropanol, the barriers are higher thanin the case of ethanol. Hence, the secondary alcohol is less reactivethan the primary one, in agreement with the experimental resultsobserved in pure dioxane (without water).
In the case of the hydrated surface, route O becomes themost favourable route for isopropanol. In addition, isopropa-nol appears being more reactive than ethanol, since the barrierof the second step is smaller, which agrees with the experi-mental observations (Fig. 1). However, if the bare and thehydrated surfaces are compared, the latter appears being lessreactive towards both alcohols (higher barriers), which is incontradiction with the experimental observations. Therefore,these results do not explain the role of water in enhancing thereactivity of the alcohols on the catalyst.
Now, as mentioned previously, it has been shown experimentallythat the adsorption of water at a Pt surface, precovered withoxygen, leads to the easy formation of OH groups adsorbed at thesurface.68–70 The barrier for the reaction O + H2O - 2OH hasbeen calculated at 0.25 eV.74 At the hydroxylated surface, we havealready noted that the unique activation energy along the reactionpath is the lowest one for both alcohols. Not only this surface ispromoting the alcohol oxidation, but also it seems to be slightlymore reactive towards isopropanol than towards ethanol:DEz(ethanol) = 0.33 eV and DEz(isopropanol) = 0.27 eV. Theseresults are in agreement with the experimental results: the additionof water increases the rate of the reaction and more for 2-octanolthan for 1-octanol.
Our results show that the role of water in enhancing thereactivity of the platinum surface during the oxidation ofalcohols is an indirect one: the hydroxyl groups, formed byreaction of H2O with O atoms at the surface, are indeed thepromoters of the reaction. The role of OH groups has indeedbeen observed experimentally on Au and Pt catalysts.51
4.2. Deactivation by decarbonylation
The experimental results described above for 1-octanol oxida-tion at 373 K (Fig. 1) showed that the oxidation reaction could
be strongly inhibited. However, performing the reaction at333 K in dioxane–water 50/50 vol% solvent made slightlyalkaline (0.03 eq. NaOH) instead of 373 K allowed thereaction to be complete to the acid, without any decelerationof the reaction rate, though, as expected, the reaction rate waslower.19
The aldehyde obtained after oxidation of the primaryalcohol can be further oxidized in solution into a carboxylicacid thanks to the presence of water, through the formation ofthe gemdiol. It can also be decomposed at the platinumsurface, as observed for acetaldehyde.72,73 In that case, thefinal product is CO, showing that there is a decarbonylation.Some theoretical works have already dealt with the decom-position scheme of acetaldehyde on Pt(111).46–48,52 In theseworks, the possible bond breakings (C–H, C–C, C–O) werecalculated. The conclusion was that breaking the C–H bond ofthe aldehydic group is the easiest reaction. Then the C–C bondis broken more easily than the C–O one but the barrier is high.We have revisited the C–H and C–C bond breaking ofacetaldehyde and of the subsequent species with the presentsurface model and method in order to be consistent and able tocompare with the previous energy diagrams.The C–H dissociation of the aldehyde hydrogen is exothermic
by !0.76 eV and needs a small energy barrier of 0.26 eV(Table 2), higher than the one calculated in ref. 43 and 44,but in the same range as the one extracted from kineticsmeasurements (0.21 eV). The corresponding transition state isa four-centers TS, rather early along the path with a C–H bondof 1.33 A (21% elongation) and a Pt–H bond of 1.77 A. Theresulting acetyl intermediate CH3CO is adsorbed by the carbonatom in a top geometry (Pt–O = 2.02 A). The di-s geometrywhere both the carbon and the oxygen are bound to the surface(with a long Pt–O bond of 2.42 A) is only slightly less stablethan the first one. This step presents the lowest barrier we havefound in the transformation of ethanol (see Fig. 8). It is evenlower than the desorption energy of acetaldehyde. Hence, thisintermediate can be easily obtained. In addition, the reversebarrier is rather high (1.02 eV) preventing the system fromgoing back to acetaldehyde.The following step can be either a C–C or a C–H bond
breaking. The C–C bond breaking is slightly exothermic(!0.16 eV) and the energy barrier is high (1.44 eV), inagreement with the values found previously.48,49 In the TS,the C–C bond is elongated to 1.99 A and the Pt–C bond isalmost formed (2.27 A, 9% elongation). This TS can beconsidered as late in relation with the high barrier. A secondaryagostic interaction takes place between a H of the methylgroup and a Pt atom (Pt–H = 1.94 A), which elongates the
Table 2 Energetics and main geometrical characteristics of thetransition state structures for the decomposition steps of acetaldehydeat the bare platinum surface Pt(111). The reaction energy DE and theactivation energy DEz of each step are provided in eV. The maindistances are given in A
Reaction DE DEz C–H C–C Pt–H Pt–C(CO)
CH3CHO - CH3CO + H !0.76 0.26 1.33 1.77CH3CO - CH2CO + H 0.08 1.06 1.52 1.62CH3CO - CH3 + CO !0.16 1.44 1.99 1.94CH2CO - CHCO + H 0.10 0.87 1.53 1.63
Dow
nloa
ded
on 1
1 Se
ptem
ber 2
012
Publ
ished
on
14 A
ugus
t 201
2 on
http
://pu
bs.rs
c.or
g | d
oi:1
0.10
39/C
2CY
2036
3D
View Online
∑Heterogeneous Catalysis 85

This journal is c The Royal Society of Chemistry 2012 Catal. Sci. Technol.
C–H bond to 1.15 A. This agostic interaction is broken inthe final state. Except the latter interaction that was notmentioned, the present TS looks very similar to the onepreviously reported. The products are a methyl group and aCQO group chemisorbed at top vicinal positions (Pt–C =2.08 A and 1.86 A, respectively and C–O = 1.16 A). The C–Hbond breaking leads to a ketene molecule, adsorbed in a di-sCC geometry (Pt–C = 2.08 and 2.03 A, C–C= 1.50 A, CO=1.20 A). The reaction is slightly endothermic by 0.08 eV andthe barrier is also relatively high at 1.06 eV (compared to0.96 eV49). The TS is a relatively late three-centres TS withC–H and Pt–H distances of 1.52 and 1.62 A, respectively. Thebarriers of the C–C and C–H bond breakings are both high,the C–H bond rupture being the smallest. Hence at lowtemperature (333 K), CH3CO is likely the acetaldehydedecomposition species. In the presence of OH groups, it canbe hydroxylated to acetic acid. The barrier for this step is low(0.31 eV46).
At higher temperature (373 K), a barrier of 1 eV is likely tobe overcome. Hence for such temperatures, the C–H bondrupture could take place and ketene be obtained. Alcala et al.have shown that the barrier to break the C–C bond in ketene ishigher than in the case of acetyl CH3CO (1.38 eV) but that thecorresponding barrier in the ketenyl CHCO is much smaller(0.96 eV). However, the transformation of ketene into ketenylhad not been studied. Hence, we have considered the C–Hbreaking in ketene leading to ketenyl. The reaction is slightlyendothermic (0.10 eV) and the barrier is 0.87 eV far lower thanthe one for the C–C bond breaking calculated previously. TheTS is an usual three-centers TS with C–H and Pt–H distancesof 1.53 and 1.63 A, respectively. Hence, in ketene, as in acetyl,it is preferable to break first the C–H bond to obtain CHCO;then the C–C bond breaks more easily. The transition statesstructures can be found in Fig. 10.
The acetaldehyde decomposition on Pt(111) has beenfollowed by temperature-programmed desorption (TPD)experiments associated with high-resolution electron-energyloss spectroscopy (HREELS).72,73 The HREEL experimentalspectrum collected following adsorption at 120 K correspondsto a monolayer of adsorbed acetaldehyde (see Fig. 11). Duringthe heating, the nCO peak of CH3CHO at 1663 cm!1 almostdisappears as well as the bands between 1360 and 1427 cm!1.Meanwhile, a high peak grows at 620 cm!1. At 350 K, thecharacteristic peak of on-top bonded CO dominates (2089 cm!1)
accompanied by the corresponding peak at 474 cm!1. A smallpeak assigned to bridge bonded CO exists also at 1819 cm!1.This evidences that decarbonylation takes place from thistemperature. In the region of the nCH vibrations, the peakat 3008 cm!1, present at low temperature, disappears when thetemperature increases and a new peak appears at 2981 cm!1
at 350 K.Fig. 10 Transition states structures of the acetaldehyde decomposition
at a bare Pt(111) surface.
Fig. 11 Experimental HREELS spectra of adsorbed acetaldehyde on
Pt(111) after heating at various temperatures (reprinted with permission
from ref. 72). Simulated spectra of CH3CHO, CH3CO, CH2CO,
CHCO, CH2. All calculated spectra have the same scale.
Dow
nloa
ded
on 1
1 Se
ptem
ber 2
012
Publ
ished
on
14 A
ugus
t 201
2 on
http
://pu
bs.rs
c.or
g | d
oi:1
0.10
39/C
2CY
2036
3D
View Online
86 ∑Heterogeneous Catalysis

Catal. Sci. Technol. This journal is c The Royal Society of Chemistry 2012
To characterize adsorbed surface species during thedesorption experiment, we have simulated the vibrationalspectra of CH3CHO, CH3CO, CH2CO, CHCO, and CH2
and compared them to the experimental ones. CH3 has notbeen considered since its formation is unlikely owing to thehigh barrier (Table 2). The simulated spectrum for CH3CHOhas been already published75 but is redone here for the sake ofconsistency. This calculated spectrum exhibits two main peaksat 1663 and 520 cm!1, corresponding to nCO and nPtO,respectively, and found experimentally at 1663–1745 and523–541 cm!1. There are also features at 893, 1107 and1323–1358 cm!1. All these peaks are found in the experimentalspectrum (898, 1122, 1362–1427 cm!1). Finally high nCHpeaks are obtained between 2817 and 3091 cm!1. Theycorrespond to the large band observed in the experimentalspectrum taken after heating at 120 K. The simulatedspectrum of CH3CO shows significant differences both inintensity and in position of the peaks. The peaks centredaround 1300 cm!1 no longer exist and the spectrum isdominated by the nPtC mode at 569 cm!1, corresponding tothe experimental peak at 620 cm!1 observed above 150 K. Theother peaks are also slightly shifted. The nCH peaks are alsoless intense. Hence, between 150 and 300 K, the appearance inthe experimental spectra of a peak at 620 cm!1 and thedisappearance of the peaks at 1361–1427 cm!1 indicates that,in this temperature range, the main species is CH3CO.
At 350 K, CO is obviously already present and a smallquantity of CH3CO remains. However the high intensity nCHpeak at 2981 cm!1 shows the existence of hydrocarbons. Infact, we have shown before that CH3CO decomposes likelyinto CH2CO and CHCO before the C–C bond is broken. Thecalculated spectra of ketene CH2CO and ketenyl CHCO aredominated by an intense peak at 1756 and 1753 cm!1,respectively. Such peaks do not exist in the experimentalspectrum at 350 K. Hence ketene and ketenyl are transientintermediates and therefore species like adsorbed CH2 or CHare likely present. These species give intense nCH vibrations asillustrated for the carbene, which could explain the high peakat 2981 cm!1 appearing with CO at 350 K. Ketene can also beat the origin of acetic acid production by hydration.
This analysis of the TPD experiment allows us to confirm thatthe first step of acetaldehyde decomposition is the C–H breakingof the aldehydic group. It occurs at temperature as low as 150 Kin agreement with the low calculated barrier. The subsequentC–H and C–C breakings are more energy demanding and occurat higher temperature so that CH3CO remains the main speciesover a large range of temperatures. At high temperature, the finalresult of acetaldehyde decomposition is decarbonylation.
To summarize, the above study of acetaldehyde decomposi-tion allows us to shed light on some experimental details. Inthe case of primary alcohols, at the temperature of the reaction(373 K), the product resulting from the removal of thealdehydic hydrogen (corresponding to acetyl) can easily behydroxylated to carboxylic acid or decomposed further intoCO and carbonaceous residues, poisoning the surface, whichcould explain the limitation of the conversion. At lowertemperature, the decomposition is less easy and the reactioncan go to completion with production of large amounts of acidas observed experimentally.
The C–C bond breakings are more difficult than the C–Hones and become feasible after the removal of almost allhydrogens. In acetone, the absence of H on the CQO groupprevents decomposition from taking place. This could bethe reason why the catalyst is not poisoned in the case ofsecondary alcohols.
5. Conclusion
The combination of experimental results on the oxidationreaction of alcohols on Pt catalysts and of DFT calculationshas allowed the understanding of the different behaviour ofprimary and secondary alcohols. In particular, it has beenshown that the higher activity of secondary alcohols comparedwith the primary alcohols in the presence of water is due to abalance between steric and electronic effects of the substituents.The present study has also shed light on the role of water inthese reactions. The main new conclusion is that the rateenhancement in the presence of water is not due to water itselfbut to hydroxyl groups formed by reaction of water withdissociated oxygen at the surface of the catalyst. The mostenergetically favorable pathway is then facilitated by thepresence of adsorbed OH, which reduces the overall barrier.Decarbonylation of acetaldehyde at 373 K is likely to be thecause of deactivation of the catalyst.
Acknowledgements
The calculations have been performed using the local HPCresources of PSMN at ENS-Lyon and of GENCI (CINES/IDRIS), project x2010075105.
Notes and references
1 J. I. Kroschwitz, inKirk-Othmer Encyclopedia of Chemical Technology,Wiley-Intersciences, New York, 4th edn, 1992, vol. 4.
2 R. A. Sheldon, I. W. C. E. Arends, G. T. Brink and A. Dijksman,Acc. Chem. Res., 2002, 35, 774.
3 J. Muzart, Tetrahedron, 2003, 59, 5789.4 J. March, in Advanced Organic Chemistry: Reactions, Wiley,New York, 1992.
5 D. B. Dess and J. C. Martin, J. Org. Chem., 1983, 48, 4155.6 A. J. Mancuso, S. L. Huang and D. Swern, J. Org. Chem., 1978,43, 2480.
7 O. Dolmer and H. Heyns, US Pat. 2 190 377, 1940.8 M. Besson and P. Gallezot, Catal. Today, 2000, 57, 127.9 T. Mallat and A. Baiker, Chem. Rev., 2000, 104, 3037.10 C. Della Pina, E. Falletta, L. Prati and M. Rossi, Chem. Soc. Rev.,
2008, 37, 2077.11 C. P. Vinod, K. Wilson and A. F. Lee, J. Chem. Technol.
Biotechnol., 2011, 86, 161.12 H. van Bekkum, in Carbohydrate as Organic Raw Materials, ed.
F. W. Lichtenthaler, Wiley VCH, Weinheim, 1990, p. 289.13 G. Jenzer, M. S. Schneider, R. Wandeler, T. Mallat and A. Baiker,
J. Catal., 2001, 199, 141.14 A. M. Steele, J. Zhu and S. C. Tsang, Catal. Lett., 2001, 73, 9.15 G. Jenzer, D. Sueur, T. Mallat and A. Baiker, Chem. Commun.,
2000, 2247.16 Z. S. Hou, N. Theyssen and W. Leitner, Green Chem., 2007, 9, 127.17 Y. Uozumi and R. Nakao, Angew. Chem., Int. Ed., 2003, 42, 194.18 Y. M. A. Yamada, T. Arakawa, H. Hocke and Y. Uozumi, Angew.
Chem., Int. Ed., 2007, 46, 704.19 A. Frassoldati, C. Pinel and M. Besson, Catal. Today, 2011,
173, 81.20 A. Frassoldati, C. Pinel and M. Besson, Catal. Today, 2012, DOI:
10.1016/j.cattod.2012.01.012.
Dow
nloa
ded
on 1
1 Se
ptem
ber 2
012
Publ
ished
on
14 A
ugus
t 201
2 on
http
://pu
bs.rs
c.or
g | d
oi:1
0.10
39/C
2CY
2036
3D
View Online
∑Heterogeneous Catalysis 87

This journal is c The Royal Society of Chemistry 2012 Catal. Sci. Technol.
21 Z. Ma, H. Yang, Y. Qin, Y. Hao and G. Li, J. Mol. Catal. A:Chem., 2010, 331, 78.
22 X. Yang, X. Wang, C. Liang, W. Su, C. Wang, Z. Feng, C. Li andJ. Qiu, Catal. Commun., 2008, 9, 2278.
23 X. Yang, X. Wang and J. Qiu, Appl. Catal., A, 2010, 382, 131.24 A. Villa, D. Wang, N. Dimitros, D. Su, V. Trevisan and L. Prati,
Catal. Today, 2010, 150, 8.25 A. Villa, M. Plebani, M. Schiavoni, C. Milone, E. Piperopoulos,
S. Galvagno and L. Prati, Catal. Today, 2012, 186, 76.26 C. Keresszegi, D. Ferri, T. Mallat and A. Baiker, J. Catal., 2005,
234, 64.27 A. F. Lee, Z. Chang, P. Ellis, S. F. J. Hackett and K. Wilson,
J. Phys. Chem. C, 2007, 111, 18844.28 C. Keresszegi, T. Burgi, T. Mallat and A. Baiker, J. Catal., 2002,
211, 244.29 D. M. Meier, A. Urakawa and A. Baiker, J. Phys. Chem. C, 2009,
113, 21849.30 H. G. J. de Wilt and H. S. van der Baan, Ind. Eng. Chem. Prod.
Res. Dev., 1972, 11, 374.31 C. Keresszegi, T. Mallat and A. Baiker, New J. Chem., 2001, 25, 1163.32 R. Di Cosimo and G. M.Whitesides, J. Phys. Chem., 1989, 93, 768.33 C. Keresszegi, J. D. Grunwaldt, T. Mallat and A. Baiker, Chem.
Commun., 2003, 2304.34 J. D. Grunwaldt, C. Keresszegi, T. Mallat and A. Baiker, J. Catal.,
2003, 213, 291.35 A. P. Markusse, B. F. M. Kuster and J. C. Schouten, Catal. Today,
2001, 66, 191.36 X. Yang, X. Wang, C. Liang, W. Su, C. Wang, Z. Feng, C. Li and
J. Qiu, Catal. Commun., 2008, 9, 2278.37 X. Yang, X. Wang and J. Qiu, Appl. Catal., A, 2010, 382, 131.38 A. Villa, M. Plebani, M. Schiavoni, C. Milone, E. Piperopoulos,
S. Galvagno and L. Prati, Catal. Today, 2012, 186, 76.39 S. K. Desai, M. Neurock and K. Kourtakis, J. Phys. Chem. B,
2002, 106, 2559.40 J. Greeley and M. Mavrikakis, J. Am. Chem. Soc., 2002, 124, 7193.41 J. Greeley and M. Mavrikakis, J. Am. Chem. Soc., 2004, 126, 3910.42 C. Hartnig and E. Spohr, Chem. Phys., 2005, 319, 185.43 D. Cao, G.-Q. Lu, A. Wieckowski, S. A. Wasileski and
M. Neurock, J. Phys. Chem. B, 2005, 109, 11622.44 S. Kandoi, J. Greeley, M. A. Sanchez-Castillo, S. T. Evans, A. A.
Gokhale, J. A. Dumesic and M. Mavrikakis, Top. Catal., 2006, 37, 17.45 C.-Y. Niu, J. Jiao, B. Xing, G.-C. Wang and X.-H. Bu, J. Comput.
Chem., 2010, 31, 2023.46 H.-F. Wang and Z.-P. Liu, J. Am. Chem. Soc., 2008, 130, 10996.47 K. I. Gursahani, R. Alcala, R. D. Cortright and J. A. Dumesic,
Appl. Catal., A, 2001, 222, 369.48 R. Alcala, M. Mavrikakis and J. A. Dumesic, J. Catal., 2003,
218, 178.
49 J.-H. Wang, C. S. Lee and M. C. Lin, J. Phys. Chem. C, 2009,113, 6681.
50 D. Basaran, A. Genest and N. Rosch, J. Catal., 2012, 287, 210.51 B. N. Zope, D. D. Hibbitts, M. Neurock and R. J. Davis, Science,
2010, 330, 74.52 R. Kavanagh, X. Cao, W.-F. Lin, C. Hardacre and P. Hu, J. Phys.
Chem. C, 2012, 116, 7185.53 C. Shang and Z.-P. Liu, J. Am. Chem. Soc., 2011, 133, 9938.54 C. Michel, F. Auneau, F. Delbecq and P. Sautet, ACS Catal., 2011,
1, 1430.55 X. Q. Qi, Z. D. Wei, L. L. Li, L. Li, M. B. Ji, Y. Zhang, M. R. Xia
and X. L. Ma, J. Mol. Struct., 2010, 980, 208.56 P. Korovchenko, C. Donze, P. Gallezot and M. Besson, Catal.
Today, 2007, 121, 13.57 G. Kresse and J. Hafner, Phys. Rev. B: Condens. Matter Mater.
Phys., 1993, 47, 558.58 J. P. Perdew and Y. Wang, Phys. Rev. B: Condens. Matter Mater.
Phys., 1992, 45, 13244.59 P. E. Blochl, Phys. Rev. B: Condens. Matter Mater. Phys., 1994,
50, 17953.60 G. Kresse and D. Joubert, Phys. Rev. B: Condens. Matter Mater.
Phys., 1999, 59, 1758.61 H. J. Monkhorst and J. D. Pack, Phys. Rev. B: Solid State, 1976,
13, 5188.62 G. Henkelman, B. P. Uberuaga and H. Jonsson, J. Chem. Phys.,
2000, 113, 9901.63 D. Sheppard, R. Terrell and G. Henkelman, J. Chem. Phys., 2008,
128, 134106.64 P. Dayal and P. Fleurat-Lessard, A chemist view on reaction path
determination, to be published. Available at http://perso.ens-lyon.fr/paul.fleurat-lessard/ReactionPath.html.
65 G. Henkelman and H. Jonsson, J. Chem. Phys., 1999, 111, 7010.66 J. Kastner and P. Sherwood, J. Chem. Phys., 2008, 128, 014106.67 D. Loffreda, Y. Jugnet, F. Delbecq, J. C. Bertolini and P. Sautet,
J. Phys. Chem. B, 2004, 108, 9085.68 S. Volkening, K. Bedurfig, K. Jacobi, J. Wintterlin and G. Ertl,
Phys. Rev. Lett., 1999, 83, 2672.69 C. Clay, S. Haq and A. Hodgson, Phys. Rev. Lett., 2004,
92, 046102.70 W. Lew, M. C. Crowe, E. Karp and C. T. Campbell, J. Phys.
Chem. C, 2011, 115, 9164.71 C. Panja, N. Saliba and B. E. Koel, Surf. Sci., 1998, 395, 248.72 H. Zhao, J. Kim and B. E. Koel, Surf. Sci., 2003, 538, 147.73 A. F. Lee, D. E. Gawthrope, N. J. Hart and K. Wilson, Surf. Sci.,
2004, 548, 200.74 R. Ferreira de Morais, PhD thesis, ENS Lyon, Ecole Doctorale de
Chime de Lyon ED206, France, 2011.75 F. Delbecq and F. Vigne, J. Phys. Chem. B, 2005, 109, 10797.
Dow
nloa
ded
on 1
1 Se
ptem
ber 2
012
Publ
ished
on
14 A
ugus
t 201
2 on
http
://pu
bs.rs
c.or
g | d
oi:1
0.10
39/C
2CY
2036
3D
View Online
88 ∑Heterogeneous Catalysis

ChemCommChemical Communicationswww.rsc.org/chemcomm
ISSN 1359-7345
COMMUNICATIONCarine Michel, Agnieszka M. Ruppert et al.Role of water in metal catalyst performance for ketone hydrogenation: a joint experimental and theoretical study on levulinic acid conversion into gamma-valerolactone
Volume 50 Number 83 25 October 2014 Pages 12403–12580
∑Heterogeneous Catalysis 89

12450 | Chem. Commun., 2014, 50, 12450--12453 This journal is©The Royal Society of Chemistry 2014
Cite this:Chem. Commun., 2014,50, 12450
Role of water in metal catalyst performance forketone hydrogenation: a joint experimental andtheoretical study on levulinic acid conversion intogamma-valerolactone†
Carine Michel,*a Jeremie Zaffran,a Agnieszka M. Ruppert,*b
Joanna Matras-Michalska,b Marcin Jedrzejczyk,b Jacek Gramsb and Philippe Sauteta
While Ru is a poor hydrogenation catalyst compared to Pt or Pd in
the gas phase, it is efficient under aqueous phase conditions in the
hydrogenation of ketones such as the conversion of levulinic acid
into gamma-valerolactone. Combining DFT calculations and experi-
ments, we demonstrate that water is responsible for the enhanced
reactivity of Ru under those conditions.
The swap from hydrocarbon based to biomass based feedstocktriggers the development of novel catalysts and processes totransform oxygenates into valuable molecules.1 Most of the time,those reactions with reactants extracted from biomass are con-ducted in water to efficiently solubilise reaction intermediatesand products. We will show here that water can also play anessential role in the catalytic activity, focusing on the conversionof levulinic acid (LA) into g-valerolactone (GVL)2 (see Fig. 1). LAcan be obtained via cellulose hydrolysis and dehydration of suchobtained glucose. GVL is an attractive platform molecule thatcan be derived from biomass and can be converted to a variety ofchemicals, including biofuel additives.3–5
Galletti et al.6 have established that with supported metalcatalysts LA hydrogenation to GVL follows the scheme pre-sented in Fig. 1: (i) the metal catalyses the first step, i.e. thehydrogenation of the ketone moiety into 4-hydroxy pentanoicacid and (ii) the cyclising esterification easily leads to the GVL.
Another route is opened at higher temperatures (4200 1C),starting with the cyclising dehydration of the enolic form ofLA.7–9 The CQC bond of the intermediary angelica lactone isthen hydrogenated, leading to GVL. This alternative route is notaccessible under our mild conditions.
Under these conditions, it is striking that Ru is usually moreactive in the conversion of LA to GVL than Pd and Pt in water,9–12
while Ru is known to be poorly active compared to Pd and Pt in thehydrogenation of ketones under gas phase conditions.13 Actually,the hydrogenation capability of Ru is strongly modulated by thereaction environment. Rooney et al. have shown that the hydro-genation of 2-butanone catalyzed by Ru/SiO2 is 30 times faster inwater than in heptane.14 Thus, Ru is much more active in aqueousmedia, even more active than Pt or Pd, so it is frequently used foraqueous phase hydrogenation of various ketones.15
This strong dependence of Ru activity upon solvent can also betransferred to our target reaction, the hydrogenation of LA towardsGVL. We analysed three noble metal catalysts (Ru, Pt, Pd) sup-ported on titania in two different environments (water and tetra-hydrofuran (THF)) under mild conditions (70 1C, 50 bar ofhydrogen, details in ESI†). The catalysts were prepared in a waythat the particle size effect could be minimized since all metalparticles possess a similar size (2.1–3.2 nm). With the samesupport and particle size, the experiments here provide a consis-tent case of comparison of two solvents under similar conditions,hence avoiding other effects on the hydrogenation activity. TEMimages (ESI†) generally demonstrated a homogeneous distributionof the active phase on the support. The results of the catalytic
Fig. 1 Conversion of levulinic acid into gamma-valerolactone.
a Laboratoire de Chimie UMR5182, University of Lyon, CNRS, Ecole NormaleSuperieure de Lyon, 46 allee d’Italie, F-69364 Lyon Cedex 07, Lyon, France.E-mail: [email protected]; Fax: +33472728080; Tel: +33472728847
b Institute of General and Ecological Chemistry, Faculty of Chemistry,Łodz University of Technology, ul. Zeromskiego 116, 90-924 Łodz, Poland.E-mail: [email protected]; Fax: +48426313128; Tel: +48426313106
† Electronic supplementary information (ESI) available: Experimental section;TEM images; computational details; energetic span definition; energetic spans ofeach path and each metal, without and with water; energetic spans of each pathwith an implicit solvent for Ru(0001); transition state structure for the hydro-genation of the alkoxy on Ru(0001) in the presence of 3 water molecules and inthe presence of 11 water molecules; an alternative route to the alkoxy path in thepresence of water on Ru(0001); correlation of the energetic span variation for thealkoxy path with the d-band center; all calculated structures together with theirabsolute energies. See DOI: 10.1039/c4cc04401k
Received 9th June 2014,Accepted 18th June 2014
DOI: 10.1039/c4cc04401k
www.rsc.org/chemcomm
ChemComm
COMMUNICATION
90 ∑Heterogeneous Catalysis

This journal is©The Royal Society of Chemistry 2014 Chem. Commun., 2014, 50, 12450--12453 | 12451
activity are presented in Fig. 2. The Ru catalyst activity is stronglydependent on the reaction media. While it is not active in THF, Ruis the most active in water (99% LA conversion, 95% GVL yield). Ptand Pd activities are not sensitive to the solvent: around 15–20% ofGVL yield together with a 20–30% conversion of LA is obtainedusing Pt and negligible activity is observed using Pd. Note that Pdwas active for this reaction but at higher temperatures (190 1C) andwith conservation of the same order of reactivity: Ru 4 Pt 4 Pd.Finally, the trends of the metal and solvent are similar for the LAconversion into GVL and the ketone hydrogenation, indicatingthat the first step (i.e. the ketone hydrogenation, see Fig. 1) is therate determining step of this reaction.
To our knowledge, this striking dependence of the relativeactivity of Ru, Pt and Pd for ketone hydrogenation on thereaction medium is not yet well understood. In this paper, weaim to explain the apparently unique behaviour of Ru in thepresence of water using DFT calculations. Several strategies arepossible to model solvent effects. Implicit models take intoaccount the dielectric constant and its capability to stabilizecharges.16 Explicit models include solvent molecules increasing
the number of atoms and accessible configurations.17 Theincrease of activity of Ru in the aqueous phase compared withthe organic solvent lies probably in the hydrogen bond effect ofliquid water. An implicit model cannot grasp this kind of effecteasily. However, an explicit model of liquid water is highlyexpensive. We propose here the use of a micro-solvationapproach, including only the most important solvent molecule,following our previous studies on the influence of water onalcohols dehydrogenation.18–20 The ketone was modelled byacetone, since both molecules show very similar trends uponmetal and solvent changes, implying that the acid group doesnot affect the hydrogenation of the ketone function.
We start by the elementary steps for acetone hydrogenation onthe Ru(0001) surface. We modelled gas phase hydrogenation witha periodic slab approach (see ESI†). The two possible reactionpaths are presented in Fig. 3, both starting in the centre of thefigure and evolving towards the left, the reference being theRu(0001) and acetone and hydrogen in the gas phase. In the alkylpath, the chemisorbed acetone (IS*) is hydrogenated on the oxygenfirst through the transition state TSOH. It leads to an alkyl radicalIntC. In the second step, the carbon is hydrogenated (TSOH–CH)resulting in the weakly chemisorbed isopropanol (FS*, Eads =!0.44 eV). This route is disfavoured by high lying transition states(TS) of energy!0.41 eV and !0.28 eV relative to the reference. Thesecond TS is the highest, 1.37 eV higher than chemisorbedacetone. In the alkoxy path, the carbon is hydrogenated first(TSCH), leading to a very stable alkoxy intermediate (IntO, 0.25 eVmore stable than the chemisorbed acetone and one chemisorbed Hatom). Then, the second step for the O hydrogenation (TSCH–OH)has to overcome a high activation energy barrier (1.40 eV) despite atransition state lying lower than in the alkyl route. Those results arein agreement with the acetone hydrogenation paths on Ru(0001)obtained by Sinha and Neurock.23
To compare kinetic rates for the two pathways, we can followthe energetic span analysis introduced by Kozuch and Shaik,
Fig. 2 LA conversion and GVL yield in % for Ru, Pd, Pt catalysts in THF andin water solvent. No conversion was observed for Ru and Pd in THF solvent.
Fig. 3 Reaction paths (in eV) for the hydrogenation of acetone on Ru(0001) in the absence (left) and in the presence of a water molecule (right). The alkylpath is represented in dash line and the alkoxy path in solid line. The reference energy is common and includes the acetone and a H2 molecule in the gasphase, three bare Ru(0001) slabs and a ‘hydrated’ slab bearing a chemisorbed water molecule.
Communication ChemComm
∑Heterogeneous Catalysis 91

12452 | Chem. Commun., 2014, 50, 12450--12453 This journal is©The Royal Society of Chemistry 2014
by establishing the TOF-determining intermediate (TD-I) and theTOF-determining TS (TD-TS).24 The energetic span (or effectivebarrier) is calculated as the energy difference between theTD-TS and the TD-I of a catalytic cycle.
The smaller the energetic span, the higher the rate and themore efficient is the corresponding catalyst. More details on theprocedure are given in the Computational details section of theESI.† This approach shows that the two paths are equallydisfavoured with an energetic span of 1.37 eV for the alkylroute and 1.40 eV for the alkoxy one.
To grasp the major effect of the water solvent, we used thesimplest possible approach and added a chemisorbed watermolecule to our model. The chemisorption of acetone isstrongly modified. In the absence of water, acetone exhibitstwo iso-energetic chemisorbed structures (Eads = !0.47 eV; theCQO bond parallel to the surface or perpendicular to thesurface). In the presence of water, the most stable situationfor acetone corresponds to the configuration parallel to thesurface forming a H-bond with the chemisorbed water mole-cule (see Fig. 4, left). This configuration is 0.18 eV more stablethan the separated adsorption of water and acetone. Theco-adsorption of the resulting isopropanol and water is in linewith previous studies on Pt(111)18 and Rh(111):19,20 the alcoholis H-bonded to the chemisorbed water and shows no directinteraction with the surface. Here again, the two possiblehydrogenation paths starting from this configuration are pre-sented in Fig. 3 starting from the centre and going towards theright, the reference being the Ru(0001) slab with water alreadychemisorbed and acetone and hydrogen in the gas phase. Thechemisorbed acetone (IS*) is stabilised by B0.2 eV. The TSOH ofthe alkyl path is also stabilized by B0.2 eV. However, thesecond transition state TSOH–CH is not affected and stillremains high in energy (!0.27 eV relative to the reference).Thus, the overall effective barrier is increased by 0.2 eV. Thesituation is more favourable on the alkoxy path. The twotransition states remain lower in energy in the presence ofwater. In addition, the formation of the alkoxy intermediate isless exothermic, although it remains the TD-I for that path.Altogether, the effective barrier markedly decreases by 0.41 eV(from 1.40 to 0.99 eV). To conclude, the presence of co-adsorbedwater slightly inhibits the alkyl path and strongly favours thealkoxy path. The effective activation barrier is diminished by35%, leading to a strong increase of the predicted activity of Ru(0001).
The addition of a single chemisorbed water molecule hence allowsus to capture the origin of the enhanced activity of Ru underaqueous conditions observed for the hydrogenation of ketones14 orfor the conversion of LA into GVL as already exposed. To go beyondthis initial model, we have refined the most favourable alkoxyroute. Adding the surrounding aqueous environment as a con-tinuum model21 does not change the energetic span significantly(see Tables S2 and S3, ESI†). Then, we increased the number ofwater molecules to 11 to include the first solvation sphere assuggested by Hu and co-workers.22 Here again, the energetic spanis not strongly affected (Fig. S3, ESI†). A single water molecule isenough to grasp the Ru catalyst activation. An alternative routecould involve the dissociation of a water molecule (Fig. S4, ESI†).For instance, the hydrogen-bonded water could dissociate andtransfer the proton involved in the hydrogen bond to the alkoxy(second elementary step of the alkoxy route) leading to theisopropanol and a surface hydroxyl. However, surface hydroxylgroups cannot accumulate at the catalyst surface and have to beeliminated. Their hydrogenation is as energy demanding as thehydrogenation of the alkoxy intermediate.
To better understand the periodic trends for the influence ofwater, the same paths were computed for a larger series of latetransition metals (Ru, Co, Rh, Ir, Ni, Pd, Pt, Cu) on the corre-sponding close-packed surfaces (111) for fcc metals and (0001)for hcp ones. For most of the metals under consideration, thetwo routes are almost equally probable in the absence of water,with a small preference for the alkyl path (except for Rh and Ir).The energetic span of the most favourable path is provided in theabsence and presence of water and for each metal under con-sideration in Fig. 5 (more details in ESI,† Table S2). At the baremetallic surface, the most active catalysts are Ir, Pt and then Cuand Rh according to their respective energetic span while Ni, Pd,Ru and Co are much less active catalysts. This is in goodagreement with experimental observations for gas phase acetonehydrogenation.13 For the common subset of metals, the experi-ment gives the activity order Pt 4 Rh 4 Pd B Ru 4 Ni B Cowhile calculations show Pt 4 Rh 4 Ni 4 Pd B Ru 4 Co so thatonly Ni is slightly misplaced. Last, one can notice that the activityfor the alkyl paths is mainly controlled by the acetone adsorption(IS*) as the TOF-determining state and the TS for the second
Fig. 4 Co-adsorption structures of acetone and water (left) and isopro-panol and water (right) on Ru(0001).
Fig. 5 Energetic span (in eV) for the acetone hydrogenation at the baremetallic surface (in black) and in the presence of one chemisorbed water(in grey) for a series of transition metals.
ChemComm Communication
92 ∑Heterogeneous Catalysis

This journal is©The Royal Society of Chemistry 2014 Chem. Commun., 2014, 50, 12450--12453 | 12453
hydrogenation on the carbon (TSOH–CH) as the TOF-determining-TS while the alkoxy paths are controlled by the oxygen hydrogena-tion TS (TSCH–OH) and the chemisorbed acetone (IS*) or the alkoxystate (IntO) for more oxophilic metals such as Co, Ni, and Ru.
The presence of one water molecule strongly modifies theenergetic span values and the alkoxy route is clearly preferred overthe alkyl one for all metals (see ESI,† Table S3). This inversionresults from an activation of the alkoxy route with a concomitantdeactivation of the alkyl route. The influence of water on theenergetic span of the most favourable route is summarized inFig. 5. We have already seen that the capability of Ru to hydrogenateacetone is strongly enhanced by the presence of a single chemi-sorbed water. On the other hand, the less-oxophilic metals (Pd andPt) are barely affected. The promotion of the alkoxy route is notstrong enough to facilitate the acetone hydrogenation: Pt is as activeas in the absence of water; Pd is still inactive. This is in line with ourexperimental findings: Pt is active to some extent in both THF andwater while Pd is not in both environments under our mildconditions. Calculations clearly show the promotion of Ru vs. Ptin the aqueous phase. However, from the intrinsic error bar of DFT-GGA (0.15 eV) it is not possible to determine in absolute value whichmetal is the most active one under aqueous conditions, since thecalculated barriers only differ by 0.1 eV. Other aspects, as thecoverage of hydrogen, could also slightly alter the relative energiesof the hydrogenation transition states. This goes beyond the scopeof this communication.
Our wider screening of transition metals shows in addition thatthe promotion effect seen for Ru can be generalized to the otheroxophilic metals such as Co and Ni. The higher the energy of thed-band centre is, the more oxophilic the metal is. The variation ofthe energetic span of the alkoxy path upon water assistance nicelycorrelates with the d-band centre of the metal under consideration(Fig. S5, ESI†). Surface species on those metals are more stronglyaffected by the co-adsorption of a water molecule. The TD-TS(TSCH–OH) is stabilized while the TD-I (mainly IntO) is oftendestabilized. Therefore, the energetic span is strongly reduced(up to B0.4 eV) and those metals become good candidate catalystsfor acetone hydrogenation in an aqueous environment. This resultclears up the difference in the catalytic reactivity order of metal foracetone hydrogenation in the gas phase13 and in the aqueousphase.15 As discussed above, in the gas phase, Ru, Co, Ni and Pdare poorly active.13 Things change completely in aqueous phaseexperiments and Ru, Co, Ni become excellent catalysts while Pdremains poor.15 The calculated assistance of water for oxophilicmetals hence shed light on experimental observations.
Ru is widely used to hydrogenate biomass sourced oxygenatessuch as levulinic acid while this metal is known to be a poorhydrogenation catalyst of acetone in the gas phase. Combiningexperiments in THF and water together with DFT calculations, we
showed that this metal activity is highly sensitive to its environment.The presence of a H-bonded water molecule dramatically reducesthe energetic span of the reaction pathway, hence enhancing thecatalytic activity. We predict that this activation can be generalizedto other oxophilic metals such as Co or Ni while Pt and Pd areinsensitive to their aqueous environment.
The authors gratefully acknowledge that this work was donewithin the framework of Polonium project 2012/2013. A.M.R.acknowledges that part of this work was done within the NCNgrant NN 209 75 83 40. J.Z., C.M. and P.S. acknowledge that partof this work was done within the ANR GALAC project (ANR-10-CD2I-011). We thank also PSMN at ENS Lyon, IDRIS-CNRS, andCINES for computational resources. The authors would like tothank Prof. Bert Weckhuysen and his group for help in the GCanalysis of the products.
Notes and references1 D. M. Alonso, J. Q. Bond and J. A. Dumesic, Green Chem., 2010,
12, 1493.2 W. R. H. Wright and R. Palkovits, ChemSusChem, 2012, 5, 1657.3 I. T. Horvath, H. Mehdi, V. Fbos, L. Boda and L. T. Mika, Green
Chem., 2008, 10, 238.4 D. M. Alonso, S. G. Wettstein and J. A. Dumesic, Green Chem., 2013,
15, 584.5 J.-P. Lange, R. Price, P. M. Ayoub, J. Louis, L. Petrus, L. Clarke and
H. Gosselink, Angew. Chem., Int. Ed., 2010, 122, 4581.6 A. M. Raspolli Galletti, C. Antonetti, V. De Luise and M. Martinelli,
Green Chem., 2012, 14, 688.7 W. Luo, U. Deka, A. M. Beale, E. R. H. van Eck, P. C. A. Bruijnincx
and B. M. Weckhuysen, J. Catal., 2013, 301, 175.8 V. Mohan, C. Raghavendra, C. V. Pramod, B. D. Raju and
K. S. R. Rao, RSC Adv., 2014, 4, 9660.9 P. P. Upare, J.-M. Lee, D. W. Hwang, S. B. Halligudi, Y. K. Hwang and
J.-S. Chang, J. Ind. Eng. Chem., 2011, 17, 287.10 L. Corbel-Demailly, B.-K. Ly, D.-P. Minh, B. Tapin, C. Especel,
F. Epron, A. Cabiac, E. Guillon, M. Besson and C. Pinel, Chem-SusChem, 2013, 6, 2388.
11 J. M. Tukacs, R. V. Jones, F. Darvas, G. Dibo, G. Lezsak andL. T. Mika, RSC Adv., 2013, 3, 16283.
12 L. E. Manzer, Appl. Catal., A, 2004, 272, 249.13 N. N. Rimar and G. N. Pirogova, Russ. Chem. Bull., 1998, 47, 398.14 B. S. Akpa, C. D’Agostino, L. F. Gladden, K. Hindle, H. Manyar,
J. McGregor, R. Li, M. Neurock, N. Sinha, E. H. Stitt, D. Weber,J. A. Zeitler and D. W. Rooney, J. Catal., 2012, 289, 30.
15 J. Lee, Y. Xu and G. W. Huber, Appl. Catal., B, 2013, 140, 98.16 J. Tomasi, B. Mennucci and R. Cammi, Chem. Rev., 2005, 105, 2999.17 C. D. Taylor and M. Neurock, Curr. Opin. Solid State Mater. Sci., 2005,
9, 49–65.18 S. Chibani, C. Michel, F. Delbecq, C. Pinel and M. Besson, Catal. Sci.
Technol., 2013, 3, 339.19 C. Michel, F. Auneau, F. Delbecq and P. Sautet, ACS Catal., 2011,
1, 1430.20 D. Loffreda, C. Michel, F. Delbecq and P. Sautet, J. Catal., 2013,
308, 374.21 K. Mathew, R. Sundararaman, K. Letchworth-Weaver, T. A. Arias and
R. G. Hennig, J. Chem. Phys., 2014, 140, 084106.22 J. Liu, X.-M. Cao and P. Hu, Phys. Chem. Chem. Phys., 2014, 16, 4176.23 N. K. Sinh and M. Neurock, J. Catal., 2012, 295, 31.24 S. Kozuch and S. Shaik, Acc. Chem. Res., 2011, 44, 101.
Communication ChemComm
∑Heterogeneous Catalysis 93

94 ∑Heterogeneous Catalysis
4
ELECTROCATALYSIS
Introduction
Electrocatalysis can be seen as a branch of catalysis where the current(generated or utilized) is analogous to the heat in thermal catalysis. En-dothermic reactions can be reached using adequate current and poten-tials while exothermic reactions can produce a current in addition tothe targeted product. The choice of the electrode and of the operat-ing conditions are essential, but they can hardly be rationalized basedon a molecular understanding of the reactive processes occurring at theelectrode/electrolyte interface. They are difficult to characterize alsoexperimentally. While modeling seems like an adequate complemen-tary tool, it also suffers from severe limitations. The direct inclusion ofthe electrochemical potential is not trivial, even though several meth-ods have been developed in the last decade.4,6,10,13,15,19 Those methodshave been barely used to understand the bond breaking/formation atthe metal/electrolyte interface.7 We have recently used them to under-stand the electrocatalytic behavior of CO2 and related compounds suchas alkenes and formic acid thanks to the strong investment of S. Stein-mann, a post-doc that was first hired on a Solvay contract.21,22, 23 Theinclusion of the electrochemical potential can be necessary but is com-putationally expensive. The computational hydrogen electrode (CHE) isa cheaper approach, based on a basic correction a posteriori on the ther-mochemistry of the elementary steps.12 It has been extensively used in
95
96 ∑Electrocatalysis
the last decade.1,3,5,8,11,14,18 We have recently used this simple model inthe context of ethanol alkaline fuel cell, in collaboration with E. Bara-nova and her PhD student E. Monyoncho (Canada, LIA Funcat).
4.1 Computational hydrogen electrode
This approach was proposed in 2004 by Norskov and co-workers.12 Thebasic idea is that each electron transfer is coupled with a hydronium(H+
+ e–) and the experimental electrochemical potential of this coupleis taken as a reference electrochemical potentiel. For instance, at agiven potential U, the reaction energy of the following reaction
CH3CO + H2O ��! CH3COOH + H++ e–
is computed as:
�Gr(U) = E(CH3COOH) � [E(CH3CO) + E(H2O)] � 0.5 E(H2) � U,
where we have assumed U to be with respect to the pH insensitive Re-versible Hydrogen Electrode and a pH of 0.
The CHE is straightforward in its application since it only requiresto add or remove a correction term to the reaction energy. This termdepends only on the number of hydrogen that are involved in the ele-mentary step (usually 0 or 1) and the reaction energy is computed inabsence of potential or charge, it corresponds to the thermal reactionenergy. The simplicity of CHE relies on strong assumptions. We em-phasize here the two main ones. First, CHE can be used only in caseswhere the electron transfert is coupled to a proton (or another cationsuch as sodium). Second, it implies that the reaction energy obtained inabsence of any charge or potential (the ’thermal’ reaction energy) corre-sponds to the U=0 V/RHE situation, whatever the nature of the surfacespecies at the electrochemical interface. This is a strong limitation ofthe model, since the relation between the charge and the potential is

∑Electrocatalysis 97
given by the capacitance of the system and this quantity depends on theinterface under consideration.
However, the simplicity of this approach allows to tackle large re-action networks. We recently focused on the ethanol oxidation in al-kaline fuel cells in collaboration with E. Baranova and E. Monyon-cho from uOttawa, Canada. To reach a high current and efficiency,the oxidation of ethanol needs to be complete, yielding 12 electronsper ethanol. However, the reaction generally stops at the acetate/aceticacid. We studied the whole reaction network of ethanol oxidation to ac-etate and then CO2. Combining polarization modulation infrared reflec-tion absorption spectroscopy (PM-IRRAS) and density functional the-ory (DFT) calculations (see Figure 4.1), we understood why the C�Cbond is not broken and the oxidation stops at acetate. As shown in Fig-ure 4.1, acetate is clearly the most stable species of the complete reac-tion network of the conversion of ethanol into CO2. In addition, acetateis highly resistant to C�C bond scission. Thus, we focused on the stepsthat precede the oxidation in acetate and we highlighted the pivotal roleof the acetyl CH3CO intermediate: it can either undergo a C�C bondscission yielding CO and then CO2 or it can either be oxidized towardsacetate. The latter is facilitated by the overpotential but it is a dead endin the reaction scheme towards CO2 production, since it cannot be eas-ily oxidized nor broken into C1 fragments. CH3CO is however not themost favored intermediate formed from ethanol electrooxidation on Pd,hence limiting the production of CO2. This reaction mechanism is sumup in Figure 4.2. Building on this study, we plan to screen catalysts insilico to favor the formation of the acetyl and its dissociation.

98 ∑Electrocatalysis
Figure 4.1: Global reaction energy profile of the most stable intermedi-ates during ethanol electrooxidation process on Pd(100) at 0.26 V/RHE.The black squares show the most stable C2 intermediates at each oxi-dation state (C2 path) whose intermediates are indicated at the top. Toguide the eyes, a line has been added, in solid (resp. dotted) when theintermediates are connected (resp. not) from one oxidation state to thenext. Legend: (a) Most stable C2 species, (b) C1 fragments generatedfrom the most stable C2, (c) Most stable C1 fragments, and (d) Par-ent C2 species of the most stable C1 fragments which are shown at thebottom.

∑Electrocatalysis 99
Figure 4.2: General Reaction Scheme based on our DFT results (shownin Figure 4.1. In blue, the experimental evidences. In black, the inter-mediates as suggested by our DFT simulations. Most of the steps arecatalyzed by the Pd electrode (single arrows) while others are solutionequilibria (two one-sided arrows).
100 ∑Electrocatalysis
4.2 Inclusion of the potential
A system of interest for Solvay is the development of novel routes yield-ing adipic acid. An elegant strategy is to use CO2 as a C1 buildingblock and couple it to butadiene, using electrocatalysis to perform thisendothermic reaction. CO2 is an inert molecule. It requires a prelim-inary (partial) reduction to be active and this can be achieved only athighly reductive potentials. To design a proper catalyst able to activateCO2 with a low overpotential without opening the door to side reactionsis a key challenge in the domain of CO2 electrocatalytic valorisation.
We started to demonstrate that the inclusion of the potential usingthe method developed by Filhol and Neurock4 in the simulations of theelectrochemical interface requires the inclusion of the solvent, at least asa continuum, to get a realistic capacitance.22 In addition, we evidencedthat non-electrochemical steps could be sensitive to the electrochemi-cal potential such as the CO2 adsorption or the formate rotation in theHCOOH/CO2 conversion on Ni.21 Once the modeled was appropriate,we tackled the targeted reaction. The electrochemical coupling betweenCO2 and butadiene on Ni and Pt electrodes is difficult: our simulationsare in agreement with the strong overpotential observed experimentally.The C�C bond formation is not sensitive to the electrochemical po-tential and could be eventually facilitated by a change in the catalystmorphology.23
4.3 What’s next?
As a natural next step, I would like to compare the electrocatalytic con-ditions to the thermal catalytic conditions. A potential target is the oxi-dation of biomass-derived alcohols, where interestingly, the same kindof catalysts are currently used in both domains (namely Au, Pd and Ptand alloys of Au-Pd and Au-Pt).2,9,16,17,20
In addition, this domain will greatly benefit of any methodologicaldevelopment to improve the description of the solvent, as we already

∑Electrocatalysis 101
discussed in the previous chapter.
Bibliography
[1] Bandarenka, A. S.; Varela, A. S.; Karamad, M.; Calle-Vallejo, F.;Bech, L.; Perez-Alonso, F. J.; Rossmeisl, J.; Stephens, I. E. L.;Chorkendorff, I. Angew. Chem. Int. Ed. 2012, 51, 11845.
[2] Besson, M.; Gallezot, P.; Pinel, C. Chem. Rev. 2014, 114, 1827–1870.
[3] Ferrin, P.; Nilekar, A. U.; Greeley, J.; Mavrikakis, M.; Ross-meisl, J. Surf. Sci. 2008, 602, 3424.
[4] Filhol, J.-S.; Neurock, M. Angew. Chem. Int. Ed. 2006, 45, 402.
[5] Greeley, J.; I. E. L., S.; Bondarenko, A. S.; Johansson, T. P.;Hansen, H. A.; Jaramillo, T. F.; Rossmeisl, J.; Chorkendorff, I.;Norskov, J. K. Nat. Chem. 2009, 1, 552.
[6] Hamada, I.; Sugino, O.; Bonnet, N.; Otani, M. Phys. Rev. B 2013,88, 155427.
[7] Janik, M. J.; Taylor, C. D.; Neurock, M. J. Electrochem. Soc.2009, 156, B126–B135, OH.
[8] Keith, J. A.; Jerkiewicz, G.; Jacob, T. ChemPhysChem 2010, 11,2779.
[9] Liu, S.-S.; Sun, K.-Q.; Xu, B.-Q. Acs Catalysis 2014, 4, 2226–2230.
[10] Mamatkulov, M.; Filhol, J.-S. Phys. Chem. Chem. Phys. 2011,13, 7675.
[11] Man, I. C.; Su, H.-Y.; Calle-Vallejo, F.; Hansen, H. A.;Martinez, J. I.; Inoglu, N. G.; Kitchin, J.; Jaramillo, T. F.;Norskov, J. K.; Rossmeisl, J. ChemCatChem 2011, 3, 1159.

102 ∑Electrocatalysis
[12] Norskov, J. K.; Rossmeisl, J.; Logadottir, A.; Lindqvist, L.;Kitchin, J. R.; Bligaard, T.; Jonsson, H. J. Phys. Chem. B 2004,108, 17886.
[13] Otani, M.; Sugino, O. Phys. Rev. B 2006, 73, 115407.
[14] Rossmeisl, J.; Qu, Z.-W.; Zhu, H.; Kroes, G.-J.; Norskov, J. J.Electroanal. Chem. 2007, 607, 83.
[15] Rossmeisl, J.; Skulason, E.; Bjorketun, M. E.; Tripkovic, V.;Norskov, J. K. Chem. Phys. Lett. 2008, 466, 68–71.
[16] Shi, X.; Simpson, D. E.; Roy, D. Physical Chemistry ChemicalPhysics 2015, 17, 11432–11444.
[17] Simoes, M.; Baranton, S.; Coutanceau, C. ChemSusChem 2012,5, 2106–2124.
[18] Stamenkovic, V.; Mun, B. S.; Mayrhofer, K. J. J.; Ross, P. N.;Markovic, N. M.; Rossmeisl, J.; Greeley, J.; Nørskov, J. K.Angew. Chem. Int. Ed. 2006, 45, 2897.
[19] Taylor, C. D.; Wasileski, S. A.; Filhol, J.-S.; Neurock, M. Phys.Rev. B 2006, 73, 165402.
[20] Zalineeva, A.; Serov, A.; Padilla, M.; Martinez, U.;Artyushkova, K.; Baranton, S.; Coutanceau, C.; Atanassov, P. B.J. Am. Chem. Soc. 2014, 136, 3937.
[21] Steinmann, S. N.; Michel, C.; Schwiedernoch, R.; Filhol, J.-S.;Sautet, P. ChemPhysChem 2015, 16, 2307–2311 .
[22] Steinmann, S. N.; Michel, C.; Schwiedernoch, R.; Sautet, P.Phys. Chem. Chem. Phys. 2015, 17, 13949–13963 .
[23] Steinmann, S. N.; Michel, C.; Schwiedernoch, R.; Wu, M.;Sautet, P. J. Catal. 2016, –.

This journal is© the Owner Societies 2015 Phys. Chem. Chem. Phys., 2015, 17, 13949--13963 | 13949
Cite this:Phys.Chem.Chem.Phys.,2015, 17, 13949
Impacts of electrode potentials and solvents onthe electroreduction of CO2: a comparison oftheoretical approaches†
Stephan N. Steinmann,a Carine Michel,ab Renate Schwiedernochc andPhilippe Sautet*ab
Since CO2 is a readily available feedstock throughout the world, the utilization of CO2 as a C1 building block
for the synthesis of valuable chemicals is a highly attractive concept. However, due to its very nature of
energy depleted ‘‘carbon sink’’, CO2 has a very low reactivity. Electrocatalysis offers the most attractive
means to activate CO2 through reduction: the electron is the ‘‘cleanest’’ reducing agent whose energy
can be tuned to the thermodynamic optimum. Under protic conditions, the reduction of CO2 over many
metal electrodes results in formic acid. Thus, to open the road to its utilization as a C1 building block, the
presence of water should be avoided to allow a more diverse chemistry, in particular for C–C bond for-
mation with alkenes. Under those conditions, the intrinsic reactivity of CO2 can generate carbonates and
oxalates by C–O and C–C bond formation, respectively. On Ni(111), almost exclusively carbonates and
carbon monoxide are evidenced experimentally. Despite recent progress in modelling electrocatalytic
reactions, determining the actual mechanism and selectivities between competing reaction pathways is
still not straight forward. As a simple but important example of the intrinsic reactivity of CO2 under aprotic
conditions, we highlight the shortcomings of the popular linear free energy relationship for electrode potentials
(LFER-EP). Going beyond this zeroth order approximation by charging the surface and thus explicitly
including the electrochemical potential into the electronic structure computations allows us to access
more detailed insights, shedding light on coverage effects and on the influence of counterions.
1 IntroductionHeterogeneous electrocatalysis is at the heart of advanced energytechnologies such as hydrogen production1 and fuel-cells.2
Furthermore, electrochemistry, in combination with photovoltaiccells, promises access to ‘‘green’’ and ‘‘mild’’ redox chemistry.3–5
In particular, the electroreduction of CO2 is a conceptuallyattractive avenue: electrochemistry activates the intrinsicallyrather inert green-house gas under mild conditions (i.e., lowpressure and temperature), enabling us to utilize CO2 as a C1building block in C–C coupling reactions6–9 or to generate
small, energy rich molecules such as CO, methanol orformic acid.10–13
In protic media, the reduction of CO2 competes with H2
evolution and mixtures of CO + H2O, formic acid and very smallamounts of hydrocarbons are observed in general.14,15 Hence,the efficient use of CO2 as a C1 building block precludes thepresence of water and protons. For instance the electroreduc-tion of CO2 in DMF in the presence of a diene over Ni has beenreported to yield C–C coupled products, in particular thedicarboxylates.6,7,16–18 However, the existing procedure is notvery efficient in terms of yield and selectivity and the mechanismis poorly understood. In addition, in aprotic solvents, CO2 has anintrinsic reactivity, potentially yielding oxalate and a combinationof CO and carbonate,11,19 opening additional reaction paths.
Electrocatalysis is carried out in a complex environment, i.e.,an electrolyte is required to increase the conductivity of thesolution and the interface between the catalyst and the solventis thin compared to the solution, making experimental character-ization challenging.20–25 Despite considerable efforts, we lack,therefore, a detailed mechanistic understanding at the atomiclevel, hampering the rational design of novel catalysts. Forall these reasons, research and development have still huge
a Universite de Lyon, Laboratoire de Chimie, Ecole Normale Superieure de Lyon 46allee d’Italie, Lyon, France
b CNRS, Laboratoire de Chimie, UMR 5182, 46 allee d’Italie, Lyon, France.E-mail: [email protected]; Fax: +334 7272 8080; Tel: +334 7272 8155
c Eco-Efficient Products and Processes Laboratory (E2P2L), UMI 3464 Solvay/CNRS,Shanghai, P. R. China
† Electronic supplementary information (ESI) available: Bader charges forselected adsorbates as a function of potential, all geometries optimized at zero-charge in a vacuum and a shell-script to post-process VASP computationsaccording to the correction proposed by Filhol and Neurock. See DOI: 10.1039/c5cp00946d
Received 13th February 2015,Accepted 21st April 2015
DOI: 10.1039/c5cp00946d
www.rsc.org/pccp
PCCP
PAPER
Publ
ished
on
27 A
pril
2015
. Dow
nloa
ded
by B
iblio
theq
ue D
ider
ot d
e Ly
on o
n 30
/05/
2016
13:
18:4
0.
View Article OnlineView Journal | View Issue
∑Electrocatalysis 103

13950 | Phys. Chem. Chem. Phys., 2015, 17, 13949--13963 This journal is© the Owner Societies 2015
challenges to overcome in order to efficiently use CO2 as a C1building block.
Atomic scale modelling is a powerful tool for complementingthe experimental effort and providing detailed information undervery well controlled conditions (catalyst surface, applied potential).However, computations are usually performed on simplifiedmodels and the influences of the electrolyte and of the solventon the catalyst interfacial properties are rarely considered,26
although their importance is well known from more empiricalapproaches.27,28 The classical description of electrochemicalsystems typically relies on ‘‘empirical’’ or at least drasticallysimplified equations29 (e.g., Marcus–Hush for electron transfer,Gouy–Chapman for the double layer properties or the Fokker–Planck equation for mass transport). These mesoscopic equationsrequire system averaged parameters which can either be obtainedby fitting to experiment or approximately extracted from firstprinciples data. Although such multi-scale models30,31 may correctlydescribe the relevant physics, the fundamental issue is that thecentral ingredient in electrocatalysis, the electrochemical potential,is far from being straight forward to include explicitly in a firstprinciples approach at the atomic level.
The present study investigates the electroreduction of CO2
in an aprotic solvent as a prerequisite for further investigationsof the CO2 coupling with alkenes.6,7,16–18 Oxalate is the majorproduct of CO2 electrolysis under aprotic conditions on ‘‘inert’’electrodes, in particular over Pb.32,33 The proposed reactionmechanism, which is in good agreement with the high over-potentials required for this reaction, goes through CO2
!". Theradical anion is supposed to be slightly stabilized by the surfaceat potentials below "1.8 V (vs. Ag/AgCl) and then undergo a fastsurface assisted coupling.34 On more reactive electrodes, and inparticular over nickel, CO formation is frequently reported.11,14
The large majority of simulations of heterogeneous electro-catalysis rely on a simple model proposed in the seminal workreported by Norskov and coworkers under the name of thecomputational hydrogen electrode (CHE),35 and its extension toother cations than H+, e.g., Li+36 or Na+, which we call linearfree energy relationship for electrode potentials (LFER-EP). Inthis model, the electrochemical potential is assumed to affect onlythe chemical potential of the exchanged electrons and solventeffects are generally neglected. In a nutshell, this approach is ana posteriori correction of first principles studies of neutral metalsurfaces in a vacuum that are routine computations for somedecades.37 The CHE model leads to highly exploitable results,38–44
despite its known limitations: the absence of polarisation ofadsorbed molecules and electron transfer strictly coupled tocation transfer. This implies, for example, that this methodcannot grasp the transient anionic species CO2
!".The comparison by Rossmeisl et al.45 of the zeroth order
approach CHE and the more advanced surface charge (SC)method of Filhol and Neurock46 (vide infra) concluded that foradsorbates with large dipole moments and for kinetic studies themore sophisticated SC method should be applied.45 However,to go beyond the CHE approach, one needs to explicitly integratethe electrochemical potential into the first principles calculations.Applying an electrochemical potential is equivalent to tune the
workfunction, which is simulated by adding or subtractingelectrons from the neutral system. Hence, charged systems arenecessary to explicitly investigate the effect of an electrochemicalpotential on surface adsorbed species. Unfortunately, chargedsystems cannot be simulated under periodic boundary condi-tions, which most efficiently simulate extended metallic systems:a periodically charged system is infinitely charged and hence theCoulomb potential diverges. Therefore, when changing the numberof electrons in periodic computations a countercharge is required.Several schemes have been proposed in the literature.26,46–53 Thetechnically simplest way to deal with the situation is to includea homogeneous background charge.46 The technical simplicityleads to a major drawback: the uniform background chargeinteracts with the system, even within the metallic slab. Filholand Neurock have proposed a correction, leading to the surfacecharging (SC) mehod, in order to mitigate the issue.46,52 The SCmodel provides, despite the approximations, excellent agree-ment with experiment when a water bilayer is used to solvatethe surfaces, as exemplified by the phase diagram of H2O overPt45,54 and Ni,55 CO electro-oxidation over Pt56 and the boro-hydride oxidation.57
In addition to the electrochemical potential, electrochemistrydepends critically on the solvent because the dielectric constant ofthe solvent governs the capability of a system to stabilize and‘‘store’’ charges, i.e., the capacitance of the system. Therefore,solvent effects are especially important for charged systems.So far, the water solvent was modeled using an explicit bilayerof water.45,54–59 In our case, we aim at modelling an aproticsolvent such as DMF. However, just like including an electro-chemical potential into the simulations, accounting for solventeffects in electronic structure computations of extended systemsis still in its infancy,60–63 with implicit solvent models becomingpublicly available only very recently.64 This is in contrast with thesituation of molecular chemistry where several solvent modelshave been developed and applied for many years.65
The aim of this study is two-fold. On the one hand, we willprovide some insight into the selectivity towards the formationof carbonates upon CO2 electrolysis over nickel under aproticconditions. On the other hand, we will elucidate the influenceof the applied electrochemical potential on species adsorbed ona metal surface in order to clarify two aspects of the modellingof heterogeneous electrocatalysis: first, the importance toaccount explicitly for the electrochemical potential, going beyondthe simplest consideration of the electrochemical potential andsecond the role of modelling the solvent.
The following section reminds the reader of the basics ofmodelling electrochemistry, before discussing the advantagesand limitations of the two schemes applied herein: the simplelinear free energy relationship for the electron chemical potential(LFER-EP), popularized by Norskov and coworkers and the explicitchange of the electrochemical potential through charging thesurface and neutralizing the simulation cell with a homogeneousbackground charge (SC) as developped by Filhol and Neurock.After this methodological discussion, the results for aprotic CO2
reduction as described by the two approaches are presented toillustrate the influence of the applied electrochemical potential
Paper PCCP
Publ
ished
on
27 A
pril
2015
. Dow
nloa
ded
by B
iblio
theq
ue D
ider
ot d
e Ly
on o
n 30
/05/
2016
13:
18:4
0.
View Article Online
104 ∑Electrocatalysis

This journal is© the Owner Societies 2015 Phys. Chem. Chem. Phys., 2015, 17, 13949--13963 | 13951
and the solvation effects simultaneously. With the SC method,we investigate the origin of the selectivity of Ni(111) to producecarbon monoxide and carbonates rather than oxalates.
2 MethodsComputational modelling of electrochemistry is hampered bythe simple fact that the electrode potential is not a naturalvariable in quantum chemical computations. Most chemistsare used to think in the ‘‘constant charge’’ picture, i.e., thenumber of electrons is not fluctuating during a reaction. Sinceeach species with a given number of electrons corresponds to adifferent electrochemical potential, the ‘‘constant charge’’ pictureis inadequate for electrochemistry, where all the intermediatesshould be treated at the same potential. For example, CO2 adsorbedon a metal surface corresponds to a different potential than COand O co-adsorbed on the same surface. Hence, to get thecorrect reaction energy, the charge on the surface for adsorbedCO2 and CO, O needs to be adapted individually to reach thedesired potential. Therefore, an electrochemical half-cell iseffectively a grand-canonical ensemble where the number ofelectrons is adapted according to the electrochemical potentialin a different way for different intermediates of an electrochemicalreaction. The most realistic approach would be to account forsolvent molecules and explicit counterions, but this approachis computationally very demanding, requiring large unit cellstogether with statistically meaningful sampling of the solventand counterion positions. To overcome this challenge, moreapproximate schemes have been developed, where the counter-charge is introduced as some idealized distribution in the unitcell (vide infra).
2.1 Basics of electrochemistry
To set the stage, this section gives a brief reminder of the basictext book equations in electrochemistry, starting with thestandard Gibbs energy of reaction DrG
~
DrG~ = "nFU SHE,~ (1)
where n is the number of electrons transferred, F the Faradayconstant and USHE,~ the standard reduction potential refer-enced to the standard hydrogen electrode (SHE).
The SHE is an ideal electrode which is immersed in anaqueous solution with a H2 and H+ activity of unity and a zerooverpotential for hydrogen evolution, which corresponds to thefollowing definition
2H+ + 2e" " H2 DrG~ = 0.0 at USHE = 0 V (2)
It is with respect to this idealized electrode reaction that formal‘‘half-cell’’ potentials are commonly defined.
By definition, the reduction occurs at the cathode and theoxidation at the anode, yielding the cell potential U~
cell
U~cell = U~
cathode " U~anode (3)
Away from standard conditions, it is most straight forwardto compute first DrG of the reaction and then convert it back
into a potential, also known as electromotive force, using theuniversal equation
Ucell ¼ "DrG
nF(4)
For spontaneous reactions, DrG is negative and hence Ucell
is positive.When applying an electrochemical potential, it is helpful to
work with the following equation
DrG(USHE) = "nF(USHE,~ " USHE) = DG~r + nFUSHE (5)
where USHE is the imposed potential and USHE,~ " USHE is, ingeneral, the over- or underpotential.
The SHE is inconvenient for computational purposes, assimulating the hydrogen evolution under realistic conditionsand measuring potentials relative to this half-cell are extremelycumbersome. Therefore, the common computational referencestate is vacuum: on the ‘‘vacuum scale’’, the energy of an electronin vacuum is defined as zero and all the attractive energy comesfrom interactions with the nuclei. This scale is often called the‘‘absolute’’ scale for redox potentials; we will stick to theunambiguous term ‘‘vacuum scale’’.66
A concept closely related to the electrode potential on thevacuum scale is the workfunction W. The workfunction is theenergy required to remove one electron from a surface, i.e., wecan understand the workfunction as the ionization energy. Formetals, the electron affinity and the ionization energy have thesame value with opposite signs. Since the vacuum scale sets theenergy of the electron in a vacuum to zero, the chemicalpotential of the electron (me) in the electrode is equal to minusthe workfunction, whereas the workfunction is identical to theelectrochemical potential, Uvac. Hence we might write
W = Uvac = "me (6)
Of course, the ‘‘experimental scale’’, U SHE, and the vacuumscale, U vac, are related. IUPAC recommends67 to assign a value ofU vac = 4.44 V to the standard hydrogen electrode.70 Accordingly,we easily switch from one scale to the other using U vac = U SHE +4.44 V as illustrated in Fig. 1. The remaining question is how agiven computation is connected to one or the other scale.
2.2 Linear free energy relationship for electrochemicalpotentials
The linear free energy relationship for accounting for theelectrochemical potential, LFER-EP, is the zeroth order levelto treat electrochemical reactions, since it accounts exclusivelyfor the energy of the transferred electron. The premise is thatelementary reaction steps can be devided into chemical steps(where the composition of the system remains constant) andelectrochemical steps, where the number of electrons changesdue to adding/removing an electron and its cation (e.g., Na+ +e" " Na(s) or the more typical H+ + e" " 1
2H2). The LFER-EPhas been introduced by Norskov and coworkers in the formula-tion of the computational hydrogen electrode (CHE).35 Through-out this article, we will use LFER-EP for the generalization of theCHE to other cations than the proton.36 However, in this section,
PCCP Paper
Publ
ished
on
27 A
pril
2015
. Dow
nloa
ded
by B
iblio
theq
ue D
ider
ot d
e Ly
on o
n 30
/05/
2016
13:
18:4
0.
View Article Online
∑Electrocatalysis 105

13952 | Phys. Chem. Chem. Phys., 2015, 17, 13949--13963 This journal is© the Owner Societies 2015
the characteristics of the LFER-EP are discussed with theexample of the CHE.
The model and assumptions of the CHE are summarized inthe following:
1. Electronic energies are only required for electroneutralentities and thus do not depend on the electrochemicalpotential. When evaluating the potential dependence of reac-tion energies, these ‘‘zero charge’’ results give the reactionenergy at 0 V vs. SHE.71
2. Electron transfers are always coupled to proton transfersand no charged systems are involved. Therefore, processes thathave no direct involvement of counterions (e.g., Fe3+(cp)2 +e" - Fe2+(cp)2 with cp = cyclopentadienyl) cannot be studiedstraightforwardly.
3. The applied electrochemical potential only affects the electro-chemical steps, i.e., the proton coupled electron transfers.
4. The correction for the applied potential is derived from:
DGHþþe" USHE! "
¼ 1
2DG~
H2" qUSHE. In other words, the energy
of the electron in the electrode is equal to "qUSHE, where q isthe fundamental charge involved in the electrochemical step.
5. The choice of the reference electrode and how it is coupledto the system under consideration imply that the solvent is waterand that the hydration energy of a proton is neither influenced bythe electrochemical potential nor by the electrolyte.
To summarize, the computational hydrogen electrode allowsus to account for the nominal potential dependence of anelectrochemical reaction, i.e., to account for the last term ofeqn (5), nFU. However, it disregards any influence of theinteraction between species and the electrode itself at a specificpotential, i.e., it describes the correct physics for solution phaseelectrochemistry, but it is an approximation for the elementaryreaction steps on an electrified interface where the number ofelectrons is variable in order to keep the potential constant.Despite these limitations, the LFER-EP is not only extremelysimple to apply (being an a posteriori correction to ‘‘standard’’computations), but also the first step in any scheme improvingon the LFER-EP.
2.3 Beyond the linear free energy relationship: the surfacecharging method
Any method aiming to improve over the LFER-EP has to take thespecific interactions between adsorbates and the electrifiedelectrode explicitly into account, lifting assumptions 1–3 in theCHE (vide supra) by introducing DGelec
r (U). The superscript ‘‘elec’’indicates that the electronic contribution, originating in polar-ization and charge-transfer, to the free energy is included. Thesimplest approach to assess the importance of the appliedelectrochemical potential on the energies of adsorbates wouldbe to apply an electrical field in the simulation cell.72–74 However,the surface charge density qsurf, needed for obtaining the electro-chemical free energy, is tricky to evaluate.75
Schemes that account for all relevant free energy changesalter, therefore, the number of electrons in the systemexplicitly46,48,49,51–53,76 and work with the grand-canonical energyexpression for all the surface adsorbed species. The potentialdependent free energy of the surface Gsurf(U
vac) is given by
DGsurf(Uvac) = DE elec
surf(Uvac) " qsurf(U
vac)FU vac
E DE elecsurf(U0) " 1
2C(U vac " U vac0 )2 (7)
with DE elecsurf(U
vac) being the electronic energy at potential U vac
and qsurf is positive if electrons are removed and negative whenelectrons are added, i.e., qsurf is the surface charge density ofthe system and U vac is the vacuum scale potential of the electrode.The reasoning behind eqn (7) is that electrons removed from thesystem are transferred to the electrode which serves as thereservoir of electrons at the potential U vac. Similarly, adding anelectron from the electrode is associated with the energetic costof removing the electron from the reservoir. The approximateequality refers to the quadratic development of the electronicfree energy,76,77 which can serve to introduce the notion of thecapacitance C of the surface and simplifies the link between SCand LFER-EP results. Assuming a constant capacitance for a givensurface (which is often a reasonable first order approximation78)the results of LFER-EP and eqn (7) are identical at the potentialwhich corresponds to the average of the zero charge potentials(U0), i.e., the workfunctions. Note that in the SC model thecapacitance C is not an ‘‘external’’ constant: its value, whichcorresponds to the curvature of the parabola (vide infra), isdetermined for each system independently and is thus quitedifferent in a vacuum than in implicit DMF. Furthermore, as can beseen in Fig. 6, the capacitance weakly depends on the adsorbate:the binding energy difference between two adsorbates (e.g., 2CO2
vs. CO, CO3) is not simply a straight line as would be the case if thecapacitances of the implicated systems were equal.
The different surface charging schemes (e.g., neutralizationwith a homogeneous background-charge as developed by Filholand Neurock46,52,76 or Otani’s implicit counterelectrode48,53)have a different way to obtain the first term of eqn (7), i.e.,DE elec(Uvac), while the second term is, essentially, the same asthe one needed for the nominal potential dependence, intro-duced in the previous section. Here, we will apply the surfacecharging method in the formulation by Filhol and Neurockwhich we abreviate by SC.76
Fig. 1 Scales of the electrochemical potential in volts with respect to thevacuum (left) and to the standard hydrogen electrode (right). The experi-mental Na/Na+ redox couple and the computed workfunction of Ni(111)and Pt(111) are given as examples.
Paper PCCP
Publ
ished
on
27 A
pril
2015
. Dow
nloa
ded
by B
iblio
theq
ue D
ider
ot d
e Ly
on o
n 30
/05/
2016
13:
18:4
0.
View Article Online
106 ∑Electrocatalysis

This journal is© the Owner Societies 2015 Phys. Chem. Chem. Phys., 2015, 17, 13949--13963 | 13953
The two main advantages of these general approaches are (a)Proper potential alignment: since these methods work with thevacuum scale potential, assessed through workfunctions, thepotential of all the systems is referenced to vacuum and properlyaligned, i.e., changes in the workfunction due to adsorptionsand reactions are fully taken into account. (b) Decoupling ofelectrons and counterion transfer: eqn (7) does not make useof any counterion. Hence a potential dependence of a systemwhere only an electron transfer has occurred is easily accessible.For example, the potential dependence of CO2 adsorption isreadily evaluated with such a scheme, while it is a constantwithin the LFER-EP framework. To be explicit, the clear distinctionbetween ‘‘chemical’’ and ‘‘electrochemical’’ steps makes placefor a ‘‘gradual, nuanced’’ description, where the electrochemicalpotential fixes an electrode polarization, which requires a specificsurface charge density, qsurf. Hence, the coupled electron cationtransfer, which could be reasonably described by LFER-EPand be a good approximation in the case of covalent bondformation (e.g., C–H), becomes a special case, while in generalthe surface charge changes by a characteristic value for a givenelementary reaction.
The energy of the reactants in the formally electrochemicalsteps are obtained like in the LFER-EP approach, i.e.,
DGX+e"(Uvac) = DGX + q(Uvac,~X " Uvac) (8)
where, Uvac,~X can be either obtained from the experiment (e.g.,
4.44 V for 12H2) or from the computed workfunction (e.g., 2.74 V
for Na(100) in a vacuum). The advantage of the later approachis that the workfunction of an uncharged sodium surface canbe computed under the specific computational conditions, e.g.,using the same solvent model, giving a ‘‘consistent’’ descrip-tion. Of course, this standard redox-potential can also beapplied in the LFER-EP.
3 ModelThe electroreduction of CO2 under aprotic conditions opens upseveral reaction channels. Herein, we investigate the C–C couplingof CO2, leading to oxalates
and the dissociation reaction of CO2 into CO and adsorbedoxygen. Under electrochemical conditions, the surface boundoxygen may further be reduced to carbonate
Both products are, in principle, competitors in any reactionwhere CO2 is reduced electrochemically, e.g., formic acid orhydrocarbon formation8,9,11,12,14,15 and are therefore worthstudying in order to, subsequently, assess the selectivity of
the target reactions. However, under the studied aprotic con-ditions, no formic acid or hydrocarbons can be formed.
As far as simulations are concerned, the aprotic solvent DMFhas the advantage compared to water that it is non-reactive andthat no specific interactions (H-bonds) are expected betweenthe solvent and the solute, but the disadvantage that its size isconsiderably larger, pushing simulations with meaningfulexplicit layers of DMF beyond our present capabilities. How-ever, the average effect of the solvent, i.e., increased capaci-tance, might be captured well enough by an implicit solventmodel, which avoids the ambiguities in choosing a structure forthe static solvent layers as usually proposed when includingsolvent effects.46 Therefore, our study investigates the combi-nation of implicit solvent treatment and explicit accounting ofthe electrochemical potential. Although this model is far fromperfect (the double layer is grossly approximated by the homo-geneous background charge and there are no explicit solventmolecules), to the best of our knowledge, it is the state of the artthat can be done with publicly available, well established, periodicDFT codes.
We model the catalyst surface by the Ni(111) facet and thesolvent by a continuum with a relative dielectric constant (e) of37.2, characteristic of DMF. The latter is also very close to theone of another typical aprotic solvent for electrochemistry,acetonitrile (e = 37.7). The results will hence be generallyapplicable to aprotic solvents with a high dielectric constant.Vlachos and co-workers concluded that the water gas shiftreaction, which involves chemisorbed CO2 and co-adsorbedCO and O, similarly to systems reported herein, yields overallsimilar results at the Ni(111) surface or the Ni(211) facet.79
Therefore, we have limited ourselves to the ideal Ni(111) surface.In order to gain a more complete understanding, simulations overdifferent surfaces and the determination of activation barriersshould be considered, but these investigations are beyond thescope of this study.
Experimentally, the electroreductive coupling of CO2 to alkenes iscarried out with a sacrifying aluminum or magnesium electrode.16–18
Computationally, the monovalent sodium cation is more con-venient than the di- or trivalent cations and the redox potentialis comparable. Therefore, we model the counterion by Na+. Forexample, carbonate is simulated as Na2CO3 instead of Al2(CO3)3.The solvation energy of Na+ is predicted to be "3.14 eV by theimplicit solvation model. At the equilibrium potential, the energyof Na+ in solution is equal to the energy of Na on the metallicsodium surface, i.e., the solvation energy is roughly compensatedby the workfunction. The solvation energy provided by the implicitsolvent model is, thus, fairly consistent with the workfunctionof sodium metal (2.7 V) but underestimated compared to the4–4.5 eV expected based on experimental data and cluster-continuum data in a similar solvent.80 Considering that Na+ isco-adsorbed on the surface (or embedded in the salt solid) andtherefore never ‘‘fully solvated’’ and its energy is obtained from theworkfunction of solid sodium, we did not try to improve thedescription of Na+ by including explicit solvent molecules. Further-more, the incurred error has an undetermined sign and magni-tude compared to the experimentally relevant Al3+or Mg2+.
PCCP Paper
Publ
ished
on
27 A
pril
2015
. Dow
nloa
ded
by B
iblio
theq
ue D
ider
ot d
e Ly
on o
n 30
/05/
2016
13:
18:4
0.
View Article Online
∑Electrocatalysis 107

13954 | Phys. Chem. Chem. Phys., 2015, 17, 13949--13963 This journal is© the Owner Societies 2015
The salts (Na2CO3 and Na2C2O4) are modelled as crystals withtwo chemical formulas per unit cell. These models are derivedfrom experimental crystal structures81,82 and are fully optimized.
To assess the window of the electrochemical stability of Na+
under our conditions, there is, on the one hand, a workfunctionof sodium (B2.7 V), which assures the formal stability of Na+
down to about "1.8 V vs. SHE with respect to the formation ofsolid sodium. On the other hand, Na+ adsorption on Ni(111) ispositive (i.e., unstable) within this potential window (vide infra,Fig. 2). Hence, Na+ is, indeed, the relevant chemical speciesunder the simulated conditions.
4 Computational detailsThe metal surface is modeled as a symmetric p(3 % 3) Ni(111)slab with a lattice constant of 3.52 Å and a thickness of 5 layers(the middle layer is frozen in its bulk position), in a periodicbox of 37.35 Å. The spin-polarized electronic structure isdescribed at the PBE level,83 with an energy cut-off of 400 eVfor the plane-wave basis set. The electron–ion interactions aredescribed by the PAW formalism.84,85 All computations areperformed with VASP 5.3.3.86,87 Accounting for solvation effectsis achieved by exploiting the implicit solvation model26,88 asimplemented by Hennig and co-workers under the nameVASPsol.64 In this model, the electrostatic interaction with theimplicit solvent is computed based on a linear polarization model,where the relative permittivity of the medium is a continuousfunction of the electron density. A switching function around aspecified isodensity value is used to vary the relative permitivityfrom 1 (well ‘‘inside’’ the surface metal atoms) to the solvent bulkvalue far away from the surface. This modified Hartree potentialis obtained by solving the modified Poisson equation. Hence,the polarization of the system due to the solvent is includedself-consistently. In order to get numerically stable results forthe potential in empty space, the surface tension was set to zero(no cavitation energy) and the critical density value was reducedto 2.5 % 10"4 e Å"3. The dielectric constant of DMF was set to37.2. Note that when we started this study, VASPsol wasincompatible with non-local van der Waals density functionalsand we did therefore not apply them. Since we are mainlycomparing two electrochemical approaches, we do not expect toobtain qualitatively different conclusions upon accounting forweak non-bonded interactions. All geometries were optimizedto reach a gradient smaller than 0.05 eV Å"1 with wave func-tions converged to 5 % 10"5 eV. The precision setting of VASP isset to ‘‘normal’’ and the automatic optimization of the real-space projection operators is used.
The energy of the sodium cation is obtained according toeqn (7) with the energy of an atom in bulk sodium (DGNa) andthe workfunction of the Na(100) surface (Uvac,~
Na is 2.74 V in avacuum and 2.67 V in implicit DMF).
In the SC method, the system is charged and Ne electrons arepresent in total instead of the neutral N0 number. In order toreach an overall neutral cell, a uniform background charge ofthe opposite sign is applied. This uniform charge is also
present in the metal slab itself, where it is screened by themetal. Hence, the ‘‘effective’’ applied charge is reduced and theDFT energy must be corrected accordingly. The correctionsuggested by Filhol and Neurock46,52,76 reads
Gelec Uabs! "
¼ EDFT N0ð Þ þ z0Z
EDFT Neð Þ " EDFT N0ð Þð Þ
þ z0Zq
ðNe
N0
Va Neð ÞdNe þUabs Ne "N0ð Þ(9)
where Uabs is the workfunction for the system with Ne electronsand N0 is the number of electrons for the neutral system. Z is theinterslab repeat vector of one supercell (z-direction) and z0 is thesegment along this direction not occupied by the metal slab(the radius of the atoms is derived from the lattice constant),
thereforez0Z
(in our setupz0Z¼ 0:703) gives the ratio of the space
in which the homogeneous back-ground charge is ‘‘active’’, i.e.,not screened by the metallicity of the slab. This ‘‘screening’’
concerns Ne "N0ð Þ 1" z0Z
$ %electrons. q is the elementary charge
and the integral approximates the interaction energy of thehomogeneous background with the system in order to removethis spurious interaction. The interaction is estimated from theelectrostatic potential Va, in the middle between the two symmetricsurfaces, which is taken to be the energy of the ‘‘vacuum’’, i.e., it isalso used to compute the workfunction. Note that even though weare using the symbol G for the free energy (to emphasize that thefree energy change due to electron transfer is taken into account)eqn (9) would need to be supplemented by the standard termsaccounting for translational, rotational and vibrational degreesof freedom in order to be a ‘‘proper’’ Gibbs energy. Whendiscussing the results, we will thus refer to ‘‘adsorption energies’’and not ‘‘adsorption free energies’’, although they are ‘‘electronicfree energies’’.
Energies were obtained for at least 5 different charges foreach system. Subsequently, a parabolic fit was used for acces-sing arbitrary potentials. The same procedure is applied to getthe effective charge qsurf(U) at an arbitrary potential. Thesedata are used to evaluate the charge injection Dadsq(U) = (qslab
surf
(U) + Nmol) " qsystemsurf (U) for a given reaction, where Nmol is the
sum of the electrons in the isolated molecules (the counterion,Na+, is considered as a charged species) adsorbed on thesurface. A script for automating these tasks is available inthe supplementary information. Whenever technically possible,the charges were chosen to obtain an interpolating parabolabetween "2 and 1 V (vs. SHE). Depending on the system thiswas not possible, as in the highly (negatively) charged systemsthe required electrons are not bound on the surface anymorebut spilling out into the ‘‘vacuum’’, filled with the backgroundcharge. In these situations, eqn (9) is not applicable anymore,which is seen as strong deviations from the parabolic behavior.
5 Results and discussionCO2 electrolysis under aprotic conditions is reported to yieldCO and carbonate or the C–C coupling product, oxalate, depending
Paper PCCP
Publ
ished
on
27 A
pril
2015
. Dow
nloa
ded
by B
iblio
theq
ue D
ider
ot d
e Ly
on o
n 30
/05/
2016
13:
18:4
0.
View Article Online
108 ∑Electrocatalysis

This journal is© the Owner Societies 2015 Phys. Chem. Chem. Phys., 2015, 17, 13949--13963 | 13955
on the electrode material. We therefore start by investigatingthe adsorption of the reactant, CO2, and its dissociation intoco-adsorbed CO and O. Then we consider the influence of CO2
coverage and the formation of oxalate, competing with the oneof carbonate and carbon monoxide. Investigating this intrinsicreactivity of CO2 under aprotic, reductive conditions will not
Fig. 2 Adsorption (top) and associated charge injection (bottom) upon adsorption of Na+(purple) and of CO2 on Ni(111) as a function of electrochemicalpotential in a vacuum (left) and implicit DMF (right). Two adsorption modes are compared for CO2: the intact chemisorption (red) and the dissociativeadsorption (i.e., CO and O co-adsorption, brown). Broken lines indicate the co-adsorption with Na+. The thin lines refer to the LFER-EP, while the thicklines are computed with the SC method.
PCCP Paper
Publ
ished
on
27 A
pril
2015
. Dow
nloa
ded
by B
iblio
theq
ue D
ider
ot d
e Ly
on o
n 30
/05/
2016
13:
18:4
0.
View Article Online
∑Electrocatalysis 109
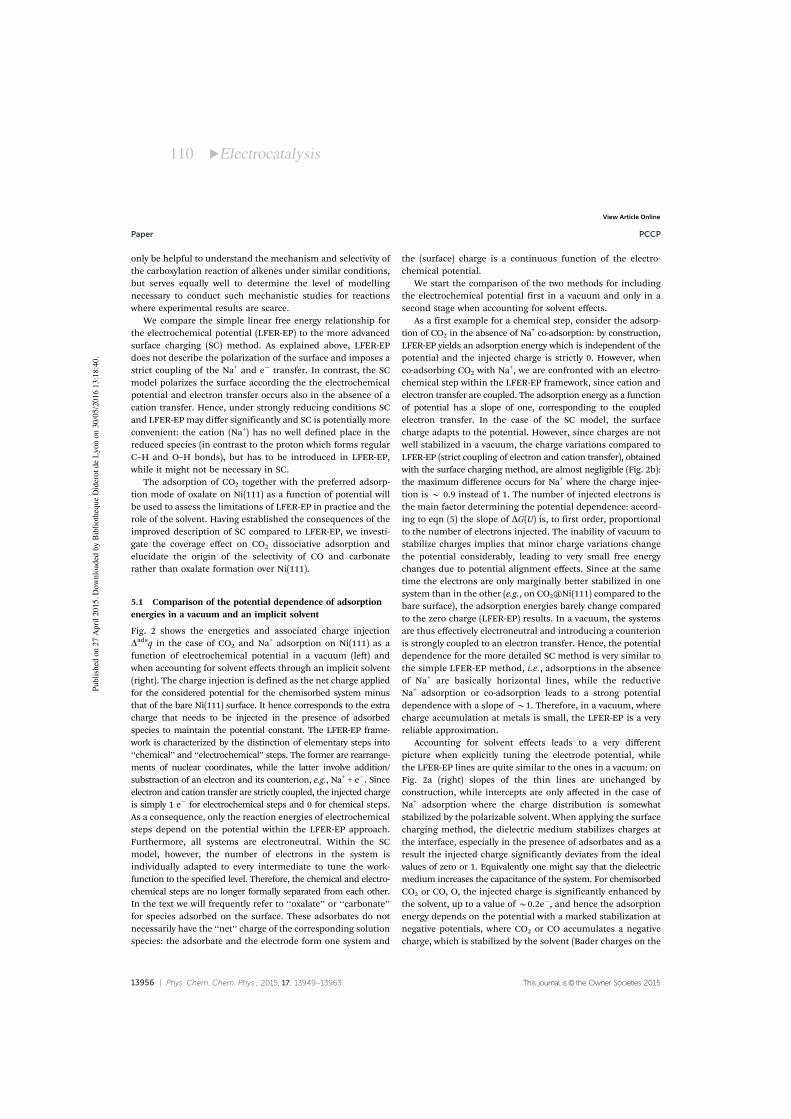
13956 | Phys. Chem. Chem. Phys., 2015, 17, 13949--13963 This journal is© the Owner Societies 2015
only be helpful to understand the mechanism and selectivity ofthe carboxylation reaction of alkenes under similar conditions,but serves equally well to determine the level of modellingnecessary to conduct such mechanistic studies for reactionswhere experimental results are scarce.
We compare the simple linear free energy relationship forthe electrochemical potential (LFER-EP) to the more advancedsurface charging (SC) method. As explained above, LFER-EPdoes not describe the polarization of the surface and imposes astrict coupling of the Na+ and e" transfer. In contrast, the SCmodel polarizes the surface according the the electrochemicalpotential and electron transfer occurs also in the absence of acation transfer. Hence, under strongly reducing conditions SCand LFER-EP may differ significantly and SC is potentially moreconvenient: the cation (Na+) has no well defined place in thereduced species (in contrast to the proton which forms regularC–H and O–H bonds), but has to be introduced in LFER-EP,while it might not be necessary in SC.
The adsorption of CO2 together with the preferred adsorp-tion mode of oxalate on Ni(111) as a function of potential willbe used to assess the limitations of LFER-EP in practice and therole of the solvent. Having established the consequences of theimproved description of SC compared to LFER-EP, we investi-gate the coverage effect on CO2 dissociative adsorption andelucidate the origin of the selectivity of CO and carbonaterather than oxalate formation over Ni(111).
5.1 Comparison of the potential dependence of adsorptionenergies in a vacuum and an implicit solvent
Fig. 2 shows the energetics and associated charge injectionDadsq in the case of CO2 and Na+ adsorption on Ni(111) as afunction of electrochemical potential in a vacuum (left) andwhen accounting for solvent effects through an implicit solvent(right). The charge injection is defined as the net charge appliedfor the considered potential for the chemisorbed system minusthat of the bare Ni(111) surface. It hence corresponds to the extracharge that needs to be injected in the presence of adsorbedspecies to maintain the potential constant. The LFER-EP frame-work is characterized by the distinction of elementary steps into‘‘chemical’’ and ‘‘electrochemical’’ steps. The former are rearrange-ments of nuclear coordinates, while the latter involve addition/substraction of an electron and its counterion, e.g., Na+ + e". Sinceelectron and cation transfer are strictly coupled, the injected chargeis simply 1 e" for electrochemical steps and 0 for chemical steps.As a consequence, only the reaction energies of electrochemicalsteps depend on the potential within the LFER-EP approach.Furthermore, all systems are electroneutral. Within the SCmodel, however, the number of electrons in the system isindividually adapted to every intermediate to tune the work-function to the specified level. Therefore, the chemical and electro-chemical steps are no longer formally separated from each other.In the text we will frequently refer to ‘‘oxalate’’ or ‘‘carbonate’’for species adsorbed on the surface. These adsorbates do notnecessarily have the ‘‘net’’ charge of the corresponding solutionspecies: the adsorbate and the electrode form one system and
the (surface) charge is a continuous function of the electro-chemical potential.
We start the comparison of the two methods for includingthe electrochemical potential first in a vacuum and only in asecond stage when accounting for solvent effects.
As a first example for a chemical step, consider the adsorp-tion of CO2 in the absence of Na+ co-adsorption: by construction,LFER-EP yields an adsorption energy which is independent of thepotential and the injected charge is strictly 0. However, whenco-adsorbing CO2 with Na+, we are confronted with an electro-chemical step within the LFER-EP framework, since cation andelectron transfer are coupled. The adsorption energy as a functionof potential has a slope of one, corresponding to the coupledelectron transfer. In the case of the SC model, the surfacecharge adapts to the potential. However, since charges are notwell stabilized in a vacuum, the charge variations compared toLFER-EP (strict coupling of electron and cation transfer), obtainedwith the surface charging method, are almost negligible (Fig. 2b):the maximum difference occurs for Na+ where the charge injec-tion is B 0.9 instead of 1. The number of injected electrons isthe main factor determining the potential dependence: accord-ing to eqn (5) the slope of DG(U) is, to first order, proportionalto the number of electrons injected. The inability of vacuum tostabilize charges implies that minor charge variations changethe potential considerably, leading to very small free energychanges due to potential alignment effects. Since at the sametime the electrons are only marginally better stabilized in onesystem than in the other (e.g., on CO2@Ni(111) compared to thebare surface), the adsorption energies barely change comparedto the zero charge (LFER-EP) results. In a vacuum, the systemsare thus effectively electroneutral and introducing a counterionis strongly coupled to an electron transfer. Hence, the potentialdependence for the more detailed SC method is very similar tothe simple LFER-EP method, i.e., adsorptions in the absenceof Na+ are basically horizontal lines, while the reductiveNa+ adsorption or co-adsorption leads to a strong potentialdependence with a slope of B1. Therefore, in a vacuum, wherecharge accumulation at metals is small, the LFER-EP is a veryreliable approximation.
Accounting for solvent effects leads to a very differentpicture when explicitly tuning the electrode potential, whilethe LFER-EP lines are quite similar to the ones in a vacuum: onFig. 2a (right) slopes of the thin lines are unchanged byconstruction, while intercepts are only affected in the case ofNa+ adsorption where the charge distribution is somewhatstabilized by the polarizable solvent. When applying the surfacecharging method, the dielectric medium stabilizes charges atthe interface, especially in the presence of adsorbates and as aresult the injected charge significantly deviates from the idealvalues of zero or 1. Equivalently one might say that the dielectricmedium increases the capacitance of the system. For chemisorbedCO2 or CO, O, the injected charge is significantly enhanced bythe solvent, up to a value of B0.2e", and hence the adsorptionenergy depends on the potential with a marked stabilization atnegative potentials, where CO2 or CO accumulates a negativecharge, which is stabilized by the solvent (Bader charges on the
Paper PCCP
Publ
ished
on
27 A
pril
2015
. Dow
nloa
ded
by B
iblio
theq
ue D
ider
ot d
e Ly
on o
n 30
/05/
2016
13:
18:4
0.
View Article Online
110 ∑Electrocatalysis
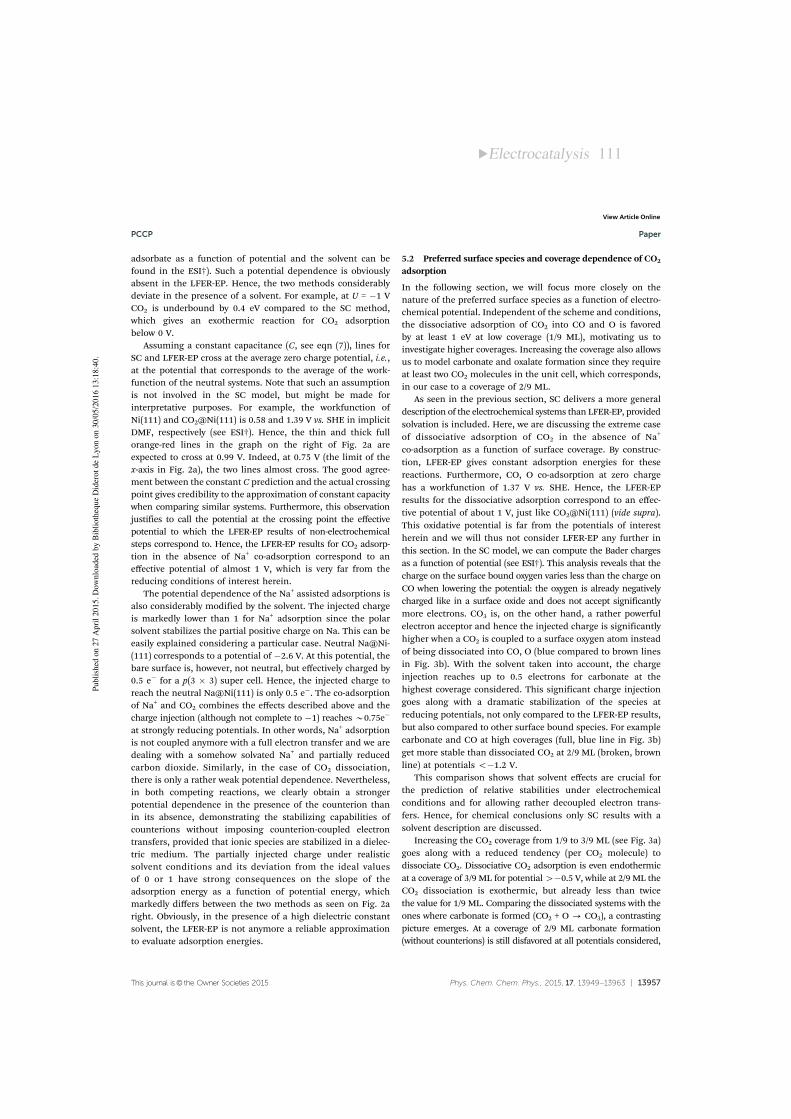
This journal is© the Owner Societies 2015 Phys. Chem. Chem. Phys., 2015, 17, 13949--13963 | 13957
adsorbate as a function of potential and the solvent can befound in the ESI†). Such a potential dependence is obviouslyabsent in the LFER-EP. Hence, the two methods considerablydeviate in the presence of a solvent. For example, at U = "1 VCO2 is underbound by 0.4 eV compared to the SC method,which gives an exothermic reaction for CO2 adsorptionbelow 0 V.
Assuming a constant capacitance (C, see eqn (7)), lines forSC and LFER-EP cross at the average zero charge potential, i.e.,at the potential that corresponds to the average of the work-function of the neutral systems. Note that such an assumptionis not involved in the SC model, but might be made forinterpretative purposes. For example, the workfunction ofNi(111) and CO2@Ni(111) is 0.58 and 1.39 V vs. SHE in implicitDMF, respectively (see ESI†). Hence, the thin and thick fullorange-red lines in the graph on the right of Fig. 2a areexpected to cross at 0.99 V. Indeed, at 0.75 V (the limit of thex-axis in Fig. 2a), the two lines almost cross. The good agree-ment between the constant C prediction and the actual crossingpoint gives credibility to the approximation of constant capacitywhen comparing similar systems. Furthermore, this observationjustifies to call the potential at the crossing point the effectivepotential to which the LFER-EP results of non-electrochemicalsteps correspond to. Hence, the LFER-EP results for CO2 adsorp-tion in the absence of Na+ co-adsorption correspond to aneffective potential of almost 1 V, which is very far from thereducing conditions of interest herein.
The potential dependence of the Na+ assisted adsorptions isalso considerably modified by the solvent. The injected chargeis markedly lower than 1 for Na+ adsorption since the polarsolvent stabilizes the partial positive charge on Na. This can beeasily explained considering a particular case. Neutral Na@Ni-(111) corresponds to a potential of "2.6 V. At this potential, thebare surface is, however, not neutral, but effectively charged by0.5 e" for a p(3 % 3) super cell. Hence, the injected charge toreach the neutral Na@Ni(111) is only 0.5 e". The co-adsorptionof Na+ and CO2 combines the effects described above and thecharge injection (although not complete to "1) reaches B0.75e"
at strongly reducing potentials. In other words, Na+ adsorptionis not coupled anymore with a full electron transfer and we aredealing with a somehow solvated Na+ and partially reducedcarbon dioxide. Similarly, in the case of CO2 dissociation,there is only a rather weak potential dependence. Nevertheless,in both competing reactions, we clearly obtain a strongerpotential dependence in the presence of the counterion thanin its absence, demonstrating the stabilizing capabilities ofcounterions without imposing counterion-coupled electrontransfers, provided that ionic species are stabilized in a dielec-tric medium. The partially injected charge under realisticsolvent conditions and its deviation from the ideal valuesof 0 or 1 have strong consequences on the slope of theadsorption energy as a function of potential energy, whichmarkedly differs between the two methods as seen on Fig. 2aright. Obviously, in the presence of a high dielectric constantsolvent, the LFER-EP is not anymore a reliable approximationto evaluate adsorption energies.
5.2 Preferred surface species and coverage dependence of CO2
adsorption
In the following section, we will focus more closely on thenature of the preferred surface species as a function of electro-chemical potential. Independent of the scheme and conditions,the dissociative adsorption of CO2 into CO and O is favoredby at least 1 eV at low coverage (1/9 ML), motivating us toinvestigate higher coverages. Increasing the coverage also allowsus to model carbonate and oxalate formation since they requireat least two CO2 molecules in the unit cell, which corresponds,in our case to a coverage of 2/9 ML.
As seen in the previous section, SC delivers a more generaldescription of the electrochemical systems than LFER-EP, providedsolvation is included. Here, we are discussing the extreme caseof dissociative adsorption of CO2 in the absence of Na+
co-adsorption as a function of surface coverage. By construc-tion, LFER-EP gives constant adsorption energies for thesereactions. Furthermore, CO, O co-adsorption at zero chargehas a workfunction of 1.37 V vs. SHE. Hence, the LFER-EPresults for the dissociative adsorption correspond to an effec-tive potential of about 1 V, just like CO2@Ni(111) (vide supra).This oxidative potential is far from the potentials of interestherein and we will thus not consider LFER-EP any further inthis section. In the SC model, we can compute the Bader chargesas a function of potential (see ESI†). This analysis reveals that thecharge on the surface bound oxygen varies less than the charge onCO when lowering the potential: the oxygen is already negativelycharged like in a surface oxide and does not accept significantlymore electrons. CO3 is, on the other hand, a rather powerfulelectron acceptor and hence the injected charge is significantlyhigher when a CO2 is coupled to a surface oxygen atom insteadof being dissociated into CO, O (blue compared to brown linesin Fig. 3b). With the solvent taken into account, the chargeinjection reaches up to 0.5 electrons for carbonate at thehighest coverage considered. This significant charge injectiongoes along with a dramatic stabilization of the species atreducing potentials, not only compared to the LFER-EP results,but also compared to other surface bound species. For examplecarbonate and CO at high coverages (full, blue line in Fig. 3b)get more stable than dissociated CO2 at 2/9 ML (broken, brownline) at potentials o"1.2 V.
This comparison shows that solvent effects are crucial forthe prediction of relative stabilities under electrochemicalconditions and for allowing rather decoupled electron trans-fers. Hence, for chemical conclusions only SC results with asolvent description are discussed.
Increasing the CO2 coverage from 1/9 to 3/9 ML (see Fig. 3a)goes along with a reduced tendency (per CO2 molecule) todissociate CO2. Dissociative CO2 adsorption is even endothermicat a coverage of 3/9 ML for potential 4"0.5 V, while at 2/9 ML theCO2 dissociation is exothermic, but already less than twicethe value for 1/9 ML. Comparing the dissociated systems with theones where carbonate is formed (CO2 + O - CO3), a contrastingpicture emerges. At a coverage of 2/9 ML carbonate formation(without counterions) is still disfavored at all potentials considered,
PCCP Paper
Publ
ished
on
27 A
pril
2015
. Dow
nloa
ded
by B
iblio
theq
ue D
ider
ot d
e Ly
on o
n 30
/05/
2016
13:
18:4
0.
View Article Online
∑Electrocatalysis 111
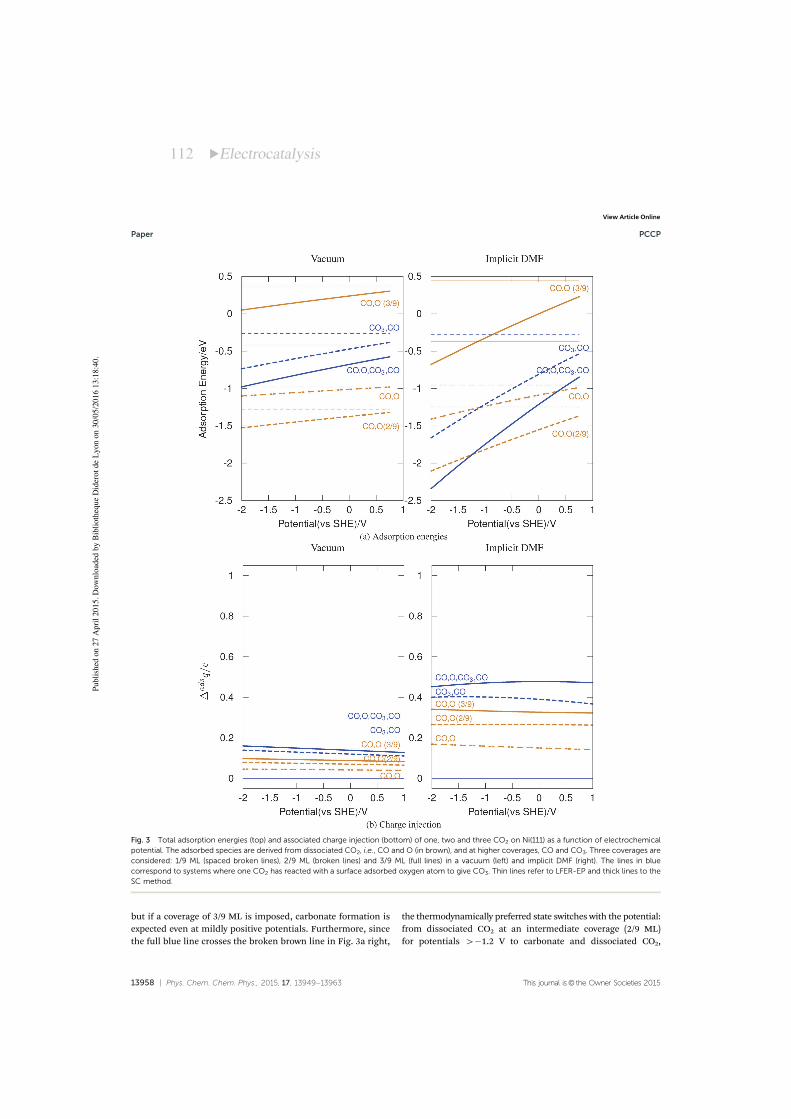
13958 | Phys. Chem. Chem. Phys., 2015, 17, 13949--13963 This journal is© the Owner Societies 2015
but if a coverage of 3/9 ML is imposed, carbonate formation isexpected even at mildly positive potentials. Furthermore, sincethe full blue line crosses the broken brown line in Fig. 3a right,
the thermodynamically preferred state switches with the potential:from dissociated CO2 at an intermediate coverage (2/9 ML)for potentials 4"1.2 V to carbonate and dissociated CO2,
Fig. 3 Total adsorption energies (top) and associated charge injection (bottom) of one, two and three CO2 on Ni(111) as a function of electrochemicalpotential. The adsorbed species are derived from dissociated CO2, i.e., CO and O (in brown), and at higher coverages, CO and CO3. Three coverages areconsidered: 1/9 ML (spaced broken lines), 2/9 ML (broken lines) and 3/9 ML (full lines) in a vacuum (left) and implicit DMF (right). The lines in bluecorrespond to systems where one CO2 has reacted with a surface adsorbed oxygen atom to give CO3. Thin lines refer to LFER-EP and thick lines to theSC method.
Paper PCCP
Publ
ished
on
27 A
pril
2015
. Dow
nloa
ded
by B
iblio
theq
ue D
ider
ot d
e Ly
on o
n 30
/05/
2016
13:
18:4
0.
View Article Online
112 ∑Electrocatalysis

This journal is© the Owner Societies 2015 Phys. Chem. Chem. Phys., 2015, 17, 13949--13963 | 13959
yielding higher coverages (3/9 ML), for potentials o"1.2 V. Thelatter is in fair agreement with the report of carbonate formationstarting around "1.5 V.15,19,89 Nevertheless, even at 3/9 MLcoverage, the dissociative adsorption of CO2 is exothermic atpotentials below "0.5 V in solution, suggesting that CO mightgenerally be a relevant intermediate in CO2 reduction over Ni, e.g.,even for C–C bond formation with alkenes.
From a chemical point of view we have learned two lessons:first, CO2 has a strong thermodynamic tendency to dissociateon Ni(111) at any potential considered. Nevertheless, stronglyreducing conditions are required to desorb reduced products(vide infra), i.e., the dissociation at anodic potentials is notcatalytic but just poisoning the catalyst surface. This tendencyto dissociate CO2 is well in line with the frequently reported COproduction during CO2 electroreduction over Ni15,19,89 and theuse of Ni as a catalyst at the cathode of solid oxide electrolyzersof CO2.90 Second, thermodynamically, the surface bound oxygencan be coupled to a second CO2 molecule yielding carbonates –and carbonate formation is favored at reducing potentials andhigh surface coverage.
5.2.1 Adsorption mode of oxalate. Above, we have focusedon CO2 dissociation and the formation of a C–O bond. As analternative, the reductive dimerization, i.e., the C–C bondformation yielding oxalate, has to be considered. When comparingthe relative stability of C2O4 with CO3, CO on Ni(111) one findsthat oxalates are much higher in energy than carbonates, whichis largely due to the important CO adsorption energy. Never-theless, the adsorption mode of oxalates serves as an examplefor a switch in the preferred adsorption mode (as opposed to aswitch in the preferred surface species) as a function of electro-chemical potential. Such a switch is, by definition, absent in theLFER-EP and thus illustrates the truly atomic, detailed under-standing which is obtained with the SC method.
Fig. 4 displays the geometries of oxalates either adsorbed‘‘flat’’, parallel, to the Ni(111) surface or slightly twisted,‘‘perpendicular’’, creating a strong surface dipole and Fig. 5shows their adsorption energies. The different magnitude ofthe surface dipole is also reflected by the workfunction, whichis 1.52 and 1.78 V vs. SHE for the parallel and perpendicularadsorption mode, respectively. The first observation is that withor without implicit solvent, the parallel adsorption mode isfavored in the zero charge picture, which is what would bediscussed in the context of the LFER-EP. However, whenaccounting for the potential dependence of the two adsorptionmodes, a crossing is obtained: in a vacuum, quite reducingpotentials (o"1.1 V) are necessary to stabilize the perpendicularmode. However, when accounting for the solvent, the situation iscompletely reversed: for potentials as high as 0.5 V the ‘‘perpendi-cular’’ mode is more stable, as now the charge accumulation ‘‘far’’from the surface is stabilized by the solvent. In addition, theenergy of the adsorbed species is markedly modified. For exam-ple, the surface charging method stabilizes oxalate by 0.7 eV at"1 V compared to the zero charge picture.
Unfortunately, this implies that the ‘‘zero charge’’ relativestabilities (here a difference of about 0.2 eV) are not necessarilyrepresentative for the relative stabilities under electrochemical
conditions. Therefore, even for the ‘‘conformational search’’the potential dependence would need to be accounted for.However, since this is associated with substantial effort, wehave limited ourselves herein to the lowest adsorption energy atzero charge. Further studies will try to establish a rapid pre-screening or a ‘‘predictive’’ scheme which exploits the work-function differences between competing adsorption modes inorder to identify the structures for which computing the potentialdependence is warranted.
5.3 Reaction energies for carbonate and oxalate formation
Carbonates are possibly formed at high coverages, even in theabsence of counterions. On the other hand, the simplest C–Ccoupling product, oxalate, seems to lie at considerably higherenergy. These findings raise the question: with the possibility ofstabilizing counterions, would carbonate form quantitatively orcould oxalate be dramatically stabilized?
To start with, we consider the reaction energy of the overallreactions starting from CO2 in the gas-phase
2CO2(g) + 2(Na+ + e") - Na2CO3(s) + CO(g)
2CO2(g) + 2(Na+ + e") - Na2C2O4(s)
yielding the Na2CO3(s) and Na2C2O4(s) salts, which are, forcomputational efficiency, modelled by perfect periodic crystals(see section Models). These salts are dissolved by high dielectricsolvents such as DMF. Hence, their true energy (e.g., as ionpairs in solution) is lower than assumed herein. These reactionenergies are given as a function of potential in thin brokenlines in Fig. 6. For the sake of consistency with the adsorptionenergies discussed above, reaction energies are ‘‘electronic’’energies, i.e., neglecting zero-point and thermal corrections.
If the overall reaction is uphill at potential U, then thereaction is unlikely to proceed at room temperature. Hence,we first investigate the overall thermodynamics of the quanti-tative formation of crystalline sodium carbonate and sodiumoxalate starting from CO2, Na+ and electrons at a potential Uthat is sufficiently reductive (see broken lines in Fig. 6). In thecase of carbonates, the side product is carbon monoxide, whichhas to be desorbed from the surface in order to close the catalyticcycle. This step is endothermic by about 1.9 eV and thereforethe formation of crystalline sodium carbonate requires a minimalpotential of "1.25 V for the combined reaction to be exothermic,in reasonable agreement with the reported onset potentialaround "1.5 V.15 Oxalate formation, on the other hand, isthermodynamically much more accessible: already at potentialslower than "0.6 V, the formation of sodium oxalate is thermo-dynamically feasible.
Fig. 4 ‘‘Perpendicular’’ and ‘‘parallel’’ adsorption modes of oxalate (C2O4)on Ni(111) on the left and right, respectively.
PCCP Paper
Publ
ished
on
27 A
pril
2015
. Dow
nloa
ded
by B
iblio
theq
ue D
ider
ot d
e Ly
on o
n 30
/05/
2016
13:
18:4
0.
View Article Online
∑Electrocatalysis 113

13960 | Phys. Chem. Chem. Phys., 2015, 17, 13949--13963 This journal is© the Owner Societies 2015
Since both carbonate and oxalate formation are surfaceassisted processes, the second relevant question is if thesereactions are feasible on the surface. Hence, we investigate
the transformation of chemisorbed CO2 into adsorbed pro-ducts. Depending on the potential, the reactant and/or theproducts are co-adsorbed with Na+ and the corresponding SC
Fig. 5 Adsorption energies of two CO2 molecules, in the form of oxalate as a function of electrochemical potential. The oxalate can be adsorbed‘‘parallel’’ to the nickel surface (dark green) or perpendicular (green). Thin lines refer to the zero charge picture while broken lines refer to the surfacecharging method. The graph on the left and right corresponds to vacuum and implicit DMF, respectively.
Fig. 6 Reaction energies of two CO2 as a function of electrochemical potential in a vacuum (left) and implicit DMF (right). Thick lines refer to reactionsstarting from chemisorbed CO2 yielding adsorbed products, e.g., CO3, CO (blue): 2COads
2 - CO, COads3 , with the number of co-adsorbed Na+ adapted
according to the potential. Thin lines refer to the overall reaction: isolated CO2 reacts with electrons and counterions to yield precipitated salts, e.g.,Na2C2O4(s) (dark-green): 2CO2(g) + 2Na+ + 2 e"- Na2C2O4(s). The vertical red lines indicate the point where the reactant changes from CO2, Na@Ni(111)to CO2@Ni(111).
Paper PCCP
Publ
ished
on
27 A
pril
2015
. Dow
nloa
ded
by B
iblio
theq
ue D
ider
ot d
e Ly
on o
n 30
/05/
2016
13:
18:4
0.
View Article Online
114 ∑Electrocatalysis

This journal is© the Owner Societies 2015 Phys. Chem. Chem. Phys., 2015, 17, 13949--13963 | 13961
reaction energies are represented in thick lines in Fig. 6.Concerning the reactant, the co-adsorption of CO2 with Na+ isfavored at stronlgy reducing potentials. This change in theenergy reference leads to a discontinuity in the reaction energiesand is indicated by a vertical line. Similarly, for each segment, themost stable product is indicated in Fig. 6 at the given coverage (i.e.2/9 ML): the number of co-adsorbed Na+ increases with moreand more reducing (more negative) potentials. These changesin the number of cations lead to the other discontinuities in thereaction energy. Since we are considering reaction energies, thereference energy is different from that of the preceding figures,which modifies the aspect of the potential dependence. Thepotential dependence of relative energies is directly related toworkfunction differences. The change in workfunction (potentialof zero charge) is often larger for an adsorption process than for asurface reaction. Therefore, the potential dependence of reactionenergies is often less pronounced than for adsorption energies.Nevertheless, since the workfunction still changes during a reac-tion, the SC method delivers more reliable results in general andwe are only showing and discussing these results.
The oxalate formation is shown as a green line in Fig. 6: atpotentials 4"0.5 V, Na+ does neither co-adsorb with thereactant nor with the product in vacuum and the formationof oxalate on the surface is endothermic. For lower potentials,one counterion is co-adsorbed with oxalate, but not with CO2,giving rise to the noticeable potential dependence of thereaction energy. Furthermore, at potentials lower than "0.9 V,the surface catalyzed reaction could take place at a reasonable ratesince it is exothermic, provided that there is chemisorbed CO2
available and not only CO and O. At potentials lower than"1.25 V, the reactant is CO2, co-adsorbed with Na+ that yieldssurface adsorbed sodium oxalate (Na2C2O4). However, thepotential dependence of the elementary reaction is almostnegligible in the absence of Na+ co-adsorption, i.e., the capaci-tance and workfunction of C2O4@Ni(111) are not significantlylarger than those of CO2@Ni(111). The situation for carbonateformation is similar to that for oxalate formation, except thatthermodynamically it is much more accessible on the surface,not the least because of the CO@Ni(111) byproduct. Hence,carbonate formation is preferred over oxalate formation on theNi(111) surface, although the overall reaction energy is less favor-able. Nevertheless, the dominating surface species down to"1.75 Vis CO, O, which itself might react with additional CO2 to yieldcarbonate, but is not expected to form oxalates.
Na+ co-adsorption provides less stability under solvent con-ditions than in a vacuum. For instance, surface adsorbedoxalate is stabilized by Na+ at potentials below "0.5 V invacuum, but only below "1.0 V in implicit DMF. As a conse-quence, the surface reaction forming C2O4 is isoenergetic atB"0.9 V in a vacuum, but it takes "1.9 V when solvating thesystems. Hence, oxalate formation on Ni(111) is even lessexpected under solvent conditions than in a vacuum. Further-more, adsorbed oxalate is more compact and thus less accessibleto the solvent than two chemisorbed CO2 molecules, resultingin a loss of solvation energy for oxalate formation. Althoughsimilar remarks apply to carbonate formation, the details differ
slightly, mostly because the solvent effect is enhanced forcarbonate compared to oxalate. Finally, the relative stabilityof CO, O (2/9 ML) compared to carbonate in solvent varies lesswith the potential than in vacuum. Nevertheless, at very redu-cing potentials carbonate formation becomes competitive withthe poisoning of the catalyst by the CO, O surface layer, just likein vacuum. Hence, the combination of unfavorable oxalateformation on the surface with the overwhelming competitionof CO2 dissociation and carbonate formation makes oxalateformation unlikely over a nickel catalyst despite a favorable overallreaction energy. In contrast, carbonate and carbon monoxideformation is likely at low potentials. This selectivity betweenthe two possible products of CO2 electroreduction under aproticconditions over Ni is in excellent agreement with experimentalobservations: oxalate formation accounts for less than 10% ofthe current density, while CO formation is the major productobserved under aprotic conditions.11,14,15
6 ConclusionInvestigating by first principles the intrinsic reactivity of CO2 onNi(111) under electrochemically reducing conditions in aproticmedia, we have compared two approaches that take the electro-chemical potential into account. Furthermore, the comparisonexploits a recently implemented implicit solvent model64 to movetowards more realistic conditions than vacuum.
The present study evidences that the zeroth order methodfor including the electrochemical potential (LFER-EP) is avaluable tool for quickly assessing the thermodynamic aspectsof electrocatalysis in vacuum, which often gives a good indica-tion of the processes under more realistic conditions. Forexample, this highly efficient approach correctly identifies thedissociative adsorption of CO2 yielding CO and O as exothermicat all relevant potentials and predicts the formation of carbo-nates, rather than oxalates, over Ni(111). This preference is dueto an insufficiently stabilizing interaction of oxalate with thesurface. The surface charging method (SC) allows us to vary thecharge on the adsorbates as a function of potential. Therefore,in contrast to the LFER-EP, which is limitted to cation coupledelectron transfers, the SC method stabilizes the chemisorptionof CO2 at reducing potentials even in the absence of counter-ions. While the LFER-EP results are insensitive to the inclusionof an implicit solvent description, the situation is dramaticallymodified when explicitly accounting for the electrochemicalpotential by charging the electrode. The solvent strongly increasesthe capacitance of the surface and hence the surface charge fora given bias potential. Even the rather simplistic solvationmodel applied herein gives rise to marked changes in electro-chemical reactivity compared to vacuum. Most strikingly, thecharge injection is system dependent and differs significantlyfrom the ideal values of 0 and 1. As a consequence, adsorptionenergies are potential dependent when accounting for solventeffects. This results, even in the absence of counterionco-adsorption, in a potential dependence of the most stablesurface species, e.g., the formation of carbonates rather than
PCCP Paper
Publ
ished
on
27 A
pril
2015
. Dow
nloa
ded
by B
iblio
theq
ue D
ider
ot d
e Ly
on o
n 30
/05/
2016
13:
18:4
0.
View Article Online
∑Electrocatalysis 115

13962 | Phys. Chem. Chem. Phys., 2015, 17, 13949--13963 This journal is© the Owner Societies 2015
just CO and O for coverages above 2/9 ML, and the preferredadsorption mode of oxalate, while such a dependency is inher-ently absent in LFER-EP. In summary, the SC method coupledwith an implicit solvent model gives access to a wealth ofdetailed information beyond the LFER-EP. Therefore, werecommend this more advanced, but still quite efficient, modelwhen seeking an understanding of the fundamental processesin an electrochemical interfacial system.
AcknowledgementsThe authors acknowledge Solvay for financial support. J.-S.Filhol and N. Lespes are thanked for help in setting up thesurface charging method and for fruitful discussions in theearly stage of composing the manuscript. The authors acknow-ledge computational resources generously provided by themesocenter PSMN. This work was granted access to the HPCresources of CINES and IDRIS under the allocation 2014-080609made by GENCI.
References1 K. S. Joya, Y. F. Joya, K. Ocakoglu and R. van de Krol, Angew.
Chem., Int. Ed., 2013, 52, 10426.2 A. J. Appleby, Catal. Rev., 1971, 4, 221.3 J. Bockris, Int. J. Hydrogen Energy, 1999, 24, 1.4 N. S. Lewis and D. G. Nocera, Proc. Natl. Acad. Sci. U. S. A.,
2006, 103, 15729.5 J. O. Bockris, Int. J. Hydrogen Energy, 2008, 33, 2129.6 D. Pletcher and J. Girault, J. Appl. Electrochem., 1986, 16, 791.7 J. Bringmann and E. Dinjus, Appl. Organomet. Chem., 2001,
15, 135.8 M. Gattrell, N. Gupta and A. Co, J. Electroanal. Chem., 2006,
594, 1.9 Y. Hori, Modern Aspects of Electrochemistry, Springer,
New York, Gaithersburg MD, 2008, ch. 3, p. 89.10 D. Canfield and K. W. Frese, J. Electrochem. Soc., 1983,
130, 1772.11 S. Ikeda, T. Takagi and K. Ito, Bull. Chem. Soc. Jpn., 1987,
60, 2517.12 D. T. Whipple and P. J. A. Kenis, J. Phys. Chem. Lett., 2010,
1, 3451.13 I. Ganesh, Renewable Sustainable Energy Rev., 2014, 31, 221.14 M. Jitaru, D. Lowy, M. Toma, B. Toma and L. Oniciu, J. Appl.
Electrochem., 1997, 27, 875.15 J.-P. Jones, G. K. S. Prakash and G. A. Olah, Isr. J. Chem.,
2014, 54, 1451.16 G.-Q. Yuan, H.-F. Jiang, C. Lin and S.-J. Liao, Electrochim.
Acta, 2008, 53, 2170.17 C.-H. Li, G.-Q. Yuan, X.-C. Ji, X.-J. Wang, J.-S. Ye and
H.-F. Jiang, Electrochim. Acta, 2011, 56, 1529.18 R. Matthessen, J. Fransaer, K. Binnemans and D. E. D. Vos,
RSC Adv., 2013, 3, 4634.19 T. Yamamoto, D. A. Tryk, K. Hashimoto, A. Fujishima and
M. Okawa, J. Electrochem. Soc., 2000, 147, 3393.
20 O. M. Magnussen, J. Hotlos, R. J. Nichols, D. M. Kolb andR. J. Behm, Phys. Rev. Lett., 1990, 64, 2929.
21 T. Iwasita and F. Nart, Prog. Surf. Sci., 1997, 55, 271.22 K. Jambunathan and A. C. Hillier, J. Electrochem. Soc., 2003,
150, E312.23 K. Jambunathan, S. Jayaraman and A. C. Hillier, Langmuir,
2004, 20, 1856.24 Y. X. Chen, M. Heinen, Z. Jusys and R. J. Behm, Angew.
Chem., Int. Ed., 2006, 45, 981.25 Y. Gorlin, B. Lassalle-Kaiser, J. D. Benck, S. Gul, S. M. Webb,
V. K. Yachandra, J. Yano and T. F. Jaramillo, J. Am. Chem.Soc., 2013, 135, 8525.
26 K. Letchworth-Weaver and T. A. Arias, Phys. Rev. B: Condens.Matter Mater. Phys., 2012, 86, 075140.
27 J. I. Siepmann and M. Sprik, J. Chem. Phys., 1995, 102, 511.28 S. Tazi, M. Salanne, C. Simon, P. Turq, M. Pounds and
P. A. Madden, J. Phys. Chem. B, 2010, 114, 8453.29 D. M. Bernardi and M. W. Verbrugge, J. Electrochem. Soc.,
1992, 139, 2477.30 W. Goddard, B. Merinov, A. van Duin, T. Jacob,
M. Blanco, V. Molinero, S. Jang and Y. Jang, Mol. Simul.,2006, 32, 251.
31 R. Ferreira de Morais, P. Sautet, D. Loffreda andA. A. Franco, Electrochim. Acta, 2011, 56, 10842.
32 K. Ito, S. Ikeda, N. Yamauchi, T. Iida and T. Takagi, Bull.Chem. Soc. Jpn., 1985, 58, 3027.
33 L. Sun, G. K. Ramesha, P. V. Kamat and J. F. Brennecke,Langmuir, 2014, 30, 6302.
34 B. Eneau-Innocent, D. Pasquier, F. Ropital, J.-M. Leger andK. B. Kokoh, Appl. Catal., B, 2010, 98, 65.
35 J. K. Norskov, J. Rossmeisl, A. Logadottir, L. Lindqvist,J. R. Kitchin, T. Bligaard and H. Jonsson, J. Phys. Chem. B,2004, 108, 17886.
36 J. S. Hummelshoj, J. Blomqvist, S. Datta, T. Vegge,J. Rossmeisl, K. S. Thygesen, A. C. Luntz, K. W. Jacobsenand J. K. Norskov, J. Chem. Phys., 2010, 132, 071101.
37 J. Greeley, J. K. Norskov and M. Mavrikakis, Annu. Rev. Phys.Chem., 2002, 53, 319.
38 V. Stamenkovic, B. S. Mun, K. J. J. Mayrhofer, P. N. Ross,N. M. Markovic, J. Rossmeisl, J. Greeley and J. K. Norskov,Angew. Chem., Int. Ed., 2006, 45, 2897.
39 J. Rossmeisl, Z.-W. Qu, H. Zhu, G.-J. Kroes and J. Norskov,J. Electroanal. Chem., 2007, 607, 83.
40 P. Ferrin, A. U. Nilekar, J. Greeley, M. Mavrikakis andJ. Rossmeisl, Surf. Sci., 2008, 602, 3424.
41 J. Greeley, I. E. Stephens, A. S. Bondarenko, T. P. Johansson,H. A. Hansen, T. F. Jaramillo, J. Rossmeisl, I. Chorkendorffand J. K. Norskov, Nat. Chem., 2009, 1, 552.
42 J. A. Keith, G. Jerkiewicz and T. Jacob, ChemPhysChem, 2010,11, 2779.
43 I. C. Man, H.-Y. Su, F. Calle-Vallejo, H. A. Hansen,J. I. Martinez, N. G. Inoglu, J. Kitchin, T. F. Jaramillo,J. K. Norskov and J. Rossmeisl, ChemCatChem, 2011, 3, 1159.
44 A. S. Bandarenka, A. S. Varela, M. Karamad, F. Calle-Vallejo,L. Bech, F. J. Perez-Alonso, J. Rossmeisl, I. E. L. Stephensand I. Chorkendorff, Angew. Chem., Int. Ed., 2012, 51, 11845.
Paper PCCP
Publ
ished
on
27 A
pril
2015
. Dow
nloa
ded
by B
iblio
theq
ue D
ider
ot d
e Ly
on o
n 30
/05/
2016
13:
18:4
0.
View Article Online
116 ∑Electrocatalysis

This journal is© the Owner Societies 2015 Phys. Chem. Chem. Phys., 2015, 17, 13949--13963 | 13963
45 J. Rossmeisl, J. K. Norskov, C. D. Taylor, M. J. Janik andM. Neurock, J. Phys. Chem. B, 2006, 110, 21833.
46 C. D. Taylor, S. A. Wasileski, J.-S. Filhol and M. Neurock,Phys. Rev. B: Condens. Matter Mater. Phys., 2006, 73, 165402.
47 A. Y. Lozovoi and A. Alavi, Phys. Rev. B: Condens. MatterMater. Phys., 2003, 68, 245416.
48 M. Otani and O. Sugino, Phys. Rev. B: Condens. Matter Mater.Phys., 2006, 73, 115407.
49 R. Jinnouchi and A. B. Anderson, Phys. Rev. B: Condens.Matter Mater. Phys., 2008, 77, 245417.
50 I. Dabo, B. Kozinsky, N. E. Singh-Miller and N. Marzari,Phys. Rev. B: Condens. Matter Mater. Phys., 2008, 77, 115139.
51 Y.-H. Fang and Z.-P. Liu, J. Phys. Chem. C, 2009, 113, 9765.52 M. Mamatkulov and J.-S. Filhol, Phys. Chem. Chem. Phys.,
2011, 13, 7675.53 I. Hamada, O. Sugino, N. Bonnet and M. Otani, Phys. Rev. B:
Condens. Matter Mater. Phys., 2013, 88, 155427.54 J.-S. Filhol and M. Neurock, Angew. Chem., Int. Ed., 2006,
45, 402.55 C. Taylor, R. G. Kelly and M. Neurock, J. Electrochem. Soc.,
2006, 153, E207.56 M. J. Janik and M. Neurock, Electrochim. Acta, 2007,
52, 5517.57 G. Rostamikia and M. J. Janik, Energy Environ. Sci., 2010,
3, 1262.58 S. A. Wasileski and M. J. Janik, Phys. Chem. Chem. Phys.,
2008, 10, 3613.59 K.-Y. Yeh and M. J. Janik, J. Comput. Chem., 2011, 32, 3399.60 J.-L. Fattebert and F. Gygi, Int. J. Quantum Chem., 2003,
93, 139.61 S. A. Petrosyan, A. A. Rigos and T. A. Arias, J. Phys. Chem. B,
2005, 109, 15436.62 Y.-H. Fang and Z.-P. Liu, J. Am. Chem. Soc., 2010, 132, 18214.63 O. Andreussi, I. Dabo and N. Marzari, J. Chem. Phys., 2012,
136, 064102.64 K. Mathew, R. Sundararaman, K. Letchworth-Weaver,
T. A. Arias and R. G. Hennig, J. Chem. Phys., 2014,140, 084106.
65 C. J. Cramer and D. G. Truhlar, Chem. Rev., 1999, 99, 2161.66 J. O. Bockris, A. K. N. Reddy and M. Gamboa-Aldeco, Modern
Electrochemistry 2A, Fundamental of Electrodics, KluwerAcademic Publishers, New York, 2002.
67 GoldBook, Standard Hydrogen electrode, http://goldbook.iupac.org/S05917.html.
68 C. P. Kelly, C. J. Cramer and D. G. Truhlar, J. Phys. Chem. B,2006, 110, 16066.
69 Y. P. Zhang, C. H. Cheng, J. T. Kim, J. Stanojevic andE. E. Eyler, Phys. Rev. Lett., 2004, 92, 203003.
70 If we use 2H+ + 2e" - H2 to estimate the energy of H2 atstandard conditions, we need the energy of the solvatedproton and the energy of the electrons. The hydration free
energy of the proton is estimated to be about "11.5 eV.68
Together with the electron potential of "4.44 V vs. vacuum,we get "31.88 eV, which is in good agreement with the‘‘quantum chemical estimate’’ of 2 % "13.6 eV (energy of ahydrogen atom) + "4.5 eV (binding energy of the hydrogenmolecule69) = "31.7 eV.
71 In the generalization of the CHE to an arbitrary referencecouple (see ref. 36) the severeness of this approximation ismost clearly visible: the zero charge energy of a systemalways corresponds to the reversible potential of the refer-ence redox couple. For example the zero charge energy ofCO2@Ni corresponds to 0 V, if we consider a hydrogenation,but to "2.7 V if we consider a reduction with sodium.
72 S. A. Wasileski, M. T. M. Koper and M. J. Weaver, J. Am.Chem. Soc., 2002, 124, 2796.
73 A. Panchenko, M. T. M. Koper, T. E. Shubina, S. J. Mitchelland E. Roduner, J. Electrochem. Soc., 2004, 151, A2016.
74 M. P. Hyman and J. W. Medlin, J. Phys. Chem. B, 2005,109, 6304.
75 S. A. Wasileski and M. J. Weaver, J. Phys. Chem. B, 2002,106, 4782.
76 J.-S. Filhol and M.-L. Doublet, Catal. Today, 2013, 202, 87.77 J.-S. Filhol and M.-L. Doublet, J. Phys. Chem. C, 2014,
118, 19023.78 Y.-H. Fang, G.-F. Wei and Z.-P. Liu, J. Phys. Chem. C, 2014,
118, 3629.79 R. C. Catapan, A. A. M. Oliveira, Y. Chen and D. G. Vlachos,
J. Phys. Chem. C, 2012, 116, 20281.80 E. Westphal and J. R. Pliego, J. Chem. Phys., 2005,
123, 074508.81 M. Dusek, G. Chapuis, M. Meyer and V. Petricek, Acta
Crystallogr., Sect. B: Struct. Sci., 2003, 59, 337.82 D. A. Reed and M. M. Olmstead, Acta Crystallogr., Sect. B:
Struct. Crystallogr. Cryst. Chem., 1981, 37, 938.83 J. P. Perdew, K. Burke and M. Ernzerhof, Phys. Rev. Lett.,
1996, 77, 3865.84 P. E. Blochl, Phys. Rev. B: Condens. Matter Mater. Phys., 1994,
50, 17953.85 G. Kresse and D. Joubert, Phys. Rev. B: Condens. Matter
Mater. Phys., 1999, 59, 1758.86 G. Kresse and J. Hafner, Phys. Rev. B: Condens. Matter Mater.
Phys., 1993, 47, 558.87 G. Kresse and J. Furthmuller, Phys. Rev. B: Condens. Matter
Mater. Phys., 1996, 54, 11169.88 D. Gunceler, K. Letchworth-Weaver, R. Sundararaman,
K. A. Schwarz and T. A. Arias, Modell. Simul. Mater. Sci.Eng., 2013, 21, 074005.
89 K. Hara, A. Kudo and T. Sakata, J. Electroanal. Chem., 1995,391, 141.
90 R. J. Lim, M. Xie, M. A. Sk, J.-M. Lee, A. Fisher, X. Wang andK. H. Lim, Catal. Today, 2014, 233, 169.
PCCP Paper
Publ
ished
on
27 A
pril
2015
. Dow
nloa
ded
by B
iblio
theq
ue D
ider
ot d
e Ly
on o
n 30
/05/
2016
13:
18:4
0.
View Article Online
∑Electrocatalysis 117

Modeling the HCOOH/CO2 Electrocatalytic Reaction: WhenDetails Are KeyStephan N. Steinmann,[a] Carine Michel,[a, b] Renate Schwiedernoch,[c] Jean-Sebastien Filhol,[d]
and Philippe Sautet*[a, b]
Our first principles simulations of the electrooxidation offormic acid over nickel identify the reorientation of the formateintermediate and the desorption of CO2 as the rate-limitingsteps. Although they are not associated with an electron trans-fer, these barriers are strongly modified when the electrochem-ical potential is explicitly accounted for and when modelingthe influence of the solvent. Hence, such a level of modeling iskey to understand the kinetic limitations that penalize the re-action.
Formic acid is an attractive fuel for direct fuel cells, avoidingthe delicate storage and transportation of hydrogen and ideal-ly even yielding 0.2 V higher cell potentials.[1, 2] To be a carbonneutral fuel, formic acid could be generated from CO2, whichcan either be achieved chemically through hydrogenation,[3, 4]
or by the reasonably efficient electroreduction of CO2, whichcan benefit from temporary excesses in wind or solarpower.[5, 6] From a chemical point of view, the electrochemicaltransformation of CO2 into formic acid and vice versa has theunique advantage that the CO2 skeleton does not need to bebroken or formed, which limits the byproducts compared tothe transformation of CO2 into less oxygenated compounds.Hence, developing efficient processes for those two electro-chemical reactions is a timely challenge.
Atomic scale modeling complements the experimental effortto understand and improve the efficiency of catalysis. In partic-ular, first principles studies are key to give credibility to experi-mental hypotheses in electrochemistry, where in situ character-izations are extremely challenging. For example, the debateabout the active intermediates of the electrooxidation of
formic acid over platinum is still ongoing, despite significantprogress in both experimental and theoretical understanding.[7]
In particular, earlier claims about the negligible reactivity offormate[8] have been challenged by the identification of thedouble role of (solution) formate: first, formate is weakly ad-sorbed and then it is oxidized (decoupled electron protontransfer).[9] Second, co-adsorption of formate with itself, likethe co-adsorption of formate with other anions, is proposed tostabilize the CˇH down adsorption mode (orientation 5 inFigure 1, see below), which is the active intermediate that un-dergoes oxidation to CO2.[10, 11]
In the present study, we investigate the activity of earthabundant and cheap nickel catalysts for the electrooxidation offormic acid and the electroreduction of CO2 to formic acid.Nickel is commonly used in heterogeneous catalysts for the hy-drogenation of carbon dioxide to methane,[12] for dry reform-ing,[13] solid oxide electrolyzers for the conversion of CO2 intoCO,[14] and solid oxide fuel cells,[15] which can be fed withformic acid.[16] Although pure nickel is not very active for theelectrooxidation of formic acid, that is, the kinetics are slow atan onset potential of about 0.3 V versus SHE,[17] nickel alloysare highly active electrocatalysts for the oxidation of formicacid.[17–20] Nevertheless, theoretical electrochemical studies forthe electrooxidation of formic acid have, so far, focused onplatinum.[7, 21–23] Hence, the investigation of nickel is overdue asa next step towards understanding the improved activity ofalloys of Ni with Pt and Pd. Note that Ni surfaces are likely tobe passivated by NiO layers under oxidizing, acidic condi-tions.[24] However, one might expect that Ni alloys with thenoble Pt and Pd metals will not suffer from this deactivation.Therefore, we investigate metallic Ni rather than NiO in thismodel study on the influence of the electrochemical potential.
The major challenge for the description of electrochemistryat the periodic density functional theory (DFT) level is the in-corporation of the electrochemical potential. The computation-al hydrogen electrode[25] (CHE) is the first successful model[26–29]
to allow a link to be made between routine computations invacuum and electrochemical experiments. The stunning sim-plicity of the CHE comes with two major drawbacks : first,proton- and electron-transfer are strictly coupled, and second,the use of CHE implies that computed barriers of elementaryreactions are not affected by the electrochemical potential. Toovercome these drawbacks, several advanced and computa-tionally more involved models have been proposed.[30–38]
Here, we investigate the reaction mechanism of the decom-position of formic acid into CO2 at a Ni(111) model surface. Asthe reverse reaction is also of considerable interest, we also
[a] Dr. S. N. Steinmann, Dr. C. Michel, Dr. P. SautetUniversitÿ de Lyon, Ecole Normale Supÿrieure de LyonLaboratoire de Chimie, 46 allee d’Italie, Lyon (France)E-mail : [email protected]
[b] Dr. C. Michel, Dr. P. SautetCNRS, Laboratoire de Chimie, UMR 518246 allee d’Italie, Lyon (France)
[c] Dr. R. SchwiedernochEco-Efficient Products and Processes Laboratory (E2P2 L)UMI 3464 Solvay/CNRSShanghai (PR China)
[d] Dr. J.-S. FilholCTMM, Institut Charles Gerhardt Montpellier UMR 5253Universite Montpellier 2Place E Bataillon, Montpellier (France)
Supporting Information for this article is available on the WWW underhttp://dx.doi.org/10.1002/cphc.201500187.
ChemPhysChem 2015, 16, 2307 – 2311 ⌫ 2015 Wiley-VCH Verlag GmbH & Co. KGaA, Weinheim2307
CommunicationsDOI: 10.1002/cphc.201500187
118 ∑Electrocatalysis
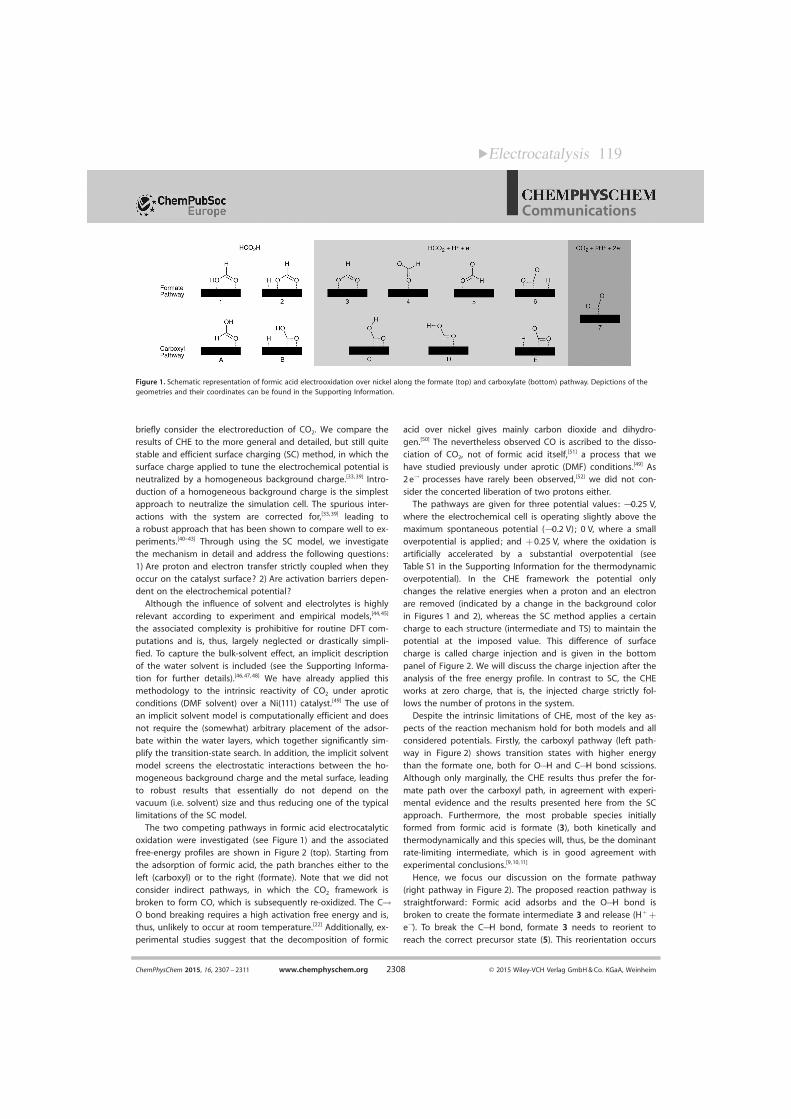
briefly consider the electroreduction of CO2. We compare theresults of CHE to the more general and detailed, but still quitestable and efficient surface charging (SC) method, in which thesurface charge applied to tune the electrochemical potential isneutralized by a homogeneous background charge.[33, 39] Intro-duction of a homogeneous background charge is the simplestapproach to neutralize the simulation cell. The spurious inter-actions with the system are corrected for,[33, 39] leading toa robust approach that has been shown to compare well to ex-periments.[40–43] Through using the SC model, we investigatethe mechanism in detail and address the following questions:1) Are proton and electron transfer strictly coupled when theyoccur on the catalyst surface? 2) Are activation barriers depen-dent on the electrochemical potential?
Although the influence of solvent and electrolytes is highlyrelevant according to experiment and empirical models,[44, 45]
the associated complexity is prohibitive for routine DFT com-putations and is, thus, largely neglected or drastically simpli-fied. To capture the bulk-solvent effect, an implicit descriptionof the water solvent is included (see the Supporting Informa-tion for further details).[46, 47, 48] We have already applied thismethodology to the intrinsic reactivity of CO2 under aproticconditions (DMF solvent) over a Ni(111) catalyst.[49] The use ofan implicit solvent model is computationally efficient and doesnot require the (somewhat) arbitrary placement of the adsor-bate within the water layers, which together significantly sim-plify the transition-state search. In addition, the implicit solventmodel screens the electrostatic interactions between the ho-mogeneous background charge and the metal surface, leadingto robust results that essentially do not depend on thevacuum (i.e. solvent) size and thus reducing one of the typicallimitations of the SC model.
The two competing pathways in formic acid electrocatalyticoxidation were investigated (see Figure 1) and the associatedfree-energy profiles are shown in Figure 2 (top). Starting fromthe adsorption of formic acid, the path branches either to theleft (carboxyl) or to the right (formate). Note that we did notconsider indirect pathways, in which the CO2 framework isbroken to form CO, which is subsequently re-oxidized. The CˇO bond breaking requires a high activation free energy and is,thus, unlikely to occur at room temperature.[22] Additionally, ex-perimental studies suggest that the decomposition of formic
acid over nickel gives mainly carbon dioxide and dihydro-gen.[50] The nevertheless observed CO is ascribed to the disso-ciation of CO2, not of formic acid itself,[51] a process that wehave studied previously under aprotic (DMF) conditions.[49] As2 eˇ processes have rarely been observed,[52] we did not con-sider the concerted liberation of two protons either.
The pathways are given for three potential values: ˇ0.25 V,where the electrochemical cell is operating slightly above themaximum spontaneous potential (ˇ0.2 V) ; 0 V, where a smalloverpotential is applied; and + 0.25 V, where the oxidation isartificially accelerated by a substantial overpotential (seeTable S1 in the Supporting Information for the thermodynamicoverpotential). In the CHE framework the potential onlychanges the relative energies when a proton and an electronare removed (indicated by a change in the background colorin Figures 1 and 2), whereas the SC method applies a certaincharge to each structure (intermediate and TS) to maintain thepotential at the imposed value. This difference of surfacecharge is called charge injection and is given in the bottompanel of Figure 2. We will discuss the charge injection after theanalysis of the free energy profile. In contrast to SC, the CHEworks at zero charge, that is, the injected charge strictly fol-lows the number of protons in the system.
Despite the intrinsic limitations of CHE, most of the key as-pects of the reaction mechanism hold for both models and allconsidered potentials. Firstly, the carboxyl pathway (left path-way in Figure 2) shows transition states with higher energythan the formate one, both for OˇH and CˇH bond scissions.Although only marginally, the CHE results thus prefer the for-mate path over the carboxyl path, in agreement with experi-mental evidence and the results presented here from the SCapproach. Furthermore, the most probable species initiallyformed from formic acid is formate (3), both kinetically andthermodynamically and this species will, thus, be the dominantrate-limiting intermediate, which is in good agreement withexperimental conclusions.[9, 10, 11]
Hence, we focus our discussion on the formate pathway(right pathway in Figure 2). The proposed reaction pathway isstraightforward: Formic acid adsorbs and the OˇH bond isbroken to create the formate intermediate 3 and release (H+ +eˇ). To break the CˇH bond, formate 3 needs to reorient toreach the correct precursor state (5). This reorientation occurs
Figure 1. Schematic representation of formic acid electrooxidation over nickel along the formate (top) and carboxylate (bottom) pathway. Depictions of thegeometries and their coordinates can be found in the Supporting Information.
ChemPhysChem 2015, 16, 2307 – 2311 www.chemphyschem.org ⌫ 2015 Wiley-VCH Verlag GmbH & Co. KGaA, Weinheim2308
Communications
∑Electrocatalysis 119

in two steps (from 3 to 4 then to 5) and is associated witha high energy barrier, which originates from the substantialstabilization of the bidentate binding mode of formate tometal surfaces, as extensively discussed previously for Pt.[21, 22]
After reorientation, the CˇH bond breaks easily, producingchemisorbed CO2 (7), which then has to desorb. The rate-limit-ing TS, which, together with the low-lying formate inter-mediate 3, defines the energetic span of the reaction,[53] de-pends on the potential : at positive potentials, it is associatedwith the reorientation of formate (TSrot’), whereas at the idealpotential of ˇ0.2 V, it is found to be the TS for CO2 desorption(TSdes).
CO2 desorption is particularly crucial when considering thereverse process. Indeed, to perform the electrochemical reduc-tion of CO2 into formic acid, the working potential needs to benegative to compensate for the endothermicity of the reaction.
Under these conditions, the sit-uation is relatively simple (seethe Supporting Information forthe corresponding reactionenergy profile): the limiting tran-sition state is the chemisorptionof CO2 and formate is the limit-ing intermediate. Unfortunately,the chemisorption barrier is es-sentially independent of the po-tential, and thus, responsible fora significant kinetic limitation onthe Ni(111) surface. Hence, tofind more active electrocatalystsfor CO2 reduction, the initial ad-sorption barrier needs to be low-ered. Analysis of the Fukui func-tion might provide further in-sights for designing improvedcatalysts,[54] for example, by al-loying, which is also the mostpromising strategy to destabilizethe formate intermediate.
We now analyze the mainsteps for formic acid oxidation inmore detail. In broad terms, theSC and CHE results are consis-tent. However, the SC resultsprovide a more nuanced pictureof the formate oxidation path, inparticular for the chemical steps,such as the CO2 desorption andthe formate reorientation.
The CO2 chemisorption is anendothermic process and wefind a barrier of almost 0.5 eV atzero charge. The importance ofthis barrier for CO2 adsorptionhas not been underlined in theliterature to our knowledge. Inthe desorption direction, the
barrier is smaller (0.2 eV) and, as no coupled proton–electrontransfer is involved in this process, the CHE results suggestthat the situation is identical under electrochemical conditions.However, according to the SC method, chemisorbed CO2 is sta-bilized by 0.1 eV at ˇ0.25 V, which increases this potential-de-pendent desorption barrier by 50 % compared to the CHE re-sults. The reorientation of formate is the other chemical stepthat is sensitive to the inclusion of the electrochemical poten-tial. If the energy profiles for the CHE (thin lines; Figue 2) andSC (thick lines) method are similar until species 4, the constantpotential mode of SC stabilizes the TS for formate reorientationby 0.3 eV (TSrot’). The difference between the two methods ismaximal at TSCH and disappears, by construction, upon CO2 de-sorption. As a consequence, the potential at which the limitingtransition state becomes CO2 desorption is predicted to be lessnegative within the SC than the CHE framework.
Figure 2. Top) Free energy profile for formic acid electrooxidation relative to the reference for oxidation [RefO ;formic acid and a slab of Ni(111)] according to the CHE (thin lines) and SC (thick lines) approach at three differentelectrochemical potentials (vs. SHE): 0 V, + 0.25 V (where the oxidation is artificially accelerated) and ˇ0.25 V(where the electrochemical cell is operating slightly above the maximum spontaneous potential). The path to theright goes through formate and the alternative carboxyl path is shown on the left. Note that until the firstproton-coupled electron transfer occurs (change from white to gray background) all the CHE lines overlap by con-struction. The second formally electrochemical step is indicated by a background color change from light to darkgray. Bottom) Charge injection along the paths. Charge injection in the CHE approach is strictly coupled to protontransfer, and thus, does not depend on the potential.
ChemPhysChem 2015, 16, 2307 – 2311 www.chemphyschem.org ⌫ 2015 Wiley-VCH Verlag GmbH & Co. KGaA, Weinheim2309
Communications
120 ∑Electrocatalysis

We next analyze the varying surface charge. CHE assumesthat electrons are released abruptly in electrochemical steps,with 1 eˇ released when entering the light gray zone anda second one in the dark gray zone of the bottom panel ofFigure 2. The SC method mostly follows these steps in chargeinjection, but with notable deviations by up to 0.25 eˇ . Thecharge injection (Dadsq) gives the charge injected into a systemwith respect to the metal surface at the same potential, andaligns the Fermi level of the systems, thus keeping the poten-tial constant. As the capacitances of all involved systems, in-cluding the reference Ni surface, are similar, the Dadsq valuesbarely depend on the electrochemical potential. In our case,rotating and oxidizing bidentately bound formate 3, that is,breaking the CˇH bond, also requires a counterintuitive chargeinjection (i.e. a partial reduction) of about 0.2 eˇ . ChemisorbedCO2 requires a charge injection of about 0.2 eˇ , which can beeasily explained:[55, 56] both the bent geometry (see the Sup-porting Information) and the analysis of the electronic struc-ture[55] provide evidence that the metal surface donates elec-tron density to CO2, forming a formal CO2
ˇ ion that interactswith the surface. Indeed, bending CO2 becomes energeticallyfavorable upon reduction, creating a dipole moment and lift-ing the degeneracy of the LUMO orbital of CO2. This statecrossing requires significant electronic reorganization from thehighly polar chemisorbed CO2 state to the apolar solvated CO2
state. Thus, the large deformation energy in the transitionstate is not compensated by the incipient electron transfer, re-sulting in the observed activated adsorption/desorption pro-cess. Note that the implicit solvent does not accurately capturethe large solvent reorganization energy upon desorption andthe presented barrier might, therefore, be under estimated.
Some models that go beyond the simplest application ofCHE to obtain potential dependent barriers, assume that thebarriers of the nominally electrochemical step are dependenton the potential.[57, 28] In the present case, those steps are thebreaking of the CˇH and OˇH bonds, leading to the release ofthe couple (H+ , eˇ). Considering Figure 2, the situation is notthat clear cut. In the formate pathway (on the right), accordingto the SC model, the potential has the largest influence on the“chemical step”: the transition state of the reorientation of for-mate TSrot’ is lowered by 0.3 eV, compared with CHE, at 0 Vversus SHE. This reorientation causes a change in the surfacedipole, and thus, in the workfunction (Figure 3, see below).The accompanying charge injection of 0.25 eˇreflects the par-tial negative charging of mono-dentately bound formate 5, inagreement with the postulatedimportance of weakly bound for-mate.[10, 11] As explained above,this charge injection is retainedafter CO2 formation, to stabilizeits bent form.
As seen in the preceding dis-cussion, the potential depend-ence of elementary steps doesnot seem to be only related toH+-formation steps, that is, the
breaking of the CˇH or OˇH bond. However, what is at theorigin of the potential dependence? Liu and co-workers haveproposed[58] that the potential dependence of an elementaryreaction is directly related to the difference in the workfunc-tion (DW) of the involved species at zero charge. Figure 3traces the potential of zero charge (i.e. the workfunction)along the reaction path. Indeed, the largest jumps in the work-function occur for adsorption/desorption processes, for TSrot’,and for TSOH, which correspond to the steps that are sensitiveto the potential. More precisely, DW is linearly correlated tothe derivative with respect to the potential of the differencebetween SC and CHE, whereas the difference between SC andCHE is a quadratic function of DW (see the Supporting Infor-mation, Figures S3–S5). Furthermore, the workfunctionchanges (DW) are, as expected,[59] roughly anticorrelated to thedipole moment of the (neutral) adsorbates (see Figure 3). Al-though not quantitative, monitoring the surface dipole allowsthe quick identification of the elementary steps when CHEmight not be a good approximation.
In summary, we presented potential-dependent reaction bar-riers for the conversion of formic acid over nickel in implicitwater, comparing the popular CHE method (zero charge) withthe more detailed SC model (constant potential). The keypoints of the mechanism are consistent between the twomethods: formate is the main intermediate and the reactionrequires a certain overpotential to proceed. The most impor-tant barriers, which explain the low activity of Ni at its onsetpotential, are found for “chemical steps” that are also the mostsensitive steps towards the electrochemical potential, that is,the desorption of CO2, together with the energetically unfavor-able reorientation of formate, which is associated with a dra-matic change in the surface dipole moment.
Hence, explicitly accounting for the electrode potential em-phasizes the complexity of heterogeneous electrocatalysis andour results highlight the benefit of going beyond the CHEwhen seeking a detailed and realistic description of electro-chemistry on metal electrodes. Monitoring the surface dipoleallows the quick identification of elementary steps, for whichthe CHE might not be a good approximation, and opens theway to using a combination of the CHE model, to quicklyscreen the reaction network, and the SC model to refine thekey steps.
Figure 3. Evolution of the potential of zero charge, that is, the workfunction (left axis, full lines), and of the dipolemoment of the adsorbate (right axis, broken lines) along the electrooxidation pathway of formic acid. The formatepathway is shown on the right and the alternative carboxyl path is shown on the left.
ChemPhysChem 2015, 16, 2307 – 2311 www.chemphyschem.org ⌫ 2015 Wiley-VCH Verlag GmbH & Co. KGaA, Weinheim2310
Communications
∑Electrocatalysis 121

Acknowledgements
The authors acknowledge Solvay for financial support. Computa-tional resources generously provided by the mesocenter PSMN(PÙle Scientifique de Modÿlisation Numÿrique). This work wasgranted access to the HPC resources of CINES (Centre Informa-tique National de l’Enseignement Supÿrieur) and IDRIS (Institutdu dÿveloppement et des ressources en informatique scientifique)under the allocation 2014-080609 made by GENCI (Grand ÿquipe-ment national de calcul intensif).
Keywords: density functional calculations · electrocatalysis ·electrochemistry · formic acid · heterogeneous catalysis
[1] C. Rice, S. Ha, R. Masel, P. Waszczuk, A. Wieckowski, T. Barnard, J. PowerSources 2002, 111, 83.
[2] X. Yu, P. G. Pickup, J. Power Sources 2008, 182, 124.[3] S. Enthaler, J. von Langermann, T. Schmidt, Energy Environ. Sci. 2010, 3,
1207.[4] B. Loges, A. Boddien, F. Gartner, H. Junge, M. Beller, Top. Catal. 2010, 53,
902.[5] D. T. Whipple, P. J. A. Kenis, J. Phys. Chem. Lett. 2010, 1, 3451.[6] A. S. Agarwal, Y. Zhai, D. Hill, N. Sridhar, ChemSusChem 2011, 4, 1301.[7] W. Gao, E. H. Song, Q. Jiang, T. Jacob, Chem. Eur. J. 2014, 20, 11005.[8] Y. X. Chen, M. Heinen, Z. Jusys, R. J. Behm, Angew. Chem. Int. Ed. 2006,
45, 981; Angew. Chem. 2006, 118, 995.[9] A. Cuesta, G. Cabello, M. Osawa, C. Gutirrez, ACS Catal. 2012, 2, 728.
[10] J. Joo, T. Uchida, A. Cuesta, M. T. M. Koper, M. Osawa, J. Am. Chem. Soc.2013, 135, 9991.
[11] J. V. Perales-RondÛn, E. Herrero, J. M. Feliu, Electrochim. Acta 2014, 140,511.
[12] W. Wang, S. Wang, X. Ma, J. Gong, Chem. Soc. Rev. 2011, 40, 3703.[13] M. Mikkelsen, M. Jorgensen, F. C. Krebs, Energy Environ. Sci. 2010, 3, 43.[14] R. J. Lim, M. Xie, M. A. Sk, J.-M. Lee, A. Fisher, X. Wang, K. H. Lim, Catal.
Today 2014, 233, 169.[15] B. C. H. Steele, A. Heinzel, Nature 2001, 414, 345.[16] Y. Chen, C. Su, T. Zheng, Z. Shao, J. Power Sources 2012, 220, 147.[17] C. Du, M. Chen, W. Wang, G. Yin, P. Shi, Electrochem. Commun. 2010, 12,
843.[18] R. F. Wang, H. Wang, H. Q. Feng, S. Ji, Int. J. Electrochem. Sci. 2013, 8,
6068.[19] L. Shen, H. Li, L. Lu, Y. Luo, Y. Tang, Y. Chen, T. Lu, Electrochim. Acta
2013, 89, 497.[20] B. T. Sneed, A. P. Young, D. Jalalpoor, M. C. Golden, S. Mao, Y. Jiang, Y.
Wang, C.-K. Tsung, ACS Nano 2014, 8, 7239.[21] M. Neurock, M. Janik, A. Wieckowski, Faraday Discuss. 2009, 140, 363.[22] W. Gao, J. A. Keith, J. Anton, T. Jacob, J. Am. Chem. Soc. 2010, 132,
18377.[23] A. B. Anderson, H. A. Asiri, Phys. Chem. Chem. Phys. 2014, 16, 10587.[24] J. Scherer, B. Ocko, O. Magnussen, Electrochim. Acta 2003, 48, 1169.[25] J. K. Nørskov, J. Rossmeisl, A. Logadottir, L. Lindqvist, J. R. Kitchin, T. Bli-
gaard, H. Jonsson, J. Phys. Chem. B 2004, 108, 17886.
[26] V. Stamenkovic, B. S. Mun, K. J. J. Mayrhofer, P. N. Ross, N. M. Markovic, J.Rossmeisl, J. Greeley, J. K. Norskov, Angew. Chem. Int. Ed. 2006, 45, 2897;Angew. Chem. 2006, 118, 2963.
[27] J. Greeley, I. E. L. Stephens, A. S. Bondarenko, T. P. Johansson, H. A.Hansen, T. F. Jaramillo, J. Rossmeisl, I. Chorkendorff, J. K. Nørskov, Nat.Chem. 2009, 1, 552.
[28] J. A. Keith, G. Jerkiewicz, T. Jacob, ChemPhysChem 2010, 11, 2779.[29] A. S. Bandarenka, A. S. Varela, M. Karamad, F. Calle-Vallejo, L. Bech, F. J.
Perez-Alonso, J. Rossmeisl, I. E. L. Stephens, I. Chorkendorff, Angew.Chem. Int. Ed. 2012, 51, 11845; Angew. Chem. 2012, 124, 12015.
[30] A. B. Anderson, T. V. Albu, J. Am. Chem. Soc. 1999, 121, 11855.[31] A. Y. Lozovoi, A. Alavi, Phys. Rev. B 2003, 68, 245416.[32] M. Otani, O. Sugino, Phys. Rev. B 2006, 73, 115407.[33] C. D. Taylor, S. A. Wasileski, J.-S. Filhol, M. Neurock, Phys. Rev. B 2006, 73,
165402.[34] E. SkÇlason, G. S. Karlberg, J. Rossmeisl, T. Bligaard, J. Greeley, H. JÛns-
son, J. K. Norskov, Phys. Chem. Chem. Phys. 2007, 9, 3241.[35] Y.-H. Fang, Z.-P. Liu, J. Phys. Chem. C 2009, 113, 9765.[36] S. Schnur, A. Gross, Catal. Today 2011, 165, 129.[37] J.-S. Filhol, M.-L. Doublet, Catal. Today 2013, 202, 87.[38] N. Bonnet, I. Dabo, N. Marzari, Electrochim. Acta 2014, 121, 210.[39] M. Mamatkulov, J.-S. Filhol, Phys. Chem. Chem. Phys. 2011, 13, 7675.[40] J.-S. Filhol, M. Neurock, Angew. Chem. Int. Ed. 2006, 45, 402; Angew.
Chem. 2006, 118, 416.[41] J. Rossmeisl, J. K. Norskov, C. D. Taylor, M. J. Janik, M. Neurock, J. Phys.
Chem. B 2006, 110, 21833.[42] M. J. Janik, M. Neurock, Electrochim. Acta 2007, 52, 5517.[43] G. Rostamikia, M. J. Janik, Energy Environ. Sci. 2010, 3, 1262.[44] J. I. Siepmann, M. Sprik, J. Chem. Phys. 1995, 102, 511.[45] S. Tazi, M. Salanne, C. Simon, P. Turq, M. Pounds, P. A. Madden, J. Phys.
Chem. B 2010, 114, 8453.[46] K. Letchworth-Weaver, T. A. Arias, Phys. Rev. B 2012, 86, 075140.[47] D. Gunceler, K. Letchworth-Weaver, R. Sundararaman, K. A. Schwarz,
T. A. Arias, Modell. Simul. Mater. Sci. Eng. 2013, 21, 074005.[48] K. Mathew, R. Sundararaman, K. Letchworth-Weaver, T. A. Arias, R. G.
Hennig, J. Chem. Phys. 2014, 140, 084106.[49] S. N. Steinmann, C. Michel, R. Schwiedernoch, P. Sautet, Phys. Chem.
Chem. Phys. 2015, 17, 13949 – 13963.[50] R. J. Ruka, L. O. Brockway, J. E. Boggs, J. Am. Chem. Soc. 1959, 81, 2930.[51] J. B. Benziqer, G. R. Schoofs, J. Phys. Chem. 1984, 88, 4439.[52] M. T. Koper, J. Electroanal. Chem. 2011, 660, 254.[53] S. Kozuch, S. Shaik, Acc. Chem. Res. 2011, 44, 101.[54] J.-S. Filhol, M.-L. Doublet, J. Phys. Chem. C 2014, 118, 19023.[55] H.-J. Freund, R. Messmer, Surf. Sci. 1986, 172, 1.[56] S.-G. Wang, X.-Y. Liao, D.-B. Cao, C.-F. Huo, Y.-W. Li, J. Wang, H. Jiao, J.
Phys. Chem. C 2007, 111, 16934.[57] X. Nie, M. R. Esopi, M. J. Janik, A. Asthagiri, Angew. Chem. Int. Ed. 2013,
52, 2459; Angew. Chem. 2013, 125, 2519.[58] Y.-H. Fang, G.-F. Wei, Z.-P. Liu, J. Phys. Chem. C 2014, 118, 3629.[59] H. P. Bonzel, G. Pirug, J. E. Muller, Phys. Rev. Lett. 1987, 58, 2138.
Received: March 3, 2015Revised: April 29, 2015Published online on June 10, 2015
ChemPhysChem 2015, 16, 2307 – 2311 www.chemphyschem.org ⌫ 2015 Wiley-VCH Verlag GmbH & Co. KGaA, Weinheim2311
Communications
122 ∑Electrocatalysis

5
PERSPECTIVES
The short term perspectives are obviously dictated by my on-goingprojects. With Mascat, I will join my expertise in homogeneous catal-ysis with the one gained in heterogeneous catalysis for the characteri-zation and the development of novel supported metathesis catalysts incollaboration with Pr. Ch. Copéret and Dr. O. Safonova from Zurich.Shapes is dedicated to the amination of alcohols using an H-transferstrategy. On this typical example of hydrogen transfer reactions inheterogenous catalysis, we will develop a screening in silico of cata-lysts based on a descriptor-based approach coupled with a micro-kineticmodel. This strategy is built on the current PhD work of A. Dumon andwill be highly valuable for Solvay, our industrial partner. Music willdevelop the methodological framework to tackle the challenging studyof the reactivity of polyols at the metal/water interface. Last, Tanopolwill target two major challenges in metal supported catalysis: (i) under-standing the processes underlying the synthesis of the nanoparticles (ii)rationalizing the structure/activity relationships.
In those on-going projects are en-rooted my research perspectiveson a longer term. For the selective conversion of cellulosic biomass,water is the solvent of choice. It is ideal as a green solvent, that perfectlysolubilises the oxygenates derived from cellulose. However, water canalso strongly modify the catalytic activity and stability of the hetero-geneous catalysts traditionally used for the upgrade of the petroleumfeedstock. In addition, the pH can also play a role: for instance, the
123

124 ∑Perspectives
oxidation of alcohols into carboxylic acid is generally performed usingmetallic supported catalysts such as Au, Pt or Pd, and require the addi-tion of a strong base such as NaOH, generating a carboxylate salt. Thissalt is then hydrolyzed yielding carboxylic acid and one equivalent ofinert salt. For a greener process with a better atom economy, this saltgeneration should be avoided. Despite a constant effort in the domain,no catalyst can avoid the usage of a base keeping a reasonable conver-sion and yield. Accordingly, the electro-oxidation of polyols is mostlybased on the same metal supported catalysts (Au, Pd, Pt and combina-tion of those three metals in bimetallic or alloys catalysts). Based onthe development foreseen in the Music project, we will tackle the reac-tivity at the metal/water interface, hopefully including pH and potentialeffects in the simulations. Those studies should open the door to a morerational development of oxidation catalysts for cellulosic biomass up-grade, the simulations being at the intercrossing between heterogeneouscatalysis and electro-catalysis.
In parallel to the development of solvatation models for heteroge-neous interfaces, I would like also to address the key challenge of aconstant improvement of the quality of the model of the catalyst inits steady state. Surface species – spectator or not – can tune the cat-alytic activity of heterogeneous catalysts. Similarly, reactant, product orcounter ions can modify the coordination sphere of the catalytic site in asingle site catalyst. The inclusion of those influences can be key in un-derstanding the physics underlying the catalytic activity. Fro instance,during the PhD project of A. Dumon, we have recently demonstratedthat one needs to include chemisorbed ammonia to appropriately de-scribe the hydrogen transfer process from alcohol to the intermediateimine. We expect that the ligands used to shape the metallic nanocat-alysts in Tanopol could also affect the catalytic activity, opening thedoor to new strategies to design catalysts. Not only ligands but alsospecies generated in the transient regime can impact the steady state(formate in the hydrogen transfer from formic acid, etc.). To identifythose species, we will couple DFT studies with micro-kinetics or even

∑Perspectives 125
kinetic Monte Carlo simulations: the efficient self-consistent couplingof several scales of simulations will be highly challenging and valuablefor the incoming years in the domain of catalysts modeling.

126 ∑Perspectives

Curriculum Vitae
Education
2004–2007 Doctorate in Theoretical ChemistryTheoretical Studies of chemical reactivity: from static methodsto metadynamics, under the supervision of Pr. Anne MILET,defended the 27/06/2007, Université Joseph Fourier, Grenoble,France ; financed by the Ministry of Education.
2000–2004 Élève normalienne de l’ENS de LyonRecruited on the first competitive exam in Physics/Chemistry
2004 Master in Molecular and Structural Physical ChemistryUniversité Joseph Fourier - Grenoble 1
2004 Agrégation de Sciences Physiques, option chimie
2002 Maîtrise in Physical ChemistryENS de Lyon/Université Claude Bernard - Lyon 1
2001 Licence in Physical ChemistryENS de Lyon/Université Claude Bernard - Lyon 1
1998–2000 Classes Préparatoires aux Grandes Écoles (PCSI/PC*)Lycée Berthollet, Annecy (74).
1998 Baccalauréat, série S, option Physique-Chimie
127

128 ∑Curriculum Vitae
Research Positions
Oct 2009 - Chargée de Recherche CNRS , Lyon, FranceComputational Studies across catalysisLaboratoire de Chimie, ENS de Lyon, Lyon, France
Sep. 2008 -Oct. 2009 Agrégée préparateur , Lyon, FranceReactivity of alcohols at metallic surfacesLaboratoire de Chimie, ENS de Lyon, Lyon, France.
Sep. 2007– Aug. 2008 PostDoc , Amsterdam, Pays-BasElectronic structure and catalysisPr. E.J. Baerends, Vrieje Universiteit, Amsterdam, The Nether-lands
Sep. 2004 – Aug. 2007 PhD in Theoretical Chemistry , Grenoble,FranceTheoretical Studies of chemical reactivity: from static methods tometadynamicsunder the supervision of Pr. A. Milet, Département de ChimieMoléculaire, Grenoble, France.
R&D projects funded throughcompetitive calls
ANR Contracts
GALAC 2011-2014 co-PIFrom glycerol to acrylic acid via lactic acid
SHAPes 2013-2017 co-PINovel Selective Heterogeneous Amination Processes for the Syn-thesis of Bio-based Monomers
∑Curriculum Vitae 129
MASCAT 2014-2018 French PI, in collaboration with SwitzerlandMetathesis Supported Catalysis
MUSIC 2014-2018 French co-PI, in collaboration with USAMultiscale Simulations of Bifunctional Catalysis ? Application tothe Hydrodeoxygenation of Molecules Extracted From Biomass
International Collaborations
PHC Polonium 2012-2014 Agnieszka Ruppert, Łódz, PolandOne-pot GVL production from sugars
PHC De Staël 2014-2016 Marcella Iannuzzi, Zurich, SwitzerlandReactivity at the solid/liquid interface: Better simulation for abetter comprehension.
LIA Funcat 2013-2017 Pr. Tom Baker, Pr. Javier Giorgi, Pr. ElenaBaranova, Ottawa, Canada.Fundamental catalysis for green chemistry: From well-definedactive sites to mechanistic explorations
PHC Polonium 2015-2017 Agnieszka Ruppert, Łódz, PolandHydrogen transfer reactions
Industrial Contracts
Rhodia 2012 -2013 18 months PostDocMechanisms in catalytic oxidation
Solvay 2013-2014 12 months PostDocElectrochemical valorisation of CO2
CNRS-Solvay 2013/16 1 PhDSelective amination of alcohols

130 ∑Curriculum Vitae
Responsibilities
Seminars Co-organisation of weekly seminars since 2013
Conseil du Laboratoire Member since 2016.
Website of the Theoretical Chemistry group since 2013
PhD Comitee Member : Florian Auneau (2011) ; Jijin Wang (2013); Jérémie Zaffran (2014) ; Kim Larmier (2015) ; Sarah Gautier(2015).
Referee
• Journals: ChemSusChem, ACS Catalysis, Journal of Physi-cal Chemistry, Journal Of Molecular Modeling, etc.
• Price: Europacat Young award
• Conferences: ECOSS 2016 panel
Organisation and Scientific Committee Member
• "Catalysis training course", 28/08/13-31/08/13, Lyon ; 80participants internationaux
• "Computational Studies across catalysis", 13/03/2016 –17/03/2016, Symposium at the 251th ACS Meeting
• "Rencontres des Chimistes Théoriciens Francophones2016", 27/06/2016 - 01/07/2016
Distinctions
2015 Médaille de Bronze du CNRS 2015

∑Curriculum Vitae 131
Experience supervising doctoral thesisand/or final year projects
Doctoral theses
Florian Auneau (20%), Ministry od Education, defended 17/10/11
Jérémie Zaffran, (50%), ANR GALAC, defended 20/04/14
Alexandre Dumon, (80%), BDI CNRS-Solvay, defense scheduled inSeptember 2016
Romain Réocreux, (100%), Ministry of Education (LIA Funcat), de-fense scheduled in June 2017
Benjamin Schweitzer, (100%), ANR MUSIC, defense scheduled inSeptember 2018
Evans Monyoncho (10%) PhD, uOttawa, Canada
Post-doctorates
Prokopis Andrikopoulos, CNRS-Rhodia, 18 months, 2012-2013
Stephan Steinmann, ENSL-Solvay, 36 months, 2013-2014
Rodrigo Ferreira De Morais, ANR, 12 months, 2015-2016
Tao Wang, ANR, 18 months, 2015-2017
Undergraduates and Experimental PhD
Lise Morlet, L3, Ecole Normale Supérieure de Lyon, 2 months, 2009
Leila Sadr Arani, M2, Université Claude Bernard, 5 months, 2010
Siwar Shibani, M2, Université Claude Bernard, 5 months, 2011

132 ∑Curriculum Vitae
Kahina Aitatmane, PhD, Université Paris Diderot, 1 month, 2011
Sarah Saadek, L2, uOttawa, Canada, 2 months, 2012
Mathilde Iachella, M1, Université Paris Diderot, 3 months, 2012
Joanna Matras, PhD, Łódz Technical University, Poland, 2 months,2012
Thomas Konincks, M1, Université de Toulouse, 3 months, 2013
Alexandra Anghel, L2, uOttawa, Canada, 2 months, 2013
Romain Réocreux, M2, ENS de Lyon, 6 months, 2014
Joshua Pocher, PhD, Marburg University, Allemagne, 1 month, 2014
Minh Huynh, L3, uOttawa, Canada, 3 months, 2014
Ahmad Galuta, L3, uOttawa, Canada, 2 months, 2014
Aghiles Ouldhamou, Master, uOttawa, Canada, 2 months, 2014
Kuncheng Li, M2, Université Claude Bernard, 5 months, 2015
Natalia Potrzebowska, Master, Łódz Technical University, Poland, 2months, 2015
Kamila Kazmierczak, Master, Łódz Technical University, Poland, 2months, 2015
Quingyi Gu, M2, ENS de Lyon, 6 months, 2016
Teaching
Few hours per year at the ENS de Lyon
Course in a Summer school (2013, 2015)

∑Curriculum Vitae 133
Popularization
Fête de la SciencePromoting Science and Chemistry using the Foldit Project
Année Mondiale de la Chimie (2011)Three presentations in High School in the framework "Leschercheurs s’invitent au lycée" organized by the CNRS
High school visitorsI have hosted high school students for a week.

134 ∑Curriculum Vitae

Publication List
37 articles ; H-index=16 ; 660 citations (GoogleScholar data, Re-searcher id G-3769-2011)
[1] T. J. M. de Bruin, C. Michel, K. Vekey, A. E. Greene, Y. Gimbert,and A. Milet. First C-C bond formation in the Pauson-Khandreaction: Influence of carbon-carbon triple bond polarization onregiochemistry - a density functional theory study. Journal ofOrganometallic Chemistry. 2006, 691, 4281–4288. Times Cited:22.
[2] T. Godet, C. Vaxelaire, C. Michel, A. Milet, and P. Belmont. Sil-ver versus gold catalysis in tandem reactions of carbonyl func-tions onto alkynes: A versatile access to furoquinoline and pyra-noquinoline cores. Chemistry-a European Journal. 2007, 13,5632–5641. Times Cited: 99.
[3] C. Michel, T. Godet, M.-L. Dheu-Andries, P. Belmont, andA. Milet. Theoretical study of the cyclization of carbonylgroups on unactivated alkynyl-quinolines in the gas phase andin methanol solution. Journal of Molecular Structure-Theochem.2007, 811, 175–182. Times Cited: 2.
[4] C. Michel, A. Laio, F. Mohamed, M. Krack, M. Parrinello, andA. Milet. Free energy ab initio metadynamics: A new tool for thetheoretical study of organometallic reactivity? Example of the C-C and C-H reductive eliminations from platinum(IV) complexes.Organometallics. 2007, 26, 1241–1249. Times Cited: 35.
135

136 ∑Publication List
[5] K. Selmeczi, C. Michel, A. Milet, I. Gautier-Luneau,C. Philouze, J.-L. Pierre, D. Schnieders, A. Rompel, andC. Belle. Structural, kinetic, and theoretical studies on models ofthe zinc-containing phosphodiesterase active center: Medium-dependent reaction mechanisms. Chemistry-a European Journal.2007, 13, 9093–9106. Times Cited: 41.
[6] C. Michel and A. Milet. Free energy calculation of the effectsof the fluorinated phosphorus ligands on the C-H and C-C reduc-tive elimination from pt(IV). Journal of Molecular Structure-Theochem. 2008, 852, 54–61. Times Cited: 6 32nd Congressof Theoretical Chemists of Latin Expression SEP 01-06, 2006Cotes de Carthage, TUNISIA.
[7] S. Stecko, K. Pasniczek, C. Michel, A. Milet, S. Perez, andM. Chmielewski. A DFT study of 1,3-dipolar cycloaddition reac-tions of 5-membered cyclic nitrones with alpha,beta-unsaturatedlactones and with cyclic vinyl ethers: Part I. Tetrahedron-Asymmetry. 2008, 19, 1660–1669. Times Cited: 16.
[8] S. Stecko, K. Pasniczek, C. Michel, A. Milet, S. Perez, andM. Chmielewski. A DFT study of 1,3-dipolar cycloadditionsof cyclic nitrones to unsaturated lactones. part II. Tetrahedron-Asymmetry. 2008, 19, 2140–2148. Times Cited: 15.
[9] W. Zeghida, J. Debray, C. Michel, A. Milet, P. Dumy, and M. De-meunynck. Synthesis of N-acridinyl-N ’-alkylguanidines: Dra-matic influence of amine to guanidine replacement on the physic-ochemical properties. Bioorganic & Medicinal Chemistry Let-ters. 2008, 18, 4779–4782. Times Cited: 3.
[10] C. Michel and E. J. Baerends. What singles out the FeO(2+)moiety? a density-functional theory study of the methane-to-methanol reaction catalyzed by the first row transition-metal ox-

∑Publication List 137
ide dications MO(H2O)2+p
, M = V-Cu. Inorganic Chemistry.2009, 48, 3628–3638. Times Cited: 49.
[11] C. Michel, P. Belanzoni, P. Gamez, J. Reedijk, and E. J.Baerends. Activation of the C-H bond by electrophilic attack:Theoretical study of the reaction mechanism of the aerobic ox-idation of alcohols to aldehydes by the Cu(bipy)(2+)/2,2,6,6-Tetramethylpiperidinyl-1-oxy cocatalyst system. InorganicChemistry. 2009, 48, 11909–11920. Times Cited: 61.
[12] C. Michel, A. Laio, and A. Milet. Tracing the entropy along areactive pathway: The energy as a generalized reaction coordi-nate. Journal of Chemical Theory and Computation. 2009, 5,2193–2196. Times Cited: 8.
[13] J. I. Rodriguez, R. F. W. Bader, P. W. Ayers, C. Michel, A. W.Gotz, and C. Bo. A high performance grid-based algorithm forcomputing QTAIM properties. Chemical Physics Letters. 2009,472, 149–152. Times Cited: 46.
[14] R. E. Bulo, H. Van Schoot, D. Rohr, and C. Michel. Bias-exchange metadynamics applied to the study of chemical reac-tivity. International Journal of Quantum Chemistry. 2010, 110,2299–2307. Times Cited: 0 SI 13th International Conference onApplication of the Density Functional Theory to Chemistry andPhysics AUG 31-SEP 01, 2009 Lyon, FRANCE.
[15] F. Auneau, C. Michel, F. Delbecq, C. Pinel, and P. Sautet. Unrav-elling the mechanism of glycerol hydrogenolysis over rhodiumcatalyst through combined experimental-theoretical investiga-tions. Chemistry-a European Journal. 2011, 17, 14288–14299.Times Cited: 53.
[16] P. Belanzoni, C. Michel, and E. J. Baerends.Cu(bipy)(2+)/TEMPO-catalyzed oxidation of alcohols: Radical

138 ∑Publication List
or nonradical mechanism? Inorganic Chemistry. 2011, 50,11896–11904. Times Cited: 20.
[17] E. Dumont, C. Michel, and P. Sautet. Unraveling gold(I)-specificaction towards peptidic disulfide cleavage: A DFT investigation.Chemphyschem. 2011, 12, 2596–2603. Times Cited: 2.
[18] C. Michel, F. Auneau, F. Delbecq, and P. Sautet. C-H versus O-Hbond dissociation for alcohols on a Rh(111) surface: A strong as-sistance from hydrogen bonded neighbors. ACS Catalysis. 2011,1, 1430–1440. Times Cited: 28.
[19] F. Auneau, L. Sadr Arani, M. Besson, L. Djakovitch, C. Michel,F. Delbecq, P. Sautet, and C. Pinel. Heterogeneous transforma-tion of glycerol to lactic acid. Topics in Catalysis. 2012, 55,474–479. Times Cited: 24.
[20] S. Chibani, C. Michel, F. Delbecq, C. Pinel, and M. Besson. Onthe key role of hydroxyl groups in platinum-catalysed alcohol ox-idation in aqueous medium. Catalysis Science and Technology.2012, 3, 339–350. Times Cited: 21.
[21] P. Fleurat-Lessard, C. Michel, and R. E. Bulo. Energy extrapo-lation schemes for adaptive multi-scale molecular dynamics sim-ulations. Journal of Chemical Physics. 2012, 137, year. Timescited: 6.
[22] C. Michel, F. Göltl, and P. Sautet. Early stages of water/hydroxylphase generation at transition metal surfaces - synergetic adsorp-tion and O-H bond dissociation assistance. Physical ChemistryChemical Physics. 2012, 14, 15286–15290. Times Cited: 16.
[23] R. E. Bulo, C. Michel, P. Fleurat-Lessard, and P. Sautet. Multi-scale modeling of chemistry in water: Are we there yet? Jour-nal of Chemical Theory and Computation. 2013, 9, 5567–5577.Times Cited: 19.

∑Publication List 139
[24] D. Loffreda, C. Michel, F. Delbecq, and P. Sautet. Tuning cat-alytic reactivity on metal surfaces: Insights from DFT. Journalof Catalysis. 2013, 308, 374–385. Times Cited: 10.
[25] K. Ait Atmane, C. Michel, J.-Y. Piquemal, P. Sautet, P. Beau-nier, M. Giraud, M. Sicard, S. Nowak, R. Losno, and G. Viau.Control of the anisotropic shape of cobalt nanorods in the liquidphase: from experiment to theory... and back. Nanoscale. 2014,6, 2682–2692. Times Cited: 6.
[26] W. Guo, C. Michel, R. Schwiedernoch, R. Wischert, X. Xu, andP. Sautet. Formation of acrylates from ethylene and CO2 onNi complexes: A mechanistic viewpoint from a hybrid DFT ap-proach. Organometallics. 2014, 33, 6369–6380. Times Cited:8.
[27] C. Michel, J. Zaffran, A. M. Ruppert, J. Matras-Michalska,M. Jedrzejczyk, J. Grams, and P. Sautet. Role of water on metalcatalyst performance for ketone hydrogenation. a join experi-mental and theoretical study on levulinic acid conversion intogamma-valerolactone. Chemical Communications. 2014, 50,12450–12453. Times Cited: 17.
[28] J. Zaffran, C. Michel, F. Auneau, F. Delbecq, and P. Sautet. Lin-ear energy relations as predictive tools for polyalcohol catalyticreactivity. ACS Catalysis. 2014, 4, 464–468. Times Cited: 8.
[29] P. C. Andrikopoulos, C. Michel, S. Chouzier, and P. Sautet. In sil-ico screening of iron-oxo catalysts for C-H bond cleavage. ACSCatalysis. 2015, 5, 2490–2499. Times Cited: 4.
[30] S. Gautier, S. N. Steinmann, C. Michel, P. Fleurat-Lessard, andP. Sautet. Molecular adsorption at Pt(111). how accurate are DFTfunctionals? Physical Chemistry Chemical Physics. 2015, 17,28921–28930. Times Cited: 0.

140 ∑Publication List
[31] M. A. Lemes, A. Pialat, S. N. Steinmann, I. Korobkov, C. Michel,and M. Murugesu. Study of a novel hepta-coordinated feiiibimetallic complex with an unusual 1,2,4,5-tetrazine-ring open-ing. Polyhedron. 2015.
[32] C. Michel and P. Gallezot. Why is ruthenium an efficient cata-lyst for the aqueous-phase hydrogenation of biosourced carbonylcompounds? ACS Catalysis. 2015, 5, 4130–4132. Times Cited:7.
[33] S. N. Steinmann, C. Michel, R. Schwiedernoch, J.-S. Filhol, andP. Sautet. Modeling the HCOOH/CO2 electrocatalytic reaction:When details are key. Chemphyschem. 2015, 16, 2307–2311.Times Cited: 5.
[34] S. N. Steinmann, C. Michel, R. Schwiedernoch, and P. Sautet.Impacts of electrode potentials and solvents on the electroreduc-tion of CO2: a comparison of theoretical approaches. PhysicalChemistry Chemical Physics. 2015, 17, 13949–13963. TimesCited: 5.
[35] J. Zaffran, C. Michel, F. Delbecq, and P. Sautet. Trade-off be-tween accuracy and universality in linear energy relations for al-cohol dehydrogenation on transition metals. Journal of PhysicalChemistry C. 2015, 119, 12988–12998. Times Cited: 2.
[36] A. M. Ruppert, M. Jedrzejczyk, O. Sneka-Platek, N. Keller, A. S.Dumon, C. Michel, P. Sautet, and J. Grams. Ru catalysts for lev-ulinic acid hydrogenation with formic acid as a hydrogen source.Green Chemistry. 2016. Times Cited: 1.
[37] S. N. Steinmann, C. Michel, R. Schwiedernoch, M. Wu, andP. Sautet. Electro-carboxylation of butadiene and ethene overPt and Ni catalysts. Journal of Catalysis. 2016.