Studies of insulin resistance in patients with clinical and subclinical hypothyroidism
6
AUTHOR COPY ONLY CLINICAL STUDY Studies of insulin resistance in patients with clinical and subclinical hyperthyroidism Eirini Maratou 1 , Dimitrios J Hadjidakis 2 , Melpomeni Peppa 2 , Maria Alevizaki 3 , Katerina Tsegka 2 , Vaia Lambadiari 2 , Panayota Mitrou 1 , Eleni Boutati 2 , Anastasios Kollias 2 , Theofanis Economopoulos 2 , Sotirios A Raptis 1,2 and George Dimitriadis 2 1 Hellenic National Center for Research, Prevention and Treatment of Diabetes Mellitus and its Complications (HNDC), GR-10675 Athens, Greece, 2 Second Department of Internal Medicine, Research Institute and Diabetes Center, ‘Attikon’ University Hospital, Athens University, 1 Rimini Street, GR-12462 Haidari, Greece and 3 Endocrine Unit, Department of Clinical Therapeutics, Athens University, GR-11528 Athens, Greece (Correspondence should be addressed to G Dimitriadis; Email: [email protected] , [email protected]) Abstract Objective: Although clinical hyperthyroidism (HR) is associated with insulin resistance, the information on insulin action in subclinical hyperthyroidism (SHR) is limited. Design and methods: To investigate this, we assessed the sensitivity of glucose metabolism to insulin in vivo (by an oral glucose tolerance test) and in vitro (by measuring insulin-stimulated rates of glucose transport in isolated monocytes) in 12 euthyroid subjects (EU), 16 patients with HR, and 10 patients with SHR. Results: HR and SHR patients displayed higher postprandial glucose levels (area under the curve, AUC 0–300 32 190G1067 and 31 497G716 mg/dl min respectively) versus EU (27 119 G1156 mg/dl min, P!0.05). HR but not SHR patients displayed higher postprandial insulin levels (AUC 0–300 11 020G985 and 9565G904 mU/l min respectively) compared with EU subjects (AUC 0–300 7588G743 mU/l min, P!0.05). Homeostasis model assessment index was increased in HR and SHR patients (2.81G0.3 and 2.43G0.38 respectively) compared with EU subjects (1.27 G0.16, P!0.05), while Matsuda and Belfiore indices were decreased in HR (4.21G0.41 and 0.77G0.05 respectively, P!0.001) and SHR patients (4.47G0.33 and 0.85G0.05 respectively, P!0.05 versus EU (7.76G0.87 and 1 respectively). At 100 mU/ml insulin, i) GLUT3 levels on the monocyte plasma membrane were increased in HR (468.8G7 mean fluorescence intensity (MFI)) and SHR patients (522.2G25 MFI) compared with EU subjects (407G18 MFI, P!0.01 and P!0.05 respectively), ii) glucose transport rates in monocytes (increases from baseline) were decreased in HR patients (37.8G5%) versus EU subjects (61.26G10%, P!0.05). Conclusions: Insulin-stimulated glucose transport in isolated monocytes of patients with HR was decreased compared with EU subjects. Insulin resistance was comparable in patients with both HR and SHR. European Journal of Endocrinology 163 625–630 Introduction In clinical hyperthyroidism (HR), impaired glucose tolerance and inulin resistance are frequent findings (1–5). In HR, tissue metabolic rate increases signi- ficantly (1). To adapt to high energy demand, cellular rates of basal and insulin-stimulated glucose disposal are generally elevated to increase the rates of lactate formation and glucose oxidation; lactate is then used by the liver to increase the rates of gluconeogenesis and endogenous glucose production (1, 2). Subclinical hyperthyroidism (SHR) is defined as decreased plasma TSH levels in the presence of normal levels of free thyroxine (FT 4 ) and free triiodothyronine (FT 3 ). SHR can be caused by exogenous or endogenous factors (6) and may be transient or persistent. The studies in the literature regarding insulin resistance in SHR are scarce and controversial. Insulin sensitivity in patients with iatrogenic SHR has been reported to be either reduced (7, 8) or unaltered (9). In SHR subjects, relevant changes in cardiovascular measures, such as arrhythmias, increased left ven- tricular mass, and impaired left ventricular mass function, have been recently reported; these changes are often accompanied by impaired diastolic function and, sometimes by reduced systolic performance on effort and decreased exercise tolerance, abnormalities that usually precede the onset of severe cardiovascular disease (10). This study was undertaken in patients with HR and SHR to examine the sensitivity of glucose metabolism to insulin both in vivo (by an oral glucose tolerance test (OGTT)) and in vitro (by measuring insulin-stimulated rates of glucose transport in isolated monocytes). European Journal of Endocrinology (2010) 163 625–630 ISSN 0804-4643 q 2010 European Society of Endocrinology DOI: 10.1530/EJE-10-0246 Online version via www.eje-online.org
Transcript of Studies of insulin resistance in patients with clinical and subclinical hypothyroidism

AUTHOR COPY ONLYEuropean Journal of Endocrinology (2010) 163 625–630 ISSN 0804-4643
CLINICAL STUDY
Studies of insulin resistance in patients with clinical andsubclinical hyperthyroidismEirini Maratou1, Dimitrios J Hadjidakis2, Melpomeni Peppa2, Maria Alevizaki3, Katerina Tsegka2, Vaia Lambadiari2,Panayota Mitrou1, Eleni Boutati2, Anastasios Kollias2, Theofanis Economopoulos2, Sotirios A Raptis1,2
and George Dimitriadis2
1Hellenic National Center for Research, Prevention and Treatment of Diabetes Mellitus and its Complications (HNDC), GR-10675 Athens, Greece,2Second Department of Internal Medicine, Research Institute and Diabetes Center, ‘Attikon’ University Hospital, Athens University, 1 Rimini Street,GR-12462 Haidari, Greece and 3Endocrine Unit, Department of Clinical Therapeutics, Athens University, GR-11528 Athens, Greece
(Correspondence should be addressed to G Dimitriadis; Email: [email protected], [email protected])
q 2010 European Society of E
Abstract
Objective: Although clinical hyperthyroidism (HR) is associated with insulin resistance, the informationon insulin action in subclinical hyperthyroidism (SHR) is limited.Design and methods: To investigate this, we assessed the sensitivity of glucose metabolism to insulinin vivo (by an oral glucose tolerance test) and in vitro (by measuring insulin-stimulated rates ofglucose transport in isolated monocytes) in 12 euthyroid subjects (EU), 16 patients with HR, and10 patients with SHR.Results: HR and SHR patients displayed higher postprandial glucose levels (area under thecurve, AUC0–300 32 190G1067 and 31 497G716 mg/dl min respectively) versus EU (27 119G1156 mg/dl min, P!0.05). HR but not SHR patients displayed higher postprandial insulinlevels (AUC0–300 11 020G985 and 9565G904 mU/l min respectively) compared with EU subjects(AUC0–300 7588G743 mU/l min, P!0.05). Homeostasis model assessment index was increased inHR and SHR patients (2.81G0.3 and 2.43G0.38 respectively) compared with EU subjects (1.27G0.16, P!0.05), while Matsuda and Belfiore indices were decreased in HR (4.21G0.41 and0.77G0.05 respectively, P!0.001) and SHR patients (4.47G0.33 and 0.85G0.05 respectively,P!0.05 versus EU (7.76G0.87 and 1 respectively). At 100 mU/ml insulin, i) GLUT3 levels on themonocyte plasma membrane were increased in HR (468.8G7 mean fluorescence intensity (MFI))and SHR patients (522.2G25 MFI) compared with EU subjects (407G18 MFI, P!0.01 andP!0.05 respectively), ii) glucose transport rates in monocytes (increases from baseline) weredecreased in HR patients (37.8G5%) versus EU subjects (61.26G10%, P!0.05).Conclusions: Insulin-stimulated glucose transport in isolated monocytes of patients with HRwas decreasedcompared with EU subjects. Insulin resistance was comparable in patients with both HR and SHR.
European Journal of Endocrinology 163 625–630
Introduction
In clinical hyperthyroidism (HR), impaired glucosetolerance and inulin resistance are frequent findings(1–5). In HR, tissue metabolic rate increases signi-ficantly (1). To adapt to high energy demand, cellularrates of basal and insulin-stimulated glucose disposalare generally elevated to increase the rates of lactateformation and glucose oxidation; lactate is then used bythe liver to increase the rates of gluconeogenesis andendogenous glucose production (1, 2).
Subclinical hyperthyroidism (SHR) is defined asdecreased plasma TSH levels in the presence of normallevels of free thyroxine (FT4) and free triiodothyronine(FT3). SHR can be caused by exogenous or endogenousfactors (6) and may be transient or persistent.The studies in the literature regarding insulin resistance
ndocrinology
in SHR are scarce and controversial. Insulin sensitivityin patients with iatrogenic SHR has been reported to beeither reduced (7, 8) or unaltered (9).
In SHR subjects, relevant changes in cardiovascularmeasures, such as arrhythmias, increased left ven-tricular mass, and impaired left ventricular massfunction, have been recently reported; these changesare often accompanied by impaired diastolic functionand, sometimes by reduced systolic performance oneffort and decreased exercise tolerance, abnormalitiesthat usually precede the onset of severe cardiovasculardisease (10).
This study was undertaken in patients with HR andSHR to examine the sensitivity of glucose metabolism toinsulin both in vivo (by an oral glucose tolerance test(OGTT)) and in vitro (by measuring insulin-stimulatedrates of glucose transport in isolated monocytes).
DOI: 10.1530/EJE-10-0246
Online version via www.eje-online.org

AUTHOR COPY ONLY626 E Maratou and others EUROPEAN JOURNAL OF ENDOCRINOLOGY (2010) 163
Materials and methods
Subjects
The groups participating in the study were i) newlydiagnosed clinical hyperthyroidism (HR) subjects withGraves’ disease who received no treatment, ii) patientswith SHR; these patients had autoimmune thyroiditisdue to positive thyroid antibodies, and iii) euthyroidsubjects (EU). There were no statistically significantdifferences in either body mass index or age between EUand HR and SHR groups (PO0.05, with one-wayANOVA). The characteristics and the hormonal andmetabolic data of the groups are presented in Table 1.None of the subjects was receiving any treatment orhad a family history of type 2 diabetes. The femaleparticipants were at the first half of their menstrualcycle, and no one was taking oral contraceptives.The duration of the disease, as reported by HR patients,was shorter than 3 months. Apart from tachycardia,perspiration, and tremor in some subjects, no othercomplication was present in HR patients. The durationof the SHR could not be accurately defined, as it ismostly asymptomatic. The normal ranges forhormones were FT3 2.2–5.3 pg/ml, FT4 0.7–2.2 ng/dl,T3 0.8–2.0 ng/ml, T4 5.1–14.1 mg/dl, and TSH0.27–4.2 mU/ml. Anti-thyroglobulin (anti-TG) andanti-thyroperoxidase (anti-TPO) antibodies’ referenceranges were !34 and !115 U/ml respectively. EUsubjects had negative anti-TG and anti-TPO antibodies(10.9G5.3 and 15.6G3.2 U/ml respectively), whilethese antibodies were positive in both HR (231G83and 218G147 U/ml respectively) and SHR (226G100and 213G103 U/ml respectively).
Some of the EU volunteers of the present study wereused in a similar study published recently by our
Table 1 The characteristics, the clinical data, and the indices oare presented as mean valuesGS.E.M.
EU
Age (years) 44G4.5Body mass index (kg/m2) 24.28G0.47FT3 (pg/ml) 2.94G0.1FT4 (ng/dl) 1.23G0.07T3 (ng/ml) 1.3G0.06T4 (mg/dl) 8.13G0.3TSH (mU/ml) 1.9G0.4HDL cholesterol (mg/dl) 50G10LDL cholesterol (mg/dl) 137G10Triglycerides (mg/dl) 82G10Systolic blood pressure (mmHg) 122G12Diastolic blood pressure (mmHg) 82G3HOMA index 1.27G0.16Matsuda index 7.76G0.87Belfiore index 1Glucose AUC0–300 (mg min/dl) 27 119G1156Insulin AUC0–300 (mU min/l) 7588G743n (number of females/males) 12 (8/4)
*P!0.05, †P!0.01, ‡P!0.001.
www.eje-online.org
group (11). The protocol was approved by the hospitalethics committee, and subjects gave informed consent.
Study protocol
Subjects were admitted to the hospital at 0800 h afteran overnight fast and received an OGTT (75 g glucose).Blood samples were drawn before the administration ofglucose (at K30 and 0 min) and at 15- to 60-minintervals for 300 min thereafter, and used for measure-ments of glucose (Yellow Springs Instrument, YellowSprings, OH, USA) and insulin (RIA, Linco Research,St Charles, MO, USA).
In the fasting state, insulin resistance was estimatedby the homeostasis model assessment index (HOMA,(fasting glucose!fasting insulin/22.5)) (12), whilein the post-glucose state, insulin sensitivity wasestimated by the Matsuda index (10 000/SQRT(mean glucose(0–120)!mean insulin(0–120)!fastingglucose!fasting insulin)) (13) and the Belfioreindex (2/((GluAUC(0–120)/meanGluAUC(0–120)EU)!(InsAUC(0–120)/MeanInsAUC(0–120)EU)C1) (14).
At K30 min, 20 ml of blood were drawn for theisolation of mononuclear cells to assess i) GLUT3 andGLUT4 glucose transporter levels on the monocyteplasma membrane in response to insulin, andii) insulin-stimulated rates of glucose transport.
Effect of insulin on GLUT expression and6-[N-(7-nitrobenz-2-oxa-1, 3-diazol-4-yl)amino]-6-deoxyglucose uptake: flowcytometry analysis
Insulin exerts its action at a cellular level by numeroussteps of intracellular mechanism, the insulin signalingpathway. Regarding glucose transport, the final step
f insulin resistance of the groups involved in the study. Data
HR SHR
44.25G2.9 43.2G424.85G0.8 24.6G1.269.28G1.1‡ 4.7G0.163.09G0.26‡ 1.83G0.1372.95G0.29‡ 1.54G0.1215.6G0.97‡ 10G0.960.01G0.0005‡ 0.06G0.0035‡
61.8G4.7 58.6G2.34144.5G12.4 140.8G780.5G15.3 83.7G8.12130G14 126G1086G2 85G4
2.81G0.3† 2.43G0.38*4.21G0.41‡ 4.47G0.33†
0.77G0.05‡ 0.85G0.05*32 190G1067† 31 497G716*11 020G985* 9565G904
16 (12/4) 10 (7/3)

AUTHOR COPY ONLY
60
80
100
120
140
160
180
–60 0 60 120 180 240 300
Time (min)
Pla
sma
gluc
ose
(mg/
dl)
EUHRSHR
EUHRSHR
00
20
40
60
80
100
–60 60 120 180 240 300
Time (min)
Pla
sma
insu
lin (
mU
/l)
Figure 1 Plasma glucose (A) and insulin (B) levels in euthyroid (EU)subjects, and patients with clinical hyperthyroidism (HR) andsubclinical hyperthyroidism (SHR) after an OGTT; postprandialplasma insulin levels were increased in patients with HR versusEU subjects (P!0.05). Postprandial plasma glucose levels werehigher in both HR and SHR patients compared with EU subjects(P!0.01 and P!0.05 respectively).
Insulin resistance in subclinical hyperthyroidism 627EUROPEAN JOURNAL OF ENDOCRINOLOGY (2010) 163
of insulin signaling is the enrichment of plasmamembrane with GLUT3 and GLUT4 isoforms. Surfaceglucose transporter isoforms were determined afterincubating cells with insulin and staining themwith anti-GLUT antisera. In summary, mononuclearcells were aliquoted at the desired concentration(1!106 cells/ml) and incubated for 60 min, at 22 8C, ina buffer (NaCl 140 mM, HEPES 20 mM, KCl 5 mM,MgSO4 2.5 mM, and glucose 5.5 mM, pH 7.4),containing different concentrations of insulin (SigmaDiagnostics). Termination of incubation was achievedwith the addition of cytochalasin-B (10 mM; SigmaDiagnostics). Cells were then stained with specificantiserum for GLUT3 and GLUT4, and were analyzed byflow cytometry as described previously in detail (15).
For the glucose transport experiments, the tracerused to monitor glucose flux in monocytes was6-[N-(7-nitrobenz-2-oxa-1, 3-diazol-4-yl) amino]-6-deoxyglucose (NBDG, Invitrogen). Cells were suspendedin the above-mentioned buffer at the same concen-tration. Flow cytometric analysis was initiated immedi-ately after the addition of NBDG (final concentration30 mM) and insulin. The uptake of the fluorescentprobe was recorded as mean fluorescence intensity(MFI) during a 500 s interval, when the reactionreached a plateau (15).
Statistical analysis
Grouped data are expressed as meanGS.E.M. 6-NBDGuptake is presented as an increase over baseline (MFIof cells prior to the addition of the fluorescent analog).The statistical analysis was performed by the statisticsoftware GraphPad InStat (San Diego, CA, USA).The normal distribution of the data was verified bythe Kolmogorov and Smirnov method. Insulin dose–response curves were analyzed with repeated-measuresANOVA. Comparison between groups was performedby one-way ANOVA with Bonferroni’s post hoc test.
Results
Postprandial plasma insulin levels were increased inHR patients compared with EU subjects (P!0.05).Postprandial plasma glucose levels were higher in bothHR and SHR patients compared with EU (P!0.01 andP!0.05 respectively; Fig. 1).
HOMA index reflects the insulin resistance in thefasting state, while Matsuda and Belfiore indices reflectinsulin sensitivity in the postprandial state.
HOMA index was increased in both HR (2.81G0.3)and SHR patients (2.43G0.38) compared with EUsubjects (1.27G0.16, P!0.01 and P!0.05 respect-ively). Belfiore and Matsuda indices were decreased inboth HR (0.77G0.05 and 4.21G0.41 respectively) andSHR (0.82G0.04 and 4.47G0.33 respectively)
patients compared with EU (1 kai 7.76G0.87,P!0.001 and P!0.01 respectively).
In monocytes from EU subjects, when insulin wasincreased from 0 to 100 mU/ml, GLUT4 and GLUT3isoforms on the plasma membrane increased by 39%(from 194 to 270 MFI) and by 34% (from 301 to 403 MFI)respectively (P!0.0001 with ANOVA for both). Therespective increases for the HR patients was 13% (from318 to 360 MFI, PZ0.001 with ANOVA) and 21% (from388 to 469 MFI, P!0.0001 with ANOVA), while therespective increases for the SHR patients was 12% (from252 to 309 MFI, PZ0.049 with ANOVA) and 22.8%(from 466 to 522 MFI, PZ0.021 with ANOVA; Fig. 2).
At 100 mU/ml insulin, GLUT4 levels on the monocyteplasma membrane increased in the HR patients(360 MFI) versus EU subjects (270 MFI, P!0.05),while GLUT3 levels increased in both HR (403 MFI) andSHR patients (522 MFI) compared with EU subjects(403 MFI, P!0.05; Fig. 2).
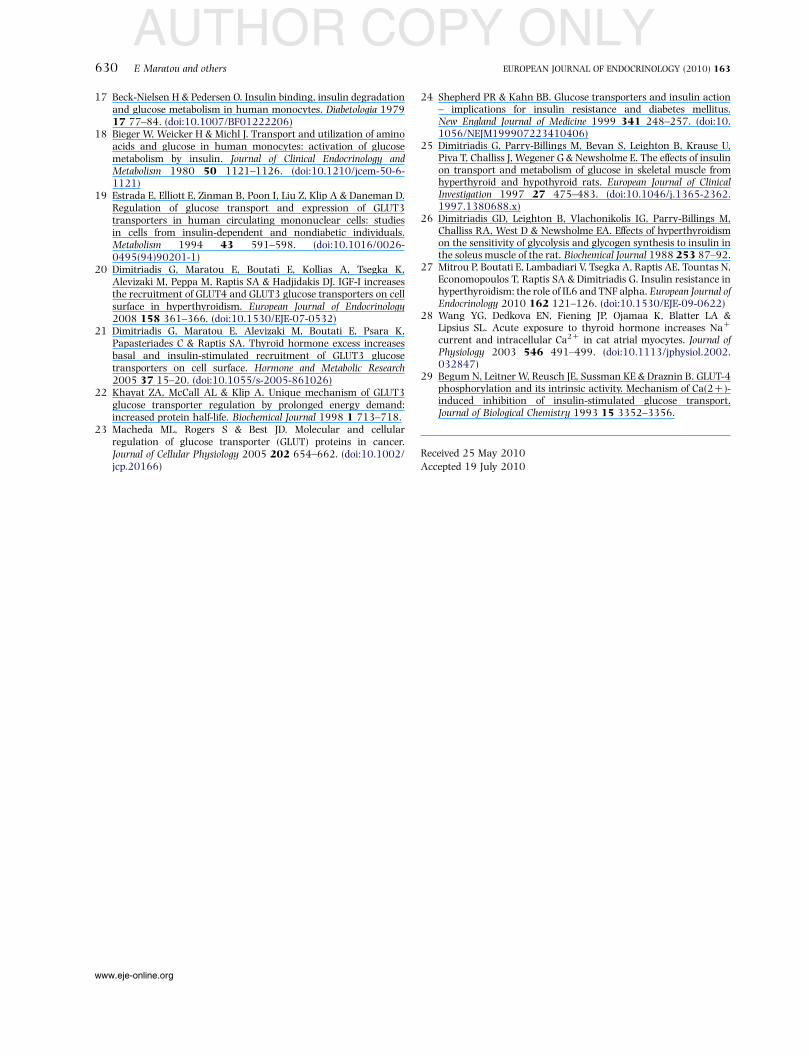
In monocytes from EU subjects, the 6-NBDG uptake(increases from baseline) in the presence of 0, 25, and100 mU/ml insulin was increased by 19, 43, and 62%respectively (P!0.005; Fig. 3). The respective increasesfor HR patients were 26, 34, and 37.8% (P!0.001),while the respective increases for SHR patients were29.6, 36, and 49.5% (P!0.001; Fig. 3).
At 100 mU/ml insulin, the 6-NBDG uptake in mono-cytes from HR patients was decreased compared with EUsubjects (P!0.05, Fig. 3), while there was no significantchange in the monocytes isolated from SHR patients.
www.eje-online.org

AUTHOR COPY ONLY
250
300
350
400
450
500
550
–10 100 20 30 40 50 60 70 80 90 100 110
GLU
T3
MF
I
HREUSHR
HREUSHR
150
200
250
300
350
400
–10 100 20 30 40 50 60 70 80 90 100 110
Insulin (µU/ml)
Insulin (µU/ml)
GLU
T4
MF
I
***** **
**
****
**
*
**
* * *
*
Figure 2 Plasma membrane levels of GLUT4 (A) and GLUT3 (B) inisolated monocytes in the presence of physiological concentrationsof insulin in euthyroid (EU) subjects, and patients with clinicalhyperthyroidism (HR) and subclinical hyperthyroidism (SHR);*P!0.05, **P!0.01 versus EU.
0
10
20
30
40
50
60
70
–10 10 20 30 40 50 60 70 80 90 100 110
Insulin (µU/ml)
6-N
BD
G u
ptak
e(%
incr
ease
from
bas
elin
e)
EUHRSHR
*
0
Figure 3 Transport rates of glucose analog (6-NBDG) in isolatedmonocytes in the presence of physiological concentrations of insulinin euthyroid (EU) subjects, and patients with clinical hyperthyroid-ism (HR) and subclinical hyperthyroidism (SHR); *P!0.05 versusEU. 6-NBDG uptake is presented as an increase over baseline(MFI of cells prior to 6-NBDG addition).
628 E Maratou and others EUROPEAN JOURNAL OF ENDOCRINOLOGY (2010) 163
Discussion
Our results demonstrate the presence of insulinresistance not only in HR but also in SHR patients.Increased HOMA and decreased Matsuda and Belfioreindices in HR and SHR patients compared witheuthyroid subjects suggest that insulin resistance ispresent in both fasting and post-glucose state. Ourresults are in agreement with those of Yavuz et al. (7, 8)reporting significantly lower insulin sensitivity in agroup of SHR. Interestingly, recent studies have shownthat even subtle decreases in the levels of thyroidhormones within the physiological range negativelycorrelate with the HOMA index (16). These findings,taken together with the results of the present study,suggest that even small deviances from thyroidhormone equilibrium may eventually lead to insulinresistance.
Monocytes provide an easily accessible and reliablemodel for metabolic studies. These cells have insulinreceptors that quickly respond to changes in insulinconcentrations and, in the presence of insulin rapidlyincrease their rates of glucose disposal (15, 17, 18).Moreover, monocytes express all GLUT isoforms foundin muscle and adipose tissue, and the increases inglucose transport in response to insulin in these cells
www.eje-online.org
correspond well with those observed in tissues quan-titatively important for glucose disposal (15, 19).We have previously used monocytes as a cellularmodel to study insulin sensitivity (11, 15); furthermore,we have suggested the important role of GLUT3 incompensating increased tissue demand for glucosein the HR state (20, 21).
Our data show an elevated basal abundance ofGLUT4 and GLUT3 in HR and SHR patients. Thisis consistent with previous studies on HR patients(20, 21). The increment of expression of GLUT3 andGLUT4 glucose transporters at the basal level of insulinreflects the adaptation of the monocyte to cope withthe increased metabolic rates involved in this condition.
In monocytes isolated from HR patients, maximalinsulin levels induced an increased GLUT3 and GLUT4abundance on the monocyte plasma membranecompared with EU subjects; the response in the monocytesisolated from SHR patients was intermediate to that ofHR patients and EU subjects (Fig. 2). GLUT3 is not themain insulin-regulated transporter in tissues, but as hasbeen shown (22, 23), the expression of this isoformincreases several fold in metabolic stress and increasedtissue energy demand; under these conditions, thisglucose transporter becomes primarily responsible forthe increase in cellular glucose transport and utilization.
Glucose transport controls the rate of glucoseutilization and is therefore an important regulatorystep in cell metabolism (24). In HR, the absolute rates ofinsulin-stimulated glucose transport in peripheraltissues (such as muscle or adipose tissue) have generallybeen found to be normal or increased, in order to adaptto high energy demand (3, 25). However, we haverecently shown that glucose uptake in muscle in HR isindeed resistant to insulin, but this defect is maskedby a marked increase in blood flow (4); this could beattributed to the dramatic decrease in intracellularpathways of insulin-stimulated glucose metabolism

AUTHOR COPY ONLYInsulin resistance in subclinical hyperthyroidism 629EUROPEAN JOURNAL OF ENDOCRINOLOGY (2010) 163
(such as glycogen synthesis) (25, 26). In addition,tumor necrosis factor a and interleukin 6 maycontribute to insulin resistance in the metabolism ofboth lipids and glucose in HR (27). These findingssupport the results of the present study: in HR patients,glucose uptake in monocytes in the presence of insulinwas significantly decreased compared to euthyroidsubjects; the SHR group showed an intermediateresponse suggesting that SHR is an intermediatemetabolic condition between EU and HR (which isfurther supported by the intermediate levels of thethyroid hormones in our SHR group). This result comesin striking contrast with the significantly increasedabundance of insulin-stimulated GLUT3 and GLUT4glucose transporters observed in monocytes isolatedfrom HR and SHR patients. The lack of correlationbetween the abundance of GLUT3 and GLUT4 and theinsulin-stimulated glucose uptake in the monocytes ofthe HR patients could be attributed to elevatedintracellular concentration of calcium. It has beenrecently shown that the elevated levels of T3 in HRincrease calcium concentration in the cytosol (28).Elevated levels of cytosolic calcium can modulateinsulin’s ability to desphosporylate GLUT4, thusreducing its intrinsic activity and resulting in calcium-induced insulin resistance (29).
In conclusion, HR and SHR are both states of insulinresistance. Both insulin resistance and the increasedabundance of GLUT3 and GLUT4, on monocyte plasmamembrane of SHR, which were found intermediate tothose of HR and EU, are likely explained by the differentdegrees of thyroid hormone levels. Future researchshould focus on the insulin signaling cascade and theplausible association of impairment of phosphorylationpattern of signaling molecules (such as insulin receptorsubstrate 1) with decreased glucose uptake.
Declaration of interest
The authors declare that there is no conflict of interest that could beperceived as prejudicing the impartiality of the research reported.
Funding
This project has been co-funded by the European Social Fund andNational Resources – (EPEAEK II) PYTHAGORAS II.
Acknowledgements
We thank E Pappas for technical support and V Fragaki, R N fornursing assistance.
References
1 Dimitriadis G & Raptis S. Thyroid hormone excess and glucoseintolerance. Experimental and Clinical Endocrinology and Diabetes2001 109 (Suppl 2) S225–S239. (doi:10.1055/s-2001-18584)
2 Dimitriadis G, Baker B, Marsh M, Mandarino L, Rizza R,Bergman R, Haymond M & Gerich J. Effect of thyroid hormone
excess on action, secretion and metabolism of insulin in humans.American Journal of Physiology. Endocrinology and Metabolism 1985248 593–601.
3 Dimitriadis G, Mitrou P, Lambadiari V, Boutati E, Maratou E,Koukkou E, Tzanella M, Thalassinos N & Raptis SA. Glucose andlipid fluxes in the adipose tissue after meal ingestion inhyperthyroidism. Journal of Clinical Endocrinology and Metabolism2006 91 1112–1118. (doi:10.1210/jc.2005-0960)
4 Dimitriadis G, Mitrou P, Lambadiari V, Boutati E, Maratou E,Koukkou E, Panagiotakos D, Tountas N, Economopoulos T &Raptis SA. Insulin-stimulated rates of glucose uptake in musclein hyperthyroidism: the importance of blood flow. Journal ofClinical Endocrinology and Metabolism 2008 93 2413–2415.(doi:10.1210/jc.2007-2832)
5 Caixas A, Tirado R, Vendrell J, Gallart L, Megıa A, Simon I,Llaurado G, Gonzalez-Clemente JM & Gimenez-Palop O. Plasmavisfatin concentrations increase in both hyper and hypothyroidsubjects after normalization of thyroid function and are not relatedto insulin resistance, anthropometric or inflammatory parameters.Clinical Endocrinology 2009 71 733–738. (doi:10.1111/j.1365-2265.2009.03546.x)
6 Ross DS. Subclinical thyrotoxicosis. In Werner and Ingbar’sThe Thyroid: A Fundamental and Clinical Text, pp 1016–1020,8th edn. Eds LE Bravermen & RD Utiger. Philadelphia: LippincottWilliams and Wilkins, 2000.
7 Yavuz DG, Yuksel M, Deyneli O, Ozen Y, Aydin H & Akalin S.Association of serum paraoxonase activity with insulin sensitivityand oxidative stress in hyperthyroid and TSH-suppressed nodulargoitre patients. Clinical Endocrinology 2004 61 515–521. (doi:10.1111/j.1365-2265.2004.02123.x)
8 Yavuz DG, Yazici D, Toprak A, Deyneli O, Aydin H, Yuksel M &Akalin S. Exogenous subclinical hyperthyroidism impairsendothelial function in nodular goiter patients. Thyroid 2008 18395–400. (doi:10.1089/thy.2007.0299)
9 Heemstra KA, Smit JW, Eustatia-Rutten CF, Heijboer AC, Frolich M,Romijn JA & Corssmit EP. Glucose tolerance and lipid profile inlongterm exogenous subclinical hyperthyroidism and the effects ofrestoration of euthyroidism, a randomised controlled trial. ClinicalEndocrinology 2006 65 737–744. (doi:10.1111/j.1365-2265.2006.02660.x)
10 Biondi B, Palmieri EA, Klain M, Schlumberger M, Filetti S &Lombardi G. Subclinical hyperthyroidism: clinical featuresand treatment options. European Journal of Endocrinology 2005152 1–9. (doi:10.1530/eje.1.01809)
11 Maratou E, Hadjidakis DJ, Kollias A, Tsegka K, Peppa M,Alevizaki M, Mitrou P, Lambadiari V, Boutati E, Nikzas D,Tountas N, Economopoulos T, Raptis SA & Dimitriadis G. Studiesof insulin resistance in patients with clinical and subclinicalhypothyroidism. European Journal of Endocrinology 2009 160 785–790. (doi:10.1530/EJE-08-0797)
12 Matthews DR, Hosker JP, Rudenski AS, Naylor BA, Treacher DF &Turner RC. Homeostasis model assessment: insulin resistanceand beta-cell function from fasting plasma glucose and insulinconcentrations in man. Diabetologia 1985 28 412–419. (doi:10.1007/BF00280883)
13 Matsuda M & DeFronzo RA. Insulin sensitivity indices obtainedfrom oral glucose tolerance testing: comparison with theeuglycemic insulin clamp. Diabetes Care 1999 22 1462–1470.(doi:10.2337/diacare.22.9.1462)
14 Belfiore F, Iannello S & Volpicelli G. Insulin sensitivity indicescalculated from basal and OGTT-induced insulin, glucose, and FFAlevels. Molecular Genetics and Metabolism 1998 63 134–141.(doi:10.1006/mgme.1997.2658)
15 Dimitriadis G, Maratou E, Boutati E, Psarra K, Papasteriades C &Raptis SA. Evaluation of glucose transport and its regulation byinsulin in human monocytes using flow cytometry. Cytometry.Part A 2005 64 27–33. (doi:10.1002/cyto.a.20108)
16 Roos A, Bakker SJ, Links TP, Gans RO & Wolffenbuttel BH. Thyroidfunction is associated with components of the metabolic syndromein euthyroid subjects. Journal of Clinical Endocrinology andMetabolism 2007 92 491–496. (doi:10.1210/jc.2006-1718)
www.eje-online.org
AUTHOR COPY ONLY630 E Maratou and others EUROPEAN JOURNAL OF ENDOCRINOLOGY (2010) 163
17 Beck-Nielsen H & Pedersen O. Insulin binding, insulin degradationand glucose metabolism in human monocytes. Diabetologia 197917 77–84. (doi:10.1007/BF01222206)
18 Bieger W, Weicker H & Michl J. Transport and utilization of aminoacids and glucose in human monocytes: activation of glucosemetabolism by insulin. Journal of Clinical Endocrinology andMetabolism 1980 50 1121–1126. (doi:10.1210/jcem-50-6-1121)
19 Estrada E, Elliott E, Zinman B, Poon I, Liu Z, Klip A & Daneman D.Regulation of glucose transport and expression of GLUT3transporters in human circulating mononuclear cells: studiesin cells from insulin-dependent and nondiabetic individuals.Metabolism 1994 43 591–598. (doi:10.1016/0026-0495(94)90201-1)
20 Dimitriadis G, Maratou E, Boutati E, Kollias A, Tsegka K,Alevizaki M, Peppa M, Raptis SA & Hadjidakis DJ. IGF-I increasesthe recruitment of GLUT4 and GLUT3 glucose transporters on cellsurface in hyperthyroidism. European Journal of Endocrinology2008 158 361–366. (doi:10.1530/EJE-07-0532)
21 Dimitriadis G, Maratou E, Alevizaki M, Boutati E, Psara K,Papasteriades C & Raptis SA. Thyroid hormone excess increasesbasal and insulin-stimulated recruitment of GLUT3 glucosetransporters on cell surface. Hormone and Metabolic Research2005 37 15–20. (doi:10.1055/s-2005-861026)
22 Khayat ZA, McCall AL & Klip A. Unique mechanism of GLUT3glucose transporter regulation by prolonged energy demand:increased protein half-life. Biochemical Journal 1998 1 713–718.
23 Macheda ML, Rogers S & Best JD. Molecular and cellularregulation of glucose transporter (GLUT) proteins in cancer.Journal of Cellular Physiology 2005 202 654–662. (doi:10.1002/jcp.20166)
www.eje-online.org
24 Shepherd PR & Kahn BB. Glucose transporters and insulin action– implications for insulin resistance and diabetes mellitus.New England Journal of Medicine 1999 341 248–257. (doi:10.1056/NEJM199907223410406)
25 Dimitriadis G, Parry-Billings M, Bevan S, Leighton B, Krause U,Piva T, Challiss J, Wegener G & Newsholme E. The effects of insulinon transport and metabolism of glucose in skeletal muscle fromhyperthyroid and hypothyroid rats. European Journal of ClinicalInvestigation 1997 27 475–483. (doi:10.1046/j.1365-2362.1997.1380688.x)
26 Dimitriadis GD, Leighton B, Vlachonikolis IG, Parry-Billings M,Challiss RA, West D & Newsholme EA. Effects of hyperthyroidismon the sensitivity of glycolysis and glycogen synthesis to insulin inthe soleus muscle of the rat. Biochemical Journal 1988 253 87–92.
27 Mitrou P, Boutati E, Lambadiari V, Tsegka A, Raptis AE, Tountas N,Economopoulos T, Raptis SA & Dimitriadis G. Insulin resistance inhyperthyroidism: the role of IL6 and TNF alpha. European Journal ofEndocrinology 2010 162 121–126. (doi:10.1530/EJE-09-0622)
28 Wang YG, Dedkova EN, Fiening JP, Ojamaa K, Blatter LA &Lipsius SL. Acute exposure to thyroid hormone increases NaC
current and intracellular Ca2C in cat atrial myocytes. Journal ofPhysiology 2003 546 491–499. (doi:10.1113/jphysiol.2002.032847)
29 Begum N, Leitner W, Reusch JE, Sussman KE & Draznin B. GLUT-4phosphorylation and its intrinsic activity. Mechanism of Ca(2C)-induced inhibition of insulin-stimulated glucose transport.Journal of Biological Chemistry 1993 15 3352–3356.
Received 25 May 2010
Accepted 19 July 2010