Rejected’ vs. ‘rejecting’ transcriptomes in allogeneic challenged colonial urochordates
Upload
independentCategory
view
2download
0
ARTICLE
Received 16 Aug 2014 | Accepted 18 Nov 2014 | Published 7 Jan 2015
Insulin resistance and white adipose tissueinflammation are uncoupled in energeticallychallenged Fsp27-deficient miceLinkang Zhou1,*, Shi-Young Park2,*, Li Xu3,*, Xiayu Xia1, Jing Ye4, Lu Su1, Kyeong-Hoon Jeong2, Jang Ho Hur2,
Hyunhee Oh2, Yoshikazu Tamori5,6, Cristina M. Zingaretti7, Saverio Cinti7, Jesus Argente8,9,10,11, Miao Yu1,
Lizhen Wu1, Shenghong Ju12, Feifei Guan13, Hongyuan Yang14, Cheol Soo Choi2,15,y, David B. Savage16,y
& Peng Li1,y
Fsp27 is a lipid droplet-associated protein almost exclusively expressed in adipocytes where it
facilitates unilocular lipid droplet formation. In mice, Fsp27 deficiency is associated with
increased basal lipolysis, ‘browning’ of white fat and a healthy metabolic profile, whereas a
patient with congenital CIDEC deficiency manifested an adverse lipodystrophic phenotype.
Here we reconcile these data by showing that exposing Fsp27-null mice to a substantial
energetic stress by crossing them with ob/ob mice or BATless mice, or feeding them a high-
fat diet, results in hepatic steatosis and insulin resistance. We also observe a striking
reduction in adipose inflammation and increase in adiponectin levels in all three models. This
appears to reflect reduced activation of the inflammasome and less adipocyte death. These
findings highlight the importance of Fsp27 in facilitating optimal energy storage in adipocytes
and represent a rare example where adipose inflammation and hepatic insulin resistance are
disassociated.
DOI: 10.1038/ncomms6949 OPEN
1 MOE Key Laboratory of Bioinformatics and Tsinghua-Peking Center for Life Sciences, School of Life Sciences, Tsinghua University, Beijing 100084, China.2 Korea Mouse Metabolic Phenotyping Center, Lee Gil Ya Cancer and Diabetes Institute, Gachon University, Incheon 406-840, Korea. 3 Key Laboratory forFeed Biotechnology of the Ministry of Agriculture, Feed Research Institute, Chinese Academy of Agricultural Sciences, Beijing 100081, China. 4 Department ofPathology, The Fourth Military Medical University, Xi’an 710032, China. 5 Division of Diabetes and Endocrinology, Department of Internal Medicine, KobeUniversity Graduate School of Medicine, Kobe 650-0017, Japan. 6 Division of Metabolism and Endocrinology, Department of Internal Medicine, ChibuneGeneral Hospital, Osaka 555-0001, Japan. 7 Department of Experimental and Clinical Medicine-Obesity Center, United Hospitals-University of Ancona,Ancona 60020, Italy. 8 Department of Pediatrics and Pediatric Endocrinology, Hospital Infantil Universitario Nino Jesus, Madrid E-28009, Spain. 9 Instituto deInvestigacion La Princesa, Madrid E-28009, Spain. 10 Department of Pediatrics, Universidad Autonoma de Madrid, Madrid E-28009, Spain. 11 CIBERFisiopatologıa de la obesidad y nutricion, Instituto de Salud Carlos III, Madrid E-28009, Spain. 12 Jiangsu Key Laboratory of Molecular and Functional Imaging,Department of Radiology, Zhongda Hospital, Southeast University, Nanjing 210009, China. 13 Key Laboratory of Human Disease Comparative Medicine,Ministry of Health, Institute of Laboratory Animal Science, Chinese Academy of Medical Sciences and Comparative Medical Center, Peking Union MedicalCollege, Beijing 100084, China. 14 School of Biotechnology and Biomolecular Sciences, University of New South Wales, Sydney, New South Wales 2052,Australia. 15 Department of Internal Medicine, Gachon University Gil Medical Center, Incheon 405-760, Korea. 16 University of Cambridge MetabolicResearch Laboratories, Wellcome Trust-Medical Research Council Institute of Metabolic Science, Cambridge CB2 0QQ, UK. * These authors contributedequally to this work. y These authors are the joint senior authors. Correspondence and requests for materials should be addressed to C.S.C. (email:[email protected]) or to D.B.S. (email: [email protected]) or to P.L. (email: [email protected]).
NATURE COMMUNICATIONS | 6:5949 | DOI: 10.1038/ncomms6949 | www.nature.com/naturecommunications 1
& 2015 Macmillan Publishers Limited. All rights reserved.

CIDE proteins including Cidea, Cideb and Fsp27 (Cidec inhumans), have emerged as key regulators of lipid droplet(LD) morphology and function in adipocytes and
hepatocytes1–3. Cidea is predominantly expressed in brownadipocytes, Cideb in hepatocytes and Fsp27 almost exclusivelyin white adipocytes in healthy wild-type (WT) mice3. In humans,one potentially important difference is that Cidea is alsoexpressed in white adipocytes2,4. Fsp27 and Cidea are alsoexpressed in steatotic livers5,6. Both Fsp27 and Cidea localize onthe surface of LDs7–9, are particularly enriched at LD contact sitesand appears to promote a unique form of ‘LD fusion’9,10.Perilipin1 enhances Fsp27-mediated LD fusion in whiteadipocytes11. Fsp27 knockdown studies in cultured 3T3L1adipocytes8 and in vivo evidence from two independentlygenerated Fsp27-null lines12,13 and from a single human patientwith a homozygous loss-of-function premature stop mutation14
clearly supports the notion that Fsp27 is required for theformation of a large unilocular LD in white adipocytes. Thepresence of multilocular LDs in Fsp27-deficient adipocytes is inturn consistently associated with increased lipolysis8,13,presumably as a result of a considerable increase in the LDsurface area accessible to lipases.
White adipocytes are uniquely adapted to store surplus energyin unilocular LDs and to quantitatively release non-esterified fattyacids for oxidation by other metabolically active tissues. Excessivelipid storage in white adipose tissue (WAT) results in thedevelopment of obesity and ultimately its related complicationsincluding insulin resistance, non-alcoholic fatty liver disease(NAFLD) and cardiovascular disease15–17. Interestingly,lipodystrophic states, which are characterized by reduced fatmass and defective lipid storage in adipose tissue, are stronglyassociated with ectopic fat deposition and an almost identicalconstellation of metabolic problems to those associated withobesity. In humans, at least 12 different genetic subtypes oflipodystrophy have been reported, and these almost invariablyresult in NAFLD, dyslipidemia and insulin resistance, whichfrequently leads to diabetes18–20. In contrast to this humanparadigm, several mouse models including some specificallydesigned to mimic human lipodystrophies21, as well as othersindependently generated in direct attempts to createlipodystrophic mouse models or simply to understand thein vivo consequences of targeted genetic perturbations, haveappeared to display ‘lean and healthy’ metabolic phenotypeswithout fatty liver disease and insulin resistance19,22.
Although the importance of Fsp27 in mediating the formationof a unilocular LD in adipocytes is very clear and we havesuggested a plausible mechanistic basis for this function9,11, thephysiological importance of this activity is much less certain.In mice and the human patient, Fsp27 deficiency resulted in asignificant reduction in total fat mass, but the systemicconsequences of this adipose phenotype were very different.Whereas the human patient manifested a typical ‘lipodystrophic’phenotype characterized by ectopic lipid accumulation in theliver, that is, NAFLD, dyslipidemia and insulin-resistantdiabetes14, both the knockout mouse models appeared to beprotected against insulin resistance12,13.
In the current studies, we endeavour to clarify the physiologicalimportance of Fsp27, particularly in relation to its role inoptimizing lipid storage and insulin sensitivity. Whereas mice aretypically housed at temperatures below thermoneutrality and feddiets with o10% fat content, humans tend to ensure that theirenvirons are thermoneutral and habitually consume diets with afar greater fat content. These differences are expected to result insignificant differences in the need to store surplus fat, particularlyin mouse models where adipose tissue insulation is reduced.Thus, to subject the Fsp27-deficient mice to a greater energeticburden, the mice are crossed with leptin-deficient ob/ob mice orchallenged with prolonged high-fat feeding. As brown adiposetissue (BAT) could conceivably aid adaptation to any deficiencyin WAT lipid storage, especially in mice with less fat mass housedin a relatively cold environment where thermogenesis is typicallyenhanced, we also seek to ascertain the importance of thermo-genic BAT in these mice by crossing the Fsp27 knockouts withBATless mice23.
ResultsReduced fat mass and inflammation in ob/ob/Fsp27�/� mice.Fsp27-null mice were crossed with leptin-deficient (ob/ob) mice togenerate doubly-deficient mice (ob/ob/Fsp27�/� ). All the off-spring were viable, born at the expected frequencies and of similarlength to their ob/ob littermates (Supplementary Fig. 1a–c).ob/ob/Fsp27�/� mice weighed B30% less than ob/ob mice(Table 1 and Supplementary Fig. 1a), with the bulk of this dif-ference being due to substantial reductions in the volume of bothsubcutaneous and visceral fat (Fig. 1a–d and Table 1). Lean masswas similar in both groups (Fig. 1c). The major determinant ofthe differences in body weight appears to be increased energy
Table 1 | Tissue weights and blood biochemistry of ob/ob and ob/ob/Fsp27�/� mice.
Parameter ob/ob ob/ob/Fsp27�/�
N Mean±s.e.m. N Mean±s.e.m. P-value
Body weight (g) 10 52.09±1.13 10 36.82±0.33 o0.0001***Serum glycerol (mg ml� 1) 9 0.76±0.08 7 1.06±0.04 0.0092**Serum NEFA (mEq l� 1) 7 1.19±0.15 9 1.15±0.10 0.8376Gonadal fat (g) 9 2.08±0.19 8 0.18±0.01 o0.0001***Subcuteneous fat (g) 9 2.34±0.11 8 0.47±0.04 o0.0001***Mesenteric fat (g) 9 1.64±0.06 8 0.34±0.01 o0.0001***Retroperitoneal fat (g) 9 2.25±0.12 8 0.46±0.02 o0.0001***Inguinal fat (g) 9 0.50±0.05 8 0.08±0.01 o0.0001***Muscle(gastrocnemius) (g) 10 0.45±0.01 10 0.45±0.01 0.886Kidney (g) 10 0.45±0.01 10 0.46±0.01 0.250Heart (g) 10 0.16±0.002 10 0.16±0.003 0.307Spleen (g) 10 0.10±0.006 10 0.11±0.003 0.398Liver (g) 6 3.49±0.19 10 5.06±0.27 o0.001***BAT (g) 5 0.39±0.03 7 0.70±0.06 o0.01**
BAT, brown adipose tissue; N, the number of mice used; NEFA, non-esterified fatty acid.Four-month-old chow fed ob/ob and ob/ob/Fsp27�/� mice were used. Quantitative data are presented as mean±s.e.m. Significance was established using a 2-tailed Student’s t-test. Differences wereconsidered significant at Po0.05. **Po0.01, ***Po0.001.
ARTICLE NATURE COMMUNICATIONS | DOI: 10.1038/ncomms6949
2 NATURE COMMUNICATIONS | 6:5949 | DOI: 10.1038/ncomms6949 | www.nature.com/naturecommunications
& 2015 Macmillan Publishers Limited. All rights reserved.

expenditure in the ob/ob/Fsp27�/� mice (Supplementary Fig. 1d),as food intake tended to be greater in theob/ob/Fsp27�/� mice (Supplementary Fig. 1e). Consistent withthe role of Fsp27 in regulating LD fusion, white adipocytes ofob/ob/Fsp27�/� mice were smaller and contained small multi-locular LDs (Fig. 1e–h). Expression levels of several LD-associatedproteins (Perilipin1, Perilipin2 and Cidea) were significantlyincreased (Fig. 1i), presumably due to the relative increase inLD-associated surface area. Proteins involved in mitochondrialoxidative phosphorylation, fatty acid oxidation (Cyto C andCox4) and lipolysis (ATGL, CGI58 and HSL) were all increased,whereas levels of key adipogenic transcription factors(CEBPb and PPARg) were similar in ob/ob/Fsp27�/� and ob/obmice (Fig. 1i). Plasma levels of glycerol were increased in
ob/ob/Fsp27�/� mice, reflecting increased lipolysis as previouslyobserved in Fsp27-deficient mice12,13 (Table 1).
Next, we systematically analysed the gene expression profiles ofgonadal WAT (GWAT) from ob/ob/Fsp27�/� and ob/ob mice bymicroarray analysis, and observed that the expression of 8,000genes were different in this depot. Wiki pathway analysissuggested that 23 of 162 Wiki pathways were significantlyincreased, whereas 39 pathways were significantly decreased inthe GWAT of ob/ob/Fsp27�/� mice compared with that in ob/obmice (Supplementary Table 1). Importantly, expression levels ofgenes in the inflammatory response pathway, B- and T-cellreceptor signalling pathway and chemokine signalling pathwaywere all markedly decreased (Fig. 2a and Supplementary Table 1).A similar comparison of gene expression data from GWAT of
ob/ob ob/ob/Fsp27 –/–ob/ob ob/ob/Fsp27 –/–
H a
nd E
ob/ob ob/ob/Fsp27 –/–
EM
Cidea
Perilipin2
Perilipin1
Fsp27
Cyto C
Cox4
CEBPβ
PPARγ
Actin
ob/ob ob/ob/Fsp27 –/–
MR
I
ATGL
CGI58
HSL
LD-associatedprotein
Mitochondriaactivity
Lipolysisprotein
Differentiationprotein
GW
AT
0
250
500
750
***
GW
AT
TA
Gs
( μg
mg–1
)
0
100
200
300
Lipi
d dr
ople
t num
ber/
cell
0
2
4
2070
120170
***
LD d
iam
eter
(μm
)
0 5,000 10,000 15,000 20,0000
100
200
300
400
500ob/ob
ob/ob/Fsp27 –/–
Fre
quen
cy
0
10
20
30
40
50
60
Body w
eight
Fat m
ass
Lean
mas
s
***
***
Wei
ght (
g)
ob/obob/ob/Fsp27 –/–
43
2672
55
26
17
17
55
43
95
55
55
Area (μm2)
Figure 1 | Reduced fat mass in the ob/ob/Fsp27�/� mice. Four-month-old ob/ob and ob/ob/Fsp27�/� mice were maintained on a chow diet for the
analyses shown in (a–i). (a) computed tomography (CT) scan analysis of the mice; fat is shown in yellow. (b) GWAT of ob/ob and ob/ob/Fsp27�/� mice.
(c) Body composition of ob/ob (n¼ 5) and ob/ob/Fsp27�/� mice (n¼ 6). (d) Decreased TAG content in the GWAT of the ob/ob and ob/ob/Fsp27�/�
mice (n¼ 5). (e) Abdominal magnetic resonance imaging (MRI) of ob/ob and ob/ob/Fsp27�/� mice (upper panel). Fat is shown in white in these MRI
images. GWAT morphology (middle and lower panels). H&E, haematoxylin and eosin staining; EM, electron microscope. Scale bar, 64 and 2 mm for H&E
staining and EM, respectively. (f) LD number per adipocyte in ob/ob and ob/ob/Fsp27�/� mice. The number of LDs in ten adipocytes was measured.
(g) The average LD diameter in the GWAT of ob/ob and ob/ob/Fsp27�/� mice. The diameter of LDs in ten adipocytes was measured. (h) The distribution
of fat cell size in the GWAT of ob/ob and ob/ob/Fsp27�/� mice. The fat cell area from 400 adipocytes was measured. (i) A representative western
blotting showing the expression pattern of Fsp27, Perilipin1, Perilipin2, Cidea, Cyto C, Cox4, ATGL, CGI58, HSL, CEBPb and PPARg in the GWAT of
ob/ob and ob/ob/Fsp27�/� mice. Actin was used as a loading control. Quantitative data are presented as mean±s.e.m. Significance was established
using a two-tailed Student’s t-test. Differences were considered significant at Po0.05. ***Po0.001.
NATURE COMMUNICATIONS | DOI: 10.1038/ncomms6949 ARTICLE
NATURE COMMUNICATIONS | 6:5949 | DOI: 10.1038/ncomms6949 | www.nature.com/naturecommunications 3
& 2015 Macmillan Publishers Limited. All rights reserved.

chow-fed Fsp27�/� and WT mice revealed no significantdifferences in inflammatory pathways (Supplementary Table 2).Thus, the reduction in expression of genes involved in pro-inflammatory pathways was specific to the ob/ob/Fsp27�/� mice.
We further validated these data by semi-quantitative reversetranscription–PCR and observed significantly lower expressionfor F4/80 (a macrophage-specific marker), Cd11c (a marker ofM1-like macrophages), TNFa, SAA3, MCP1 and IL-6 in the WATof ob/ob/Fsp27�/� mice (Fig. 2b). In contrast, expression levels ofnon-inflammatory M2 marker genes (Arg1, Ym1 and IL-4) weresimilar between ob/ob and ob/ob/Fsp27�/� mice (Fig. 2c).Immunohistochemical analyses also confirmed that F4/80 andtumour necrosis factor-a (TNFa) protein levels were significantlylower in the WAT of ob/ob/Fsp27�/� mice (Fig. 2d,h). Consistentwith reduced adipose tissue inflammation, plasma levels ofinterleukin (IL)-6 and TNFa were significantly reduced in ob/ob/Fsp27�/� mice (Fig. 2e,f). In contrast, adiponectin messengerRNA expression in WAT and circulating adiponectin concentra-tions were considerably higher in the ob/ob/Fsp27�/� mice(Fig. 2c,g).
Cinti et al.24,25 have previously shown that 490% ofmacrophages infiltrating WAT typically surround deadadipocytes forming crown-like structures (CLSs), and that thenumber of CLSs present in the WAT of ob/ob mice is significantlyelevated. In ob/ob/Fsp27�/�mice, we observed a dramaticreduction in CLS compared with ob/ob mice (Fig. 2h). Exactlywhat causes cell death in hypertrophic adipocytes remainsunclear, but Giordano et al.26 and others27 have suggested thatNLRP3-dependent caspase-1 activation is likely to induce celldeath by pyroptosis, a proinflammatory form of programmed celldeath. In keeping with these data, we also observed significantlyreduced expression of ASC, NLRP3, Caspase-1 and TXNIP in theadipose tissue of ob/ob/Fsp27�/�mice (Fig. 2i).
The reduction in WAT inflammation in ob/obFsp27�/� miceprompted us to review the biopsy we had previously obtainedfrom the patient with the E186X homozygous CIDEC mutation14.Careful review of this sample obtained from axilliary white fatindicated that this patient’s WAT was characterized by a mixedpopulation of larger unilocular and smaller multilocular cells, andthat the CLSs were only observed in relation to unilocular cells
F4/
80
ob/ob ob/ob/Fsp27 –/–
Ser
um a
dipo
nect
in (
μg m
l–1)
0
5
10
15
**
Ser
um IL
-6 (
pg m
l–1)
0.0
2.5
5.0
7.5
***
Ser
um T
NF
α (p
g m
l–1)
0
10
20
30***
ob/ob
ob/ob/Fsp27 –/–
ob/ob ob/ob/Fsp27 –/–
0.0
0.2
0.4
0.6
0.8
1.0
1.2
TNFαSAA3
IL-1
8IL
-6
MCP1
*
*****
***
*** ***
F4/80
CD11c
Rel
ativ
e m
RN
A le
vel
0.0
0.5
1.0
1.5
2.0
2.5
3.0
Arg1
Ym1
IL-1
0IL
-4
*
**
Adipon
ectin
Rel
ativ
e m
RN
A le
vel
0
100
200
300
400
500
***
Cro
wn-
like
stru
ctur
es
0.00
0.25
0.50
0.75
1.00
1.25
ASC
NLRP3
TXNIP
Caspa
se-1
******
* *
Rel
ativ
e m
RN
A le
vel
T-cell receptor signaling
Toll-like receptor signaling
Focal adhesion
Matrix metalloproteinases
Ptprc
Dock2
Eyb
Tlr8Tlr1
Tlr7
Tlr6Tlr4
Spp1
Itgax
Itgb2Itgam
Mmp12
Timp1
Mmp13
Mmp3
Tnf II6ra III8IIIr1
II2rg
II7r II4ra
III13ra1
Blnk
Lat2
ob/ob/Fsp27–/–
Cd72
Stap1Ccl2
Ccl5
Ccl9Ccl3
IL signaling
II3ra
Ev1 Vav1
Chemokine signaling
B-cell receptor signaling
Figure 2 | Reduced WAT inflammatory response in ob/ob/Fsp27�/� mice. Four-month-old chow-fed ob/ob and ob/ob/Fsp27�/� mice were
used for the analyses in (a–i). (a) Gene expression profiling in the GWAT of ob/ob and ob/ob/Fsp27�/� mice. Green circles represent downregulated genes
in the ob/ob/Fsp27�/� mice compared with ob/ob mice. The intensity of the green colour indicates the extent of downregulation.
(b) Relative mRNA expression of F4/80, CD11c and other pro-inflammatory genes, or (c) anti-inflammatory genes in the GWAT of ob/ob and ob/ob/Fsp27�/
� mice (n¼4 per group). (d) F4/80 immunohistochemical analysis in the GWAT of ob/ob and ob/ob/Fsp27�/� mice. Scale bar, 64mm.
(e) Serum concentration of IL-6 (n¼ 7 per group). (f) Serum concentration of TNFa (n¼ 7 for ob/ob and n¼ 9 for ob/ob/Fsp27�/� ). (g) Serum
concentration of adiponectin (n¼ 8 per group). (h) TNFa immunohistochemical analysis in the GWAT of ob/ob and ob/ob/Fsp27�/� mice showing
the CLSs (left). Right: statistic analysis of the CLSs per 1,000 adipocytes. Scale bar, 50mm. (i) Relative mRNA levels of ASC, NLRP3, Caspase-1 and TXNIP
in the GWAT of ob/ob and ob/ob/Fsp27�/� mice (n¼ 3 per group). Quantitative data are presented as mean±s.e.m. Significance was established
using a two-tailed Student’s t-test. Differences were considered significant at Po0.05. *Po0.05, **Po0.01, ***Po0.001.
ARTICLE NATURE COMMUNICATIONS | DOI: 10.1038/ncomms6949
4 NATURE COMMUNICATIONS | 6:5949 | DOI: 10.1038/ncomms6949 | www.nature.com/naturecommunications
& 2015 Macmillan Publishers Limited. All rights reserved.

(Supplementary Fig. 2). These observations are consistent withthe notion that the smaller multilocular Fsp27-null cells are lessprone to macrophage recruitment and activation. Overall, thesedata strongly indicate that the WAT of ob/obFsp27�/� mice isdefective in storing lipid and manifests reduced chronicinflammation.
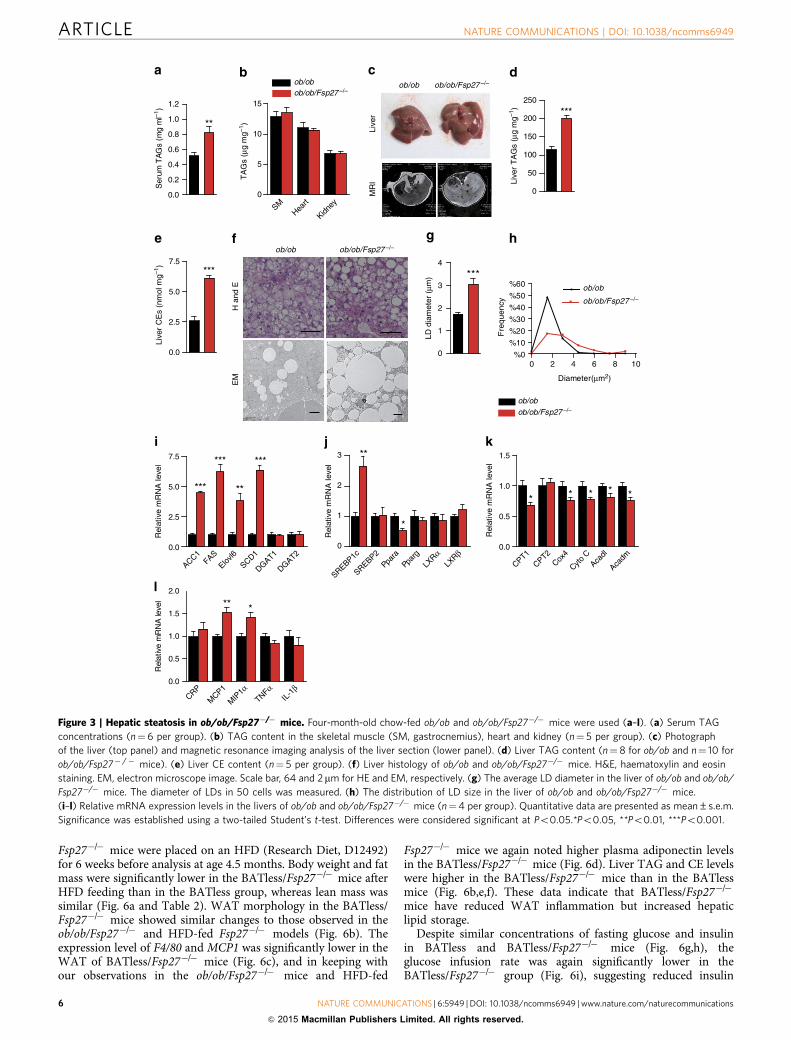
Fatty liver and insulin resistance in ob/ob/Fsp27�/� mice. Asdefective adipose lipid storage often results in increased circu-lating triglyceride (TAG) levels and ectopic lipid deposition, wemeasured TAG levels in the serum and in several other tissues.Serum TAG concentrations were found to be significantly higherin ob/ob/Fsp27�/� mice compared with that in ob/ob mice(Fig. 3a). No difference in tissue weight and TAG levels wereobserved in the skeletal muscle (Gastrocnemius), heart or kidneysof ob/ob and ob/ob/Fsp27�/� mice (Table 1 and Fig. 3b). How-ever, the size and weight of livers of ob/ob/Fsp27�/� mice weresignificantly greater than those of ob/ob mice (Fig. 3c andTable 1). Hepatic levels of TAG and cholesterol ester (CE) weresignificantly greater in ob/ob/Fsp27�/� mice (Fig. 3d,e).Consistent with this, larger LDs were observed in the liver ofob/ob/Fsp27�/� mice (Fig. 3f–h). The interscapular BAT depotwas larger in the ob/ob/Fsp27�/� mice than in the ob/ob mice(Table 1 and Supplementary Fig. 3a) and contained larger LDsand elevated levels of TAG (Supplementary Fig. 3b,c).
Expression levels of several genes involved in hepatic de novolipogenesis (ACC1, FAS, Elovl6 and SCD1), and their majortranscriptional regulator SREBP1c, were found to be significantlyincreased in ob/ob/Fsp27�/� mice (Fig. 3i,j). In contrast,expression levels of several genes involved in fatty acid oxidationand oxidative phosphorylation (Ppara, CPT1, Cox4, Cyto C,ACADL and ACADM) were all slightly decreased in the liver ofob/ob/Fsp27�/�mice (Fig. 3j,k). Expression levels of inflammatorygenes such as MCP1 and MIP1a were increased in the liver of ob/ob/Fsp27�/� mice (Fig. 3l).
Fsp27�/� mice were previously shown to be glucose tolerantand more insulin sensitive than WT littermates when studied at21–23 �C on a chow diet12,13. We have also previously reportedthat glucose tolerance was improved in ob/ob/Fsp27�/� micecompared with ob/ob littermates when studied at a young age (10weeks12). When studied at age 4 months, fasting glucose andinsulin concentrations, glucose tolerance tests and insulintolerance tests (ITTs) were again similar in ob/ob/Fsp27�/� andob/ob mice (Supplementary Fig. 3d–g). When studied at age 8.5months, fasting glucose and insulin concentrations remainedsimilar between ob/ob/Fsp27�/� and ob/ob mice (Fig. 4a,b).Glucose tolerance was also similar in both groups (Fig. 4c).However, ITTs appeared to demonstrate insulin resistance(Fig. 4d) in the ob/ob/Fsp27�/� group. To more precisely assessinsulin sensitivity, we performed hyperinsulinaemic–euglycaemicclamps in these mice (at age 4 months). When infusing insulin ata constant rate (15 mU kg� 1 min� 1), the exogenous glucoseinfusion rate required to maintain euglycaemia was much lowerin ob/ob/Fsp27�/� mice compared with ob/ob mice, confirmingreduced systemic insulin sensitivity (Fig. 4e,f). Glucose turnover,glycolysis and glycogen synthesis were similar in the ob/ob/Fsp27�/� group (Fig. 4g). However, radio-isotope tracer analysissuggested that hepatic glucose output (production) was higher inthe ob/ob/Fsp27�/�mice than in the ob/ob group in the basal stateand during the insulin infusion (Fig. 4h). Consistently, expressionlevels of gluconeogenic genes (G6pc and Pck1) were increased inthe liver of ob/ob/Fsp27�/�mice (Fig. 4i).
We next assessed insulin signalling in various tissues ofob/ob/Fsp27�/� mice following tail vain injection of insulin.Insulin-induced Akt phosphorylation was similar in the muscle
and BAT of ob/ob and ob/ob/Fsp27�/�mice, and was increased inthe GWAT of ob/ob/Fsp27�/� mice (Fig. 4j–l). However, insulin-stimulated Akt phosphorylation was significantly reduced in theliver of ob/ob/Fsp27�/� mice (Fig. 4m), suggesting reducedhepatic insulin signalling. These data indicate that ob/ob/Fsp27�/
� mice have systemic insulin resistance, which is mostlyattributed to severe hepatic insulin resistance despite reducedinflammation and increased insulin-stimulated Akt phosphoryla-tion in WAT.
Fatty liver and insulin resistance in HFD-fed Fsp27�/� mice.To check whether reduced WAT inflammation and hepaticinsulin resistance also occur in Fsp27-deficient mice with diet-induced obesity, Fsp27�/� mice were fed with an high-fat diet(HFD; Research Diet, D12331) for 3 months. HFD feeding (for 3months) has very little effect on Fsp27 expression in WAT depotsin WT mice (Supplementary Fig. 4a). However, Fsp27 expressionis clearly elevated in WAT depots in ob/ob mice (SupplementaryFig. 4a). Body weight remained similar in HFD-fed WT andFsp27�/� mice (Supplementary Fig. 4b,c), but liver and BATmass were significantly higher in the Fsp27�/� mice(Supplementary Fig. 4d,e). Fat mass, including GWAT, sub-cutaneous fat and mesenteric fat, was significantly reduced inFsp27�/� mice (Supplementary Fig. 4d,e). Reduced LD sizes andlower TAG levels were observed in the WAT of Fsp27�/� mice(Fig. 5a,b). In contrast, serum TAG concentrations (Fig. 5c), thesize of LDs and cellular TAG content in the BAT, liver and iso-lated hepatocytes of HFD-fed Fsp27�/� mice were all increased(Fig. 5a,b). In agreement with reduced inflammation in the WATof ob/ob/Fsp27�/� mice, expression levels of F4/80, TNFa andMCP1 in the WAT of HFD-fed Fsp27�/� mice were reduced(Fig. 5d). Reduced serum IL-6 concentrations and elevated serumadiponectin concentrations were also observed in these mice(Fig. 5e,f). Consistent with increased hepatic inflammation inob/ob/Fsp27�/� mice, expression levels of MCP1, MIP1a, TNFaand IL-1b were increased in the liver of HFD-fed Fsp27�/� mice(Fig. 5g). Thus, HFD-fed Fsp27-deficient mice displayed reducedWAT inflammation but increased hepatic lipid accumulation.
Next, we measured fasting glucose and insulin concentrations,and found them to be significantly higher than those of WT mice(Fig. 5h,i). Blood glucose concentrations were also higher in theHFD-fed Fsp27�/� mice during the first 1 h of the clampexperiment (Fig. 5j). When infusing insulin at a constant rate(3 mU kg� 1 min� 1), the glucose infusion rate required tomaintain euglycaemia was much lower in Fsp27�/� mice fedwith an HFD (Fig. 5k). In addition, basal and clamp hepaticglucose output were increased in the HFD-fed Fsp27�/� group(Fig. 5l). Consistent with increased glucose output, the expressionlevels of G6pc and Pck1 were increased in the liver of HFD-fedFsp27�/� mice (Fig. 5m). Glucose turnover, glycolysis andglycogen synthesis were similar in the HFD-fed Fsp27�/� group(Fig. 5n). Overall, these data suggest that Fsp27 deficiency alsoinduces hepatic steatosis and insulin resistance despite reducedWAT inflammation in HFD-fed mice.
Fatty liver and insulin resistance in BATless/Fsp27�/� mice. AsBAT could conceivably aid adaptation to any deficiency in WATlipid storage, especially in mice with less fat mass housed in arelatively cold environment where thermogenesis is typicallyenhanced, we also sought to ascertain the importance of ther-mogenic BAT in these mice by crossing the Fsp27 knockouts withBATless mice23. BATless mice were previously shown to lackBAT as a result of BAT-selective expression of diphtheriatoxinand are susceptible to HFD-induced obesity and insulinresistance28. At age 3 months, BATless and littermate BATless/
NATURE COMMUNICATIONS | DOI: 10.1038/ncomms6949 ARTICLE
NATURE COMMUNICATIONS | 6:5949 | DOI: 10.1038/ncomms6949 | www.nature.com/naturecommunications 5
& 2015 Macmillan Publishers Limited. All rights reserved.
Fsp27�/� mice were placed on an HFD (Research Diet, D12492)for 6 weeks before analysis at age 4.5 months. Body weight and fatmass were significantly lower in the BATless/Fsp27�/� mice afterHFD feeding than in the BATless group, whereas lean mass wassimilar (Fig. 6a and Table 2). WAT morphology in the BATless/Fsp27�/� mice showed similar changes to those observed in theob/ob/Fsp27�/� and HFD-fed Fsp27�/� models (Fig. 6b). Theexpression level of F4/80 and MCP1 was significantly lower in theWAT of BATless/Fsp27�/� mice (Fig. 6c), and in keeping withour observations in the ob/ob/Fsp27�/� mice and HFD-fed
Fsp27�/� mice we again noted higher plasma adiponectin levelsin the BATless/Fsp27�/� mice (Fig. 6d). Liver TAG and CE levelswere higher in the BATless/Fsp27�/� mice than in the BATlessmice (Fig. 6b,e,f). These data indicate that BATless/Fsp27�/�
mice have reduced WAT inflammation but increased hepaticlipid storage.
Despite similar concentrations of fasting glucose and insulinin BATless and BATless/Fsp27�/� mice (Fig. 6g,h), theglucose infusion rate was again significantly lower in theBATless/Fsp27�/� group (Fig. 6i), suggesting reduced insulin
ob/ob ob/ob/Fsp27 –/–
H a
nd E
EM
0.0
2.5
5.0
7.5***
Live
r C
Es
(nm
ol m
g–1)
0
50
100
150
200
250
***
Live
r T
AG
s (μ
g m
g–1)
0.0
0.2
0.4
0.6
0.8
1.0
1.2
**
Ser
um T
AG
s (m
g m
l–1)
0.0
2.5
5.0
7.5
ob/obob/ob/Fsp27 –/–
FAS
Elovl6
ACC1
SCD1
DGAT1
DGAT2
***
***
**
***
Rel
ativ
e m
RN
A le
vel
0
1
2
3
SREBP1c
SREBP2Ppa
raPp
arg
LXRα
LXRβ
**
*
Rel
ativ
e m
RN
A le
vel
0.0
0.5
1.0
1.5
CPT1CPT2
Cox4
Cyto C
Acadl
Acadm
* * * * *R
elat
ive
mR
NA
leve
l
0.0
0.5
1.0
1.5
2.0
CRP
MIP
1αIL
-1β
TNFαM
CP1
** *
Rel
ativ
e m
RN
A le
vel
0
5
10
15
ob/obob/ob/Fsp27 –/–
SMHea
rt
Kidney
TA
Gs
(μg
mg–1
)
ob/ob ob/ob/Fsp27 –/–
Live
rM
RI
0 2 4 6 8 10%0
%10
%20
%30
%40
%50
%60 ob/ob
ob/ob/Fsp27 –/–
Diameter(μm2)
Fre
que
ncy
0
1
2
3
4
***
LD d
iam
eter
(μm
)
Figure 3 | Hepatic steatosis in ob/ob/Fsp27�/� mice. Four-month-old chow-fed ob/ob and ob/ob/Fsp27�/� mice were used (a–l). (a) Serum TAG
concentrations (n¼6 per group). (b) TAG content in the skeletal muscle (SM, gastrocnemius), heart and kidney (n¼ 5 per group). (c) Photograph
of the liver (top panel) and magnetic resonance imaging analysis of the liver section (lower panel). (d) Liver TAG content (n¼ 8 for ob/ob and n¼ 10 for
ob/ob/Fsp27� /� mice). (e) Liver CE content (n¼ 5 per group). (f) Liver histology of ob/ob and ob/ob/Fsp27�/� mice. H&E, haematoxylin and eosin
staining. EM, electron microscope image. Scale bar, 64 and 2mm for HE and EM, respectively. (g) The average LD diameter in the liver of ob/ob and ob/ob/
Fsp27�/� mice. The diameter of LDs in 50 cells was measured. (h) The distribution of LD size in the liver of ob/ob and ob/ob/Fsp27�/� mice.
(i–l) Relative mRNA expression levels in the livers of ob/ob and ob/ob/Fsp27�/� mice (n¼4 per group). Quantitative data are presented as mean±s.e.m.
Significance was established using a two-tailed Student’s t-test. Differences were considered significant at Po0.05.*Po0.05, **Po0.01, ***Po0.001.
ARTICLE NATURE COMMUNICATIONS | DOI: 10.1038/ncomms6949
6 NATURE COMMUNICATIONS | 6:5949 | DOI: 10.1038/ncomms6949 | www.nature.com/naturecommunications
& 2015 Macmillan Publishers Limited. All rights reserved.

sensitivity. Similar to the observations in the ob/ob/Fsp27�/� andthe HFD-fed Fsp27�/� mice, both basal and clamp hepaticglucose production were increased in the BATless/Fsp27�/� mice,suggesting significant hepatic insulin resistance(Fig. 6j). Glucose turnover and glycolysis rates were similar,whereas glycogen synthesis appeared to be elevated in theBATless/Fsp27�/� mice (Fig. 6k). In conclusion, Fsp27
deficiency in this BAT-deficient model also resulted in reducedWAT inflammation but increased hepatic insulin resistance.
Increased Cidea expression in ob/ob/Fsp27�/� mice liver. Asmentioned previously, Fsp27 expression is typically increased insteatotic livers and knocking it down has been shown to alleviate
ob/ob
ob/ob/Fsp27 –/–
###
0.0
0.5
1.0
1.5
2.0
2.5
G6pc Pck1
*
*
Rel
ativ
e m
RN
A le
vel
0.0
0.2
0.4
0.6
0.8
1.0
1.2
**
Rel
ativ
e pr
otei
n le
vel
Liver
ob/ob ob/ob/Fsp27 –/–
pAKT(S473)
AKT
Insulin
0
100
200
300
400
Fas
ting
insu
lin (
μU m
l–1)
0
50
100
150
200
250
Fas
ting
gluc
ose
(mg
dl–1
)
Muscle
0.0
0.2
0.4
0.6
0.8
1.0
1.2
Rel
ativ
e pr
otei
n le
vel
ob/ob ob/ob/Fsp27 –/–
pAKT(S473)
AKT
Insulin
pAKT(S473)
AKT
Insulin
ob/ob ob/ob/Fsp27 –/–
BAT
0.0
0.2
0.4
0.6
0.8
1.0
1.2
Rel
ativ
e pr
otei
n le
vel
GWAT
0
1
2
3
*
Rel
ativ
e pr
otei
n le
vel
ob/ob ob/ob/Fsp27 –/–
pAKT(S473)
AKT
Insulin
0 60 120 1800
50
100
150
200
250
ob/ob
ob/ob/Fsp27 –/–
Time (min)
Blo
od g
luco
se r
ate
(%
of b
asal
)
0 60 120 180
0
50
100
150
******
*
**
Time (min)
Blo
od g
luco
se r
ate
(% o
f bas
al)
0 30 60 90 120
0
5
10
15
20
25
30
Time (min)
Glu
cose
infu
sion
rat
e(m
g kg
–1 le
an m
ass
min
–1)
0 30 60 90 1200
50100150200250300350400
** *
Time (min)
Blo
od g
luco
se le
vel (
mg
dl–1
)
0
10
20
30
40
50
60
70
Basal Clamp
**
**
Hep
atic
glu
cose
out
put
(mg
kg–1
lean
mas
s m
in–1
)
0
10
20
30
40
50
60
70
Glucos
e
turn
over
Glycoly
sis
Glycog
en
synt
hesis
Glu
cose
flux
(mg
kg–1
lean
mas
s m
in–1
)
###
55
55
55
55
55
55
55
55
+++– +++–+++–+++–
+++–+++–
+++–+++–
Figure 4 | Insulin-resistant phenotype of ob/ob/Fsp27�/� mice. (a) Fasting glucose and (b) fasting insulin concentrations of chow-fed 8.5-month-old
ob/ob (n¼ 6) and ob/ob/Fsp27�/� (n¼ 7) mice. (c) Glucose tolerance tests (GTTs) and (d) ITTs in chow-fed 8.5-month-old ob/ob (n¼ 7) and
ob/ob/Fsp27�/� (n¼8) mice. Peripheral and hepatic insulin sensitivity were assessed in 4-month-old male mice using hyperinsulinaemic–euglycaemic
clamps (e–h, ob/ob, n¼ 11; ob/ob/Fsp27�/� , n¼ 6). (e) Blood glucose concentrations during the clamp experiment. (f) Glucose infusion rates.
(g) Peripheral glucose turnover. (h) Hepatic glucose output during basal and clamp conditions. (i) Relative mRNA level of G6pc and Pck1 in the liver (n¼4
per group). Insulin was injected in three pairs of anaesthetized 4-month-old male ob/ob and ob/ob/Fsp27�/� mice. Representative images of basal and
insulin-stimulated phospho-AKT (Ser473) levels in the muscle (j), BAT (k), gonadal fat (GWAT) (l) and liver (m). Quantitative data are presented as
mean±s.e.m. Significance was established using a two-tailed Student’s t-test. Differences were considered significant at Po0.05.*Po0.05, **Po0.01,
***Po0.001. Two-way repeated-measurement analyses of variance were used to evaluate the data in Fig. 4c,d,f (###Po0.001 in this figure indicates that
the two groups respond differently following the intervention).
NATURE COMMUNICATIONS | DOI: 10.1038/ncomms6949 ARTICLE
NATURE COMMUNICATIONS | 6:5949 | DOI: 10.1038/ncomms6949 | www.nature.com/naturecommunications 7
& 2015 Macmillan Publishers Limited. All rights reserved.

Live
rH
epat
ocyt
e bo
dipy
+/+ Fsp27 –/–HFD
0
50
100
150
200
250***
Fas
ting
gluc
ose
(mg
dl–1
)
0
10
20
30
40
50
60 *
Fas
ting
insu
lin (
μU m
l–1)
###
0
5
10
15
20
25
Basal Clamp
***
***
Hep
atic
glu
cose
out
put
(mg
kg–1
min
–1)
0
100
200
300
400
500
GWAT
BATLiv
er
*** ***
***
Trig
lyce
rides
(μg
mg–1
)
0
10
20 ***S
erum
adi
pone
ctin
(μg
ml–1
)
0.0
0.5
1.0
1.5
F4/80
CD11c
TNFαSAA3
MCP1
Arg1
Ym1
** ** **
Rel
ativ
e m
RN
A le
vel
GWAT
+/+ HFD
Fsp27 –/– HFD
0 30 60 90 120
0
5
10
15
20
25
30
35+/+ HFDFsp27 –/– HFD
Time (min)
Glu
cose
infu
sion
rat
e(m
g kg
–1 m
in–1
)
0 30 60 90 120
0
50
100
150
200
250
300
*****
Time (min)
Blo
od g
luco
se le
vel (
mg
dl–1
)0
2
4
6
8
10
**
Ser
um IL
-6 (
pg m
l–1)
0.0
0.1
0.2
0.3
0.4
**
Ser
um T
AG
s (m
g m
l–1)
0
2
4
6
CRP
MIP
1αIL
1βM
CP1
*
**
***
Rel
ativ
e m
RN
A le
vel
Liver
0
1
2
3
G6pc Pck1
*****
Rel
ativ
e m
RN
A le
vel
0
10
20
30
Glucos
e
turn
over
Glycoly
sis
Glycog
en
synt
hesis
Glu
cose
flux
(mg
kg–1
min
–1)
TNFα
GW
AT
BA
T
Figure 5 | Hepatic steatosis and insulin resistance but reduced WAT inflammation in HFD-fed Fsp27�/� mice. Three-month-old WT and Fsp27�/� mice
were challenged with a HFD (D12331, 58% kcal of fat) for 3 months (a–g). (a) Morphology of WAT, BAT and liver in WT and Fsp27�/� mice. Scale bar,
64mm for H&E (haematoxylin and eosin staining). Isolated hepatocytes were stained with bodipy 493/503. Scale bar, 10mm. (b) TAG content in WAT, BAT
and liver (n¼ 5 per group). (c) Serum TAG concentrations (n¼6 for WT and n¼ 8 for Fsp27�/� ). (d) Relative mRNA levels (n¼4 per group).
(e) Serum IL-6 concentrations (n¼ 7 per group). (f) Serum adiponectin concentrations (n¼8 per group). (g) Relative mRNA levels (n¼4 per group).
Three-month-old WT (n¼ 6) and Fsp27�/� mice (n¼6) were challenged with an HFD (D12492, 60% kcal of fat) for 6 weeks (h–n). Fasting blood glucose
(h) and insulin (i) concentrations of WT and Fsp27�/� mice. Peripheral and hepatic insulin sensitivity were assessed using hyperinsulinaemic–euglycaemic
clamps (j–l,n; WT, n¼6; Fsp27�/� , n¼6). (j) Blood glucose concentrations during the hyperinsulinaemic–euglycaemic clamp. (k) Glucose infusion rates.
(l) Hepatic glucose output during the basal and hyperinsulinaemic clamp conditions. (m) Relative mRNA level of G6pc and Pck1 in the liver (n¼4 per
group). (n) Peripheral glucose turnover. Quantitative data are presented as mean±s.e.m. Significance was established using a two-tailed Student’s t-test.
Differences were considered significant at Po0.05.*Po0.05, **Po0.01, ***Po0.001. Two-way repeated-measurement analyses of variance were used to
evaluate the data in Fig. 5k (###Po0.001 in this figure indicates that the two groups respond differently following the intervention).
ARTICLE NATURE COMMUNICATIONS | DOI: 10.1038/ncomms6949
8 NATURE COMMUNICATIONS | 6:5949 | DOI: 10.1038/ncomms6949 | www.nature.com/naturecommunications
& 2015 Macmillan Publishers Limited. All rights reserved.
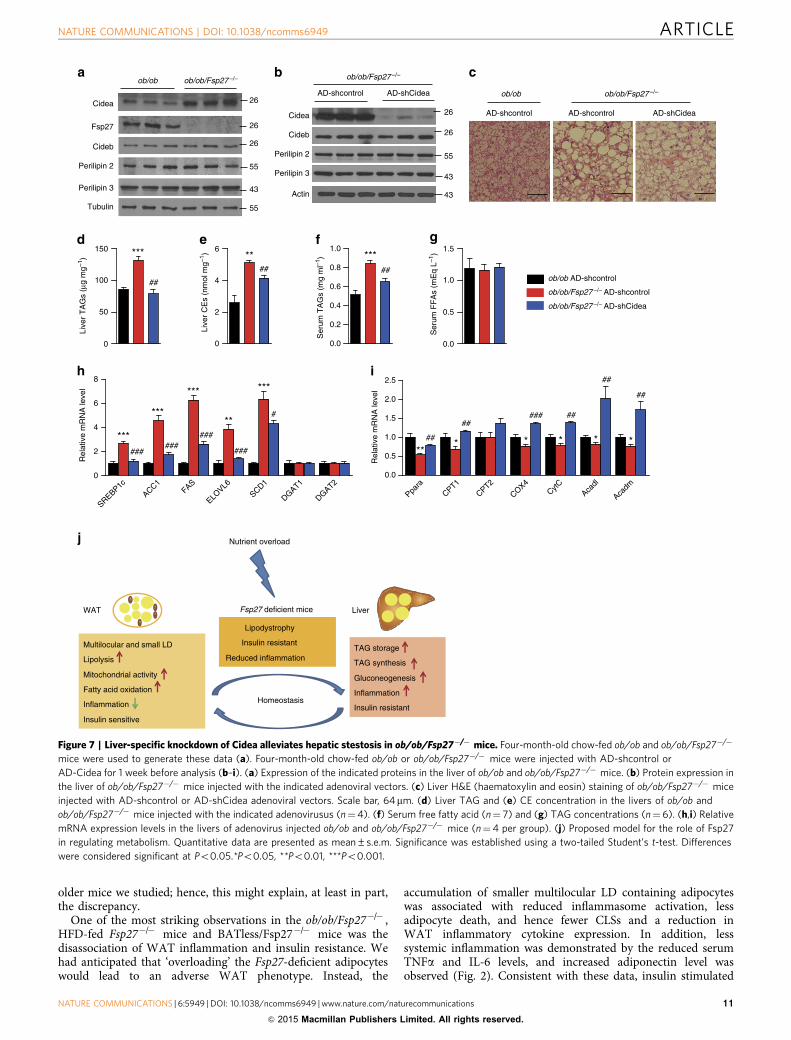
hepatic steatosis5. We therefore sort to understand the molecularpathways involved in mediating the hepatic steatosis observed inour Fsp27�/� models. We began by checking the expression levelsof several LD-associated proteins in the livers of ob/ob and ob/ob/Fsp27�/� mice. Cidea expression (mRNA and protein) wasmarkedly increased in the livers of ob/ob/Fsp27�/� mice (Fig. 7a
(protein) and Supplementary Fig. 5a (mRNA)), whereasexpression of other LD-associated proteins including Cideb andPerilipin 2/3 were similar between ob/ob/Fsp27�/� and ob/obmice (Fig. 7a and Supplementary Fig. 5a). The protein stability ofCidea but not Cideb and Perilipin 2 was also significantlyincreased in the liver of ob/ob/Fsp27�/� mice, suggesting that the
###
BATless
BATless/Fsp27 –/–
0
5
10
15
20
25
Basal Clamp
***
**
Hep
atic
glu
cose
out
put
(mg
kg–1
min
–1)
0
10
20
30
40
50
BW
Fat m
ass
Lean
mas
s
***
After HFD
***
Wei
ght (
g)
0
10
20
30
Glucos
e
turn
over
Glycoly
sis
Glycog
en
synt
hesis
**Glu
cose
flux
(mg
kg–1
min
–1)
0
50
100
150
200
Fas
ting
gluc
ose
(mg
dl–1
)
0 30 60 90 120
0
2
4
6
8
10
12
14BATless HFD
BATless/Fsp27–/– HFD
Time (min)
Glu
cose
infu
sion
rat
e(m
g kg
–1 m
in–1
)
0
20
40
60
80
Fas
ting
insu
lin (
μU m
l–1)
0
25
50
75
100
125 **
Live
r T
AG
s (μ
g m
g–1)
0
1
2
3
4
5
6
7 **
Live
r C
Es
(μg
mg–1
)
0.0
0.2
0.4
0.6
0.8
1.0
1.2
1.4
F4/80 MCP1
****R
elat
ive
mR
NA
leve
l
05
1015202530354045 ***
Pla
sma
adip
onec
tin (
μg m
l–1)
WAT
Live
rLi
ver
oil r
edW
AT
BATless BATless/Fsp27 –/–
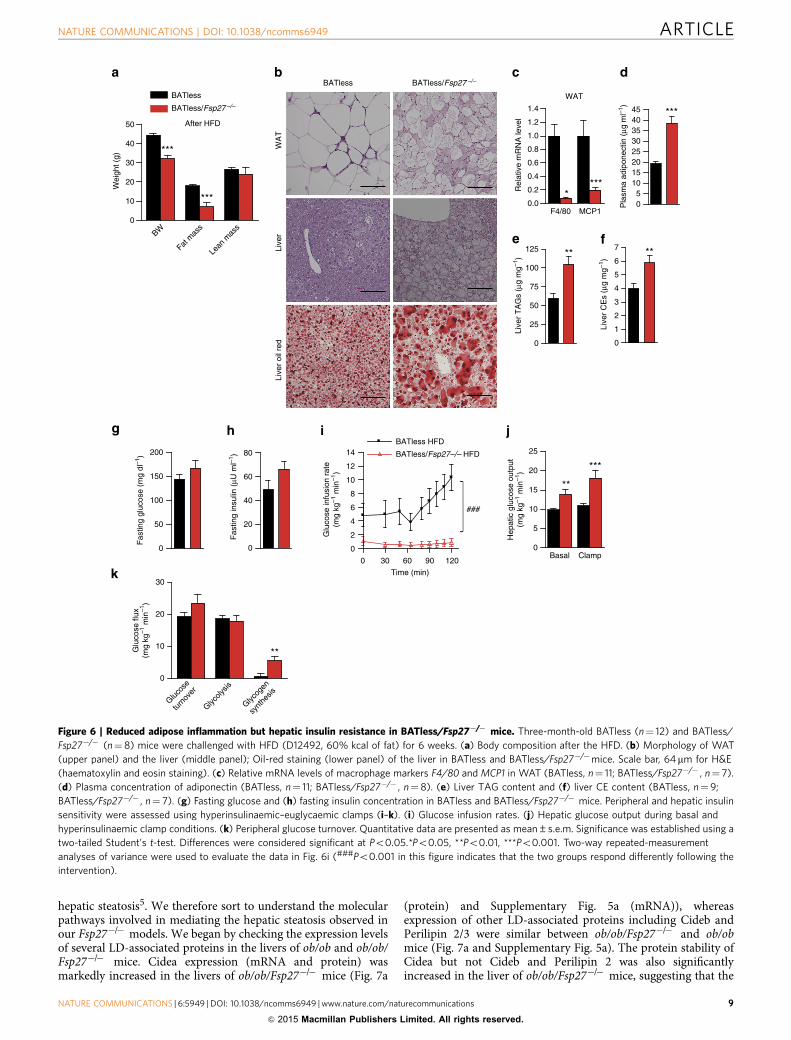
Figure 6 | Reduced adipose inflammation but hepatic insulin resistance in BATless/Fsp27�/� mice. Three-month-old BATless (n¼ 12) and BATless/
Fsp27�/� (n¼ 8) mice were challenged with HFD (D12492, 60% kcal of fat) for 6 weeks. (a) Body composition after the HFD. (b) Morphology of WAT
(upper panel) and the liver (middle panel); Oil-red staining (lower panel) of the liver in BATless and BATless/Fsp27�/�mice. Scale bar, 64mm for H&E
(haematoxylin and eosin staining). (c) Relative mRNA levels of macrophage markers F4/80 and MCP1 in WAT (BATless, n¼ 11; BATless/Fsp27�/� , n¼ 7).
(d) Plasma concentration of adiponectin (BATless, n¼ 11; BATless/Fsp27�/� , n¼8). (e) Liver TAG content and (f) liver CE content (BATless, n¼9;
BATless/Fsp27�/� , n¼ 7). (g) Fasting glucose and (h) fasting insulin concentration in BATless and BATless/Fsp27�/� mice. Peripheral and hepatic insulin
sensitivity were assessed using hyperinsulinaemic–euglycaemic clamps (i–k). (i) Glucose infusion rates. (j) Hepatic glucose output during basal and
hyperinsulinaemic clamp conditions. (k) Peripheral glucose turnover. Quantitative data are presented as mean±s.e.m. Significance was established using a
two-tailed Student’s t-test. Differences were considered significant at Po0.05.*Po0.05, **Po0.01, ***Po0.001. Two-way repeated-measurement
analyses of variance were used to evaluate the data in Fig. 6i (###Po0.001 in this figure indicates that the two groups respond differently following the
intervention).
NATURE COMMUNICATIONS | DOI: 10.1038/ncomms6949 ARTICLE
NATURE COMMUNICATIONS | 6:5949 | DOI: 10.1038/ncomms6949 | www.nature.com/naturecommunications 9
& 2015 Macmillan Publishers Limited. All rights reserved.
observed increase in Cidea expression is a consequence oftranscriptional changes as well as changes in protein degradation(Supplementary Fig. 5b). Similar changes in Cidea protein levelswere apparent in the livers of HFD-fed Fsp27�/� mice(Supplementary Fig. 5c–e).
To evaluate the physiological significance of the observedchanges in hepatic Cidea expression, we proceeded to knockdownCidea expression using adenovirally delivered short hairpin RNAagainst Cidea in ob/ob/Fsp27�/� mice. This strategy resulted in asubstantial (B90%) knockdown of Cidea (Fig. 7b) but had nodiscernible effect on Cideb or Perilipin2/3 expression (Fig. 7b).Depletion of Cidea led to a significant reduction in LD size andboth TAG and CE content in the liver of ob/ob/Fsp27�/� mice(Fig. 7c–e). Knocking down Cidea in isolated hepatocytes fromob/ob/Fsp27�/� or HFD-fed Fsp27�/� mice also reduced TAGconcentration (Supplementary Fig. 5f–i). These changes in liverlipid accumulation were not associated with differences in foodintake, body weight or serum free fatty acid concentrations(Fig. 7f). However, they did correspond with differences in serumTAG concentrations (Fig. 7g).
These findings suggest that the observed increase in hepaticCidea expression compensates for the absence of Fsp27 andfacilitates liver lipid accumulation. Furthermore, many of thechanges in gene expression noted in the livers of ob/ob/Fsp27�/�
mice (see Fig. 3i–k) were reversed following Cidea knockdown.Specifically, expression levels of SREBP1c and some of itsdownstream target genes (ACC1, FAS, Elovl6 and SCD1) weresignificantly reduced when Cidea was depleted in the liver ofob/ob/Fsp27�/� mice (Fig. 7h), whereas expression of Pparaand some of its target genes were significantly increased in theliver of these mice (Fig. 7i). Collectively, these data suggestthat Cidea compensates functionally for the absence ofFsp27 in regulating hepatic lipid storage in ‘obese’ Fsp27-deficientmice.
DiscussionIn summary, our data suggest that Fsp27 deficiency significantlyreduces the capacity of white adipocytes/adipose tissue to storelipids in the face of severe energy overload and thus enhancessusceptibility to develop liver steatosis and hepatic insulinresistance (schematically illustrated in Fig. 7j). In this context,increases in hepatic Cidea expression appear to compensate forthe absence of liver Fsp27 expression and contribute to thedevelopment of hepatic steatosis. These mouse data are consistentwith the lipodystrophic phenotype reported in the human patientwith a homozygous CIDEC mutation14. Although this defect in
lipid storage is at least partly compensated for by increased fatoxidation and energy expenditure, the very modest increase inenergy expenditure is not sufficient to dispose off all the excesslipid/energy delivered to WAT in the context of leptin deficiencyor long-term exposure to an HFD; thus, lipid starts to accumulatein the liver. Here it impairs insulin signalling and induces hepaticinsulin resistance, which manifests as increased hepatic glucoseoutput and increased lipogenesis. Exactly how liver steatosis leadsto insulin resistance has been the subject of many previousstudies29 but remains incompletely understood30.
Our findings suggest that in the context of surplus energyintake, Fsp27 deficiency can switch a relatively ‘lean and healthy’insulin-sensitive animal to a ‘lipodystrophic’ insulin-resistantstate. This is particularly important when considering the leanphenotypes observed in several other mouse models and theirpotential relevance to humans, as mice are conventionally fed alow-fat diet and housed at a sub-thermoneutral temperature,conditions in which mice require higher metabolic activity,whereas humans live in a thermoneutral environment andconsume diets typically containing considerably more fat overprolonged periods of time. It is thus tempting to speculate thatother ‘lean’ mouse models19,22,31,32 that arise from defects inneutral lipid storage in WAT may also manifest a lipodystrophicphenotype with the development of hepatic steatosis and insulinresistance when exposed to a more extreme nutritional challengeas was previously reported for mice with a loss-of-function Ppargmutation33.
Our conclusions differ from those previously reported byNishino et al.13, who reported improved whole body and hepaticinsulin sensitivity in 12-week-old, HFD-fed (from age 4 weeks)Fsp27-null mice, and from those of Toh et al.12, who reportedimproved glucose and insulin tolerance in 10-week-old chow-fed ob/ob/Fsp27�/� . To comprehensively address thesediscrepancies, we have studied both of these independentlygenerated Fsp27 knockout lines, involved collaborators from bothof these original studies and ‘nutritionally’ challenged the Fsp27knockouts in three different ways. The consistency of our currentfindings is in our view compelling evidence for the conclusionswe report. The precise reasons for the discrepancies between ourdata and those of Nishino et al.13 are difficult to be certain of; allwe can say is that they studied the mice at a younger age (B12versus B20 weeks) and on a different HFD formulation, in adifferent laboratory environment. The work reported by Tohet al.12 did not include hyperinsulinaemic-euglycaemic clampsand the mice were again studied at a younger age (B10 weeks)than in the current studies. The differences we observed inglucose tolerance tests and ITTs were still relatively subtle in the
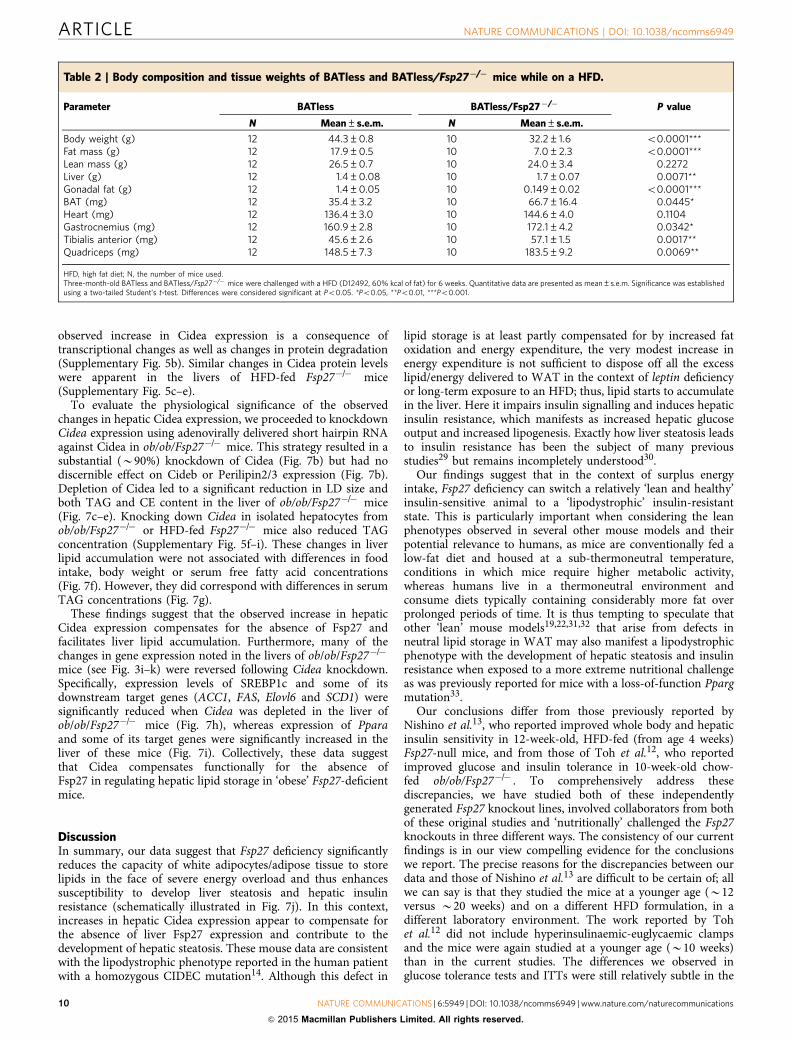
Table 2 | Body composition and tissue weights of BATless and BATless/Fsp27�/� mice while on a HFD.
Parameter BATless BATless/Fsp27�/� P value
N Mean±s.e.m. N Mean±s.e.m.
Body weight (g) 12 44.3±0.8 10 32.2±1.6 o0.0001***Fat mass (g) 12 17.9±0.5 10 7.0±2.3 o0.0001***Lean mass (g) 12 26.5±0.7 10 24.0±3.4 0.2272Liver (g) 12 1.4±0.08 10 1.7±0.07 0.0071**Gonadal fat (g) 12 1.4±0.05 10 0.149±0.02 o0.0001***BAT (mg) 12 35.4±3.2 10 66.7±16.4 0.0445*Heart (mg) 12 136.4±3.0 10 144.6±4.0 0.1104Gastrocnemius (mg) 12 160.9±2.8 10 172.1±4.2 0.0342*Tibialis anterior (mg) 12 45.6±2.6 10 57.1±1.5 0.0017**Quadriceps (mg) 12 148.5±7.3 10 183.5±9.2 0.0069**
HFD, high fat diet; N, the number of mice used.Three-month-old BATless and BATless/Fsp27�/� mice were challenged with a HFD (D12492, 60% kcal of fat) for 6 weeks. Quantitative data are presented as mean±s.e.m. Significance was establishedusing a two-tailed Student’s t-test. Differences were considered significant at Po0.05. *Po0.05, **Po0.01, ***Po0.001.
ARTICLE NATURE COMMUNICATIONS | DOI: 10.1038/ncomms6949
10 NATURE COMMUNICATIONS | 6:5949 | DOI: 10.1038/ncomms6949 | www.nature.com/naturecommunications
& 2015 Macmillan Publishers Limited. All rights reserved.
older mice we studied; hence, this might explain, at least in part,the discrepancy.
One of the most striking observations in the ob/ob/Fsp27�/� ,HFD-fed Fsp27�/� mice and BATless/Fsp27�/� mice was thedisassociation of WAT inflammation and insulin resistance. Wehad anticipated that ‘overloading’ the Fsp27-deficient adipocyteswould lead to an adverse WAT phenotype. Instead, the
accumulation of smaller multilocular LD containing adipocyteswas associated with reduced inflammasome activation, lessadipocyte death, and hence fewer CLSs and a reduction inWAT inflammatory cytokine expression. In addition, lesssystemic inflammation was demonstrated by the reduced serumTNFa and IL-6 levels, and increased adiponectin level wasobserved (Fig. 2). Consistent with these data, insulin stimulated
Fsp27
Cideb
Perilipin 2
Cidea
Tubulin
ob/ob ob/ob/Fsp27 –/–
AD-shCideaAD-shcontrol
AD-shcontrol AD-shCideaCidea
Actin
Cideb
Perilipin 2
Perilipin 3
Perilipin 3
TAG storage
TAG synthesis
Gluconeogenesis
Inflammation
Insulin resistant
Multilocular and small LD
Lipolysis
Mitochondrial activity
Fatty acid oxidation
Inflammation
Insulin sensitive
WAT Liver
Lipodystrophy
Insulin resistant
Reduced inflammation
Fsp27 deficient mice
Homeostasis
Nutrient overload
26
26
43
43
26
26
26
55
43
5555
ob/ob/Fsp27 –/–
0
50
100
150 ***
ob/ob AD-shcontrol
ob/ob/Fsp27 –/– AD-shcontrol
ob/ob/Fsp27 –/– AD-shCidea
##
Live
r T
AG
s (μ
g m
g–1)
0
2
4
6**
##
Live
r C
Es
(nm
ol m
g–1)
0.0
0.5
1.0
1.5
Ser
um F
FA
s (m
Eq
L–1)
0.0
0.2
0.4
0.6
0.8
1.0***
##
Ser
um T
AG
s (m
g m
l–1)
0
2
4
6
8
FAS
ELOVL6
ACC1
SCD1
DGAT1
DGAT2
**
*** ***
***
SREBP1c
###
Rel
ativ
e m
RN
A le
vel
###
###
#
***###
0.0
0.5
1.0
1.5
2.0
2.5
CPT2
COX4CPT1
CytCAca
dl
Acadm
***
*
Ppara
###
Rel
ativ
e m
RN
A le
vel
##
##
####
## ***
ob/ob/Fsp27 –/–
AD-shcontrol
ob/ob
Figure 7 | Liver-specific knockdown of Cidea alleviates hepatic stestosis in ob/ob/Fsp27�/� mice. Four-month-old chow-fed ob/ob and ob/ob/Fsp27�/�
mice were used to generate these data (a). Four-month-old chow-fed ob/ob or ob/ob/Fsp27�/� mice were injected with AD-shcontrol or
AD-Cidea for 1 week before analysis (b–i). (a) Expression of the indicated proteins in the liver of ob/ob and ob/ob/Fsp27�/� mice. (b) Protein expression in
the liver of ob/ob/Fsp27�/� mice injected with the indicated adenoviral vectors. (c) Liver H&E (haematoxylin and eosin) staining of ob/ob/Fsp27�/� mice
injected with AD-shcontrol or AD-shCidea adenoviral vectors. Scale bar, 64mm. (d) Liver TAG and (e) CE concentration in the livers of ob/ob and
ob/ob/Fsp27�/� mice injected with the indicated adenovirusus (n¼4). (f) Serum free fatty acid (n¼ 7) and (g) TAG concentrations (n¼6). (h,i) Relative
mRNA expression levels in the livers of adenovirus injected ob/ob and ob/ob/Fsp27�/� mice (n¼4 per group). (j) Proposed model for the role of Fsp27
in regulating metabolism. Quantitative data are presented as mean±s.e.m. Significance was established using a two-tailed Student’s t-test. Differences
were considered significant at Po0.05.*Po0.05, **Po0.01, ***Po0.001.
NATURE COMMUNICATIONS | DOI: 10.1038/ncomms6949 ARTICLE
NATURE COMMUNICATIONS | 6:5949 | DOI: 10.1038/ncomms6949 | www.nature.com/naturecommunications 11
& 2015 Macmillan Publishers Limited. All rights reserved.
Akt phosphorylation was improved in the WAT of ob/ob/Fsp27�/�
mice. Insulin-stimulated Akt phosphorylation in skeletal musclewas not affected by Fsp27 deficiency. Glucose tolerance, oneuseful indicator of b-cell function was also unaffected by Fsp27deficiency. This represents a very rare, but informative, model of‘pure WAT lipid storage limitation’ resulting in hepatic steatosisand hepatic insulin resistance; it also reminds us that althoughabundant data now emphasizes the importance of endocrine andcytokine WAT dysfunction, the primary role of WAT remainsenergy storage. Our data suggest that treating WAT inflammationalone may not be sufficient to improve systemic insulin sensitivityunless energy balance is also favourably modified. Clearly, ourdata does not prove that anti-inflammatory approaches totreating obesity-associated insulin resistance will not be usefuland we are aware of several mouse studies in which knockdownor inhibition of inflammatory signalling intermediates wereshown to improve insulin sensitivity34,35. Nevertheless, our dataat least suggest that this may be a contributing factor inexplaining the relatively modest benefits observed to date inresponse to anti-inflammatory therapies in humans with type 2diabetes36,37.
MethodsAnimal models. The double knockout mice ob/ob/Fsp27�/� were generated bycrossing Fsp27�/� mice generated by Toh et al.12 with leptinþ /� mice. Mice usedwere on a C57BL/6J background. Male mice were studied in all cases. Mice were fedwith a chow diet (ND, 5053, PicoLab Rodent Diet20, Research Diet, USA) or anHFD (D12331, Research Diet). For the HFD experiments presented in Fig. 5a–g,Supplementary Fig. 4a–e and Supplementary Fig. 5c–e,h,i, 3-month-old mice wereprovided with an HFD for 3 months. Mouse experiments were performed in theanimal facility of the Center of Biomedical Analysis at Tsinghua University(Beijing, China). The laboratory animal facility has been accredited by theAAALAC (Association for Assessment and Accreditation of Laboratory AnimalCare International), and the IACUC (Institutional Animal Care and UseCommittee) of Tsinghua University approved all animal protocols used inthis study. Computed tomography (CT) analysis was performed using theLatheta LCT-200, Hitachi Aloka, Japan. Magnetic resonance imaging analysiswas performed at the Department of Radiology, Southeast University, Nanjing,China38.
BATless transgenic mice (FVB/N-Tg(UcpDta)1Kz/J) were purchased from TheJackson Laboratory (Bar Harbor, Maine) and crossed with Fsp27�/� micegenerated by Nishino et al.13, to generate BATless/Fsp27�/� mice. These mice wererederived onto a C57BL/6J background and interbred thereafter. At age 3 months,BATless and littermate BATless/Fsp27�/� mice were placed on an HFD (D12492)for 6 weeks before surgery, recovery and then hyperinsulinaemic–euglycaemicclamps at age 4.5 months. Three-month-old WT and Fsp27�/� mice generated byToh et al.12 were placed on an HFD (Research Diet, D12492) for6 weeks before surgery, recovery and then hyperinsulinaemic–euglycaemic clampsat age 4.5 months. The BATless mouse studies and all hyperinsulinaemic–euglycaemic clamps were accredited by the AAALAC. The IACUC of Center ofAnimal Care and Use at Lee Gil Ya Cancer and Diabetes Institute, GachonUniversity (Incheon, Korea) approved all animal protocols used in this project(approval number: DI-2011-0044 and LCDI-2013-0053).
Generation and administration of recombinant adenoviruses. Recombinantadenoviruses used for the knockdown of Cidea (AD-shCidea) and control(AD-shcontrol) were constructed using the AdEasy Adenoviral Vector System(Stratagene, USA). The short hairpin RNA targeting sequence of Cidea was asfollows: 50-ACACGCATTTCATGATCTT-30 . The recombinant adenoviruses wereproduced and purified according to the manufacturer’s instructions. Following alarge-scale amplification in AD293 cells and CsCl adenoviral purification, the titresof the adenoviruses were determined using the AdEasy Viral Titer Kit (Stratagene).The viruses were stored at � 80 �C. For the in vivo infection, 4-month-old micewere intravenously injected in the tail vein with 1� 1010 viral particles of theindicated viruses in a total volume of 200 ml and were euthanized for tissue col-lection 7 days later. For the infection of isolated primary hepatocytes, the cells wereinfected with the indicated viruses in serum-free DMEM for 4 h, followed by theaddition of fetal bovine serum (FBS) to a final concentration of 10%. Twenty-fourhours later, the cells were harvested for further experiments.
Isolation of primary hepatocytes. Mouse primary hepatocytes were isolated asfollows. Four-month-old male ob/ob or ob/ob/Fsp27�/� mice were anaesthetizedwith 1% Pelltobarbitalum Natricum (Amresco, USA) before exposing the hepaticportal veins, which were washed to remove residual blood and then perfused with
collagenase (C5138, Sigma, USA) for about 10 min. Thereafter, the livers wereimmediately moved to a sterile 10-cm cell culture dish for mincing before thehepatocytes were dispersed, by aspiration with a large-bore pipette; the hepatocyteswere then filtered through a 70-mm membrane (Millipore, USA) to remove tissuedebris. After washing twice with cold DMEM and centrifuging at 50g for 4 min at4 �C, the isolated hepatocytes were seeded at a density of 1� 107 cells per dish in6-cm dishes in DMEM with 10% FBS. The medium was changed 6 h after seeding.Isolated hepatocytes were maintained in DMEM (Invitrogen, USA) containing 10%FBS (Invitrogen). For protein stability experiment, medium was replaced with freshDMEM plus 10% FBS and Cycloheximide (100 mg ml� 1, Sigma). Hepatocytes wereharvested at different time points after the addition of Cycloheximide.
Serum and plasma biochemical and metabolic analyses. Serum TAG con-centrations were measured using Serum Triglyceride Determination Kit (Sigma)following the manufacturer’s instructions. Plasma glycerol concentrations weredetermined using the Free Glycerol Reagent (Sigma). The free fatty acid con-centrations were determined using enzymatic assay kits (Wako Pure Chem, Japan).The serum concentrations of IL-6 and TNFa were determined using the Mouse IL6Elisa Ready-SET-GO kit and Mouse TNFa Elisa Ready-SET-GO kit (eBioscience,USA). Serum concentrations of adiponectin were determined using the enzymaticmethods (Abcam, USA, ab108785). Plasma concentrations of adiponectin inBATless background mice were determined using the Adiponectin Elisa kit,47-ADPMS-E01 (Alpco). Blood insulin concentrations were measured using a RatInsulin RIA kit (Millipore, RI-13K).
Mouse metabolic studies. Fat and lean body masses were measured by 1Hminispec system (LF90II, Bruker Optik, Germany) in mice. Energy expenditurewas determined using a MM-100 Metabolic Monitor system (CWE, Inc., USA).Experiments were performed on 4-month-old ob/ob and ob/ob/Fsp27�/� malemice. The mice were monitored individually in the Oxymax chamber for 24 h andwere allowed to acclimate the chamber for several hours before commencingdata collection. For HFD-fed mice, energy balance was assessed in a metabolicmonitoring system (CLAMS, Columbus Instruments, USA) for 4 days (2 daysof acclimation followed by 2 days of measurement).
GTTs and ITTs. Glucose tolerance tests of ob/ob and ob/ob/Fsp27�/� micewere performed in overnight-fasted mice following an intraperitoneal injection ofglucose (0.5 g per kg body mass). ITTs of ob/ob and ob/ob/Fsp27�/� mice wereperformed after an intraperitoneal injection of insulin (2 U per kg body mass)following a 6 h fast. Blood glucose concentrations were measured with glucoseanalyser (GM9, Analox Instruments Ltd, UK). For examination of in vivo insulinsignalling, 4-month-old male ob/ob and ob/ob/Fsp27�/� mice were fasted for 2 h,anaesthetized and injected with insulin (5 U per kg body weight). After 5 min, micewere killed and tissues were collected.
Hyperinsulinaemic–euglycaemic clamp. After an overnight fast, [3-3H]-glucose(HPLC purified; American Radiolabeled Chemicals, USA) was infused at a rate of0.05 mCi min� 1 for 2 h, to assess the basal glucose turnover. Following the basalperiod, a hyperinsulinaemic–euglycaemic clamp was conducted for 120 min with aprimed/continuous infusion of human insulin (Eli Lilly) (for BATless backgroundmice and HFD-fed mice: 21 mU kg� 1 during priming and 3 mU kg� 1 min� 1
during infusion; for ob/ob background mice: 105 mU kg� 1 during priming and15 mU kg� 1 min� 1 during infusion, whereas plasma glucose was maintained atbasal concentrations (B180 mg dl� 1 for ob/ob background mice; B150 mg dl� 1
for BATless background mice and HFD-fed mice))39. To estimate insulin-stimulated whole-body glucose fluxes, [3-3H]-glucose was infused at a rate of0.1 mCi min� 1 throughout the clamps40. Rates of basal and insulin-stimulatedwhole-body glucose fluxes and tissue glucose uptake were determined as previouslydescribed40.
Microarray analysis. Equal amounts of total RNA from three mice were com-bined to form RNA pools. In total, we analysed three RNA pools from nine ob/obmice and three RNA pools from nine ob/ob/Fsp27�/� mice. Six Affymetrix genechips (GeneChip Mouse Gene 1.0 ST Array, Affymetrix, USA) were used forhybridization and data collection. Microarray data related to WT and Fsp27�/�
mice were from Li et al. (GSE22693)41. Quality control and statistical analyses of allthe Mouse Gene 1.0 ST microarray data was conducted using R/Bioconductor42.Methods including scatterplots, distribution histograms, boxplots andunsupervised Principle Component Analysis were employed to visualize the databefore and after preprocessing procedures. All arrays were consistent andcomparable for further analyses, and we performed background adjustment,quantile normalization and summaries of transcript-level intensity for all arraysusing the Robust Multi-array Average algorithm43, followed by two rounds ofprobeset filtering. After removing control probesets, 28,858 probesets from theoriginal 35,556 were retained. Next, the Detection Above Background P-values forprobesets were calculated using the xps package and only the significant ones(Po0.05) were considered as ‘present’. We only retained probesets flagged aspresent in at least one sample for each type of tissue and used the package
ARTICLE NATURE COMMUNICATIONS | DOI: 10.1038/ncomms6949
12 NATURE COMMUNICATIONS | 6:5949 | DOI: 10.1038/ncomms6949 | www.nature.com/naturecommunications
& 2015 Macmillan Publishers Limited. All rights reserved.
LIMMA to identify probesets that were differentially expressed between theob/ob/Fsp27�/� and ob/ob mice44. The Benjamini and Hochberg method was usedto estimate the false discovery rate and correct for multiple hypotheses testing.Annotation was taken and genes that changed by log fold of at least 0.5 betweenob/ob/Fsp27�/� and ob/ob mice, and with a false discovery rate o0.05 wereconsidered significant. The up- and downregulated genes were further mapped tobiological pathways using PathVisio with Wiki Pathways content, and the resultswere sorted by Z-score, which is the standard statistical test under thehypergeometric distribution45,46.
Quantitative PCR analysis. Total RNA was isolated from mouse livers and WATwith TRIzol (Invitrogen) extraction. First-strand complementary DNA synthesiswas performed using the Superscript First-Strand Synthesis System (Invitrogen).Quantitative real-time PCR reaction were performed using the Power SYBR GreenPCR Master Mix (Applied Biosystems) on an ABI 7500 (Applied Biosystems) withreaction volumes of 20ml. The primer sequences are listed in SupplementaryTable 3.
Histology. The livers were excised and fixed in 10% formalin buffer. The fixedspecimens were processed to paraffin blocks, sectioned and stained withhaematoxylin–eosin. For electron microscope analysis, liver or fat tissue was fixedin 2.5% glutaraldehyde buffer and studied at Center of Biomedical Analysis,Tsinghua University, China. For immunohistochemistry, formalin-fixed andparaffin-embedded sections were blocked with endogenous peroxidase (3% H2O2
in 80% methanol) for 20 min. Antigen retrieval was performed in 10 mM sodiumcitrate in a microwave for 15 min. After blocking nonspecific antigen with normalgoat serum for 30 min, the slides were then incubated with TNFa (Abcam, ab1793,1:100 dilution) or F4/80 (Abcam, ab6640, 1:100 dilution) antibody overnight at4 �C. The slides were then incubated with biotinylated-labelled secondary anti-bodies (1:200, GE Health, UK) for 30 min at room temperature. Visualization wasperformed using 0.1% 3,30-diaminobenzidine (Dako, Denmark) in PBS togetherwith 0.05% H2O2 (ref. 47). For the analysis of CLS, immunohistochemistry sectionsstained with a TNFa antibody were used and the CLS density was derived bycounting the total number of CLS in each section compared with the total numberof adipocytes. Data were expressed as the number of CLS/1,000 adipocytes.
Tissue lipid content. Tissues were homogenized in PBS buffer with proteaseinhibitors. A chloroform/methanol (2:1) solution was rapidly added to thehomogenate and the samples were vortexed. The samples were centrifuged at 250gfor 10 min, to separate the phases. The lower lipid-containing phase was carefullyaspirated and allowed to dry in a 70 �C metal bath with nitrogen steam. The driedlipids were reconstituted in methylbenzene and loaded onto a thin-layer chro-matography plate. The lipids were separated in a hexane/diethyl ether/acetic acid(70:30:1, v/v) solution. The thin-layer chromatography plates were sprayed with10% CuSO4 in 10% phosphoric acid and were developed by drying in an oven at120 �C. Alternatively, the dried lipids were emulsified in chloroform with 5%Triton X-100. Finally, dried emulsified lipids with nitrogen gas were reconstitutedin distilled water. The contents of TAG and CE were measured by enzymaticreaction according to the instruction manual (Wako Diagnotics, Japan).
Western blotting. The frozen tissues were homogenized in a lysis buffer (20 mMTris-HCl, 150 mM NaCl, 1 mM EDTA, 1 mM EGTA, 1% Triton-X100 and proteaseinhibitor, pH 7.4) and then centrifuged for 20 min at 10,000g to discard cell debris.The total protein concentrations were determined using a Bio-Rad kit (USA).The proteins were subjected to western blot analysis with the desired antibodies.The antibodies against Cidea (1:1,000), Cideb (1:500) and Fsp27 (1:2,000) weregenerated by injection of rabbits with His-tagged truncated Cidea (aa 1–195)and Cideb (aa 1–176), and Fsp27 (aa 1–190) proteins that were expressed in andpurified in Escherichia coli12. Antibodies against b-actin (Sigma-Aldrich, USA,1:2,000), Perilipin1 (Fitzgerald Industries, USA, 20R-pp004, 1:4,000), Perilipin2(Fitzgerald Industries, 20R-Ap002, 1:8,000), Perilipin3 (Santa Cruz, USA,sc14726R, 1:1,000), Cyto C (BD Pharmingen, USA, 556433, 1:1,000), Cox4(Molecular Probes, Invitrogen, A21348, 1:1,000), ATGL (Cell Signaling, USA, 2439,1:1,000), HSL (Cell Signaling, 4107, 1:1,000), CGI58 (Santa Cruz, sc100468,1:1,000), PPARg (Santa Cruz, sc271392, 1:1,000), CEBPb (Santa Cruz, sc7962,1:1,000), P-AKT(S473,193H12, Cell Signaling, 4058, 1:1,000), AKT (Cell Signaling,9272, 1:1,000) were used for western blot analysis. The blots were developed usingHRP-conjugated secondary antibodies (GE Health, 1:3,000) and the ECL-plussystem.
Statistics. The statistical data reported includes results from at least three biolo-gical replicates. All results are expressed as mean±s.e.m.. All statistical analyseswere performed in GraphPad Prism Version 5 (GraphPad Software). Significancewas predominantly established using a two-tailed Student’s t-test. However, energyexpenditure was analysed using analysis of covariance as recommended by Tschopet al.48 and we used two-way repeated-measurement analyses of variance toevaluate the data in Figs 4c,d,f, 5k and 6i. (###Po0.001 in these figures indicatesthat the two groups respond differently following the intervention). In all cases,
differences were considered significant at Po0.05. P-values are indicated in eachfigure as *Po0.05, **Po0.01, ***Po0.001.
References1. Guilherme, A., Virbasius, J. V., Puri, V. & Czech, M. P. Adipocyte dysfunctions
linking obesity to insulin resistance and type 2 diabetes. Nat. Rev. Mol. Cell Biol.9, 367–377 (2008).
2. Puri, V. et al. Cidea is associated with lipid droplets and insulin sensitivity inhumans. Proc. Natl Acad. Sci. USA 105, 7833–7838 (2008).
3. Gong, J., Sun, Z. & Li, P. CIDE proteins and metabolic disorders. Curr. Opin.Lipidol. 20, 121–126 (2009).
4. Nordstrom, E. A. et al. A human-specific role of cell death-inducing DFFA(DNA fragmentation factor-alpha)-like effector A (CIDEA) in adipocytelipolysis and obesity. Diabetes 54, 1726–1734 (2005).
5. Matsusue, K. et al. Hepatic steatosis in leptin-deficient mice is promoted by thePPARgamma target gene Fsp27. Cell Metab. 7, 302–311 (2008).
6. Zhou, L. et al. Cidea promotes hepatic steatosis by sensing dietary fatty acids.Hepatology 56, 95–107 (2012).
7. Puri, V. et al. Fat-specific protein 27, a novel lipid droplet protein that enhancestriglyceride storage. J. Biol. Chem. 282, 34213–34218 (2007).
8. Keller, P. et al. Fat-specific protein 27 regulates storage of triacylglycerol. J. Biol.Chem. 283, 14355–14365 (2008).
9. Gong, J. et al. Fsp27 promotes lipid droplet growth by lipid exchange andtransfer at lipid droplet contact sites. J. Cell Biol. 195, 953–963 (2011).
10. Wu, L. et al. Cidea controls lipid droplet fusion and lipid storage in brown andwhite adipose tissue. Sci. China Life Sci. 57, 107–116 (2014).
11. Sun, Z. et al. Perilipin1 promotes unilocular lipid droplet formation through theactivation of Fsp27 in adipocytes. Nat. Commun. 4, 1594 (2013).
12. Toh, S. Y. et al. Up-regulation of mitochondrial activity and acquirement ofbrown adipose tissue-like property in the white adipose tissue of fsp27 deficientmice. PLoS One 3, e2890 (2008).
13. Nishino, N. et al. FSP27 contributes to efficient energy storage in murine whiteadipocytes by promoting the formation of unilocular lipid droplets. J. Clin.Invest. 118, 2808–2821 (2008).
14. Rubio-Cabezas, O. et al. Partial lipodystrophy and insulin resistant diabetes in apatient with a homozygous nonsense mutation in CIDEC. EMBO Mol. Med. 1,280–287 (2009).
15. Rosen, E. D. & Spiegelman, B. M. What we talk about when we talk about fat.Cell 156, 20–44 (2014).
16. Rosen, E. D. & Spiegelman, B. M. Adipocytes as regulators of energy balanceand glucose homeostasis. Nature 444, 847–853 (2006).
17. Frayn, K. N. Adipose tissue as a buffer for daily lipid flux. Diabetologia 45,1201–1210 (2002).
18. Garg, A. Clinical review: Lipodystrophies: genetic and acquired body fatdisorders. J. Clin. Endocrinol. Metab. 96, 3313–3325 (2011).
19. Savage, D. B. Mouse models of inherited lipodystrophy. Dis. Model Mech. 2,554–562 (2009).
20. Vigouroux, C., Caron-Debarle, M., Le Dour, C., Magre, J. & Capeau, J.Molecular mechanisms of human lipodystrophies: from adipocyte lipid dropletto oxidative stress and lipotoxicity. Int. J. Biochem. Cell Biol. 43, 862–876 (2011).
21. Pendse, A. A., Johnson, L. A., Tsai, Y. S. & Maeda, N. Pparg-P465L mutationworsens hyperglycemia in Ins2-Akita female mice via adipose-specific insulinresistance and storage dysfunction. Diabetes 59, 2890–2897 (2010).
22. Reue, K. & Phan, J. Metabolic consequences of lipodystrophy in mouse models.Curr. Opin. Clin. Nutr. Metab. Care 9, 436–441 (2006).
23. Lowell, B. B. et al. Development of obesity in transgenic mice after geneticablation of brown adipose tissue. Nature 366, 740–742 (1993).
24. Cinti, S. et al. Adipocyte death defines macrophage localization and function inadipose tissue of obese mice and humans. J. Lipid Res. 46, 2347–2355 (2005).
25. Murano, I. et al. Dead adipocytes, detected as crown-like structures, areprevalent in visceral fat depots of genetically obese mice. J. Lipid Res. 49,1562–1568 (2008).
26. Giordano, A. et al. Obese adipocytes show ultrastructural features of stressedcells and die of pyroptosis. J. Lipid Res. 54, 2423–2436 (2013).
27. Vandanmagsar, B. et al. The NLRP3 inflammasome instigates obesity-inducedinflammation and insulin resistance. Nat. Med. 17, 179–188 (2011).
28. Hamann, A., Flier, J. S. & Lowell, B. B. Obesity after genetic ablation of brownadipose tissue. Z. Ernahrungswiss 37 (Suppl 1), 1–7 (1998).
29. Perry, R. J., Samuel, V. T., Petersen, K. F. & Shulman, G. I. The role of hepaticlipids in hepatic insulin resistance and type 2 diabetes. Nature 510, 84–91(2014).
30. Sun, Z. & Lazar, M. A. Dissociating fatty liver and diabetes. Trends Endocrinol.Metab. 24, 4–12 (2013).
31. Reitman, M. L. Metabolic lessons from genetically lean mice. Annu. Rev. Nutr.22, 459–482 (2002).
32. Asterholm, I. W., Halberg, N. & Scherer, P. E. Mouse models of lipodystrophykey reagents for the understanding of the metabolic syndrome. Drug Discov.Today Dis. Models 4, 17–24 (2007).
NATURE COMMUNICATIONS | DOI: 10.1038/ncomms6949 ARTICLE
NATURE COMMUNICATIONS | 6:5949 | DOI: 10.1038/ncomms6949 | www.nature.com/naturecommunications 13
& 2015 Macmillan Publishers Limited. All rights reserved.
33. Gray, S. L. et al. Leptin deficiency unmasks the deleterious effects of impairedperoxisome proliferator-activated receptor gamma function (P465LPPARgamma) in mice. Diabetes 55, 2669–2677 (2006).
34. Hotamisligil, G. S., Shargill, N. S. & Spiegelman, B. M. Adipose expression oftumor necrosis factor-alpha: direct role in obesity-linked insulin resistance.Science 259, 87–91 (1993).
35. Glass, C. K. & Olefsky, J. M. Inflammation and lipid signaling in the etiology ofinsulin resistance. Cell Metab. 15, 635–645 (2012).
36. McNelis, J. C. & Olefsky, J. M. Macrophages, immunity, and metabolic disease.Immunity 41, 36–48 (2014).
37. Ferrante, Jr. A. W. Macrophages, fat, and the emergence ofimmunometabolism. J. Clin. Invest. 123, 4992–4993 (2013).
38. Peng, X. G. et al. Comparison of brown and white adipose tissue fat fractions inob, seipin, and Fsp27 gene knockout mice by chemical shift-selective imagingand (1)H-MR spectroscopy. Am. J. Physiol. Endocrinol. Metab. 304, E160–E167(2013).
39. Choi, C. S. et al. Continuous fat oxidation in acetyl-CoA carboxylase 2knockout mice increases total energy expenditure, reduces fat mass, andimproves insulin sensitivity. Proc. Natl Acad. Sci. USA 104, 16480–16485(2007).
40. Kim, K. H. et al. Autophagy deficiency leads to protection from obesityand insulin resistance by inducing Fgf21 as a mitokine. Nat. Med. 19, 83–92(2013).
41. Li, D. et al. Regulation of gene expression by FSP27 in white and brown adiposetissue. BMC Genomics 11, 446 (2010).
42. Gentleman, R. C. et al. Bioconductor: open software development forcomputational biology and bioinformatics. Genome Biol. 5, R80 (2004).
43. Irizarry, R. A. et al. Exploration, normalization, and summaries ofhigh density oligonucleotide array probe level data. Biostatistics 4, 249–264(2003).
44. Smyth, G. K. Linear models and empirical bayes methods for assessingdifferential expression in microarray experiments. Stat. Appl. Genet. Mol. Biol.3, Article3 (2004).
45. van Iersel, M. P. et al. Presenting and exploring biological pathways withPathVisio. BMC Bioinformatics 9, 399 (2008).
46. Kelder, T. et al. WikiPathways: building research communities on biologicalpathways. Nucleic Acids Res. 40, D1301–D1307 (2012).
47. Li, H. et al. Cell death-inducing DFF45-like effector b (Cideb) is present inpancreatic beta-cells and involved in palmitate induced beta-cell apoptosis.Diabetes Metab. Res. Rev. 28, 145–155 (2012).
48. Tschop, M. H. et al. A guide to analysis of mouse energy metabolism. Nat.Methods 9, 57–63 (2012).
AcknowledgementsWe are very grateful to Professor M. Kasuga for providing us with their line of Fsp27-nullmice. We thank the members of Peng Li’s laboratory at Tsinghua University for theirhelpful discussion. We thank Soo Young Bang for technical assistance. We thank Dr Y.N.Gu for assistance in data analysis. This work was supported by grants from the NationalBasic Research Program (2013CB530602 and 2011CB910801 to P.L.), from the NationalNatural Science Foundation of China (31430040, 31321003 and 31030038), from theChina Postdoctoral Science Foundation (2012M520249 and 2013T60103 to L.Z.) andfrom the Wellcome Trust (091551 to D.S.). This work was also supported by the Bio andMedical Technology Development Program of the National Research Foundation (NRF)funded by the Ministry of Science, ICT and Future Planning (NRF-2013M3A9D5072563to C.C.) and Korea Healthcare Technology R&D Project, Ministry for Health, Welfareand Family Affairs, Korea (A102060 to C.C.).
Author contributionsL.Z., S.P., L.X., C.C., D.S. and P.L. conceived and designed the experiments. L.Z., S.P.,L.X., K.J., J.H., H.O., M.Y., L.S. and L.W. performed the experiments. L.Z., S.P., C.C.,X.Y., D.S. and P.L. Analyzed the data. J.Y., Y.T., C.Z., S.C., J.A., S.J., F.G., and H.Y.contributed reagents/materials/analysis tools. L.Z., P.L. and D.S. wrote the paper.
Additional informationAccession codes: The Gene Expression omnibus (GEO) accession number for the geneexpression data is GSE59807.
Supplementary Information accompanies this paper at http://www.nature.com/naturecommunications
Competing financial interests: The authors declare no competing financial interests.
Reprints and permission information is available online at http://npg.nature.com/reprintsandpermissions/
How to cite this article: Zhou, L. et al. Insulin resistance and white adipose tissueinflammation are uncoupled in energetically challenged Fsp27-deficient mice. Nat.Commun. 6:5949 doi: 10.1038/ncomms6949 (2015).
This work is licensed under a Creative Commons Attribution 4.0International License. The images or other third party material in this
article are included in the article’s Creative Commons license, unless indicated otherwisein the credit line; if the material is not included under the Creative Commons license,users will need to obtain permission from the license holder to reproduce the material.To view a copy of this license, visit http://creativecommons.org/licenses/by/4.0/
ARTICLE NATURE COMMUNICATIONS | DOI: 10.1038/ncomms6949
14 NATURE COMMUNICATIONS | 6:5949 | DOI: 10.1038/ncomms6949 | www.nature.com/naturecommunications
& 2015 Macmillan Publishers Limited. All rights reserved.
Copyright © 2022 FDOKUMEN