Rejected’ vs. ‘rejecting’ transcriptomes in allogeneic challenged colonial urochordates
11
Molecular Immunology 47 (2010) 2083–2093 Contents lists available at ScienceDirect Molecular Immunology journal homepage: www.elsevier.com/locate/molimm ‘Rejected’ vs. ‘rejecting’ transcriptomes in allogeneic challenged colonial urochordates Matan Oren a,b,∗ , Guy Paz a , Jacob Douek a , Amalia Rosner a , Zvi Fishelson b , Tamar L. Goulet c , Kolja Henckel d , Baruch Rinkevich a a Israel Oceanographic and Limnological Research, National Institute of Oceanography, P.O. Box 8030, Haifa 31080, Israel b Department of Cell and Developmental Biology, Sackler School of Medicine, Tel Aviv University, Tel Aviv 69978, Israel c Department of Biology, University of Mississippi, University, MS 38677, USA d Bioinformatics in Signaling Networks, Center for Biotechnology (CeBiTec), Bielefeld University, D-35594, Germany article info Article history: Received 1 March 2010 Received in revised form 7 April 2010 Accepted 9 April 2010 Available online 7 May 2010 Keywords: Botryllus Histocompatibility Immune rejection Innate immunity Invertebrates Microarray Self–non-self recognition Self-destruction abstract In botryllid ascidians, allogeneic contacts between histoincompatible colonies lead to inflammatory rejec- tion responses, which eventually separate the interacting colonies. In order to elucidate the molecular background of allogeneic rejection in the colonial ascidian Botryllus schlosseri, we performed microarray assays verified by qPCR, and employed bioinformatic analyses of the results, revealing disparate transcrip- tion profiles of the rejecting partners. While only minor expression changes were documented during rejection when both interacting genotypes were pooled together, analyses performed on each genotype separately portrayed disparate transcriptome responses. Allogeneic interacting genotypes that devel- oped the morphological markers of rejection (points of rejection; PORs), termed ‘rejected’ genotypes, showed transcription inhibition of key functional gene groups, including protein biosynthesis, cell struc- ture and motility and stress response genes. In contrast, the allogeneic partners that did not show PORs, termed ‘rejecting’ genotypes, showed minor expression changes that were different from those of the ‘rejected’ genotypes. This data demonstrates that the observed morphological changes in the ‘rejected’ genotypes are not due to active transcriptional response to the immune challenge but reflect transcrip- tion inhibition of response elements. Based on the morphological and molecular outcomes we suggest that the ‘rejected’ colony activates an injurious self-destructive mechanism in order to disconnect itself from its histoincompatible neighboring colony. © 2010 Elsevier Ltd. All rights reserved. 1. Introduction Intra-species interactions are ubiquitous in diverse taxa of marine sedentary invertebrates, including sponges, cnidarians, bryozoans and ascidians (Hildemann, 1979). Histoincompatible interactions often lead to intense rejection responses activating destructive immune mechanisms that prevent fusion between distantly related individuals and play a fundamental role in maintaining the genetic uniqueness of the interacting organisms (Grosberg, 1988). In the colonial urochordate Botryllus schlosseri (belonging to botryllid ascidians, family Styelidae) histocompatibility is governed ∗ Corresponding author at: Israel Oceanographic and Limnological Research, National Institute of Oceanography, P.O. Box 8030, Haifa 31080, Israel. Tel.: +972 4 8565275/5 668882; fax: +972 4 8511911. E-mail addresses: [email protected], [email protected], [email protected] (M. Oren). by a highly polymorphic haplotype (Scofield et al., 1982), the fusibility/histocompatibility locus (Fu/HC; Weissman et al., 1990), which contains up to several hundreds codominantly expressed alleles (Rinkevich et al., 1995). Allogeneic encounters between Botryllus colonies end up in rejection when they share no Fu/HC alleles (Scofield et al., 1982). Rejection process is accompanied by the formation of necrotic, clot-like zones (Oren et al., 2008), called ‘points of rejection’ (PORs; Fig. 1) that are confined to one or to both interacting partners. POR formation is preceded by accumu- lation of granular cells, termed “morula cells”, in the interacting peripheral vasculature tips, the ampullae (Rinkevich et al., 1998), followed by partial fusion of the tunic cuticle between interacting genotypes (Scofield and Nagashima, 1983). Morula cells, contain- ing inactive prophenol-oxidase inside intracellular vacuoles, are recruited to ampullar tips in both histocompatible and histoincom- patible settings (Rinkevich et al., 1998) but are activated to release their vacuoles’ content only in allogeneic incompatible assemblies (Ballarin and Cima, 1998). This cytotoxic event leads to the deposi- tion of melanin that accumulates as brownish colored material at the PORs. 0161-5890/$ – see front matter © 2010 Elsevier Ltd. All rights reserved. doi:10.1016/j.molimm.2010.04.007
-
Upload
independent -
Category
Documents
-
view
3 -
download
0
Transcript of Rejected’ vs. ‘rejecting’ transcriptomes in allogeneic challenged colonial urochordates
‘c
MTa
b
c
d
a
ARRAA
KBHIIIMSS
1
mbiddm(
b
NT
(
0d
Molecular Immunology 47 (2010) 2083–2093
Contents lists available at ScienceDirect
Molecular Immunology
journa l homepage: www.e lsev ier .com/ locate /mol imm
Rejected’ vs. ‘rejecting’ transcriptomes in allogeneic challengedolonial urochordates
atan Orena,b,∗, Guy Paza, Jacob Doueka, Amalia Rosnera, Zvi Fishelsonb,amar L. Gouletc, Kolja Henckeld, Baruch Rinkevicha
Israel Oceanographic and Limnological Research, National Institute of Oceanography, P.O. Box 8030, Haifa 31080, IsraelDepartment of Cell and Developmental Biology, Sackler School of Medicine, Tel Aviv University, Tel Aviv 69978, IsraelDepartment of Biology, University of Mississippi, University, MS 38677, USABioinformatics in Signaling Networks, Center for Biotechnology (CeBiTec), Bielefeld University, D-35594, Germany
r t i c l e i n f o
rticle history:eceived 1 March 2010eceived in revised form 7 April 2010ccepted 9 April 2010vailable online 7 May 2010
eywords:otryllusistocompatibility
mmune rejection
a b s t r a c t
In botryllid ascidians, allogeneic contacts between histoincompatible colonies lead to inflammatory rejec-tion responses, which eventually separate the interacting colonies. In order to elucidate the molecularbackground of allogeneic rejection in the colonial ascidian Botryllus schlosseri, we performed microarrayassays verified by qPCR, and employed bioinformatic analyses of the results, revealing disparate transcrip-tion profiles of the rejecting partners. While only minor expression changes were documented duringrejection when both interacting genotypes were pooled together, analyses performed on each genotypeseparately portrayed disparate transcriptome responses. Allogeneic interacting genotypes that devel-oped the morphological markers of rejection (points of rejection; PORs), termed ‘rejected’ genotypes,showed transcription inhibition of key functional gene groups, including protein biosynthesis, cell struc-
nnate immunitynvertebrates
icroarrayelf–non-self recognitionelf-destruction
ture and motility and stress response genes. In contrast, the allogeneic partners that did not show PORs,termed ‘rejecting’ genotypes, showed minor expression changes that were different from those of the‘rejected’ genotypes. This data demonstrates that the observed morphological changes in the ‘rejected’genotypes are not due to active transcriptional response to the immune challenge but reflect transcrip-tion inhibition of response elements. Based on the morphological and molecular outcomes we suggestthat the ‘rejected’ colony activates an injurious self-destructive mechanism in order to disconnect itself
le nei
from its histoincompatib. Introduction
Intra-species interactions are ubiquitous in diverse taxa ofarine sedentary invertebrates, including sponges, cnidarians,
ryozoans and ascidians (Hildemann, 1979). Histoincompatiblenteractions often lead to intense rejection responses activatingestructive immune mechanisms that prevent fusion between
istantly related individuals and play a fundamental role inaintaining the genetic uniqueness of the interacting organismsGrosberg, 1988).In the colonial urochordate Botryllus schlosseri (belonging to
otryllid ascidians, family Styelidae) histocompatibility is governed
∗ Corresponding author at: Israel Oceanographic and Limnological Research,ational Institute of Oceanography, P.O. Box 8030, Haifa 31080, Israel.el.: +972 4 8565275/5 668882; fax: +972 4 8511911.
E-mail addresses: [email protected], [email protected], [email protected]. Oren).
161-5890/$ – see front matter © 2010 Elsevier Ltd. All rights reserved.oi:10.1016/j.molimm.2010.04.007
ghboring colony.© 2010 Elsevier Ltd. All rights reserved.
by a highly polymorphic haplotype (Scofield et al., 1982), thefusibility/histocompatibility locus (Fu/HC; Weissman et al., 1990),which contains up to several hundreds codominantly expressedalleles (Rinkevich et al., 1995). Allogeneic encounters betweenBotryllus colonies end up in rejection when they share no Fu/HCalleles (Scofield et al., 1982). Rejection process is accompanied bythe formation of necrotic, clot-like zones (Oren et al., 2008), called‘points of rejection’ (PORs; Fig. 1) that are confined to one or toboth interacting partners. POR formation is preceded by accumu-lation of granular cells, termed “morula cells”, in the interactingperipheral vasculature tips, the ampullae (Rinkevich et al., 1998),followed by partial fusion of the tunic cuticle between interactinggenotypes (Scofield and Nagashima, 1983). Morula cells, contain-ing inactive prophenol-oxidase inside intracellular vacuoles, arerecruited to ampullar tips in both histocompatible and histoincom-
patible settings (Rinkevich et al., 1998) but are activated to releasetheir vacuoles’ content only in allogeneic incompatible assemblies(Ballarin and Cima, 1998). This cytotoxic event leads to the deposi-tion of melanin that accumulates as brownish colored material atthe PORs.
2084 M. Oren et al. / Molecular Immunology 47 (2010) 2083–2093
Fig. 1. Asymmetric rejection reaction for Botryllus non-self-recognition. Asymmetric responses are abundant in Botryllus allogeneic interactions but symmetric responsesexpressing PORs on both sides are also common. (A) A low magnification for an advanced histoincompatibility, revealing the appearance of points of rejection (PORs) ininteracting ampullae between a pair of colonies. (B) A higher magnification for non-self-recognition outcomes, showing ‘rejected’ vs. ‘rejecting’ phenotypes. The rejectedpartner (R1, right) presents numerous PORs (dark brown colored) in its colonial premises while the rejecting colony (R2, left) did not develop a single POR. (C) Initiationof an asymmetric rejection reaction between a pair of Botryllus oozooids (juveniles, shortly after their settlement); photographed by Claudette Rabinowitz. The reactions rrowho ht miC . (Fort
pwtsD(refifie(acwupp
2
cMwcpwt
tarts within an interacting ampula (ia) of the ‘rejected’ genotype (R1, left). Black af rejection, t – tunic, z – zooid. Interactions were observed in vivo using upright ligolor View Camera (Soft Imaging System, Muenster, Germany). Scale bar – 200 �mo the web version of this article.)
Although the morphological and cytological events that takelace during allogeneic rejection in botryllid ascidians have beenidely studied, no extensive genome approach has yet been taken
o investigate histocompatibility effector mechanisms at the tran-criptome level. To address this level, we produced a BotryllusNA chip based on two recently developed Botryllus EST libraries
one is rejection specific; Oren et al., 2007). Rejection microar-ay experiments on pooled samples containing both sides of thexamined interacting pairs, resulted in only few repeatedly dif-erentially expressed genes. When tested separately, each of thenteracting genotypes revealed its own distinctive expression pro-le. These expression profiles were found to be associated withither one of two rejection phenotypes in the same rejected pairFig. 1): a ‘rejected’ phenotype developing and hosting the PORs and‘rejecting’ phenotype showing little morphological and molecularhanges. In our tested cases, a specific rejected–rejecting hierarchyas genotype-dependent and repeated itself in different assayssing the same genotype combinations. Based on these results, weropose a new hierarchical perspective for the allogeneic rejectionrocess in these animals.
. Materials and methods
Parent colonies of B. schlosseri genotypes used in this study wereollected from shallow waters at Monterey, Half Moon Bay andoss Landing, CA, USA and at Banyuls, France marinas. Colonies
ere individually maintained on 5 cm × 7.5 cm glass slides andultured in 25-l tanks at 20 ◦C in a standing seawater system, asreviously described (Rinkevich and Shapira, 1998). Large coloniesere routinely subcloned into ramets of different sizes that were
hen transferred onto other glass slides, for further growth. Hence,
eads mark the border between the tunics. a – ampula, white arrowheads – pointscroscopy (BX-FLA BX50, Olympus, Hamburg, Germany). Pictures were taken with ainterpretation of the references to color in this figure legend, the reader is referred
the same genotypic constituent could be simultaneously used forboth control and repeated assays. Allorecognition assays were per-formed as described (Rinkevich, 1995) on paired histoincompatiblecolonies juxtaposed on a glass slide at a distance of less than 1 mm inorder to allow fast contact between extending peripheral ampullae.
2.1. Preparation of cDNA microarray
The microarray preparation was based on two subtractive ESTlibraries (accession numbers GO355495–GO359797), one rejectionspecific (2223 ESTs) and the other blastogenic ‘stage D’ specific(2080 ESTs; unpublished). The libraries assembly and sequencingprocedures we described in Oren et al. (2007). In addition to the twoEST libraries, we amplified 15 NCBI gene bank published sequences.All together, 4318 ESTs were used for the microarray prepara-tion. All EST sequences were amplified by standard PCR from1 �l of bacterial culture templates (35 cycles of 0.5 min at 94 ◦C,0.5 min at 68 ◦C, and 1.5 min at 72 ◦C; MyCycler Personal ThermalCycler; Bio-Rad; Hercules, CA, USA) using Clontech PCR-SelectTM
cDNA Subtraction Kit (Clontech, Mountain View, CA, USA) univer-sal primers: a forward primer 5′-TCGAGCGGCCGCCCGGGCAGGT-3′
and a reverse primer 5′-AGCGTGGTCGCGGCCGAGGT-3′. Amplifica-tion efficiency was tested by running the PCR products on agarosegel. PCR products were precipitated from the PCR solution byadding two volumes of isopropanol, centrifuged at 2000 × g for45 min at 4 ◦C. The DNA was dried and dissolved in 10 DDW.
The DNA products were mixed with betaine printing buffer (1.5 Mbetaine; B2629 Sigma USA with 3× SSC), centrifuged 1 min, gen-tly shaken for 1 h at room temperature and kept overnight at 9 ◦C.The next day the samples were gently shaken and the DNA prod-ucts were printed in duplicates on microarray glass slides (GAPS
M. Oren et al. / Molecular Immunology 47 (2010) 2083–2093 2085
Fig. 2. Experimental scheme and microarray design. Fifteen microarray chips (1–15) were printed, each containing two identical Botryllus ESTs sets, allowing technicalrepetitions. We used a dual-labeling protocol with cy-3 and cy-5 fluorescent dyes as described in Section 2. Both experiments started 6–12 h prior to the establishment ofthe points of rejection (T0). The rejecting colonies were harvested concurrently with their naïve clones (T1 harvesting) preventing any possible differentiations related todifferences in blastogenic (weekly developmental cycle; Lauzon et al., 1992) stage. RNA was extracted (RNA extraction) from each sample and was divided into two, eachhalf labeled with a different dye (labeling). In the first microarray experiment (Exp. 1), we tested three rejecting pairs against their naïve clones in a simple bilateral designusing chips 1–3. In the second microarray experiment (Exp. 2) we tested separately, each side of three rejecting pairs against its naïve clone and against its rejecting partneri Each ag detaid d or rei
ItGihr
2
dwgwatwacat1
2
pU1g
n a cyclic design allowing direct and indirect analysis using 12 chips (Nos. 4–15).reen/red coloring on the arrows indicate the RNA labeling cy-3/cy-5 direction. Allifferent genotypes (letters A–L). ‘R’ and ‘N’ are for the interacting partner (rejecte
n this figure legend, the reader is referred to the web version of this article.)
I slides, Corning Life Sciences, Lowell, MA, USA) using a highhroughput automated microarrayer machine (BioRobotics Micro-rid, Genomic Solutions, Ann Arbor, MI, USA). The printing pattern
ncluded two complete sets of all microarray DNA probes on eachalf of the microarray slide respectively in order to permit technicalepetitions.
.2. Experimental scheme
Each interacting genotype in the microarray experiments wasirectly hybridized and tested against its naïve clone. In this way,e could reduce the “noise” which may exist in the case of random
enotype pooling. Two different sets of microarray experimentsere conducted. In the first set (Exp. 1), we harvested both inter-
cting genotypes of each (n = 3) interacting pair together and testedhem against their pooled naïve clones. In the second set (Exp. 2),e harvested each of the interacting genotype from each inter-
cting pair (n = 3) separately and tested them against their naïvelones and against one another. The interacting colonies werell harvested 6–12 h following the onset of historecognition andested using competitive dual-labeling hybridization technique on5 DNA chips as described in Fig. 2.
.3. Hybridization procedure
Total RNA extraction from tissues of Botryllus colonies waserformed using RNeasy kits (cat. 74104, Qiagen, Valencia, CA,SA). RNA was kept in 100% ETOH, precipitated (centrifugation0,000 × g, 30 min, 4 ◦C), washed twice in 70% ETOH (centrifu-ation 10,000 × g, 15 min, 4 ◦C) and re-dissolved in RNase-free
rrow in the hybridization section indicates one dual labeled microarray chip. Thels are shown in the table according to the chip number, including indication of thejecting) and naïve allogeneic ramets. (For interpretation of the references to color
DDW. The quality, quantity and integrity of the total RNA productswere analyzed using NanoDrop (ND-1000 NanoDrop Technologies,Wilmington, DE, USA) and bioanalyzer (Agilent 2100 bioanalyzer,Agilent Technologies, Santa Clara, CA, USA) machines and found tobe at optimum levels.
Amplification and labeling of the RNA populations with the flu-orescent dyes Cy3 and Cy5 were done according to Aminoallylindirect aRNA labeling method (TargetAmp 1-round Aminoallyl-aRNA amplification Kit 101, Epicentre Biotechnologies, Madison,WI, USA) as follows: reverse transcription with denaturized (65 ◦Cfor 5 min) RNA mixture (1 �l of 500 ng total RNA, 1 �l of RNA spike;Amersham, cat. 63-0042-84, 1 �l primer mix) was done at 50 ◦Cfor 30 min followed by 65 ◦C for 10 min for second-strand cDNAsynthesis. Hydrolysis of the original RNA was performed at 80 ◦Cfor 3 min. Labeling was performed by in vitro RNA transcription at42 ◦C for 4 h with Aminoallyl modified nucleotides. The DNA wasdigested by incubation at 37 ◦C for 15 min with RNase-Free DNaseI. Aminoalyl-aRNA was purified by RNeasy column (cat. 74104,rnEASEy mini kit, qiagen). aRNA samples were speed vacuumedto a final volume 10 �l and stored at −80 ◦C.
Labeling efficiency was evaluated by spectrophotometry at260 nm for aRNA estimation and 550 nm (Cy3) and 650 nm (Cy5)for determining labeling intensity.
Hybridization of the labeled aRNA with each microarray slidewas preceded by incubation of a pre-hybridization buffer (600 mg
BSA, 41.7 ml DDW, 600 �l 10% SDS, 15 ml 20× SSC) at 42 ◦C for45 min. The probe mixture contained 11 �l of the labeled aRNA,40 �l of a fresh hybridization buffer (100 �l RNase-free DDW,150 �l 20× SSC, 250 �l formamide 10 �l 10% SDS), 29 �l RNase-free water and 4 �l of t-RNA. The probe mixture was denatured
2086 M. Oren et al. / Molecular Immuno
Ftcs
(cUas
IssdwGCtUe
2
mpmrr
TD
N
ig. 3. Number of differentially expressed ESTs (up/down-regulated) in the rejec-ion phenomenon, in accordance with their functional categories. The three analysisategories (rejected vs. naïve, rejecting vs. naïve and rejected vs. rejecting) are pre-ented within separated doted frames.
3 min at 95 ◦C), spun and layered onto the microarray slides, thenovered with cover slips (Lifterslip, Erie Scientific, Portsmouth, NH,SA; #25x60-2-4789; Corning). Thirty-five microliter of water wasdded to each hole of the hybridization chambers that were thenealed and incubated for 20 h at 42 ◦C.
Following hybridization, the slides were washed in wash buffers–III, consecutively (wash buffer I: 1× SSC, 0.1% SDS, 42 ◦C, 5 minhaking in dark; wash buffer II: 0.1× SSC, 0.1% SDS, 42 ◦C, 5 minhaking in dark; wash buffer III: 0.1× SSC, 5 min mild shaking inark at room temperature twice and followed by a quick dip inater). The slides were dried by centrifugation and scanned by aenePix 4000B scanner on two wavelengths corresponding to they3 and Cy5 emissions. The dual fluorescence images were quan-ified by the GENEPIX software (Molecular Devices, Sunnyvale, CA,SA), which also provided a weight index evaluating the quality ofach hybridized spot.
.4. Data analysis
Data analysis was conducted with the R computational environ-
ent (http://www.r-project.org/), using BioConductor softwareackages (Smyth, 2005), calculation and statistical analysis wasade using the LIMMA package (Linear Models for Microar-
ay data Analysis; Smyth, 2004, 2005) on the three biologicaleplicates. GENEPIX quantified image files were imported into
able 1ifferentially expressed genes of pooled samples (Exp. 1).
Functional classification No. Accession number
Up-regulated 1 GO357588, GO357648, GO357345, GO2 GO3567853 GO3568364 GO3569165 GO3560096 GO3577577 GO356576
Down-regulated 8 GO356404
A, not available.a Average value.
logy 47 (2010) 2083–2093
LIMMA and GENEPIX quality criteria were used. The Cy5 and Cy3intensities within each slide were normalized using the print-tiplocally weighted scatter plot smoothing (LOESS) method, while nobackground correction was applied. Clones were considered differ-entially expressed between two experimental conditions within abinary comparison when both Adj. P value <0.05 and B value >0were met (Benjamini and Hochberg, 1995).
Both blast match and GO annotations were attained usingthe Blast2GO software (http://www.blast2go.de/; Ashburner et al.,2000). Only blast hits with e-values <10−5 and their derived GOterms were considered valid annotations.
2.5. qPCR
cDNAs were synthesized using Verso cDNA kit (cat. AB-1453/B;Thermo Fisher Scientific, Epsom, UK). PCR amplifications were per-formed using Absolute Blue SYBER Green ROX Mix (cat. AB-4162/B;Thermo Fisher Scientific Inc, Epsom, UK) according to the man-ufacturer’s instructions. The analyzed ESTs were amplified usingspecific primers (S1). Data analysis was performed according toPfaffl, 2001.
3. Results
3.1. Transcriptomes vary between ‘rejecting’ and ‘rejected’colonies
The first microarray experiment (Exp. 1) in which pooled reject-ing pairs were tested against their pooled naïve clones (n = 3; Fig. 2)resulted in only 13 (0.3%) differentially expressed ESTs of whichfive matched cytochrome b and the rest had no significant blastmatches (Table 1). In the second microarray experiment (Exp. 2),each of six interacting Botryllus colonies from three interactingpairs was tested separately against its naïve clone and against itsrejecting partner as described in Fig. 2. In these rejection settings,the points of rejection, created by the challenged morula cells,were formed in only one genotype territory (referred to as ‘rejected’genotype) while the other genotype had no visual rejection signsand was termed as the ‘rejecting’ partner (Fig. 1). The microarrayanalysis showed that the rejected transcriptomes went throughsignificant transcriptional changes against their naïve counter-parts with 151 (3.5%) differentially expressed ESTs, divided into132 (87%) down-regulated and only 19 (13%) up-regulated ESTs(Table 2). Conversely, the rejecting transcriptomes showed just 31(0.7%) differentially expressed ESTs with 15 (48%) down-regulatedand 16 (52%) up-regulated ESTs (Table 3). No common differentiallyexpressed genes were identified between these two gene groups.
In order to characterize the direct transcriptional differentia-tion between rejected and rejecting samples we tested them directlyagainst each other (n = 3). The genotype-specific effects were elim-inated by subtracting the expression values of the correspondingnaïve clones. One hundred and twenty-five ESTs (2.9%) were differ-
Blast match Fold change N
356843, GO358359 Cytochrome b 1.6a 5NA 2.4 1NA 1.5 1NA 1.5 1NA 1.4 1NA 1.1 1NA 0.7 1NA −1.0 1

M. Oren et al. / Molecular Immunology 47 (2010) 2083–2093 2087
Table 2Differentially expressed genes of the rejected transcriptome.
Functional classification No. Accession number Blast match Fold change N
Up-regulatedProtein biosynthesis 1 GO358215 Ribosomal protein s19 2.3 1Other 2 GO356349 Atp synthase alpha subunit 5.0 1
3 GO355946 Aida protein 2.4 14 GO357116 von willebrand factor type
egf and pentraxin domaincontaining 1
3.3 1
Unknown 5 GO356699 NA 1.5 16 GO357513 NA 1.6 17 GO357569 NA 1.8 18 GO359508 NA 1.8 19 GO356306 NA 1.8 1
10 GO358349 NA 1.8 111 GO358159 NA 1.8 112 GO358389 NA 2.1 113 GO356256 NA 2.9 114 GO356803 NA 3.2 115 GO355844 NA 4.8 116 GO356836 NA 5.0 117 GO356009 NA 5.9 118 GO356511 NA 6.9 119 GO355930 NA 9.2 1
Down-regulatedCell structure and motility 20 GO359574, GO357892,
GO358628Actina −3.7 3
21 GO356892, GO357338,GO356730, GO357534,GO356999, GO358182
Beta actina −4.8 6
22 GO356356, GO358480,GO356962, GO357603
Muscle actina −2.2 4
23 GO356417 Actin related protein 2/3complex subunit 2
−2.8 1
24 GO357298, GO357906,GO358338, GO358041
Tubulin alphaa −5.7 4
25 GO358887, GO359124,GO356675, GO356712
Tubulin betaa −3.2 4
26 GO357122 Myosin regulatory lightchain
−2.0 1
Protein biosynthesis 27 GO358031, GO358472,GO357104, GO359135,GO358185, GO358394,GO357209
Ribosomal phosphoproteinp0a
−4.7 7
28 GO359095 Ribosomal protein l11 −2.8 129 GO359428 Ribosomal protein l13a −2.3 130 GO359307 Ribosomal protein l15 −7.2 131 GO357590 Ribosomal protein l23 −1.6 132 GO355571, GO359751 Ribosomal protein l3a −2.3 233 GO355855 Ribosomal protein l35a −5.1 134 GO358144 Ribosomal protein l5 −3.3 135 GO357402 Ribosomal protein l6 −2.0 136 GO358088, GO358921 Ribosomal protein l7a −2.5 237 GO358583, GO358491 Ribosomal protein l8a −3.1 238 GO356889 Ribosomal protein s14 −3.0 139 GO356647 Ribosomal protein s16 −2.0 140 GO359231 Ribosomal protein s2 −2.1 141 GO357694, GO357048,
GO356496, GO357525,GO358133
Ribosomal protein s3a −4.1 5
42 GO359111 Ribosomal protein s6 −2.4 143 GO358460 Ribosomal protein s7 −2.7 144 GO358592 Ribosomal protein s8 −2.7 145 GO359412, GO359499 Ribosomal
proteinx-linkeda−3.7 2
46 GO355925 Mediator of RNApolymerase 2
−3.8 1
47 GO355628 Transcription factor 25 −4.0 148 GO357798 Elongation factor-1 gamma −4.9 1
Immune related 49 GO355809 Thymus-specific serineprotease
−2.3 1
50 GO357651 Heat shock protein 70 −3.0 151 GO358546, GO356749 Heat shock protein 90a −1.8 252 GO355890 Cytochrome p450 like −2.6 153 GO356547, GO359313 Calmodulina −2.6 254 GO358752 B-cell translocation gene 1 −3.7 1

2088 M. Oren et al. / Molecular Immunology 47 (2010) 2083–2093
Table 2 (Continued )
Functional classification No. Accession number Blast match Fold change N
55 GO356270 Selenoprotein k −3.7 156 GO355966 Sparc-like 1 −5.6 157 GO357600 Selectin p (cd62) −4.3 158 GO355670 Sco-spondin −4.5 159 GO356986 Echinonectin −4.9 160 GO359723 Annexin isoform 1 −3.7 1
Other 61 GO358435 Heat shock cognate 70 −3.1 162 GO357362 Polyubiquitin −3.2 163 GO359681 Chaperonin containing
subunit 5−3.6 1
64 GO357321, GO356717 Atpase beta subunita −3.5 265 GO357916 Aldehyde dehydrogenase −3.3 166 GO355569 Angiopoietin-like 2 −3.2 167 GO355924 Ankyrin repeat domain 16 −3.2 168 GO355570 Anterior pharynx defective
1 homolog a−2.8 1
69 GO358106 Phosphate cytidylyltransferase alpha
−3.7 1
70 GO355672 Progestin and adipoqreceptor family member 3
−4.7 1
71 GO355651 Protein phosphataseregulatory subunit 7
−3.0 1
72 GO356211 Receptor for activatedprotein kinase c
−4.3 1
73 GO356651 Solute carrier family 25member 6
−2.5 1
74 GO358020 Zinc finger protein −4.4 1Unknown 75 GO358098 Unknown −7.4 1
76 GO359003 Unknown −5.6 177 GO358334 Unknown −5.3 178 GO355979 Unknown −3.4 179 GO358157 NA −6.1 180 GO358679 NA −6.1 181 GO355847 NA −6.0 182 GO356325 NA −5.0 183 GO358973 NA −5.0 184 GO356236 NA −4.5 185 GO356333 NA −4.2 186 GO359380 NA −4.2 187 GO357797 NA −4.2 188 GO355788 NA −4.1 189 GO358276 NA −3.9 190 GO358266 NA −3.8 191 GO358600 NA −3.7 192 GO358742 NA −3.7 193 GO358702 NA −3.7 194 GO356006 NA −3.6 195 GO357266 NA −3.6 196 GO356220 NA −3.5 197 GO355953 NA −3.5 198 GO355505 NA −3.4 199 GO358967 NA −3.3 1
100 GO358504 NA −3.2 1101 GO358298 NA −3.1 1102 GO357852 NA −3.0 1103 GO358739 NA −3.0 1104 GO355647 NA −2.9 1105 GO359667 NA −2.8 1106 GO359026 NA −2.8 1107 GO356568 NA −2.8 1108 GO358392 NA −2.7 1109 GO357901 NA −2.7 1110 GO355821 NA −2.3 1111 GO356181 NA −2.3 1112 GO358914 NA −2.2 1113 GO356201 NA −2.0 1114 GO359050 NA −2.0 1115 GO358250 NA −1.8 1116 GO358856 NA −2.0 1117 GO356823 NA −2.0 1118 GO358345 NA −1.9 1119 GO359230 NA −1.8 1
NA, not available.a Average values.
M. Oren et al. / Molecular Immunology 47 (2010) 2083–2093 2089
Table 3Differentially expressed genes of the rejecting transcriptome.
Functional classification No. Accession number Blast match Fold change
Up-regulatedOther 1 GO359435 f-box protein 36 4.2
2 GO358322 scd6 homolog a 2.1Unknown 3 GO358281 Unknown 1.7
4 GO359405 Unknown 2.45 GO358927 Unknown 3.26 GO358117 NA 1.57 GO358892 NA 1.68 GO356616 NA 1.79 GO358407 NA 2.0
10 GO358416 NA 2.411 GO357733 NA 2.512 GO357983 NA 2.513 GO356124 NA 2.614 GO355991 NA 3.015 GO359643 NA 3.116 GO358178 NA 3.3
Down-regulatedOther 17 GO358809 Ferredoxin −4.0
18 GO356594 Crystallin, beta −4.019 GO355886 Adp-ribosylation factor 5 −2.820 GO357683 Interferon-induced transmembraneprotein 3 (interferon-inducible protein 1–8u) −2.521 GO358633 af483038 1 post-like protein −2.122 GO356728 Solute carrier family 5 member 1 −2.023 GO357900 35-Bisphosphate nucleotidase 1 −1.5
Unknown 24 GO355804 NA −3.825 GO359070 NA −3.426 GO358993 NA −3.227 GO357673 NA −3.128 GO356823 NA −3.029 GO355615 NA −3.0
N
e9rs
ied
3
aitat
30 GO355790 NA31 GO357276 NA
A, not available.
ntially expressed between rejected and rejecting samples including0 (72%) down-regulated and 35 (28%) up-regulated in rejected vs.ejecting (Table 4). These results depict disparate rejection tran-criptomes matching the two distinctive rejection phenotypes.
It is also interesting to note that the candidate histocompatibil-ty gene (De Tomaso et al., 2005) and its receptor – fester (Nyholmt al., 2006) although included in the microarray, did not showifferential expression in any of the rejection assays.
.2. Expression profile of functional gene groups
Several genes and functional gene groups went through remark-
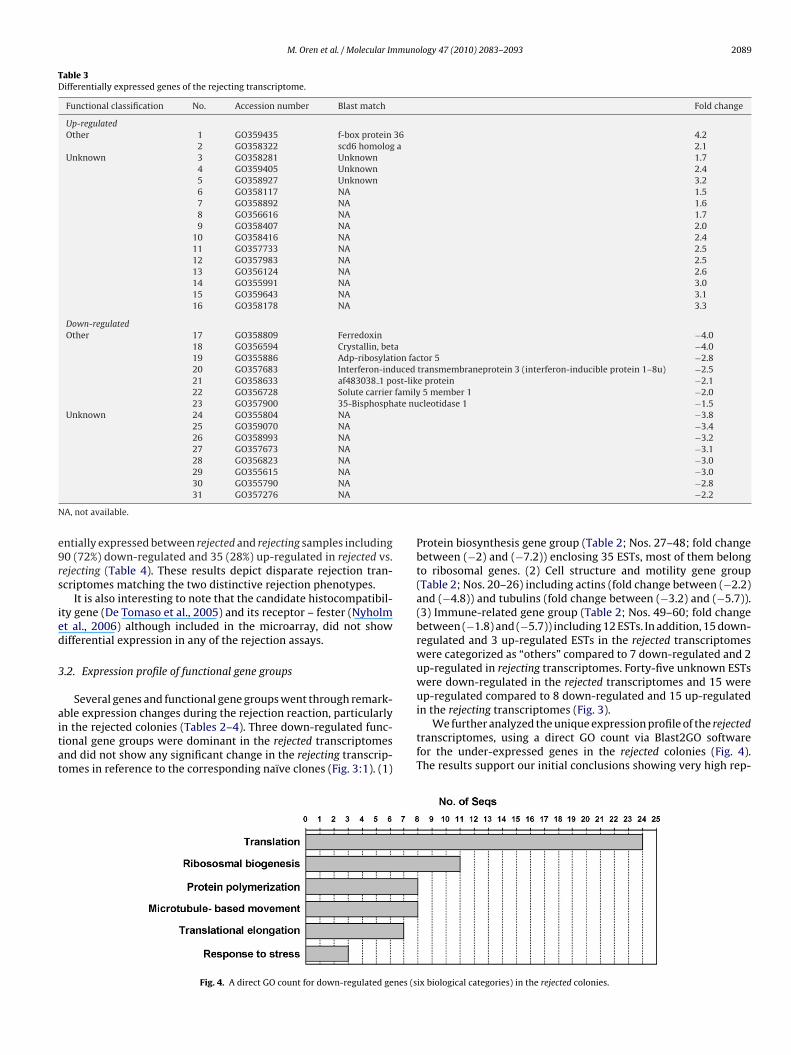
ble expression changes during the rejection reaction, particularlyn the rejected colonies (Tables 2–4). Three down-regulated func-ional gene groups were dominant in the rejected transcriptomesnd did not show any significant change in the rejecting transcrip-omes in reference to the corresponding naïve clones (Fig. 3:1). (1)Fig. 4. A direct GO count for down-regulated genes (s
−2.8−2.2
Protein biosynthesis gene group (Table 2; Nos. 27–48; fold changebetween (−2) and (−7.2)) enclosing 35 ESTs, most of them belongto ribosomal genes. (2) Cell structure and motility gene group(Table 2; Nos. 20–26) including actins (fold change between (−2.2)and (−4.8)) and tubulins (fold change between (−3.2) and (−5.7)).(3) Immune-related gene group (Table 2; Nos. 49–60; fold changebetween (−1.8) and (−5.7)) including 12 ESTs. In addition, 15 down-regulated and 3 up-regulated ESTs in the rejected transcriptomeswere categorized as “others” compared to 7 down-regulated and 2up-regulated in rejecting transcriptomes. Forty-five unknown ESTswere down-regulated in the rejected transcriptomes and 15 wereup-regulated compared to 8 down-regulated and 15 up-regulated
in the rejecting transcriptomes (Fig. 3).We further analyzed the unique expression profile of the rejectedtranscriptomes, using a direct GO count via Blast2GO softwarefor the under-expressed genes in the rejected colonies (Fig. 4).The results support our initial conclusions showing very high rep-
ix biological categories) in the rejected colonies.

2090 M. Oren et al. / Molecular Immunology 47 (2010) 2083–2093
Table 4Differentially expressed genes: rejected vs. rejecting transcriptome.
Functional classification No. Accession number Blast match Fold change N
Up-regulatedImmune related 1 GO357124, GO356879 Trypsina 2.4 2
2 GO358155 chk1 checkpoint homolog 2.6 13 GO357146 Heat shock 10 kDa protein
1 (chaperonin 10)1.8 1
4 GO357593 Cathepsin l 2.5 15 GO357683 Interferon-induced
transmembrane protein 3(interferon-inducibleprotein 1–8u)
2.9 1
Other 6 GO359056 Ribosomal protein s21 4.0 17 GO356391 Aspartyl aminopeptidase 2.2 18 GO355886 Adp-ribosylation factor 5 3.0 19 GO355946 Aida protein 2.4 1
10 GO358402 Succinate dehydrogenas-esubunitintegralmembrane protein
1.9 1
11 GO355559 Lipoproteinreceptor-related protein 6
2.4 1
Unknown 12 GO355538 Unknown 3.4 113 GO359063 Unknown 1.8 114 GO359359 NA 1.7 115 GO359508 NA 1.7 116 GO357569 NA 1.8 117 GO356304 NA 1.9 118 GO355578 NA 1.9 119 GO358659 NA 2.0 120 GO356306 NA 2.1 121 GO356054 NA 2.1 122 GO358349 NA 2.2 123 GO355659 NA 2.4 124 GO356419 NA 2.4 125 GO357428 NA 2.4 126 GO357663 NA 2.4 127 GO355799 NA 2.6 128 GO357067 NA 2.9 129 GO355574 NA 2.9 130 GO357276 NA 3.0 131 GO357673 NA 3.1 132 GO355615 NA 3.6 133 GO355882 NA 4.2 134 GO355790 NA 5.2 1
Down-regulatedCell structure and motility 35 GO357445, GO359574,
GO358628Actina −3.6 3
36 GO357903, GO358182,GO356730, GO356892,GO357338, GO356999
Beta actina −3.8 6
37 GO357603, GO356962 Muscle actin −3.8 238 GO357298 Tubulin alpha −4.2 139 GO357122 myosin regulatory light
chain−2.1 1
Protein biosynthesis 40 GO358472, GO357104,GO358031, GO358185,GO359135
Ribosomal phosphoproteinp0
−4.4 5
41 GO359307 Ribosomal protein l15 −7.0 142 GO359751 Ribosomal protein l3 −2.8 143 GO355855 Ribosomal protein l35a −4.5 144 GO358188, GO358144 Ribosomal protein l5 −3.4 245 GO358088 Ribosomal protein l7 −3.2 146 GO358491, GO358583 Ribosomal protein l8 −3.1 147 GO356889 Ribosomal protein s14 −2.9 148 GO356647 Ribosomal protein s16 −2.1 149 GO357525, GO357694,
GO356496, GO357048Ribosomal protein s3 −3.7 1
50 GO359111 Ribosomal protein s6 −2.3 151 GO358460 Ribosomal protein s7 −2.5 152 GO358592 Ribosomal protein s8 −2.3 153 GO359412 Ribosomal proteinx-linked −3.6 154 GO355628 Transcription factor 25
(basic helix–loop–helix)−3.6 1
55 GO355925 Mediator of RNApolymerase ii transcriptionsubunit 6-like
−3.7 1
M. Oren et al. / Molecular Immunology 47 (2010) 2083–2093 2091
Table 4 (Continued )
Functional classification No. Accession number Blast match Fold change N
56 GO358405 Elongation factor-1 alpha −2.8 1Immune related 57 GO358752 B-cell translocation gene
anti-proliferative−4.8 1
58 GO355570 Anterior pharynx defective1 homolog a
−3.0 1
59 GO356936 Chitinase 1 −2.0 160 GO358546 Heat shock protein 90 −6.2 161 GO357479 Rhamnose binding lectin −2.8 162 GO356547 Calmodulin −2.9 163 GO355809 Thymus-specific serine
protease−2.5 1
64 GO355890 Cytochrome p450 like −3.6 165 GO356986 Echinonectin −2.9 166 GO355966 Sparc-like 1 −4.8 167 GO359723 Annexin isoform 1 −3.5 168 GO355670 Sco-spondin −3.9 1
Other 69 GO358322 scd6 homolog a −2.170 GO356211 Receptor for activated
protein kinase c−4.0 1
71 GO356270 Selenoprotein k −3.0 172 GO359681 Chaperonin containing
subunit 5−4.1 1
73 GO358514 Coatomer protein subunitgamma 2
−3.7 1
74 GO357916 Aldehyde dehydrogenase −3.0 175 GO355924 Ankyrin repeat domain 16 −2.0 176 GO357362 Polyubiquitin −3.3 177 GO355672 Progestin and adipoq
receptor family member iii−3.9 1
Unknown 78 GO358098, GO358334 loc795591 unknownprotein
−4.9 2
79 GO358927 Unknown −3.0 180 GO355979 Unknown −3.4 181 GO359405 Unknown −2.2 182 GO359003 Unknown −5.2 183 GO358157 NA −6.3 184 GO358679 NA −5.7 185 GO356325 NA −4.4 186 GO356236 NA −4.2 187 GO358276 NA −4.0 188 GO355788 NA −3.9 189 GO356333 NA −3.9 190 GO358742 NA −3.8 191 GO357266 NA −3.7 192 GO359380 NA −3.6 193 GO358973 NA −3.6 194 GO355953 NA −3.5 195 GO355505 NA −3.3 196 GO356020 NA −3.2 197 GO358967 NA −3.1 198 GO358702 NA −3.1 199 GO356220 NA −3.0 1
100 GO357797 NA −3.0 1101 GO359667 NA −3.0 1102 GO358504 NA −3.0 1103 GO356006 NA −2.9 1104 GO358738 NA −2.8 1105 GO359026 NA −2.7 1106 GO355647 NA −2.7 1107 GO357852 NA −2.7 1108 GO355854 NA −2.6 1109 GO358178 NA −2.5 1110 GO359643 NA −2.1 1
N
rctruic
A, not available.a Average values.
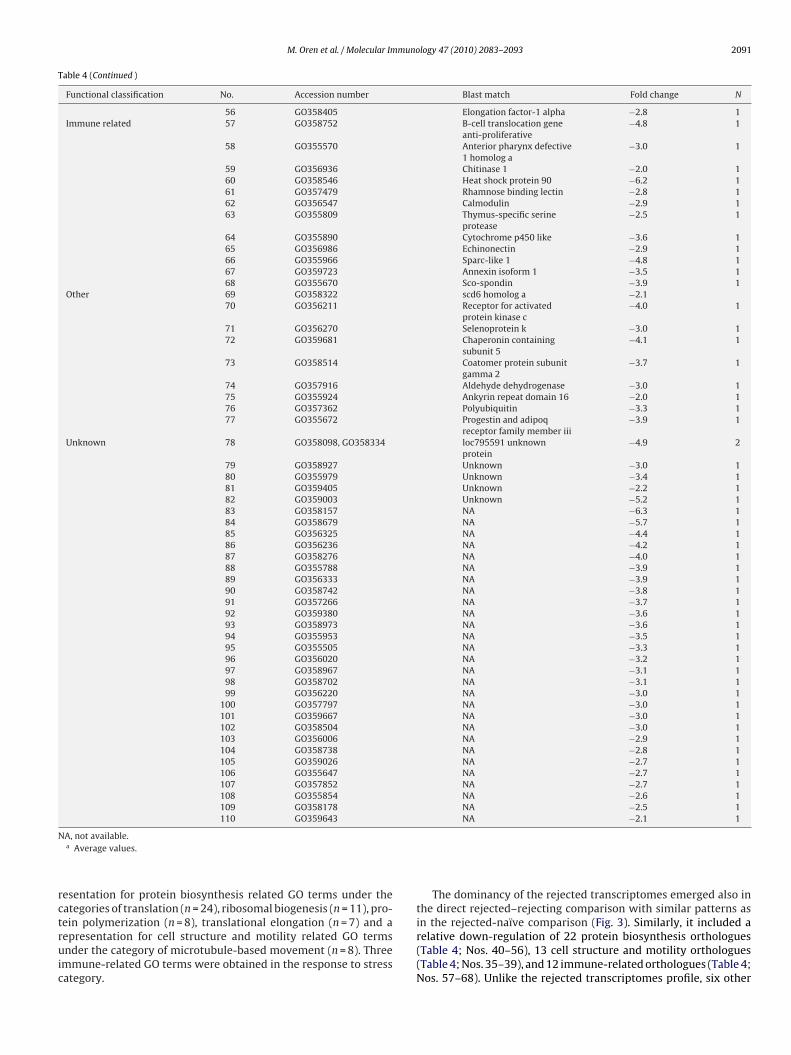
esentation for protein biosynthesis related GO terms under theategories of translation (n = 24), ribosomal biogenesis (n = 11), pro-
ein polymerization (n = 8), translational elongation (n = 7) and aepresentation for cell structure and motility related GO termsnder the category of microtubule-based movement (n = 8). Threemmune-related GO terms were obtained in the response to stressategory.
The dominancy of the rejected transcriptomes emerged also inthe direct rejected–rejecting comparison with similar patterns as
in the rejected-naïve comparison (Fig. 3). Similarly, it included arelative down-regulation of 22 protein biosynthesis orthologues(Table 4; Nos. 40–56), 13 cell structure and motility orthologues(Table 4; Nos. 35–39), and 12 immune-related orthologues (Table 4;Nos. 57–68). Unlike the rejected transcriptomes profile, six other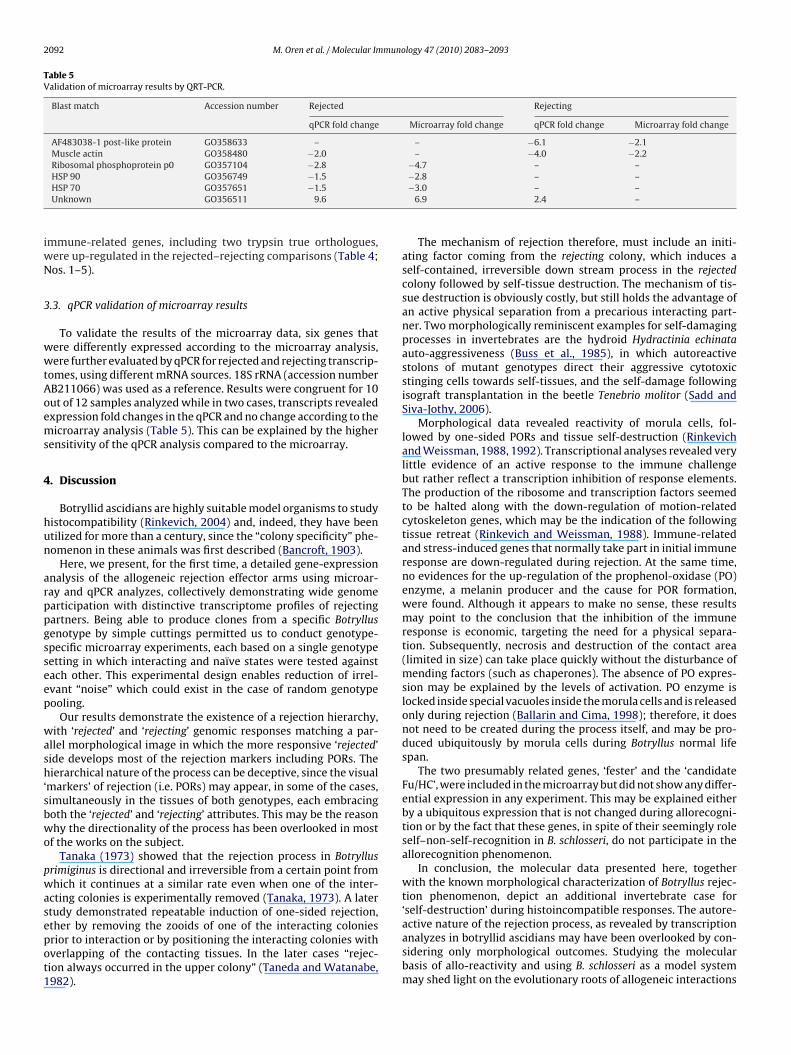
2092 M. Oren et al. / Molecular Immunology 47 (2010) 2083–2093
Table 5Validation of microarray results by QRT-PCR.
Blast match Accession number Rejected Rejecting
qPCR fold change Microarray fold change qPCR fold change Microarray fold change
AF483038-1 post-like protein GO358633 – – −6.1 −2.1Muscle actin GO358480 −2.0 – −4.0 −2.2Ribosomal phosphoprotein p0 GO357104 −2.8 −4.7 – –
iwN
3
wwtAoems
4
hun
arppgsseep
wash‘sbwo
pwasepot1
HSP 90 GO356749 −1.5HSP 70 GO357651 −1.5Unknown GO356511 9.6
mmune-related genes, including two trypsin true orthologues,ere up-regulated in the rejected–rejecting comparisons (Table 4;os. 1–5).
.3. qPCR validation of microarray results
To validate the results of the microarray data, six genes thatere differently expressed according to the microarray analysis,ere further evaluated by qPCR for rejected and rejecting transcrip-
omes, using different mRNA sources. 18S rRNA (accession numberB211066) was used as a reference. Results were congruent for 10ut of 12 samples analyzed while in two cases, transcripts revealedxpression fold changes in the qPCR and no change according to theicroarray analysis (Table 5). This can be explained by the higher
ensitivity of the qPCR analysis compared to the microarray.
. Discussion
Botryllid ascidians are highly suitable model organisms to studyistocompatibility (Rinkevich, 2004) and, indeed, they have beentilized for more than a century, since the “colony specificity” phe-omenon in these animals was first described (Bancroft, 1903).
Here, we present, for the first time, a detailed gene-expressionnalysis of the allogeneic rejection effector arms using microar-ay and qPCR analyzes, collectively demonstrating wide genomearticipation with distinctive transcriptome profiles of rejectingartners. Being able to produce clones from a specific Botryllusenotype by simple cuttings permitted us to conduct genotype-pecific microarray experiments, each based on a single genotypeetting in which interacting and naïve states were tested againstach other. This experimental design enables reduction of irrel-vant “noise” which could exist in the case of random genotypeooling.
Our results demonstrate the existence of a rejection hierarchy,ith ‘rejected’ and ‘rejecting’ genomic responses matching a par-
llel morphological image in which the more responsive ‘rejected’ide develops most of the rejection markers including PORs. Theierarchical nature of the process can be deceptive, since the visual
markers’ of rejection (i.e. PORs) may appear, in some of the cases,imultaneously in the tissues of both genotypes, each embracingoth the ‘rejected’ and ‘rejecting’ attributes. This may be the reasonhy the directionality of the process has been overlooked in most
f the works on the subject.Tanaka (1973) showed that the rejection process in Botryllus
rimiginus is directional and irreversible from a certain point fromhich it continues at a similar rate even when one of the inter-
cting colonies is experimentally removed (Tanaka, 1973). A latertudy demonstrated repeatable induction of one-sided rejection,
ther by removing the zooids of one of the interacting coloniesrior to interaction or by positioning the interacting colonies withverlapping of the contacting tissues. In the later cases “rejec-ion always occurred in the upper colony” (Taneda and Watanabe,982).−2.8 – –−3.0 – –
6.9 2.4 –
The mechanism of rejection therefore, must include an initi-ating factor coming from the rejecting colony, which induces aself-contained, irreversible down stream process in the rejectedcolony followed by self-tissue destruction. The mechanism of tis-sue destruction is obviously costly, but still holds the advantage ofan active physical separation from a precarious interacting part-ner. Two morphologically reminiscent examples for self-damagingprocesses in invertebrates are the hydroid Hydractinia echinataauto-aggressiveness (Buss et al., 1985), in which autoreactivestolons of mutant genotypes direct their aggressive cytotoxicstinging cells towards self-tissues, and the self-damage followingisograft transplantation in the beetle Tenebrio molitor (Sadd andSiva-Jothy, 2006).
Morphological data revealed reactivity of morula cells, fol-lowed by one-sided PORs and tissue self-destruction (Rinkevichand Weissman, 1988, 1992). Transcriptional analyses revealed verylittle evidence of an active response to the immune challengebut rather reflect a transcription inhibition of response elements.The production of the ribosome and transcription factors seemedto be halted along with the down-regulation of motion-relatedcytoskeleton genes, which may be the indication of the followingtissue retreat (Rinkevich and Weissman, 1988). Immune-relatedand stress-induced genes that normally take part in initial immuneresponse are down-regulated during rejection. At the same time,no evidences for the up-regulation of the prophenol-oxidase (PO)enzyme, a melanin producer and the cause for POR formation,were found. Although it appears to make no sense, these resultsmay point to the conclusion that the inhibition of the immuneresponse is economic, targeting the need for a physical separa-tion. Subsequently, necrosis and destruction of the contact area(limited in size) can take place quickly without the disturbance ofmending factors (such as chaperones). The absence of PO expres-sion may be explained by the levels of activation. PO enzyme islocked inside special vacuoles inside the morula cells and is releasedonly during rejection (Ballarin and Cima, 1998); therefore, it doesnot need to be created during the process itself, and may be pro-duced ubiquitously by morula cells during Botryllus normal lifespan.
The two presumably related genes, ‘fester’ and the ‘candidateFu/HC’, were included in the microarray but did not show any differ-ential expression in any experiment. This may be explained eitherby a ubiquitous expression that is not changed during allorecogni-tion or by the fact that these genes, in spite of their seemingly roleself–non-self-recognition in B. schlosseri, do not participate in theallorecognition phenomenon.
In conclusion, the molecular data presented here, togetherwith the known morphological characterization of Botryllus rejec-tion phenomenon, depict an additional invertebrate case for‘self-destruction’ during histoincompatible responses. The autore-
active nature of the rejection process, as revealed by transcriptionanalyzes in botryllid ascidians may have been overlooked by con-sidering only morphological outcomes. Studying the molecularbasis of allo-reactivity and using B. schlosseri as a model systemmay shed light on the evolutionary roots of allogeneic interactions
muno
ai
A
rMU2U
A
t
R
A
B
B
B
B
D
G
H
L
N
M. Oren et al. / Molecular Im
nd on the evolutionary connections between phenomena such asnnate immunity, histocompatibility and auto-immunity.
cknowledgements
We thank E. Moiseeva for histology and M. Kott for the microar-ay services. This study was supported by grants to B.R. from thearine Genomics Europe Network of Excellence (EDD Node), thenited States–Israel Bi-National Science Foundation (550-06 and003-010), the Israel Science Foundation (1342-08); J.D and theniversity of Mississippi College of Liberal Arts (T.L.G.).
ppendix A. Supplementary data
Supplementary data associated with this article can be found, inhe online version, at doi:10.1016/j.molimm.2010.04.007.
eferences
shburner, M., Ball, C.A., Blake, J.A., Botstein, D., Butler, H., Cherry, J.M., Davis,A.P., Dolinski, K., Dwight, S.S., Eppig, J.T., Harris, M.A., Hill, D.P., Issel-Tarver, L.,Kasarskis, A., Lewis, S., Matese, J.C., Richardson, J.E., Ringwald, M., Rubin, G.M.,Sherlock, G., 2000. Gene ontology: tool for the unification of biology. Nat. Genet.25, 25–29.
allarin, L., Cima, F., 1998. Phenoloxidase and cytotoxicity in the compound ascidianBotryllus schlosseri. Dev. Comp. Immunol. 22, 479–492.
ancroft, F.W., 1903. Variation and fusion of colonies in compound ascidians. Proc.Calif. Acad. Sci. Ser. 3, 137–186.
enjamini, Y., Hochberg, Y., 1995. Controlling the false discovery rate: a practicaland powerful approach to multiple testing. J. R. Stat. Soc. Ser. B: Stat. Methodol.57, 289–300.
uss, L.W., Moore, J.L., Green, D.G., 1985. Autoreactivity and self tolerance in aninvertebrate. Nature 313, 400–402.
e Tomaso, A.W., Nyholm, S.V., Palmeri, K.J., Ishizuka, K.J., Ludington, W.B., Mitchel,K., Weissman, I.L., 2005. Isolation and characterization of a protochordate his-tocompatibility locus. Nature 38, 454–459.
rosberg, R.K., 1988. The evolution of allorecognition specificity in clonal inverte-brates. Q. Rev. Biol. 63, 277–412.
ildemann, W.H., 1979. Immunocompetence and allogeneic polymorphism among
invertebrates. Transplantation 27, 1–3.auzon, R.J., Ishizuka, K.J., Weissman, I.L., 1992. A cyclical, developmentally regulateddeath phenomenon in a colonial urochordate. Dev. Dyn. 194, 71–83.
yholm, S.V., Passegue, E., Ludington, W.B., Voskoboynic, A., Mitchel, K., Weissman,I.L., De Tomaso, A.W., 2006. Fester, a candidate allorecognition receptor from aprimitive chordate. Immunity 25, 163–173.
logy 47 (2010) 2083–2093 2093
Oren, M., Douek, J., Fishelson, Z., Rinkevich, B., 2007. Identification of immune-relevant genes in histoincompatible rejecting colonies of the tunicate Botryllusschlosseri. Dev. Comp. Immunol. 31, 889–902.
Oren, M., Escande, M.L., Paz, G., Fishelson, Z., Rinkevich, B., 2008. Urochor-date histoincompatible interactions activate vertebrate-like coagulation systemcomponents. PLoS ONE 3, e3123.
Pfaffl, M.W., 2001. A new mathematical model for relative quantification in real-timeRT-PCR. Nucleic Acids Res. 29, 2002–2007.
Rinkevich, B., 1995. Morphologically related allorecognition assays in botryllidascidians. In: Stolen, J.S., Fletcher, T.C., Smith, S.A., Zelikoff, J.T., Kaattari, S.L.,Anderson, R.S., Söderhäll, K., Weeks-Perkins, B.A. (Eds.), Techniques in FishImmunology. 4. Immunology and Pathology of Aquatic Invertebrates. SOS Pub-lications, Fair Haven, pp. 17–21.
Rinkevich, B., Porat, R., Goren, M., 1995. Allorecognition elements on a urochordatehistocompatibility locus indicates unprecedented extensive polymorphism.Proc. R. Soc. Lond. B 259, 319–324.
Rinkevich, B., Weissman, I.L., 1988. Retreat growth in the ascidian Botryllus schlosseri:a consequence of nonself recognition. In: Grosberg, R.K., Hedgecock, R.K., Nelson,D.K. (Eds.), Invertebrate Historecognition. Plenum Press, New York, pp. 93–109.
Rinkevich, B., Weissman, I.L., 1992. Incidents of rejection and indifference in Fu/HCincompatible protochordate colonies. J. Exp. Zool. 263, 105–111.
Rinkevich, B., Shapira, M., 1998. An improved diet for inland broodstock and theestablishment of an inbred line form Botryllus schlosseri, a colonial sea squirt(Ascidiacea). Aquat. Living Resour. 11, 163–171.
Rinkevich, B., Tartakover, S., Gershon, H., 1998. The contribution of morula cells toallogeneic responses in the colonial urochordate, Botryllus schlosseri. Mar. Biol.131, 227–236.
Rinkevich, B., 2004. Primitive immune systems: are your ways my ways? Immunol.Rev. 198, 25–35.
Sadd, B.M., Siva-Jothy, M.T., 2006. Self-harm caused by an insect’s innate immunity.Proc. R. Soc. B 273, 2571–2754.
Scofield, V.L., Schlumpberger, J.M., West, L.A., Weissman, I.L., 1982. Protochordateallorecognition is controlled by an MHC-like gene system. Nature 295, 499–502.
Scofield, V.L., Nagashima, L.S., 1983. Morphology and genetics of rejection reactionsbetween oozooids from the tunicate Botryllus schlosseri. Biol. Bull. 165, 733–744.
Smyth, G.K., 2004. Linear models and empirical Bayes methods for assessing dif-ferential expression in microarray experiments. Stat. Appl. Genet. Mol. Biol. 3,Article 3.
Smyth, G.K., 2005. LIMMA: linear models for microarray data. In: Gentleman, R.,Carey, V.J., Huber, W., Irizarry, R.A., Dudoit, S. (Eds.), Bioinformatics and Compu-tational Biology Solutions Using R and Bioconductor. Statistics for Biology andHealth. Springer, New York, NY, pp. 397–420.
Tanaka, K., 1973. Allogeneic inhibition in a compound ascidican, Botryllus primigenusOka. II. Cellular and humoral responses in “nonfusion” reaction. Cell Immunol.7, 427–443.
Taneda, Y., Watanabe, H., 1982. Studies on colony specificity in the compound ascid-ian, Botryllus primigenus Oka. I. initiation of “nonfusion” reaction with specialreference to blood cells infiltration. Dev. Comp. Immunol. 6, 43–52.
Weissman, I.L., Saito, Y., Rinkevich, B., 1990. Allorecognition histocompatibility ina protochordate species: is the relationship to MHC semantic or structural?Immunol. Rev. 113, 227–241.