Small RNA sequencing-microarray analyses in Parkinson leukocytes reveal deep brain...
20
ORIGINAL RESEARCH ARTICLE published: 13 May 2013 doi: 10.3389/fnmol.2013.00010 Small RNA sequencing-microarray analyses in Parkinson leukocytes reveal deep brain stimulation-induced splicing changes that classify brain region transcriptomes Lilach Soreq 1 , Nathan Salomonis 2 , Michal Bronstein 3 , David S. Greenberg 4 , Zvi Israel 5 , Hagai Bergman 1,6 and Hermona Soreq 4,6 * 1 Department of Medical Neurobiology, Hadassah Faculty of Medicine, The Hebrew University of Jerusalem, Jerusalem, Israel 2 Division of Genomic Medicine, The Gladstone Institute of Cardiovascular Disease, San Francisco, CA, USA 3 The Center for Genomic Technologies, The Institute of Life Sciences, The Hebrew University of Jerusalem, Jerusalem, Israel 4 Department of Biological Chemistry, The Life Sciences Institute, The Hebrew University of Jerusalem, Jerusalem, Israel 5 Department of Neurosurgery, The Centre for Functional and Restorative Neurosurgery, Hadassah University Hospital, Jerusalem, Israel 6 The Edmond and Lili Safra Center for Brain Sciences, The Hebrew University of Jerusalem, Jerusalem, Israel Edited by: Alistair N. Garratt, Max Delbrück Center for Molecular Medicine, Germany Reviewed by: Hansen Wang, University of Toronto, Canada Eldi Schonfeld-Dado, Stanford University, USA *Correspondence: Hermona Soreq, Department of Biological Chemistry, The Alexander Silberman Institute of Life Sciences, Edmond Safra Campus - Givat Ram, The Hebrew University of Jerusalem, Jerusalem, 91904, Israel. e-mail: hermona.soreq@ mail.huji.ac.il MicroRNAs (miRNAs) are key post transcriptional regulators of their multiple target genes. However, the detailed profile of miRNA expression in Parkinson’s disease, the second most common neurodegenerative disease worldwide and the first motor disorder has not been charted yet. Here, we report comprehensive miRNA profiling by next-generation small-RNA sequencing, combined with targets inspection by splice-junction and exon arrays interrogating leukocyte RNA in Parkinson’s disease patients before and after deep brain stimulation (DBS) treatment and of matched healthy control volunteers (HC). RNA-Seq analysis identified 254 miRNAs and 79 passenger strand forms as expressed in blood leukocytes, 16 of which were modified in patients pre-treatment as compared to HC. 11 miRNAs were modified following brain stimulation 5 of which were changed inversely to the disease induced changes. Stimulation cessation further induced changes in 11 miRNAs. Transcript isoform abundance analysis yielded 332 changed isoforms in patients compared to HC, which classified brain transcriptomes of 47 PD and control independent microarrays. Functional enrichment analysis highlighted mitochondrion organization. DBS induced 155 splice changes, enriched in ubiquitin homeostasis. Cellular composition analysis revealed immune cell activity pre and post treatment. Overall, 217 disease and 74 treatment alternative isoforms were predictably targeted by modified miRNAs within both 3 and 5 untranslated ends and coding sequence sites. The stimulation-induced network sustained 4 miRNAs and 7 transcripts of the disease network. We believe that the presented dynamic networks provide a novel avenue for identifying disease and treatment-related therapeutic targets. Furthermore, the identification of these networks is a major step forward in the road for understanding the molecular basis for neurological and neurodegenerative diseases and assessment of the impact of brain stimulation on human diseases. Keywords: deep brain stimulation, high throughput sequencing, leukocytes, miRNAs, Parkinson’s disease, splice junction microarrays, substantia nigra INTRODUCTION Parkinson’s disease (PD) is the second most prevalent neurode- generative disease worldwide and the first movement disorder. PD is mainly expressed in progressive, deliberating motor symptoms, initiating with tremor at rest, slowness of movement and rigidity which develops into flexed posture, loss of postural reflexes and a freezing phenomenon (Fahn and Elton, 1987). Notably, the car- dinal motor symptoms appear only years after initiation of the disease process. As the disease presents other central signs such as depression, sleep disorders (Bernal-Pacheco et al., 2012) and dementia (Goldman and Litvan, 2011) as well as peripheral symp- toms (e.g., digestive and olfactory impairments) (Braak and Del Tredici, 2008), it is becoming increasingly clear that PD is not a pure motor disorder. In fact, it may initiate many years prior to the appearance of the motor symptoms (Hawkes et al., 2010). However, current methods do not allow early or accurate diag- nosis and moreover, the genes and mechanisms that lead to the massive dopaminergic neuronal loss in the damaged PD brain are still largely obscure. The growing prevalence of PD worldwide introduces a strong incentive to find both disease biomarkers and future therapeutic targets. MicroRNAs (miRNAs) are key post transcriptional regulators. Since their discovery 20 years ago (Lee et al., 1993), it has been well demonstrated that they play essential roles in development (Reinhart et al., 2000) as well as in human diseases, for example in cancer (Mraz et al., 2009; Li et al., 2013; Pu et al., 2013), as well Frontiers in Molecular Neuroscience www.frontiersin.org May 2013 | Volume6 | Article 10 | 1 MOLECULAR NEUROSCIENCE
Transcript of Small RNA sequencing-microarray analyses in Parkinson leukocytes reveal deep brain...

ORIGINAL RESEARCH ARTICLEpublished: 13 May 2013
doi: 10.3389/fnmol.2013.00010
Small RNA sequencing-microarray analyses in Parkinsonleukocytes reveal deep brain stimulation-induced splicingchanges that classify brain region transcriptomesLilach Soreq1, Nathan Salomonis2, Michal Bronstein 3, David S. Greenberg 4, Zvi Israel 5,Hagai Bergman1,6 and Hermona Soreq4,6*
1 Department of Medical Neurobiology, Hadassah Faculty of Medicine, The Hebrew University of Jerusalem, Jerusalem, Israel2 Division of Genomic Medicine, The Gladstone Institute of Cardiovascular Disease, San Francisco, CA, USA3 The Center for Genomic Technologies, The Institute of Life Sciences, The Hebrew University of Jerusalem, Jerusalem, Israel4 Department of Biological Chemistry, The Life Sciences Institute, The Hebrew University of Jerusalem, Jerusalem, Israel5 Department of Neurosurgery, The Centre for Functional and Restorative Neurosurgery, Hadassah University Hospital, Jerusalem, Israel6 The Edmond and Lili Safra Center for Brain Sciences, The Hebrew University of Jerusalem, Jerusalem, Israel
Edited by:
Alistair N. Garratt, Max DelbrückCenter for Molecular Medicine,Germany
Reviewed by:
Hansen Wang, Universityof Toronto, CanadaEldi Schonfeld-Dado, StanfordUniversity, USA
*Correspondence:
Hermona Soreq, Department ofBiological Chemistry, The AlexanderSilberman Institute of Life Sciences,Edmond Safra Campus - Givat Ram,The Hebrew University ofJerusalem, Jerusalem, 91904, Israel.e-mail: [email protected]
MicroRNAs (miRNAs) are key post transcriptional regulators of their multiple target genes.However, the detailed profile of miRNA expression in Parkinson’s disease, the secondmost common neurodegenerative disease worldwide and the first motor disorder has notbeen charted yet. Here, we report comprehensive miRNA profiling by next-generationsmall-RNA sequencing, combined with targets inspection by splice-junction and exonarrays interrogating leukocyte RNA in Parkinson’s disease patients before and afterdeep brain stimulation (DBS) treatment and of matched healthy control volunteers (HC).RNA-Seq analysis identified 254 miRNAs and 79 passenger strand forms as expressed inblood leukocytes, 16 of which were modified in patients pre-treatment as compared to HC.11 miRNAs were modified following brain stimulation 5 of which were changed inverselyto the disease induced changes. Stimulation cessation further induced changes in 11miRNAs. Transcript isoform abundance analysis yielded 332 changed isoforms in patientscompared to HC, which classified brain transcriptomes of 47 PD and control independentmicroarrays. Functional enrichment analysis highlighted mitochondrion organization. DBSinduced 155 splice changes, enriched in ubiquitin homeostasis. Cellular compositionanalysis revealed immune cell activity pre and post treatment. Overall, 217 disease and74 treatment alternative isoforms were predictably targeted by modified miRNAs withinboth 3′ and 5′ untranslated ends and coding sequence sites. The stimulation-inducednetwork sustained 4 miRNAs and 7 transcripts of the disease network. We believe thatthe presented dynamic networks provide a novel avenue for identifying disease andtreatment-related therapeutic targets. Furthermore, the identification of these networksis a major step forward in the road for understanding the molecular basis for neurologicaland neurodegenerative diseases and assessment of the impact of brain stimulation onhuman diseases.
Keywords: deep brain stimulation, high throughput sequencing, leukocytes, miRNAs, Parkinson’s disease, splice
junction microarrays, substantia nigra
INTRODUCTIONParkinson’s disease (PD) is the second most prevalent neurode-generative disease worldwide and the first movement disorder. PDis mainly expressed in progressive, deliberating motor symptoms,initiating with tremor at rest, slowness of movement and rigiditywhich develops into flexed posture, loss of postural reflexes and afreezing phenomenon (Fahn and Elton, 1987). Notably, the car-dinal motor symptoms appear only years after initiation of thedisease process. As the disease presents other central signs suchas depression, sleep disorders (Bernal-Pacheco et al., 2012) anddementia (Goldman and Litvan, 2011) as well as peripheral symp-toms (e.g., digestive and olfactory impairments) (Braak and DelTredici, 2008), it is becoming increasingly clear that PD is not a
pure motor disorder. In fact, it may initiate many years prior tothe appearance of the motor symptoms (Hawkes et al., 2010).However, current methods do not allow early or accurate diag-nosis and moreover, the genes and mechanisms that lead to themassive dopaminergic neuronal loss in the damaged PD brainare still largely obscure. The growing prevalence of PD worldwideintroduces a strong incentive to find both disease biomarkers andfuture therapeutic targets.
MicroRNAs (miRNAs) are key post transcriptional regulators.Since their discovery 20 years ago (Lee et al., 1993), it has beenwell demonstrated that they play essential roles in development(Reinhart et al., 2000) as well as in human diseases, for examplein cancer (Mraz et al., 2009; Li et al., 2013; Pu et al., 2013), as well
Frontiers in Molecular Neuroscience www.frontiersin.org May 2013 | Volume 6 | Article 10 | 1
MOLECULAR NEUROSCIENCE

Soreq et al. Parkinson leukocyte miRNA-splicing profiles
as Alzheimer’s disease and other central nervous system disorders(Maes et al., 2009). A growing body of evidence now suggeststhat peripheral miRNA changes may co-occur with the onset ofPD (Doxakis, 2010; Martins et al., 2011). MiRNAs mediate post-transcriptional regulation of protein-coding genes by primarilybinding to short sequence motifs found typically in the 3′ un-translated region of target mRNAs. Depending on the degreeof sequence complementation, this leads to translational inhibi-tion, mRNA destabilization or degradation. Since their discovery,miRNAs have emerged as crucial regulators of gene expression,and a single miRNA can concurrently regulate hundreds of targetmRNAs. However, despite their biologic importance, determiningglobal miRNA profiles and functional miRNA-target interactionsremained a major challenge. Correspondingly, so far only about20% of the known human miRNAs were found as constitutingbiological networks of functionally-associated molecules (Satohand Tabunoki, 2011).
PD-related miRNAs have been characterized in midbraindopaminergic neurons (Kim et al., 2007; Minones-Moyano et al.,2011), and were found to post-transcriptionally regulate the keyPD genes LRRK2 (Gehrke et al., 2010) and SNCA (Doxakis,2010). Also, down-regulation of miR-34b/c was found to mod-ulate mitochondrial function in PD (Martins et al., 2011) anddeletion of hsa-let-7 caused toxic effects similar to those ofpathogenic LRRK2 (Gehrke et al., 2010) in a Drosophila PDmodel. However, post-mortem brain tissue is not readily acces-sible, and entails RNA quality concerns (Atz et al., 2007). Bloodleukocytes, however, are readily obtained, and the RNA can beobtained at high quality from them. Recently, miRNAs were char-acterized in whole blood of PD patients (Martins et al., 2011) bymicroarrays and quantitative real time PCR (Margis and Rieder,2011). RNA-Seq provides an unbiased, high resolution, accuratemeans for profiling miRNAs (Pritchard et al., 2012) and thusfor investigating the miRNA mediated pathogenesis of complexdiseases such as PD. Purported advantages of small RNA sequenc-ing for this purpose include generation of data unlimited bygenome annotations or probe affinities. Analyses of genome-widesmall RNA transcriptome provide an accurate and comprehensiveapproach of globally characterizing miRNA expression in diseaseunder different conditions. Yet, the global profile of miRNAs wasnot characterized yet by comprehensive RNA high throughputsequencing of PD blood cells.
Alternative splicing (AS) dramatically increases the complexityof the human transcriptome. Recent studies identified possi-ble interactions between miRNAs and spliced targets (Salomoniset al., 2010; Irimia and Blencowe, 2012). Yet, while gene-expression changes have been characterized in PD blood cellsusing conventional microarrays (Scherzer et al., 2007; Soreq et al.,2008), such studies are blinded to alternative isoform regula-tion, which has been associated with at least 95% of the humangenes (Pan et al., 2008). Deep brain stimulation (DBS) treat-ment dramatically improves the debilitating PD motor symptomswhich are the cardinal disease symptoms (Bergman et al., 1990;Kingwell, 2011). Recently, we found disease-related transcriptionchanges in PD leukocytes and demonstrated that DBS neuro-surgery largely reversed the observed transcriptional changes(Soreq et al., 2012b). We have identified that a large number
of predicted miRNA binding sites located in alternative exonregions.
Here, we performed a comparative miRNA, splicing and geneexpression analysis of PD patients’ blood leukocytes pre- andpost-DBS with the electrical stimulus being on and following 1 hof stimulation cessation using high throughput RNA sequenc-ing in conjunction with exon and splice junction microarrays ofthe same cells. Along with these samples, mRNA samples frommatched healthy control volunteers were analysed.
We found significant differences in miRNA expression levels inPD, partially reversed by DBS, which co-occurred with high con-fidence changes in gene isoform expression levels and cell lineagecomposition. Our findings provide new insights for the molecularmechanisms underlying peripheral reactions to neurological andneurodegenerative diseases and opening new avenues for futuredevelopment of both new diagnostic and therapeutic tools. Weprovide these data sets and analyses as a resource for under-standing miRNA expression and splicing in Parkinson’s patient’sleukocytes pre- and post-treatment.
MATERIALS AND METHODSThis study was authorized and approved by the Ethics commit-tee of the human review board (Hadassah University Hospital,Ein-Kerem, approval number 07.09.07-6) in accordance with theDeclaration of Helsinki principles. Following oral agreement allparticipants signed informed consent prior to inclusion in thestudy.
PATIENT RECRUITMENT, DBS NEUROSURGERY AND CLINICALEVALUATIONOverall, seven PD male patients nominated for bilateral STN-DBSneurosurgery and six healthy age-matched male controls healthycontrol volunteers (HC) were recruited to the study. Clinicaldescription appears under (Soreq et al., 2012b). Briefly, volun-teers were assessed for their clinical background and state andfulfilled detailed medical history questionnaires. Patients withother medical conditions were excluded, including depressionand past and current DSM Axis I and II psychological disorders(SM), chronic inflammatory disease, coagulation irregularities,previous malignancies or cardiac events, or any surgical proce-dure up to one year pre-DBS. All patients went through bilateralSTN-DBS electrode implantation (Medtronics, USA) and wereunder dopamine replacement therapy (DRT) both pre- and post-DBS (on significantly reduced dosage post-DBS both on andoff stimulation), the last medication administered at least 5 hpre-sampling. Patients further exhibited similar total white andred blood cell counts pre- and post-DBS. Blood samples werecollected from each patient at three time points: (1) one daypre-DBS upon hospitalization, with medication; (2) post-DBS(range 6–18 weeks), when reaching optimal clinical state as eval-uated by a neurologist and on a lower DRT dose, ON stimulusand (3) OFF stimulus, following 1 h while being OFF electri-cal stimulation (counted from stage 2). The clinical severityof disease symptoms was assessed by a neurologist for UnifiedPD Rating Scale (UPDRS-III) (Fahn and Elton, 1987) section3 (motor section) in the tested stated (pre-DBS, post-DBS onand off stimulation). Controls were recruited among Hadassah
Frontiers in Molecular Neuroscience www.frontiersin.org May 2013 | Volume 6 | Article 10 | 2

Soreq et al. Parkinson leukocyte miRNA-splicing profiles
hospital staff and researchers at the Edmond J. Safra Campus(Jerusalem). Exclusion criteria for the HC volunteers includedsmoking, chronic inflammatory diseases, drug or alcohol use,major depression, previous cardiac events and past year hospi-talizations. The only group of other control volunteers that wasincluded in this study is of healthy control volunteers, as samplesfrom “sham” operated healthy (or patient) volunteers cannot beobtained or authorized by ethics committee. However, in addi-tion to the healthy controls, we tested the leukocyte RNA fromPD patients post-DBS also following 1 h of electrical stimulationcessation, to enable discrimination of the electrical stimulationeffect from the effect of the presence of the stimulator in the brainper-se.
BLOOD SAMPLE COLLECTION AND RNA EXTRACTIONBlood collection was conducted between 10AM–14PM. Collectedvenous blood (9 ml blood using 4.5 ml EDTA (anti-coagulanttubes) was immediately filtered using the LeukoLock fractiona-tion and stabilization kit™ (Ambion, Applied Biosystems, Inc.,Foster City, CA) and incubated in RNALater (Ambion). Stabilizedfilters and serum samples were stored at −80◦C. RNA extractionfollowed the manufacturers’ alternative protocol instructions.Briefly, cells were flushed (TRI-Reagent™, Ambion) into 1-bromo-3-chloropropane-(BCP) containing 15 ml tubes and cen-trifuged. 0.5 and 1.25 volume water and ethanol were addedto the aqueous phase. Samples were filtered through spin car-tridges, stored in pre-heated 150 µl EDTA; RNA was quantifiedand examined on Bioanalyzer 2100 (Agilent, Santa Clara, CA,USA) and frozen in −80◦C.
RNA-Seq SREK LIBRARY PREPARATION AND SEQUENCINGLibraries for next generation sequencing (NGS) were preparedfrom total leukocyte RNA with the manufacturers’ SREK (SmallRNA Expression Kit) protocol (Applied Biosystems, Foster City,CA, USA). A total of 12 libraries were prepared: from RNA ofblood leukocytes from three healthy volunteers and three PDpatients in three states (pre-DBS, post-DBS on stimulation andfollowing 1 h of stimulation cessation). The DNA Libraries weretested using a DNA 1000 Lab Chip on Bioanalyzer 2100. Briefly,the total RNA samples were hybridized with Adaptor Mix A whichis a set of oligonucleotides with a single-stranded degeneratesequence at one end and a defined sequence required for SOLiDsequencing at the other end. The Adaptor Mix A constrainsthe orientation of the RNA in the ligation reaction such thathybridization with it yields template for SOLiD sequencing fromthe 5′ end of the sense strand. After hybridization, the adaptorsare ligated to the small RNA molecules using Ligation EnzymeMix, which is a mixture of an RNA Ligase and other components.Ligation requires an RNA molecule with a 5′-monophosphateand a 3′-hydroxyl end; therefore, most small RNAs can partici-pate in this reaction, and intact mRNA molecules with a 5′ capstructure are excluded. Next, the small RNA population with lig-ated adaptors of each sample was reverse transcribed, to generatecDNA libraries. Treatment with RNase H followed, to digest theRNA from RNA/cDNA duplexes and to reduce the concentra-tion of unligated adaptors and adaptor by-products. The cDNAlibraries were amplified using bar-coded primer sets and 15–18
cycles of PCR. The amplified cDNA libraries were cleaned upand size selected from gel—PCR products ∼105–150 bp wereisolated, corresponding to inserts derived from the small RNApopulation. These contained each 90 base pairs of primers andadapter sequences. The amplified cDNA libraries generated withthe SOLiD Small RNA Expression Kit were thereafter ready forattachment to beads at the emulsion PCR step of the SOLiDsample preparation workflow. The slides were analyzed on aSOLiD system V3.5 (Applied Biosystems). Applied BiosystemsSOLiD sequencer generated 50-base read sequences as.csfastafiles and the corresponding quality control (.qual) and statistic(.stat) files.
MAPPING TO miRBase AND TO HUMAN REFERENCE GENOMEA total of 166,746,207 sequencing reads were obtained. All thereads (50 bp long) were subjected to trimming of the tag endterminal base pairs to remove these 15 bases. The trimmed(35 bases) reads were subjected to further trimming of the P1 startadapter as well as the SOLiD miRNA reverse primer sequencesusing CLC genomics workbench V4.0 [CLC bio, Cambridge, MA(Sakharkar et al., 2004a)] through local Smith–Watermann align-ment. Overall, 50.92% of the reads contained adapter sequenceand/or the SOLiD small RNA reverse primer. The 5′ termi-nal nucleotide was removed as well. This left 71,939,833 reads(average length of 21 bases). The minimum sampling countthreshold was set to 1. The remaining reads obtained from eachpatient’s library were first aligned against the human miRNAgenome (miRBase release 15, which contained 940 Homo sapi-ens sequences). On average, 55% (range 44.9–61.3%) of thesequences of all libraries were mapped (Figure S1) and 50.94%(range 43.8–54.8%) of miRBase genes were detected (Figure S1).Of the mapped reads, on average 42.03% (range 39.6–45.9%) hadperfect match to the aligned genes, 45.16% (range 42.5–55.3%)-one mismatch, 12.6% (range 0–18.6%)-2 mismatches and 0.18%(range 0.1–0.6%)-3 mismatches (Figure S1).
The full count information obtained from the alignmentresults is given under Tables S4 and S5. Through the annota-tion and merge counts, only reads longer than 15 bases wereanalyzed. Match parameters included for mature length vari-ants (IsomiRs)-additional 2 upstream and downstream bases, and2 missing upstream and downstream bases. Alignment settingswere not conducted on the color space. This allowed detection ofmismatches up to the maximal allowed by the software (of 3 mis-matches instead of 2). Annotated samples were grouped by bothprecursor and mature sequence identity.
Mapping to another repository of reference human genomedatabase (Ambion, life technologies) which included 764sequences of snoRNAs, tRNA, SINE/ALU sequences, LINEs andspliceosomal U genes (such as U1) yielded mapping to 293.3(38.37%) filter database sequences on average across libraries.Only 151,136.8 (3.16%) reads of these that were not mapped tomiRBase were mapped against this repository. Of them, 60.88%(range 42.2–68.9%) exhibited perfect match to the referencesequences, 30.94% (range 25.4–41.2%) with 1 mismatch, 6.24(2.1–13.4%)-2 mismatches and 1.94% (0.5–3.3%)-3 mismatches(Figure S1). An average of 486 miRNAs per sample (range:436–515) were detected in the analyzed libraries (Figures S2A–E:
Frontiers in Molecular Neuroscience www.frontiersin.org May 2013 | Volume 6 | Article 10 | 3

Soreq et al. Parkinson leukocyte miRNA-splicing profiles
selected examples, full raw digital count quantification underTables S4 and S5).
DIFFERENTIAL EXPRESSION ANALYSIS OF NEXT GENERATIONSEQUENCING DETECTED miRNAsOverall, a total of 335 mature and 79 mature-star (mature 3′/5′forms) that exhibited count of at least 1 per million readsin at least one sample were analyzed for differential expres-sion between the different experimental conditions. Differentialexpression analysis of the miRNAs was conducted using theBioconductor R package biocLite. The EdgeR (Robinson et al.,2010) and BaySeq (Hardcastle and Kelly, 2010) components wereused for differential expression. 251 miRNAs were detected inall the samples, but the statistical methodologies applied allowedto analyze the detected miRNAs that presented count of at least1 per million reads in at least one sample using adjacent sta-tistical approach, to avoid false negative results. First, a com-bined data matrix of all the miRNAs detected in any of thesamples was created. Then, the detected miRNAs were filteredfor low count values such that only these with count ≥ 1 inat least 3 of the 12 libraries remained and 351 miRNAs wereanalyzed.
AFFYMETRIX HJAY SPLICE JUNCTION MICROARRAY HYBRIDIZATIONSAND DATA PRE-PROCESSINGThe Affymetrix human junction arrays (HJAY) were obtainedthrough collaboration with the EURASNET consortium andwere used to assess genome-wide changes in exon and junctionexpression. Briefly, these microarrays interrogate 335,663 humantranscripts from ∼25,000 Ensembl genes, 260,488 junctions and360,569 exons. Using the program AltAnalyze, probe set levelRMA [17] expression and DAGB p-values were obtained by call-ing Affymetrix Power Tools (APT) [17]. From this probe set-leveldata, sample gene expression values were calculated from themean intensity of constitutive annotated exon and junction probesets in AltAnalyze.
HJAY MICROARRAY PROFILING, DATABASE CONSTRUCTION ANDANALYSISHJAY profiling of blood leukocytes was conducted usingexon array pre-prepared hybridization samples and Gene-ChipWhole Transcript Sense target Labeling assay kit (Affymetrix),as per manufacturers’ instructions. The high-density HJAYs(Affymetrix) were washed and stained with streptavidin-phycoerythrin and signal amplification was done using abiotinylated anti-streptavidin antibody. The microarrays werescanned on an Affymetrix GeneChip Scanner 3000 7G scan-ner, according to the Affymetrix GeneChip Whole TranscriptSense Target Labeling Assay protocol for the GeneChip Exon1.0 ST array (Lapuk et al., 2010). A total of 12 microarray sam-ples were obtained. AltAnalyze probe set-to-exon associationswere obtained by matching the annotated exon sequences (twoexons for each junction probe sets) provided by Affymetrixto the reference Ensembl genome (version 62) for Affymetrixannotated gene symbols. In cases where probe sets alignedto an intron, a novel exon annotation indicating the rela-tive intron position was assigned. Alternative exons, junctions,
reciprocal probe sets and event-annotations (e.g., alternative cas-sette exon, alternative promoter) were obtained by comparingthe exon-structure of mRNAs from Ensembl, the UCSC genomedatabase and novel junctions assayed by the HJAY array, aspreviously described (Salomonis et al., 2010). Linear regres-sion analysis was employed by an updated version of AltAnalyzeto detect AS with a fold change of 2. P < 0.05 were con-sidered significant. Additional methods details are provided athttp://www.altanalyze.org/help_main.htm.
FUNCTIONAL PREDICTION ANALYSIS OF THE HJAY DETECTED SPLICEDTRANSCRIPTSEach detected alternative event or alternative promoter selec-tion (e.g., cassette exon, alternative 3′ end, alternative 5′ end,intron retention, bleeding exon, alternative C-terminal exon) oralternative promoter (alternative N-terminal exon or alternativepromoter) of a pair of reciprocal junctions detected by the linearregression analysis was examined for putative protein domains ormotifs and for miRNA binding sites. Alternative event annota-tions were obtained from both from Ensembl and UCSC GenomeBrowser databases as previously described for AltAnalyze version1.0 (Salomonis et al., 2009).
FUNCTIONAL ENRICHMENT ANALYSIS OF THE HJAY DETECTEDSPLICED TRANSCRIPTSFunctional post-hoc analysis of the alternative isoforms detectedby linear regression analysis conducted for each comparison(e.g., patients pre-treatment as compared with controls) usingGene Ontology (GO) Elite (Zambon et al., 2012) was calleddirectly from the adopted AltAnalyze version using Ensembldatabase. Genes cut-off parameters included minimal 2-foldchange; and t-test raw P-value < 0.05 with minimum number of3 changed genes defined. GO terms (Ashburner et al., 2000) andWikiPathways (Pico et al., 2008) were ranked by a combinationof z-score (cut-off: 1.96) and gene number. Over-representationanalysis (ORA) was conducted with 2000 permutations.
BRAIN TRANSCRIPTOME MICROARRAY ANALYSISRaw expression data was obtained from the GEO dataset GSE8397[citation: (Moran et al., 2006)], where Affymetrix HG_U133 arraysets were used to determine the whole genome transcription pro-file of clinically documented and neuropathologically confirmedcases of sporadic Parkinson’s disease as well as controls (andoverall 47 samples). The .CEL files were normalized by sketchnormalization and the expression of the 22,283 interrogatedprobe-sets (including 68 microarray internal control prone-sets)was quantified from 506,944 probes using the Probe LogarithmicIntensity Error estimation (PLIER) method (Affymetrix)while considering mismatch probes (Irizarry et al., 2003)(PLIER-MM).
EXON MICROARRAYS HYBRIDIZATION AND INITIAL PRE-PROCESSING1 µg of total RNA was labeled using the Affymetrix exon arrayusing whole transcripts sense targeting labeling assay according tothe manufacturers’ instructions; cDNA samples were hybridizedto GeneChip® Exon_1.0_ST_Array (Affymetrix, Santa Clara, CA,USA) microarrays, and results were scanned (GeneChip scan-ner 30007G, 27 CEL files). Hybridizations were conducted in
Frontiers in Molecular Neuroscience www.frontiersin.org May 2013 | Volume 6 | Article 10 | 4

Soreq et al. Parkinson leukocyte miRNA-splicing profiles
7 batches. To prevent possible batch effect, each microarrayhybridization included samples of patients from all experimentalstages (pre, post-DBS on stimulation and post-DBS off stim-ulation) by random sampling. Quality assurance, normaliza-tion (quantile) and probe set summation (DABG iter-PLIER)were conducted using expression console (EC) 1.0 (Affymetrix,Santa Clara, CA). Only core level probe sets (n = 284.241) wereincluded to summarize probe set level expression for 22,011 exonarray transcript clusters (iter-PLIER, EC). Filtering out transcriptclusters with no annotated gene symbols maintained 17,658 of22,011 transcripts.
CELLULAR LINEAGE ANALYSIS OF THE EXON MICROARRAYS DATATo identify cellular composition, the new module of AltAnalyze,LineageProfiler, was used. To derive correlation scores to dif-ferent cell types and tissues (lineages), a database reflecting themost specifically-expressed genes or exons present in each par-ticular lineage, relative to all lineages types examined (rangingfrom 50 to 150), was created. The resulting database was a smallsubset of the original, containing the most informative markers.The exon microarrays RNA-profile expression data of patients inthree states (pre-DBS, post-DBS on and following 1 h of electri-cal stimulation cessation-off stimulus) and HC volunteers wascompared to the profile of each lineage only for these markersto derive correlation coefficients and resulting Z scores based onthe distribution of values for each user RNA-profile. Z scoresto each lineage were calculated from the distribution of Pearsoncorrelation coefficients, specifically for each sample or conditionanalyzed. Lineage differences between conditions were specificallyevaluated via the AltAnalyze GO-Elite module using the databaseof lineage specific markers for examined differentially expressedgenes. The results were visualized as association scores at the levelof hierarchically clustered cell types and curated lineage networks.
miRNA: TARGET PREDICTIONSPrediction of target gene sites for the miRNAs that exhibiteddifferential expression in PD patients compared to control vol-unteers was conducted using the miRWalk repository whichcombines prediction data from 8 different prediction programsand adds inspection of all the gene regions including 5′ UTRand coding regions (Dweep et al., 2011). The analysis was con-ducted through a construction of a local MySQL database basedon these predictions. For each miRNA that was detected as differ-entially expressed in the deep transcriptome of patients comparedto control volunteers and post compared to pre-DBS, all thepredicted targets were searched for and were filtered to thesethat were detected as alternatively spliced in the human junctionmicroarrays for the corresponding tested condition. The final net-work of miRNA-spliced targets was analyzed and created throughCytoscape (Smoot et al., 2011).
ACCESSION CODESAll the data discussed in this publication have been deposited inNCBI’s Gene Expression Omnibus (Edgar et al., 2002):
(1) High throughput SOLiD small RNA sequencing:http://www.ncbi.nlm.nih.gov/geo/query/acc.cgi?token=btahlkcwcuyyyvy&acc=GSE40915
(2) Splice junction microarrays: http://www.ncbi.nlm.nih.gov/geo/query/acc.cgi?token=hhmvrgcsyyciexi&acc=GSE37591
(3) Exon microarrays: http://www.ncbi.nlm.nih.gov/geo/query/acc.cgi?acc=GSE23676
RESULTSDIFFERENTIAL EXPRESSION OF miRNAs IN PD COMPARED TOHEALTHY VOLUNTEERSTo delineate the expression of miRNAs in PD peripheral bloodleukocytes, we employed SOLiD high throughput sequenc-ing on small RNAs from peripheral blood leukocytes of PDpatients followed by alignment to miRBase. The samples wereobtained from three PD patients prior to DBS treatment, andupon symptoms stabilization following DBS neurosurgery, bothon stimulation and following 1 hour off-electrical stimula-tion and as compared with matched healthy volunteers (clin-ical information under Table S1). The study design and over-all analysis flow are given under Figure 1. The full mappinginformation and reads count are given under Tables S2 andS4. Alignment to miRNABase detected 44.9–61.3% annotatedreads (an average detection of 54.67% reads of each library)constituting 43.8–54.8% of miRBase (Figure S1 and Table S2).For comparison, we also aligned all the sequenced librariesagainst a reference database which contained 764 human filtersequences of other non-coding RNAs including snoRNAs, scR-NAs, 5S_RNAs, tRNAs, SINE and ALU repeats, LINEs, spliceo-somal U sequences (number 1,2,3,4,5,6,8,13,14, and 17) andsnRNAs. These alignments yielded an average of 8.9% alignedreads of the total number of reads (with a minimum of 0.2%and a maximum of 3.16%) (Table S3). The raw read countsof all the detected miRNA and miRNA∗ (also termed 3′/5′)mature forms (given under Tables S4, S5 and Figures S2A–E)were filtered to include only those presenting at least 1 readsper million base pairs in at least three samples. Thus, 254miRNAs, 2 recent miRNA-candidates which are highly likelytRNA fragments and 79 passenger strand miRNAs 3′/5′ forms(miRNA∗) were analyzed (altogether 334). At the technical level,count data was discrete and skewed and was hence not wellapproximated by a normal distribution. To account for this,we applied a test based on the negative binomial distribution(a generalization of the Poisson model that recaptures biolog-ical variance correctly) (Robinson and Smyth, 2008). This testcan effectively reflect the sample properties and detect differ-ential expression. A linear modeling approach was applied forcalculating fold changes and estimating standard errors, andwas followed by an empirical Bayes smoothing (which pro-vides more stable results for small sample sized data sets) tomoderate the standard errors [16]. Also, sequenced librariesdiffer in the number of expressed transcripts. This fact couldskew the differential expression calls due to over- and under-sampling (Robinson and Oshlack, 2010). To overcome thisdifficulty, we estimated tag-wise common dispersion to com-pute normalization factors for each library while accountingfor library size. The common dispersion values enabled esti-mation of the bias using an empirical approach and were builtinto the library size. The computed concentrations were fur-ther subjected to an exact test to detect the top differentially
Frontiers in Molecular Neuroscience www.frontiersin.org May 2013 | Volume 6 | Article 10 | 5

Soreq et al. Parkinson leukocyte miRNA-splicing profiles
FIGURE 1 | Experimental design and analysis flow. (A) RNA wasprepared from filtered blood leukocytes isolated from whole bloodsamples of PD patients 1 day prior to DBS (PD), and post-DBS uponclinical stabilization, both on (DBS-ON) and following 1 h off electricalstimulation (DBS-OFF). Age- and gender-matched male healthy volunteersserved as a control group (HC). Small RNA libraries were prepared usinga Small RNA Expression Kit (SREK) and constructed according to themanufacturer’s instructions. cDNA of patients pre- and post-DBS onstimulation and controls was also applied to Affymetrix human exon andjunction prototype microarrays (HJAY). (B) The junction array datasetswere processed in AltAnalyze using a previously described regression
approach (Sugnet et al., 2006) on junction pairs, followed by functionalenrichment analysis. Protein domains and enriched motifs and miRNAbinding sites were also identified. (C) Reads obtained by high throughputsequencing were trimmed from adapter and end terminal bases andwere aligned to miRBase and the human filter reference sequencesdatabase. The counts were standardized for common tag-wise dispersionand tested for differential expression using both dispersion estimationand Bayesian learning methods. (D) Predictions of miRNA: targetinteractions with the spliced transcripts were conducted by using themiRWalk algorithm which combines 8 established databases withpredictions beyond the 3′ untranslated region (3′-UTR).
Frontiers in Molecular Neuroscience www.frontiersin.org May 2013 | Volume 6 | Article 10 | 6
Soreq et al. Parkinson leukocyte miRNA-splicing profiles
expressed genes. This involved B statistic ranking (logarithmof the posterior odds that a gene is differentially expressed(Lonnstedt, 2002) through the EdgeR package (Robinson et al.,2010). Thus, the statistical approach applied here took intoaccount both technical and biological variability of the digitalcount data.
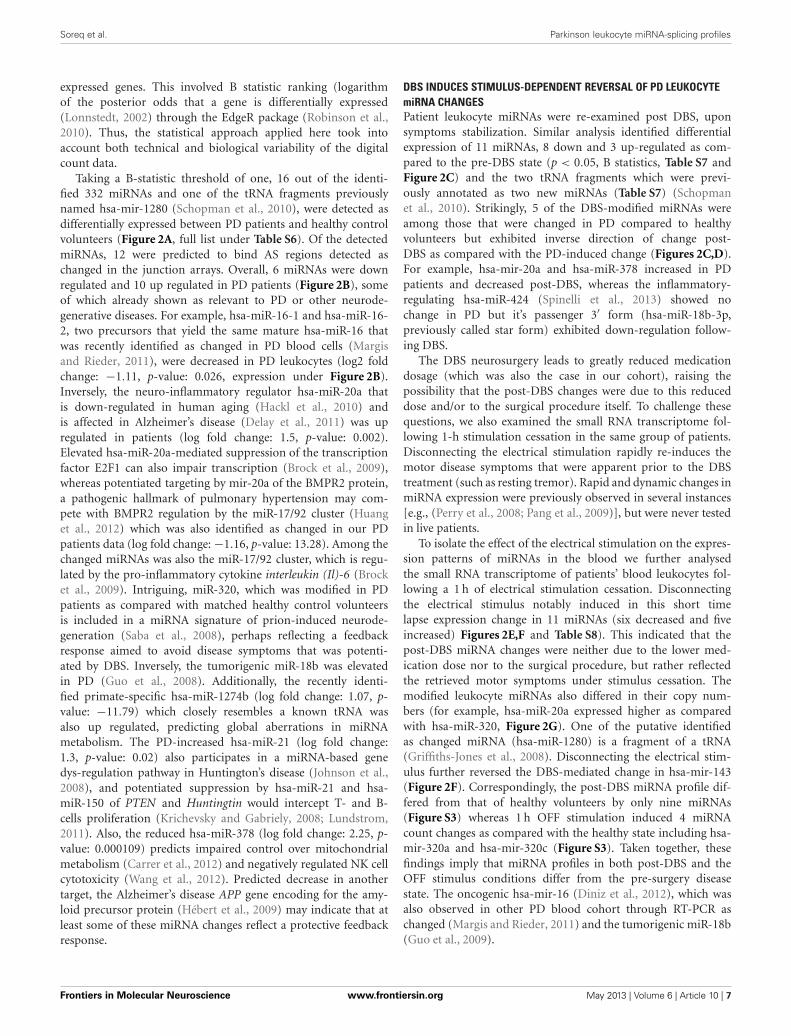
Taking a B-statistic threshold of one, 16 out of the identi-fied 332 miRNAs and one of the tRNA fragments previouslynamed hsa-mir-1280 (Schopman et al., 2010), were detected asdifferentially expressed between PD patients and healthy controlvolunteers (Figure 2A, full list under Table S6). Of the detectedmiRNAs, 12 were predicted to bind AS regions detected aschanged in the junction arrays. Overall, 6 miRNAs were downregulated and 10 up regulated in PD patients (Figure 2B), someof which already shown as relevant to PD or other neurode-generative diseases. For example, hsa-miR-16-1 and hsa-miR-16-2, two precursors that yield the same mature hsa-miR-16 thatwas recently identified as changed in PD blood cells (Margisand Rieder, 2011), were decreased in PD leukocytes (log2 foldchange: −1.11, p-value: 0.026, expression under Figure 2B).Inversely, the neuro-inflammatory regulator hsa-miR-20a thatis down-regulated in human aging (Hackl et al., 2010) andis affected in Alzheimer’s disease (Delay et al., 2011) was upregulated in patients (log fold change: 1.5, p-value: 0.002).Elevated hsa-miR-20a-mediated suppression of the transcriptionfactor E2F1 can also impair transcription (Brock et al., 2009),whereas potentiated targeting by mir-20a of the BMPR2 protein,a pathogenic hallmark of pulmonary hypertension may com-pete with BMPR2 regulation by the miR-17/92 cluster (Huanget al., 2012) which was also identified as changed in our PDpatients data (log fold change: −1.16, p-value: 13.28). Among thechanged miRNAs was also the miR-17/92 cluster, which is regu-lated by the pro-inflammatory cytokine interleukin (Il)-6 (Brocket al., 2009). Intriguing, miR-320, which was modified in PDpatients as compared with matched healthy control volunteersis included in a miRNA signature of prion-induced neurode-generation (Saba et al., 2008), perhaps reflecting a feedbackresponse aimed to avoid disease symptoms that was potenti-ated by DBS. Inversely, the tumorigenic miR-18b was elevatedin PD (Guo et al., 2008). Additionally, the recently identi-fied primate-specific hsa-miR-1274b (log fold change: 1.07, p-value: −11.79) which closely resembles a known tRNA wasalso up regulated, predicting global aberrations in miRNAmetabolism. The PD-increased hsa-miR-21 (log fold change:1.3, p-value: 0.02) also participates in a miRNA-based genedys-regulation pathway in Huntington’s disease (Johnson et al.,2008), and potentiated suppression by hsa-miR-21 and hsa-miR-150 of PTEN and Huntingtin would intercept T- and B-cells proliferation (Krichevsky and Gabriely, 2008; Lundstrom,2011). Also, the reduced hsa-miR-378 (log fold change: 2.25, p-value: 0.000109) predicts impaired control over mitochondrialmetabolism (Carrer et al., 2012) and negatively regulated NK cellcytotoxicity (Wang et al., 2012). Predicted decrease in anothertarget, the Alzheimer’s disease APP gene encoding for the amy-loid precursor protein (Hébert et al., 2009) may indicate that atleast some of these miRNA changes reflect a protective feedbackresponse.
DBS INDUCES STIMULUS-DEPENDENT REVERSAL OF PD LEUKOCYTEmiRNA CHANGESPatient leukocyte miRNAs were re-examined post DBS, uponsymptoms stabilization. Similar analysis identified differentialexpression of 11 miRNAs, 8 down and 3 up-regulated as com-pared to the pre-DBS state (p < 0.05, B statistics, Table S7 andFigure 2C) and the two tRNA fragments which were previ-ously annotated as two new miRNAs (Table S7) (Schopmanet al., 2010). Strikingly, 5 of the DBS-modified miRNAs wereamong those that were changed in PD compared to healthyvolunteers but exhibited inverse direction of change post-DBS as compared with the PD-induced change (Figures 2C,D).For example, hsa-mir-20a and hsa-miR-378 increased in PDpatients and decreased post-DBS, whereas the inflammatory-regulating hsa-miR-424 (Spinelli et al., 2013) showed nochange in PD but it’s passenger 3′ form (hsa-miR-18b-3p,previously called star form) exhibited down-regulation follow-ing DBS.
The DBS neurosurgery leads to greatly reduced medicationdosage (which was also the case in our cohort), raising thepossibility that the post-DBS changes were due to this reduceddose and/or to the surgical procedure itself. To challenge thesequestions, we also examined the small RNA transcriptome fol-lowing 1-h stimulation cessation in the same group of patients.Disconnecting the electrical stimulation rapidly re-induces themotor disease symptoms that were apparent prior to the DBStreatment (such as resting tremor). Rapid and dynamic changes inmiRNA expression were previously observed in several instances[e.g., (Perry et al., 2008; Pang et al., 2009)], but were never testedin live patients.
To isolate the effect of the electrical stimulation on the expres-sion patterns of miRNAs in the blood we further analysedthe small RNA transcriptome of patients’ blood leukocytes fol-lowing a 1 h of electrical stimulation cessation. Disconnectingthe electrical stimulus notably induced in this short timelapse expression change in 11 miRNAs (six decreased and fiveincreased) Figures 2E,F and Table S8). This indicated that thepost-DBS miRNA changes were neither due to the lower med-ication dose nor to the surgical procedure, but rather reflectedthe retrieved motor symptoms under stimulus cessation. Themodified leukocyte miRNAs also differed in their copy num-bers (for example, hsa-miR-20a expressed higher as comparedwith hsa-miR-320, Figure 2G). One of the putative identifiedas changed miRNA (hsa-miR-1280) is a fragment of a tRNA(Griffiths-Jones et al., 2008). Disconnecting the electrical stim-ulus further reversed the DBS-mediated change in hsa-mir-143(Figure 2F). Correspondingly, the post-DBS miRNA profile dif-fered from that of healthy volunteers by only nine miRNAs(Figure S3) whereas 1 h OFF stimulation induced 4 miRNAcount changes as compared with the healthy state including hsa-mir-320a and hsa-mir-320c (Figure S3). Taken together, thesefindings imply that miRNA profiles in both post-DBS and theOFF stimulus conditions differ from the pre-surgery diseasestate. The oncogenic hsa-mir-16 (Diniz et al., 2012), which wasalso observed in other PD blood cohort through RT-PCR aschanged (Margis and Rieder, 2011) and the tumorigenic miR-18b(Guo et al., 2009).
Frontiers in Molecular Neuroscience www.frontiersin.org May 2013 | Volume 6 | Article 10 | 7

Soreq et al. Parkinson leukocyte miRNA-splicing profiles
FIGURE 2 | Changed miRNA profiles in PD patients pre-and post-DBS
and under stimulation cessation. (A,C,E). Log concentrations (X -axis) andlog 2 fold change (FC) (Y -axis) of miRNAs detected as differentially expressedin (A) PD patient leukocytes pre- DBS as compared with healthy volunteers,
(C) post-DBS on stimulation as compared to pre-DBS and (E) following 1 h offelectrical stimulation. Red color denotes miRNAs that were detected asexhibiting a statistically significant change in each condition. The yellow
(Continued)
Frontiers in Molecular Neuroscience www.frontiersin.org May 2013 | Volume 6 | Article 10 | 8
Soreq et al. Parkinson leukocyte miRNA-splicing profiles
FIGURE 2 | Continued
dots represent all miRNAs that exhibited close to zero expression in oneor both conditions (thus they cannot be plotted on a log scale). Thesecondition-unique points in the plot are artificially represented by spreadingthem vertically as a “smear” on the left. (B,D,F) The fold change andp-value of miRNAs exhibiting down- or up-regulation in patients’ pre-DBScompared to (B) healthy volunteers, (D) post-DBS on stimulation ascompared to pre-DBS and (E) post-DBS off stimulation compared to
on-stimulation (F). The length of the bar denotes the statisticalsignificance and the direction of change is denoted by positive ornegative direction of the bar. Y -axis: -ln (p-value)*log fold change. MarkedmiRNA names: 5 (∼30%) of the miRNAs that were detected as changedin PD patients were also detected as changed post-DBS and exhibitedreverse direction of change compared to the disease state. (G) Thenon-normalized sequence read counts for selected changed miRNAs inthe four tested states.
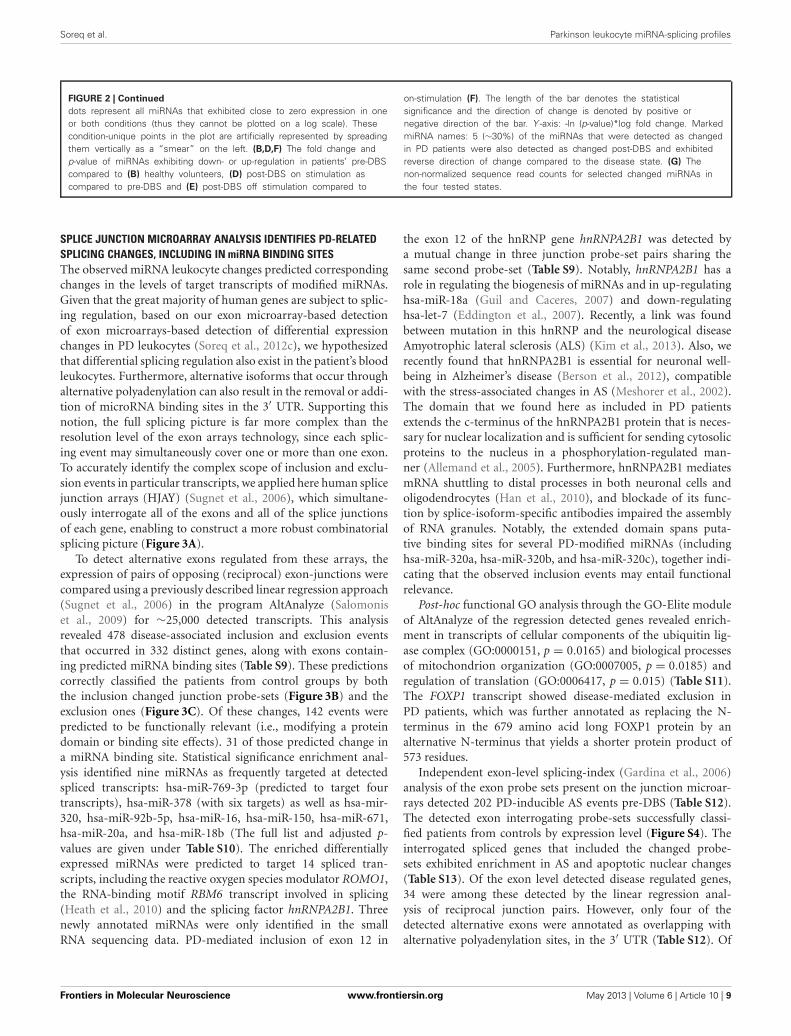
SPLICE JUNCTION MICROARRAY ANALYSIS IDENTIFIES PD-RELATEDSPLICING CHANGES, INCLUDING IN miRNA BINDING SITESThe observed miRNA leukocyte changes predicted correspondingchanges in the levels of target transcripts of modified miRNAs.Given that the great majority of human genes are subject to splic-ing regulation, based on our exon microarray-based detectionof exon microarrays-based detection of differential expressionchanges in PD leukocytes (Soreq et al., 2012c), we hypothesizedthat differential splicing regulation also exist in the patient’s bloodleukocytes. Furthermore, alternative isoforms that occur throughalternative polyadenylation can also result in the removal or addi-tion of microRNA binding sites in the 3′ UTR. Supporting thisnotion, the full splicing picture is far more complex than theresolution level of the exon arrays technology, since each splic-ing event may simultaneously cover one or more than one exon.To accurately identify the complex scope of inclusion and exclu-sion events in particular transcripts, we applied here human splicejunction arrays (HJAY) (Sugnet et al., 2006), which simultane-ously interrogate all of the exons and all of the splice junctionsof each gene, enabling to construct a more robust combinatorialsplicing picture (Figure 3A).
To detect alternative exons regulated from these arrays, theexpression of pairs of opposing (reciprocal) exon-junctions werecompared using a previously described linear regression approach(Sugnet et al., 2006) in the program AltAnalyze (Salomoniset al., 2009) for ∼25,000 detected transcripts. This analysisrevealed 478 disease-associated inclusion and exclusion eventsthat occurred in 332 distinct genes, along with exons contain-ing predicted miRNA binding sites (Table S9). These predictionscorrectly classified the patients from control groups by boththe inclusion changed junction probe-sets (Figure 3B) and theexclusion ones (Figure 3C). Of these changes, 142 events werepredicted to be functionally relevant (i.e., modifying a proteindomain or binding site effects). 31 of those predicted change ina miRNA binding site. Statistical significance enrichment anal-ysis identified nine miRNAs as frequently targeted at detectedspliced transcripts: hsa-miR-769-3p (predicted to target fourtranscripts), hsa-miR-378 (with six targets) as well as hsa-mir-320, hsa-miR-92b-5p, hsa-miR-16, hsa-miR-150, hsa-miR-671,hsa-miR-20a, and hsa-miR-18b (The full list and adjusted p-values are given under Table S10). The enriched differentiallyexpressed miRNAs were predicted to target 14 spliced tran-scripts, including the reactive oxygen species modulator ROMO1,the RNA-binding motif RBM6 transcript involved in splicing(Heath et al., 2010) and the splicing factor hnRNPA2B1. Threenewly annotated miRNAs were only identified in the smallRNA sequencing data. PD-mediated inclusion of exon 12 in
the exon 12 of the hnRNP gene hnRNPA2B1 was detected bya mutual change in three junction probe-set pairs sharing thesame second probe-set (Table S9). Notably, hnRNPA2B1 has arole in regulating the biogenesis of miRNAs and in up-regulatinghsa-miR-18a (Guil and Caceres, 2007) and down-regulatinghsa-let-7 (Eddington et al., 2007). Recently, a link was foundbetween mutation in this hnRNP and the neurological diseaseAmyotrophic lateral sclerosis (ALS) (Kim et al., 2013). Also, werecently found that hnRNPA2B1 is essential for neuronal well-being in Alzheimer’s disease (Berson et al., 2012), compatiblewith the stress-associated changes in AS (Meshorer et al., 2002).The domain that we found here as included in PD patientsextends the c-terminus of the hnRNPA2B1 protein that is neces-sary for nuclear localization and is sufficient for sending cytosolicproteins to the nucleus in a phosphorylation-regulated man-ner (Allemand et al., 2005). Furthermore, hnRNPA2B1 mediatesmRNA shuttling to distal processes in both neuronal cells andoligodendrocytes (Han et al., 2010), and blockade of its func-tion by splice-isoform-specific antibodies impaired the assemblyof RNA granules. Notably, the extended domain spans puta-tive binding sites for several PD-modified miRNAs (includinghsa-miR-320a, hsa-miR-320b, and hsa-miR-320c), together indi-cating that the observed inclusion events may entail functionalrelevance.
Post-hoc functional GO analysis through the GO-Elite moduleof AltAnalyze of the regression detected genes revealed enrich-ment in transcripts of cellular components of the ubiquitin lig-ase complex (GO:0000151, p = 0.0165) and biological processesof mitochondrion organization (GO:0007005, p = 0.0185) andregulation of translation (GO:0006417, p = 0.015) (Table S11).The FOXP1 transcript showed disease-mediated exclusion inPD patients, which was further annotated as replacing the N-terminus in the 679 amino acid long FOXP1 protein by analternative N-terminus that yields a shorter protein product of573 residues.
Independent exon-level splicing-index (Gardina et al., 2006)analysis of the exon probe sets present on the junction microar-rays detected 202 PD-inducible AS events pre-DBS (Table S12).The detected exon interrogating probe-sets successfully classi-fied patients from controls by expression level (Figure S4). Theinterrogated spliced genes that included the changed probe-sets exhibited enrichment in AS and apoptotic nuclear changes(Table S13). Of the exon level detected disease regulated genes,34 were among these detected by the linear regression anal-ysis of reciprocal junction pairs. However, only four of thedetected alternative exons were annotated as overlapping withalternative polyadenylation sites, in the 3′ UTR (Table S12). Of
Frontiers in Molecular Neuroscience www.frontiersin.org May 2013 | Volume 6 | Article 10 | 9

Soreq et al. Parkinson leukocyte miRNA-splicing profiles
FIGURE 3 | Alternatively spliced exon-junction pairs classify PD and
post-DBS samples correctly. (A) A schematic illustration of theinterrogated gene regions and possible combinations of inclusion andexclusion of junction and exon probe-sets. Dashed lines: possibleinter-exonic Probe Selection Region (PSR) combinations with exclusion ofjunction probe-sets. A splice change is defined where bi-directionalchanges occur in the inclusion and the exclusion probe-sets (oralternatively, in a PSR and exclusion probe-sets) concurrently between
two tested states. (B) The global expression of inclusion junction arrayprobe sets that were detected as changed classified patients fromhealthy volunteers successfully. (C) Classification by the exclusion junctionprobe-sets. (D) Classification following DBS classified post-DBS frompre-treatment state by inclusion detected probe-sets. (E) Internal exonclassification of the post-DBS from pre-DBS states by PSRs. (F)
Classification by the DBS-modified exclusion junction probe-sets. Distancemethod for all the clusterograms: city block.
the 202 identified events, 127 had functional predictions suchas alternative terminals or non-sense-mediated decay regions(Table S12). Of these, 36 (∼30%) were functionally predicted asmiRNA binding sites (Table S14). Enrichment analysis detected6 of the DBS-modified miRNAs as modified (having adjusted p-value < 0.05): hsa-miR-320 (a, b, and c) as predicted to bind4 spliced transcripts including hnRNPA2B1, hsa-miR-378 (pre-dicted to bind 6 spliced transcripts), hsa-miR-92b (predicted tobind 4 spliced transcripts), hsa-mir-150, hsa-miR-20a, and hsa-miR-18b (where hsa-miR-18b-3′ changed). Overall, the disease-modified miRNAs were predicted to target overall 11 splicedtarget transcripts, including ROMO1 and COL6A2 that wereeach predicted as targets of four different modified miRNAs(Table S14).
SPLICE JUNCTION MICROARRAYS IDENTIFY SPLICE ISOFORMCHANGES FOLLOWING DBS INCLUDING IN miRNA PREDICTEDBINDING SITESTo identify splicing changes induced by DBS, we compared thesplice junctions of patients post-DBS to these of pre-DBS state.Linear regression analysis was conducted through AltAnalyzesoftware package (Salomonis et al., 2010) which was adopted forthe human junction arrays. The analysis demonstrated a more
limited AS induction of 155 inclusion and exclusion events in 117genes (Table S15). Of these, 140 entailed functional predictions,109 changing protein domain(s) and 31 modifying miRNA bind-ing sites (Table S15). For ∼1/3rd of the detected splicing events,an additional internal exon probe set reproduced the junction-level results (45 out of 155), indicating higher confidence exonexpression changes. Each of these measurement types (inclusionjunction, exclusion junction, or inclusion exon) properly segre-gated the post-DBS samples from pre-DBS ones: the inclusionjunction probe-sets (Figure 3D), the exon probe-sets (Figure 3E)and most distinctly, the exclusion probe-sets (Figure 3F), whichshowed an inverse pattern of change to that observed for PD,completely segregating the post-DBS samples from pre-DBS ones.The linear regression detected genes were enriched in the molec-ular processes of RNA import into nucleus and MAPK phos-phatase export from nucleus as well as in ubiquitin homeostasis(Table S16).
DBS induced potentiated reduction in the junction pair mea-suring exclusion of the PD-included region of hnRNPA2B1, how-ever, with two additionally decreased internal exons. Thus, PDhnRNPA2B1 transcripts showed lower expression of the inter-nal exon probe-set as compared with control volunteers, andpost-DBS state caused a yet lower level of this internal region;
Frontiers in Molecular Neuroscience www.frontiersin.org May 2013 | Volume 6 | Article 10 | 10
Soreq et al. Parkinson leukocyte miRNA-splicing profiles
and the opposite trend was found in the corresponding junctionprobes, reinforcing the conclusion that an exclusion event hadoccurred.
Exon level splicing-index analysis of PD patients post-compared to pre-DBS detected 131 AS events in 117 genes(Table S17), in 20 of them junctions were also detected as changedthrough the linear regression analysis of patients post- comparedto pre-DBS. The detected exon-interrogating probe-sets suc-cessfully classified post- from pre-DBS samples (Figure S5).Intriguingly, 89 of the detected exons had functional transcriptstructure predictions. Two of these were annotated in Poly(A)sites (Table S17), and one of these predictions occured in theToll-like receptor (TLR)3, a pro-inflammatory cytokine mediator(Butt et al., 2012). The NCBI web-based functional annota-tion tool DAVID (Database for Annotation, Visualization andIntegrated Discovery) was used to investigate functional associ-ations of splicing changes seen in the patients’ blood leukocytesfollowing DBS. Functional analysis using the DAVID EASE tool(Hosack et al., 2003) revealed that the DBS modified genes werefunctionally enriched in response to metal ion, AS, apoptosis,immune response and mitochondrion organization (Table S18).Enrichment analysis for miRNA binding sited in the detectedgenes detected 3 of the DBS-modified miRNAs: hsa-miR-20, hsa-mir-18, and hsa-miR-143 as highly predicted to bind AS targetsdetected by the exon level analysis (Table S19).
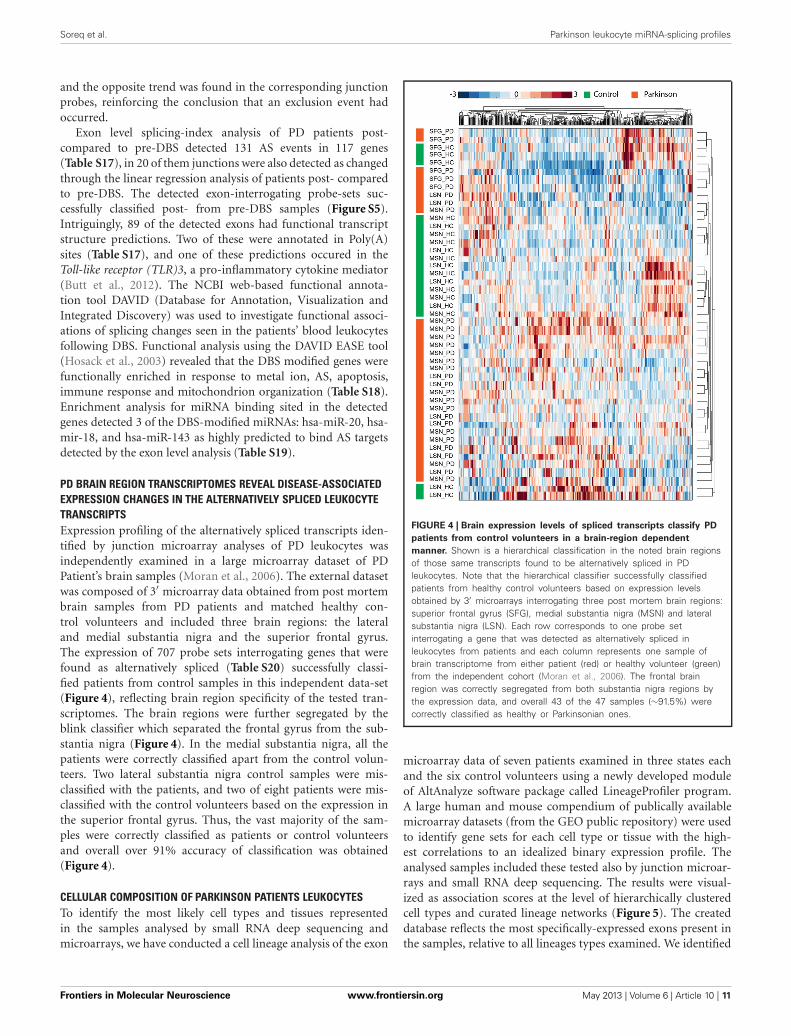
PD BRAIN REGION TRANSCRIPTOMES REVEAL DISEASE-ASSOCIATEDEXPRESSION CHANGES IN THE ALTERNATIVELY SPLICED LEUKOCYTETRANSCRIPTSExpression profiling of the alternatively spliced transcripts iden-tified by junction microarray analyses of PD leukocytes wasindependently examined in a large microarray dataset of PDPatient’s brain samples (Moran et al., 2006). The external datasetwas composed of 3′ microarray data obtained from post mortembrain samples from PD patients and matched healthy con-trol volunteers and included three brain regions: the lateraland medial substantia nigra and the superior frontal gyrus.The expression of 707 probe sets interrogating genes that werefound as alternatively spliced (Table S20) successfully classi-fied patients from control samples in this independent data-set(Figure 4), reflecting brain region specificity of the tested tran-scriptomes. The brain regions were further segregated by theblink classifier which separated the frontal gyrus from the sub-stantia nigra (Figure 4). In the medial substantia nigra, all thepatients were correctly classified apart from the control volun-teers. Two lateral substantia nigra control samples were mis-classified with the patients, and two of eight patients were mis-classified with the control volunteers based on the expression inthe superior frontal gyrus. Thus, the vast majority of the sam-ples were correctly classified as patients or control volunteersand overall over 91% accuracy of classification was obtained(Figure 4).
CELLULAR COMPOSITION OF PARKINSON PATIENTS LEUKOCYTESTo identify the most likely cell types and tissues representedin the samples analysed by small RNA deep sequencing andmicroarrays, we have conducted a cell lineage analysis of the exon
FIGURE 4 | Brain expression levels of spliced transcripts classify PD
patients from control volunteers in a brain-region dependent
manner. Shown is a hierarchical classification in the noted brain regionsof those same transcripts found to be alternatively spliced in PDleukocytes. Note that the hierarchical classifier successfully classifiedpatients from healthy control volunteers based on expression levelsobtained by 3′ microarrays interrogating three post mortem brain regions:superior frontal gyrus (SFG), medial substantia nigra (MSN) and lateralsubstantia nigra (LSN). Each row corresponds to one probe setinterrogating a gene that was detected as alternatively spliced inleukocytes from patients and each column represents one sample ofbrain transcriptome from either patient (red) or healthy volunteer (green)from the independent cohort (Moran et al., 2006). The frontal brainregion was correctly segregated from both substantia nigra regions bythe expression data, and overall 43 of the 47 samples (∼91.5%) werecorrectly classified as healthy or Parkinsonian ones.
microarray data of seven patients examined in three states eachand the six control volunteers using a newly developed moduleof AltAnalyze software package called LineageProfiler program.A large human and mouse compendium of publically availablemicroarray datasets (from the GEO public repository) were usedto identify gene sets for each cell type or tissue with the high-est correlations to an idealized binary expression profile. Theanalysed samples included these tested also by junction microar-rays and small RNA deep sequencing. The results were visual-ized as association scores at the level of hierarchically clusteredcell types and curated lineage networks (Figure 5). The createddatabase reflects the most specifically-expressed exons present inthe samples, relative to all lineages types examined. We identified
Frontiers in Molecular Neuroscience www.frontiersin.org May 2013 | Volume 6 | Article 10 | 11

Soreq et al. Parkinson leukocyte miRNA-splicing profiles
substantial immune cell activity in the patient’s blood leuko-cytes both pre and post- treatment. Furthermore, most healthyindividual samples were classified with post-treated patients andpre-treated patients with the off stimulation state based on theexpression data of the marker genes.
PD-SPLICED TRANSCRIPTS SHOW MULTIPLE GENE-WIDE BINDINGSITES FOR PD-MODIFIED miRNAsRecent evidence indicates miRNA targeting beyond the 3′-UTR(Orom et al., 2008; Lee et al., 2009). Therefore, we extendedthe search for putatively changed miRNA-AS pairs to both thecoding region and the 5′-UTR using miRWalk (Dweep et al.,2011). The miRWalk database, which predicts miRNA bindingsites on the complete sequence of each gene, includes thousandsof predicted targets for each of the PD-differentially expressedmiRNAs. Using this information, we constructed a network ofpotential links between the 13 PD-differentially expressed miR-NAs and the 217 target transcripts that showed AS changes inPD (Figure 6A), which exhibited more inclusion than exclusionevents (Figure 6B). A total of 560 putative connections emerged(an average of 2.6 miRNA binding sites/target gene), with 43% ofthose on the 3′ UTR, 38% in the coding sequence and the remain-ing 19% in the 5′ UTR of the AS target genes (Figure 6C). Thiscould not be explained by the relative length of the different generegions of the identified links, since the average fraction (out ofthe total length for all genes) is 24% for the 3′ UTR, 69% for thecoding sequence and only 7% for the 5′ UTR (Mazumder et al.,2003; Sakharkar et al., 2004b). The network showed a remarkableasymmetry containing the highest number of spliced junctions(68) in predicted targets for miR-16 and the lowest (1) for hsa-miR-18b-3p (previously called hsa-miR-18b∗). Supporting thenotion of disease relevance, this network included several knownPD-related genes such as the transcriptional regulator FOXP1(Kim et al., 2007), that promotes midbrain dopaminergic iden-tity in stem cells (Konstantoulas et al., 2010), which was identifiedas alternatively spliced in this study and was predicted as tar-geted by the PD dys-regulated hsa-miR-320 cluster. We concludethat at least some of the PD-modified miRNAs may poten-tially interact with part of the AS-modified transcripts in PDleukocytes.
DBS-SPLICED TRANSCRIPTS SHOW MULTIPLE GENE-WIDE BINDINGSITES FOR DBS-MODIFIED miRNAsAn independent network was constructed for the DBS-modifiedmiRNAs and their DBS-spliced predicted targets (Figure 7A).Similar to the PD network, it included more AS predicted targetsexhibiting inclusion (rather than exclusion) events (Figure 7B),with binding prediction again showing a decreasing order fromthe 3′ UTR (45%), coding sequence (35%) to the 5′ UTR (20%)(Figure 7C).The pair-sample DBS network was predictably thin-ner than the PD one as it avoided inter-individual variabilityand was based on smaller numbers of DBS-modified miR-NAs and AS target transcripts. Nevertheless, this network aswell showed asymmetry, with many more predicted AS tar-gets for hsa-miR-424. The two networks shared four miR-NAs that their predicted targets were modified both in PDand after DBS as compared with healthy volunteers. Of these,
hsa-miR-378, and hsa-miR-20a were predicted to bind the sameseven AS target genes, affecting the actin-associated proteinVASP involved in axon guidance (Mohamed et al., 2012), thehemoglobin subunit gamma-2 HBG2 gene, the retinoic acidreceptor responder RARRES3, the androgen-regulated solute car-rier SLC14A1 (Vaarala et al., 2012), TMEM69, a dividing leuko-cytes biomarker (Solmi et al., 2006), the mitochondrial tRNAdimethyl-allyltransferase trit1 and the bZIP nuclear transcriptionfactor. Other identified targets were the cAMP-responsive modu-lator CREM, which has known spliced isoform variants (Sanbornet al., 1997) and regulates target genes in different tissues (Fimiaet al., 2000) and which associates with panic disorder (Domschkeet al., 2003), depression and bipolar disorder (Crisafulli et al.,2012) and the schizophrenia-mutated GABA receptor modula-tor DBI which encodes a diazepam binding inhibitor (Niu et al.,2004).
We found three target genes (HBG2, RARRES3, and VASP)common to both networks to be regulated by the same miRNAspredicted to target the same junction probe-set pairs (Figure 7A),and in opposite directions from healthy controls to PD patientsas compared with pre- to post-DBS. This is a remarkable overlapgiven that the DBS network was much narrower than the PD oneand that the patient’s pre-DBS changes were unpaired with thehealthy volunteers.
The observed changes in miRNA-AS interactions in bothPD and following DBS further raised the question if the pre-dicted binding sites coincided with the modified splice junctions.Sequence comparisons of the miRNA seed regions with the junc-tion probe sets that exhibited splicing changes identified suchPD-and DBS-modified links in 34 (Table S21) and 33 events(Table S22) from 13 and 5 spliced transcripts, respectively. Giventhat this is only a small fraction of the modified transcripts ineach case, this finding demonstrates that the great majority of theobserved interactions did not involve active splicing events, whilesuggesting that direct miRNA-mediated splicing regulation is aviable, albeit exceptional case where the predicted binding site waslocated exactly in an alternatively spliced junction (Tables S21and S22). Exceptional PD-related examples of seemingly activemiRNA-spliced transcripts predicted interactions include USP13,which promotes smooth (SMO) signaling by preventing its ubiq-uitination (Xia et al., 2012), RGS3 which contributes to neuralprogenitor/stem cell regulation (Qiu et al., 2010) and MGAT1,involved in multiple sclerosis (Grigorian et al., 2012). The DBS-induced events occurred in the NPC2 gene, which shares choles-terol interactions with alpha-synuclein (SNCA) (Liu et al., 2010),as well as in HLX, C11orf5, CREM, and the poly-A binding proteincoding transcript PABPC1L.
DISCUSSIONOur study provides the first report of complete small RNA tran-scriptome sequencing of live human PD patients’ blood leuko-cytes. Using a whole transcriptome high throughput sequencingtechnique in conjunction with analyses of both exon and junctionmicroarrays interrogating RNA from the same cells of patientsprior to brain stimulation treatment and post-treatment whilebeing on and off electrical stimulation as well as of healthyvolunteers, we characterized differential expression in miRNAs
Frontiers in Molecular Neuroscience www.frontiersin.org May 2013 | Volume 6 | Article 10 | 12

Soreq et al. Parkinson leukocyte miRNA-splicing profiles
FIGURE 5 | Tissue and cell type origins of leukocyte-expressed
AS-modified long transcripts. Putative cell and tissue specific markerssubjected to alternative splicing in the leukocyte RNA samples from tested
patients and controls were hierarchically classified by exon array gene levelexpression (columns) and markers (rows). The color code scale presentslineage correlation Z -scores.
Frontiers in Molecular Neuroscience www.frontiersin.org May 2013 | Volume 6 | Article 10 | 13

Soreq et al. Parkinson leukocyte miRNA-splicing profiles
predicted to bind target transcripts that underwent splicing modi-fications. We have successfully classified microarray brain samplesof an independent patients cohort based on the expression lev-els of genes that were found as alternatively spliced in bloodleukocytes, at high accuracy of over 91%. Moreover, the dualcomparative analysis of patients pre- and post- treatment aswell as compared to healthy volunteers yielded insights intoboth disease and treatment mechanisms. Practically all of thehuman genes are simultaneously subject to post-transcriptional
regulation by either AS or miRNAs thus both miRNAs andspliced isoforns represent promising new candidates for PDresearch.
For the small RNA sequencing, we used SOLiD genomeanalyser, obtaining ∼106 reads per sample, which is consid-ered a sufficient coverage for small RNA profiling, with above50% average mapping to the miRBase database, detecting abouthalf of miRBase miRNAs in the samples in up to millions ofcopies for few of them. For comparison, alignment to a different
FIGURE 6 | A complex disease network of miRNA-spliced targets
expanding beyond the 3′-UTR. (A) Circular tree layout of the network ofconnections between the miRNAs detected as differentially expressed in PDpatients to their predicted target genes that exhibited AS change in splicejunction microarrays. External circle: red node color indicates exclusion eventin the predicted target splice junction and green—exclusion. Larger node sizeindicates higher number of connections. The color of edges represents thegene region in which the binding is predicted to occur (5′ , 3′ -UTR or coding
sequence, CDS). Middle circle: the predicted target genes. Gray circle colorhighlights miRNAs targeting the PD-related gene FOXP1, previously linked tomiRNA regulation. Curved lines in the inner circle denote two differentregions predicted to be bound (e.g., 3′ UTR and coding sequence). (B) PDpatients exhibited more inclusion events (green) as compared with exclusion(red). (C) The types of events predicted to be regulated by the changedmiRNAs: 3′ un-translated region (UTR) (dark blue), 5′ UTR (orange) or codingsequence (CDS, light blue).
Frontiers in Molecular Neuroscience www.frontiersin.org May 2013 | Volume 6 | Article 10 | 14

Soreq et al. Parkinson leukocyte miRNA-splicing profiles
FIGURE 7 | The treatment induced network partially overlaps with the
disease network. (A) A circular tree layout network of connectionsbetween miRNAs that exhibited differential expression following DBSneurosurgery as compared with the pre-DBS (non-stimulated) state, andtheir predicted target genes that exhibited alternative splicing changes inPD patients following the DBS treatment. External circle: red node colorindicates exclusion event in the predicted target splice junction andgreen—exclusion. Larger node size indicates higher number ofconnections. The color of edges represents the gene region in which thebinding is predicted to occur (5′ , 3′-UTR or coding sequence, CDS).
Middle circle: the predicted target genes. Curved lines in the inner circledenote two different regions predicted to be bound (e.g., 3′ UTR andcoding sequence). Black miRNAs and dark blue target genes: overlap withthe patients compared to healthy network presented in Figure 6. (B) Thenumber of exon exclusion (red) and exon inclusion (green) events detectedin the predicted target genes that were detected by linear regressionanalysis of reciprocal junction pairs interrogated by junction microarrays(Y -axis: number of detected events). (C) The types of events predicted tobe regulated by DBS modified miRNAs: 3′ un-translated region (UTR) (darkblue), 5′ UTR (orange) or coding sequence (CDS, light blue).
reference sequence database of other (non-miRNA) non-codinghuman RNAs yielded only an average of ∼9% alignment overall the sequenced libraries, supporting the notion that the miR-NAs are composing the largest population of non-coding RNAsfound in the studied human leukocyte samples. Concurrently,we employed splice junction and exon microarrays to generateparallel transcriptome datasets from the same cells in order to
identify AS changes in the modified miRNAs predicted targets,as well as the cellular composition changes in patients and post-treatment. Testing the same patients before and after surgeryfurther overcame individual variability. Further studies which willexpand the size of the tested cohort will enable validation of ourfindings in larger and independent patient and healthy volunteercohorts.
Frontiers in Molecular Neuroscience www.frontiersin.org May 2013 | Volume 6 | Article 10 | 15

Soreq et al. Parkinson leukocyte miRNA-splicing profiles
We identified significant changes in 16 miRNAs in PD and in11 post-DBS treatment, 5 of which were among these changed inthe disease, but inversely, reinforcing the disease and treatmentrelevance of these changes. The post-DBS change was furtherdependent on the stimulus itself, as 1-h off-stimulus completelychanged the modified miRNA profiles as compared with the stim-ulated state. We also identified expression changes in two newlyproposed miRNAs that were recently reported as tRNA fragments,possibly originated from the antisense copy of an endogenousretroviral element (Kawaji et al., 2008; De Hoon et al., 2010).The observed miRNA changes post DBS were compatible withmiRNA expression being subject to rapid changes under modifiedenvironmental conditions (Brzuzan et al., 2012) and immunolog-ical challenges (Perry et al., 2008) and indicating possible rele-vance to the DBS-suppressed symptoms. To our knowledge, ourstudy is the first to construct differential disease- and treatment-related networks in human cells from neurodegenerative diseasepatients.
Analysis of gene isoform differential expression, AS and mod-ifications of miRNA binding sites revealed significant differencesin splice isoform profiles between PD patients and healthy con-trol volunteers blood leukocytes, as well as in post- comparedto pre-DBS states, following the brain stimulation treatment. Weidentified enrichment of immune cellular composition by lin-eage cell profiling analysis of the exon microarrays, both pre-and post-DBS. Through database and network analyses we iden-tified disease and treatment networks of miRNAs and splicedtargets. Combining the data from differential expression of miR-NAs with the changes in expression of their potential targets ina systematic way is a powerful tool to identify disease relatedmiRNA-target gene networks. In this study we combined miRNAexpression profile in PD patients pre- and post-treatment withdata of splice junction microarrays from the same samples pre-senting a systems biology approach for studying blood leukocyteRNA expression patterns in neurological and neurodegenerativediseases.
Intriguingly, there were more predicted binding sites in the 3′UTR as compared with the other regions, compatible with other’sobservations for more efficient regulation of the target genesthrough 3′-UTR binding. Whereas binding to the 3′ UTR inducesstronger degradation of the target, auxiliary binding to the cod-ing sequence may possibly increase this effect. Recent reports thattarget regulation through miRNAs may function also in codingregions, not only the 3′ UTR (Dolken et al., 2010; Hafner et al.,2010) are compatible with our predictions. Correspondingly,computational analyses of data produced from RNA-bindingprotein PAR-CLIP [Photoactivatable-Ribonucleoside-EnhancedCrosslinking and Immunoprecipitation, (Ule et al., 2003)] exper-iments showed that nearly 50% of the miRNA binding siteswere located in the coding regions of the targets, compatiblewith the capacity of miRNAs to each regulate thousands of tar-get mRNAs (Lewis et al., 2005; Friedman et al., 2009). Yet,the molecular mechanisms underlying the selection of inter-action between distinct “seed” domains and single transcriptswas not yet interrogated in a global manner in human diseases;therefore, the identification of more than a single miRNA-target
putative interaction site opens yet more questions, for futurestudies.
The state specific enrichment for GO processes suggestsdisease- and treatment-specific functional involvement. Thedisease induced processes included ubiquitin ligase complex,mitochondrion organization and regulation of translation, com-patible with our recent observations in brains of PD modelmice (Soreq et al., 2012a). The DBS induced functional changesincluded MAPK phosphatase export from nucleus as well as inubiquitin homeostasis, suggesting treatment influence on diseaseleukocyte pathways.
While the majority of small RNAs are found within the cells,a growing number of miRNAs are observed outside cells, includ-ing various body fluids and blood (Caby et al., 2005; Garcia et al.,2008). For example, small RNA deep sequencing identified miR-NAs in exosomes, membrane-bound nanoparticles which are anewly described pathway of intercellular communications (Zhangand Grizzle, 2011), with a distinct signature during prion infec-tion (Bellingham et al., 2012). Circulating miRNAs were recentlysuggested as new biomarkers in diagnosis, prognosis, and treat-ment of cancer (Allegra et al., 2012). Moreover, extracellularRNAs have immune-modulating properties (Altincicek et al.,2008) and can escape the blood-brain barrier to reach distal loca-tions (Graner et al., 2009) or to tumors. This suggests a futurevenue to pursue.
Epigenetic chromatin changes were recently found in bloodleukocytes of schizophrenia patients (Melas et al., 2012), whereassociation was found between DNA methylation and antipsy-chotic drug treatment. As PD also entails hereditary componentin about 10% of the cases, it will be highly interesting to pur-sue in the future for genome-wide DNA methylation changesin PD patients prior to, and following DBS, which may revealdysregulated epigenome in PD and may further discover DNAmethylation disease biomarkers in blood leukocytes.
Concurrent measurements of miRNAs and their mRNA tar-gets were recently reported for two other human diseases:Myelodysplastic Syndromes (Beck et al., 2011) and multiple scle-rosis (Angerstein et al., 2012) but these studies did not addresssplice isoform and AS changes of the targets. To our knowl-edge, this is the first report where quantitative information aboutmiRNAs has been generated concurrently with particular splicevariants in a genome wide scale for blood leukocytes of humanpatients prior to, and post brain stimulation treatment. Thus,our study provides a useful data set supplementing previousmicroarray datasets of transcripts, which lacked isoform-specificresolution, and provides a comparative resource for miRNA studyin PD.
The PD network included the transcription factor FOXP1,implicated in a miRNA-mediated feedback loop controlling thesurvival of midbrain dopaminergic neurons (Kim et al., 2007),and shown to co-act with PITX3 for maintaining neuronal fatein the midbrain. Specifically, PITX3 promotes midbrain iden-tity through regulation by this dopaminergic regulator (De Menaet al., 2010; Konstantoulas et al., 2010). These findings suggestrelevance of the observed changes for both the PD phenotypeand treatment efficacy, and foresee the use of similar network
Frontiers in Molecular Neuroscience www.frontiersin.org May 2013 | Volume 6 | Article 10 | 16

Soreq et al. Parkinson leukocyte miRNA-splicing profiles
approaches for the study of other neurological and neurodegen-erative diseases.
The identified miRNA changes in PD patient’s blood leuko-cytes here may provide an important biomarker profile, reflectingremarkable dynamics and stimulus-dependent reversal of miRNAexpression. Our data set provide a source for miRNA expressionin blood leukocytes in healthy state and under neurodegenera-tive disease. Our analyses and findings suggest disease-associateddys-regulation and treatment-related reversal of the transcrip-tional mediated checks and balances that, under healthy statefunctioning, reflect balanced splicing events controlling leukocytetranscript profiles.
ACKNOWLEDGMENTS
AUTHOR CONTRIBUTIONSConceived and designed the experiments: Lilach Soreq, HermonaSoreq, Hagai Bergman, Zvi Israel. Recruited study participants:Zvi Israel, Hagai Bergman, Lilach Soreq. Collected patient sam-ples: Lilach Soreq. Produced RNA: Lilach Soreq. Conducted com-putational and Bioinformatic analyses: Lilach Soreq. Designedthe software used in analysis: Nathan Salomonis, Lilach Soreq.Contributed analysis tools: Nathan Salomonis. Wrote thepaper: Lilach Soreq and Hermona Soreq and all co-authorsapproved.
SUPPLEMENTARY MATERIALThe Supplementary Material for this article can be found onlineat: http://www.frontiersin.org/Molecular_Neuroscience/10.3389/fnmol.2013.00010/abstract
Figure S1 | The percentage of annotated reads and of the miRBase aligned
reads. (A) Percent of annotated reads of the total number of RNA-Seq
reads in all the 12 RNA-Seq libraries. (B) Percent of miRBase detected
entries in the RNA-Seq libraries (C) Percent of sequence match between
the reads and the miRBase sequences (perfect, 1 mismatch, 2
mismatches and 3 mismatches) (D) Percent of reads match to the human
reference sequences database (which comprises of non protein-coding
RNAs other than miRNAs, such as SINEs and ALU sequences).
Figure S2 | Expression map of selected miRNAs and miRNA∗ (3′/5′ forms)
in blood leukocytes of Parkinson’s patients pre- and post- treatment and
of healthy control volunteers. Read counts of selected miRNAs that were
detected through RNA-Seq alignment of small RNAs detected in blood
leukocytes of PD patients pre- and post-DBS while being on and off
electrical stimulation and of matched healthy control (HC) volunteers to
the miRBase database. (A) Highly expressed miRNAs (B) Highest
expressed, and (C) Count levels of miRNA∗ (3′/5′) forms presenting low
expression (D) and high expression (E). Y axis: the number of reads. Dark
blue: the expression of miRNAs in HC volunteers, lighter blue: in PD
patients pre-DBS, light blue: post-DBS while being on electrical
stimulation (DBS) and lightest: in PD patients post-DBS following one hour
of a complete electrical stimulation cessation (DBS-off).
Figure S3 | DBS differentially expressed miRNAs. Presented are miRNAs
that were detected as changed in PD patients post-DBS as compared with
HC volunteers (left), the same patients while being off electrical
stimulation state as compared with healthy control volunteers (middle)
and in off electrical stimulation state as compared with the pre-surgical
state (right). Y axis: fold change multiplied by the ln (log base 10) of the
significance p-value which was obtained by a negative binomial
distribution test through a generalization of the Poisson model that
recaptures biological variance correctly (Robinson and Smyth, 2008).
Figure S4 | Classification of patients pre-DBS from healthy control
volunteers. The junction microarrays expression levels of blood
leukocyte RNA exons that were detected as changed in PD patients as
compared with HC volunteers correctly classified patient samples apart
from the healthy samples. The unsupervised hierarchical classification
was conducted on the expression signals of the exons detected by
splicing-index analysis which was conducted by a modified version of
AltAnalyze (Salomonis et al., 2009) that was adopted to the human
splice junction (HJAY) arrays and is based on the measurement
described for exon arrays under (Gardina et al., 2006). The classification
was conducted with Euclidean distance measure on both the exons and
the samples.
Figure S5 | Classification of patients post-DBS from pre-DBS state. The
junction microarrays expression levels of blood leukocyte RNA exons that
were detected as changed by splicing-index analysis in PD patients
pre-DBS as compared with post-DBS (DBS) state (while being on
electrical stimulation) correctly classified between the states. The
classification was conducted by a hierarchical classifier with Euclidean
distance measure on both the exons and the samples.
REFERENCESAffymetrix Technical Notes. Guide to
Probe Logarithmic Intensity Error(PLIER) Estimation. Availableonline at: http://www.affymetrix.com/support/technical/technotes/plier_technote.pdf
Allegra, A., Alonci, A., Campo, S.,Penna, G., Petrungaro, A., Gerace,D., et al. (2012). CirculatingmicroRNAs: new biomarkers indiagnosis, prognosis and treatment
of cancer (Review). Int. J. Oncol. 41,1897–1912.
Allemand, E., Guil, S., Myers, M.,Moscat, J., Caceres, J. F., andKrainer, A. R. (2005). Regulationof heterogenous nuclear ribonu-cleoprotein A1 transport byphosphorylation in cells stressed byosmotic shock. Proc. Natl. Acad. Sci.U.S.A. 102, 3605–3610.
Altincicek, B., Stotzel, S., Wygrecka,M., Preissner, K. T., and Vilcinskas,
A. (2008). Host-derived extracel-lular nucleic acids enhance innateimmune responses, induce coagu-lation, and prolong survival uponinfection in insects. J. Immunol. 181,2705–2712.
Angerstein, C., Hecker, M., Paap, B.K., Koczan, D., Thamilarasan, M.,Thiesen, H. J., et al. (2012).Integration of MicroRNAdatabases to study MicroRNAsassociated with multiple
sclerosis. Mol. Neurobiol. 45,520–535.
Ashburner, M., Ball, C. A., Blake,J. A., Botstein, D., Butler, H.,Cherry, J. M., et al. (2000). Geneontology: tool for the unifi-cation of biology. Nat. Genet.25, 25.
Atz, M., Walsh, D., Cartagena, P., Li, J.,Evans, S., Choudary, P., et al. (2007).Methodological considerations forgene expression profiling of human
Frontiers in Molecular Neuroscience www.frontiersin.org May 2013 | Volume 6 | Article 10 | 17
We thank the patient and healthy volunteers that partici-pated in this study. This work was supported by the IsraeliChief Scientist to Hagai Bergman and David S. Greenberg, theThyssen Foundation to Hermona Soreq. and to Hagai Bergman,and the Rosetrees foundation and the European Network ofexcellence on alternative splicing (EURASNET) to HermonaSoreq. Lilach Soreq thanks HUJI sources for PhD fellowshipsupport.

Soreq et al. Parkinson leukocyte miRNA-splicing profiles
brain. J. Neurosci. Methods 163,295–309.
Beck, D., Ayers, S., Wen, J., Brandl, M.B., Pham, T. D., Webb, P., et al.(2011). Integrative analysis of nextgeneration sequencing for smallnon-coding RNAs and transcrip-tional regulation in MyelodysplasticSyndromes. BMC Med. Genomics4:19. doi: 10.1186/1755-8794-4-19
Bellingham, S. A., Coleman, B. M.,and Hill, A. F. (2012). Small RNAdeep sequencing reveals a distinctmiRNA signature released in exo-somes from prion-infected neu-ronal cells. Nucleic Acids Res. 40,10937–10949.
Bergman, H., Wichmann, T., andDelong, M. R. (1990). Reversalof experimental parkinsonism bylesions of the subthalamic nucleus.Science 249, 1436–1438.
Bernal-Pacheco, O., Limotai, N.,Go, C. L., and Fernandez, H. H.(2012). Nonmotor manifestationsin Parkinson disease. Neurologist18, 1–16.
Berson, A., Barbash, S., Shaltiel, G.,Goll, Y., Hanin, G., Greenberg,D. S., et al. (2012). Cholinergic-associated loss of hnRNP-A/B inAlzheimer’s disease impairs corti-cal splicing and cognitive func-tion in mice. EMBO Mol. Med. 4,730–742.
Braak, H., and Del Tredici, K.(2008). Invited article: nervoussystem pathology in sporadicParkinson disease. Neurology 70,1916–1925.
Brock, M., Trenkmann, M., Gay, R.E., Michel, B. A., Gay, S., Fischler,M., et al. (2009). Interleukin-6 modulates the expression ofthe bone morphogenic pro-tein receptor type II through anovel STAT3–microRNA cluster17/92 pathway. Circ. Res. 104,1184–1191.
Brzuzan, P., Wozny, M., Wolinska, L.,and Piasecka, A. (2012). Expressionprofiling in vivo demonstratesrapid changes in liver microRNAlevels of whitefish (Coregonuslavaretus) following microcystin-LRexposure. Aquat. Toxicol. 122-123,188–196.
Butt, A. Q., Ahmed, S., Maratha,A., and Miggin, S. M. (2012).14-3-3{epsilon} and 14-3-3sigmainhibit TLR-mediated pro-inflammatory cytokine induction.J. Biol. Chem. 287, 38665–38679.
Caby, M. P., Lankar, D., Vincendeau-Scherrer, C., Raposo, G., andBonnerot, C. (2005). Exosomal-likevesicles are present in humanblood plasma. Int. Immunol. 17,879–887.
Carrer, M., Liu, N., Grueter, C. E.,Williams, A. H., Frisard, M. I.,Hulver, M. W., et al. (2012). Controlof mitochondrial metabolismand systemic energy homeostasisby microRNAs 378 and 378∗.Proc. Natl. Acad. Sci. U.S.A. 109,15330–15335.
Crisafulli, C., Shim, D. S., Andrisano,C., Pae, C. U., Chiesa, A., Han,C., et al. (2012). Case-control asso-ciation study of 14 variants ofCREB1, CREBBP and CREM ondiagnosis and treatment outcomein major depressive disorder andbipolar disorder. Psychiatry Res. 198,39–46.
De Hoon, M. J., Taft, R. J., Hashimoto,T., Kanamori-Katayama, M.,Kawaji, H., Kawano, M., et al.(2010). Cross-mapping and theidentification of editing sitesin mature microRNAs in high-throughput sequencing libraries.Genome Res. 20, 257–264.
Delay, C., Calon, F., Mathews, P., andHebert, S. S. (2011). Alzheimer-specific variants in the 3′UTRof Amyloid precursor pro-tein affect microRNA function.Mol. Neurodegener. 6:70. doi:10.1186/1750-1326-6-70
De Mena, L., Coto, E., Cardo, L. F.,Diaz, M., Blazquez, M., Ribacoba,R., et al. (2010). Analysis of theMicro-RNA-133 and PITX3 genesin Parkinson’s disease. Am. J. Med.Genet. B Neuropsychiatr. Genet.153B, 1234–1239.
Diniz, M. G., Gomes, C. C., De Castro,W. H., Guimaraes, A. L., De Paula,A. M., Amm, H., et al. (2012). miR-15a/16-1 influences BCL2 expres-sion in keratocystic odontogenictumors. Cell Oncol. (Dordr.) 35,285–291.
Dolken, L., Malterer, G., Erhard, F.,Kothe, S., Friedel, C. C., Suffert, G.,et al. (2010). Systematic analysisof viral and cellular microRNAtargets in cells latently infected withhuman gamma-herpesvirusesby RISC immunoprecipita-tion assay. Cell Host Microbe 7,324–334.
Domschke, K., Kuhlenbaumer, G.,Schirmacher, A., Lorenzi, C.,Armengol, L., Dibella, D., et al.(2003). Human nuclear transcrip-tion factor gene CREM: genomicorganization, mutation screening,and association analysis in panicdisorder. Am. J. Med. Genet. BNeuropsychiatr. Genet. 117B, 70–78.
Doxakis, E. (2010). Post-transcriptional regulation ofalpha-synuclein expression bymir-7 and mir-153. J. Biol. Chem.285, 12726–12734.
Dweep, H., Sticht, C., Pandey, P.,and Gretz, N. (2011). miRWalk–database: prediction of possiblemiRNA binding sites by "walk-ing" the genes of three genomes.J. Biomed. Inform. 44, 839–847.
Eddington, K. M., Dolcos, F., Cabeza,R., Kr, R. K., and Strauman, T.J. (2007). Neural correlates ofpromotion and prevention goalactivation: an fMRI study usingan idiographic approach. J. Cogn.Neurosci. 19, 1152–1162.
Edgar, R., Domrachev, M., and Lash,A. E. (2002). Gene expressionomnibus: NCBI gene expressionand hybridization array datarepository. Nucleic Acids Res. 30,207–210.
Fahn, S. (2011). Classification of move-ment disorders. Mov. Disord. 26,947–957.
Fahn, S., and Elton, R. (1987).“Members of the updrsDevelopment Committee,” inRecent Developments in Parkinson’sDisease, Vol 2. eds S. Fahn, C.D. Marsden, D. B. Calne, andM. Goldstein (Florham Park,NJ: Macmillan Health CareInformation), 153–163, 293–304.
Fimia, G. M., De Cesare, D., andSassone-Corsi, P. (2000). A familyof LIM-only transcriptional coac-tivators: tissue-specific expressionand selective activation of CREBand CREM. Mol. Cell. Biol. 20,8613–8622.
Friedman, R. C., Farh, K. K., Burge, C.B., and Bartel, D. P. (2009). Mostmammalian mRNAs are conservedtargets of microRNAs. Genome Res.19, 92–105.
Garcia, J. M., Garcia, V., Pena, C.,Dominguez, G., Silva, J., Diaz, R.,et al. (2008). Extracellular plasmaRNA from colon cancer patients isconfined in a vesicle-like structureand is mRNA-enriched. RNA 14,1424–1432.
Gardina, P. J., Clark, T. A., Shimada,B., Staples, M. K., Yang, Q., Veitch,J., et al. (2006). Alternative splic-ing and differential gene expres-sion in colon cancer detected bya whole genome exon array. BMCGenomics 7:325. doi: 10.1186/1471-2164-7-325
Gehrke, S., Imai, Y., Sokol, N., andLu, B. (2010). Pathogenic LRRK2negatively regulates microRNA-mediated translational repression.Nature 466, 637–641.
Goldman, J. G., and Litvan, I. (2011).Mild cognitive impairment inParkinson’s disease. Minerva Med.102, 441–459.
Graner, M. W., Alzate, O.,Dechkovskaia, A. M., Keene, J.
D., Sampson, J. H., Mitchell, D.A., et al. (2009). Proteomic andimmunologic analyses of braintumor exosomes. FASEB J. 23,1541–1557.
Griffiths-Jones, S., Saini, H. K.,Van Dongen, S., and Enright,A. J. (2008). miRBase: tools formicroRNA genomics. Nucleic AcidsRes. 36, D154–D158.
Grigorian, A., Mkhikian, H., Li,C. F., Newton, B. L., Zhou, R.W., and Demetriou, M. (2012).Pathogenesis of multiple sclerosisvia environmental and geneticdysregulation of N-glycosylation.Semin. Immunopathol. 34, 415–424.
Guil, S., and Caceres, J. F. (2007).The multifunctional RNA-binding protein hnRNP A1 isrequired for processing of miR-18a. Nat. Struct. Mol. Biol. 14,591–596.
Guo, J., Miao, Y., Xiao, B., Huan,R., Jiang, Z., Meng, D., et al.(2008). Differential expression ofmicroRNA species in human gas-tric cancer versus non-tumorous tis-sues. J. Gastroenterol. Hepatol. 24,652–657.
Guo, J., Miao, Y., Xiao, B., Huan,R., Jiang, Z., Meng, D., et al.(2009). Differential expression ofmicroRNA species in human gas-tric cancer versus non-tumorous tis-sues. J. Gastroenterol. Hepatol. 24,652–657.
Hackl, M., Brunner, S., Fortschegger,K., Schreiner, C., Micutkova, L.,Mück, C., et al. (2010). miR-17, miR-19b, miR-20a, and miR-106a are down-regulated in humanaging. Aging Cell 9, 291–296.
Hafner, M., Landthaler, M., Burger,L., Khorshid, M., Hausser, J.,Berninger, P., et al. (2010).Transcriptome-wide identifica-tion of RNA-binding protein andmicroRNA target sites by PAR-CLIP.Cell 141, 129–141.
Han, S. P., Friend, L. R., Carson,J. H., Korza, G., Barbarese, E.,Maggipinto, M., et al. (2010).Differential subcellular distribu-tions and trafficking functions ofhnRNP A2/B1 spliceoforms. Traffic11, 886–898.
Hardcastle, T. J., and Kelly, K. A.(2010). baySeq: empirical Bayesianmethods for identifying differen-tial expression in sequence countdata. BMC Bioinformatics 11:422.doi: 10.1186/1471-2105-11-422
Hawkes, C. H., Del Tredici, K., andBraak, H. (2010). A timeline forParkinson’s disease. ParkinsonismRelat. Disord. 16, 79–84.
Heath, E., Sablitzky, F., and Morgan,G. T. (2010). Subnuclear targeting
Frontiers in Molecular Neuroscience www.frontiersin.org May 2013 | Volume 6 | Article 10 | 18
Soreq et al. Parkinson leukocyte miRNA-splicing profiles
of the RNA-binding motif proteinRBM6 to splicing speckles andnascent transcripts. ChromosomeRes. 18, 851–872.
Hébert, S. S., Horré, K., Nicolaï, L.,Bergmans, B., Papadopoulou,A. S., Delacourte, A., et al.(2009). MicroRNA regulationof Alzheimer’s Amyloid precursorprotein expression. Neurobiol. Dis.33, 422–428.
Hosack, D. A., Dennis, G. Jr., Sherman,B. T., Lane, H. C., and Lempicki,R. A. (2003). Identifying biolog-ical themes within lists of geneswith EASE. Genome Biol. 4:R70. doi:10.1186/gb-2003-4-10-r70
Huang, G., Nishimoto, K., Zhou, Z.,Hughes, D., and Kleinerman, E.S. (2012). miR-20a encoded bythe miR-17-92 cluster increasesthe metastatic potential ofosteosarcoma cells by regulat-ing Fas expression. Cancer Res. 72,908–916.
Irimia, M., and Blencowe, B. J. (2012).Alternative splicing: decoding anexpansive regulatory layer. Curr.Opin. Cell Biol. 24, 323–332.
Irizarry, R. A., Bolstad, B. M., Collin,F., Cope, L. M., Hobbs, B., andSpeed, T. P. (2003). Summariesof affymetrix GeneChip probelevel data. Nucleic Acids Res.31, e15.
Johnson, R., Zuccato, C., Belyaev, N.D., Guest, D. J., Cattaneo, E., andBuckley, N. J. (2008). A microRNA-based gene dysregulation pathwayin Huntington’s disease. Neurobiol.Dis. 29, 438–445.
Kawaji, H., Nakamura, M., Takahashi,Y., Sandelin, A., Katayama,S., Fukuda, S., et al. (2008).Hidden layers of human smallRNAs. BMC Genomics 9:157. doi:10.1186/1471-2164-9-157
Kim, H. J., Kim, N. C., Wang, Y. D.,Scarborough, E. A., Moore, J., Diaz,Z., et al. (2013). Mutations in prion-like domains in hnRNPA2B1 andhnRNPA1 cause multisystem pro-teinopathy and ALS. Nature 495,467–473.
Kim, J., Inoue, K., Ishii, J., Vanti, W.B., Voronov, S. V., Murchison, E.,et al. (2007). A MicroRNA feedbackcircuit in midbrain dopamine neu-rons. Science 317, 1220–1224.
Kingwell, K. (2011). Parkinson dis-ease. Constant-current deepbrain stimulation improvessymptoms in Parkinson dis-ease. Nat. Rev. Neurol. 8:119. doi:10.1038/nrneurol.2012.14
Konstantoulas, C. J., Parmar, M., andLi, M. (2010). FoxP1 promotes mid-brain identity in embryonic stemcell-derived dopamine neurons by
regulating Pitx3. J. Neurochem. 113,836–847.
Krichevsky, A. M., and Gabriely, G.(2008). miR-21: a small multi-faceted RNA. J. Cell. Mol. Med. 13,39–53.
Lapuk, A., Marr, H., Jakkula, L., Pedro,H., Bhattacharya, S., Purdom,E., et al. (2010). Exon-levelmicroarray analyses identifyalternative splicing programs inbreast cancer. Mol. Cancer Res.8, 961.
Lee, I., Ajay, S. S., Yook, J. I., Kim,H. S., Hong, S. H., Kim, N.H., et al. (2009). New class ofmicroRNA targets containingsimultaneous5′-UTR and 3′-UTRinteraction sites. Genome Res. 19,1175–1183.
Lee, R. C., Feinbaum, R. L., andAmbros, V. (1993). The, C. elegansheterochronic gene lin-4 encodessmall RNAs with antisense com-plementarity to lin-14. Cell 75,843–854.
Lewis, B. P., Burge, C. B., and Bartel,D. P. (2005). Conserved seed pair-ing, often flanked by adenosines,indicates that thousands of humangenes are microRNA targets. Cell120, 15–20.
Li, J., Kong, X., Zhang, J., Luo, Q., Li,X., and Fang, L. (2013). MiRNA-26binhibits proliferation by targetingPTGS2 in breast cancer. Cancer CellInt. 13, 7.
Liu, J. P., Tang, Y., Zhou, S., Toh,B. H., McLean, C., and Li, H.(2010). Cholesterol involvement inthe pathogenesis of neurodegenera-tive diseases. Mol. Cell. Neurosci. 43,33–42.
Lonnstedt, I. S. T. (2002). Replicatedmicroarray data. Stat. Sinica 12,31–46.
Lundstrom, K. (2011). Micro-RNA indisease and gene therapy. Curr. DrugDiscov. Technol. 8, 76–86.
Maes, O. C., Chertkow, H. M., Wang,E., and Schipper, H. M. (2009).MicroRNA: implications forAlzheimer disease and other humanCNS disorders. Curr. Genomics 10,154–168.
Margis, R., and Rieder, C. R. (2011).Identification of blood microRNAsassociated to Parkinsonis disease.J. Biotechnol. 152, 96–101.
Martins, M., Rosa, A., Guedes, L.C., Fonseca, B. V., Gotovac,K., Violante, S., et al. (2011).Convergence of miRNA expressionprofiling, alpha-synuclein inter-acton and GWAS in Parkinson’sdisease. PLoS ONE 6:e25443. doi:10.1371/journal.pone.0025443
Mazumder, B., Seshadri, V., and Fox,P. L. (2003). Translational control
by the 3′-UTR: the ends specifythe means. Trends Biochem. Sci. 28,91–98.
Melas, P. A., Rogdaki, M., Osby, U.,Schalling, M., Lavebratt, C., andEkstrom, T. J. (2012). Epigeneticaberrations in leukocytes of patientswith schizophrenia: associationof global DNA methylation withantipsychotic drug treatmentand disease onset. FASEB J. 26,2712–2718.
Meshorer, E., Erb, C., Gazit, R.,Pavlovsky, L., Kaufer, D., Friedman,A., et al. (2002). Alternative splicingand neuritic mRNA transloca-tion under long-term neuronalhypersensitivity. Science 295,508–512.
Minones-Moyano, E., Porta, S.,Escaramis, G., Rabionet, R., Iraola,S., Kagerbauer, B., et al. (2011).MicroRNA profiling of Parkinson’sdisease brains identifies earlydownregulation of miR-34b/cwhich modulate mitochondrialfunction. Hum. Mol. Genet. 20,3067–3078.
Mohamed, A. M., Boudreau, J. R.,Yu, F. P., Liu, J., and Chin-Sang,I. D. (2012). The Caenorhabditiselegans Eph receptor activatesNCK and N-WASP, and inhibitsEna/VASP to regulate growth conedynamics during axon guidance.PLoS Genet. 8:e1002513. doi:10.1371/journal.pgen.1002513
Moran, L. B., Duke, D. C., Deprez,M., Dexter, D. T., Pearce, R. K.,and Graeber, M. B. (2006). Wholegenome expression profiling of themedial and lateral substantia nigrain Parkinson’s disease. Neurogenetics7, 1–11.
Mraz, M., Pospisilova, S., Malinova,K., Slapak, I., and Mayer, J. (2009).MicroRNAs in chronic lympho-cytic leukemia pathogenesis anddisease subtypes. Leuk. Lymphoma50, 506–509.
Niu, N., Rice, S. R., Heston, L. L.,and Sobell, J. L. (2004). Multiplemissense mutations in the diazepambinding inhibitor (DBI) gene iden-tified in schizophrenia but lack ofdisease association. Am. J. Med.Genet. B Neuropsychiatr. Genet.125B, 10–19.
Orom, U. A., Nielsen, F. C., andLund, A. H. (2008). MicroRNA-10abinds the 5′UTR of ribosomalprotein mRNAs and enhancestheir translation. Mol. Cell 30,460–471.
Pan, Q., Shai, O., Lee, L. J., Frey, B. J.,and Blencowe, B. J. (2008). Deepsurveying of alternative splicingcomplexity in the human tran-scriptome by high-throughput
sequencing. Nat. Genet. 40,1413–1415.
Pang, M., Woodward, A. W.,Agarwal, V., Guan, X., Ha, M.,Ramachandran, V., et al. (2009).Genome-wide analysis reveals rapidand dynamic changes in miRNAand siRNA sequence and expressionduring ovule and fiber developmentin allotetraploid cotton (Gossypiumhirsutum L.). Genome Biol10, R122.
Perry, M. M., Moschos, S. A., Williams,A. E., Shepherd, N. J., Larner-Svensson, H. M., and Lindsay,M. A. (2008). Rapid changesin microRNA-146a expressionnegatively regulate the IL-1beta-induced inflammatory response inhuman lung alveolar epithelial cells.J. Immunol. 180, 5689–5698.
Pico, A. R., Kelder, T., Van Iersel, M.P., Hanspers, K., Conklin, B. R.,and Evelo, C. (2008). WikiPathways:pathway editing for the people.PLoS Biol. 6:e184. doi: 10.1371/jour-nal.pbio.0060184
Pritchard, C. C., Cheng, H. H., andTewari, M. (2012). MicroRNAprofiling: approaches and con-siderations. Nat. Rev. Genet. 13,358–369.
Pu, X., Roth, J. A., Hildebrandt, M. A.,Ye, Y., Wei, H., Minna, J. D., et al.(2013). MicroRNA-related geneticvariants associated with clinical out-comes in early stage non-small celllung cancer patients. Cancer Res. 73,1867–1875.
Qiu, R., Wang, J., Tsark, W., and Lu,Q. (2010). Essential role of PDZ-RGS3 in the maintenance of neu-ral progenitor cells. Stem Cells 28,1602–1610.
Reinhart, B. J., Slack, F. J., Basson,M., Pasquinelli, A. E., Bettinger,J. C., Rougvie, A. E., et al. (2000).The 21-nucleotide let-7 RNA reg-ulates developmental timing inCaenorhabditis elegans. Nature 403,901–906.
Robinson, M. D., McCarthy, D. J., andSmyth, G. K. (2010). edgeR: a bio-conductor package for differentialexpression analysis of digital geneexpression data. Bioinformatics 26,139–140.
Robinson, M. D., and Oshlack, A.(2010). A scaling normalizationmethod for differential expressionanalysis of RNA-seq data. GenomeBiol. 11, R25.
Robinson, M. D., and Smyth, G.K. (2008). Small-sample estima-tion of negative binomial disper-sion, with applications to SAGEdata. Biostatistics 9, 321–332.
Saba, R., Goodman, C. D., Huzarewich,R. L. C. H., Robertson, C., and
Frontiers in Molecular Neuroscience www.frontiersin.org May 2013 | Volume 6 | Article 10 | 19

Soreq et al. Parkinson leukocyte miRNA-splicing profiles
Booth, S. A. (2008). A miRNA sig-nature of prion induced neurode-generation. PloS ONE 3:e3652. doi:10.1371/journal.pone.0003652
Sakharkar, M. K., Chow, V. T.,Chaturvedi, I., Mathura, V. S.,Shapshak, P., and Kangueane,P. (2004a). A report on singleexon genes (SEG) in eukaryotes.Front. Biosci. 9:3262–3267. doi:10.2741/1478
Sakharkar, M. K., Chow, V. T.,and Kangueane, P. (2004b).Distributions of exons and intronsin the human genome. In Silico Biol.4, 387–393.
Salomonis, N., Nelson, B., Vranizan,K., Pico, A. R., Hanspers, K.,Kuchinsky, A., et al. (2009).Alternative splicing in the differ-entiation of human embryonicstem cells into cardiac precursors.PLoS Comput. Biol. 5:e1000553. doi:10.1371/journal.pcbi.1000553
Salomonis, N., Schlieve, C. R., Pereira,L., Wahlquist, C., Colas, A.,Zambon, A. C., et al. (2010).Alternative splicing regulatesmouse embryonic stem cellpluripotency and differentiation.Proc. Natl. Acad. Sci. U.S.A. 107,10514–10519.
Sanborn, B. M., Millan, J. L., Meistrich,M. L., and Moore, L. C. (1997).Alternative splicing of CREB andCREM mRNAs in an immortal-ized germ cell line. J. Androl. 18,62–70.
Satoh, J., and Tabunoki, H. (2011).Comprehensive analysis of humanmicroRNA target networks.BioData Min. 4, 17.
Scherzer, C. R., Eklund, A. C., Morse,L. J., Liao, Z., Locascio, J. J., Fefer,D., et al. (2007). Molecular mark-ers of early Parkinson’s disease
based on gene expression in blood.Proc. Natl. Acad. Sci. U.S.A. 104,955–960.
Schopman, N. C., Heynen, S.,Haasnoot, J., and Berkhout, B.(2010). A miRNA-tRNA mix-up:tRNA origin of proposed miRNA.RNA Biol. 7, 573–576.
Smoot, M. E., Ono, K., Ruscheinski, J.,Wang, P. L., and Ideker, T. (2011).Cytoscape 2.8: new features for dataintegration and network visualiza-tion. Bioinformatics 27, 431–432.
Solmi, R., Ugolini, G., Rosati, G.,Zanotti, S., Lauriola, M., Montroni,I., et al. (2006). Microarray-based identification and RT-PCRtest screening for epithelial-specific mRNAs in peripheralblood of patients with coloncancer. BMC Cancer 6:250. doi:10.1186/1471-2407-6-250
Soreq, L., Ben-Shaul, Y., Israel, Z.,Bergman, H., and Soreq, H.(2012a). Meta-analysis of geneticand environmental Parkinson’sdisease models reveals a commonrole of mitochondrial protectionpathways. Neurobiol. Dis. 45,1018–1030.
Soreq, L., Bergman, H., Goll, Y.,Greenberg, D. S., Israel, Z., andSoreq, H. (2012b). Deep brain stim-ulation induces rapidly reversibletranscript changes in Parkinson’sleucocytes. J. Cell. Mol. Med. 16,1496–1507.
Soreq, L., Bergman, H., Israel, Z.,and Soreq, H. (2012c). Exonarrays reveal alternative splicingaberrations in Parkinson’s diseaseleukocytes. Neurodegener. Dis. 10,203–206.
Soreq, L., Israel, Z., Bergman, H.,and Soreq, H. (2008). Advancedmicroarray analysis highlights
modified neuro-immune signal-ing in nucleated blood cells fromParkinson’s disease patients.J. Neuroimmunol. 201–202,227–236.
Spinelli, S. V., Diaz, A., D’Attilio, L.,Marchesini, M. M., Bogue, C.,Bay, M. L., et al. (2013). AlteredmicroRNA expression levels inmononuclear cells of patientswith pulmonary and pleuraltuberculosis and their relationwith components of the immuneresponse. Mol. Immunol. 53,265–269.
Sugnet, C. W., Srinivasan, K., Clark, T.A., O’Brien, G., Cline, M. S., Wang,H., et al.. (2006). Unusual intronconservation near tissue-regulatedexons found by splicing microar-rays. PLoS Comput. Biol. 2:e4. doi:10.1371/journal.pcbi.0020004
Ule, J., Jensen, K. B., Ruggiu, M.,Mele, A., Ule, A., and Darnell, R.B. (2003). CLIP identifies Nova-regulated RNA networks in thebrain. Science 302, 1212–1215.
Vaarala, M. H., Hirvikoski, P.,Kauppila, S., and Paavonen,T. K. (2012). Identification ofandrogen-regulated genes inhuman prostate. Mol. Med. Rep. 6,466–472.
Wang, P., Gu, Y., Zhang, Q., Han,Y., Hou, J., Lin, L., et al. (2012).Identification of resting and typeI IFN-activated human NK cellmiRNomes reveals MicroRNA-378 and MicroRNA-30e asnegative regulators of NK cellcytotoxicity. J. Immunol. 189,211–221.
Xia, R., Jia, H., Fan, J., Liu, Y.,and Jia, J. (2012). USP8 pro-motes smoothened signaling bypreventing its ubiquitination and
changing its subcellular localiza-tion. PLoS Biol. 10:e1001238. doi:10.1371/journal.pbio.1001238
Zambon, A. C., Gaj, S., Ho, I.,Hanspers, K., Vranizan, K., Evelo,C. T., et al. (2012). GO-Elite: aflexible solution for pathway andontology over-representation.Bioinformatics 28, 2209–2210.
Zhang, H. G., and Grizzle, W. E.(2011). Exosomes and cancer:a newly described pathway ofimmune suppression. Clin. CancerRes. 17, 959–964.
Conflict of Interest Statement: Theauthors declare that the researchwas conducted in the absence of anycommercial or financial relationshipsthat could be construed as a potentialconflict of interest.
Received: 07 March 2013; accepted: 16April 2013; published online: 13 May2013.Citation: Soreq L, Salomonis N,Bronstein M, Greenberg DS, Israel Z,Bergman H and Soreq H (2013) SmallRNA sequencing-microarray analyses inParkinson leukocytes reveal deep brainstimulation-induced splicing changesthat classify brain region transcriptomes.Front. Mol. Neurosci. 6:10. doi: 10.3389/fnmol.2013.00010Copyright © 2013 Soreq, Salomonis,Bronstein, Greenberg, Israel, Bergmanand Soreq. This is an open-access articledistributed under the terms of theCreative Commons Attribution License,which permits use, distribution andreproduction in other forums, providedthe original authors and source arecredited and subject to any copyrightnotices concerning any third-partygraphics etc.
Frontiers in Molecular Neuroscience www.frontiersin.org May 2013 | Volume 6 | Article 10 | 20