Hyperinsulinemia Drives Diet-Induced Obesity Independently of Brain Insulin Production
Upload
independentCategory
view
1download
0
Brain Structure and Obesity
Cyrus A. Raji, PhD1,2,*, April J. Ho, BS*,3, Neelroop Parikshak, BS3, James T. Becker,PhD4,5,6, Oscar L. Lopez, MD6, Lewis H. Kuller, PhD7, Xue Hua, BS3, Alex D. Leow, MDPhD3, Arthur W. Toga, PhD3, and Paul M. Thompson, PhD31Department of Pathology University of Pittsburgh, School of Medicine, Pittsburgh, PA, USA2Department of Radiology University of Pittsburgh, School of Medicine, Pittsburgh, PA, USA4Department of Psychiatry University of Pittsburgh, School of Medicine, Pittsburgh, PA, USA5Department of Psychology University of Pittsburgh, School of Medicine, Pittsburgh, PA, USA6Department of Neurology University of Pittsburgh, School of Medicine, Pittsburgh, PA, USA7Department of Epidemiology, University of Pittsburgh, School of Medicine, Pittsburgh, PA, USA3Laboratory of Neuro Imaging, University of California Los Angeles, School of Medicine, LosAngeles, CA, USA
AbstractObesity is associated with increased risk for cardiovascular health problems including diabetes,hypertension, and stroke. These cardiovascular afflictions increase risk for cognitive decline anddementia, but it is unknown whether these factors, specifically obesity and type II diabetes, areassociated with specific patterns of brain atrophy. We used tensor-based morphometry (TBM) toexamine gray matter (GM) and white matter (WM) volume differences in 94 elderly subjects whoremained cognitively normal for at least 5 years after their scan. Bivariate analyses with correctionsfor multiple comparisons strongly linked body mass index (BMI), fasting plasma insulin (FPI) levels,and Type II Diabetes Mellitus (DM2) with atrophy in frontal, temporal, and subcortical brain regions.A multiple regression model, also correcting for multiple comparisons, revealed that BMI was stillnegatively correlated with brain atrophy (FDR < 5%), while DM2 and FPI were no longer associatedwith any volume differences. In an Analysis of Covariance (ANCOVA) model controlling for age,gender, and race, obese subjects with a high BMI (BMI > 30) showed atrophy in the frontal lobes,anterior cingulate gyrus, hippocampus, and thalamus compared to individuals with a normal BMI(18.5–25). Overweight subjects (BMI: 25–30) had atrophy in the basal ganglia and corona radiataof the WM. Overall brain volume did not differ between overweight and obese persons. Higher bodymass index was associated with lower brain volumes in overweight and obese elderly subjects.Obesity is therefore associated with detectable brain volume deficits in cognitively normal elderlysubjects.
Keywordsbrain atrophy; obesity; tensor-based morphometry
Please Address Correspondence to: Paul Thompson, Ph.D. Professor of Neurology Laboratory of Neuro Imaging Department ofNeurology, UCLA School of Medicine 635 Charles E. Young Drive South, Suite 225E Los Angeles, CA 90095-7332, USA Phone: (310)206-2101 Fax: (310) 206-5518 [email protected].*Cyrus Raji and April Ho contributed equally to this work.
NIH Public AccessAuthor ManuscriptHum Brain Mapp. Author manuscript; available in PMC 2011 March 1.
Published in final edited form as:Hum Brain Mapp. 2010 March ; 31(3): 353–364. doi:10.1002/hbm.20870.
NIH
-PA Author Manuscript
NIH
-PA Author Manuscript
NIH
-PA Author Manuscript

IntroductionObesity and type II, or non-insulin dependent, diabetes mellitus (DM2) are two interlinkedconditions that have reached epidemic proportions. There are currently over one billionoverweight and 300 million obese persons worldwide [World Health Organization, 2009]. Theelderly population has not been spared - 40% of men and 45% of women over age 70 areburdened either with obesity or DM2 [Ceska, 2007], increasing their risk for cardiovasculardisease and stroke [Mankovsky and Ziegler, 2004]. Obesity is also a risk factor for cognitivedecline and dementia, including Alzheimer's disease (AD) [Elias et al., 2005; Wolf et al.,2007]. This added risk may be mediated by DM2, which is associated with a higher probabilityof having AD [Irie et al., 2008; Leibson et al., 1997].
Previous studies analyzing data from the Cardiovascular Health Study-Cognition Study (CHS-CS) indicate that cerebrovascular disease, in addition to age, race, and education level, areassociated with cognition and with the development of an intermediate risk state for AD, knownas mild cognitive impairment (MCI) [Lopez et al., 2003a]. Cardiovascular risk factors for MCIincluded white matter lesions, infarcts, hypertension, diabetes mellitus, and heart disease[Lopez et al., 2003a]. Further, patients with AD have abnormally high rates of brain atrophy[Apostolova et al., 2006; Callen et al., 2001; Leow et al., 2009]. Additionally, brain atrophymay be detectable on MRI even before cognitive impairment is clinically evident, asdemonstrated in a study showing greater atrophy in asymptomatic APOE4 carriers comparedto non-carriers [Morra et al., 2009].
Obesity and DM2 may amplify the risk for dementia by worsening cerebral atrophy even incognitively intact individuals, raising their vulnerability to future AD neuropathology. Earlierstudies, mostly in subjects younger than 65, suggest that increased body tissue fat content(adiposity) is correlated with atrophy in the temporal cortex, frontal lobes, putamen, caudate,precuneus, thalamus, and white matter (WM) [Gustafson et al., 2004; Pannacciulli et al.,2006; Taki et al., 2008]. It is unknown, but of great interest, whether high tissue fat content,as measured by BMI, is associated with differences in brain structure in cognitively normalelderly.
DM2 is also associated with brain atrophy in the elderly including in the temporal lobes,hippocampus, and with greater expansion of the lateral ventricles [Korf et al., 2007]. The mostcommon explanation for these effects is WM lesions [Claus et al., 1996] and clinical strokes[Mankovsky and Ziegler, 2004]. DM2 associated brain atrophy may be secondary to increasedinsulin levels seen in the disease; higher fasting plasma insulin has been associated withcognitive deficits in elderly subjects [Yaffe et al., 2004], and promotes amyloid deposition,thus increasing risk for Alzheimer's disease [Watson et al., 2003]. So far, no other studies havecorrelated fasting plasma insulin and brain structure, even when DM2 has been examined. Aserious potential confound in such studies is the possibility of pre-symptomaticneurodegenerative changes in the elderly cohorts studied. Since brain atrophy and ADpathology can exist years before onset of clinical symptoms [Braskie et al., 2008; DeKosky etal., 2006], investigations of BMI, DM2 and brain atrophy should be done in individuals forwhom incipient AD can be ruled out as far as possible.
Obesity and DM2 may amplify risk for AD by promoting brain atrophy and thus may representpotentially critical risk factors for cognitive decline and dementia. Because these conditionsare to some extent preventable and treatable, it is important to identify specifically affectedbrain structures in non-demented elderly, both to understand the systems affected, andultimately to gauge the success of interventions to protect these areas.
We applied tensor-based morphometry (TBM), a relatively novel method [Hua et al., 2008;Thompson et al., 2000], to generate 3D maps of brain atrophy in a group of non-demented
Raji et al. Page 2
Hum Brain Mapp. Author manuscript; available in PMC 2011 March 1.
NIH
-PA Author Manuscript
NIH
-PA Author Manuscript
NIH
-PA Author Manuscript
elderly subjects recruited from the Cardiovascular Health Study-Cognition Study (CHS-CS),a community based cohort of individuals for whom extensive clinical, cognitive, and imagingdata exists [Lopez et al., 2004]. Based on longitudinal cognitive data, we selected 94 subjectswho remained cognitively normal for at least 5 years after their baseline MRI scan, thusminimizing confounding effects of early pre-clinical neurodegeneration. We regressed BMI(n=94), FPI (n=64), and DM2 diagnosis (n=94) against image-derived measures of GM andWM volume differences across subjects, to determine whether these variables were associatedwith brain atrophy. We used bivariate correlation models for an initial exploratory analysis,and then multiple regression models were used to account for potential confounders such asgender and race. We also compared brain structure between normal weight (BMI: 18.5–25),overweight (BMI: 25–30), and obese (BMI: 30+) subjects to assess if these clinical cutoffs fordefining higher adiposity are themselves associated with brain atrophy.
Materials and MethodsSubjects
The Cardiovascular Health Study Cognition Study (CHS-CS) is a continuation of the CHSDementia Study, which began in 2002–2003 to determine the incidence of dementia and mildcognitive impairment (MCI) in a population of normal and MCI subjects identified in 1998–99 in Pittsburgh [Lopez et al., 2003b]. Of the 927 participants examined in 1998–99, 532 normaland MCI subjects were available for study in 2002–03. All subjects had complete neurologicaland neuropsychological examinations in 1998–99 and 2002–03, and an MRI of the brain in1992–94, and 295 were scanned with 3-D volumetric brain MRI in 1998–99. From the lattersample, we selected 94 subjects who were cognitively normal in 1997–1998 and 2002–2003.BMI (n = 94) and fasting plasma insulin levels (n = 64) were obtained using standard CHSmethods [Fried et al., 1991; McNeill et al., 2006]. All non-imaging statistical analyses wereanalyzed using the Statistical Package for Social Science (SPSS, version 16.0, SPSS Inc.,Chicago, IL).
Type II Diabetes Mellitus (DM2)—Classification of DM2 was determined from annuallyacquired medical data and is described in greater detail in previously published work [Brachet al., 2008]. To summarize, CHS participants were classified as having DM2 if they met anyone of the following criteria: (i) use of any DM2 medications; (ii) fasting (≥ 8 hours) glucose≥ 126 mg/dL; (iii) nonfasting (< 8 hours) glucose ≥ 200 mg/dL, or (iv) oral glucose tolerancetest ≥ 200 mg/dL.
MRI acquisition and image correctionAll MRI data were acquired at the University of Pittsburgh Medical Center MR ResearchCenter using a 1.5 T GE Signa scanner (GE Medical Systems, Milwaukee, WI, LX Version).A 3D volumetric spoiled gradient recalled acquisition (SPGR) sequence was obtained for thewhole brain (TE/TR = 5/25 msec, flip angle = 40°, NEX = 1, slice thickness = 1.5 mm/0 mminterslice gap) set parallel to the AC-PC line with an in-plane acquisition matrix of 256x256image elements, 250 × 250 mm field of view and an in-plane voxel size of 0.98 × 0.98 mm.
Image pre-processingIndividual scans were linearly registered to the International Consortium for Brain Mappingstandard brain image template (ICBM-53) using a 9-parameter registration to account forglobal position and scale differences across individuals, including head size. Globally alignedimages were re-sampled in an isotropic space of 220 voxels along each axis (x, y, and z) witha final voxel size of 1 mm3.
Raji et al. Page 3
Hum Brain Mapp. Author manuscript; available in PMC 2011 March 1.
NIH
-PA Author Manuscript
NIH
-PA Author Manuscript
NIH
-PA Author Manuscript

Tensor-based morphometry (TBM) and three-dimensional Jacobian mapsTensor-Based Morphometry (TBM) detects local volumetric differences by averaging rates ofvolumetric changes (i.e., Jacobian maps), after nonlinearly aligning individual maps of changeto a minimal deformation template (MDT). An MDT for this specific study was created fromthe MRI scans of 40 normal CHS subjects to enable automated image registration, reducestatistical bias, and potentially improve the detection of statistically significant effects [Hua etal., 2008; Kochunov et al., 2002; Lepore et al., 2007]. All scans were non-linearly aligned tothe study-specific template so that they would all share a common coordinate system, and thelocal expansion factor of the 3D elastic warping transform, the Jacobian determinant, wasplotted for each subject. These 3D Jacobian maps show relative volume differences betweeneach individual and the common template, and may be used to illustrate areas of structuralvolume reduction such as atrophy of GM and WM. The CHS-MDT template was manuallyparcellated using the Brainsuite software program (http://brainsuite.usc.edu/) by a trainedanatomist to generate binary masks covering the cerebrum. Correlations between BMI andJacobian maps were evaluated at each voxel using the general linear model on a whole brainlevel.
Overview of Statistical AnalysesWe performed bivariate statistical tests as an exploratory analysis to identify if obesity and oneof its well known complications, DM2, were associated with GM and WM atrophy. We alsodid this with FPI as increased insulin levels are an early component of DM2 pathology [Ceska,2007]. We next applied multiple regression analyses to identify which one of these variablesaccounted for the most variance in our sample. We then used common clinical classificationsof normal BMI, overweight, and obesity to conduct ANCOVA analyses. The purpose of thiswas to express our BMI findings in terms that can be understood in a clinical context.
Bivariate Statistical AnalysesIn an initial exploratory analysis, we used a bivariate model to correlate Jacobian maps, whichprovide information on both tissue atrophy and CSF expansion relative to a standard template,with the possible predictor variables BMI, FPI, and DM2. We conducted separate tests ofnegative, positive, and two-tailed correlations. The statistical significance of these associationsis reported using omnibus p-values. Since our hypothesis focused on GM and WM atrophy,we report only p-values for negative associations (i.e., based on one-tailed testing). Permutationtests (with N=10,000 randomizations) [Edgington, 1995] were performed to correct formultiple comparisons. We derived corrected p-values for the overall pattern of effects, bycomputing the probability of observing the suprathreshold volume of statistics under the nullhypothesis, i.e., by chance, when covariates and groups were randomly assigned (setting avoxel-level threshold of p=0.01). Statistically significant associations were projected as mapsof p-values and correlation coefficient r-values onto the CHS-MDT using the Shiva viewer(http://www.loni.ucla.edu/Software/Software_Detail.-jsp?software_id=12) and displayedwith standard scales.
Multiple regression Statistical AnalysesAfter applying a bivariate approach in our exploratory analyses, we fitted a multipleregression statistical model to better understand which of these variables (BMI, FPI, DM2)best accounted for the variance in brain volumes in the cohort. We analyzed the Jacobian mapsusing Statistical Parametric Mapping software (SPM2, http://www.fil.ion.ucl.ac.uk/spm/),inputting BMI, DM2, age, gender, and race in the same general linear model. The influence ofFPI was separately tested in interaction models with BMI.
Raji et al. Page 4
Hum Brain Mapp. Author manuscript; available in PMC 2011 March 1.
NIH
-PA Author Manuscript
NIH
-PA Author Manuscript
NIH
-PA Author Manuscript

To better understand how the inverse associations between BMI and brain structure weredistributed in groups who were obese and to put such associations in a clinical context, we rana series of between-group ANCOVA analyses in SPM2. These included: (i) Obese versusnormal BMI groups; (ii) Overweight versus normal BMI groups; (iii) Obese versus overweightgroups. All between-group comparisons controlled for age, gender, race, and DM2. Correctionfor multiple comparisons was achieved using the False Discovery Rate (FDR) method[Genovese et al., 2002] in which findings were only declared as significant if the expected rateof false positives in the map was less than 5%. Voxel-level t-values were converted to pointbiserial correlations (r) as a measure of effect size, using the cg_spmT2x.m script in SPM2.This was done for all analyses so that the effect sizes of all results could be compared usingthe same measure. The r- values were projected onto orthogonal sections of the standard singlesubject MNI template [Holmes et al., 1998] in MRIcron(http://www.sph.sc.edu/comd/- rorden/MRIcron/) for display purposes.
ResultsSubject demographics are shown in Table I, divided into 3 BMI categories for normal,overweight and obese (BMI Range: 18.5–36.2). Only BMI and FPI levels differed between thegroups - as expected, or by definition, overweight and obese persons had higher BMI and FPIlevels than the normal BMI group (p ≤ 0.001). There was no correlation between DM2 andFPI levels (r(64) = .01,p = .92). Additionally, DM2subjects did not have higher FPI levels thannon-FPI subjects (t(62) = −.09,p = .92).
Bivariate Statistical Analyses:Potential Confounders—In our TBM maps correlating potential confounding variableswith brain structure, increasing age showed a trend-level association with lower brain volumesin this sample but this was not statistically significant (p = 0.07, corrected; permutation test).Age and BMI were not significantly correlated in our sample (r (92) = − 0.04, p = 0.90) norwas age correlated with insulin levels (r (64) = 0.06, p = 0.66) or with DM2 diagnosis (r (92)= −0.05, p = 0.61). Additionally, APOE4 genotype, which increases the risk for sporadic AD,was not related to detectable alterations in brain structure as assessed with TBM in this sample(p = 0.39, permutation test). Education, defined categorically as progression beyond highschool, was also not statistically significant in its correlation with TBM measures of GM andWM atrophy either negatively (p= .92, permutation test) or positively (p= .12, permutationtest). A clinical designation of hypertension (systolic/diastolic > 140/90 mm hg or use of anti-hypertensive medications) also had no statistically significant negative correlation with brainstructure in our sample (p= .33, permutation test).
BMI—Higher BMI was significantly correlated with lower GM and WM volumes throughoutthe brain (p < 0.001, permutation test). Figure 1a shows the correlation coefficients for theinverse association of BMI with brain structure projected onto the CHS-specific minimumdeformation template (the CHS-MDT). Blue colors represent areas of higher negativecorrelation; values typically range from −0.30 to 0.30. The areas of positive correlation in redand yellow were not statistically significant. Areas of strongest negative correlation (r ≤ −0.30)were found in the orbital frontal cortex (red arrow at x = −9, y = 57, z = 29, r = −.31), thehippocampus (gold arrows: left at x = − 31, y = −2, z = 25, r = −.32; right at x = 32, x = 9, z =18, r = −.31) and subcortical areas (white asterisks: left at x = −28, y = −14, z = 1, r = −.30;right at x = 29, y = −15, z = 1, r = −.34) including the putamen, globus pallidus, and thalamus.These results suggest atrophy in people with higher body tissue fat. Figure 1b shows thecorresponding significance (p-value) map. Darker colors indicate areas with lower p-values.
Raji et al. Page 5
Hum Brain Mapp. Author manuscript; available in PMC 2011 March 1.
NIH
-PA Author Manuscript
NIH
-PA Author Manuscript
NIH
-PA Author Manuscript
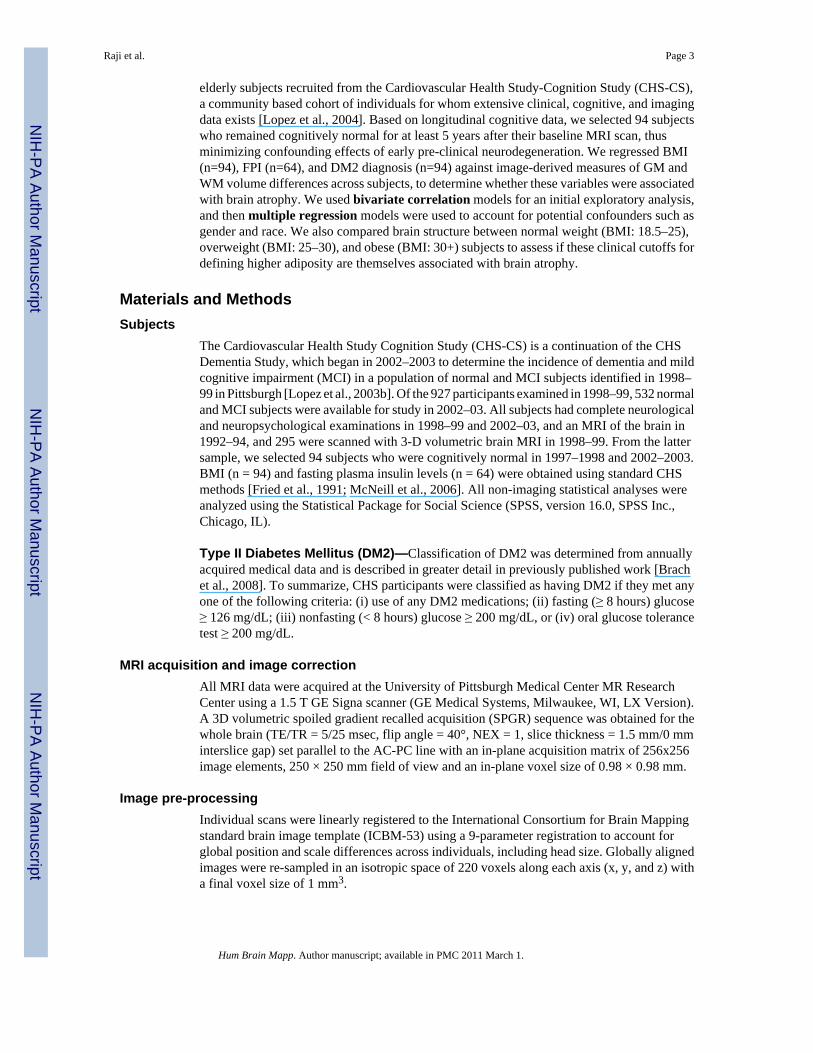
FPI—Higher FPI was associated with lower regional brain volumes (p = 0.01, permutationtest) in both GM and WM. Higher FPI were associated with brain atrophy in the frontal lobes,hippocampus, and the splenium of the corpus callosum. These results are shown in Figures 2aand 2b. Figure 2a shows the correlation coefficient map in which higher FPI is correlated withlower volumes in the splenium of the corpus callosum (red arrow: x = −3, y = 12, z = −12, r =−.27), orbital frontal cortex (orange arrow: x = −3, y = −39, z = 31, r = −.33) and hippocampus(gold arrows: left at x = −24, y = −1, z = 24, r = −.31; right at x = 31, x = 3, z = 21, r = −.33).Figure 2b shows the corresponding p-value map. These results suggest that high insulin levels,an early component of DM2 pathology, may be linked to brain atrophy in brain regions withcognitive function such as the splenium of corpus callosum (inter-hemispheric transfer of visualand other cognitive information), the orbital frontal cortex (executive function), andhippocampus (learning and memory).
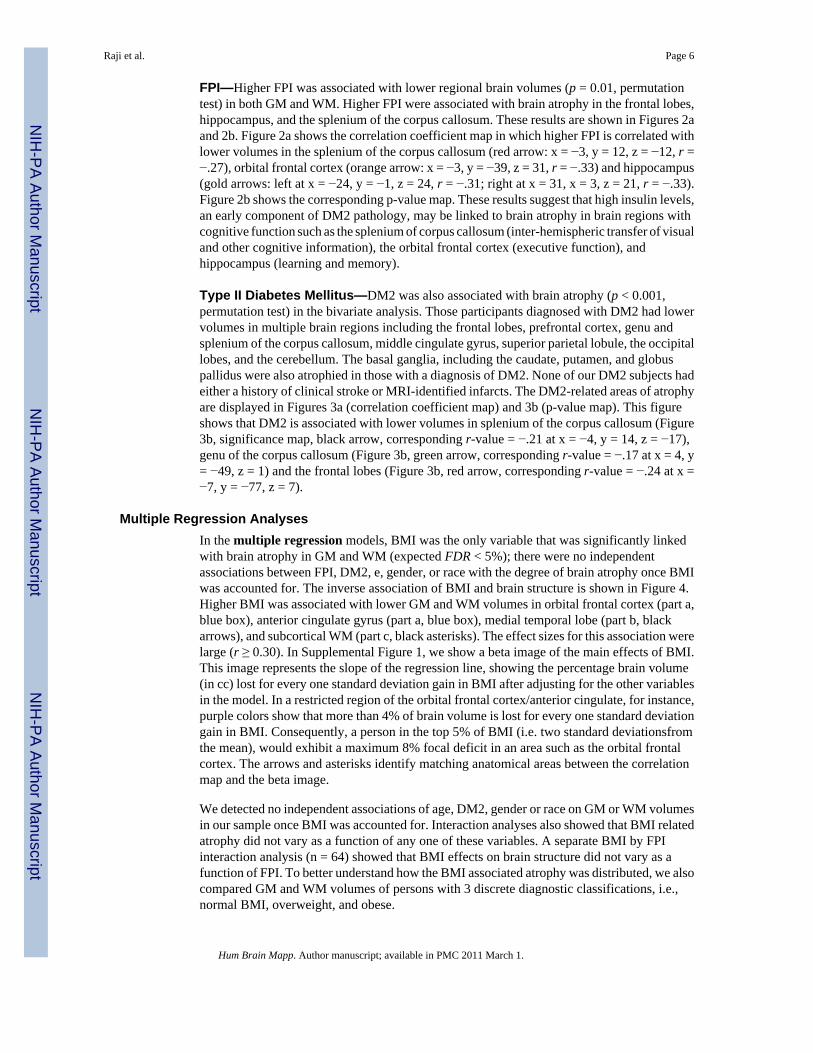
Type II Diabetes Mellitus—DM2 was also associated with brain atrophy (p < 0.001,permutation test) in the bivariate analysis. Those participants diagnosed with DM2 had lowervolumes in multiple brain regions including the frontal lobes, prefrontal cortex, genu andsplenium of the corpus callosum, middle cingulate gyrus, superior parietal lobule, the occipitallobes, and the cerebellum. The basal ganglia, including the caudate, putamen, and globuspallidus were also atrophied in those with a diagnosis of DM2. None of our DM2 subjects hadeither a history of clinical stroke or MRI-identified infarcts. The DM2-related areas of atrophyare displayed in Figures 3a (correlation coefficient map) and 3b (p-value map). This figureshows that DM2 is associated with lower volumes in splenium of the corpus callosum (Figure3b, significance map, black arrow, corresponding r-value = −.21 at x = −4, y = 14, z = −17),genu of the corpus callosum (Figure 3b, green arrow, corresponding r-value = −.17 at x = 4, y= −49, z = 1) and the frontal lobes (Figure 3b, red arrow, corresponding r-value = −.24 at x =−7, y = −77, z = 7).
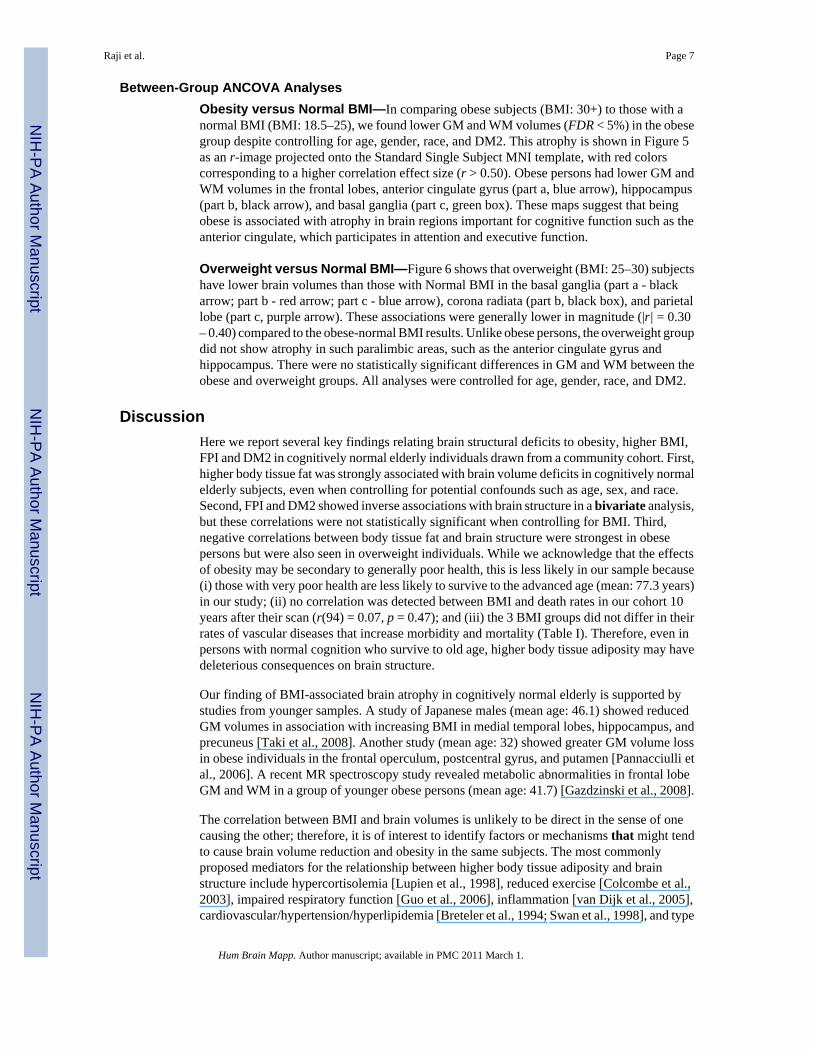
Multiple Regression AnalysesIn the multiple regression models, BMI was the only variable that was significantly linkedwith brain atrophy in GM and WM (expected FDR < 5%); there were no independentassociations between FPI, DM2, e, gender, or race with the degree of brain atrophy once BMIwas accounted for. The inverse association of BMI and brain structure is shown in Figure 4.Higher BMI was associated with lower GM and WM volumes in orbital frontal cortex (part a,blue box), anterior cingulate gyrus (part a, blue box), medial temporal lobe (part b, blackarrows), and subcortical WM (part c, black asterisks). The effect sizes for this association werelarge (r ≥ 0.30). In Supplemental Figure 1, we show a beta image of the main effects of BMI.This image represents the slope of the regression line, showing the percentage brain volume(in cc) lost for every one standard deviation gain in BMI after adjusting for the other variablesin the model. In a restricted region of the orbital frontal cortex/anterior cingulate, for instance,purple colors show that more than 4% of brain volume is lost for every one standard deviationgain in BMI. Consequently, a person in the top 5% of BMI (i.e. two standard deviationsfromthe mean), would exhibit a maximum 8% focal deficit in an area such as the orbital frontalcortex. The arrows and asterisks identify matching anatomical areas between the correlationmap and the beta image.
We detected no independent associations of age, DM2, gender or race on GM or WM volumesin our sample once BMI was accounted for. Interaction analyses also showed that BMI relatedatrophy did not vary as a function of any one of these variables. A separate BMI by FPIinteraction analysis (n = 64) showed that BMI effects on brain structure did not vary as afunction of FPI. To better understand how the BMI associated atrophy was distributed, we alsocompared GM and WM volumes of persons with 3 discrete diagnostic classifications, i.e.,normal BMI, overweight, and obese.
Raji et al. Page 6
Hum Brain Mapp. Author manuscript; available in PMC 2011 March 1.
NIH
-PA Author Manuscript
NIH
-PA Author Manuscript
NIH
-PA Author Manuscript
Between-Group ANCOVA AnalysesObesity versus Normal BMI—In comparing obese subjects (BMI: 30+) to those with anormal BMI (BMI: 18.5–25), we found lower GM and WM volumes (FDR < 5%) in the obesegroup despite controlling for age, gender, race, and DM2. This atrophy is shown in Figure 5as an r-image projected onto the Standard Single Subject MNI template, with red colorscorresponding to a higher correlation effect size (r > 0.50). Obese persons had lower GM andWM volumes in the frontal lobes, anterior cingulate gyrus (part a, blue arrow), hippocampus(part b, black arrow), and basal ganglia (part c, green box). These maps suggest that beingobese is associated with atrophy in brain regions important for cognitive function such as theanterior cingulate, which participates in attention and executive function.
Overweight versus Normal BMI—Figure 6 shows that overweight (BMI: 25–30) subjectshave lower brain volumes than those with Normal BMI in the basal ganglia (part a - blackarrow; part b - red arrow; part c - blue arrow), corona radiata (part b, black box), and parietallobe (part c, purple arrow). These associations were generally lower in magnitude (|r| = 0.30– 0.40) compared to the obese-normal BMI results. Unlike obese persons, the overweight groupdid not show atrophy in such paralimbic areas, such as the anterior cingulate gyrus andhippocampus. There were no statistically significant differences in GM and WM between theobese and overweight groups. All analyses were controlled for age, gender, race, and DM2.
DiscussionHere we report several key findings relating brain structural deficits to obesity, higher BMI,FPI and DM2 in cognitively normal elderly individuals drawn from a community cohort. First,higher body tissue fat was strongly associated with brain volume deficits in cognitively normalelderly subjects, even when controlling for potential confounds such as age, sex, and race.Second, FPI and DM2 showed inverse associations with brain structure in a bivariate analysis,but these correlations were not statistically significant when controlling for BMI. Third,negative correlations between body tissue fat and brain structure were strongest in obesepersons but were also seen in overweight individuals. While we acknowledge that the effectsof obesity may be secondary to generally poor health, this is less likely in our sample because(i) those with very poor health are less likely to survive to the advanced age (mean: 77.3 years)in our study; (ii) no correlation was detected between BMI and death rates in our cohort 10years after their scan (r(94) = 0.07, p = 0.47); and (iii) the 3 BMI groups did not differ in theirrates of vascular diseases that increase morbidity and mortality (Table I). Therefore, even inpersons with normal cognition who survive to old age, higher body tissue adiposity may havedeleterious consequences on brain structure.
Our finding of BMI-associated brain atrophy in cognitively normal elderly is supported bystudies from younger samples. A study of Japanese males (mean age: 46.1) showed reducedGM volumes in association with increasing BMI in medial temporal lobes, hippocampus, andprecuneus [Taki et al., 2008]. Another study (mean age: 32) showed greater GM volume lossin obese individuals in the frontal operculum, postcentral gyrus, and putamen [Pannacciulli etal., 2006]. A recent MR spectroscopy study revealed metabolic abnormalities in frontal lobeGM and WM in a group of younger obese persons (mean age: 41.7) [Gazdzinski et al., 2008].
The correlation between BMI and brain volumes is unlikely to be direct in the sense of onecausing the other; therefore, it is of interest to identify factors or mechanisms that might tendto cause brain volume reduction and obesity in the same subjects. The most commonlyproposed mediators for the relationship between higher body tissue adiposity and brainstructure include hypercortisolemia [Lupien et al., 1998], reduced exercise [Colcombe et al.,2003], impaired respiratory function [Guo et al., 2006], inflammation [van Dijk et al., 2005],cardiovascular/hypertension/hyperlipidemia [Breteler et al., 1994; Swan et al., 1998], and type
Raji et al. Page 7
Hum Brain Mapp. Author manuscript; available in PMC 2011 March 1.
NIH
-PA Author Manuscript
NIH
-PA Author Manuscript
NIH
-PA Author Manuscript

II diabetes mellitus [den Heijer et al., 2003; Ferguson et al., 2003]. The manifestations of brainstructural deficits in these studies were hippocampal atrophy, cortical volume loss, and WMhyperintensities. We found no interaction between BMI and DM2, so the effects of BMI areunlikely to be mediated by that mechanism in our sample. Additionally, our BMI results didnot change when controlling for hypertension and WM hyperintensities as assessed bystandardized CHS criteria [Dai et al., 2008; Yue et al., 1997]. These results may reflect asurvivor effect, as persons with both high BMI and clinically severe cerebrovascular diseaseare less likely to live to the age range of our study population (70–89 years). Additionally, wecannot rule out the possibility that BMI relationships with brain atrophy in our elderly cohortare more directly mediated through any one or any combination of the othermechanisms listedabove.
Having established that BMI is associated with brain atrophy in the elderly, we alsoacknowledge that controversy exists in the literature about how this association is influencedby sex differences. A group of elderly (70–84 years) Swedish women showed substantialtemporal lobe atrophy on computed tomography [Gustafson et al., 2004] while another studyfound BMI associated cerebral volume loss in Japanese men but not in women [Taki et al.,2008]. To determine whether or not correlations between BMI and brain structure areinfluenced by gender in our study, we modeled a BMI by gender interaction in our multipleregression analyses and did not detect a sex difference in BMI-related brain atrophy. Our studytherefore suggests that the deleterious effects of higher tissue adiposity on brain structure maybe gender independent; however, this finding merits further investigation in future studies.
Even though the unadjusted correlations of FPI, DM2, and brain atrophy were not statisticallysignificant in the adjusted models, they may merit discussion due to a growing literature onthe effects of hyperinsulinemia and DM2 on the brain. In the early stages of DM2, insulinresistance is associated with a compensatory hyperinsulinemia [Yaffe et al., 2004], and highinsulin levels are associated with cognitive impairment, even in subjects who will not developDM2 [van Oijen et al., 2008], suggesting that hyperinsulinemia can alter brain structure.Multiple mechanisms are involved in the impact of hyperinsulinemia on brain function andstructure, including vasoactive effects on cerebral arteries, neurotoxicity due to impairedclearance of amyloid from the brain and stimulation of the formation of neurofibrillary tanglesthrough advanced glycation end-product metabolism [Bian et al., 2004; Watson et al., 2003].The insulin effect is observed here in multiple areas relevant to cognitive function such as theorbital frontal cortex and the hippocampus. This is consistent with the notion thathyperinsulinemia affects brain structures involved in cognition; it may also lead to subtlecognitive decline before clear clinical symptoms of dementia are detectable [Kalmijn et al.,1995].
DM2 was associated with lower GM and WM volumes areas of cognitive relevance such asthe frontal lobes and large WM tracts (splenium of the corpus callosum), suggesting that DM2has a widespread association with brain atrophy. DM2 can reduce brain volume through aprogressive cerebrovascular process that leads to stroke and infarcts [Ikram et al., 2008;Knopman et al., 2005]. DM2 can exert damage through advanced glycation of key structuralproteins, imbalance between production and elimination of reactive oxygen species, andthrough perturbations of hexosamine and polyol pathways, causing the basement membranesof cerebral capillaries to thicken [Arvanitakis et al., 2006]. Such microvascular changes, whichfrequently occur with other obesity consequences such as hypertension, can lead to chronicsubclinical ischemia, impaired neuronal energy consumption, and atrophy in brain areas withdelicately vulnerable vasculature such as the lenticulostriate arteries of the basal ganglia[Breteler et al., 1994]. Basal ganglial findings in TBM analyses can also be noticeable due toa comparative lack of sensitivity TBM has to volume changes in the cortical surface due tosmoothness of the deformation fields and resulting partial volume effects [Hua et al, 2009;
Raji et al. Page 8
Hum Brain Mapp. Author manuscript; available in PMC 2011 March 1.
NIH
-PA Author Manuscript
NIH
-PA Author Manuscript
NIH
-PA Author Manuscript
Leow et al., 2009]. Our bivariate DM2 results are consistent with prior findings that GM andWM are affected in DM2 [Korf et al., 2007; Tiehuis et al., 2008] and with FDG-PET studiesthat showed hypometabolism in frontal, temporal, and parietal association regions, andposterior cingulate gyrus in cognitively normal subjects with mild hyperglycemia [Kawasakiet al., 2008].
The DM2 association did not survive the adjusted multiple regression models, which maybe due to the small number of DM2 subjects in the study (n = 11), that itself may be aconsequence of a survivor effect. That is, many persons with DM2 may not have lived longenough to undergo scanning as part of the CHS. This bias may have led to lack of power inthe multiple regression models and lack of a statistically significant interaction between BMIand DM2. This issue could be overcome in future studies by analyzing larger numbers ofcognitively normal elderly DM2 persons. Such work could elucidate a possible mediation rolefor DM2 with respect to obesity and brain atrophy.While it is tempting to speculate that obeseand overweight persons harbor early subclinical DM2 pathology (as reflected by obese andoverweight persons having higher FPI) and that this drives the relationship between BMI andbrain atrophy, future work would have to verify this as we found no statistically significantinteractions between BMI and DM2 or FPI.
Our findings, taken in the context of earlier studies, suggest that elderly persons with higheradiposity are at increased risk for brain atrophy and consequently dementia. Even our elderlysubjects, who were very healthy and confirmed to be cognitively stable for at least 5 years afterbaseline scanning, were afflicted with brain atrophy associated with obesity. Our resultssuggest that individuals may have a greater extent of brain atrophy due to obesity or due tofactors that promote obesity and that this atrophy may, in turn, predispose them to futurecognitive impairment and dementia. The implications of this cycle include: (i) amplifiedmorbidity/mortality in the elderly; (ii) higher health care costs due to obesity-related dementia;and (iii) emotional and other non-financial burdens on caretakers and healthcare providers.Obesity associations with brain atrophy and dementia risk therefore present a potential publichealth challenge.
This study used neuroimaging methods to explore the effects of higher BMI, insulin, and DM2in an elderly community cohort who remained cognitively normal for five years after theirscan. Such results are therefore more likely to reflect brain changes in the general elderlypopulation as they avoid the referral biases of studies that draw subjects from specialty clinics.Tensor-Based Morphometry (TBM) offers high resolution mapping of anatomical differences,offering excellent sensitivity to systematic structural differences in the brain, and lacks theselection bias of ROI tracings that examine only part of the brain. We used TBM because ofits effectiveness in analyzing volumetric group differences in the entire brain. In other typesof voxel-based studies, such as voxel-based morphometry [Ashburner and Friston, 2000], aquestion sometimes arises as to whether the findings may be attributable to imperfectregistration. This question arises because in VBM, smoothed maps of classified gray matterare automatically aligned across subjects and smoothed, and then statistical inferences are maderegarding group differences, by voxel-by-voxel subtraction of the group-averaged images. Assuch it is possible that a difference detected at any one location is due to imperfect registration[Thacker et al., 2004].
In TBM, however, the signals analyzed are based only on the registrations of the images andnot the aligned gray matter classifications, so it is not required that the gray matter be perfectlyregistered across subjects as the gray matter density is not analyzed at each stereotactic location.As such, false positive findings due to systematic group differences in registration errors areless likely. Even so, there may be false negative findings, because the power to detectmorphometric differences depends on the scale at which anatomic data can be matched by the
Raji et al. Page 9
Hum Brain Mapp. Author manuscript; available in PMC 2011 March 1.
NIH
-PA Author Manuscript
NIH
-PA Author Manuscript
NIH
-PA Author Manuscript

warping algorithm. Finer-scale morphometric differences (e.g. in the hippocampus or corticalthickness) may be better detected using other methods that model those structures explicitly.However, we preferred use of TBM over cortical pattern matching as TBM is able to processlarger numbers of subjects in faster times and requires less computational memory [Xue et al.,2008]. TBM is therefore less vulnerable to registration bias than VBM and more efficient foranalyzing larger numbers of subjects than cortical surface modeling and cortical patternmatching.
Our findings are limited by the cross-sectional design, though longitudinal follow-up was usedto inform subject selection to minimize confounding from those experiencing earlyneurodegeneration from Alzheimer's or other dementias. Our multiple regression approachaccounted for the potentially confounding effects of age, gender, and race and DM2. We didnot include APOE4 genotype in this model, as the variable showed no statistically significantrelationships in the bivariate analysis (p = 0.39, permutation test).
With an increasing number of persons becoming both obese and elderly, a detailedunderstanding of brain structural abnormalities in this group is vital. Studies such as this suggestwhy these individuals may have an increased risk for dementia. Even elderly individuals whoremained cognitively normal long after their MRI had BMI associated atrophy in brain areastargeted by neurodegeneration: hippocampus, frontal lobes, and thalamus. Such individualsmay benefit from interventions to reduce body tissue fat and experience better brain health inaging.
Supplementary MaterialRefer to Web version on PubMed Central for supplementary material.
AcknowledgmentsAlgorithm development for this study was funded by the NIA, NIBIB, and the NCRR (AG016570, EB01651,RR019771 to PT). This study was also supported by funds from the National Institute of Aging to O.L.L. (AG 20098,AG05133) and L.H.K. (AG15928) and an American Heart Association Pre-doctoral Grant to C.A.R. (0815465D). Afull list of participating CHS investigators and institutions is available at www.chs-nhlbi.org. C.A.R would like toacknowledge Dr. William E. Klunk for his mentorship and support.
ReferencesWHO. Obesity and overweight. World Health Organization; 2009.
http://www.who.int/dietphysicalactivity/publications/facts/obesity/en/. Accessed on April 19, 2009Apostolova LG, Dutton RA, Dinov ID, Hayashi KM, Toga AW, Cummings JL, Thompson PM.
Conversion of mild cognitive impairment to Alzheimer disease predicted by hippocampal atrophymaps. Arch Neurol 2006;63(5):693–9. [PubMed: 16682538]
Arvanitakis Z, Schneider JA, Wilson RS, Li Y, Arnold SE, Wang Z, Bennett DA. Diabetes is related tocerebral infarction but not to AD pathology in older persons. Neurology 2006;67(11):1960–5.[PubMed: 17159101]
Ashburner J, Friston KJ. Voxel-based morphometry – the methods. Neuroimage 2000;11:805–21.[PubMed: 10860804]
Bian L, Yang JD, Guo TW, Sun Y, Duan SW, Chen WY, Pan YX, Yeng GY, He L. Insulin-degradingenzyme and Alzheimer disease. Neurology 2004;63:241–245. [PubMed: 15277615]
Braak H, Braak E. Neuropathological stageing of Alzheimer-related changes. Acta Neuropathol1991;82:239–259. [PubMed: 1759558]
Brach JS, Talkowski JB, Strotmeyer ES, Newman AB. Diabetes Mellitus and Gait Dysfunction: PossibleExplanatory Factors. Phys Ther. 2008
Raji et al. Page 10
Hum Brain Mapp. Author manuscript; available in PMC 2011 March 1.
NIH
-PA Author Manuscript
NIH
-PA Author Manuscript
NIH
-PA Author Manuscript

Braskie MN, Klunder AD, Hayashi KM, Protas H, Kepe V, Miller KJ, Huang SC, Barrio JR, Ercoli LM,Siddarth P, et al. Plaque and tangle imaging and cognition in normal aging and Alzheimer's disease.Neurobiol Aging. 2008
Breteler MM, van Swieten JC, Bots ML, Grobbee DE, Claus JJ, van den Hout JH, van Harskamp F,Tanghe HL, de Jong PT, van Gijn J, et al. Cerebral white matter lesions, vascular risk factors, andcognitive function in a population-based study: the Rotterdam Study. Neurology 1994;44(7):1246–52. [PubMed: 8035924]
Callen DJA, Black SE, Gao F, Caldwell CB, Szalai JP. Beyond the hippocampus. MRI volumetryconfirms widespread limbic atrophy in AD. Neurology 2001;57:1669–1674. [PubMed: 11706109]
Ceska R. Clinical implications of the metabolic syndrome. Diab Vasc Dis Res 2007;4(Suppl 3):S2–4.[PubMed: 17935057]
Claus JJ, Breteler MM, hasan D, Krenning EP, Bots ML, Grobbee DE, van Swieten JC, van HarskampF, Hofman A. Vascular risk factors, atherosclerosis, cerebral white matter lesions and cerebralperfusion in a population-based study. Eur J Nucl Med 1996;23(6):675–682. [PubMed: 8662102]
Colcombe SJ, Erickson KI, Raz N, Webb AG, Cohen NJ, McAuley E, Kramer AF. Aerobic fitness reducesbrain tissue loss in aging humans. J Gerontol A Biol Sci Med Sci 2003;58(2):176–80. [PubMed:12586857]
Dai W, Lopez OL, Carmichael OT, Becker JT, Kuller LH, Gach HM. Abnormal regional cerebral bloodflow in cognitively normal elderly subjects with hypertension. Stroke 2008;39(2):349–354.[PubMed: 18174483]
DeKosky ST, Mathis CA, Price JC, Lopresti BJ, Meltzer CC, Zioko SK, Hoge JA, Tsopelas N, KlunkWE. Human amyloid-imaging studies with Pittsburgh Compound-B in Mild Cognitive Impairment(MCI): Is MCI the critical period of amyloid plaque deposition? Neurology. 2006
den Heijer T, Vermeer SE, van Dijk EJ, Prins ND, Koudstaal PJ, Hofman A, Breteler MM. Type 2 diabetesand atrophy of medial temporal lobe structures on brain MRI. Diabetologia 2003;46(12):1604–10.[PubMed: 14595538]
Edgington, ES. Randomization Tests. 3rd Edition. Marcel Dekker; New York: 1995.Elias MF, Elias PK, Sullivan LM, Wolf PA, D'Agostino RB. Obesity, diabetes and cognitive deficit: The
Framingham Heart Study. Neurobiol Aging 2005;26(Suppl 1):11–6. [PubMed: 16223549]Ferguson SC, Blane A, Perros P, McCrimmon RJ, Best JJ, Wardlaw J, Deary IJ, Frier BM. Cognitive
ability and brain structure in type 1 diabetes: relation to microangiopathy and preceding severehypoglycemia. Diabetes 2003;52(1):149–56. [PubMed: 12502506]
Fried LP, Borhani NO, Enright P, Furberg CD, Gardin JM, Kronmal RA, Kuller LH, Manolio TA,Mittelmark MB, Newman A, et al. The Cardiovascular Health Study: Design and Rationale. AnnEpidemiol 1991;1(3):263–276. [PubMed: 1669507]
Gazdzinski S, Kornak J, Weiner MW, Meyerhoff DJ. Body mass index and magnetic resonance markersof brain integrity in adults. Ann Neurol 2008;63(5):652–7. [PubMed: 18409192]
Genovese CR, Lazar NA, Nichols TE. Thresholding of statistical maps in functional neuroimaging usingthe false discovery rate. Neuroimage 2002;15(4):870–878. [PubMed: 11906227]
Guo X, Pantoni L, Simoni M, Gustafson D, Bengtsson C, Palmertz B, Skoog I. Midlife respiratoryfunction related to white matter lesions and lacunar infarcts in late life: the Prospective PopulationStudy of Women in Gothenburg, Sweden. Stroke 2006;37(7):1658–62. [PubMed: 16728692]
Gustafson D, Lissner L, Bengtsson C, Bjorkelund C, Skoog I. A 24-year follow-up of body mass indexand cerebral atrophy. Neurology 2004;63(10):1876–81. [PubMed: 15557505]
Holmes CJ, Hoge R, Collins L, Woods R, Toga AW, Evans AC. Enhancement of MR images usingregistration for signal averaging. J Comput Assist Tomogr 1998;22(2):324–33. [PubMed: 9530404]
Hua X, Leow AD, Parikshak N, Lee S, Chiang MC, Toga AW, Jack CR Jr. Weiner MW, Thompson PM.Tensor-based morphometry as a neuroimaging biomarker for Alzheimer's disease: An MRI study of676 AD, MCI, and normal subjects. Neuroimage. 2008
Ikram MA, Vrooman HA, Vernooij MW, van der Lijn F, Hofman A, van der Lugt A, Niessen WJ, BretelerMM. Brain tissue volumes in the general elderly population. The Rotterdam Scan Study. NeurobiolAging 2008;29(6):882–90. [PubMed: 17239994]
Raji et al. Page 11
Hum Brain Mapp. Author manuscript; available in PMC 2011 March 1.
NIH
-PA Author Manuscript
NIH
-PA Author Manuscript
NIH
-PA Author Manuscript

Irie F, Fitzpatrick AL, Lopez OL, Kuller LH, Peila R, Newman AB, Launer LJ. Enhanced risk forAlzheimer disease in persons with type 2 diabetes and APOE epsilon4: the Cardiovascular HealthStudy Cognition Study. Arch Neurol 2008;65(1):89–93. [PubMed: 18195144]
Kalmijn S, Fesken EM, Launer LJ, Stignen T, Kromhout D. Glucose intolerance, hyperinsulinemia, andcognitive function in a general population of eldelry men. Diabetologica 1995;38:1096–1102.
Kawasaki K, Ishii K, Saito Y, Oda K, Kimura Y, Ishiwata K. Influence of mild hyperglycemia on cerebralFDG distribution patterns calculated by statistical parametric mapping. Ann Nucl Med 2008;22(3):191–200. [PubMed: 18498034]
Knopman DS, Mosley TH, Catellier DJ, Sharrett AR. Cardiovascular risk factors and cerebral atrophyin a middle-aged cohort. Neurology 2005;65:876–881. [PubMed: 16186527]
Kochunov P, Lancaster J, Thompson P, Toga AW, Brewer P, Hardies J, Fox P. An optimized individualtarget brain in the Talairach coordinate system. Neuroimage 2002;17(2):922–7. [PubMed: 12377166]
Korf ES, van Straaten EC, de Leeuw FE, van der Flier WM, Barkhof F, Pantoni L, Basile AM, InzitariD, Erkinjuntti T, Wahlund LO, et al. Diabetes mellitus, hypertension and medial temporal lobeatrophy: the LADIS study. Diabet Med 2007;24(2):166–71. [PubMed: 17257279]
Leibson CL, Rocca WA, Hanson VA. Risk of dementia among persons with diabetes mellitus: apopulation-based cohort study. Am J Epidemiol 1997;145:301–308. [PubMed: 9054233]
Leow AD, Yanovsky I, Parikshak N, Hua X, Lee S, Toga AW, Jack CR Jr. Bernstein MA, Britson PJ,Gunter JL, et al. Alzheimer's disease neuroimaging initiative: a one-year follow up study using tensor-based morphometry correlating degenerative rates, biomarkers and cognition. Neuroimage 2009;45(3):645–55. [PubMed: 19280686]
Lepore, N.; Brun, CA.; Pennec, X.; Chou, YY.; Lopez, OL.; H.J., A.; Becker, JT.; Toga, AW.; Thompson,PM. Mean template for tensor-based morphometry using deformation tensors. In: Ayavhe, N.;Ourselin, S.; Maeder, A., editors. MICCAI2007, Part II, LNCS 4792. Springer-Verlag; BerlinHeidelberg: 2007. p. 826-833.
Lopez OL, Jagust WJ, Dulberg C, Becker JT, DeKosky ST, Fitzpatrick A, Breitner J, Lyketsos CG, JonesB, Kawas C, et al. Risk factors for mild cognitive imapirment in the Cardiovascular Health StudyCognition Study: Part 2. Arch Neurol 2003a;60:1394–1399. [PubMed: 14568809]
Lopez OL, Kuller LH, Becker JT, Jagust JW, Fitzpatrick A, Carlson M, Breimer J, Lyketsos C.Classification of vascular dementia in the Cardiovascular Health Study cognition study.Neurobiology of Aging 2004;25(Suppl 1):S483.
Lopez OL, Kuller LH, Fitzpatrick A, Ives D, Becker JT, Beauchamp N. Evaluations of dementia in thecardiovascular health cognition study. Neuroepidemiology 2003b;22(1):1–12. [PubMed: 12566948]
Lupien SJ, de Leon M, de Santi S, Convit A, Tarshish C, Nair NP, Thakur M, McEwen BS, Hauger RL,Meaney MJ. Cortisol levels during human aging predict hippocampal atrophy and memory deficits.Nature Neuroscience 1998;1(1):69–73. [see comment][erratum appears in Nat Neurosci 1998 Aug;1(4):329].
Mankovsky BN, Ziegler D. Stroke in patients with diabetes mellitus. Diabetes Metab Res Rev2004;20:268–287. [PubMed: 15250030]
Morra JH, Tu Z, Apostolova LG, Green AE, Avedissian C, Madsen SK, Parikshak N, Toga AW, JackCR Jr, Schuff N, Weiner MW, Thompson PM. Automated mapping of hippocampal atrophy in 1-year repeat MRI data from 490 subjects with Alzheimer's disease, mild cognitive impairment, andelderly controls. Neuroimage Mar;2009 45(1 Suppl):S3–15. [PubMed: 19041724]
McNeill AM, Katz R, Girman CJ, Rosamond WD, Wagenknecht LE, Barzilay JI, Tracy RP, Savage PJ,Jackson SA. Metabolic syndrome and cardiovascular disease in older people: The cardiovascularhealth study. J Am Geriatr Soc 2006;54(9):1317–24. [PubMed: 16970637]
Pannacciulli N, Del Parigi A, Chen K, Le DS, Reiman EM, Tataranni PA. Brain abnormalities in humanobesity: a voxel-based morphometric study. Neuroimage 2006;31(4):1419–25. [PubMed: 16545583]
Swan GE, DeCarli C, Miller BL, Reed T, Wolf PA, Jack LM, Carmelli D. Association of midlife bloodpressure to late-life cognitive decline and brain morphology. Neurology 1998;51(4):986–93.[PubMed: 9781518]
Taki Y, Kinomura S, Sato K, Inoue K, Goto R, Okada K, Uchida S, Kawashima R, Fukuda H. Relationshipbetween body mass index and gray matter volume in 1,428 healthy individuals. Obesity (SilverSpring) 2008;16(1):119–24. [PubMed: 18223623]
Raji et al. Page 12
Hum Brain Mapp. Author manuscript; available in PMC 2011 March 1.
NIH
-PA Author Manuscript
NIH
-PA Author Manuscript
NIH
-PA Author Manuscript

Thompson PM, Giedd JN, Woods RP, MacDonald D, Evans AC, Toga AW. Growth patterns in thedeveloping brain detected by using continuum-mechanizal tensor maps. Nature 2000;404(6774):190–193. [PubMed: 10724172]
Thacker NA, Williamson DC, Pokric M. Voxel based analysis of tissue volume from MRI data. Br JRadiol 2004;77(Spec No 2):S114–25. [PubMed: 15677353]
Tiehuis AM, van der Graaf Y, Visseren FL, Vincken KL, Biessels GJ, Appelman AP, Kappelle LJ, MaliWP. Diabetes increases atrophy and vascular lesions on brain MRI in patients with symptomaticarterial disease. Stroke 2008;39(5):1600–3. [PubMed: 18369167]
van Dijk EJ, Prins ND, Vermeer SE, Vrooman HA, Hofman A, Koudstaal PJ, Breteler MM. C-reactiveprotein and cerebral small-vessel disease: the Rotterdam Scan Study. Circulation 2005;112(6):900–5. [PubMed: 16061741]
van Oijen M, Okereke OI, Kang JH, Pollak MN, Hu FB, Hankinson SE, Grodstein F. Fasting insulinlevels and cognitive decline in older women without diabetes. Neuroepidemiology 2008;30(3):174–9. [PubMed: 18421217]
Watson GS, Peskind ER, Asthana S, Purganan K, Wait C, Chapman D, Schwartz MW, Plymate S, CraftS. Insulin increases CSF A-Beta-42 levels in normal older adults. Neurology 2003;60:1899–1903.[PubMed: 12821730]
Wolf PA, Beiser A, Elias MF, Au R, Vasan RS, Seshadri S. Relation of obesity to cognitive function:importance of central obesity and synergistic influence of concomitant hypertension. TheFramingham Heart Study. Curr Alzheimer Res 2007;4(2):111–6. [PubMed: 17430232]
Yaffe K, Blackwell T, Kanaya AM, Davidowitz N, Barrtett-Connor E, Krueger K. Diabetes, impairedfasting glucose, and development of cognitive impairment in older women. Neurology 2004;63:658–663. [PubMed: 15326238]
Yue NC, Arnold AM, Longstreth WT, Elster AD, Jungreis CA, O'Leary DH, Poirier VC, Bryan RN.Sulcal, ventricular, and white matter changes at MR imaging in the aging brain: Data from theCardiovascular Health Study. Radiology 1997;202:33–39. [PubMed: 8988189]
Raji et al. Page 13
Hum Brain Mapp. Author manuscript; available in PMC 2011 March 1.
NIH
-PA Author Manuscript
NIH
-PA Author Manuscript
NIH
-PA Author Manuscript

Figure 1.Part a shows a r-value (Pearson correlation coefficient) map highlighting the negative andpositive correlations between BMI and brain structure projected onto cardinal sections of theCardiovascular Health Study Minimal Deformation Template (CHS-MDT). Blue colors showstronger negative correlations while red and yellow colors show positive correlations; onlynegative correlations were statistically significant (p < 0.001; permutations test). An inverseassociation between BMI and brain volume is observed in orbital frontal cortex (red arrow atx = −9, y = 57, z = 29, r = −.31), the hippocampus (gold arrows: left at x = −31, y = −2, z =25, r = −.32; right at x = 32, x = 9, z = 18, r = −.31) and subcortical areas (white asterisks: leftat x = −28, y = −14, z = 1, r = −.30; right at x = 29, y = −15, z = 1, r = −.34) including theputamen, globus pallidus, and thalamus. Part b shows a p-value image of BMI main effects onbrain structure projected onto the CHS-MDT. All images are in neurological convention (lefton left). Dark colors indicate atrophy in both GM and WM; darker colors denote lower p-values.
Raji et al. Page 14
Hum Brain Mapp. Author manuscript; available in PMC 2011 March 1.
NIH
-PA Author Manuscript
NIH
-PA Author Manuscript
NIH
-PA Author Manuscript

Figure 2.Part a shows a correlation map projected onto the CHS-MDT template indicating where brainatrophy (volume reduction) is related to higher fasting plasma insulin levels. Higher FPI iscorrelated to lower volumes of the splenium of the corpus callosum (red arrow: x = −3, y = 12,z = −12, r = −.27), orbital frontal cortex (orange arrow: x = −3, y = −39, z = 31, r = −.33) andhippocampus (gold arrows: left at x = −24, y = −1, z = 24, r = −.31; right at x = 31, x = 3, z =21, r = −.33). Part b shows the corresponding significance maps.
Raji et al. Page 15
Hum Brain Mapp. Author manuscript; available in PMC 2011 March 1.
NIH
-PA Author Manuscript
NIH
-PA Author Manuscript
NIH
-PA Author Manuscript

Figure 3.The r-value image in part a shows the negative correlation between a categorical diagnosis ofDM2 and atrophy in GM and WM. DM2 is associated with lower volumes in splenium of thecorpus callosum Figure 3b, significance map, black arrow, corresponding r-value = −.21 at x= −4, y = 14, z = −17), genu of the corpus callosum (Figure 3b, green arrow, correspondingr-value = −.17 at x = 4, y = −49, z = 1) and the frontal lobes (Figure 3b, red arrow, correspondingr-value = −.24 at x = −7, y = −77, z = 7). All results in this image were projected onto the CHS-MDT.
Raji et al. Page 16
Hum Brain Mapp. Author manuscript; available in PMC 2011 March 1.
NIH
-PA Author Manuscript
NIH
-PA Author Manuscript
NIH
-PA Author Manuscript

Figure 4.This figure shows map of correlation values (r-value map) projected onto the Standard SingleSubject MNI brain template for display purposes. The correlation shown is between higherBMI and GM/WM atrophy controlling for age, gender, race and DM2. Hotter colors denotestronger correlation effect sizes, which range from 0 to 0.4. Higher BMI was associated withlower GM and WM volumes in orbital frontal cortex (part a, blue box), anterior cingulate gyrus(part a, blue box), medial temporal lobe (part b, black arrows), and subcortical WM (part c,black asterisks).
Raji et al. Page 17
Hum Brain Mapp. Author manuscript; available in PMC 2011 March 1.
NIH
-PA Author Manuscript
NIH
-PA Author Manuscript
NIH
-PA Author Manuscript

Figure 5.Correlation map (r-value image) effect sizes for a comparison of 14 obese persons (BMI > 30)to 29 normal weight persons (18.5–25). Obese persons had lower GM and WM volumes in thefrontal lobes, anterior cingulate gyrus (part a, blue arrow), hippocampus (part b, black arrow),and basal ganglia (part c, green box). Correlation coefficients range from 0 to 0.5.
Raji et al. Page 18
Hum Brain Mapp. Author manuscript; available in PMC 2011 March 1.
NIH
-PA Author Manuscript
NIH
-PA Author Manuscript
NIH
-PA Author Manuscript

Figure 6.Maps of correlation coefficients are shown for a group comparison of 51 overweight persons(BMI: 25–30) versus 29 normal weight persons (18.5–25). Atrophy in the overweight groupis seen in the basal ganglia (part a – black arrow; part b – red arrow; part c – blue arrow), coronaradiata (part b, black box), and parietal lobe (part c, purple arrow). Correlations range from 0to 0.5.
Raji et al. Page 19
Hum Brain Mapp. Author manuscript; available in PMC 2011 March 1.
NIH
-PA Author Manuscript
NIH
-PA Author Manuscript
NIH
-PA Author Manuscript

NIH
-PA Author Manuscript
NIH
-PA Author Manuscript
NIH
-PA Author Manuscript
Raji et al. Page 20
Table I
Subject Characteristics. The groups studied differed only in BMI and FPI (p < 0.01).
Variable Normal BMI (18.5–25) Overweight (25–29) Obese (30+) T-test(t, p)/χ2
Sample Size (n) 29 51 14 ----------
BMI 22.5 ± 1.9 27.5 ± 1.4 32.9 ± 2.5 −15.5, < 0.001*
−13.2, < 0.001**
−10.5, < 0.001***
Age 77.5 ± 4.0 77.2 ± 2.6 76.9 ± 2.8 0.49, 0.63*
0.35, 0.73**
−0.40, 0.69***
Female Gender 48% (14) 53% (27) 64% (9) 0.98, 0.61
Education (Grade12 +)
69% (20) 67% (34) 50% (7) 1.65, 0.44
Non-White 17% (5) 10% (5) 14% (2) 0.95, 0.62
MRI Infarcts (47) 24% (7) 23% (12) 7% (1) 1.97, 0.37
Type II diabetesmellitus
3% (1) 16% (8) 14% (2) 2.79. 0.25
WMH Grade >3(48)
28% (8) 28% (14) 29% (4) 0.001, 0.98
Hypertension 28% (8) 31% (16) 43% (6) 1.03, 0.59
APOE 4 genotype 29% (7) 24% (11) 7% (1) 2.55, 0.28
Fasting PlasmaInsulin (n = 64)
10.1 ± 2.8 14.6 ± 6.3 15.4 ± 4.4 −4.1, < 0.001*
−3.1, 0.001**
0.37, 0.71***
*Normal BMI compared to Obese on t-test
**Normal BMI compared to Overweight on t-test
***Overweight Compared to Obese on t-test
Hum Brain Mapp. Author manuscript; available in PMC 2011 March 1.
Copyright © 2022 FDOKUMEN