Hyperinsulinemia Drives Diet-Induced Obesity Independently of Brain Insulin Production
40
Cell Metabolism Article Hyperinsulinemia Drives Diet-Induced Obesity Independently of Brain Insulin Production Arya E. Mehran, 1,2 Nicole M. Templeman, 1,2 G. Stefano Brigidi, 1 Gareth E. Lim, 1,2 Kwan-Yi Chu, 1,2 Xiaoke Hu, 1,2 Jose Diego Botezelli, 1,2 Ali Asadi, 1,2 Bradford G. Hoffman, 2 Timothy J. Kieffer, 1,2 Shernaz X. Bamji, 1 Susanne M. Clee, 1 and James D. Johnson 1,2, * 1 Department of Cellular and Physiological Sciences 2 Department of Surgery University of British Columbia, Vancouver, BC V6T 1Z3, Canada *Correspondence: [email protected] http://dx.doi.org/10.1016/j.cmet.2012.10.019 SUMMARY Hyperinsulinemia is associated with obesity and pancreatic islet hyperplasia, but whether insulin causes these phenomena or is a compensatory response has remained unsettled for decades. We examined the role of insulin hypersecretion in diet- induced obesity by varying the pancreas-specific Ins1 gene dosage in mice lacking Ins2 gene expres- sion in the pancreas, thymus, and brain. Age-depen- dent increases in fasting insulin and b cell mass were absent in Ins1 +/ :Ins2 / mice fed a high-fat diet when compared to Ins1 +/+ :Ins2 / littermate controls. Remarkably, Ins1 +/ :Ins2 / mice were completely protected from diet-induced obesity. Genetic prevention of chronic hyperinsulinemia in this model reprogrammed white adipose tissue to express uncoupling protein 1 and increase energy expenditure. Normalization of adipocyte size and activation of energy expenditure genes in white adipose tissue was associated with reduced inflam- mation, reduced fatty acid spillover, and reduced hepatic steatosis. Thus, we provide genetic evidence that pathological circulating hyperinsulinemia drives diet-induced obesity and its complications. INTRODUCTION Obesity is a worldwide epidemic with increasing prevalence and is a major independent risk factor for heart disease, hyper- tension, stroke, diabetes, cancer, and many other diseases (Despre ´ s and Lemieux, 2006; Olshansky et al., 2005). The molec- ular causes of obesity remain largely unexplained, despite the identification of common gene variants that contribute modest risk (Frayling et al., 2007). Obesity research has benefited from animal models in which genetic and environmental factors can be manipulated in ways that are impossible with humans. For example, invertebrates with reduced insulin or insulin signaling have leaner, smaller bodies, along with increased life span (Broughton et al., 2008; Li et al., 2003). Studies in mammals point to cell type-specific roles for the insulin receptor in diet-induced obesity. Fat-specific insulin receptor knockout mice are pro- tected from diet-induced obesity and have extended longevity (Blu ¨ her et al., 2002; Katic et al., 2007), whereas elimination of insulin receptors from some, but not all, brain regions increases food intake and obesity (Bru ¨ ning et al., 2000; Ko ¨ nner and Bru ¨ n- ing, 2012). The interpretation of studies involving insulin receptor ablation is confounded by compensation between tissues and disruption of insulin-like growth factor signaling involving hybrid receptors (Blu ¨ her et al., 2002; Kitamura et al., 2003). Moreover, knockout of the insulin receptor, by definition, induces tissue- specific insulin resistance, which alone may promote hypergly- cemia and insulin hypersecretion (Bru ¨ ning et al., 1998; Kitamura et al., 2003). Previous studies have been unable to determine the role of hyperinsulinemia on obesity in the absence of insulin resistance and glucose intolerance. It is a widely held view that hyperinsulinemia simply represents a compensation for systemic insulin resistance. Nevertheless, the cause-and-effect relationships between hyperinsulinemia, insulin resistance, obesity, and type 2 diabetes remain unre- solved. Reports of elevated insulin secretion at birth, and of insulin hypersecretion preceding obesity or insulin resistance, are inconsistent with hyperinsulinemia being merely an adaptive response (Genuth et al., 1971; Gray et al., 2010; Ishikawa et al., 1998; Kitamura et al., 2003; Koopmans et al., 1997; Le Stunff and Bougne ` res, 1994; Lustig, 2006; Odeleye et al., 1997; Shanik et al., 2008; Zimmet et al., 1991). Furthermore, blocking hyperin- sulinemia with drugs including diazoxide or octreotide can cause weight loss in humans (Alemzadeh et al., 1998; Lustig et al., 2006), although interpretation of these studies is complicated by direct effects of these treatments on multiple tissues, in- cluding white fat (Shi et al., 1999) and brain (Pocai et al., 2005). Thus, although circumstantial evidence points to a role for hyper- insulinemia in the development of obesity, to date, there has been no direct evidence that circulating insulin itself drives obesity in mammals. To directly test this hypothesis, one would ideally genetically lower the amount of pancreatic insulin avail- able without crossing the threshold that would result in diabetes. Members of the insulin gene family are evolutionarily con- served products of neurosecretory cells (Broughton et al., 2008; Li et al., 2003). In mammals, insulin is recognized for its critical metabolic roles, whereas the insulin-like growth factors are most often associated with tissue growth. Evidence from our group and others points to important growth factor roles of insulin (Blu ¨ her et al., 2002; Johnson and Alejandro, 2008; Okada Cell Metabolism 16, 723–737, December 5, 2012 ª2012 Elsevier Inc. 723
Transcript of Hyperinsulinemia Drives Diet-Induced Obesity Independently of Brain Insulin Production

Cell Metabolism
Article
Hyperinsulinemia Drives Diet-Induced ObesityIndependently of Brain Insulin ProductionArya E. Mehran,1,2 Nicole M. Templeman,1,2 G. Stefano Brigidi,1 Gareth E. Lim,1,2 Kwan-Yi Chu,1,2 Xiaoke Hu,1,2
Jose Diego Botezelli,1,2 Ali Asadi,1,2 Bradford G. Hoffman,2 Timothy J. Kieffer,1,2 Shernaz X. Bamji,1 Susanne M. Clee,1
and James D. Johnson1,2,*1Department of Cellular and Physiological Sciences2Department of Surgery
University of British Columbia, Vancouver, BC V6T 1Z3, Canada
*Correspondence: [email protected]
http://dx.doi.org/10.1016/j.cmet.2012.10.019
SUMMARY
Hyperinsulinemia is associated with obesity andpancreatic islet hyperplasia, but whether insulincauses these phenomena or is a compensatoryresponse has remained unsettled for decades. Weexamined the role of insulin hypersecretion in diet-induced obesity by varying the pancreas-specificIns1 gene dosage in mice lacking Ins2 gene expres-sion in the pancreas, thymus, and brain. Age-depen-dent increases in fasting insulin and b cell masswere absent in Ins1+/�:Ins2�/� mice fed a high-fatdiet when compared to Ins1+/+:Ins2�/� littermatecontrols. Remarkably, Ins1+/�:Ins2�/� mice werecompletely protected from diet-induced obesity.Genetic prevention of chronic hyperinsulinemia inthis model reprogrammed white adipose tissue toexpress uncoupling protein 1 and increase energyexpenditure. Normalization of adipocyte size andactivation of energy expenditure genes in whiteadipose tissue was associated with reduced inflam-mation, reduced fatty acid spillover, and reducedhepatic steatosis. Thus, we provide genetic evidencethat pathological circulating hyperinsulinemia drivesdiet-induced obesity and its complications.
INTRODUCTION
Obesity is a worldwide epidemic with increasing prevalence
and is a major independent risk factor for heart disease, hyper-
tension, stroke, diabetes, cancer, and many other diseases
(Despres and Lemieux, 2006; Olshansky et al., 2005). Themolec-
ular causes of obesity remain largely unexplained, despite the
identification of common gene variants that contribute modest
risk (Frayling et al., 2007). Obesity research has benefited from
animal models in which genetic and environmental factors can
be manipulated in ways that are impossible with humans. For
example, invertebrates with reduced insulin or insulin signaling
have leaner, smaller bodies, along with increased life span
(Broughton et al., 2008; Li et al., 2003). Studies in mammals point
to cell type-specific roles for the insulin receptor in diet-induced
Cell M
obesity. Fat-specific insulin receptor knockout mice are pro-
tected from diet-induced obesity and have extended longevity
(Bluher et al., 2002; Katic et al., 2007), whereas elimination of
insulin receptors from some, but not all, brain regions increases
food intake and obesity (Bruning et al., 2000; Konner and Brun-
ing, 2012). The interpretation of studies involving insulin receptor
ablation is confounded by compensation between tissues and
disruption of insulin-like growth factor signaling involving hybrid
receptors (Bluher et al., 2002; Kitamura et al., 2003). Moreover,
knockout of the insulin receptor, by definition, induces tissue-
specific insulin resistance, which alone may promote hypergly-
cemia and insulin hypersecretion (Bruning et al., 1998; Kitamura
et al., 2003). Previous studies have been unable to determine the
role of hyperinsulinemia on obesity in the absence of insulin
resistance and glucose intolerance.
It is a widely held view that hyperinsulinemia simply represents
a compensation for systemic insulin resistance. Nevertheless,
the cause-and-effect relationships between hyperinsulinemia,
insulin resistance, obesity, and type 2 diabetes remain unre-
solved. Reports of elevated insulin secretion at birth, and of
insulin hypersecretion preceding obesity or insulin resistance,
are inconsistent with hyperinsulinemia being merely an adaptive
response (Genuth et al., 1971; Gray et al., 2010; Ishikawa et al.,
1998; Kitamura et al., 2003; Koopmans et al., 1997; Le Stunff and
Bougneres, 1994; Lustig, 2006; Odeleye et al., 1997; Shanik
et al., 2008; Zimmet et al., 1991). Furthermore, blocking hyperin-
sulinemia with drugs including diazoxide or octreotide can cause
weight loss in humans (Alemzadeh et al., 1998; Lustig et al.,
2006), although interpretation of these studies is complicated
by direct effects of these treatments on multiple tissues, in-
cluding white fat (Shi et al., 1999) and brain (Pocai et al., 2005).
Thus, although circumstantial evidence points to a role for hyper-
insulinemia in the development of obesity, to date, there has
been no direct evidence that circulating insulin itself drives
obesity in mammals. To directly test this hypothesis, one would
ideally genetically lower the amount of pancreatic insulin avail-
able without crossing the threshold that would result in diabetes.
Members of the insulin gene family are evolutionarily con-
served products of neurosecretory cells (Broughton et al.,
2008; Li et al., 2003). In mammals, insulin is recognized for its
critical metabolic roles, whereas the insulin-like growth factors
are most often associated with tissue growth. Evidence from
our group and others points to important growth factor roles of
insulin (Bluher et al., 2002; Johnson and Alejandro, 2008; Okada
etabolism 16, 723–737, December 5, 2012 ª2012 Elsevier Inc. 723

A B
C
D
E
F
G
Cell Metabolism
Insulin Gene Dosage Controls Mammalian Obesity
724 Cell Metabolism 16, 723–737, December 5, 2012 ª2012 Elsevier Inc.

Cell Metabolism
Insulin Gene Dosage Controls Mammalian Obesity
et al., 2007). Mice and rats have two insulin genes, producing
hormones with similar peptide sequences. Deletion of both
rodent insulin genes causes death from neonatal diabetes (Duvil-
lie et al., 1997). It has been reported that ablation of either Ins1 or
Ins2 from the mouse genome does not result in significant
changes in glucose homeostasis in young mice fed a normal
diet, implying compensation or redundancy with regards to
metabolism (Duvillie et al., 1997; Leroux et al., 2001). However,
there is evidence that the two rodent insulin genes have specific
tissue distribution patterns suggesting some nonoverlapping
functions (Kojima et al., 2004; Moore et al., 2001; Pugliese
et al., 1997). Most studies have shown that Ins1 is restricted to
pancreatic b cells, where it contributes to approximately one-
third of the expressed and secreted insulin (Hay and Docherty,
2006). Ins2 is the ancestral gene, with gene structure, parental
imprinting, and a broad tissue distribution similar to human INS
(Deltour et al., 1993; Hay and Docherty, 2006).
In the present study, we took advantage of the pancreas-
specific expression of the murine Ins1 gene to demonstrate
that diet-induced pancreatic insulin hypersecretion promotes
obesity and its associated complications in this model. Mice
made genetically incapable of high-fat diet-induced fasting hy-
perinsulinemia had increased levels of Ucp1 in white adipose
tissue and increased energy expenditure. These results have
profound implications for our understanding of the role of insulin
in obesity and reveal unappreciated in vivo connections between
fasting hyperinsulinemia and adipocyte reprogramming. As the
human INS gene is subject to genetic variation (Le Stunff et al.,
2001), our results suggest a mechanism for establishing obesity
susceptibility to dietary stress.
RESULTS
Ins2, but Not Ins1, Is Expressed in the Central NervousSystemWhile it is clear that pancreatic b cells are the only significant
source of circulating hormonal insulin, it is known that some cells
outside the pancreas express modest amounts of Ins2/INS. For
example, Ins2 production in the thymus is widely accepted to
play a role in immune tolerance (Fan et al., 2010; Pugliese et al.,
1997). Over 80 reports have suggested that insulin can be
produced in the brain (de la Monte and Wands, 2008; Deltour
Figure 1. Central Nervous System Expression of Ins2, but Not Ins1
(A) Analysis of Ins2 and Ins1 mRNA expression (relative to the control gene) in th
C57Bl6/J mice.
(B) No significant compensatory upregulation of either insulin gene in Ins1�/�:Ins2the qRT-PCR. Further validation of the specificity of mouse Ins1 and Ins2 Taqman
found in the Supplemental Information.
(C) Ins1 and Ins2 gene expression assessed by Taqman real-time qPCR in arrayed
postnatal brain.
(D) Distribution of neurons expressing insulin protein in the hippocampus of 12-we
antibodies were validated with Ins1�/�:Ins2+/+ and Ins1+/+:Ins2�/� mice (see the
(E) Close-up view of individual insulin neurons in the rostral cortex.
(F) Colocalization of insulin protein in cell bodies and axons (green), with b-gala
neurons (i), anterior olfactory nucleus neurons (ii), and cerebellar Purkinje neuron
(G) Confocal imaging of morphologically identified neurons showing punctate
endoplasmic reticulum (ER; green; iii) and in the somas of 7 day in vitro cultured ra
EGFP transfection was used to outline the boundaries andmorphological health of
neurons and staining was absent in neurons from Ins1�/�:Ins2�/� mice (see the
See also Figures S1 and S2.
Cell M
et al., 1993; Devaskar et al., 1993; Giddings et al., 1985; Havran-
kova et al., 1978; Lamotte et al., 2004;Wicksteed et al., 2010) (see
the Supplemental Information available online). Deep-
sequencing data from over 200 tissue libraries revealed broad
expression of Ins2, but not Ins1, in multiple regions of the devel-
opingandpostnatal brain (FigureS1A). Theobservation of central
nervous system (CNS) Ins2 prompted us to employ Taqman
quantitative PCR (qPCR) primers, validated in Ins2�/� or Ins1�/�
islets (Figure S2A), to elucidate the expression pattern of insulin
in the brain. We observed brain expression of Ins2 messenger
RNA (mRNA), significantly above the background seen in Ins2�/�
brain tissue (Figures 1A and 1B). Ins1mRNAwas absent accord-
ing to these criteria. Using an array with complementary DNA
(cDNA) from multiple brain regions, we found Ins2 was broadly
expressed (most prominently in the hippocampus), while Ins1
was virtually absent (Figure 1C). Consistent with a local role for
neuronal insulin, quantitative analysis (Figure S2B) confirmed
that Ins2 expression in hippocampal neurons is much lower
than in pancreatic islets, which must deliver insulin to the entire
body. A similar RT-qPCR analysis of human brain cDNA array
confirmed INS expression in several regions, including hippo-
campus (Figure S1B). Chromatin immunoprecipitation with
antibodies to methylated histones, marking regions of active
transcription, followed by direct sequencing pointed to active
transcription around the Ins2 gene, but not the Ins1 gene, in
cerebral cortex and cerebellum (Figure S1C). Both genes had
activity marks in pancreatic islets (Figure S1C). Interestingly,
the active regions near the Ins2 locus inbrain appear tobedistinct
from those in islets. These observations are consistent withmany
reports that Ins2 promoters, but not Ins1 promoters, exhibit
robust activity in the brain (e.g., Wicksteed et al., 2010).
We studied the localization of insulin protein throughout the
brain using antibodies validated in Ins2�/� or Ins1�/� islets and
Ins1�/�:Ins2�/� neurons (Figure S2C–S2E). Specific insulin im-
munoreactivity and C-peptide immunoreactivity were observed
in the hippocampus, anterior olfactory nucleus, cerebral cortex,
cerebellar Purkinje neurons, and other discrete nuclei (Figures
1D–1G). We also took advantage of the fact that the Ins2�/�
mice used in our studies had LacZ knocked into in their endog-
enous Ins2 locus (Figure S2E). We found that the same adult
neurons that were positive for bGal also stained robustly for
insulin protein in Ins1�/�:Ins2+/�(bgal) mice (Figure 1F). To rule
e hypothalamus, posterior brain, and anterior brain of 6-month-old wild-type
+/+ or Ins1+/+:Ins2�/� mice. These mice also provide ideal negative controls for
real-time qPCR primer/probe sets in Ins1 or Ins2 knockout mouse islets can be
cDNA frommultiple murine brain regions at multiple stages of developing and
ek-old mice (i). Hippocampal section stained without primary antibody (ii). The
Supplemental Information).
ctosidase knocked into the endogenous Ins2 locus (nucleus; red) in cortical
s (iii) from 12-week-old Ins1�/�:Ins2+/�(bGal) mice.
and reticular C-peptide-2 immunoreactivity (red; ii) within calnexin-positive
t neonatal hippocampal neurons (approximately half of the cells were positive).
individual neurons (i). Identical results were observedwithmouse hippocampal
Supplemental Information). Error bars represent standard error of the mean.
etabolism 16, 723–737, December 5, 2012 ª2012 Elsevier Inc. 725

B
H
0
50
100
150
200
250
300
350
400
Isle
t Ins1
mR
NA
(C
t)
*
*
Insulin 2
Pancreas Pancreas
Brain
Thymus
Insulin 1 W
ildty
pe
Ins1
+/+ :Ins2
-/-
Ins1
+/- :Ins2-
/-
Pancreas
Pancreas
A
E
0.0
0.2
0.4
0.6
0.8
1.0
1.2
1.4
Bet
a C
ell A
rea
(%)
*
D Ins1+/+:Ins2-/- HFD Ins1+/-:Ins2-/- HFD Ins1+/+:Ins2-/- Ins1+/-:Ins2-/-
0
0.25
0.5
0.75
1
PC
NA
: Act
in (a
u)
PCNA Actin
G
0 0.002 0.004 0.006 0.008 0.01
0.012 0.014 0.016 0.018
TUN
EL+
bet
a-ce
lls/is
let a
rea
0
5x10⁻⁶
4x10⁻⁶
3x10⁻⁶
2x10⁻⁶
1x10⁻⁶
* F
% P
CN
A+
beta
-cel
ls
I
*
Ins1+/+:Ins2-/- Control Diet Ins1+/-:Ins2-/- Control Diet Ins1+/+:Ins2-/- High Fat Diet Ins1+/-:Ins2-/- High Fat Diet
Control Diet
Control Diet
High Fat Diet
High Fat Diet
0
50
100
150
200
250
300
Isle
t Ins
ulin
Con
tent
(ng/
ml)
C
0.0
0.2
0.4
0.6
0.8
1.0
1.2
1.4
0 5 10 15 20 25 30 35 40 45 50 55
*
*
*
Fast
ing
Insu
lin (n
g/m
l)
Age (weeks)
Ins1+/+:Ins2-/- Control Diet Ins1+/-:Ins2-/- Control Diet Ins1+/+:Ins2-/- High Fat Diet Ins1+/-:Ins2-/- High Fat Diet
**
+/-
+/+
Cell Metabolism
Insulin Gene Dosage Controls Mammalian Obesity
726 Cell Metabolism 16, 723–737, December 5, 2012 ª2012 Elsevier Inc.

Cell Metabolism
Insulin Gene Dosage Controls Mammalian Obesity
out the possibility that insulin immunoreactivity arose from insulin
taken up into specific neurons via endocytosis, we cultured
hippocampal neurons in defined insulin-free media. Using an
antibody that recognizes mouse C-peptide 2, but not mouse
C-peptide 1 (Figure S2C), we identified endoplasmic reticulum
(ER) staining in cultured neurons (Figure 1G). The diffuse staining
pattern of insulin distribution, also observed with an antibody to
fully processed mature insulin, suggests a constitutive release
expected for a local trophic factor. Together, these data demon-
strate that Ins2 is produced in themammalian brain by a subset of
neurons, a feature conserved from lower animals (Rulifson et al.,
2002). Previous reports of insulin produced in the brain were
highly controversial because it was difficult to distinguish low
levels of insulin from background signals in the absence of ideal
negative controls (Ins2�/� and/or Ins1�/�mice) and positive con-
trols [Ins1�/�:Ins2+/�(bgal) mice]. The differential expression of two
murine insulin genesand the availability of Ins1and Ins2 knockout
mice presented a unique opportunity to specifically dissect the
role of circulating Ins1 derived from the pancreas.
Reduced Ins1 Prevents Diet-Induced b Cell Growth andFasting HyperinsulinemiaTo test the hypothesis that peripheral, pancreas-derived insulin
drives diet-induced obesity, we endeavored to selectively lower
circulating insulin by generating mice null for the brain-ex-
pressed Ins2 gene while modulating the gene dosage of
pancreas-specific Ins1 (Figure 2A). It was critical to first test
whether removal of one Ins1 allele in Ins2�/� mice would result
in a proportional reduction in Ins1 mRNA and circulating insulin.
Indeed, Ins1+/�:Ins2�/� mice exhibited an �50% reduction in
islet Ins1 mRNA compared to Ins1+/+:Ins2�/� mice (Figure 2B).
Analysis of insulin secretion and insulin content in islets in young
mice revealed some posttranscriptional compensation (Figures
2C and S4). However, by 1 year, insulin immunostaining, fasting
circulating insulin, and glucose-stimulated insulin secretion were
all markedly decreased in mice with reduced Ins1 gene dosage
(Figures 2D, 2I, and 3A).
Although the Ins1+/+:Ins2�/� control mice used in these exper-
iments have been reported to be indistinguishable from wild-
type mice on a control diet (Duvillie et al., 1997; Leroux et al.,
2001), it was essential to determine whether they would respond
to a high-fat diet with a similar hyperinsulinemia and b cell mass
increase seen in other control strains (Okada et al., 2007). Rela-
tive to chow-fed controls, Ins1+/+:Ins2�/�mice fed a 58% fat diet
since weaning developed age-dependent, high-fat diet-induced
fasting hyperinsulinemia by 7 weeks of age (Figures 2I and S4A).
Figure 2. Reduced Insulin Gene Dosage Prevents b Cell Expansion an
(A) Experimental design to test the role of circulating insulin on diet-induced obe
(B) qRT-PCR analysis of Ins1 mRNA in islets from 12-week-old mice (n = 3–5).
(C) Islet insulin content from 30 hand picked islets from 8-week-old mice (n = 3).
(D) Representative staining using anti-insulin (green) and anti-glucagon (red) an
evidence of islet autoimmunity.
(E) Ins1+/�:Ins2�/� mice failed to increase b cell mass in response to a high-fat d
(F) Cell death was assessed by measuring the number of TUNEL-positive b cells
(G and H) Proliferation was estimated by quantification of the percentage of PCNA
of PCNA immunoblot in islets isolated from 12-week-old mice (n = 4–6).
(I) Age-dependent high-fat diet-induced fasting hyperinsulinemia was prevented
*Significant difference between high-fat diet (HFD) mice (p < 0.05). **Significant dif
See also Figures S3 and S4.
Cell M
Persistent hyperinsulinemia was dependent on the expression of
both Ins1 alleles.
The fasting hyperinsulinemia in high fat-fed Ins1+/+:Ins2�/�
mice was associated with an �2 fold increase in fractional
b cell area, compared with mice fed a control diet (Figure 2E).
However, in high fat-fed Ins1+/�:Ins2�/� mice, b cell area was
equivalent to control diet levels, pointing to a critical role for basal
circulating insulin in this process (Figure 2E). Analysis of pro-
grammed cell death and proliferation in b cells from Ins1+/�:Ins2�/� mice suggested that circulating insulin had gene
dosage-dependent antiapoptotic and proproliferative autocrine
effects in the context of a high-fat diet (Figures 2F–2H). These
observations complement studies showing that mice lacking
insulin receptors on their b cells fail to increase b cell mass due
to defective proliferation and increased apoptosis (Okada
et al., 2007). Thus, long-term diet-induced fasting hyperinsuline-
mia was prevented in Ins1+/�:Ins2�/�mice (Figure 2I), which was
associated with a lack of diet-induced b cell expansion (Fig-
ure 2E). In other words, we generated mice that were genetically
incapable of high-fat diet-induced fasting hyperinsulinemia. We
were unable to observe high-fat diet-induced hyperinsulinemia
or high-fat diet-induced obesity in female Ins2�/� mice regard-
less of their Ins1 gene dosage (Figure S3). Male mice were
used for all subsequent studies designed to examine the effects
of diet on obesity.
Glucose Homeostasis in Mice with Reduced InsulinGene DosageSomewhat surprisingly, we observed only transient differences
in fasting glucose between Ins1+/�:Ins2�/� and Ins1+/+:Ins2�/�
mice, despite a modest reduction in glucose-stimulated insulin
release (Figures 3A, 3B, and S4B). Significant worsening of
glucose homeostasis in Ins1+/�:Ins2�/� mice was only observed
in a small subset of high fat-fedmice (twomice) during the period
of rapid somatic growth around 11 weeks of age and was not
observed later in life or on the chow diet (Figure 3C). Insulin
sensitivity was generally similar between the genotypes and
diets (Figure 3D). Therefore, comparing Ins1+/+:Ins2�/� mice
and Ins1+/�:Ins2�/� mice enabled us to test the effects of genet-
ically reduced pancreatic insulin secretion on obesity, in the
absence of sustained hyperglycemia or insulin resistance.
Reduced Ins1 Gene Dosage Prevents Diet-InducedObesityWe directly tested the hypothesis that pancreatic insulin hyper-
secretion is required for diet-induced obesity by tracking body
d Sustained Hyperinsulinemia on a High-Fat Diet
sity in the absence of Ins2.
tibodies in pancreas tissue sections from 12-month-old mice. We found no
iet (n = 3).
in pancreatic sections from 8-week-old mice (n = 3-5).
-positive b cells in pancreata from 8-week-old mice (n = 3) and by performance
in Ins1+/�:Ins2�/� mice (n = 6–16).
ference between control diet (CD)mice (p < 0.05). Error bars represent the SEM.
etabolism 16, 723–737, December 5, 2012 ª2012 Elsevier Inc. 727

Figure 3. Glucose Homeostasis and Insulin Sensitivity in Mice with Reduced Insulin Gene Dosage
(A) Insulin release in response to intraperitoneal injection of 18% glucose in 53-week-old mice.
(B) Four-hour fasted glucose levels measured weekly over the first year of life.
(C) Intraperitoneal glucose tolerance was impaired in young, but not old Ins1+/�:Ins2�/� mice. Insets show the area under the curve (AUC).
(D) Insulin tolerance was statistically similar between all groups at all ages studied. Insets show the area over the curve (AOC).
All data are represented as means of at least five male mice in each group at all time points. *Statistical significance (p < 0.05). Error bars represent the SEM. See
also Figures S3 and S4.
Cell Metabolism
Insulin Gene Dosage Controls Mammalian Obesity
weight of Ins1+/+:Ins2�/� mice and Ins1+/�:Ins2�/� mice, fed a
control diet or an obesigenic high-fat diet (Figure 4A). We ob-
served robust adult-onset obesity in male high fat-fed Ins1+/+:
Ins2�/� control mice with all the expected hallmarks, including
increased fat-to-lean ratio measured by nuclear magnetic reso-
nance (NMR), increased fat pad weight, increased size of indi-
vidual adipocytes, and increased inflammation markers in white
adipose tissue (Figure 4). In striking contrast, Ins1+/�:Ins2�/�
728 Cell Metabolism 16, 723–737, December 5, 2012 ª2012 Elsevier
mice were completely protected from diet-induced adult-onset
weight gain for the duration of these 1-year-long experiments
(Figure 4A). The high-fat diet-induced increase in epididymal
fat pad weight was completely prevented (Figure 4B), resulting
in reduced circulating leptin (Figure 4C). Whole-body growth,
measured by tibia length, was independent of Ins1 gene dosage
(Figure 4D). Weights of other organs were not statistically
different between any of the groups (Figure 4E). Even at ages
Inc.

Cell Metabolism
Insulin Gene Dosage Controls Mammalian Obesity
prior to the significant divergence of body weight between high
fat-fed groups, fasting insulin and body weight were positively
correlated between mice within genotypes (Figure S4). Together
with the results above, these data suggest that circulating Ins1 is
an adipocyte-specific and b cell-specific growth factor.
Next, we sought to determine the physiological mechanisms
accounting for the lack of high-fat diet-induced adiposity in the
nonhyperinsulinemic Ins1+/�:Ins2�/� mice (Figures 4F and 4G).
Using indirect calorimetry, we found increased energy expendi-
ture preceding the onset of differences in body weight (Fig-
ure 4H). The timing of this observation was important because
the normalization of energy expenditure between mice with dif-
ferent levels of adiposity is complicated (Himms-Hagen, 1997).
Notably, we did not observe significant differences in food
intake, physical activity, or respiratory quotient (Figures 4I–4L).
Collectively, these in vivo data suggest that high-fat diet-induced
hyperinsulinemia promotes adult adipocyte hypertrophy and
nutrient storage. The loss of one Ins1 allele was sufficient to
increase energy expenditure and prevent adiposity in the context
of a high-fat diet.
Ins1 Is a Negative Regulator of Uncoupling, Lipolytic,and Inflammatory Genes in White FatWe predicted changes in energy expenditure and fat cell growth
over this long time scale would be associated with stable alter-
ations in gene expression patterns and cellular reprogramming,
rather than only acute signaling events. Indeed, while hyperinsu-
linemic Ins1+/+:Ins2�/� mice exhibited marked adipocyte hyper-
trophy, white adipose tissue from high fat-fed Ins1+/�:Ins2�/�
mice appeared similar to that from mice fed a control diet
(Figure 5A). To determine the molecular mechanisms underlying
the protective effects of reduced circulating insulin, we designed
a Taqman real-time PCR miniarray of 45 key metabolic, inflam-
matory, and insulin target genes (see the Supplemental Informa-
tion for the rationale behind each gene choice). In white adipose
tissue, there were few differences between the two groups of
mice on the low-fat diet, although insulin receptor mRNA was
significantly decreased in Ins1+/� mice (Figure 5B). In keeping
with the lean phenotype and increased energy expenditure, we
observed a gene expression pattern associated with energy
expenditure and lipid mobilization, including increased expres-
sion of uncoupling proteins and Pnpla2 (adipose triglyceride
lipase), in white adipose tissue from high fat-fed Ins1+/�:Ins2�/�mice versus high fat-fed Ins1+/+:Ins2�/�mice (Figure 5B).
The increase in Ucp1 gene expression in white adipose tissue
isolated from high fat-fed Ins1+/�:Ins2�/� mice suggested brown
adipose tissue-like features similar to what have been observed
in other lean models (Leonardsson et al., 2004). Ppargc1a
(Pgc1a) and Pparg, positive regulators of Ucp1 and energy
expenditure, were also upregulated at the mRNA level in white
adipose tissue from high fat-fed Ins1+/�:Ins2�/� mice. Further-
more, we observed downregulation of factors previously shown
to promote obesity and adipocyte differentiation in the white
adipose of high fat-fed Ins1+/�:Ins2�/�mice, including the insulin
target Egr2 (Krox20) and Nrip1 (RIP140), a corepressor that
suppresses Ucp1 expression in white adipose tissue (Leonards-
son et al., 2004) (Figure 5B). Interestingly, none of the uncoupling
proteins were differentially expressed between brown adipose
tissue of high fat-fed Ins1+/�:Ins2�/� mice and high fat-fed
Cell M
Ins1+/+:Ins2�/� mice (Figure S5A). We observed a tendency for
a gene expression profile promoting energy expenditure in skel-
etal muscle from high fat-fed Ins1+/�:Ins2�/� mice, although
these effects were not statistically significant with this sample
size (Figure S5B).
We selected a few differentially expressed genes with known
roles in insulin signaling and/or adipocyte differentiation for addi-
tional analysis at the protein level. Immunocytochemistry
showed what appeared to be enhanced Ucp1 protein in white
adipose tissue from high fat-fed Ins1+/�:Ins2�/� mice compared
with high fat-fed Ins1+/+:Ins2�/� littermates (Figure 5C). A signif-
icant increase in Ucp1 protein levels in high fat-fed Ins1+/�:Ins2�/� mice was confirmed and quantified by immunoblot of
white adipose tissue (Figure 5D). We also observed elevated
protein levels of Pparg and Srebf1/SREBP-1c (Figure 5E), point-
ing to the upstream transcriptional control of this process by
insulin. Immunoblot also confirmed a significant decrease in
Egr2 protein in high fat-fed Ins1+/�:Ins2�/� mice (Figure 5F), mir-
roring the effects on its mRNA and suggesting a possible ‘‘dedif-
ferentiation’’ of white adipocytes. These quantitative data clearly
demonstrate that the pancreas-specific Ins1 gene, and by exten-
sion the circulating insulin hormone, influences the expression of
a large number of key metabolic genes in white adipose tissue,
specifically in the context of a high-fat diet.
It is well established that obesity and insulin resistance are
associated with chronic low-grade inflammation of multiple
tissues, including white fat. However, the cause-and-effect rela-
tionships between these phenomena and hyperinsulinemia have
not been fully established. Our qRT-PCR analysis revealed a
broad reduction in inflammatory markers, including Tnfa and
Emr1 (F4/80; macrophages) in white adipose tissue from high
fat-fed Ins1+/�:Ins2�/� mice compared with high fat-fed Ins1+/+:
Ins2�/� littermates. These data suggest that insulin regulates
adipose inflammation either directly (e.g., bymodulating immune
cells), or indirectly (e.g., via the effects on adipocyte size/stress).
Reduced Pancreatic Ins1 Protects Mice from LipidSpillover and Fatty LiverIns1+/�:Ins2�/� mice were protected from elevated circulating
free fatty acids when compared to their high fat-fed Ins1+/+:
Ins2�/� littermate controls (Figure 6A). In accordance with the
lack of lipid spillover, livers of high fat-fed Ins1+/�:Ins2�/� mice
were protected fromhigh-fat diet-induced hepatic steatosis (Fig-
ure 6B) and associated stress pathway activation (Figure 6C).
The increase in liver triglyceride content in high fat-fed control
Ins1+/+:Ins2�/� mice was significantly reduced in Ins1+/�:Ins2�/�
mice, while significant differences in cholesterol were not
observed (Figures 6D and 6E). qRT-PCR analysis of liver showed
that most of the differences were related to diet (reduced Ddit3,
Pparg, Ptpn1, Il6, Igfbp1, Egr1, and Egr2; increased Glut4,
Srebf1, Ppargc1a, and Pck1), rather than between genotypes
on the high-fat diet (Figure 6C). There were also notable differ-
ences in some inflammation markers in bulk liver tissue (Fig-
ure 6C). The reduction in the stress marker Atf3 (Figure 6C)
prompted us to evaluate markers of oxidative stress and lipid
peroxidation in this tissue, but the levels of protein carbonyl
and 4-hydroxynonenal (HNE) were not different between high
fat-fed Ins1+/�:Ins2�/�mice and their high fat-fed Ins1+/+:Ins2�/�
littermates (Figure 6C). Our data support a paradigm whereby
etabolism 16, 723–737, December 5, 2012 ª2012 Elsevier Inc. 729

10
15
20
25
30
35
40
3 10 17 24 31 38 45 52
Bod
y W
eigh
t (g)
Age (weeks)
0.0
0.1
0.2
0.3
0.4
0.5
Fat:L
ean
0.0
0.5
1.0
1.5
2.0
Fat P
ad (g
)
Ins1+/+:Ins2-/- CD Ins1+/-:Ins2-/- CD Ins1+/+:Ins2-/- HFD Ins1+/-:Ins2-/- HFD
A
G
B
H
*
*
*
0 5
10 15 20 25 30 35
Food
Inta
ke (K
Cal
)
I
0.0
0.5
1.0
1.5
2.0
Tibi
al L
engt
h (c
m)
D
F
0
2
4
6
8
10
12
14
Lept
in (n
g/m
L)
#
C
0.0
0.5
1.0
1.5
Liver Pancreas Heart Brain Kidney Spleen Thymus
Wei
ght (
g)
E
0
10
20
30
40
Bod
y W
eigh
t (g)
0
200
400
600
800
1000
1200
Day Night
Act
ivity
(cou
nts)
0.800 0.810 0.820 0.830 0.840 0.850 0.860 0.870
Day Night
RE
R
J
LK
Hours
Ins1+/+:Ins2-/- Control Diet Ins1+/-:Ins2-/- Control Diet Ins1+/+:Ins2-/- High Fat Diet Ins1+/-:Ins2-/- High Fat Diet
Ins1+/+:Ins2-/- HFD Ins1+/-:Ins2-/- HFD
Figure 4. Mice with Reduced Fasting Insulin Are Protected from High Fat-Induced Obesity as a Result of Increased Energy Expenditure
(A) Body weight tracked over 1 year, in multiple independent cohorts (assessed over several years; n = 5–11).
(B) Epididymal fat pad weight in 1-year-old mice (n = 5–11).
(C) Circulating leptin levels (n = 3).
(D and E) Tibial length and organ weight were measured at 1 year as indexes of somatic growth (n = 5–11).
(F and G) NMR spectroscopy (n = 3).
Cell Metabolism
Insulin Gene Dosage Controls Mammalian Obesity
730 Cell Metabolism 16, 723–737, December 5, 2012 ª2012 Elsevier Inc.

Cell Metabolism
Insulin Gene Dosage Controls Mammalian Obesity
high fat consumption leads to chronic basal insulin hypersecre-
tion (perhaps via direct insulinotropic effects of fatty acids),
which then increases adipocyte size and lipid accumulation in
adipose tissue. The spillover of free fatty acids subsequently
leads to steatosis and ER stress in the liver and other tissues,
which may eventually result in pathway- and/or tissue-specific
insulin resistance when combined with additional factors (Fig-
ure 7). The combination of these factors, initiated by hyperinsu-
linemia-induced obesity, could predispose individuals to type 2
diabetes.
DISCUSSION
Pancreatic Insulin Hypersecretion Drives Fat Storageand Prevents Fat Burning in AdipocytesA canon of diabetes and obesity research is that obesity-associ-
ated insulin resistance causes hyperinsulinemia because the
pancreatic b cells are hyperstimulated to release more insulin,
although the physiological mechanism for this hyperstimulation
remains unclear since it often occurs prior to hyperglycemia.
Our data demonstrate that prevention of high-fat diet-induced
hyperinsulinemia through partial ablation of the pancreas-
specific Ins1 gene protects mice from diet-induced obesity
and associated complications by upregulating genes that mobi-
lize lipids and increase mitochondrial uncoupling while downre-
gulating genes required for differentiation in white adipose
tissue. This would be expected to produce small amounts of
heat at the expense of maximal calorie storage in white fat.
Specifically, we propose a model for diet-induced obesity
whereby hyperinsulinemia normally negatively regulates white
adipose tissue Ucp1 expression, via a gene network involving
Pparg and Nrip1, to suppress energy expenditure (Figure 7).
This idea is consistent with the general anabolic role for insulin
and the observation that reducing circulating insulin with diazo-
xide promotes weight loss in obese mice via an increase in basal
metabolic rate (Alemzadeh et al., 2008). Our in vivo data place
the pancreas-specific Ins1 gene upstream of obesity, and estab-
lish the causality of circulating hyperinsulinemia in adult fat
growth in the absence of insulin resistance (Figure 7A). In our
study, increased basal insulin secretion occurred without sus-
tained hyperglycemia. Indeed, both insulin resistance and insulin
hypersecretion can occur in normoglycemic humans, preceding
obesity and insulin resistance (Genuth et al., 1971; Gray et al.,
2010; Ishikawa et al., 1998; Kitamura et al., 2003; Koopmans
et al., 1997; Le Stunff et al., 2001; Odeleye et al., 1997). It is
notable that early hyperinsulinemia was the strongest predictor
of type 2 diabetes in a 24 year study (Dankner et al., 2009). Insulin
resistance and obesity can also be uncoupled in human lipody-
strophies (Hegele, 2003) and in many mouse models (Bruning
et al., 1998; Chen et al., 2010; El-Haschimi et al., 2003; Vijay-Ku-
mar et al., 2010; Wang et al., 2010). Further evidence for the
concept that hyperinsulinemia can be a primary factor in the
metabolic syndrome in humans can be found in the increased
risk of childhood weight gain observed in individuals with
(H and I) Energy expenditure was measured by indirect calorimetry in high fat-fe
gain (n = 5).
(J–L) We did not note significant differences in activity, food intake, or respirator
*Statistical significance (p < 0.05). Error bars represent the SEM. See also Figure
Cell M
elevated pancreatic insulin production caused by inheritance
of class I alleles of the INS gene (Le Stunff et al., 2001). Genetics
and epigenetics likely combine with environmental and dietary
factors that stimulate insulin hypersecretion early in life,
including in utero, to promote fat growth and eventually compli-
cations including type 2 diabetes. The therapeutic potential of
drugs that inhibit circulating insulin has previously been demon-
strated (Alemzadeh et al., 2008; Alemzadeh et al., 1998; Lustig
et al., 2006), but here we provide insight into the molecular
mechanism of these clinical observations. Our study provides
additional rationale for dietary and therapeutic efforts to partially
block insulin hypersecretion or peripheral insulin action
in specific tissues to combat obesity. However, insulin levels
must always be high enough to sustain glucose homeostasis.
Diet-Induced b Cell Expansion Is Regulated by InsulinIn VivoElegant studies have suggested that insulin receptor signaling
modulates postnatal b cell mass expansion in response to
high-fat diet (Okada et al., 2007), but this concept has remained
controversial, in part due to the ability of insulin receptor manip-
ulations to influence IGF1 signaling and to cause compensatory
changes in other tissues. The lack of b cell mass ‘‘compensa-
tion’’ in Ins1+/�:Ins2�/� mice provides direct in vivo evidence
that insulin itself is critical for b cell growth and survival under
conditions of nutrient stress. Importantly, our results demon-
strate that b cell proliferation is induced in the absence of sus-
tained hyperglycemia in vivo. In the past, we have used in vitro
cultures of dispersed primary islet cells, a system where insulin
and glucose can be clamped independently of each other, to
demonstrate that insulin, but not glucose, stimulates b cell prolif-
eration (Beith et al., 2008; Johnson et al., 2006). We have also
shown that glucose-stimulated ERK activation is proportionally
reduced in islets with reduced insulin gene dosage or treated
with somatostatin to block insulin exocytosis (Alejandro et al.,
2010; Alejandro et al., 2011), strongly suggesting that glucose
modulates b cell fate mainly via local autocrine/paracrine insulin
signaling. Indeed, >80% of the effects of glucose on b cell gene
expression are lost in b cells with insulin receptor knockdown
(Ohsugi et al., 2005). Together, many lines of evidence from
multiple groups support the concept that insulin acts via insulin
receptors to mediate the compensatory increase in b cell mass
and basal insulin release in the context of high-fat diet. This
has implications for efforts to increase b cell mass in both type
1 and type 2 diabetes.
Tissue-Specific Roles for Ins1 and Ins2: Relevance toHuman INSInsulin is the most studied hormone in biology, yet the present
study provides much needed integrated insight into its localiza-
tion and physiological functions in vivo. Clinically, insulin insuffi-
ciency resulting from a loss of greater than �80% of functional
b cell mass results in diabetes, promoting the prevailing mindset
that insulin’s roles are almost exclusively positive. Here we show
d mice at 20 weeks of age (green star in A), just prior to differences in weight
y quotient (n = 3–5).
s S3 and S4.
etabolism 16, 723–737, December 5, 2012 ª2012 Elsevier Inc. 731

Figure 5. Molecular Mechanisms Leading to Protection from Diet-Induced Obesity in Ins1+/–:Ins2–/– Mice
(A) Hematoxylin and eosin-stained epididymal fat pad (n = 5–11).
(B) Taqman real-time qPCR quantification of 45 genes in epididymal white adipose tissue from 1-year-old mice. Results are sorted according to the magnitude of
the difference between high fat-fed Ins1+/�:Ins2�/�mice and high fat-fed Ins1+/+:Ins2�/� littermates (#p < 0.05). Geneswith a large negative relative expression are
colored red; genes with increased expression are green. $Significant difference between diets in the Ins1+/�:Ins2�/�mice. &Significant difference between diets in
the Ins1+/+:Ins2�/� mice. *Significant difference between genotypes on the control diet. Data are from 1-year-old mice (n = 5–11), unless otherwise specified.
(C) Ucp1 immunocytochemistry in white adipose tissue from 1-year-oldmice. The inset shows results from the identical staining protocol on brown adipose tissue
sections.
Cell Metabolism
Insulin Gene Dosage Controls Mammalian Obesity
732 Cell Metabolism 16, 723–737, December 5, 2012 ª2012 Elsevier Inc.

Cell Metabolism
Insulin Gene Dosage Controls Mammalian Obesity
that insulin hypersecretion from b cells can be maladaptive.
Similarly, elegant studies in flies and worms have demonstrated
that deleting insulin genes, or blocking elements of the insulin
signaling pathway, dramatically increases life span and prevents
diseases associated with adiposity (Broughton et al., 2008; Li
et al., 2003). These model systems also clearly indicate that indi-
vidual insulin-like peptide genes have distinct functions despite
signaling through a single receptor (Broughton et al., 2008; Li
et al., 2003). In rodents, the Ins1 and Ins2 genes are under
partially distinct regulation (Alejandro et al., 2011; Hay and Doch-
erty, 2006). Previously, it has also been shown that the mouse
Ins1 and Ins2 genes have opposing roles on type 1 diabetes inci-
dence in theNODmouse due to the induction of thymic tolerance
by Ins2 (Fan et al., 2009; Moriyama et al., 2003), but the possi-
bility that they have distinct roles in obesity had not been
examined.
In the present study, we elucidated the tissue-specific
patterns of Ins1 and Ins2 expression. Usingmultiple approaches,
we found that Ins2 is present in CNS neurons, at both the mRNA
and protein levels. Uniquely, we present both negative and posi-
tive controls, arguing against qPCR or staining artifacts. We also
find distinct active chromatin marks on the Ins2 gene in the CNS
and provide RNA sequencing data. Given the conservation
between the rodent Ins2 gene and the human INS gene, we
were not surprised to find additional evidence for insulin produc-
tion in the human brain. In both species, we find robust insulin
expression in the hippocampus, pointing to potential roles in
learning and memory. It is interesting to note the recent interest
in clinical trials using nasal insulin to replace this putative central
neurotrophic factor for the treatment of Alzheimer’s disease. A
complete understanding of the role of Ins2 produced in the
CNS will require brain-specific Ins2 knockout mice.
We predict that insulin produced locally in specific brain
regions will have potent effects on food intake (Hallschmid
et al., 2012). Based on recent studies, we expect that some
insulin circuits will promote food intake, while others will
suppress it, and we predict that distinct populations of insulin
neurons will be differentially susceptible to insulin resistance
(Konner and Bruning, 2012; Rother et al., 2012). It should be
noted that our data do not address what may be an important
role of peripheral insulin acting on the brain in the lean phenotype
of our mice. Within and outside the brain, we predict that the
source of the insulin is critical for its effect on obesity.
ConclusionsWe generated mice that were genetically incapable of age-
dependent, diet-induced fasting hyperinsulinemia, and thereby
demonstrated that circulating insulin plays a causal role in
obesity in this model (Figure 7). We identify circulating insulin
as a critical regulator of Ucp1 expression in white adipose tissue
and whole-body energy expenditure. We find that increased fat
burning in white adipose tissue is associated with reduced lipid
(D) Immunoblot for Ucp1 in white adipose tissue. Lane 1 is brown adipose tissue
and Ponceau staining (pink). Quantification bars are the normalized ratio to b-ac
(E) Immunoblots of Pparg and Srebf1.
(F) Immunoblot analysis of Egr2.
*p < 0.05 versus high fat-fed Ins1+/+:Ins2�/� littermates (n = 4–5). Error bars repr
Cell M
accumulation in liver. Our data provide strong rationale to inves-
tigate approaches to limit peripheral hyperinsulinemia for the
prevention and treatment of obesity in mammals.
EXPERIMENTAL PROCEDURES
Experimental Animals and Glucose Homeostasis
Animal protocols were approved by the University of British Columbia Animal
Care Committee in accordance with national and international guidelines.
Ins1�/� and Ins2�/� mice were generated by the group of J. Jami (INSERM,
France), and their baseline phenotype described elsewhere (Duvillie et al.,
1997). C57Bl6/J mice (Jackson Laboratory, Bar Harbor, ME) were employed
for some studies, as indicated. Male mice were used unless otherwise noted.
Groups of mice were randomly divided into two diet groups at weaning
(3 weeks), and fed a control diet (25% fat) or a high-fat diet (58% fat). Additional
details of the diet composition can be found in the Supplemental Information.
Body weight, fasting glucose, glucose tolerance, and insulin tolerance were
examined after 4 hr fasts according to standard methods we have previously
described in more detail (Alejandro et al., 2011). The insulin-positive area was
used as an index of b cell mass, as described previously (Alejandro et al.,
2011). The cell death was assayed with the Roche TUNEL kit (Alejandro
et al., 2011). Serum insulin levels were measured with an ultrasensitive ELISA
kit (80-INSMSU-E01; ALPCO Diagnostics, Salem, NH). Leptin levels were
measured with mouse leptin ELISA kit (number 90030; CrystalChem, Downers
Grove, IL).
In Vivo Metabolic Analysis
PhenoMaster metabolic cages (TSE Systems, Chesterfield, MO) were used
for indirect calorimetry, activity, body weight, and food intake studies in
accordance with the manufacturer’s instructions. After 52 weeks of age,
mice were scanned for whole-body fat to lean mass ratio via NMR Spec-
troscopy at the 7T MRI Research Center (University of British Columbia,
Vancouver, Canada). Circulating fatty acids were measured with the Wako
NEFA kit.
Gene Expression and Protein Analysis
Mouse and human cDNA arrays, from tissue collected under IRB protocols,
were purchased from Origene (Rockville, MD). Gene expression analysis
was conducted with custom arrays of Taqman Real-Time PCR Assays (Life
Technologies, Burlington, Canada). Immunoblotting and staining were con-
ducted according to standard protocols (Alejandro et al., 2011). Brains were
frozen prior to cryosectioning, while all other tissues were fixed in 4% parafor-
maldehyde. Paraffin block sectioning and hemotoxyn and eosin staining were
conducted by the Histology Core at the Child and Family Research Institute
(Vancouver, Canada). The following antibodies were used in immunofluores-
cence studies of neurons and b cells: polyclonal rabbit anti-C-peptide-2 (Milli-
pore), monoclonal mouse anti-mature insulin (Biodesign), and polyclonal
guinea pig anti-(pan)insulin (Sigma). Uncoupling protein 1 protein levels were
quantified with antibodies from Santa Cruz (catalog number sc-6829), with
brown adipose tissue used as a positive control. Imageswere taken with either
an Olympus FV1000 confocal microscope or a Zeiss 200mmicroscope equip-
ped with deconvolution software (Slidebook, Intelligent Imaging Innovartions,
Denver, CO).
Statistical Analysis
Studies were repeated at least three times. All results are expressed asmean ±
SEM (indicated by error bars). Statistical analyses were performedwith Graph-
pad Prism 5 or Microsoft Excel. A student’s t test or AVOVA (Tukey’s) were
used as appropriate. A p value < 0.05 was considered significant.
(positive control). Equal protein loading was confirmed by b-actin immunoblot
tin (n = 4–5).
esent the SEM. See also Figure S5.
etabolism 16, 723–737, December 5, 2012 ª2012 Elsevier Inc. 733

Figure 6. Mice with Reduced Ins1 Are Protected from Lipid Spill Over, Fatty Liver and ER Stress
(A) Circulating free fatty acids levels.
(B) Low and high magnification of hematoxylin and eosin-stained liver.
(C) Taqman real-time qPCR quantification of 49 genes in liver (n = 3–7 individual mice). Results are sorted as in Figure 3. #p < 0.05 (t test) between high fat-fed
Ins1+/�:Ins2�/� mice versus high fat-fed Ins1+/+:Ins2�/� mice. $Significant difference between diets within the Ins1+/�:Ins2�/� mice. &Differences between
Ins1+/�:Ins2�/� mice versus Ins1+/+:Ins2�/� mice on the control diet.
(D and E) Liver triglyceride and cholesterol measurements (n = 3–5).
(F and G) Markers of oxidative stress, protein carbonyl and 4-hydroxynonenal NHE, were measured in livers (n = 4–6). All data are from 1-year-old mice.
Error bars represent the SEM. See also Figure S5.
Cell Metabolism
Insulin Gene Dosage Controls Mammalian Obesity
734 Cell Metabolism 16, 723–737, December 5, 2012 ª2012 Elsevier Inc.

Figure 7. Revisiting the Current Model of
Obesity and Type 2 Diabetes
(A) The most widely accepted model of the path-
ogenesis of obesity and type 2 diabetes posits that
a high-fat diet leads to obesity and insulin
resistance (there is debate about the relative order
and causality of these). In this widely held view,
insulin resistance then leads to hyperinsulinemia,
which is followed by b cell exhaustion, and then
type 2 diabetes. The accepted model is incom-
patible with our results that put the insulin hyper-
secretion genetically upstream of obesity.
(B) Our data support a model whereby insulin
levels must be kept low to maintain energy ex-
penditure in white adipose tissue via the expres-
sion of Ucp1. Our data do not address the order
of subsequent events after obesity (outside the
yellow box), such as insulin resistance and/or
type 2 diabetes, since they were not observed in
our studies. In other words, the effects of insulin
gene dosage on obesity are independent of sus-
tained changes in glucose homeostasis or insulin
resistance.
Cell Metabolism
Insulin Gene Dosage Controls Mammalian Obesity
SUPPLEMENTAL INFORMATION
Supplemental Information includes Supplemental Experimental Procedures
and five figures and can be found with this article online at http://dx.doi.org/
10.1016/j.cmet.2012.10.019.
ACKNOWLEDGMENTS
We thank Jacques Jami (INSERM) for giving us the insulin knockout mice. We
thank Jake Kushner (Baylor College of Medicine) for designing the Ins1 and
Ins2 Taqman primer sets and helpful discussions. We thank Sarah Gray
(University of Northern British Columbia), Rohit Kulkarni (Harvard University),
and Kenneth S. Polonsky (University of Chicago) for helpful comments on
early drafts of the manuscript. J.D.J. was supported by the JDRF, Canadian
Diabetes Association (CDA), Canadian Institutes for Health Research
(CIHR), and the Michael Smith Foundation for Health Research (MSFHR).
Cell M
T.J.K. was supported by CDA, CIHR, and MSFHR. S.M.C. was supported
by the CDA and the Heart and Stroke Foundation of BC and the Yukon.
N.M.T. was supported by the Natural Sciences and Engineering Research
Council of Canada.
Received: January 27, 2011
Revised: August 26, 2012
Accepted: October 31, 2012
Published: December 4, 2012
REFERENCES
Alejandro, E.U., Kalynyak, T.B., Taghizadeh, F., Gwiazda, K.S., Rawstron,
E.K., Jacob, K.J., and Johnson, J.D. (2010). Acute insulin signaling in pan-
creatic beta-cells is mediated by multiple Raf-1 dependent pathways.
Endocrinology 151, 502–512.
etabolism 16, 723–737, December 5, 2012 ª2012 Elsevier Inc. 735

Cell Metabolism
Insulin Gene Dosage Controls Mammalian Obesity
Alejandro, E.U., Lim, G.E., Mehran, A.E., Hu, X., Taghizadeh, F.,
Pelipeychenko, D., Baccarini, M., and Johnson, J.D. (2011). Pancreatic
b-cell Raf-1 is required for glucose tolerance, insulin secretion, and insulin 2
transcription. FASEB J. 25, 3884–3895.
Alemzadeh, R., Langley, G., Upchurch, L., Smith, P., and Slonim, A.E. (1998).
Beneficial effect of diazoxide in obese hyperinsulinemic adults. J. Clin.
Endocrinol. Metab. 83, 1911–1915.
Alemzadeh, R., Karlstad, M.D., Tushaus, K., and Buchholz, M. (2008).
Diazoxide enhances basal metabolic rate and fat oxidation in obese Zucker
rats. Metabolism 57, 1597–1607.
Beith, J.L., Alejandro, E.U., and Johnson, J.D. (2008). Insulin stimulates
primary beta-cell proliferation via Raf-1 kinase. Endocrinology 149, 2251–
2260.
Bluher, M., Michael, M.D., Peroni, O.D., Ueki, K., Carter, N., Kahn, B.B., and
Kahn, C.R. (2002). Adipose tissue selective insulin receptor knockout protects
against obesity and obesity-related glucose intolerance. Dev. Cell 3, 25–38.
Broughton, S., Alic, N., Slack, C., Bass, T., Ikeya, T., Vinti, G., Tommasi, A.M.,
Driege, Y., Hafen, E., and Partridge, L. (2008). Reduction of DILP2 in
Drosophila triages a metabolic phenotype from lifespan revealing redundancy
and compensation among DILPs. PLoS ONE 3, e3721.
Bruning, J.C., Michael, M.D., Winnay, J.N., Hayashi, T., Horsch, D., Accili, D.,
Goodyear, L.J., and Kahn, C.R. (1998). A muscle-specific insulin receptor
knockout exhibits features of the metabolic syndrome of NIDDM without
altering glucose tolerance. Mol. Cell 2, 559–569.
Bruning, J.C., Gautam, D., Burks, D.J., Gillette, J., Schubert, M., Orban, P.C.,
Klein, R., Krone, W., Muller-Wieland, D., and Kahn, C.R. (2000). Role of brain
insulin receptor in control of body weight and reproduction. Science 289,
2122–2125.
Chen, Z., Li, Z., Wei, B., Yin, W., Xu, T., Kotlikoff, M.I., and Ji, G. (2010).
FKBP12.6-knockout mice display hyperinsulinemia and resistance to high-
fat diet-induced hyperglycemia. FASEB J. 24, 357–363.
Dankner, R., Chetrit, A., Shanik, M.H., Raz, I., and Roth, J. (2009). Basal-state
hyperinsulinemia in healthy normoglycemic adults is predictive of type 2 dia-
betes over a 24-year follow-up: a preliminary report. Diabetes Care 32,
1464–1466.
de la Monte, S.M., and Wands, J.R. (2008). Alzheimer’s disease is type 3 dia-
betes-evidence reviewed. J. Diabetes Sci. Tech. 2, 1101–1113.
Deltour, L., Leduque, P., Blume, N., Madsen, O., Dubois, P., Jami, J., and
Bucchini, D. (1993). Differential expression of the two nonallelic proinsulin
genes in the developing mouse embryo. Proc. Natl. Acad. Sci. USA 90,
527–531.
Despres, J.P., and Lemieux, I. (2006). Abdominal obesity and metabolic
syndrome. Nature 444, 881–887.
Devaskar, S.U., Singh, B.S., Carnaghi, L.R., Rajakumar, P.A., and Giddings,
S.J. (1993). Insulin II gene expression in rat central nervous system. Regul.
Pept. 48, 55–63.
Duvillie, B., Cordonnier, N., Deltour, L., Dandoy-Dron, F., Itier, J.M.,
Monthioux, E., Jami, J., Joshi, R.L., and Bucchini, D. (1997). Phenotypic alter-
ations in insulin-deficient mutant mice. Proc. Natl. Acad. Sci. USA 94, 5137–
5140.
El-Haschimi, K., Dufresne, S.D., Hirshman, M.F., Flier, J.S., Goodyear, L.J.,
and Bjørbaek, C. (2003). Insulin resistance and lipodystrophy in mice lacking
ribosomal S6 kinase 2. Diabetes 52, 1340–1346.
Fan, Y., Rudert, W.A., Grupillo, M., He, J., Sisino, G., and Trucco, M. (2009).
Thymus-specific deletion of insulin induces autoimmune diabetes. EMBO J.
28, 2812–2824.
Fan, Y., Rudert, W.A., Grupillo, M., He, J., Wong, C.T., Flounlacker, J., Sisino,
G., and Trucco, M. (2010). Type 1 Diabetes Induced by Thymus-Specific
Deletion of Insulin. Diabetes 59, A89.
Frayling, T.M., Timpson, N.J., Weedon, M.N., Zeggini, E., Freathy, R.M.,
Lindgren, C.M., Perry, J.R., Elliott, K.S., Lango, H., Rayner, N.W., et al.
(2007). A common variant in the FTO gene is associated with body mass index
and predisposes to childhood and adult obesity. Science 316, 889–894.
736 Cell Metabolism 16, 723–737, December 5, 2012 ª2012 Elsevier
Genuth, S.M., Przybylski, R.J., and Rosenberg, D.M. (1971). Insulin resistance
in genetically obese, hyperglycemic mice. Endocrinology 88, 1230–1238.
Giddings, S.J., Chirgwin, J., and Permutt, M.A. (1985). Evaluation of rat insulin
messenger RNA in pancreatic and extrapancreatic tissues. Diabetologia 28,
343–347.
Gray, S.L., Donald, C., Jetha, A., Covey, S.D., and Kieffer, T.J. (2010).
Hyperinsulinemia precedes insulin resistance in mice lacking pancreatic
beta-cell leptin signaling. Endocrinology 151, 4178–4186.
Hallschmid, M., Higgs, S., Thienel, M., Ott, V., and Lehnert, H. (2012).
Postprandial administration of intranasal insulin intensifies satiety and reduces
intake of palatable snacks in women. Diabetes 61, 782–789.
Havrankova, J., Schmechel, D., Roth, J., and Brownstein, M. (1978).
Identification of insulin in rat brain. Proc. Natl. Acad. Sci. USA 75, 5737–5741.
Hay, C.W., and Docherty, K. (2006). Comparative analysis of insulin gene
promoters: implications for diabetes research. Diabetes 55, 3201–3213.
Hegele, R.A. (2003). Monogenic forms of insulin resistance: apertures that
expose the common metabolic syndrome. Trends Endocrinol. Metab. 14,
371–377.
Himms-Hagen, J. (1997). On raising energy expenditure in ob/ob mice.
Science 276, 1132–1133.
Ishikawa, M., Pruneda, M.L., Adams-Huet, B., and Raskin, P. (1998). Obesity-
independent hyperinsulinemia in nondiabetic first-degree relatives of individ-
uals with type 2 diabetes. Diabetes 47, 788–792.
Johnson, J.D., and Alejandro, E.U. (2008). Control of pancreatic beta-cell fate
by insulin signaling: The sweet spot hypothesis. Cell Cycle 7, 1343–1347.
Johnson, J.D., Bernal-Mizrachi, E., Alejandro, E.U., Han, Z., Kalynyak, T.B., Li,
H., Beith, J.L., Gross, J., Warnock, G.L., Townsend, R.R., et al. (2006). Insulin
protects islets from apoptosis via Pdx1 and specific changes in the human islet
proteome. Proc. Natl. Acad. Sci. USA 103, 19575–19580.
Katic, M., Kennedy, A.R., Leykin, I., Norris, A., McGettrick, A., Gesta, S.,
Russell, S.J., Bluher, M., Maratos-Flier, E., and Kahn, C.R. (2007).
Mitochondrial gene expression and increased oxidative metabolism: role in
increased lifespan of fat-specific insulin receptor knock-out mice. Aging Cell
6, 827–839.
Kitamura, T., Kahn, C.R., and Accili, D. (2003). Insulin receptor knockout mice.
Annu. Rev. Physiol. 65, 313–332.
Kojima, H., Fujimiya, M., Matsumura, K., Nakahara, T., Hara, M., and Chan, L.
(2004). Extrapancreatic insulin-producing cells in multiple organs in diabetes.
Proc. Natl. Acad. Sci. USA 101, 2458–2463.
Konner, A.C., and Bruning, J.C. (2012). Selective insulin and leptin resistance
in metabolic disorders. Cell Metab. 16, 144–152.
Koopmans, S.J., Ohman, L., Haywood, J.R., Mandarino, L.J., and DeFronzo,
R.A. (1997). Seven days of euglycemic hyperinsulinemia induces insulin resis-
tance for glucose metabolism but not hypertension, elevated catecholamine
levels, or increased sodium retention in conscious normal rats. Diabetes 46,
1572–1578.
Lamotte, L., Jackerott, M., Bucchini, D., Jami, J., Joshi, R.L., and Deltour, L.
(2004). Knock-in of diphteria toxin A chain gene at Ins2 locus: effects on islet
development and localization of Ins2 expression in the brain. Transgenic
Res. 13, 463–473.
Le Stunff, C., and Bougneres, P. (1994). Early changes in postprandial insulin
secretion, not in insulin sensitivity, characterize juvenile obesity. Diabetes 43,
696–702.
Le Stunff, C., Fallin, D., and Bougneres, P. (2001). Paternal transmission of the
very common class I INS VNTR alleles predisposes to childhood obesity. Nat.
Genet. 29, 96–99.
Leonardsson, G., Steel, J.H., Christian, M., Pocock, V., Milligan, S., Bell, J., So,
P.W., Medina-Gomez, G., Vidal-Puig, A., White, R., and Parker, M.G. (2004).
Nuclear receptor corepressor RIP140 regulates fat accumulation. Proc. Natl.
Acad. Sci. USA 101, 8437–8442.
Leroux, L., Desbois, P., Lamotte, L., Duvillie, B., Cordonnier, N., Jackerott, M.,
Jami, J., Bucchini, D., and Joshi, R.L. (2001). Compensatory responses inmice
carrying a null mutation for Ins1 or Ins2. Diabetes 50(Suppl 1 ), S150–S153.
Inc.

Cell Metabolism
Insulin Gene Dosage Controls Mammalian Obesity
Li, W., Kennedy, S.G., and Ruvkun, G. (2003). daf-28 encodes a C. elegans
insulin superfamily member that is regulated by environmental cues and acts
in the DAF-2 signaling pathway. Genes Dev. 17, 844–858.
Lustig, R.H. (2006). Childhood obesity: behavioral aberration or biochemical
drive? Reinterpreting the First Law of Thermodynamics. Nat. Clin. Pract.
Endocrinol. Metab. 2, 447–458.
Lustig, R.H., Greenway, F., Velasquez-Mieyer, P., Heimburger, D.,
Schumacher, D., Smith, D., Smith, W., Soler, N., Warsi, G., Berg, W., et al.
(2006). A multicenter, randomized, double-blind, placebo-controlled, dose-
finding trial of a long-acting formulation of octreotide in promoting weight
loss in obese adults with insulin hypersecretion. Int J Obes (Lond) 30, 331–341.
Moore, G.E., Abu-Amero, S.N., Bell, G.,Wakeling, E.L., Kingsnorth, A., Stanier,
P., Jauniaux, E., and Bennett, S.T. (2001). Evidence that insulin is imprinted in
the human yolk sac. Diabetes 50, 199–203.
Moriyama, H., Abiru, N., Paronen, J., Sikora, K., Liu, E., Miao, D., Devendra, D.,
Beilke, J., Gianani, R., Gill, R.G., and Eisenbarth, G.S. (2003). Evidence for
a primary islet autoantigen (preproinsulin 1) for insulitis and diabetes in the
nonobese diabetic mouse. Proc. Natl. Acad. Sci. USA 100, 10376–10381.
Odeleye, O.E., de Courten, M., Pettitt, D.J., and Ravussin, E. (1997). Fasting
hyperinsulinemia is a predictor of increased body weight gain and obesity in
Pima Indian children. Diabetes 46, 1341–1345.
Ohsugi, M., Cras-Meneur, C., Zhou, Y., Bernal-Mizrachi, E., Johnson, J.D.,
Luciani, D.S., Polonsky, K.S., and Permutt, M.A. (2005). Reduced expression
of the insulin receptor in mouse insulinoma (MIN6) cells reveals multiple roles
of insulin signaling in gene expression, proliferation, insulin content, and secre-
tion. J. Biol. Chem. 280, 4992–5003.
Okada, T., Liew, C.W., Hu, J., Hinault, C., Michael, M.D., Krtzfeldt, J., Yin, C.,
Holzenberger, M., Stoffel, M., and Kulkarni, R.N. (2007). Insulin receptors in
beta-cells are critical for islet compensatory growth response to insulin resis-
tance. Proc. Natl. Acad. Sci. USA 104, 8977–8982.
Olshansky, S.J., Passaro, D.J., Hershow, R.C., Layden, J., Carnes, B.A.,
Brody, J., Hayflick, L., Butler, R.N., Allison, D.B., and Ludwig, D.S. (2005). A
potential decline in life expectancy in the United States in the 21st century.
N. Engl. J. Med. 352, 1138–1145.
Cell M
Pocai, A., Lam, T.K., Gutierrez-Juarez, R., Obici, S., Schwartz, G.J., Bryan, J.,
Aguilar-Bryan, L., and Rossetti, L. (2005). Hypothalamic K(ATP) channels
control hepatic glucose production. Nature 434, 1026–1031.
Pugliese, A., Zeller, M., Fernandez, A., Jr., Zalcberg, L.J., Bartlett, R.J.,
Ricordi, C., Pietropaolo, M., Eisenbarth, G.S., Bennett, S.T., and Patel, D.D.
(1997). The insulin gene is transcribed in the human thymus and transcription
levels correlated with allelic variation at the INS VNTR-IDDM2 susceptibility
locus for type 1 diabetes. Nat. Genet. 15, 293–297.
Rother, E., Belgardt, B.F., Tsaousidou, E., Hampel, B., Waisman, A., Myers,
M.G., Jr., and Bruning, J.C. (2012). Acute selective ablation of rat insulin
promoter-expressing (RIPHER) neurons defines their orexigenic nature.
Proc. Natl. Acad. Sci. USA 109, 18132–18137.
Rulifson, E.J., Kim, S.K., and Nusse, R. (2002). Ablation of insulin-producing
neurons in flies: growth and diabetic phenotypes. Science 296, 1118–1120.
Shanik, M.H., Xu, Y., Skrha, J., Dankner, R., Zick, Y., and Roth, J. (2008).
Insulin resistance and hyperinsulinemia: is hyperinsulinemia the cart or the
horse? Diabetes Care 31(Suppl 2 ), S262–S268.
Shi, H., Moustaid-Moussa, N., Wilkison, W.O., and Zemel, M.B. (1999). Role of
the sulfonylurea receptor in regulating human adipocyte metabolism. FASEB
J. 13, 1833–1838.
Vijay-Kumar, M., Aitken, J.D., Carvalho, F.A., Cullender, T.C., Mwangi, S.,
Srinivasan, S., Sitaraman, S.V., Knight, R., Ley, R.E., and Gewirtz, A.T.
(2010). Metabolic syndrome and altered gut microbiota in mice lacking Toll-
like receptor 5. Science 328, 228–231.
Wang, F., Liu, H., Blanton, W.P., Belkina, A., Lebrasseur, N.K., and Denis, G.V.
(2010). Brd2 disruption in mice causes severe obesity without Type 2 diabetes.
Biochem. J. 425, 71–83.
Wicksteed, B., Brissova, M., Yan, W., Opland, D.M., Plank, J.L., Reinert, R.B.,
Dickson, L.M., Tamarina, N.A., Philipson, L.H., Shostak, A., et al. (2010).
Conditional gene targeting in mouse pancreatic ß-Cells: analysis of ectopic
Cre transgene expression in the brain. Diabetes 59, 3090–3098.
Zimmet, P., Dowse, G., and Bennett, P. (1991). Hyperinsulinaemia is a
predictor of non-insulin-dependent diabetes mellitus. Diabete Metab. 17,
101–108.
etabolism 16, 723–737, December 5, 2012 ª2012 Elsevier Inc. 737

Online Supplement
Hyperinsulinemia drives diet-induced obesity independently of brain insulin production
Arya E. Mehran1,2, Nicole M. Templeman1,2, G. Stefano Brigidi1, Gareth E. Lim1,2, Kwan-Yi Chu1,2,
Xiaoke Hu1,2, Jose Diego Botezelli1,2, Ali Asadi1,2, Bradford G. Hoffman2, Timothy J. Kieffer1,2, Shernaz
X. Bamji1, Susanne M. Clee1, and James D. Johnson1,2*
1 Department of Cellular and Physiological Sciences, University of British Columbia 2 Department of Surgery, University of British Columbia

SUPPLEMENTAL FIGURES


SUPPLEMENTAL FIGURE LEGENDS
Figure S1. Detection of Ins2/INSULIN mRNA and Ins2 enhancer activity in human and rodent
brain. (A) Sequencing-based analysis of the differential gene expression of Ins1 and Ins2 from 203
libraries representing 43 distinct tissue types. Only libraries where either insulin gene was found are
shown. Data are shown as the log 10 of the tags per million. The lightest yellow color is the log 10 of
7.4 tags per million (~0.87 tags per million) and the maximum red color is the log 10 of 224712 tpm
(~5.35). (B) Taqman real-time RT-qPCR data showing amplification human insulin from a commercial
panel of brain cDNAs (Origene). (C) Enhancer analysis of Ins1 and Ins2 loci in islets and brain. Data
representing the locations of enrichment for the transcription factors Pdx1, Foxa2, Mafa, and Neurod1
in pancreatic islets is shown on the UCSC genome browser views. Also shown are the locations of
histone H3 lysine 4 mono- and tri- methylation (H3K4me1 and H3K4me3 respectively), which are
associated with functional cis-regulatory regions, in islets (blue) and in cerebellum and cortex (grey).
In each case the higher the signal, or peak, the greater the level of enrichment of the factor, or histone
modification. From comparing the Ins1 and Ins2 loci, it is clear that Ins1 only has active histone
modifications (H3K4me1 and/or H3K4me3) enriched at its cis-regulatory loci in pancreatic islets. On
the other hand, Ins2 has H3K4me1 enrichment at its cis-regulatory loci in islets, cerebellum, and
cortex tissues, indicating it is under active cis-regulation in these tissues.
Figure S2. Validation of specific Ins1 and Ins2 mRNA and protein detection tools. (A) Raw
Taqman real-time RT-qPCR data showing specific amplification Ins1 (blue traces; absent in Ins1-/-
:Ins2+/+ mice) and Ins2 (red traces; absent in Ins1+/+:Ins2-/- mice) in isolated islets. Beta-actin (yellow
traces) is shown as a control. (B) Quantitative comparison of Ins2 mRNA levels in islets and brain
regions using Taqman RT-qPCR (red, hippocampus; orange, cortex; yellow, remainder of brain;
green, cerebellum; blue, olfactory bulb; purple, hypothalamus; in each case tissues were micro-
dissected from a single brain). Data are presented as relative mRNA amounts per isolated tissue (i.e.
not normalized for the amount of tissue/cells). Ins2 mRNA was serially diluted from a sample of 236
hand picked wildtype mouse islets to generate a standard curve. Thus, hippocampi from a single adult
wildtype mouse has less than 1,000 times the amount of insulin mRNA when compared with 236 islets
(with number of islets had roughly 8 times fewer cells than the hippocampi based on the nucleic acid
recovered from the samples). Based on published estimations each islet would be composed of 1260
!-cells (Jo et al., 2007) and each !-cell has ~50,000 copies of Ins2 mRNA. (C) Anti-C-peptide antibody
(Millipore # 4020-01) fails to stain Ins2 knockout islets, demonstrating its specificity for the Ins2 gene
product. (D) Confocal imaging of cultured hippocampal neurons from Ins1-/-:Ins2-/- mice show no C-
peptide 2 or (pan)insulin immunoreactivity. MAP3 staining (far red) and DAPI (blue) are used to
delineate individual neurons. (E) Pancreatic islets from Ins1-/-:Ins2+/+ mice express insulin but are

negative for !Gal, while Ins1-/-:Ins2-/- mice are negative for insulin but shown immunoreactivity for
!Gal. The Ins2 gene was replaced with the LacZ gene in our Ins2-/- mice.
Figure S3. Lack of fasting hyperinsulinemia and weight gain in high fat fed female Ins1+/+:Ins2-/-
and Ins1+/-:Ins2-/- mice. (A) Insulin, after a 4-hour fast, was measured in female mice at the ages
indicated (n=3). (B) Body weight was tracked weekly (n = 7-8 per group). (C) Glucose tolerance tests,
and area under the curve (insets) (n = 7-8). (D) Insulin tolerance tests, and area over the curve
(insets) (n = 7-8). * denotes significant differences. Error bars are standard error of the mean.
Figure S4. Correlation between fasting insulin and body weight in young mice within
genotypes. (A,B) Plasma insulin and glucose after a 4-hour fast in an independent cohort of young
mice. (C) Body weight in young male Ins1+/+:Ins2-/- mice and Ins1+/-:Ins2-/- mice fed a high fat diet from
4 weeks of age. (D) A significant correlation between body mass and fasting insulin is maintained
within genotypes in 9-week old mice, at a time when fasting insulin begins to diverge, but prior to
significant differences in body mass between groups (n = 9-10). Error bars are standard error of the
mean.
Figure S5. Quantitative gene expression profile of brown adipose tissue and skeletal muscle.
Taqman qPCR of intra-scapular brown adipose tissue (A) and gastrocnemius skeletal muscle (B) in
high fat fed Ins1+/+:Ins2-/- and Ins1+/-:Ins2-/- mice. Data are ranked by numerical differences between
conditions. No statistical significances were detected (n = 7,5).
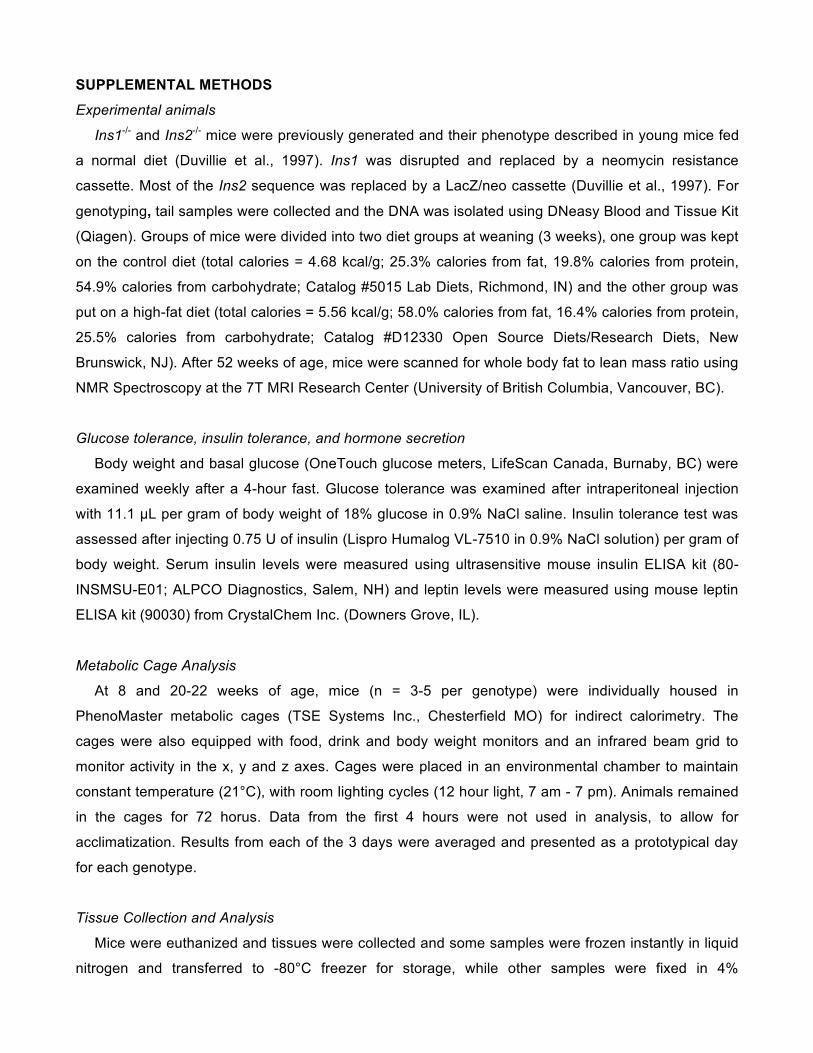
SUPPLEMENTAL METHODS
Experimental animals
Ins1-/- and Ins2-/- mice were previously generated and their phenotype described in young mice fed
a normal diet (Duvillie et al., 1997). Ins1 was disrupted and replaced by a neomycin resistance
cassette. Most of the Ins2 sequence was replaced by a LacZ/neo cassette (Duvillie et al., 1997). For
genotyping, tail samples were collected and the DNA was isolated using DNeasy Blood and Tissue Kit
(Qiagen). Groups of mice were divided into two diet groups at weaning (3 weeks), one group was kept
on the control diet (total calories = 4.68 kcal/g; 25.3% calories from fat, 19.8% calories from protein,
54.9% calories from carbohydrate; Catalog #5015 Lab Diets, Richmond, IN) and the other group was
put on a high-fat diet (total calories = 5.56 kcal/g; 58.0% calories from fat, 16.4% calories from protein,
25.5% calories from carbohydrate; Catalog #D12330 Open Source Diets/Research Diets, New
Brunswick, NJ). After 52 weeks of age, mice were scanned for whole body fat to lean mass ratio using
NMR Spectroscopy at the 7T MRI Research Center (University of British Columbia, Vancouver, BC).
Glucose tolerance, insulin tolerance, and hormone secretion
Body weight and basal glucose (OneTouch glucose meters, LifeScan Canada, Burnaby, BC) were
examined weekly after a 4-hour fast. Glucose tolerance was examined after intraperitoneal injection
with 11.1 !L per gram of body weight of 18% glucose in 0.9% NaCl saline. Insulin tolerance test was
assessed after injecting 0.75 U of insulin (Lispro Humalog VL-7510 in 0.9% NaCl solution) per gram of
body weight. Serum insulin levels were measured using ultrasensitive mouse insulin ELISA kit (80-
INSMSU-E01; ALPCO Diagnostics, Salem, NH) and leptin levels were measured using mouse leptin
ELISA kit (90030) from CrystalChem Inc. (Downers Grove, IL).
Metabolic Cage Analysis
At 8 and 20-22 weeks of age, mice (n = 3-5 per genotype) were individually housed in
PhenoMaster metabolic cages (TSE Systems Inc., Chesterfield MO) for indirect calorimetry. The
cages were also equipped with food, drink and body weight monitors and an infrared beam grid to
monitor activity in the x, y and z axes. Cages were placed in an environmental chamber to maintain
constant temperature (21°C), with room lighting cycles (12 hour light, 7 am - 7 pm). Animals remained
in the cages for 72 horus. Data from the first 4 hours were not used in analysis, to allow for
acclimatization. Results from each of the 3 days were averaged and presented as a prototypical day
for each genotype.
Tissue Collection and Analysis
Mice were euthanized and tissues were collected and some samples were frozen instantly in liquid
nitrogen and transferred to -80°C freezer for storage, while other samples were fixed in 4%
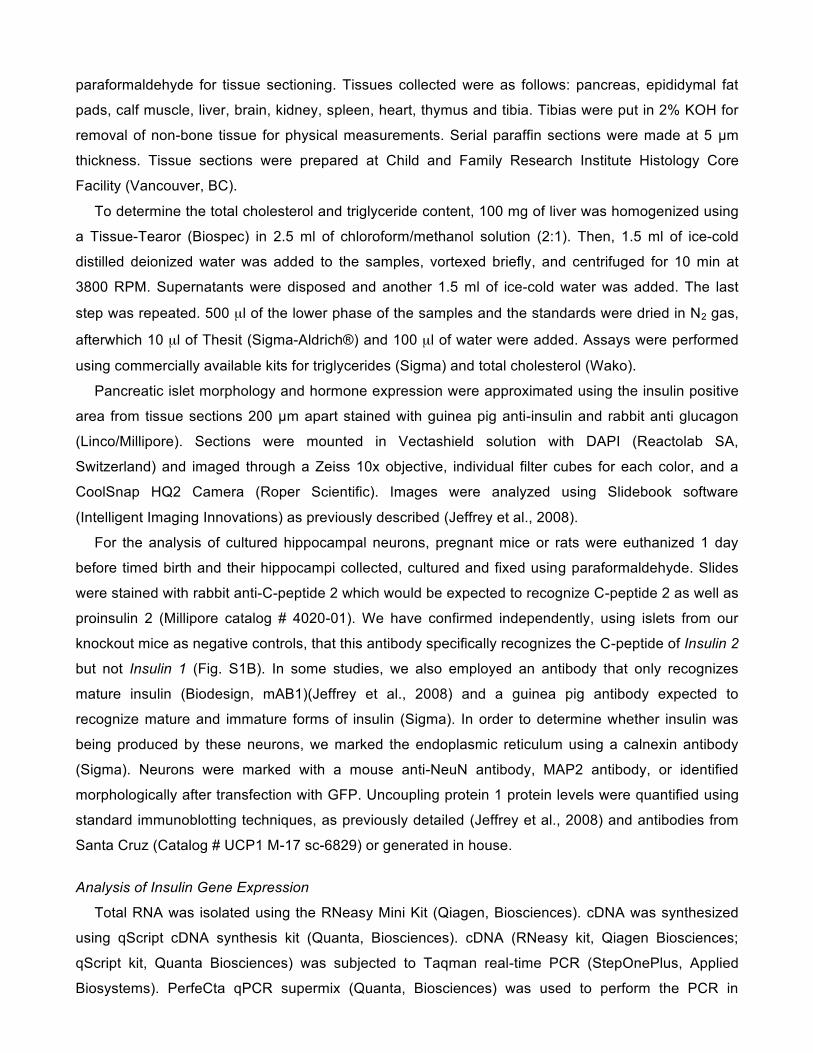
paraformaldehyde for tissue sectioning. Tissues collected were as follows: pancreas, epididymal fat
pads, calf muscle, liver, brain, kidney, spleen, heart, thymus and tibia. Tibias were put in 2% KOH for
removal of non-bone tissue for physical measurements. Serial paraffin sections were made at 5 !m
thickness. Tissue sections were prepared at Child and Family Research Institute Histology Core
Facility (Vancouver, BC).
To determine the total cholesterol and triglyceride content, 100 mg of liver was homogenized using
a Tissue-Tearor (Biospec) in 2.5 ml of chloroform/methanol solution (2:1). Then, 1.5 ml of ice-cold
distilled deionized water was added to the samples, vortexed briefly, and centrifuged for 10 min at
3800 RPM. Supernatants were disposed and another 1.5 ml of ice-cold water was added. The last
step was repeated. 500 µl of the lower phase of the samples and the standards were dried in N2 gas,
afterwhich 10 µl of Thesit (Sigma-Aldrich®) and 100 µl of water were added. Assays were performed
using commercially available kits for triglycerides (Sigma) and total cholesterol (Wako).
Pancreatic islet morphology and hormone expression were approximated using the insulin positive
area from tissue sections 200 !m apart stained with guinea pig anti-insulin and rabbit anti glucagon
(Linco/Millipore). Sections were mounted in Vectashield solution with DAPI (Reactolab SA,
Switzerland) and imaged through a Zeiss 10x objective, individual filter cubes for each color, and a
CoolSnap HQ2 Camera (Roper Scientific). Images were analyzed using Slidebook software
(Intelligent Imaging Innovations) as previously described (Jeffrey et al., 2008).
For the analysis of cultured hippocampal neurons, pregnant mice or rats were euthanized 1 day
before timed birth and their hippocampi collected, cultured and fixed using paraformaldehyde. Slides
were stained with rabbit anti-C-peptide 2 which would be expected to recognize C-peptide 2 as well as
proinsulin 2 (Millipore catalog # 4020-01). We have confirmed independently, using islets from our
knockout mice as negative controls, that this antibody specifically recognizes the C-peptide of Insulin 2
but not Insulin 1 (Fig. S1B). In some studies, we also employed an antibody that only recognizes
mature insulin (Biodesign, mAB1)(Jeffrey et al., 2008) and a guinea pig antibody expected to
recognize mature and immature forms of insulin (Sigma). In order to determine whether insulin was
being produced by these neurons, we marked the endoplasmic reticulum using a calnexin antibody
(Sigma). Neurons were marked with a mouse anti-NeuN antibody, MAP2 antibody, or identified
morphologically after transfection with GFP. Uncoupling protein 1 protein levels were quantified using
standard immunoblotting techniques, as previously detailed (Jeffrey et al., 2008) and antibodies from
Santa Cruz (Catalog # UCP1 M-17 sc-6829) or generated in house.
Analysis of Insulin Gene Expression
Total RNA was isolated using the RNeasy Mini Kit (Qiagen, Biosciences). cDNA was synthesized
using qScript cDNA synthesis kit (Quanta, Biosciences). cDNA (RNeasy kit, Qiagen Biosciences;
qScript kit, Quanta Biosciences) was subjected to Taqman real-time PCR (StepOnePlus, Applied
Biosystems). PerfeCta qPCR supermix (Quanta, Biosciences) was used to perform the PCR in

StepOnePlus real-time PCR system (Applied Biosystems). Following primers were used Ins1 Taqman
forward 169!189: GAA GTG GAG GAC CCA CAA GTG, Ins1 Taqman reverse 273!254: ATC CAC
AAT GCC ACG CTT CT, Ins1 Taqman probe 219!200: CCC GGG GCT TCC TCC CAG CT, Ins2
taqman forward 169!189: GAA GTG GAG GAC CCA CAA GTG, Ins2 Taqman reverse 280!259:
GAT CTA CAA TGC CAC GCT TCT G, Ins2 Taqman probe 224!207: CCT GCT CCC GGG CCT
CCA. PCR conditions were 2 min at 50 °C, 10 min at 95 °C and followed by 40 cycles of 15 sec at 95
°C, 1 min at 60 °C. Reverse log of the raw values were used for analysis. Mouse brain cDNA panel
(MDRT101) and human brain cDNA panel (HBRT101) were purchased from Origene (Rockville, MD).
Human INSULIN probe set (Hs00355773-m1) was from Applied Biosystems.
Analysis of sequencing-based gene expression data was performed as described previously
(Hoffman et al., 2008). Briefly, available serial analysis of gene expression (SAGE) data from 205
different mouse libraries, generated as part of the Mouse Atlas of Gene Expression (Hoffman et al.,
2008; Siddiqui et al., 2005), was obtained (http://cgap.nci.nih.gov/SAGE). Data were then filtered for
sequence quality so that each tag had a 95% or greater probability of being correct, using PHRED
score quality assessment software. The counts of tags corresponding Ins1 and Ins2 was then
determined in each of the 205 libraries. Tags corresponding to Ins1 were detected in 7 out of 205
libraries, while tags corresponding to Insulin 2 were detected in 20 out of 205 libraries (Figure 1C).
Data are shown as the log 10 of the tags per million. The lightest blue color is the log 10 of 7.4 tags
per million (~0.87) and the max color is the log 10 of 224712 tpm (~5.35).
To complement our own investigations, we also performed an exhaustive literature search and
found over 80 reports of CNS insulin expression in the CNS of various species (e.g. Broughton and
Partridge, 2009; Broughton et al., 2010; Clarke et al., 1986; Deltour et al., 1993; Devaskar, 1991;
Devaskar et al., 1994; Devaskar et al., 1993; Dorn et al., 1981; Fan et al., 2009; Fan et al., 2010;
Frolich et al., 1998; Frolich et al., 1999; Giddings et al., 1985; Grunblatt et al., 2006; Grunblatt et al.,
2007; Hrytsenko et al., 2007; Hua et al., 2003; Hwangbo et al., 2004; Kodama et al., 2006; Lamotte et
al., 2004; Nakayama et al., 2005; Narasimhan et al., 2009; Oda et al., 2011; Osmanovic et al., 2010;
Plaschke et al., 2009, 2010; Pugliese et al., 1997; Riederer et al., 2011; Rulifson et al., 2002; Salkovic-
Petrisic et al., 2005; Salkovic-Petrisic et al., 2009; Schechter et al., 1988; Schechter et al., 1994;
Serrano et al., 1989; Singh et al., 1997; Steen et al., 2005; You et al., 2008). In rodents, this evidence
includes Ins2 promoter activity(Alpert et al., 1988; Lamotte et al., 2004), mRNA (Northern, RT-PCR,
real-time RT-qPCR, in situ hybridization)(Cohen et al., 2007; de la Monte, 2009; de la Monte et al.,
2011; de la Monte et al., 2008; de la Monte et al., 2006; de la Monte and Wands, 2005, 2008; de la
Monte et al., 2005; Deltour et al., 1993; Devaskar, 1991; Devaskar et al., 1993; Giddings et al., 1985;
Grunblatt et al., 2006; Grunblatt et al., 2007; Havrankova et al., 1978a, b; Jones et al., 2011; Kojima et
al., 2006; Lamotte et al., 2004; Lester-Coll et al., 2006; Moroz et al., 2008; Osmanovic et al., 2010;
Plaschke et al., 2010; Riederer et al., 2011; Rivera et al., 2005; Salkovic-Petrisic et al., 2005; Salkovic-

Petrisic et al., 2009; Schechter et al., 1990; Schechter et al., 1992; Schechter et al., 1994; Singh et al.,
1997; Soscia et al., 2006; Wozniak et al., 1993; Young, 1986), and protein (immunohistochemistry,
RIA, HPLC)(Bernstein et al., 1984; Birch et al., 1984a, b, 1987; Clarke et al., 1986; de la Monte, 2009;
de la Monte and Wands, 2008; Devaskar, 1991; Devaskar et al., 1994; Devaskar et al., 1993; Dheen
et al., 1996; Dorn et al., 1984a; Dorn et al., 1981; Dorn et al., 1980; Dorn et al., 1982a; Dorn et al.,
1983a; Dorn et al., 1983b; Dorn et al., 1982b; Dorn et al., 1984b; Havrankova et al., 1978a, b; Hill et
al., 1986; Kojima et al., 2006; Nishimura et al., 1991; Raizada, 1983; Riederer et al., 2011;
Rosenzweig et al., 1980; Schechter et al., 1988; Schechter et al., 1990; Schechter et al., 1994; Singh
et al., 1997; Stempniak and Guzek, 1993; Stevenson, 1983; Unger et al., 1989; Weyhenmeyer and
Fellows, 1983; Wozniak et al., 1993). Animals with a single insulin gene (rabbits, guinea pigs, dogs,
non-human primates) also have brain insulin(Watanabe et al., 1986), suggesting a default pattern
(rodent Ins1 being the exception). Multiple groups have shown that primary neuronal cultures secrete
metabolically labeled, newly synthesized insulin into conditioned media (Birch et al., 1984a; Devaskar
et al., 1994). Insulin levels are highest during development and decline after birth, until insulin can only
be found in rare cells, (Bernstein et al., 1984), like many other neuropeptides (Albertson et al., 2008;
Najimi et al., 1990). Multiple laboratories, using different antibodies, have found diffuse insulin staining
in the same areas of the brain, including the hypothalamus, thalamus, amygdala and prominently in
the hippocampus (Bernstein et al., 1984; Dorn et al., 1984a; Dorn et al., 1981; Dorn et al., 1980; Dorn
et al., 1982a; Dorn et al., 1983a; Dorn et al., 1983b; Dorn et al., 1982b; Dorn et al., 1984b). Neuronal
insulin expression and staining are expected to be much weaker than in beta-cells because local
action does not require ‘endocrine’ levels of peptide production in each cell, just enough so that
neighboring cells can sense and respond with amplifying signalling cascades. Insulin receptors
respond to picomolar levels of the hormone (Alejandro et al., 2010; Beith et al., 2008; Johnson and
Alejandro, 2008; Johnson et al., 2006a; Johnson et al., 2006b; Johnson and Misler, 2002; Luciani and
Johnson, 2005). Importantly, there is no evidence that insulin produced in the brain has any effect on
circulating peripheral insulin, suggesting that it must act locally. Central glucose infusion or feeding
rapidly increase extracellular insulin in the hypothalamus, but does not affect peripheral insulin levels
or glycemia (Gerozissis et al., 1993, 1997; Gerozissis et al., 2001; Gerozissis et al., 1999; Orosco et
al., 1995a; Orosco et al., 1995b; Orosco et al., 2000). Indeed, brain insulin mRNA levels are dynamic,
and are modulated positively and negatively by a large number of factors (de la Monte, 2009; de la
Monte et al., 2011; de la Monte et al., 2008; de la Monte et al., 2006; de la Monte et al., 2010; de la
Monte and Wands, 2002, 2005, 2008; de la Monte et al., 2005; Lester-Coll et al., 2006; Soscia et al.,
2006; Tong and de la Monte, 2009; Tong et al., 2009), further suggesting that it is not artifactual.
Analysis of putative insulin target genes

Analysis of gene expression patterns in white adipose tissue, liver, and skeletal muscle was
performed using custom Taqman mini-arrays. Each 96-well PCR plate was divided in half with 45
genes of interest and 3 internal controls (18S, "-actin/Actb, hypoxanthine guanine phosphoribosyl
transferase 1/Hprt1). Genotypes were then compared on the same plate, side-by-side. We chose
genes involved in lipid metabolism, several of which are known to be insulin target genes, including:
ATP citrate lyase (Acly)(Chu et al., 2010; Pearce et al., 1998), hormone sensitive lipase (Hsl)(Harada
et al., 2003; Langin et al., 1993), fatty acid synthase (Fasn)(Moon et al., 2000; Wang and Sul, 1995,
1998), patatin-like phospholipase domain containing 2 (Atgl)(Lake et al., 2005; Zimmermann et al.,
2004), patatin-like phospholipase domain containing 3 (Adpn)(Huong and Ide, 2008; Kershaw et al.,
2006; Lake et al., 2005; Liu et al., 2004; Moldes et al., 2006), acetyl coa carboxylase (Acacb)(Czech et
al., 1989) and stearoyl-coenzyme a desaturase 1 (Scd1)(Brown et al., 2008; Flowers and Ntambi,
2008; Mauvoisin and Mounier, 2011; Prasad and Joshi, 1979; Rahman et al., 2003). We chose to
examine each of the uncoupling proteins (Ucp1, Ucp2, Ucp3)(Alemzadeh et al., 2008; Almind et al.,
2007; Azzu and Brand, 2010; Bhopal and Rafnsson, 2009; Chan and Harper, 2006; Christian et al.,
2005; Jezek, 2002; Krauss et al., 2005; Mogensen et al., 2007; Zhang et al., 2001). A number of
transcription factors involved in regulating metabolism were chosen: peroxisome proliferator activated
receptor alpha and gamma (Ppara, Pparg)(Finck et al., 2006; Guilherme et al., 2008; Jay and Ren,
2007; Jones et al., 2005; Tontonoz and Spiegelman, 2008), peroxisome proliferative gamma
coactivator 1 alpha (Ppargc1a)(Liu et al., 2008; Puigserver et al., 1999; Wu et al., 1999),
CCAAT/enhancer binding protein (Cebpa)(Miller et al., 1996), sterol regulatory element binding
transcription factor 1 (srebf1, also known as Srebp1c)(Kim et al., 1998; Lin et al., 2005), mlx
interacting protein-like (Chrebp)(Ferre and Foufelle, 2010; Iizuka and Horikawa, 2008; Miyazaki et al.,
2007; Postic et al., 2007; Sanchez et al., 2009; Sirek et al., 2009; Wong and Sul, 2010), forkhead box
a2 (Foxa2)(Puigserver and Rodgers, 2006; Silva et al., 2009; Tabassum et al., 2008; Wolfrum et al.,
2004; Wolfrum and Stoffel, 2006), forkhead box c2 (Foxc2)(Cederberg et al., 2001; Di Gregorio et al.,
2004; Gronning et al., 2002; Lidell et al., 2011; Yang et al., 2003), forkhead box o1 (Foxo1)(Farmer,
2003; Liu et al., 2008; Matsuzaki et al., 2003; Nakae et al., 2003; Puigserver et al., 2003), sirtuin 1
(Sirt1)(Bai et al., 2011; Coppari et al., 2009; Iwabu et al., 2010; Kaestner, 2008; Lagouge et al., 2006;
Liu et al., 2008; Luo and Kraus, 2011; Purushotham et al., 2009), nuclear receptor subfamily 1
(Lxr)(Baranowski, 2008; Fernandez-Veledo et al., 2006; Kalaany et al., 2005; Laffitte et al., 2003;
Mukherjee et al., 1997), early growth response 1 (Egr1)(Jhun et al., 1995; Keeton et al., 2003; Nelson
et al., 2011; Shen et al., 2011), early growth response 2 (Egr2)(Keeton et al., 2003; Li et al., 2010;
Wang et al., 2009), kruppel-like factor 15 (Klf15)(Elbein et al., 2011; Gray et al., 2002; Teshigawara et
al., 2005; Yamamoto et al., 2004), nuclear receptor interacting protein 1 (Rip140)(Christian et al.,
2005; Leonardsson et al., 2004), as well as the stress factors, activating transcription factor 3
(Atf3)(Gilchrist et al., 2006; Kim et al., 2006; Lim et al., 2006; Qi et al., 2009; Zmuda et al., 2010), and

DNA-damage inducible transcript 3 (Ddit3, also known as Chop)(Ariyama et al., 2007; Ozcan et al.,
2004). We also examined genes involved in insulin signaling such as insulin receptor (Insr)(Bluher et
al., 2003; Bluher et al., 2002; Bruning et al., 2000; Saltiel and Kahn, 2001), protein tyrosine
phosphatase (Ptpn1)(Koren and Fantus, 2007), and solute carrier family 2 member 4 (Glut4)(Gray et
al., 2002; Miller et al., 2007; Park et al., 2005; Qi et al., 2009). Some adipokines and their receptors
were also tested: adiponectin (Adipoq), adiponectin receptor 1 (Adipor1), adiponectin receptor 2
(Adipor2)(Ahima and Lazar, 2008; Koh et al., 2010; Liu et al., 2007), leptin (Lep) and leptin receptor
(Lepr)(Ahima and Lazar, 2008; Anubhuti and Arora, 2008; Das, 2010). Inflammatory factors that are
known to be heightened in obesity were also tested, including the macrophage marker F4/80 (EGF-
like module-containing mucin-like hormone receptor-like 1, Emr1), interleukin 6 (IL6) and tumor
necrosis factor alpha (TNFa)(Guilherme et al., 2008; Pradhan, 2007). Other genes that are reported to
be involved in obesity were chosen, including alpha-ketoglutarate-dependent dioxygenase (Fto)(Dina
et al., 2007; Frayling et al., 2007), insulin-like growth factor binding protein 1 (Igfbp1)(Wheatcroft and
Kearney, 2009), fibroblast growth factor 21 (Fgf21)(Kharitonenkov et al., 2005), and retinol binding
protein 4 (Rbp4)(Graham et al., 2006; Kloting et al., 2007; Yang et al., 2005).
Statistical and Data Analysis.
All results are expressed as means ± SEM. For glucose tolerance, insulin tolerance and insulin
secretion testes statistical analysis was performed on values obtained from measuring area under the
curve (AUC). Statistical analysis was performed using Prism 5 (Graphpad). Two way ANOVA or one-
way ANOVA followed by Tukey's HSD was used where appropriate. P < 0.05 was considered to be
significant.
!SUPPLEMENTAL REFERENCES Ahima, R.S., and Lazar, M.A. (2008). Adipokines and the peripheral and neural control of energy
balance. Mol Endocrinol 22, 1023-1031. Albertson, A.J., Talbott, H., Wang, Q., Jensen, D., and Skinner, D.C. (2008). The gonadotropin-
releasing hormone type I receptor is expressed in the mouse cerebellum. Cerebellum 7, 379-384. Alejandro, E.U., Kalynyak, T.B., Taghizadeh, F., Gwiazda, K.S., Rawstron, E.K., Jacob, K.J., and
Johnson, J.D. (2010). Acute insulin signaling in pancreatic beta-cells is mediated by multiple Raf-1 dependent pathways. Endocrinology 151, 502-512.
Alemzadeh, R., Karlstad, M.D., Tushaus, K., and Buchholz, M. (2008). Diazoxide enhances basal metabolic rate and fat oxidation in obese Zucker rats. Metabolism 57, 1597-1607.
Almind, K., Manieri, M., Sivitz, W.I., Cinti, S., and Kahn, C.R. (2007). Ectopic brown adipose tissue in muscle provides a mechanism for differences in risk of metabolic syndrome in mice. Proc Natl Acad Sci U S A 104, 2366-2371.
Alpert, S., Hanahan, D., and Teitelman, G. (1988). Hybrid insulin genes reveal a developmental lineage for pancreatic endocrine cells and imply a relationship with neurons. Cell 53, 295-308.
Anubhuti, and Arora, S. (2008). Leptin and its metabolic interactions: an update. Diabetes Obes Metab 10, 973-993.
Ariyama, Y., Shimizu, H., Satoh, T., Tsuchiya, T., Okada, S., Oyadomari, S., Mori, M., and Mori, M. (2007). Chop-deficient mice showed increased adiposity but no glucose intolerance. Obesity (Silver Spring) 15, 1647-1656.

Azzu, V., and Brand, M.D. (2010). The on-off switches of the mitochondrial uncoupling proteins. Trends Biochem Sci 35, 298-307.
Bai, P., Canto, C., Brunyanszki, A., Huber, A., Szanto, M., Cen, Y., Yamamoto, H., Houten, S.M., Kiss, B., Oudart, H., et al. (2011). PARP-2 regulates SIRT1 expression and whole-body energy expenditure. Cell Metabolism 13, 450-460.
Baranowski, M. (2008). Biological role of liver X receptors. Journal of physiology and pharmacology : an official journal of the Polish Physiological Society 59 Suppl 7, 31-55.
Beith, J.L., Alejandro, E.U., and Johnson, J.D. (2008). Insulin stimulates primary beta-cell proliferation via Raf-1 kinase. Endocrinology 149, 2251-2260.
Bernstein, H.G., Dorn, A., Reiser, M., and Ziegler, M. (1984). Cerebral insulin-like immunoreactivity in rats and mice. Drastic decline during postnatal ontogenesis. Acta histochemica 74, 33-36.
Bhopal, R.S., and Rafnsson, S.B. (2009). Could mitochondrial efficiency explain the susceptibility to adiposity, metabolic syndrome, diabetes and cardiovascular diseases in South Asian populations? Int J Epidemiol 38, 1072-1081.
Birch, N.P., Christie, D.L., and Renwick, A.G. (1984a). Immunoreactive insulin from mouse brain cells in culture and whole rat brain. The Biochemical journal 218, 19-27.
Birch, N.P., Christie, D.L., and Renwick, A.G. (1984b). Proinsulin-like material in mouse foetal brain cell cultures. Febs Letters 168, 299-302.
Birch, N.P., Christie, D.L., and Renwick, A.G. (1987). Multiple forms of biologically active insulin-like material from mouse fetal brain cells in culture. Neuropeptides 9, 325-331.
Bluher, M., Kahn, B.B., and Kahn, C.R. (2003). Extended longevity in mice lacking the insulin receptor in adipose tissue. Science 299, 572-574.
Bluher, M., Michael, M.D., Peroni, O.D., Ueki, K., Carter, N., Kahn, B.B., and Kahn, C.R. (2002). Adipose tissue selective insulin receptor knockout protects against obesity and obesity-related glucose intolerance. Dev Cell 3, 25-38.
Broughton, S., and Partridge, L. (2009). Insulin/IGF-like signalling, the central nervous system and aging. Biochem J 418, 1-12.
Broughton, S.J., Slack, C., Alic, N., Metaxakis, A., Bass, T.M., Driege, Y., and Partridge, L. (2010). DILP-producing median neurosecretory cells in the Drosophila brain mediate the response of lifespan to nutrition. Aging Cell 9, 336-346.
Brown, J.M., Chung, S., Sawyer, J.K., Degirolamo, C., Alger, H.M., Nguyen, T., Zhu, X., Duong, M.N., Wibley, A.L., Shah, R., et al. (2008). Inhibition of stearoyl-coenzyme A desaturase 1 dissociates insulin resistance and obesity from atherosclerosis. Circulation 118, 1467-1475.
Bruning, J.C., Gautam, D., Burks, D.J., Gillette, J., Schubert, M., Orban, P.C., Klein, R., Krone, W., Muller-Wieland, D., and Kahn, C.R. (2000). Role of brain insulin receptor in control of body weight and reproduction. Science 289, 2122-2125.
Cederberg, A., Gronning, L.M., Ahren, B., Tasken, K., Carlsson, P., and Enerback, S. (2001). FOXC2 is a winged helix gene that counteracts obesity, hypertriglyceridemia, and diet-induced insulin resistance. Cell 106, 563-573.
Chan, C.B., and Harper, M.E. (2006). Uncoupling proteins: role in insulin resistance and insulin insufficiency. Curr Diabetes Rev 2, 271-283.
Christian, M., Kiskinis, E., Debevec, D., Leonardsson, G., White, R., and Parker, M.G. (2005). RIP140-targeted repression of gene expression in adipocytes. Mol Cell Biol 25, 9383-9391.
Chu, K., Lin, Y., Hendel, A., Kulpa, J., Brownsey, R., and Johnson, J. (2010). ATP-Citrate Lyase Reduction Mediates Palmitate-induced Apoptosis in Pancreatic Beta Cells. Journal of Biological Chemistry 285, 32606-32615.
Clarke, D.W., Mudd, L., Boyd, F.T., Jr., Fields, M., and Raizada, M.K. (1986). Insulin is released from rat brain neuronal cells in culture. Journal of Neurochemistry 47, 831-836.
Cohen, A.C., Tong, M., Wands, J.R., and de la Monte, S.M. (2007). Insulin and insulin-like growth factor resistance with neurodegeneration in an adult chronic ethanol exposure model. Alcoholism, clinical and experimental research 31, 1558-1573.
Coppari, R., Ramadori, G., and Elmquist, J.K. (2009). The role of transcriptional regulators in central control of appetite and body weight. Nature clinical practice. Endocrinology & metabolism 5, 160-166.

Czech, M.P., Lewis, R.E., and Corvera, S. (1989). Multifunctional glycoprotein receptors for insulin and the insulin-like growth factors. Ciba Found Symp 145, 27-41; discussion 42-24.
Das, U.N. (2010). Obesity: genes, brain, gut, and environment. Nutrition 26, 459-473. de la Monte, S.M. (2009). Insulin resistance and Alzheimer's disease. BMB reports 42, 475-481. de la Monte, S.M., Tong, M., Bowling, N., and Moskal, P. (2011). si-RNA inhibition of brain insulin or
insulin-like growth factor receptors causes developmental cerebellar abnormalities: relevance to fetal alcohol spectrum disorder. Mol Brain 4, 13.
de la Monte, S.M., Tong, M., Cohen, A.C., Sheedy, D., Harper, C., and Wands, J.R. (2008). Insulin and insulin-like growth factor resistance in alcoholic neurodegeneration. Alcoholism, clinical and experimental research 32, 1630-1644.
de la Monte, S.M., Tong, M., Lester-Coll, N., Plater, M., Jr., and Wands, J.R. (2006). Therapeutic rescue of neurodegeneration in experimental type 3 diabetes: relevance to Alzheimer's disease. Journal of Alzheimer's disease : JAD 10, 89-109.
de la Monte, S.M., Tong, M., Nguyen, V., Setshedi, M., Longato, L., and Wands, J.R. (2010). Ceramide-mediated insulin resistance and impairment of cognitive-motor functions. Journal of Alzheimer's disease : JAD 21, 967-984.
de la Monte, S.M., and Wands, J.R. (2002). Chronic gestational exposure to ethanol impairs insulin-stimulated survival and mitochondrial function in cerebellar neurons. Cellular and molecular life sciences : CMLS 59, 882-893.
de la Monte, S.M., and Wands, J.R. (2005). Review of insulin and insulin-like growth factor expression, signaling, and malfunction in the central nervous system: relevance to Alzheimer's disease. Journal of Alzheimer's disease : JAD 7, 45-61.
de la Monte, S.M., and Wands, J.R. (2008). Alzheimer's disease is type 3 diabetes-evidence reviewed. Journal of diabetes science and technology 2, 1101-1113.
de la Monte, S.M., Xu, X.J., and Wands, J.R. (2005). Ethanol inhibits insulin expression and actions in the developing brain. Cellular and molecular life sciences : CMLS 62, 1131-1145.
Deltour, L., Leduque, P., Blume, N., Madsen, O., Dubois, P., Jami, J., and Bucchini, D. (1993). Differential expression of the two nonallelic proinsulin genes in the developing mouse embryo. Proc Natl Acad Sci U S A 90, 527-531.
Devaskar, S.U. (1991). A review of insulin/insulin-like peptide in the central nervous system. Physiology and Pathophysiology of the Islets of Langerhans 293, 385-396.
Devaskar, S.U., Giddings, S.J., Rajakumar, P.A., Carnaghi, L.R., Menon, R.K., and Zahm, D.S. (1994). Insulin gene expression and insulin synthesis in mammalian neuronal cells. Journal of Biological Chemistry 269, 8445-8454.
Devaskar, S.U., Singh, B.S., Carnaghi, L.R., Rajakumar, P.A., and Giddings, S.J. (1993). Insulin II gene expression in rat central nervous system. Regul Pept 48, 55-63.
Dheen, S.T., Tay, S.S., and Wong, W.C. (1996). Localization of insulin-like immunoreactive neurons in the rat gracile nucleus. Histology and histopathology 11, 667-672.
Di Gregorio, G.B., Westergren, R., Enerback, S., Lu, T., and Kern, P.A. (2004). Expression of FOXC2 in adipose and muscle and its association with whole body insulin sensitivity. American journal of physiology. Endocrinology and metabolism 287, E799-803.
Dina, C., Meyre, D., Gallina, S., Durand, E., Korner, A., Jacobson, P., Carlsson, L.M., Kiess, W., Vatin, V., Lecoeur, C., et al. (2007). Variation in FTO contributes to childhood obesity and severe adult obesity. Nat Genet 39, 724-726.
Dorn, A., Bernstein, H.G., Hahn, H.J., Ziegler, M., and Rinne, A. (1984a). [Immunoreactive insulin in the CNS of human fetuses and newborn infants of metabolically healthy and diabetic mothers--an immunohistochemical study]. Acta Histochem Suppl 30, 281-285.
Dorn, A., Bernstein, H.G., Hahn, H.J., Ziegler, M., and Rummelfanger, H. (1981). Insulin immunohistochemistry of rodent CNS: apparent species differences but good correlation with radioimmunological data. Histochemistry 71, 609-616.
Dorn, A., Bernstein, H.G., Kostmann, G., Hahn, H.J., and Ziegler, M. (1980). An immunofluorescent reaction appears to insulin-antiserum in different CNS regions of two rat species. Acta histochemica 66, 276-278.

Dorn, A., Bernstein, H.G., Rinne, A., Hahn, H.J., and Ziegler, M. (1982a). Insulin-like immunoreactivity in the human brain- A preliminary report. Histochemistry 74, 293-300.
Dorn, A., Bernstein, H.G., Rinne, A., Ziegler, M., Hahn, H.J., and Ansorge, S. (1983a). Insulin- and glucagonlike peptides in the brain. The Anatomical record 207, 69-77.
Dorn, A., Rinne, A., Bernstein, H.G., Hahn, H.J., and Ziegler, M. (1983b). Insulin and C-peptide in human brain neurons (insulin/C-peptide/brain peptides/immunohistochemistry/radioimmunoassay). J Hirnforsch 24, 495-499.
Dorn, A., Rinne, A., Hahn, H.J., Bernstein, H.G., and Ziegler, M. (1982b). C-peptide immunoreactive neurons in human brain. Acta histochemica 70, 326-330.
Dorn, A., Ziegler, M., Bernstein, H.G., Dietz, H., and Rinne, A. (1984b). Concerning the presence of an insulin-related peptide in the human brain: an immunohistochemical reinvestigation by use of monoclonal insulin antibodies. Acta histochemica 74, 81-84.
Duvillie, B., Cordonnier, N., Deltour, L., Dandoy-Dron, F., Itier, J.M., Monthioux, E., Jami, J., Joshi, R.L., and Bucchini, D. (1997). Phenotypic alterations in insulin-deficient mutant mice. Proc Natl Acad Sci U S A 94, 5137-5140.
Elbein, S.C., Kern, P.A., Rasouli, N., Yao-Borengasser, A., Sharma, N.K., and Das, S.K. (2011). Global gene expression profiles of subcutaneous adipose and muscle from glucose-tolerant, insulin-sensitive, and insulin-resistant individuals matched for BMI. Diabetes 60, 1019-1029.
Fan, Y., Rudert, W.A., Grupillo, M., He, J., Sisino, G., and Trucco, M. (2009). Thymus-specific deletion of insulin induces autoimmune diabetes. Embo Journal.
Fan, Y., Rudert, W.A., Grupillo, M., He, J., Wong, C.T., Flounlacker, J., Sisino, G., and Trucco, M. (2010). Type 1 Diabetes Induced by Thymus-Specific Deletion of Insulin. Diabetes 59, A89-A89.
Farmer, S.R. (2003). The forkhead transcription factor Foxo1: a possible link between obesity and insulin resistance. Molecular Cell 11, 6-8.
Fernandez-Veledo, S., Nieto-Vazquez, I., Rondinone, C.M., and Lorenzo, M. (2006). Liver X receptor agonists ameliorate TNFalpha-induced insulin resistance in murine brown adipocytes by downregulating protein tyrosine phosphatase-1B gene expression. Diabetologia 49, 3038-3048.
Ferre, P., and Foufelle, F. (2010). Hepatic steatosis: a role for de novo lipogenesis and the transcription factor SREBP-1c. Diabetes, obesity & metabolism 12 Suppl 2, 83-92.
Finck, B.N., Gropler, M.C., Chen, Z., Leone, T.C., Croce, M.A., Harris, T.E., Lawrence, J.C., Jr., and Kelly, D.P. (2006). Lipin 1 is an inducible amplifier of the hepatic PGC-1alpha/PPARalpha regulatory pathway. Cell Metabolism 4, 199-210.
Flowers, M.T., and Ntambi, J.M. (2008). Role of stearoyl-coenzyme A desaturase in regulating lipid metabolism. Current opinion in lipidology 19, 248-256.
Frayling, T.M., Timpson, N.J., Weedon, M.N., Zeggini, E., Freathy, R.M., Lindgren, C.M., Perry, J.R., Elliott, K.S., Lango, H., Rayner, N.W., et al. (2007). A common variant in the FTO gene is associated with body mass index and predisposes to childhood and adult obesity. Science 316, 889-894.
Frolich, L., Blum-Degen, D., Bernstein, H.G., Engelsberger, S., Humrich, J., Laufer, S., Muschner, D., Thalheimer, A., Turk, A., Hoyer, S., et al. (1998). Brain insulin and insulin receptors in aging and sporadic Alzheimer's disease. J Neural Transm 105, 423-438.
Frolich, L., Blum-Degen, D., Riederer, P., and Hoyer, S. (1999). A disturbance in the neuronal insulin receptor signal transduction in sporadic Alzheimer's disease. Ann N Y Acad Sci 893, 290-293.
Gerozissis, K., Orosco, M., Rouch, C., and Nicolaidis, S. (1993). Basal and hyperinsulinemia-induced immunoreactive hypothalamic insulin changes in lean and genetically obese Zucker rats revealed by microdialysis. Brain Research 611, 258-263.
Gerozissis, K., Orosco, M., Rouch, C., and Nicolaidis, S. (1997). Insulin responses to a fat meal in hypothalamic microdialysates and plasma. Physiology & behavior 62, 767-772.
Gerozissis, K., Rouch, C., Lemierre, S., Nicolaidis, S., and Orosco, M. (2001). A potential role of central insulin in learning and memory related to feeding. Cell Mol Neurobiol 21, 389-401.
Gerozissis, K., Rouch, C., Nicolaidis, S., and Orosco, M. (1999). Brain insulin response to feeding in the rat is both macronutrient and area specific. Physiology & behavior 66, 271-275.
Giddings, S.J., Chirgwin, J., and Permutt, M.A. (1985). Evaluation of rat insulin messenger RNA in pancreatic and extrapancreatic tissues. Diabetologia 28, 343-347.

Gilchrist, M., Thorsson, V., Li, B., Rust, A.G., Korb, M., Roach, J.C., Kennedy, K., Hai, T., Bolouri, H., and Aderem, A. (2006). Systems biology approaches identify ATF3 as a negative regulator of Toll-like receptor 4. Nature 441, 173-178.
Graham, T.E., Yang, Q., Bluher, M., Hammarstedt, A., Ciaraldi, T.P., Henry, R.R., Wason, C.J., Oberbach, A., Jansson, P.A., Smith, U., et al. (2006). Retinol-binding protein 4 and insulin resistance in lean, obese, and diabetic subjects. The New England journal of medicine 354, 2552-2563.
Gray, S., Feinberg, M.W., Hull, S., Kuo, C.T., Watanabe, M., Sen-Banerjee, S., DePina, A., Haspel, R., and Jain, M.K. (2002). The Kruppel-like factor KLF15 regulates the insulin-sensitive glucose transporter GLUT4. The Journal of biological chemistry 277, 34322-34328.
Gronning, L.M., Cederberg, A., Miura, N., Enerback, S., and Tasken, K. (2002). Insulin and TNF alpha induce expression of the forkhead transcription factor gene Foxc2 in 3T3-L1 adipocytes via PI3K and ERK 1/2-dependent pathways. Mol Endocrinol 16, 873-883.
Grunblatt, E., Koutsilieri, E., Hoyer, S., and Riederer, P. (2006). Gene expression alterations in brain areas of intracerebroventricular streptozotocin treated rat. J Alzheimers Dis 9, 261-271.
Grunblatt, E., Salkovic-Petrisic, M., Osmanovic, J., Riederer, P., and Hoyer, S. (2007). Brain insulin system dysfunction in streptozotocin intracerebroventricularly treated rats generates hyperphosphorylated tau protein. Journal of Neurochemistry 101, 757-770.
Guilherme, A., Virbasius, J.V., Puri, V., and Czech, M.P. (2008). Adipocyte dysfunctions linking obesity to insulin resistance and type 2 diabetes. Nature reviews. Molecular cell biology 9, 367-377.
Harada, K., Shen, W.J., Patel, S., Natu, V., Wang, J., Osuga, J., Ishibashi, S., and Kraemer, F.B. (2003). Resistance to high-fat diet-induced obesity and altered expression of adipose-specific genes in HSL-deficient mice. Am J Physiol Endocrinol Metab 285, E1182-1195.
Havrankova, J., Schmechel, D., Roth, J., and Brownstein, M. (1978a). Identification of insulin in rat brain. Proc Natl Acad Sci U S A 75, 5737-5741.
Havrankova, J., Schmechel, D., Roth, J., and Brownstein, M. (1978b). Identification of Insulin in Rat-Brain. P Natl Acad Sci USA 75, 5737-5741.
Hill, J.M., Lesniak, M.A., Pert, C.B., and Roth, J. (1986). Autoradiographic localization of insulin receptors in rat brain: prominence in olfactory and limbic areas. Neuroscience 17, 1127-1138.
Hoffman, B.G., Zavaglia, B., Witzsche, J., Ruiz de Algara, T., Beach, M., Hoodless, P.A., Jones, S.J., Marra, M.A., and Helgason, C.D. (2008). Identification of transcripts with enriched expression in the developing and adult pancreas. Genome Biol 9, R99.
Hrytsenko, O., Wright, J.R., Jr., Morrison, C.M., and Pohajdak, B. (2007). Insulin expression in the brain and pituitary cells of tilapia (Oreochromis niloticus). Brain Research 1135, 31-40.
Hua, Q.X., Nakagawa, S.H., Wilken, J., Ramos, R.R., Jia, W., Bass, J., and Weiss, M.A. (2003). A divergent INS protein in Caenorhabditis elegans structurally resembles human insulin and activates the human insulin receptor. Genes & development 17, 826-831.
Huong, D.T., and Ide, T. (2008). Dietary lipoic acid-dependent changes in the activity and mRNA levels of hepatic lipogenic enzymes in rats. Br J Nutr 100, 79-87.
Hwangbo, D.S., Gershman, B., Tu, M.P., Palmer, M., and Tatar, M. (2004). Drosophila dFOXO controls lifespan and regulates insulin signalling in brain and fat body. Nature 429, 562-566.
Iizuka, K., and Horikawa, Y. (2008). ChREBP: a glucose-activated transcription factor involved in the development of metabolic syndrome. Endocrine journal 55, 617-624.
Iwabu, M., Yamauchi, T., Okada-Iwabu, M., Sato, K., Nakagawa, T., Funata, M., Yamaguchi, M., Namiki, S., Nakayama, R., Tabata, M., et al. (2010). Adiponectin and AdipoR1 regulate PGC-1alpha and mitochondria by Ca(2+) and AMPK/SIRT1. Nature 464, 1313-1319.
Jay, M.A., and Ren, J. (2007). Peroxisome proliferator-activated receptor (PPAR) in metabolic syndrome and type 2 diabetes mellitus. Curr Diabetes Rev 3, 33-39.
Jeffrey, K.D., Alejandro, E.U., Luciani, D.S., Kalynyak, T.B., Hu, X., Li, H., Lin, Y., Townsend, R.R., Polonsky, K.S., and Johnson, J.D. (2008). Carboxypeptidase E mediates palmitate-induced beta-cell ER stress and apoptosis. Proc Natl Acad Sci U S A 105, 8452-8457.
Jezek, P. (2002). Possible physiological roles of mitochondrial uncoupling proteins--UCPn. Int J Biochem Cell Biol 34, 1190-1206.

Jhun, B.H., Haruta, T., Meinkoth, J.L., Leitner, W., Draznin, B., Saltiel, A.R., Pang, L., Sasaoka, T., and Olefsky, J.M. (1995). Signal transduction pathways leading to insulin-induced early gene induction. Biochemistry 34, 7996-8004.
Jo, J., Choi, M.Y., and Koh, D.S. (2007). Size distribution of mouse Langerhans islets. Biophysical Journal 93, 2655-2666.
Johnson, J.D., and Alejandro, E.U. (2008). Control of pancreatic beta-cell fate by insulin signaling: The sweet spot hypothesis. Cell Cycle 7, 1343-1347.
Johnson, J.D., Bernal-Mizrachi, E., Alejandro, E.U., Han, Z., Kalynyak, T.B., Li, H., Beith, J.L., Gross, J., Warnock, G.L., Townsend, R.R., et al. (2006a). Insulin protects islets from apoptosis via Pdx1 and specific changes in the human islet proteome. Proc Natl Acad Sci U S A 103, 19575-19580.
Johnson, J.D., Ford, E.L., Bernal-Mizrachi, E., Kusser, K.L., Luciani, D.S., Han, Z., Tran, H., Randall, T.D., Lund, F.E., and Polonsky, K.S. (2006b). Suppressed insulin signaling and increased apoptosis in CD38-null islets. Diabetes 55, 2737-2746.
Johnson, J.D., and Misler, S. (2002). Nicotinic acid-adenine dinucleotide phosphate-sensitive calcium stores initiate insulin signaling in human beta cells. Proc Natl Acad Sci U S A 99, 14566-14571.
Jones, J.R., Barrick, C., Kim, K.A., Lindner, J., Blondeau, B., Fujimoto, Y., Shiota, M., Kesterson, R.A., Kahn, B.B., and Magnuson, M.A. (2005). Deletion of PPARgamma in adipose tissues of mice protects against high fat diet-induced obesity and insulin resistance. Proc Natl Acad Sci U S A 102, 6207-6212.
Jones, M.J., Bogutz, A.B., and Lefebvre, L. (2011). An extended domain of Kcnq1ot1 silencing revealed by an imprinted fluorescent reporter. Mol Cell Biol 31, 2827-2837.
Kaestner, K.H. (2008). A two-step pathway to resist fasting. Cell Metabolism 8, 449-451. Kalaany, N.Y., Gauthier, K.C., Zavacki, A.M., Mammen, P.P., Kitazume, T., Peterson, J.A., Horton,
J.D., Garry, D.J., Bianco, A.C., and Mangelsdorf, D.J. (2005). LXRs regulate the balance between fat storage and oxidation. Cell Metabolism 1, 231-244.
Keeton, A.B., Bortoff, K.D., Bennett, W.L., Franklin, J.L., Venable, D.Y., and Messina, J.L. (2003). Insulin-regulated expression of Egr-1 and Krox20: dependence on ERK1/2 and interaction with p38 and PI3-kinase pathways. Endocrinology 144, 5402-5410.
Kershaw, E.E., Hamm, J.K., Verhagen, L.A., Peroni, O., Katic, M., and Flier, J.S. (2006). Adipose triglyceride lipase: function, regulation by insulin, and comparison with adiponutrin. Diabetes 55, 148-157.
Kharitonenkov, A., Shiyanova, T.L., Koester, A., Ford, A.M., Micanovic, R., Galbreath, E.J., Sandusky, G.E., Hammond, L.J., Moyers, J.S., Owens, R.A., et al. (2005). FGF-21 as a novel metabolic regulator. The Journal of clinical investigation 115, 1627-1635.
Kim, H.B., Kong, M., Kim, T.M., Suh, Y.H., Kim, W.H., Lim, J.H., Song, J.H., and Jung, M.H. (2006). NFATc4 and ATF3 negatively regulate adiponectin gene expression in 3T3-L1 adipocytes. Diabetes 55, 1342-1352.
Kim, J.B., Sarraf, P., Wright, M., Yao, K.M., Mueller, E., Solanes, G., Lowell, B.B., and Spiegelman, B.M. (1998). Nutritional and insulin regulation of fatty acid synthetase and leptin gene expression through ADD1/SREBP1. The Journal of clinical investigation 101, 1-9.
Kloting, N., Graham, T.E., Berndt, J., Kralisch, S., Kovacs, P., Wason, C.J., Fasshauer, M., Schon, M.R., Stumvoll, M., Bluher, M., et al. (2007). Serum retinol-binding protein is more highly expressed in visceral than in subcutaneous adipose tissue and is a marker of intra-abdominal fat mass. Cell Metabolism 6, 79-87.
Kodama, E., Kuhara, A., Mohri-Shiomi, A., Kimura, K.D., Okumura, M., Tomioka, M., Iino, Y., and Mori, I. (2006). Insulin-like signaling and the neural circuit for integrative behavior in C. elegans. Genes & development 20, 2955-2960.
Koh, I.U., Lim, J.H., Joe, M.K., Kim, W.H., Jung, M.H., Yoon, J.B., and Song, J. (2010). AdipoR2 is transcriptionally regulated by ER stress-inducible ATF3 in HepG2 human hepatocyte cells. The FEBS journal 277, 2304-2317.
Kojima, H., Fujimiya, M., Terashima, T., Kimura, H., and Chan, L. (2006). Extrapancreatic proinsulin/insulin-expressing cells in diabetes mellitus: is history repeating itself? Endocr J 53, 715-722.
Koren, S., and Fantus, I.G. (2007). Inhibition of the protein tyrosine phosphatase PTP1B: potential therapy for obesity, insulin resistance and type-2 diabetes mellitus. Best Pract Res Clin Endocrinol Metab 21, 621-640.
Krauss, S., Zhang, C.Y., and Lowell, B.B. (2005). The mitochondrial uncoupling-protein homologues. Nat Rev Mol Cell Biol 6, 248-261.
Laffitte, B.A., Chao, L.C., Li, J., Walczak, R., Hummasti, S., Joseph, S.B., Castrillo, A., Wilpitz, D.C., Mangelsdorf, D.J., Collins, J.L., et al. (2003). Activation of liver X receptor improves glucose tolerance through coordinate regulation of glucose metabolism in liver and adipose tissue. P Natl Acad Sci USA 100, 5419-5424.
Lagouge, M., Argmann, C., Gerhart-Hines, Z., Meziane, H., Lerin, C., Daussin, F., Messadeq, N., Milne, J., Lambert, P., Elliott, P., et al. (2006). Resveratrol improves mitochondrial function and protects against metabolic disease by activating SIRT1 and PGC-1alpha. Cell 127, 1109-1122.
Lake, A.C., Sun, Y., Li, J.L., Kim, J.E., Johnson, J.W., Li, D., Revett, T., Shih, H.H., Liu, W., Paulsen, J.E., et al. (2005). Expression, regulation, and triglyceride hydrolase activity of Adiponutrin family members. Journal of lipid research 46, 2477-2487.
Lamotte, L., Jackerott, M., Bucchini, D., Jami, J., Joshi, R.L., and Deltour, L. (2004). Knock-in of diphteria toxin A chain gene at Ins2 locus: effects on islet development and localization of Ins2 expression in the brain. Transgenic Res 13, 463-473.
Langin, D., Laurell, H., Holst, L.S., Belfrage, P., and Holm, C. (1993). Gene organization and primary structure of human hormone-sensitive lipase: possible significance of a sequence homology with a lipase of Moraxella TA144, an antarctic bacterium. P Natl Acad Sci USA 90, 4897-4901.
Leonardsson, G., Steel, J.H., Christian, M., Pocock, V., Milligan, S., Bell, J., So, P.W., Medina-Gomez, G., Vidal-Puig, A., White, R., et al. (2004). Nuclear receptor corepressor RIP140 regulates fat accumulation. P Natl Acad Sci USA 101, 8437-8442.
Lester-Coll, N., Rivera, E.J., Soscia, S.J., Doiron, K., Wands, J.R., and de la Monte, S.M. (2006). Intracerebral streptozotocin model of type 3 diabetes: relevance to sporadic Alzheimer's disease. Journal of Alzheimer's disease : JAD 9, 13-33.
Li, X., Thomason, P.A., Withers, D.J., and Scott, J. (2010). Bio-informatics analysis of a gene co-expression module in adipose tissue containing the diet-responsive gene Nnat. BMC systems biology 4, 175.
Lidell, M.E., Seifert, E.L., Westergren, R., Heglind, M., Gowing, A., Sukonina, V., Arani, Z., Itkonen, P., Wallin, S., Westberg, F., et al. (2011). The adipocyte-expressed forkhead transcription factor Foxc2 regulates metabolism through altered mitochondrial function. Diabetes 60, 427-435.
Lim, J.H., Lee, J.I., Suh, Y.H., Kim, W., Song, J.H., and Jung, M.H. (2006). Mitochondrial dysfunction induces aberrant insulin signalling and glucose utilisation in murine C2C12 myotube cells. Diabetologia 49, 1924-1936.
Lin, J., Yang, R., Tarr, P.T., Wu, P.H., Handschin, C., Li, S., Yang, W., Pei, L., Uldry, M., Tontonoz, P., et al. (2005). Hyperlipidemic effects of dietary saturated fats mediated through PGC-1beta coactivation of SREBP. Cell 120, 261-273.
Liu, Y., Dentin, R., Chen, D., Hedrick, S., Ravnskjaer, K., Schenk, S., Milne, J., Meyers, D.J., Cole, P., Yates, J., 3rd, et al. (2008). A fasting inducible switch modulates gluconeogenesis via activator/coactivator exchange. Nature 456, 269-273.
Liu, Y., Michael, M.D., Kash, S., Bensch, W.R., Monia, B.P., Murray, S.F., Otto, K.A., Syed, S.K., Bhanot, S., Sloop, K.W., et al. (2007). Deficiency of adiponectin receptor 2 reduces diet-induced insulin resistance but promotes type 2 diabetes. Endocrinology 148, 683-692.
Liu, Y.M., Moldes, M., Bastard, J.P., Bruckert, E., Viguerie, N., Hainque, B., Basdevant, A., Langin, D., Pairault, J., and Clement, K. (2004). Adiponutrin: A new gene regulated by energy balance in human adipose tissue. The Journal of clinical endocrinology and metabolism 89, 2684-2689.
Luciani, D.S., and Johnson, J.D. (2005). Acute effects of insulin on beta-cells from transplantable human islets. Molecular and Cellular Endocrinology 241, 88-98.
Luo, X., and Kraus, W.L. (2011). A one and a two ... expanding roles for poly(ADP-ribose) polymerases in metabolism. Cell Metabolism 13, 353-355.

Matsuzaki, H., Daitoku, H., Hatta, M., Tanaka, K., and Fukamizu, A. (2003). Insulin-induced phosphorylation of FKHR (Foxo1) targets to proteasomal degradation. P Natl Acad Sci USA 100, 11285-11290.
Mauvoisin, D., and Mounier, C. (2011). Hormonal and nutritional regulation of SCD1 gene expression. Biochimie 93, 78-86.
Miller, R.S., Diaczok, D., and Cooke, D.W. (2007). Repression of GLUT4 expression by the endoplasmic reticulum stress response in 3T3-L1 adipocytes. Biochem Bioph Res Co 362, 188-192.
Miller, S.G., De Vos, P., Guerre-Millo, M., Wong, K., Hermann, T., Staels, B., Briggs, M.R., and Auwerx, J. (1996). The adipocyte specific transcription factor C/EBPalpha modulates human ob gene expression. P Natl Acad Sci USA 93, 5507-5511.
Miyazaki, M., Flowers, M.T., Sampath, H., Chu, K., Otzelberger, C., Liu, X., and Ntambi, J.M. (2007). Hepatic stearoyl-CoA desaturase-1 deficiency protects mice from carbohydrate-induced adiposity and hepatic steatosis. Cell Metabolism 6, 484-496.
Mogensen, M., Sahlin, K., Fernstrom, M., Glintborg, D., Vind, B.F., Beck-Nielsen, H., and Hojlund, K. (2007). Mitochondrial respiration is decreased in skeletal muscle of patients with type 2 diabetes. Diabetes 56, 1592-1599.
Moldes, M., Beauregard, G., Faraj, M., Peretti, N., Ducluzeau, P.H., Laville, M., Rabasa-Lhoret, R., Vidal, H., and Clement, K. (2006). Adiponutrin gene is regulated by insulin and glucose in human adipose tissue. European journal of endocrinology / European Federation of Endocrine Societies 155, 461-468.
Moon, Y.S., Latasa, M.J., Kim, K.H., Wang, D., and Sul, H.S. (2000). Two 5'-regions are required for nutritional and insulin regulation of the fatty-acid synthase promoter in transgenic mice. The Journal of biological chemistry 275, 10121-10127.
Moroz, N., Tong, M., Longato, L., Xu, H., and de la Monte, S.M. (2008). Limited Alzheimer-type neurodegeneration in experimental obesity and type 2 diabetes mellitus. Journal of Alzheimer's disease : JAD 15, 29-44.
Mukherjee, R., Davies, P.J., Crombie, D.L., Bischoff, E.D., Cesario, R.M., Jow, L., Hamann, L.G., Boehm, M.F., Mondon, C.E., Nadzan, A.M., et al. (1997). Sensitization of diabetic and obese mice to insulin by retinoid X receptor agonists. Nature 386, 407-410.
Najimi, M., Chigr, F., Jordan, D., Leduque, P., Bloch, B., Tommasi, M., Rebaud, P., and Kopp, N. (1990). Anatomical distribution of LHRH-immunoreactive neurons in the human infant hypothalamus and extrahypothalamic regions. Brain Research 516, 280-291.
Nakae, J., Kitamura, T., Kitamura, Y., Biggs, W.H., 3rd, Arden, K.C., and Accili, D. (2003). The forkhead transcription factor Foxo1 regulates adipocyte differentiation. Developmental cell 4, 119-129.
Nakayama, M., Abiru, N., Moriyama, H., Babaya, N., Liu, E., Miao, D., Yu, L., Wegmann, D.R., Hutton, J.C., Elliott, J.F., et al. (2005). Prime role for an insulin epitope in the development of type 1 diabetes in NOD mice. Nature 435, 220-223.
Narasimhan, S.D., Yen, K., and Tissenbaum, H.A. (2009). Converging pathways in lifespan regulation. Curr Biol 19, R657-666.
Nelson, J.D., LeBoeuf, R.C., and Bomsztyk, K. (2011). Direct recruitment of insulin receptor and ERK signaling cascade to insulin-inducible gene loci. Diabetes 60, 127-137.
Nishimura, M., Takahashi, H., Matsusawa, M., Ikegaki, I., Nakanishi, T., and Yoshimura, M. (1991). The effects of insulin and insulin-like materials in the brain on central cardiovascular regulation: with special reference to the central effects of sodium chloride. Journal of hypertension 9, 509-517.
Oda, S., Tomioka, M., and Iino, Y. (2011). Neuronal plasticity regulated by the insulin-like signaling pathway underlies salt chemotaxis learning in Caenorhabditis elegans. Journal of neurophysiology 106, 301-308.
Orosco, M., Gerozissis, K., Rouch, C., Meile, M.J., and Nicolaidis, S. (1995a). Hypothalamic monoamines and insulin in relation to feeding in the genetically obese Zucker rat as revealed by microdialysis. Obesity Research 3 Suppl 5, 655S-665S.
Orosco, M., Gerozissis, K., Rouch, C., and Nicolaidis, S. (1995b). Feeding-related immunoreactive insulin changes in the PVN-VMH revealed by microdialysis. Brain Research 671, 149-158.

Orosco, M., Rouch, C., and Gerozissis, K. (2000). Activation of hypothalamic insulin by serotonin is the primary event of the insulin-serotonin interaction involved in the control of feeding. Brain Research 872, 64-70.
Osmanovic, J., Plaschke, K., Salkovic-Petrisic, M., Grunblatt, E., Riederer, P., and Hoyer, S. (2010). Chronic exogenous corticosterone administration generates an insulin-resistant brain state in rats. Stress 13, 123-131.
Ozcan, U., Cao, Q., Yilmaz, E., Lee, A.H., Iwakoshi, N.N., Ozdelen, E., Tuncman, G., Gorgun, C., Glimcher, L.H., and Hotamisligil, G.S. (2004). Endoplasmic reticulum stress links obesity, insulin action, and type 2 diabetes. Science 306, 457-461.
Park, S.Y., Cho, Y.R., Kim, H.J., Higashimori, T., Danton, C., Lee, M.K., Dey, A., Rothermel, B., Kim, Y.B., Kalinowski, A., et al. (2005). Unraveling the temporal pattern of diet-induced insulin resistance in individual organs and cardiac dysfunction in C57BL/6 mice. Diabetes 54, 3530-3540.
Pearce, N.J., Yates, J.W., Berkhout, T.A., Jackson, B., Tew, D., Boyd, H., Camilleri, P., Sweeney, P., Gribble, A.D., Shaw, A., et al. (1998). The role of ATP citrate-lyase in the metabolic regulation of plasma lipids. Hypolipidaemic effects of SB-204990, a lactone prodrug of the potent ATP citrate-lyase inhibitor SB-201076. Biochem J 334 ( Pt 1), 113-119.
Plaschke, K., Kopitz, J., Siegelin, M., Schliebs, R., Salkovic-Petrisic, M., Riederer, P., and Hoyer, S. (2009). Insulin-Resistant Brain State after Intracerebroventricular Streptozotocin Injection Deteriorates Alzheimer-like Changes in Tg2576 AbetaPP-Overexpressing Mice. J Alzheimers Dis.
Plaschke, K., Kopitz, J., Siegelin, M., Schliebs, R., Salkovic-Petrisic, M., Riederer, P., and Hoyer, S. (2010). Insulin-resistant brain state after intracerebroventricular streptozotocin injection exacerbates Alzheimer-like changes in Tg2576 AbetaPP-overexpressing mice. J Alzheimers Dis 19, 691-704.
Postic, C., Dentin, R., Denechaud, P.D., and Girard, J. (2007). ChREBP, a transcriptional regulator of glucose and lipid metabolism. Annual review of nutrition 27, 179-192.
Pradhan, A. (2007). Obesity, metabolic syndrome, and type 2 diabetes: inflammatory basis of glucose metabolic disorders. Nutr Rev 65, S152-156.
Prasad, M.R., and Joshi, V.C. (1979). Regulation of rat hepatic stearoyl coenzyme A desaturase. The roles of insulin and carbohydrate. The Journal of biological chemistry 254, 997-999.
Pugliese, A., Zeller, M., Fernandez, A., Jr., Zalcberg, L.J., Bartlett, R.J., Ricordi, C., Pietropaolo, M., Eisenbarth, G.S., Bennett, S.T., and Patel, D.D. (1997). The insulin gene is transcribed in the human thymus and transcription levels correlated with allelic variation at the INS VNTR-IDDM2 susceptibility locus for type 1 diabetes. Nat Genet 15, 293-297.
Puigserver, P., Adelmant, G., Wu, Z., Fan, M., Xu, J., O'Malley, B., and Spiegelman, B.M. (1999). Activation of PPARgamma coactivator-1 through transcription factor docking. Science 286, 1368-1371.
Puigserver, P., Rhee, J., Donovan, J., Walkey, C.J., Yoon, J.C., Oriente, F., Kitamura, Y., Altomonte, J., Dong, H., Accili, D., et al. (2003). Insulin-regulated hepatic gluconeogenesis through FOXO1-PGC-1alpha interaction. Nature 423, 550-555.
Puigserver, P., and Rodgers, J.T. (2006). Foxa2, a novel transcriptional regulator of insulin sensitivity. Nature Medicine 12, 38-39.
Purushotham, A., Schug, T.T., Xu, Q., Surapureddi, S., Guo, X., and Li, X. (2009). Hepatocyte-specific deletion of SIRT1 alters fatty acid metabolism and results in hepatic steatosis and inflammation. Cell Metabolism 9, 327-338.
Qi, L., Saberi, M., Zmuda, E., Wang, Y., Altarejos, J., Zhang, X., Dentin, R., Hedrick, S., Bandyopadhyay, G., Hai, T., et al. (2009). Adipocyte CREB promotes insulin resistance in obesity. Cell Metabolism 9, 277-286.
Rahman, S.M., Dobrzyn, A., Dobrzyn, P., Lee, S.H., Miyazaki, M., and Ntambi, J.M. (2003). Stearoyl-CoA desaturase 1 deficiency elevates insulin-signaling components and down-regulates protein-tyrosine phosphatase 1B in muscle. P Natl Acad Sci USA 100, 11110-11115.
Raizada, M.K. (1983). Localization of insulin-like immunoreactivity in the neurons from primary cultures of rat brain. Experimental cell research 143, 351-357.
Riederer, P., Bartl, J., Laux, G., and Grunblatt, E. (2011). Diabetes type II: a risk factor for depression-Parkinson-Alzheimer? Neurotox Res 19, 253-265.

Rivera, E.J., Goldin, A., Fulmer, N., Tavares, R., Wands, J.R., and de la Monte, S.M. (2005). Insulin and insulin-like growth factor expression and function deteriorate with progression of Alzheimer's disease: link to brain reductions in acetylcholine. Journal of Alzheimer's disease : JAD 8, 247-268.
Rosenzweig, J.L., Havrankova, J., Lesniak, M.A., Brownstein, M., and Roth, J. (1980). Insulin is ubiquitous in extrapancreatic tissues of rats and humans. Proc Natl Acad Sci U S A 77, 572-576.
Rulifson, E.J., Kim, S.K., and Nusse, R. (2002). Ablation of insulin-producing neurons in flies: growth and diabetic phenotypes. Science 296, 1118-1120.
Salkovic-Petrisic, M., Lackovic, Z., Hoyer, S., and Riederer, P. (2005). Central administration of alloxan impairs glucose tolerance in rats. J Neural Transm 112, 1391-1395.
Salkovic-Petrisic, M., Osmanovic, J., Grunblatt, E., Riederer, P., and Hoyer, S. (2009). Modeling sporadic Alzheimer's disease: the insulin resistant brain state generates multiple long-term morphobiological abnormalities including hyperphosphorylated tau protein and amyloid-beta. J Alzheimers Dis 18, 729-750.
Saltiel, A.R., and Kahn, C.R. (2001). Insulin signalling and the regulation of glucose and lipid metabolism. Nature 414, 799-806.
Sanchez, J., Palou, A., and Pico, C. (2009). Response to carbohydrate and fat refeeding in the expression of genes involved in nutrient partitioning and metabolism: striking effects on fibroblast growth factor-21 induction. Endocrinology 150, 5341-5350.
Schechter, R., Holtzclaw, L., Sadiq, F., Kahn, A., and Devaskar, S. (1988). Insulin synthesis by isolated rabbit neurons. Endocrinology 123, 505-513.
Schechter, R., Sadiq, H.F., and Devaskar, S.U. (1990). Insulin and insulin mRNA are detected in neuronal cell cultures maintained in an insulin-free/serum-free medium. J Histochem Cytochem 38, 829-836.
Schechter, R., Whitmire, J., Holtzclaw, L., George, M., Harlow, R., and Devaskar, S.U. (1992). Developmental regulation of insulin in the mammalian central nervous system. Brain Research 582, 27-37.
Schechter, R., Whitmire, J., Wheet, G.S., Beju, D., Jackson, K.W., Harlow, R., and Gavin, J.R., 3rd (1994). Immunohistochemical and in situ hybridization study of an insulin-like substance in fetal neuron cell cultures. Brain Research 636, 9-27.
Serrano, J., Bevins, C.L., Young, S.W., and de Pablo, F. (1989). Insulin gene expression in chicken ontogeny: pancreatic, extrapancreatic, and prepancreatic. Developmental Biology 132, 410-418.
Shen, N., Yu, X., Pan, F.Y., Gao, X., Xue, B., and Li, C.J. (2011). An early response transcription factor, Egr-1, enhances insulin resistance in type 2 diabetes with chronic hyperinsulinism. The Journal of biological chemistry 286, 14508-14515.
Siddiqui, A.S., Khattra, J., Delaney, A.D., Zhao, Y., Astell, C., Asano, J., Babakaiff, R., Barber, S., Beland, J., Bohacec, S., et al. (2005). A mouse atlas of gene expression: large-scale digital gene-expression profiles from precisely defined developing C57BL/6J mouse tissues and cells. Proc Natl Acad Sci U S A 102, 18485-18490.
Silva, J.P., von Meyenn, F., Howell, J., Thorens, B., Wolfrum, C., and Stoffel, M. (2009). Regulation of adaptive behaviour during fasting by hypothalamic Foxa2. Nature 462, 646-650.
Singh, B.S., Rajakumar, P.A., Eves, E.M., Rosner, M.R., Wainer, B.H., and Devaskar, S.U. (1997). Insulin gene expression in immortalized rat hippocampal and pheochromocytoma-12 cell lines. Regul Pept 69, 7-14.
Sirek, A.S., Liu, L., Naples, M., Adeli, K., Ng, D.S., and Jin, T. (2009). Insulin stimulates the expression of carbohydrate response element binding protein (ChREBP) by attenuating the repressive effect of Pit-1, Oct-1/Oct-2, and Unc-86 homeodomain protein octamer transcription factor-1. Endocrinology 150, 3483-3492.
Soscia, S.J., Tong, M., Xu, X.J., Cohen, A.C., Chu, J., Wands, J.R., and de la Monte, S.M. (2006). Chronic gestational exposure to ethanol causes insulin and IGF resistance and impairs acetylcholine homeostasis in the brain. Cellular and molecular life sciences : CMLS 63, 2039-2056.
Steen, E., Terry, B.M., Rivera, E.J., Cannon, J.L., Neely, T.R., Tavares, R., Xu, X.J., Wands, J.R., and de la Monte, S.M. (2005). Impaired insulin and insulin-like growth factor expression and signaling mechanisms in Alzheimer's disease--is this type 3 diabetes? J Alzheimers Dis 7, 63-80.

Stempniak, B., and Guzek, J.W. (1993). Insulin-like immunoreactivity (IRI) in the rat hypothalamo-neurohypophysial system: effect of dehydration and haemorrhage. Journal of physiology and pharmacology : an official journal of the Polish Physiological Society 44, 155-159.
Stevenson, R.W. (1983). Further evidence for non-pancreatic insulin immunoreactivity in guinea pig brain. Hormone and metabolic research = Hormon- und Stoffwechselforschung = Hormones et metabolisme 15, 526-529.
Tabassum, R., Chavali, S., Dwivedi, O.P., Tandon, N., and Bharadwaj, D. (2008). Genetic variants of FOXA2: risk of type 2 diabetes and effect on metabolic traits in North Indians. Journal of human genetics 53, 957-965.
Teshigawara, K., Ogawa, W., Mori, T., Matsuki, Y., Watanabe, E., Hiramatsu, R., Inoue, H., Miyake, K., Sakaue, H., and Kasuga, M. (2005). Role of Kruppel-like factor 15 in PEPCK gene expression in the liver. Biochem Bioph Res Co 327, 920-926.
Tong, M., and de la Monte, S.M. (2009). Mechanisms of ceramide-mediated neurodegeneration. Journal of Alzheimer's disease : JAD 16, 705-714.
Tong, M., Dong, M., and de la Monte, S.M. (2009). Brain insulin-like growth factor and neurotrophin resistance in Parkinson's disease and dementia with Lewy bodies: potential role of manganese neurotoxicity. Journal of Alzheimer's disease : JAD 16, 585-599.
Tontonoz, P., and Spiegelman, B.M. (2008). Fat and beyond: the diverse biology of PPARgamma. Annual review of biochemistry 77, 289-312.
Unger, J., McNeill, T.H., Moxley, R.T., 3rd, White, M., Moss, A., and Livingston, J.N. (1989). Distribution of insulin receptor-like immunoreactivity in the rat forebrain. Neuroscience 31, 143-157.
Wang, D., and Sul, H.S. (1995). Upstream stimulatory factors bind to insulin response sequence of the fatty acid synthase promoter. USF1 is regulated. The Journal of biological chemistry 270, 28716-28722.
Wang, D., and Sul, H.S. (1998). Insulin stimulation of the fatty acid synthase promoter is mediated by the phosphatidylinositol 3-kinase pathway. Involvement of protein kinase B/Akt. The Journal of biological chemistry 273, 25420-25426.
Wang, W., Huang, L., Huang, Y., Yin, J.W., Berk, A.J., Friedman, J.M., and Wang, G. (2009). Mediator MED23 links insulin signaling to the adipogenesis transcription cascade. Developmental cell 16, 764-771.
Watanabe, A., Fujiwara, M., and Nagashima, H. (1986). Glucagon-like polypeptide and insulin contents in the brain from acute hepatic failure dogs. Res Exp Med (Berl) 186, 203-208.
Weyhenmeyer, J.A., and Fellows, R.E. (1983). Presence of immunoreactive insulin in neurons cultured from fetal rat brain. Cell Mol Neurobiol 3, 81-86.
Wheatcroft, S.B., and Kearney, M.T. (2009). IGF-dependent and IGF-independent actions of IGF-binding protein-1 and -2: implications for metabolic homeostasis. Trends in endocrinology and metabolism: TEM 20, 153-162.
Wolfrum, C., Asilmaz, E., Luca, E., Friedman, J.M., and Stoffel, M. (2004). Foxa2 regulates lipid metabolism and ketogenesis in the liver during fasting and in diabetes. Nature 432, 1027-1032.
Wolfrum, C., and Stoffel, M. (2006). Coactivation of Foxa2 through Pgc-1beta promotes liver fatty acid oxidation and triglyceride/VLDL secretion. Cell Metabolism 3, 99-110.
Wong, R.H., and Sul, H.S. (2010). Insulin signaling in fatty acid and fat synthesis: a transcriptional perspective. Current opinion in pharmacology 10, 684-691.
Wozniak, M., Rydzewski, B., Baker, S.P., and Raizada, M.K. (1993). The cellular and physiological actions of insulin in the central nervous system. Neurochemistry international 22, 1-10.
Wu, Z., Rosen, E.D., Brun, R., Hauser, S., Adelmant, G., Troy, A.E., McKeon, C., Darlington, G.J., and Spiegelman, B.M. (1999). Cross-regulation of C/EBP alpha and PPAR gamma controls the transcriptional pathway of adipogenesis and insulin sensitivity. Molecular Cell 3, 151-158.
Yamamoto, J., Ikeda, Y., Iguchi, H., Fujino, T., Tanaka, T., Asaba, H., Iwasaki, S., Ioka, R.X., Kaneko, I.W., Magoori, K., et al. (2004). A Kruppel-like factor KLF15 contributes fasting-induced transcriptional activation of mitochondrial acetyl-CoA synthetase gene AceCS2. The Journal of biological chemistry 279, 16954-16962.

Yang, Q., Graham, T.E., Mody, N., Preitner, F., Peroni, O.D., Zabolotny, J.M., Kotani, K., Quadro, L., and Kahn, B.B. (2005). Serum retinol binding protein 4 contributes to insulin resistance in obesity and type 2 diabetes. Nature 436, 356-362.
Yang, X., Enerback, S., and Smith, U. (2003). Reduced expression of FOXC2 and brown adipogenic genes in human subjects with insulin resistance. Obesity Research 11, 1182-1191.
You, Y.J., Kim, J., Raizen, D.M., and Avery, L. (2008). Insulin, cGMP, and TGF-beta signals regulate food intake and quiescence in C. elegans: a model for satiety. Cell Metabolism 7, 249-257.
Young, W.S., 3rd (1986). Periventricular hypothalamic cells in the rat brain contain insulin mRNA. Neuropeptides 8, 93-97.
Zhang, C.Y., Baffy, G., Perret, P., Krauss, S., Peroni, O., Grujic, D., Hagen, T., Vidal-Puig, A.J., Boss, O., Kim, Y.B., et al. (2001). Uncoupling protein-2 negatively regulates insulin secretion and is a major link between obesity, beta cell dysfunction, and type 2 diabetes. Cell 105, 745-755.
Zimmermann, R., Strauss, J.G., Haemmerle, G., Schoiswohl, G., Birner-Gruenberger, R., Riederer, M., Lass, A., Neuberger, G., Eisenhaber, F., Hermetter, A., et al. (2004). Fat mobilization in adipose tissue is promoted by adipose triglyceride lipase. Science 306, 1383-1386.
Zmuda, E.J., Qi, L., Zhu, M.X., Mirmira, R.G., Montminy, M.R., and Hai, T. (2010). The roles of ATF3, an adaptive-response gene, in high-fat-diet-induced diabetes and pancreatic beta-cell dysfunction. Mol Endocrinol 24, 1423-1433.