Cognitive abilities independent of IQ correlate with regional brain structure
11
Cognitive abilities independent of IQ correlate with regional brain structure Wendy Johnson a , Rex E. Jung b , Roberto Colom c , Richard J. Haier d, ⁎ a Department of Psychology, University of Minnesota, Minneapolis, MN 55455, USA b Department of Neurology, and the MIND Institute, University of New Mexico, Albuquerque, NM 87131, USA c Facultad de Psicología, Universidad Autónoma de Madrid, 28049 Madrid, Spain d School of Medicine, University of California, Irvine, CA 92697-4475, USA Received 26 September 2006; received in revised form 17 January 2007; accepted 23 January 2007 Available online 1 March 2007 Abstract There is increasing evidence relating psychometric measures of general intelligence and reasoning to regional brain structure and function assessed with a variety of neuroimaging techniques. Cognitive dimensions independent of general intelligence can also be identified psychometrically and studied for any neuroanatomical correlates. Here we investigated two such dimensions, rotation–verbal and focus–diffusion. We used structural MRI and voxel-based morphometry (VBM) in two independent samples to identify gray and white matter correlates of both dimensions. Based on statistical conjunction of both samples, (N = 45; p b .001), there were correlations with gray matter in Brodmann areas (BA) 20 and 9 involving the rotation–verbal dimension and in BA 18 involving the focus–diffusion dimension. There were white matter correlations involving the rotation–verbal dimension near BA 18, 40, 39, 10, 8, and 4 and involving the focus–diffusion dimension near BA 5 and the right sub-lobar amygdala. These correlations may have implications for understanding individual differences in the manifestation of intelligence. © 2007 Elsevier Inc. All rights reserved. Keywords: Brain imaging; MRI; FSIQ; Cognitive abilities; g-factor There is increasing evidence relating psychometric measures of intelligence and reasoning to regional brain structure and function assessed with a variety of neuroimaging techniques (Jung et al., 1999; Haier, Jung, Yeo, Head, & Alkire, 2004; Haier, White, & Alkire, 2003; Haier et al., 1988; Jung & Haier, in press; Schmithorst & Holland, 2006; Shaw et al., 2006). These findings act to allay concerns about whether psycho- metric approaches to intelligence have sufficient construct validity (Ceci, 1996; Gardner, 1983; Horn, 1989; Sternberg, 1985). The neuroimaging studies support both the concept of a general factor of intellectual ability (g; Colom, Jung, & Haier, 2006b; Gottfredson, 1997; Jensen, 1998), as well as the importance of specific abilities. In our view, the data converge generally on the factor model proposed by Carroll (1993), which includes a general intelligence factor that contributes to performance on all tasks, as well as factors contributing to performance on more specific, narrowly construed abilities. Johnson and Bouchard (2005, in press) have articulated how the situation summarized by this general model may arise. They hypothesized that general intelligence is of Available online at www.sciencedirect.com Intelligence 36 (2008) 18 – 28 ⁎ Corresponding author. E-mail address: [email protected] (R.J. Haier). 0160-2896/$ - see front matter © 2007 Elsevier Inc. All rights reserved. doi:10.1016/j.intell.2007.01.005
-
Upload
independent -
Category
Documents
-
view
3 -
download
0
Transcript of Cognitive abilities independent of IQ correlate with regional brain structure
Available online at www.sciencedirect.com
008) 18–28
Intelligence 36 (2Cognitive abilities independent of IQ correlate withregional brain structure
Wendy Johnson a, Rex E. Jung b, Roberto Colom c, Richard J. Haier d,⁎
a Department of Psychology, University of Minnesota, Minneapolis, MN 55455, USAb Department of Neurology, and the MIND Institute, University of New Mexico, Albuquerque, NM 87131, USA
c Facultad de Psicología, Universidad Autónoma de Madrid, 28049 Madrid, Spaind School of Medicine, University of California, Irvine, CA 92697-4475, USA
Received 26 September 2006; received in revised form 17 January 2007; accepted 23 January 2007Available online 1 March 2007
Abstract
There is increasing evidence relating psychometric measures of general intelligence and reasoning to regional brain structureand function assessed with a variety of neuroimaging techniques. Cognitive dimensions independent of general intelligence canalso be identified psychometrically and studied for any neuroanatomical correlates. Here we investigated two such dimensions,rotation–verbal and focus–diffusion. We used structural MRI and voxel-based morphometry (VBM) in two independent samples toidentify gray and white matter correlates of both dimensions. Based on statistical conjunction of both samples, (N=45; pb .001),there were correlations with gray matter in Brodmann areas (BA) 20 and 9 involving the rotation–verbal dimension and in BA 18involving the focus–diffusion dimension. There were white matter correlations involving the rotation–verbal dimension near BA18, 40, 39, 10, 8, and 4 and involving the focus–diffusion dimension near BA 5 and the right sub-lobar amygdala. Thesecorrelations may have implications for understanding individual differences in the manifestation of intelligence.© 2007 Elsevier Inc. All rights reserved.
Keywords: Brain imaging; MRI; FSIQ; Cognitive abilities; g-factor
There is increasing evidence relating psychometricmeasures of intelligence and reasoning to regional brainstructure and function assessed with a variety ofneuroimaging techniques (Jung et al., 1999; Haier,Jung, Yeo, Head, & Alkire, 2004; Haier, White, &Alkire, 2003; Haier et al., 1988; Jung & Haier, in press;Schmithorst & Holland, 2006; Shaw et al., 2006). Thesefindings act to allay concerns about whether psycho-metric approaches to intelligence have sufficientconstruct validity (Ceci, 1996; Gardner, 1983; Horn,
⁎ Corresponding author.E-mail address: [email protected] (R.J. Haier).
0160-2896/$ - see front matter © 2007 Elsevier Inc. All rights reserved.doi:10.1016/j.intell.2007.01.005
1989; Sternberg, 1985). The neuroimaging studiessupport both the concept of a general factor ofintellectual ability (g; Colom, Jung, & Haier, 2006b;Gottfredson, 1997; Jensen, 1998), as well as theimportance of specific abilities. In our view, the dataconverge generally on the factor model proposed byCarroll (1993), which includes a general intelligencefactor that contributes to performance on all tasks, aswell as factors contributing to performance on morespecific, narrowly construed abilities. Johnson andBouchard (2005, in press) have articulated how thesituation summarized by this general model may arise.They hypothesized that general intelligence is of

Fig. 1. The four-stratum Verbal-Perceptual-Image Rotation (VPR)model of mental ability.
19W. Johnson et al. / Intelligence 36 (2008) 18–28
general-purpose use, yet it is manifested through theaccession of components of ability that vary fromindividual to individual. They argued that this meansthat different individuals manifesting similar perfor-mance on specific tasks may attain that similar level ofperformance through different brain pathways, makinguse of different brain structures. If general intelligence issufficiently powerful, it may effectively mask many ofthe associations among more specific abilities thatreflect brain structure.
This argument could be correct if, at the biologicallevel, general intelligence were primarily reflected in atrait such as neuronal plasticity (Garlick, 2002) orprocessing efficiency (Neubauer, Grabner, Freudentha-ler, Beckman, & Guthke, 2004; Haier, 1993; Haier et al.,1988; Vernon, 1993; see also Kovas & Plomin, 2006),while specific abilities were reflected in localizedstructural brain formations such as neuronal densityand brain matter volume and integrity. At the level ofproblem solving, this could be the case if generalintelligence were used to apply existing knowledge,skills, and specific perceptual abilities to develop astrategy to address any problem, while specific abilitieswere reflected in the functional and perceptual capac-ities of the localized brain formations. For example, aperson with high general intelligence may be able to usethat general intelligence to address image rotationproblems even when s/he has little specific imagerotation ability. Such a person may achieve similarlevels of success on such problems as a person of lowergeneral intelligence but good image rotation ability. Theanalogy is that the specific abilities are the toolsavailable to the general intelligence of the user. Usersdiffer in their skill and ability in tool use, as well as inthe tools available to them. If this analogy is appropriate,there are substantive individual differences in abilitiesthat are independent of general intelligence yet theseabilities are reflected in both sizes of brain regions andperformance on tasks that have been associated withgeneral intelligence. To understand general intelligence,it will be necessary to characterize these individualdifferences in specific abilities both psychometricallyand in the brain, and to link the psychometric andneuroanatomical perspectives.
To describe variations in ability beyond generalintelligence in greater psychometric detail, Johnson andBouchard (2005) developed the Verbal-Perceptual-Image Rotation (VPR) model from a battery of 42mental ability tests administered to a sample of 436adults from a broad range of backgrounds. The VPRmodel is a more specific, accurate, and detailed versionof the general factor model proposed by Carroll (1993).
As shown in Fig. 1, it consists of a fourth-stratum gfactor that contributes strongly to broad third-stratumverbal, perceptual, and image rotation abilities, which inturn contribute to 8 second-stratum factors representingmore specialized abilities that contribute to specific testperformance. The model operationalizes the situationwe are describing, in which a g factor permeatesperformance on mental ability tests, yet special abilitiesare also important. Johnson and Bouchard (2006) usedthis model to examine patterns of ability independent ofgeneral intelligence. They regressed the effects ofgeneral intelligence from the VPR model in the samesample, and then used confirmatory factor analysis todevelop a model of the residual ability structure (Fig. 2).The model they developed grouped residual ability testscores according to general content at the secondstratum. At the third stratum, however, three indepen-dent dimensions of cognitive orientation could beobserved. One represented a rotation–verbal dimension,a second represented an analogous dimension welabeled focus–diffusion of attention, and a thirdrepresented content memory. The first two of thesedimensions shared a particularly interesting feature.Each spanned negatively correlated residual abilities.That is, individuals had normally distributed patterns ofability that lay all along both dimensions. Those lyingtowards one pole of each dimension, however, tended tohave relatively strong abilities in one area and relativelyweak abilities in the area associated with the other poleand vice versa. This was true regardless of level ofgeneral intelligence.
One dimension spanned a space ranging from imagerotation to verbal abilities. The other dimension spanneda space ranging from problem solving orientationsinvolving attentional focus on details one at a time to the

Fig. 2. A model of residual mental abilities based on the Verbal-Perceptual-Image Rotation (VPR) model of mental abilities.
20 W. Johnson et al. / Intelligence 36 (2008) 18–28
application of diffuse attention to a variety of cuessimultaneously. This latter dimension may possibly berelated to the cognitive processes that the neuropsy-chologist Luria (1966, 1973, 1980) proposed underliemental task performance. He suggested that the brainstem and reticular activating system provide the brainwith the appropriate level of arousal for focusedattention and resistance to distraction, the occipital–parietal and frontal–temporal areas of the brain receive,analyze, and store incoming sensory information, andthe frontal lobes of the brain program and regulatebehavior, and that there were individual differences inthe ways these systems work in concert that contributeto individual differences in task performance.
The rotation–verbal and focus–diffusion dimensionswere derived from the structure of abilities residual ofgeneral intelligence. Thus they were independent of it aswell as orthogonal to each other. Because of theapparent trade-off in relative levels of specific abilitiesthese dimensions involved, Johnson and Bouchardsuggested that these two dimensions of cognitiveorientation are particularly likely to outline individualdifferences in strategy and performance on mentalability tests that reflect individual differences in brainstructure and function that should be observable inneuroanatomical brain studies. We therefore made thesetwo dimensions the focus of this study.
Gray matter (GM) and white matter (WM) volumesare two structural components of the brain that havebeen linked to intelligent performance (Gignac,Vernon, & Wickett, 2003; Haier et al., 2004; Haier,Jung, Yeo, Head, & Alkire, 2005). GM is composed ofneuron cell bodies; WM is composed of neuron axons
that connect areas of gray matter. Thus WM appears tobe directly involved in communication among brainareas. Both GM and WM appear to be under stronggenetic influence (Baare, van Oel, Hulshoff Pol,Schnack, & Durston, 2001; Thompson et al., 2001),and to share their genetic influences with generalintelligence (Posthuma et al., 2002). They showcharacteristic development patterns over time (Sowellet al., 2003; Good et al., 2001), and these developmentpatterns show individual differences related to intelli-gence (Schmithorst & Holland, 2006; Shaw et al.,2006). At the same time, these structural componentsare not subject to the task-related variations observed infunctional brain imaging studies. They therefore makegood candidates for investigating individual differ-ences in the manifestation of intelligent performance inthe brain.
Here we investigated whether two psychometricallyderived dimensions of cognitive orientation that areindependent of general intelligence were associated withindividual differences in regional volumes of GM andWM. The rotation–verbal dimension is related tospecific task content. We therefore expected to findcorrelations with dimensional position in relativelylocalized regions of the brain involved in performingtasks of those kinds. In contrast, the focus–diffusiondimension is related to problem-solving attention andinformation processing approaches across areas ofcontent. Thus we expected to find correlations distrib-uted more widely across areas of the brain involved withsensory processing and attention, and perhaps involvingWM more than GM because of WM's apparent role incommunication among brain areas.
21W. Johnson et al. / Intelligence 36 (2008) 18–28
1. Materials and methods
1.1. Subjects
Two independent samples of normal volunteers werestudied. The first sample of 23 volunteers (14 womenand 9 men; mean age=27, SD=5.9, range=18–37) wasrecruited from the University of New Mexico (UNM).The second sample of 25 volunteers (14 men and 11women, mean age=59, SD=16; range 37–84) wererecruited from the University of California, Irvine (UCI)as middle aged and older normal controls for an imagingstudy of dementia in Down syndrome and Alzheimer'sdisease (Haier et al., 2003). These are the same subjectsused in our previous report (Haier et al., 2004), exceptthat one additional subject was added to the UCI sample.As described below, 3 subjects were excluded becausethey were outliers on the dimension scores so the finalsample was 45. All of the subjects were in good physicaland mental health and none had a history of head injury.
1.2. Intelligence testing
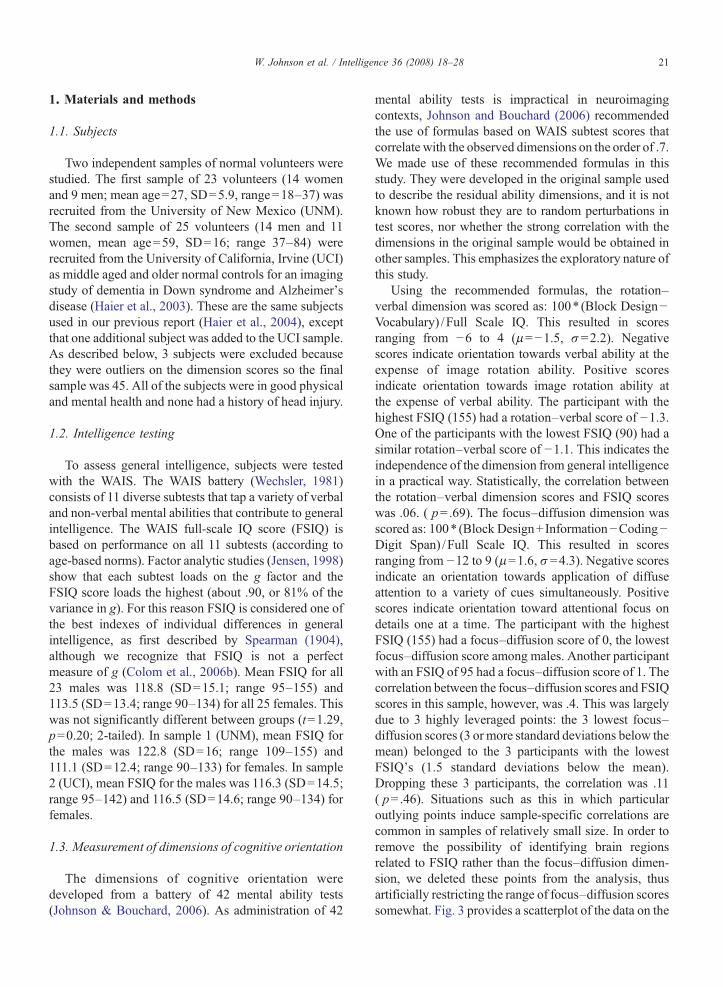
To assess general intelligence, subjects were testedwith the WAIS. The WAIS battery (Wechsler, 1981)consists of 11 diverse subtests that tap a variety of verbaland non-verbal mental abilities that contribute to generalintelligence. The WAIS full-scale IQ score (FSIQ) isbased on performance on all 11 subtests (according toage-based norms). Factor analytic studies (Jensen, 1998)show that each subtest loads on the g factor and theFSIQ score loads the highest (about .90, or 81% of thevariance in g). For this reason FSIQ is considered one ofthe best indexes of individual differences in generalintelligence, as first described by Spearman (1904),although we recognize that FSIQ is not a perfectmeasure of g (Colom et al., 2006b). Mean FSIQ for all23 males was 118.8 (SD=15.1; range 95–155) and113.5 (SD=13.4; range 90–134) for all 25 females. Thiswas not significantly different between groups (t=1.29,p=0.20; 2-tailed). In sample 1 (UNM), mean FSIQ forthe males was 122.8 (SD=16; range 109–155) and111.1 (SD=12.4; range 90–133) for females. In sample2 (UCI), mean FSIQ for the males was 116.3 (SD=14.5;range 95–142) and 116.5 (SD=14.6; range 90–134) forfemales.
1.3. Measurement of dimensions of cognitive orientation
The dimensions of cognitive orientation weredeveloped from a battery of 42 mental ability tests(Johnson & Bouchard, 2006). As administration of 42
mental ability tests is impractical in neuroimagingcontexts, Johnson and Bouchard (2006) recommendedthe use of formulas based on WAIS subtest scores thatcorrelate with the observed dimensions on the order of .7.We made use of these recommended formulas in thisstudy. They were developed in the original sample usedto describe the residual ability dimensions, and it is notknown how robust they are to random perturbations intest scores, nor whether the strong correlation with thedimensions in the original sample would be obtained inother samples. This emphasizes the exploratory nature ofthis study.
Using the recommended formulas, the rotation–verbal dimension was scored as: 100⁎ (Block Design−Vocabulary) /Full Scale IQ. This resulted in scoresranging from −6 to 4 (μ=−1.5, σ=2.2). Negativescores indicate orientation towards verbal ability at theexpense of image rotation ability. Positive scoresindicate orientation towards image rotation ability atthe expense of verbal ability. The participant with thehighest FSIQ (155) had a rotation–verbal score of −1.3.One of the participants with the lowest FSIQ (90) had asimilar rotation–verbal score of −1.1. This indicates theindependence of the dimension from general intelligencein a practical way. Statistically, the correlation betweenthe rotation–verbal dimension scores and FSIQ scoreswas .06. ( p=.69). The focus–diffusion dimension wasscored as: 100⁎ (Block Design+Information−Coding−Digit Span) /Full Scale IQ. This resulted in scoresranging from −12 to 9 (μ=1.6, σ=4.3). Negative scoresindicate an orientation towards application of diffuseattention to a variety of cues simultaneously. Positivescores indicate orientation toward attentional focus ondetails one at a time. The participant with the highestFSIQ (155) had a focus–diffusion score of 0, the lowestfocus–diffusion score among males. Another participantwith an FSIQ of 95 had a focus–diffusion score of 1. Thecorrelation between the focus–diffusion scores and FSIQscores in this sample, however, was .4. This was largelydue to 3 highly leveraged points: the 3 lowest focus–diffusion scores (3 or more standard deviations below themean) belonged to the 3 participants with the lowestFSIQ's (1.5 standard deviations below the mean).Dropping these 3 participants, the correlation was .11( p=.46). Situations such as this in which particularoutlying points induce sample-specific correlations arecommon in samples of relatively small size. In order toremove the possibility of identifying brain regionsrelated to FSIQ rather than the focus–diffusion dimen-sion, we deleted these points from the analysis, thusartificially restricting the range of focus–diffusion scoressomewhat. Fig. 3 provides a scatterplot of the data on the

Fig. 3. Scatterplot of rotation–verbal and focus–diffusion scores(N=45), 3 deleted outlying points are indicated in the oval.
22 W. Johnson et al. / Intelligence 36 (2008) 18–28
two dimensions from the sample used in the analyses(N=45), with the 3 deleted points indicated.
1.4. Structural MRI imaging parameters
Sample 1 MRIs were obtained with a 1.5 T scanner,head coil, and software (Signa 5.4; General ElectricMedical Systems, Waukesha, WI). A T1 sagital localizersequence (TE=6.9 ms, TR=200 ms, FOV=24×24 cm2,five slices, thickness=5 mm, spacing=2.5 mm, ma-trix=256×128) was acquired, followed by a T1 weightedaxial series (fast RF spoiled gradient-recalled, TE=6.9 ms,TR=17.7 ms, flip angle=25°, matrix=256×192, 120slices, thickness=1.5 mm) to give full brain coverage.Sample 2MRIs were obtainedwith a 1.5 Tclinical PhillipsEclipse scanner (Philips Medical Systems, N.A., Bothell,WA).We used T1-weighted, volumetric SPGRMRI scans(FOV=24 cm, flip angle=40, TR=24, TE=5). Theimages consisted of 120 contiguous 1.2-mm thick axialslices, each with an in-plane image matrix of 256×256image elements, to achieve full brain coverage. All imagesin both samples were visually inspected to ensure imagequality.
1.5. Voxel-based morphometry (VBM)
We applied VBM to identify brain areas where GMand WM volumes were correlated to each dimensionscore. We used Statistical Parametric Mapping software(SPM2; The Wellcome Department of Imaging Neuro-science, University College London) to create onestudy-specific template for the combined sample ofUNM and UCI. The optimized VBM protocol wasapplied to the entire sample using the methods of
Ashburner and Friston (2001) and Good et al. (2001). Topreserve the amount of tissue in any given anatomicalregion after spatial normalization, the optimal GM andWM partitions were multiplied by the Jacobiandeterminants of their respective spatial transformationmatrix. This modulation step was performed so that thefinal VBM statistics would reflect local deviations in theabsolute amount (volume) of tissue in different regionsof the brain (Ashburner & Friston, 2000). Themodulated GM and WM partitions were then smoothedwith a 12-mm FWHM isotropic Gaussian kernel toaccount for slight misalignments of homologousanatomical structures and to ensure statistical validityunder parametric assumptions.
1.6. Statistical conjunction approach
We specifically tested whether regional GM or WMvolumes were correlated with each set of dimensionscores, treating any effects of age, sex and handednessas nuisance variables in the SPM2 design matrix exactlyas in our previous report (Haier et al., 2004). We did nottreat FSIQ as a nuisance variable because it was boththeoretically and empirically independent of the twodimension scores (after removal of the leveragedpoints), and because to do so would have excluded thepossibility of detecting any brain region related to bothFSIQ and to one or both of our dimensions. We used theconjunction approach (Price & Friston, 1997) to showwhere GM and WM correlations with both dimensionsoverlapped for the UNM and the UCI samples (i.e.voxels with correlations in common for both samples).We repeated these analyses separately for each dimen-sion. The conjunction approach minimizes potentialproblems associated with combining data from differentscanners, and has the additional advantage of maximiz-ing statistical power because all subjects are used in theanalysis. Locations of significant clusters (maximumvoxel values) are converted fromMontreal NeurologicalInstitute (MNI) to Talairach atlas (Talairach & Tour-noux, 1988) coordinates and reported as closestBrodmann area (BA) where possible. Only clusters ofat least 10 voxels are reported.
2. Results
Because the sample is relatively small and the studysomewhat exploratory, we regarded correlations signif-icant at pb .001(uncorrected for multiple comparisons),but we also report all correlations with statisticalsignificance p≤ .003 (see Tables 1 and 2; and Fig. 1),to aid in future hypothesis generation and replication
Table 2White matter (WM) correlates of the rotation/verbal and the focus/diffusion dimensions
Clustersize
T Z p X Y Z Brain area
WM correlations with rotation371 2.06 3.27 0.001 40 −63 −29 Right cerebellum
posterior lobe tuber721 1.91 3.08 0.001 −39 −64 −32 Left cerebellum
posterior lobecerebellar tonsil
91 1.82 2.98 0.001 −51 −31 −1 Left middle temporalgyrus BA 21
WM correlations with verbal3292 3.00 4.39 0.000 −2 −75 4 Left occipital lobe
lingual gyrus BA 182728 2.56 3.87 0.000 −42 −53 39 Left inferior parietal
lobule BA 401981 2.39 3.68 0.000 43 −61 36 Right parietal lobe
angular gyrus BA 39577 2.32 3.59 0.000 35 49 24 Right superior frontal
gyrus BA 10993 2.32 3.59 0.000 −46 14 38 Left middle frontal
gyrus BA 84090 2.16 3.40 0.000 53 −7 46 Right frontal lobe
precentral gyrus BA 4417 1.92 3.10 0.001 50 −14 18 Right parietal lobe
postcentral gyrusBA 43
361 1.85 3.01 0.001 −60 −46 21 Left temporal lobesupramarginal gyrusBA 40
1182 1.82 2.98 0.001 −52 −12 43 Left parietal lobepostcentral gyrus BA 3
1552 1.79 2.94 0.002 −24 12 43 Left middle frontalgyrus BA 8
677 1.78 2.93 0.002 −38 37 23 Left middle frontalgyrus BA 10
266 1.77 2.92 0.002 −55 −20 19 Left parietal lobepostcentral gyrusBA 40
476 1.71 2.83 0.002 56 −43 21 Right superiortemporal gyrusBA 13
164 1.70 2.82 0.002 63 −35 38 Right inferiorparietal lobule BA 40
136 1.68 2.81 0.003 5 −3 43 Right limbic lobecingulate gyrusBA 24
161 1.67 2.78 0.003 −60 −36 30 Left inferior parietallobule BA 40
203 1.66 2.78 0.003 −22 39 41 Left superior frontalgyrus BA 8
531 1.65 2.76 0.003 −41 −72 12 Left middle temporalgyrus BA 39
WM correlations with focus833 1.94 3.13 0.001 57 −42 2 Right middle
temporal gyrus
(continued on next page)
Table 1Gray matter (GM) correlates of the rotation/verbal and the focus/diffusion dimensions
Clustersize
T Z p X Y Z Brain area
GM correlations with rotation146 1.91 3.09 0.001 −66 −27 −26 Left inferior temporal
gyrus BA 2014 1.62 2.72 0.003 −9 −50 74 Left parietal lobe
postcentral gyrusBA 7
GM correlations with verbal832 2.18 3.42 0.000 −29 20 27 Left middle frontal
gyrus BA 9562 1.80 2.96 0.002 −51 13 41 Left middle frontal
gyrus BA 8210 1.69 2.81 0.002 37 −51 19 Right superior
temporal gyrus BA 22
GM correlations with focus4510 2.07 3.29 0.001 −26 −4 57 Left frontal lobe
sub-gyral BA 62712 2.03 3.23 0.001 −53 16 −19 Left superior temporal
gyrus BA 38612 1.90 3.07 0.001 28 25 −13 Right inferior frontal
gyrus BA 47770 1.86 3.02 0.001 41 −4 62 Right frontal lobe
precentral gyrus BA 6172 1.70 2.82 0.002 21 −25 51 Right parietal lobe
postcentral gyrusBA 3
505 1.67 2.79 0.003 29 −59 32 Right parietal lobeangular gyrus BA 39
296 1.67 2.79 0.003 −18 14 66 Left superior frontalgyrus BA 6
233 1.66 2.77 0.003 −42 −16 −25 Left temporal lobefusiform gyrus BA 20
344 1.64 2.75 0.003 −21 −58 39 Left parietal lobeprecuneus BA 7
GM correlations with diffusion2723 3.14 4.55 0.000 −32 −83 −7 Left middle occipital
gyrus BA 18185 1.96 3.15 0.001 31 −73 0 Right occipital lobe
lingual gyrus BA 19
Note: X, Y, and Z coordinates refer to Talairach Atlas.
23W. Johnson et al. / Intelligence 36 (2008) 18–28
efforts. In discussion, however, we will address onlythose correlations where pb .001.
Fig. 1 (left column) shows the correlations betweenGM volumes and the rotation–verbal dimension (seeTable 1, top). There were both positive and negativecorrelations. Positive correlations indicated associationsbetween greater GM volumes and greater orientationtoward rotation-related abilities. Negative correlationsindicated associations between greater GM volumes andverbally-related abilities. Though we conceived of these
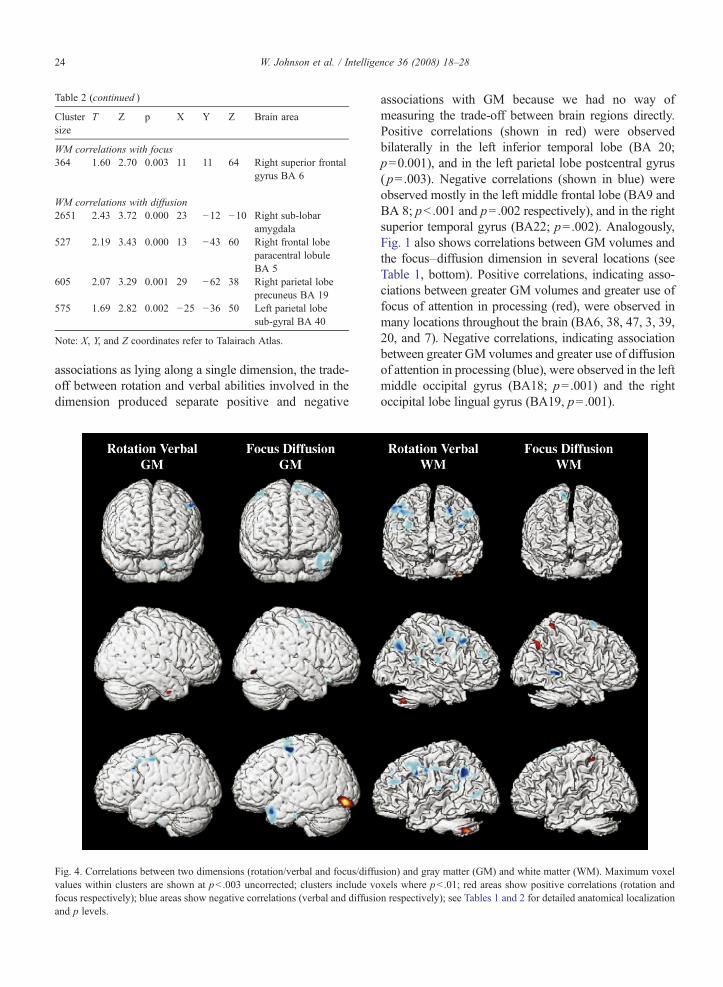
Table 2 (continued )
Clustersize
T Z p X Y Z Brain area
WM correlations with focus364 1.60 2.70 0.003 11 11 64 Right superior frontal
gyrus BA 6
WM correlations with diffusion2651 2.43 3.72 0.000 23 −12 −10 Right sub-lobar
amygdala527 2.19 3.43 0.000 13 −43 60 Right frontal lobe
paracentral lobuleBA 5
605 2.07 3.29 0.001 29 −62 38 Right parietal lobeprecuneus BA 19
575 1.69 2.82 0.002 −25 −36 50 Left parietal lobesub-gyral BA 40
Note: X, Y, and Z coordinates refer to Talairach Atlas.
24 W. Johnson et al. / Intelligence 36 (2008) 18–28
associations as lying along a single dimension, the trade-off between rotation and verbal abilities involved in thedimension produced separate positive and negative
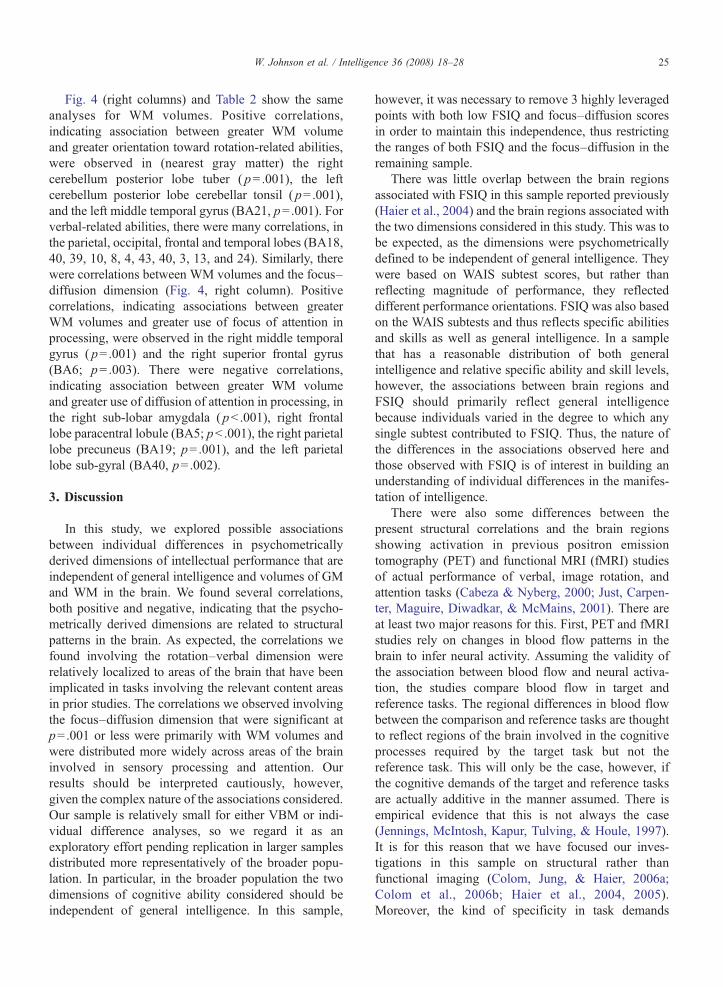
Fig. 4. Correlations between two dimensions (rotation/verbal and focus/diffuvalues within clusters are shown at pb .003 uncorrected; clusters include vofocus respectively); blue areas show negative correlations (verbal and diffusioand p levels.
associations with GM because we had no way ofmeasuring the trade-off between brain regions directly.Positive correlations (shown in red) were observedbilaterally in the left inferior temporal lobe (BA 20;p=0.001), and in the left parietal lobe postcentral gyrus(p=.003). Negative correlations (shown in blue) wereobserved mostly in the left middle frontal lobe (BA9 andBA 8; pb .001 and p=.002 respectively), and in the rightsuperior temporal gyrus (BA22; p=.002). Analogously,Fig. 1 also shows correlations between GM volumes andthe focus–diffusion dimension in several locations (seeTable 1, bottom). Positive correlations, indicating asso-ciations between greater GM volumes and greater use offocus of attention in processing (red), were observed inmany locations throughout the brain (BA6, 38, 47, 3, 39,20, and 7). Negative correlations, indicating associationbetween greater GM volumes and greater use of diffusionof attention in processing (blue), were observed in the leftmiddle occipital gyrus (BA18; p=.001) and the rightoccipital lobe lingual gyrus (BA19, p=.001).
sion) and gray matter (GM) and white matter (WM). Maximum voxelxels where pb .01; red areas show positive correlations (rotation andn respectively); see Tables 1 and 2 for detailed anatomical localization
25W. Johnson et al. / Intelligence 36 (2008) 18–28
Fig. 4 (right columns) and Table 2 show the sameanalyses for WM volumes. Positive correlations,indicating association between greater WM volumeand greater orientation toward rotation-related abilities,were observed in (nearest gray matter) the rightcerebellum posterior lobe tuber ( p= .001), the leftcerebellum posterior lobe cerebellar tonsil ( p=.001),and the left middle temporal gyrus (BA21, p=.001). Forverbal-related abilities, there were many correlations, inthe parietal, occipital, frontal and temporal lobes (BA18,40, 39, 10, 8, 4, 43, 40, 3, 13, and 24). Similarly, therewere correlations between WM volumes and the focus–diffusion dimension (Fig. 4, right column). Positivecorrelations, indicating associations between greaterWM volumes and greater use of focus of attention inprocessing, were observed in the right middle temporalgyrus ( p=.001) and the right superior frontal gyrus(BA6; p= .003). There were negative correlations,indicating association between greater WM volumeand greater use of diffusion of attention in processing, inthe right sub-lobar amygdala ( pb .001), right frontallobe paracentral lobule (BA5; pb .001), the right parietallobe precuneus (BA19; p=.001), and the left parietallobe sub-gyral (BA40, p=.002).
3. Discussion
In this study, we explored possible associationsbetween individual differences in psychometricallyderived dimensions of intellectual performance that areindependent of general intelligence and volumes of GMand WM in the brain. We found several correlations,both positive and negative, indicating that the psycho-metrically derived dimensions are related to structuralpatterns in the brain. As expected, the correlations wefound involving the rotation–verbal dimension wererelatively localized to areas of the brain that have beenimplicated in tasks involving the relevant content areasin prior studies. The correlations we observed involvingthe focus–diffusion dimension that were significant atp=.001 or less were primarily with WM volumes andwere distributed more widely across areas of the braininvolved in sensory processing and attention. Ourresults should be interpreted cautiously, however,given the complex nature of the associations considered.Our sample is relatively small for either VBM or indi-vidual difference analyses, so we regard it as anexploratory effort pending replication in larger samplesdistributed more representatively of the broader popu-lation. In particular, in the broader population the twodimensions of cognitive ability considered should beindependent of general intelligence. In this sample,
however, it was necessary to remove 3 highly leveragedpoints with both low FSIQ and focus–diffusion scoresin order to maintain this independence, thus restrictingthe ranges of both FSIQ and the focus–diffusion in theremaining sample.
There was little overlap between the brain regionsassociated with FSIQ in this sample reported previously(Haier et al., 2004) and the brain regions associated withthe two dimensions considered in this study. This was tobe expected, as the dimensions were psychometricallydefined to be independent of general intelligence. Theywere based on WAIS subtest scores, but rather thanreflecting magnitude of performance, they reflecteddifferent performance orientations. FSIQ was also basedon the WAIS subtests and thus reflects specific abilitiesand skills as well as general intelligence. In a samplethat has a reasonable distribution of both generalintelligence and relative specific ability and skill levels,however, the associations between brain regions andFSIQ should primarily reflect general intelligencebecause individuals varied in the degree to which anysingle subtest contributed to FSIQ. Thus, the nature ofthe differences in the associations observed here andthose observed with FSIQ is of interest in building anunderstanding of individual differences in the manifes-tation of intelligence.
There were also some differences between thepresent structural correlations and the brain regionsshowing activation in previous positron emissiontomography (PET) and functional MRI (fMRI) studiesof actual performance of verbal, image rotation, andattention tasks (Cabeza & Nyberg, 2000; Just, Carpen-ter, Maguire, Diwadkar, & McMains, 2001). There areat least two major reasons for this. First, PET and fMRIstudies rely on changes in blood flow patterns in thebrain to infer neural activity. Assuming the validity ofthe association between blood flow and neural activa-tion, the studies compare blood flow in target andreference tasks. The regional differences in blood flowbetween the comparison and reference tasks are thoughtto reflect regions of the brain involved in the cognitiveprocesses required by the target task but not thereference task. This will only be the case, however, ifthe cognitive demands of the target and reference tasksare actually additive in the manner assumed. There isempirical evidence that this is not always the case(Jennings, McIntosh, Kapur, Tulving, & Houle, 1997).It is for this reason that we have focused our inves-tigations in this sample on structural rather thanfunctional imaging (Colom, Jung, & Haier, 2006a;Colom et al., 2006b; Haier et al., 2004, 2005).Moreover, the kind of specificity in task demands

26 W. Johnson et al. / Intelligence 36 (2008) 18–28
required by this assumption has tended to result in theuse of very straightforward tasks that show fewindividual differences in performance accuracy. Thismeans that the tasks, and thus the brain regions involvedin their performance, may not reflect the full range ofneural activity associated with the ability in question.
Second, because general intelligence is likelyinvolved in the performance of all cognitive tasks, it islikely that all previous studies have used measures oftask performance that confound general intelligencewith the specific ability in question. Thus, a possibleexplanation for the changes in blood flow observedbetween target and reference tasks is that an increase intask difficulty that primarily requires the greaterinvolvement of general intelligence is responsible ratherthan the specific demands of the task. This could be thecase even when general intelligence is statisticallycontrolled. Because we made use of dimensions ofspecific ability independent of general intelligence, weremoved this potential confound.
As reported previously, in this sample, there weremany regions showing significant correlations betweenFSIQ and GM. In contrast, for the two dimensionsreported here there were relatively few brain regionsshowing GM correlations. The reverse was true withrespect to the WM correlations. There was only onesignificant correlation between FSIQ and WM volumein this sample (Haier et al., 2004), in BA39, a parietalvisual area. In contrast, there were several regionsshowing potentially significant correlations involvingWM volumes and the two dimensions, particularly theverbal orientation. This suggests that the problem-solving power represented by general intelligence maybe more closely related to GM, while individual diffe-rences in the manifestation of this power may be relatedto both gray and white matter communication patternsamong brain regions. Of course, it is also possible thatthere are sex differences in the ways in which GM andWM in various regions are involved in the manifesta-tions of different aspects of intelligence. Consistent withthis, this sample showed sex differences in the GM andWM regions involved with FSIQ (Haier et al., 2005),and there are sex differences on the two dimensions ofability as well (Johnson & Bouchard, 2006).
The associations we observed in this study can beused to inform future research in at least three importantways. First, they add to the growing evidence thatindividual differences in psychometric measures ofcognitive ability reflect basic individual differences inbrain structure. Though the question of how thesedifferences in brain structure arise is far from resolved, itis increasingly difficult to argue that individual
differences in performance on tests of cognitive abilityare purely situational, or solely due to attitudinal factorsor exposure to particular kinds of experiences. Theassociations with brain structure act to increase the facevalidity of cognitive ability tests in practical applicationssuch as job candidate selection. They also provide directevidence that both psychometric theory and measure-ments can be used productively to inform neuroana-tomical studies of brain structure and function.
Second, the associations we observed suggest thatthe same overall level of general intelligence ismanifested in different ways in different individuals, atboth biological and psychometric levels. For example,within the 48 individuals in the current sample, therewere some same-sex pairs with highly similar FSIQscores. In one pair with FSIQ's of 112, rotation–verbalscores were (4, −4) and the focus–diffusion scores were(1, −4). In another pair with FSIQ's of 135 and 133,rotation–verbal scores were (−5, 5) and focus–diffusionscores were (1, 7). The correlations we observed wouldsuggest that there should be substantial differenceswithin pairs in GM in the hippocampus and in Broca'sarea and in WM throughout the base of the brain, as wellas differences in overall volumes of GM and WMindicative of the IQ difference across pairs.
The existence of these dimensions in addition togeneral intelligence has several practical implications. Itsuggests that tests of specific abilities such as those thatmight be used for assessing job aptitude need to beinterpreted in the context of a broader range of abilitiesincluding general intelligence. For example, the indi-vidual above with a rotation–verbal score of 4 (and anFSIQ of 112) had a score of 16 on the Block Designsubtest of the WAIS. Another individual with an FSIQof 133 also had a score of 16 on Block Design, with arotation–verbal score of 2. Though Block Design mayassess abilities important to occupations such as airplanepilot or engineer and the two individuals were equi-valent by this measure, the difference in generalintelligence likely carries predictive weight for thesejobs as well. We might expect the individual with thehigher FSIQ to demonstrate higher performance across arange of tasks. On the other hand, the Vocabulary scoreof 16 that contributed to an IQ of 127 in anotherindividual with a rotation–verbal score of −5 mayindicate that any engineering aptitude is likely primarilythe result of the usefulness of general intelligence inaddressing any kind of problem, given that the BlockDesign score was 10.
The existence of these dimensions can also help toexplain why two individuals suffering brain lesions in thesame location due to stroke, injury, or aging-related

27W. Johnson et al. / Intelligence 36 (2008) 18–28
deterioration may have different patterns of net cognitiveimpairment, since these impairment patterns likelydepend on the differences in their pre-morbid patterns ofbrain function and ability. Finally, despite the increases inthe face validity of cognitive ability tests provided by thelinks with brain structure, the evidence these same linksprovide for the presence of individual differences in themanifestation of general intelligence indicates that thesesame tests may not measure the same abilities in the sameways in different individuals. This is because individualdifferences in the availability of specific brain structuralresources related to specific abilities may make necessarythe use of problem solving strategies that differsufficiently that it no longer makes sense to think of thestrategies as reflecting the same ability. This should beexplored in greater detail in future research.
The third way in which these results can be used toinform future research involves the application of scoreson these particular psychometrically derived dimensionsin future studies of both brain structure and function.Both structural and functional brain studies have showndifferent patterns of associations with brain regionsacross samples and demographic variables such as ageand sex (Haier & Benbow, 1995; Haier et al., 2004,2005; Jung et al., 2005; Schmithorst & Holland, 2006).It is possible that these inconsistencies may be explainedat least partly by sampling differences in the patterns ofscores on the psychometric dimensions considered here.For example, Bell, Wilson, Wilman, Dave, Silverstone(2006) observed substantial sex differences in brainactivation patterns during specific cognitive tasks. Asour psychometric dimensions show sex differences aswell (Johnson & Bouchard, 2006), it is possible that thedifferences in brain activation patterns that have beenobserved to be associated with sex differences partic-ularly in verbal and rotation-related abilities (e.g.Neubauer, Grabner, Fink, & Neuper, 2005) could berelated to differences in patterns of scores on thepsychometric dimensions considered here. Our ability tointerpret the results of such studies may be greatlyimproved through the inclusion of both measures ofgeneral intelligence and these two dimensions that areindependent of general intelligence.
In conclusion, our data indicate that two dimensionsof ability independent of general intelligence haveneuroanatomical correlates in the brain. Though thesefindings require replication in larger samples morecompletely representative of the population, theyprovide an important step in showing how individualdifferences in brain structure may be related toindividual differences in intellectual performance.Moreover, these findings demonstrate that purely
psychometrically derived information about intelligentperformance may reflect neuroanatomical properties ofthe brain, and they suggest that such information can bevaluable in identifying and disentangling potentiallyconfounding explanations for some of the associationsthat have been observed in prior studies.
Acknowledgements
We thank Kevin Head for the assistance with dataanalyses. The UCI portion of this work was funded inpart by a grant from NICHD to Dr. Haier (HD037427).The MIND portion of this work was supported in part bya generous donation from Carl and Ann Hawk (SandiaNational Laboratories, retired). The UAM portion ofthis work was funded in part by a grant fromMEC to Dr.Colom (SEJ2006-07890).
References
Ashburner, J., & Friston, K. J. (2000). Voxel-based morphometry —The methods. NeuroImage, 11, 805−821.
Ashburner, J., & Friston, K. J. (2001). Why voxel-based morphometryshould be used. NeuroImage, 14, 1238−1243.
Baare, W. F. C., van Oel, C. J., Hulshoff Pol, H. E., Schnack, H. G., &Durston, S. E. E. (2001). Volumes of brain structures in twinsdiscordant for schizophrenia. Archives of General Psychiatry, 58,33−40.
Bell, E. C., Wilson, M. C., Wilman, A. H., Dave, S., & Silverstone,P. H. (2006). Males and females differ in bran activation duringcognitive tasks. NeuroImage, 30, 529−538.
Cabeza, R., & Nyberg, L. (2000). Imaging cognition II: An empiricalreview of 275 PET and fMRI studies. Journal of CognitiveNeuroscience, 12, 1−47.
Carroll, J. B. (1993). Human cognitive abilities: A survey of factor-analytic studies. Cambridge, England: Cambridge University Press.
Ceci, S. J. (1996).On intelligence: A bioecological treatise on intellectualdevelopment. Cambridge, MA: Harvard University Press.
Colom, R., Jung, R. E., & Haier, R. J. (2006a). Distributed brain sitesfor the g-factor of intelligence. NeuroImage, 31, 1359−1365.
Colom, R., Jung, R. E., & Haier, R. J. (2006b). Finding the g-factor inbrain structure using the method of correlated vectors. Intelligence,34, 561−570.
Gardner, H. (1983). Frames of mind: The theory of multipleintelligences. New York: Basic Books.
Garlick, D. (2002). Understanding the nature of the general factor ofintelligence: The role of individual differences in neural plasticity asan explanatory mechanism. Psychological Review, 109, 116−136.
Gignac, G., Vernon, P. A., & Wickett, J. C. (2003). Factors influencingthe relationship between brain size and intelligence. The scientificstudy of general intelligence. In H. Nyborg (Ed.), Amsterdam:Pergamon.
Good, C. D., Johnsrude, I. S., Ashburner, J., Henson, R. N. A., Friston,K. J., & Frackowiak, R. S. (2001). A voxel-based morphometricstudy of ageing in 465 normal adult human brains. NeuroImage,14, 21−36.
Gottfredson, L. S. (1997). Why g matters: The complexity of everydaylife. Intelligence, 24, 79−132.

28 W. Johnson et al. / Intelligence 36 (2008) 18–28
Haier, R. J. (1993). Cerebral glucose metabolism and intelligence.Biological approaches to the study of human intelligence. In P. A.Vernon (Ed.), Norwood, NJ: Ablex.
Haier, R. J., & Benbow, C. P. (1995). Sex differences and lateralizationin temporal lobe glucose metabolism during mathematicalreasoning. Developmental Neuropsychology, 11, 405−407.
Haier, R. J., Jung, R. E., Yeo, R. A., Head, K., & Alkire, M. T. (2004).Structural brain variation and general intelligence. NeuroImage,23, 425−433.
Haier, R. J., Jung, R. E., Yeo, R. A., Head, K., & Alkire, M. T. (2005).The neuroanatomy of general intelligence: Sex matters. Neuro-Image, 25, 320−327.
Haier, R. J., Siegel, B. V., Nuechterlein, K. H., Hazlett, E., Wu, J. C.,Paek, J., et al. (1988). Cortical glucose metabolic-rate correlates ofabstract reasoning and attention studied with positron emissiontomography. Intelligence, 12, 199−217.
Haier, R. J., White, N. S., & Alkire, M. T. (2003). Individualdifferences in general intelligence correlate with brain functionduring nonreasoning tasks. Intelligence, 31, 429−441.
Horn, J. L. (1989). Models of intelligence. Intelligence: Measurement,theory, and public policy. In R. L. Linn (Ed.), Urbana, IL:University of Illinois Press.
Jennings, J. M., McIntosh, A. R., Kapur, S., Tulving, E., & Houle, S.(1997). Cognitive subtractions may not add up: The interactionbetween semantic processing and response mode. NeuroImage, 5,229−239.
Jensen, A. (1998). The g factor. Westport, CN: Praeger.Johnson, W., & Bouchard Jr., T. J. (2005). The Structure of Human
Intelligence: It's verbal, perceptual, and image rotation (VPR), notfluid and crystallized. Intelligence, 33, 393−416.
Johnson, W., & Bouchard Jr., T. J. (2006). Sex differences in mentalability: g masks the dimensions on which they lie. Intelligence, 35,23−39.
Johnson, W., & Bouchard Jr., T. J. (in press). Sex differences in mentalability: A proposed means to link them to brain structure andfunction. Intelligence.
Jung, R. E., & Haier, R. J. (in press). The parieto-frontal integrationtheory (P-FIT) of intelligence: Converging neuroimaging evi-dence. Behavioral and Brain Sciences.
Jung, R. E., Brooks, W. M., Yeo, R. A., Chiulli, S. J., Weers, D. C., &Sibbitt, W. L. (1999). Biochemical markers of intelligence: Aproton mr spectroscopy study of normal human brain. Proceedingsof the Royal Society of London Series B-Biological Sciences, 266(1426), 1375−1379.
Jung, R. E., Haier, R. J., Yeo, R. A., Rowland, L. M., Petropoulos, H.,Levine, A. S., et al. (2005). Sex differences in N-acetylaspartatecorrelates of general intelligence: An 1H-MRS study of normalhuman brain. NeuroImage, 26, 965.
Just, M. A., Carpenter, P. A., Maguire, M., Diwadkar, V., &McMains, S.(2001). Mental rotation of objects retrieved from memory: Afunctional MRI study of spatial processing. Journal of ExperimentalPsychology — General, 130, 493−504.
Kovas, Y., & Plomin, R. (2006). Generalist genes: Implications for thecognitive sciences. Trends in Cognitive Neuroscience, 10, 198−203.
Luria, A. R. (1966).Higher cortical functions in man.NewYork: BasicBooks.
Luria, A. R. (1973). The working brain: An introduction toneuropsychology. New York: Basic Books.
Luria, A. R. (1980). Higher cortical functions in man (2nd ed.). NewYork: Basic Books.
Neubauer, A. C., Grabner, R. H., Freudenthaler, H. H., Beckmann, J. F.,& Guthke, H. (2004). Intelligence and individual differences inbecoming neurally efficient. Acta Psychologica, 116, 55−74.
Neubauer, A. C., Grabner, R. H., Fink, A., & Neuper, C. (2005).Intelligence and neural efficiency: Further evidence of theinfluence of task content and sex on the brain–IQ relationship.Cognitive Brain Research, 25, 217−225.
Posthuma,D., Geus, E. J. C. d., Baare,W. F. C., Pol, H. E. H., Kahn, R. S.,&Boomsma, D. I. (2002). The association between brain volume andintelligence is of genetic origin. Nature Neuroscience, 5, 83−84.
Price, C. J., & Friston, K. J. (1997). Cognitive conjunction: A newapproach to brain activation experiments. NeuroImage, 5, 261−270.
Schmithorst, V. J., & Holland, S. K. (2006). Functional MRI evidencefor disparate developmental processes underlying intelligence inboys and girls. NeuroImage, 31, 1366−1379.
Shaw, P., Greenstein, D., Lerch, J., Clasen, L., Lenroot, R., Gogtay, N.,et al. (2006). Intellectual ability and cortical development inchildren and adolescents. Nature, 676−679.
Sowell, E. R., Peterson, B. S., Thompson, P. M., Welcome, S. M.,Henkenius, A. L., & Toga, A. W. (2003). Mapping cortical changeacross the human life span. Nature Neuroscience, 6, 309−315.
Spearman, C. (1904). General intelligence objectively determined andmeasured. American Journal of Psychology, 15, 201−293.
Sternberg, R. J. (1985). Beyond IQ: A triarchic theory of humanintelligence. Cambridge: Cambridge University Press.
Talairach, J., & Tournoux, P. (1988). Co-planar stereotaxic atlas of thehuman brain: A 3-dimensional proportional system, an approachto cerebral imaging. Stuttgart: Thieme Medical Publishers.
Thompson, P.M., Cannon, T. D., Narr, K. L., van Erp, T., Poutanen, V. P.,Huttunen, M., et al. (2001). Genetic influences on brain structure.Nature Neuroscience, 4, 1−6.
Vernon, P. (1993). Intelligence and neural efficiency. Current topics inhuman intelligence: Individual differences and cognition. In D. K.Detterman (Ed.), Norwood: Ablex.
Wechsler, D. (1981).Wechsler adult intelligence scale— Revised. SanAntonio, TX: Psychologica Corporation.