


Power IQ 8.0.0 User Guide - Chatsworth Products
968
Power IQ 8.0.0 User Guide
-
Upload
khangminh22 -
Category
Documents
-
view
1 -
download
0
Transcript of Power IQ 8.0.0 User Guide - Chatsworth Products

Power IQ 8.0.0 User Guide

This document contains proprietary information that is protected by copyright. All rights reserved. No part of this document maybe photocopied, reproduced, or translated into another language without express prior written consent of Sunbird.
© Copyright 2018 Sunbird. All third-party software and hardware mentioned in this document are registered trademarks or trade-marks of and are the property of their respective holders.
FCC Information
This equipment has been tested and found to comply with the limits for a Class A digital device, pursuant to Part 15 of the FCCRules. These limits are designed to provide reasonable protection against harmful interference in a commercial installation. Thisequipment generates, uses, and can radiate radio frequency energy and if not installed and used in accordance with the instruc-tions, may cause harmful interference to radio communications. Operation of this equipment in a residential environment maycause harmful interference.
VCCI Information (Japan)
Sunbird is not responsible for damage to this product resulting from accident, disaster, misuse, abuse, non-Sunbird modification ofthe product, or other events outside of Sunbird's reasonable control or not arising under normal operating conditions.
If a power cable is included with this product, it must be used exclusively for this product.

Contents
Contents 3What's NewinPower IQ8.0.0 37The Term"PDU"inPower IQ 38Chapter 1:Installing the Power IQApplication 39
Preparing to Install Power IQ 39
Installing Power IQwith VMware 39
Outlet-Metered Rack PDUs 39
Inlet-Metered Rack PDUs 40
Create the Virtual Machine and Install the ISO(VMware) 40
Install the Application on the Virtual Machine (VMware) 47
Installing Power IQwith Hyper-V 47
Virtual Machine Requirements (Hyper-V) 48
Outlet-Metered Rack PDUs 48
Inlet-Metered Rack PDUs 48
Create the Virtual Machine and Install the ISO(Hyper-V) 49
Install the Application on the Virtual Machine (Hyper-V) 66
Troubleshooting Power IQInstallations with Hyper-V 66
Issue: Installation fails when a large amount of memory is allocated to the virtual machine. 67
Issue: Installation fails when the virtual machine is configured for a large number of CPUs. 67
Issue: Installation fails when using ahard drive on aSCSI controller. 67
Issue:Degraded/slow performance or loss of network connectivity 67
Installing Power IQwith KVM 67
Outlet-Metered Rack PDUs 68
Inlet-Metered Rack PDUs 68
3

Create the Virtual Machine and Install the ISO(KVM) 69
Install the Application on the Virtual Machine (KVM) 78
Chapter 2:Initial Configurationof Power IQ 79Open Port Requirements 79
Ports Open Between Power IQand PDUs 79
Ports Open Between Clients and Power IQ 79
Configure Network Access 79
Chapter 3:Connecting toPower IQ 81Chapter 3:Settings 82
Menus 83
About 83
Appliance Administration 83
DataManagement 83
Authorization and Authentication 84
Securityand Encryption 84
Chapter 4:Additional ConfigurationTasks 85Configuring Logging through Syslog 86
Configuring Health Polling 87
Advanced Health Polling Settings 88
PDU ConnectivityStatus Changes 89
Configuring Polling Intervals 90
Recommended Polling Intervals 91
Polling Intervals with buffered data retrieval: 91
Polling Intervals without buffered data retrieval: 91
Configuring Raw Sensor Readings Storage 92
Enable or Disable Storing Raw Readings in CSVFiles on Disk 92
DataStorage Configuration Calculator 92
4

Buffered DataRetrieval 93
Set Polling Intervals and Sample Rates at Even Multiples 94
Enabling Buffered DataRetrieval from Raritan PX1.2.5 or Higher 95
External Sensor Data from Raritan PX 96
Use NTPServers with Buffered DataRetrieval 97
Advanced DataPolling Settings 98
Advanced SNMPSettings 98
Advanced Thread Pooling Settings 99
Troubleshooting "Connectivity:DataCollection Failed" Status in PDUs 99
Setting the Default SNMPVersion for PDUs 101
SNMPv3 MayRequire Longer Polling Interval 101
Setting Default Estimated Voltages 102
Note on Geist and Rittal PDUs 103
Configuring Polling Path Redundancy(Backup IPAddress Support) for PDUs 103
Viewing aBackup IPAddress 103
Adding aNew PDU and Specifying aBackup IPAddress 103
Adding,Editing,or Deleting aBackup IPAddress for an Existing PDU 104
Bulk Adding,Editing,or Deleting Backup IPAddresses Using CSVImport 105
Trap Support for Backup IPAddresses 106
Polling Path Redundancyfor CPI PDUs (Secure ArraySupport) 106
Support for IPv6 108
Valid IPv6 Address Formats 108
PDU Autodiscovery 108
How to Add PDUs to Power IQ 112
Adding PDUs to Power IQManually 112
DiscoveryProgress Status 114
Validating PDU Credentials 115
5

Editing PDUs under Power IQManagement 116
Configuring Estimated Voltages 118
Adding PDUs in Bulk with CSV 119
Structure of the Add PDUs CSVFile 119
ProxyIndexDetails 120
Adding Raritan Power Meter and Power Meter Branch Circuit Monitor (BCM) 121
Adding Raritan EMX 123
Adding MRVPDUs 124
Adding Rack Transfer Switches 125
Adding Veris Branch Circuit Monitors with Acquisuite 126
Adding PDUs Managed byDominion SX 127
Adding PDUs with Custom Dynamic Plugins 128
Adding Raritan PDUs in Port Forwarding Configuration 131
Adding Server TechnologyPDUs 132
Autodiscoveryof Server TechnologyPDUs 132
Adding Server TechnologyPDUs viaCSVImport 132
Server TechnologyPDU Names in Power IQ 132
Server TechnologyPDU Firmware Version and X.509 Certificate Issues 132
Recommendations for Server TechnologyPDUs in Power IQ6.2 133
1.Prior to upgrading to Power IQ6.2,upgrade all Server TechnologyPDUs to the latest avail-able firmware (at aminimum v7.0m). 133
2.After upgrading to Power IQ6.2,update your Server TechnologyPDU administrator cre-dentials. 133
Bulk Configuration of PDUs 134
Requirements for Bulk Configuration 135
Planning aNew Rollout 136
Viewing Saved/Current Rollout Plans 137
Editing aSaved Rollout Plan 138
6

Executing aSaved Rollout Plan 139
Rollout Timing 139
Viewing Status of Rollout Plans 140
Viewing Completed Rollout Plans 141
Managing Uploaded Configuration Files 142
Viewing the Run Historyand Report for aBulk Configuration Template 143
Template/Plan Reports 144
Actions 144
Summary 144
Details 144
CSVSummaryReport 145
Managing Bulk Configuration Templates 146
Bulk Configuration Template Activities 147
Adding aBulk Configuration Template 148
Editing aBulk Configuration Template 148
Copying aBulk Configuration Template 149
Deleting aBulk Configuration Template 149
Running aBulk Configuration Template 150
Viewing Run History 150
Updating Firmware for Facility Items in Bulk 151
Changing the Administrator Password for Facility Items in Bulk 155
Setting Power IQas the SNMPTrap Destination for Facility Items in Bulk 158
Configuring SNMPSettings for Facility Items in Bulk 162
Backing Up Facility Item Configuration Files 166
Enabling/Disabling Facility Item Configuration Backups 166
Cloning and Restoring Facility Item Configuration Files 166
PDU Outlet Naming and Setting System Attributes 169
7

Naming Individual Outlets 170
Naming Outlets in Bulk with CSVFiles 171
Setting SNMPSystem Attributes for PDUs 172
Structure of the Outlet Name CSVFile 173
Exporting Outlet Names to aCSVFile 174
Bulk Change PDU IPAddresses and View Run HistoryReports 175
Create and Upload the CSVImport File to Change PDU IPAddresses in Bulk 175
Bulk Change PDU IPAddress File Requirements 176
Viewing aBulk Change PDU IPAddress Import Attempt Run History 177
Plan Reports 178
Report 178
Actions 179
Summary 179
Details 179
Configuring ProxyConnections to Power IQ 180
Configuring Facility Item DisplaySettings - View Facility Items byIPor Name 181
Customizing Your View of Facility Items, ITDevices,and Events 182
How to Restore and Clone Sever Technologyand Raritan Device Configurations 182
Adjusting Event Severities 185
Report and Monitor 3 Phase Power 185
Report and Monitor Circuit Breakers 186
Chapter 7:Event andTrapManagement 188User Permissions for Event Management 189
Prepare PDUs for Power IQEvent Management 190
Supported Events 191
APC Supported Events 192
APC Rack PDU Supported Events 193
8

APC UPS Supported Events 195
APC Transfer Switch Supported Events 198
APC NetbotzSupported Events 199
Aphel Supported Events 201
Avocent Supported Events 202
Baytech Supported Events 204
CPI Supported Events 206
Cyberswitching Supported Events 207
Eaton eAM004 Supported Events 207
Geist Supported Events 210
Geist EMSupported Events 211
Geist RCXSupported Events 213
Geist V3 Supported Events 214
Hewlett Packard Supported Events 216
Hewlett Packard PDU2 Supported Events 217
Knurr Supported Events 218
Liebert Supported Events 221
MRVSupported Events 222
NetbotzSupported Events 223
Raritan EMXSupported Events 224
Raritan Power Meter Supported Events 227
Raritan PX/PX2/PX3 Supported Events 232
Raritan PX3TS Transfer Switch Supported Events 243
Rittal Supported Events 246
Schleifenbauer Supported Events 248
Servertech Supported Events 250
Servertech PRO2 (Sentry4) Supported Events 251
9

SineticaSupported Events 254
Starline Supported Events 257
Tripplite Supported Events 257
PDU ConnectivityLost and Restored Events 259
Rack Thresholds 260
Configuring Default Threshold Settings 260
Set Rack Capacityand Override Threshold Percentages 261
Viewing Events 262
Events Page Auto-Refresh 263
EDMLocation Information for Events 263
EDM Locations in the Events Tab 264
EDMLocation Information in Event Notifications 265
Filter the Events List 267
Exporting the Events List to CSV 269
Clearing Events 271
Automatic Delete of Cleared Events 272
Enable or Disable Event Notifications 273
Enable or Disable Event Notifications viaEmail 273
Enable or Disable Event Notifications viaJSON 274
Configuring Notification Filters 275
Managing Event Notifications for Users 276
SMTPServer Settings 277
Events That Clear Quickly 278
SNMPTrap Filtering and Event-Based Trap Forwarding 279
Accessing the SNMPTrap Settings Panel 280
SNMPTrap Settings Panel 281
Trap Filtering (Pre-Fuse) 281
10

Trap Fuse Settings (Advanced) 281
Trap Forwarding 282
Enabling/Disabling Trap Filtering 283
Managing Individual Trap Drop Filters 284
Adding aNew Trap Filter 284
Editing an Existing Trap Filter 285
Deleting an Existing Trap Filter 285
Trap Drop Filtering Criteria 287
Trap Fuse Handling 288
Configuring Trap Fuse Settings 289
Enabling/Disabling Event-Based Trap Forwarding 291
Configuring Trap Forwarding Destinations 292
Adding aNew Trap Forwarding Destination 292
Editing an Existing Trap Destination 293
Deleting an Existing Trap Destination 293
Managing Individual Trap Forwarding Filters 294
Adding aNew Trap Forwarding Filter 295
Editing an Existing Trap Forwarding Filter 296
Deleting an Existing Trap Forwarding Filter 296
Trap Queue Handling 297
Configuring Event (Trap) Notification Settings for APC Devices 299
Configuring Notifications byIndividual Event 300
Configuring Notifications byEvent Group 305
Chapter 8:User Configuration 310Change the Administrator Username and Password 311
Adding,Editing,and Deleting Users 313
Add aUser 313
11

Edit aUser 313
Delete One or Multiple User(s) 314
Configuring the LDAPServer Settings 316
Gather Active Directory and LDAP Server Configuration Information 316
Microsoft® Active Directory Server Information 316
LDAP Server Information 318
Add a Remote Server 319
Active DirectoryServer Configuration in Power IQ 321
General Information 321
Connection Information 322
(Optional) Manage Certificates 323
Bind Information 324
Groups Information 324
LDAPServer Configuration in Power IQ 326
General Information 326
Connection Information 326
(Optional) Manage Certificates 327
Bind Information 328
Groups Information 329
Search for Remote Users and/or User Groups and Add Them to Power IQ 330
Edit User Information and Configure Power IQ Login Credentials 333
Configure Common Server Settings 335
Enable or Disable LDAP in Power IQ 337
Delete an LDAP Server 337
Adding,Editing,and Deleting User Groups 339
Default User Groups 339
Limiting View Permissions 340
12

Assigning Roles for User Permissions 341
Power IQRole Definitions 341
Assign Roles to aUser 344
Remove Roles from aUser 345
Assign Roles to aUser Group 346
Remove Roles from aUser Group 347
Assign Roles within aDataCenter 348
Permissions for Power Control on aDevice Group 349
Chapter 9:Dashboard 350Manage Dashboards 351
Add aDashboard Folder 351
Adding aDashboard 352
Sharing Dashboards 355
Hiding aShared Dashboard 355
Deleting Dashboard Folders and Dashboards 355
Dashboard Slide Show Mode 355
Configuring Widgets 358
Active Events Widget 358
Device Chart Widget 358
PDU Health Chart Widget 359
CapacityForecast Chart Widget 359
Set aCapacity 360
CapacityGauge Widget 361
Image Widget 361
Dashboard Heading Widget 362
HTML Widget 362
Configuring an HTML Widget to DisplayaWebcam Connected to aPDU 363
13

Cooling Chart Widget 363
Requirements for Cooling Charts 364
ASHRAEEnvelope Descriptions 364
Cooling Chart Details - How Your Sensor Data is Charted 365
Viewing Sensor DataPoint Details 365
Exporting Sensor Data 366
Calculate Potential Cooling EnergySavings 366
PUETrend Chart Widget 367
Set PUEThresholds 367
Latest PUEReading Gauge Widget 368
Facilities Chart Widget 369
Floor Map Widget 370
Syncing the Floor Map Drawing with EDM 372
Using the Floor Map 372
Floor Map DataRefresh Rates 373
Floor Map User Permissions 374
Facilities Chart Widget 374
How Does Power IQCalculate the Sum of aDataCenter Node? 375
Chapter 10:SecurityandEncryption 376Installing an HTTPS Certificate 376
Restricting Web and Shell Access Based on IPAddress 378
Configuring Password Requirements 379
Encrypting DataBackup Files 380
Enabling Single Sign On for Raritan Products 381
Enabling the WS API 382
Enabling the Web API User Account 383
Change Web User Session Timeouts 384
14

Configuring the Authorization Warning Message 385
Configuring Enterprise Power IQSettings 386
Chapter 11:Data Management 387DataBackups 388
Downloading System Configuration Backup Files 389
Creating aSystem Configuration Backup File 391
Decrypt Backup Files Before Restoring 393
Restoring System Configuration Backups 394
System Configuration Backup File Retention 396
Configuring Remote Storage of Archive Files 397
How to Retrieve the Host Keyfor an SFTPor SCPServer 400
More Information on ssh-keyscan 401
Configuring Remote Access to Database 402
Configuring DataRollup Retention 403
Enabling and Configuring the DataArchive (BETA) 404
Enterprise Relationships and the EDM 405
What is an Enterprise DataModel (EDM) Object? 406
What are Mappings and Relationships? 407
Object Types and Their Hierarchy 408
Requirements for Creating EDM 409
Creating Your EDM 410
Creating an EDMManually 411
AutomaticallyAssociate Sensors in the EDM 412
Icons for EDMObjects 413
Importing EDMObject Mappings 414
CSVColumns for OUTLETObjects 414
CSVColumns for PDU Objects 414
15

CSVColumns for CIRCUITObjects 415
CSVColumns for SENSORObjects 415
Importing More than 2500 Objects 415
Structure of the EDMImport File 417
CSVColumns for DATA_CENTERObjects 418
CSVColumns for FLOOR,ROOM,AISLE,and ROWObjects 419
CSVColumns for RACK Objects 420
CSVColumns for DEVICEObjects 421
Exporting an EDM 422
Generate aDefault EDM 423
Associate aCircuit or Outlet with an ITDevice 424
Clearing Enterprise Relationships 425
Viewing Enterprise Relationship Summaries 426
Viewing Orphaned Systems Information 427
Finding Unmapped PDUs 428
Configuring Custom Fields 429
Chapter 12:FacilityItems 430Using the Facility Items Tab 431
Filter the Facility Items List 432
Configuring the Number of Items in the Facility Items List 438
Exporting the Facility Items List to CSV 439
Launch the Web Interface for aRaritan PXPDU 443
Quick Search for Facility Items,Racks,Doors,and ITDevices 444
Adding Facility Items to Power IQManagement 445
Viewing aFacility Item 446
Rescanning Facility Items 447
PDUs 448
16

Rack PDU Smart View 449
Rack PDU EnergyTrends 450
Rack PDU Readings 451
Inlet Readings and Line Readings for Three Phase PDUs 452
Multi-Inlet PDU Readings 453
Residual Current Readings 453
Rack PDU Sensors 454
Rack PDU Details 454
Rack PDU Event Listing 455
Rack PDU Asset Strips 456
Asset Strip and Tag Events 457
Rack PDU Smart View 458
Rack Energyand Environmental Trends 459
Rack ITDevices 460
Rack Details 462
PDU Elements - Rack Smart View and Rack PDU Smart View 463
3 Phase PDU Outlet Readings for Raritan PX1 466
PDUs with Fuses 467
Rack Transfer Switches 468
Transfer Switch Smart View 469
Transfer Switch EnergyTrends 469
Transfer Switch Readings 469
Transfer Switch Elements 469
Transfer Switch Details 469
Transfer Switch Event Listing 470
PDU ConnectivityHealth Statuses 471
Troubleshooting ConnectivityHealth 473
17

Trend Chart Settings in Smart Views 474
Active Power Trends for Devices 475
Actions Menu in Smart Views 476
Native Support for Chatsworth eConnect PDUs 477
Launching the Web Browser of the Chatsworth PDU 479
Organizing Facility Items in the DataCenter Browser 481
CRACs in the DataCenter Browser 482
CRACs 483
CRAC Smart View 483
CRAC EnergyTrends 483
CRAC Readings 483
CRAC Details 484
Floor PDUs 485
Floor PDUs Smart View 485
Floor PDU EnergyTrends 485
Floor PDU Readings 485
Floor PDU Elements 487
Floor PDU Details 489
Floor UPS 490
Floor UPS Smart View 490
Floor UPS EnergyTrends 490
Floor UPS Readings 490
Floor UPS Elements 491
Floor UPS Details 492
Power Panel 493
Power Panels Smart View 493
Power Panels EnergyTrends 493
18

Power Panels Readings 494
Power Panels Elements 495
Power Panels Details 496
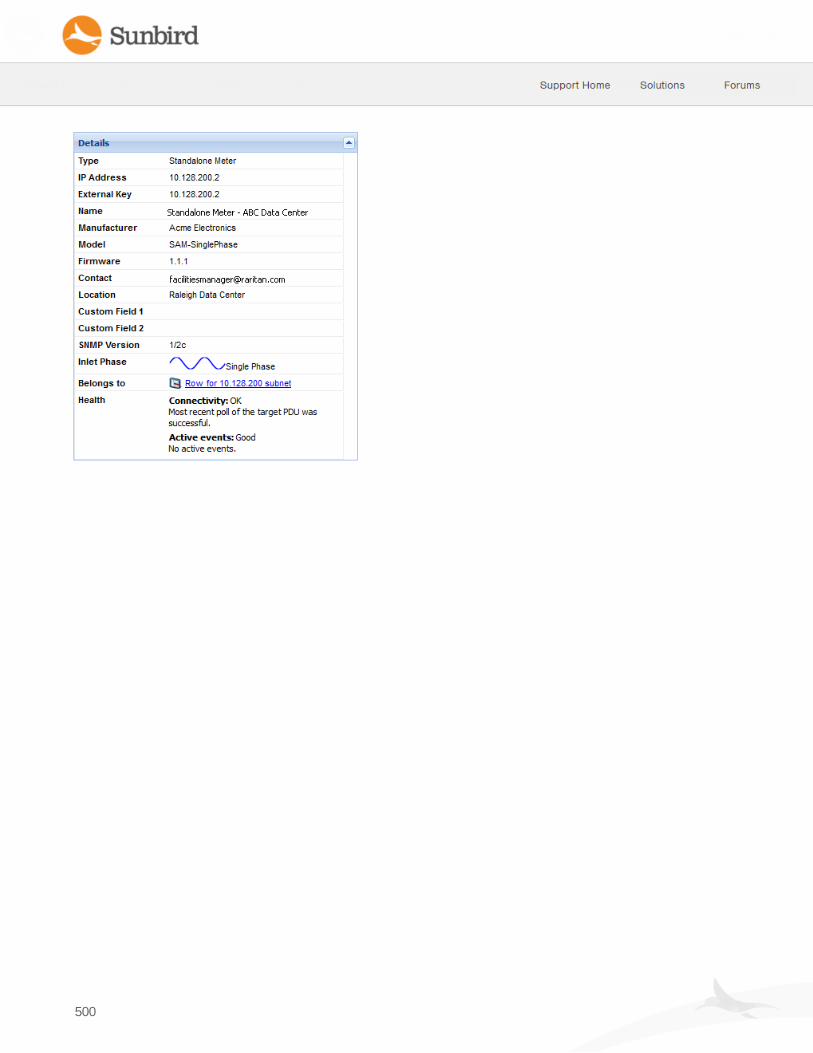
Standalone Meters 497
Standalone Meters Smart View 497
Standalone Meter EnergyTrends 497
Standalone Meter Readings 498
Standalone Meter Elements 499
Standalone Meter Details 499
Chapter 14:Sensors 501Using the Sensors Tab 501
Editing Sensors in the Sensors Tab 501
Sorting,Filtering,and Grouping Sensors 502
Exporting Data to CSV 504
Sensor Grid Columns 505
Sensor Thresholds 506
Configuring Default Threshold Settings 506
Sensor Smart View 508
Sensor Environmental Trends 509
Specify Inlet,Outlet,or Outside Air Location for Environmental Sensors 510
Naming Environmental Sensors 511
Sensors Connected to PX1 and PX2 PDUs 512
States of Managed Sensors 513
Sensor Assignment Guideline 514
Chapter 15:Power Control 515Enable or Disable Power Control 516
Configuring Power Control Options 517
19

Control Power to Outlets in aDataCenter 518
Control Power to Devices in aGroup 519
Power Cycle aDevice 520
Scheduling Power Control 521
Adding aPower Control Task 522
Viewing Power Control Task Results 523
Configuring Graceful Shutdown 524
Adding Shutdown Commands 525
Enable Graceful Shutdown for an ITDevice 526
Disable Graceful Shutdown for an ITDevice 527
Viewing the ITDevices Using aShutdown Command 528
Remove aShutdown Command from Power IQ 529
Preparing Servers for Graceful Shutdown 530
Open Ports for Graceful Shutdown 531
Basic Configuration for SSH Shutdown 532
Sample SSH Shutdown Commands 533
Basic Configuration for Windows Remote Shutdown 534
When Will Graceful Shutdown Abort? 535
Creating aDevice Group 536
Creating aDevice Group 537
Adding Devices to an Existing Device Group 538
Adding Devices to aGroup in the DataCenters Tab 539
Configuring the Power Control Settings for aDevice Group 540
Remove aDevice from aGroup 541
Set aDifferent Power On Delayfor aDevice 542
Chapter 16:Door Access Management 543Door Control Permissions 544
20

Door Smart Page 544
Door Control 546
Sensors and Door Status 546
Door 546
Card Readers 546
Adding or Deleting aDoor 547
Adding aDoor 547
Deleting aDoor 548
Configuring aDoor 548
Bulk Configuring Doors Using CSV 550
Locking,Unlocking,and Automatic Relocking of Doors 551
Setting Door Placement with Tags and Tag Groups 551
Enabling/Disabling the Global Door Relock Timer 552
Enabling/Disabling the Door Override Relock Timer 553
Card Reader Access Support 554
Adding Card Readers in Power IQ 555
Card Reader Smart Page 556
Card Reader 557
Doors 557
Permissions 557
Adding and Removing Card Readers from the Door Smart Page 558
Adding aCard Reader from the Card Readers Panel 558
Removing aCard Reader from the Card Readers Panel 558
Renaming and Removing Card Readers from the EDMHierarchy 559
Renaming aCard Reader 559
Removing aCard Reader 559
Decommissioning and Recommissioning Card Readers 561
21

Creating,Activating,Deactivating,and Assigning Cards 562
Creating aNew Card 562
Deactivating aCard 562
Activating aCard 562
Editing aCard’s Assignment 563
Card Reader Events and Audit Log Entries 564
Bulk Card Reader Configuration viaCSV 566
Mapping aCard Reader to Its Parent 566
Mapping aCard Reader to aDoor 566
Electronic Access Control for CPI Doors and Locks 566
Autoconfiguration of CPI Doors and Door Mappings 567
Supported CPI Door and Electronic Lock Sensor Statuses 568
Unlocking CPI Doors 568
Raritan Electronic Door Locks 569
Requirements to setup to push rules. 570
571
Setting the Door Access Control Authorization Method 571
Set or Change the Keypad PIN Code and Assign Keypad PIN Role to Users 572
Assign Door Control Role to Users and Groups 574
Associate Door,Lock and Handle Sensors 578
Associate Keypads with One or More Doors 579
Assign Users and Groups Access Schedules 582
Chapter 17:Analytics 584What are Power IQAnalytics? 584
Adding Reports to the Analytics Page 585
Sharing Reports on the Analytics Page 586
Creating aChart 587
22

Configuring Charts 588
Device Chart Settings 589
ManuallyDefine Individual Device Chart Lines 591
What's the difference between "Past" and "Last" time periods? 592
Device Chart Measurements 593
Charting Archive DataUsing the Device Chart (BETA) 594
Example Chart Using Archive Data 596
PDU Health Chart Settings 598
Overall PDU Health 599
Exporting Charts 600
Chapter 18:PUE- Power Usage Effectiveness 601Requirements for PUE 602
Set PUEFlags 603
What PUEFlags Does Power IQSet Automatically? 604
List PUECalculations and Adjustments 605
Chapter 19:Reports andTags 606Creating aReport 607
Creating aPower/EnergyReport 608
Creating aTemperature Report 610
Creating aRack Capacityand Failover Report 612
Pairing PDUs for Rack Capacityand Failover Reports 614
Information Available in the Rack Capacityand Failover Report 614
Rack Summary 614
614
Rack PDU Capacity and Failover Information 614
Assumptions About Supported Racks 616
Report Disclaimer 616
23

DataSources for Each Time Range 617
Creating aDoor SecurityStatus Report 618
Creating aDoor SecurityAudit Report 621
Run aReport 626
Schedule aReport 627
Exporting aReport to PDFor CSV 628
Report Examples 629
MonthlyEnergyReport for One Internal Customer with Scheduled PDFDelivery 630
DataCenter Power Report for Past Week 632
Load for All B-Side PDUs for Last Month 634
Adding Tag Groups and Tags 636
Tag Example:Report on Racks byCustomer Tag 637
Migrating Existing Data to Tags 638
Migrate Custom Field Data 640
Assign Tags in the DataCenters Tab 641
Exporting and Importing Tags 642
Exporting Existing Tag Assignments 643
Assigning Tags with CSVImport 644
Import Errors for Tags 645
User Permissions for Reports and Tags 646
View Tag Groups 646
Chapter 20:Plugins 648Standard Plugins 649
Dynamic Plugins 650
Limitations of Dynamic Plugins 651
Types of Dynamic Plugins:Structured and Custom 652
Structured Dynamic Plugin 652
24

Custom Dynamic Plugin 652
Mappings for Each PDU Type 653
Common Mappings 653
CRAC Mappings 654
Floor PDU Mappings 654
Floor UPS Mappings 656
Power Panel Mappings 658
Rack PDU Mappings 659
Rack UPS Mappings 661
Standalone Meter Mappings 664
External Temperature and HumiditySensor Mappings 665
Generic sensor mappings 665
Sensor specific mappings for temperature 666
Sensor specific mappings for humidity 667
Temperature Unit Configuration Precedence 667
BinarySensor Mappings - Custom Dynamic Plugins Only 668
Wildcard IndexMappings - Structured Dynamic Plugins Only 668
Wildcard IndexMapping Example 669
Metadata for Structured and Custom Dynamic Plugins 671
MetadataDefinitions 671
Metadata for Circuit Breakers and Outlets 671
Circuit Breaker State and Outlet State Metadata 671
Outlet Power Metadata 672
Metadata for Environmental Sensors 672
Metadata for UPS Output Source 672
Metadata for BinarySensors 673
Metadata for BatteryStatus 674
25

Metadata for BatteryReplacement Indicator 675
Trap Support in Dynamic Plugins - Structured or Custom 677
IdentifyTrap OIDs and Parameters 678
Trap OIDs 678
Trap Parameters 678
Tools To Help With Trap Mapping 678
Trap OID Wildcards 679
Trap Filter Regular Expressions (Wildcards) 680
Additional Resources 681
Trap Mapping Variables and Format 682
Duplicate Trap Handling 683
Event Clearing 684
Event Parameter Mappings 684
Event Labels 687
Clearing Event Labels 687
Event Clearing Detail 689
Event Listing and Detail Page Changes 689
Expand/Collapse Configured Trap Mappings 692
Upgrading PIQWith Existing Trap Mapping Definitions 692
Example:Trap Mapping with Filters 693
Example:Event SummaryMessage with Variables 695
Example:Trap Mapping with Filters for Babel Buster SPXSNMPGateway 697
Tips for Babel Buster Configuration 698
Structured Dynamic Plugins 700
Requirements 700
Find the MIB File 701
Use aMIB Browser 702
26

Identify the OIDs for Mapping 703
Creating aStructured Dynamic Plugin 704
OID Variables and Format 706
IndexMapping Format 709
Custom Mapping Dynamic Plugins 712
Find the Modbus Register List 713
Creating aCustom Mapping Dynamic Plugin 714
Sensor Mappings 717
Object Identifier 717
DataModel Element 718
DataModel Elements byPDU Type 718
Sensor Type 720
Sensor Mapping CSVImport File Structure 722
Sensor Multipliers 723
Additional Custom Mapping Rules 725
Showing Accurate Circuit Pole Positions 726
Custom Dynamic Plugin Example Screenshots 727
Custom Dynamic Plugin Mapping Example - UPS 729
External Temperature and HumiditySensor Mappings Example Screenshots 731
How Power IQAssociates Facility Items with aStructured or Custom Plugin 734
Structured Plugin Associations 734
Custom Plugin Associations 734
Adding PDUs with Custom Dynamic Plugins 735
Check PDUs Added with Dynamic Plugins 738
Viewing PDUs Using aDynamic Plugin 739
Troubleshooting Dynamic Plugins 740
When to Delete and Rediscover aPDU Using aDynamic Plugin 742
27

Troubleshooting Dynamic Plugin Trap Mapping 743
SNMPGateways and Custom Dynamic Plugins 744
Configuring the SNMPGateway 745
Importing and Exporting Plugin Files 746
Supported Vendors 746
Chapter 21:Maintenance Tasks 750Downloading DailySensor Readings 750
Downloading DailySensor Readings 752
Upgrading Power IQFirmware 753
Shutting Down and Restarting Power IQ 754
Accessing Audit Logs 755
Chapter 22:Appliance Administration 756Allow HTML Widgets on Dashboard 756
Allow HTML Widgets on Dashboard 757
DisplayaLogo on EveryPage 758
Configuring the System Clock 759
Configuring NTPServer Settings 760
Configuring the System Clock Manually 761
Set Phase Labels for Circuit Pole Phase 762
Set Fahrenheit or Celsius Temperature 763
How to Secure aSunbird Appliance 763
Change the ‘config’ user’s password via the console 763
Consider using IP Access Control 763
Change the password for the administrative account on the appliance 764
Change the ‘odbcuser’ password 764
Monitor the Audit Log 764
Use an external System Log server 764
28

Install a valid HTTPS Certificate 764
Use encrypted backups and leverage the appliance’s automated remote backup feature 764
Keep the appliance up to date 764
Report security issues to Sunbird support 764
Chapter 23:UpgradingRaritanPX, Power Meter, andEMX 766Plan aNew Upgrade 767
Viewing Saved Upgrade Plans 769
Editing aSaved Upgrade Plan 770
Execute aSaved Upgrade Plan 771
Upgrade Timing 772
Viewing Status of Upgrade Plans in Progress 773
View Completed Upgrade Plans 774
Managing Firmware Versions 775
Chapter 23:ManagingRemovedor Out of Service Items 776Available Setting Options 777
Maintenance Mode 778
Setting Facility Items to Maintenance Mode 779
IdentifyFacility Items in Maintenance Mode 783
Filtering the Facility Items List byMaintenance Health State 783
Viewing Facility Items in Maintenance from the PDU Health Chart 785
Viewing Maintenance Mode on the Facility Item Smart Page 785
Decommissioning in Power IQ 787
Decommissioned Facility Items 787
Decommissioned ITDevices 787
Decommissioned Sensors 787
Decommission aFacility Item 788
Decommission an ITDevice 795
29

Decommission aSensor 796
IdentifyaDecommissioned Facility Item 797
IdentifyaDecommissioned ITDevice 800
IdentifyaDecommissioned Sensor 801
Return aFacility Item to Service 802
Chapter 24:Support andLicensing 804Support Connections 804
Prerequisites for Support Connections 805
Creating aSupport Connection 806
Stop aSupport Connection 807
Save Support Logs 808
Enable or Disable the Root Accounts for Support 809
Licensing 810
View Licenses 811
Adding aLicense File 812
License Count Rules for Rack PDUs and Facility Items 813
AppendixA:ODBCAccess 814Configuring ODBC Access to Power IQ 815
Configuring ODBC User Credentials 816
Restrictions of ODBC User Credentials 817
ODBC Client Configuration 818
Timezone Configuration for ODBC Data 819
Advanced Reporting with Database and Reporting Programs 820
Install and Configure aPostgreSQL Driver 821
Link Database Tables in Microsoft® Access® 822
Correlated Fields in ODBC Tables 823
Power IQODBC Schema 824
30

PDUOutlets 824
PDUCircuitPoles 824
PDUCircuits 825
PDUCircuitBreakers 825
PDULines 826
PDUInlets 826
PDUPanels 826
PDUReadings 827
PDUInletReadings 827
PDUInletReadingHourlyRollups 829
PDUInletReadingDailyRollups 831
PDUInletReadingMonthlyRollups 832
PDUOutletReadings 834
PDULineReadings 835
PDUCircuitReadings 836
PDUCircuitPoleReadings 837
PDUCircuitBreakersReadings 838
PDUSensorReadings 839
PDUOutletReadingsRollup - To Be Deprecated 839
PDUOutletReadingHourlyRollups 841
PDUOutletReadingDailyRollups 842
PDUOutletReadingMonthlyRollups 843
PDUReadingsRollup - To Be Deprecated 844
PDULineReadingsRollup - To Be Deprecated 845
PDULineReadingHourlyRollups 846
PDULineReadingDailyRollups 847
PDULineReadingMonthlyRollups 848
31

PDUCircuitReadingMonthlyRollups 849
PDUCircuitReadingHourlyRollups 850
PDUCircuitPoleReadingDailyRollups 852
PDUCircuitPoleReadingMonthlyRollups 853
PDUCircuitPoleReadingHourlyRollups 854
PDUCircuitReadingDailyRollups 855
PDUCircuitPoleReadingMonthlyRollups 857
PDUCircuitBreakerReadingsRollup - To Be Deprecated 858
PDUCircuitBreakerReadingHourlyRollups 859
PDUCircuitBreakerReadingDailyRollups 860
PDUCircuitBreakerReadingMonthlyRollups 861
PDUSensorReadingsRollup - To Be Deprecated 861
PDUSensorReadingHourlyRollup 862
PDUSensorReadingDailyRollup 863
PDUSensorReadingMonthlyRollup 863
PDUSensors 864
PDUTransferSwitchStates 864
PDUTransferSwitches 865
PDUs 866
PDUOutlets 867
PDUCircuitPoles 868
PDUCircuits 868
PDUCircuitBreakers 869
PDULines 869
PDUInlets 870
PDUPanels 870
PDUReadings 870
32

PDUInletReadings 871
PDUInletReadingHourlyRollups 873
PDUInletReadingDailyRollups 874
PDUInletReadingMonthlyRollups 875
PDUOutletReadings 877
PDULineReadings 878
PDUCircuitReadings 879
PDUCircuitPoleReadings 880
PDUCircuitBreakersReadings 881
PDUSensorReadings 881
PDUOutletReadingsRollup - To Be Deprecated 882
PDUOutletReadingHourlyRollups 883
PDUOutletReadingDailyRollups 885
PDUOutletReadingMonthlyRollups 886
PDUReadingsRollup - To Be Deprecated 887
PDULineReadingsRollup - To Be Deprecated 888
PDULineReadingHourlyRollups 889
PDULineReadingDailyRollups 890
PDULineReadingMonthlyRollups 891
PDUCircuitReadingMonthlyRollups 891
PDUCircuitReadingHourlyRollups 893
PDUCircuitPoleReadingDailyRollups 895
PDUCircuitPoleReadingMonthlyRollups 896
PDUCircuitPoleReadingHourlyRollups 897
PDUCircuitReadingDailyRollups 898
PDUCircuitPoleReadingMonthlyRollups 899
PDUCircuitBreakerReadingsRollup - To Be Deprecated 900
33

PDUCircuitBreakerReadingHourlyRollups 901
PDUCircuitBreakerReadingDailyRollups 902
PDUCircuitBreakerReadingMonthlyRollups 903
PDUSensorReadingsRollup - To Be Deprecated 904
PDUSensorReadingHourlyRollup 905
PDUSensorReadingDailyRollup 905
PDUSensorReadingMonthlyRollup 906
PDUSensors 906
PDUTransferSwitchStates 907
PDUTransferSwitches 907
TagEntries 909
TagGroups 910
Tags 911
DataCenters 912
Floors 914
Rooms 915
Aisles 916
Rows 917
Racks 918
Rack Readings Rollups 918
RackReadingHourlyRollups 918
RackReadingDailyRollups 919
RackReadingMonthlyRollups 919
ITDevices 920
ITDevice Readings Rollups 920
ITDeviceReadingDailyRollups 920
ITDeviceReadingHourlyRollups 921
34

ITDeviceReadingMonthlyRollups 922
EDMNodes 924
AssetStrips 925
RackUnits 926
PUECalculations 927
PDUBatteries 927
PDUBatteryReadings 928
PDUBatteryReadingHourlyRollups 928
PDUBatteryReadingDailyRollups 929
PDUBatteryReadingMonthlyRollups 930
PDUBatteryReplacementStatusRecords 931
Sample ODBC Queries 932
Obtain Active Power and Apparent Power Data for aPDU With IPAddress 66.214.208.92 932
Obtain Active Power and Apparent Power for an ITDevice With Name “DBServer’’ 932
Report Maximum Power Reading for Each ITDevice Since Added to Power IQ 933
Creating Database Connection in Excel 934
Finding All Entities in aRack 935
ODBC Configuration and Sample Queryfor Apple Users 936
Download and Install ODBC Client Driver for Mac 937
Download and Install Microsoft Query for Mac (included in Office 2011 v14.1.2) 938
Allow Your Mac to Access Power IQviaODBC 939
Adding Power IQas an ODBC Information Source to your Mac 940
Creating Database Connection in Excel 941
Formulate aDatabase Query 942
AppendixB:Floor MapDrawingFiles 943Terminology- Objects vs.Shapes 943
Create Drawing Files or Download Templates 943
35

Microsoft Visio Drawing File Requirements 944
Shape Fill Requirements - Visio Files 944
Add aFill Color to aVisio Shape 944
Shape Name Requirements for Power IQ- Visio Files 945
Add Text to aVisio Shape 945
Shape Border Layer Naming Requirements - Visio Files 945
Set aShape's Border,Fill and Visio Layer to the Same Color 946
Create aBorder for Visio Shapes on aLayer (Workaround) 946
AutoCAD Drawing File Requirements 947
Object Outlines - AutoCAD Files 947
Object Name Requirements for Power IQ- AutoCAD Files 947
Drawing File Layer Requirements - AutoCAD Files 947
AutoCAD Drawing Object File Recommendations 947
Rack Object - Layers 948
Object Hatch - Pattern 948
Object Hatch - Color 948
Object Label and Text Recommendations - AutoCAD Drawing Files 949
Object Labels - Text Formatting 949
AppendixC:FrequentlyAskedQuestions 950SecurityQuestions 950
PDU Questions 950
Unable to Collect IPv4 Routing Table 951
Index 952
36

What's New in Power IQ 8.0.0
See the release notes for details on these and other enhancements.
l Raritan Electronic Door Lock Authorizationl New Side Bar Navigation Settings Menu
37

The Term "PDU" in Power IQ
In the GUI and in this documentation, Power IQ uses the term PDU to encompass any device that Power IQ polls togather power or sensor data. In some cases, PDU and Facility Item may be used interchangeably.
When you see the terms PDU and Facility Items in the product interface, remember that they include every polled object:rack PDUs, CRACs, floor PDUs, floor UPSs, power panels, standalone meters, and environmental sensor aggregators.
In this guide, the following terms are also used:
l Rack PDUl Facility Items: CRAC, floor PDU, floor UPS, power panel, and standalone meter.
38

Chapter 1: Installing the Power IQApplication
Power IQ 5.1.2 and higher support both VMware ESC/ESXi and Microsoft Hyper-Vvirtual machines. Power IQ 6.1.0 intro-duces Linux KVM support. Click below to jump to the appropriate installation instructions.
l Installing Power IQ with VMware belowl Installing Power IQ with Hyper-Von page 47l Installing Power IQ with KVM on page 67
Preparing to Install Power IQ
1. Download the Power IQ .ISO file from the Sunbird Support portal at https://support.sunbirddcim.com.
Installing Power IQ with VMware
Note: If you obtained Power IQ as a VMware application, you must install it on a VMware ESX/ESXi Server.
These requirements are based on the following assumptions:
l 5 minute standard pollingl Mechanical Hard Drives (HDD)l 54 outlets per PDU
Outlet-Metered Rack PDUs
Minimum Con-figuration (Num-ber of PDUs)*
RAM(GB)
CPU(Cores)
Datastore(GB)
OS VMware
Up to 100 8 4 160 or more CentOS 64-Bit ESX/ESXi
101-1500 16 8 160 or more CentOS 64-Bit ESX/ESXi
1501-3000 32 16 160 or more CentOS 64-Bit ESX/ESXi
3001-5000 64 24 160 or more CentOS 64-Bit ESX/ESXi
5001-6000 128 32 160 or more CentOS 64-Bit ESX/ESXi
39

Inlet-Metered Rack PDUs
Minimum Con-figuration (Num-ber of PDUs)*
RAM(GB)
CPU(Cores)
Datastore(GB)
Linux
Up to 100 8 4 160 or more KVM
101-1500 16 8 160 or more KVM
1501-5000 32 16 160 or more KVM
5001-7000 64 24 160 or more KVM
7001-10000 128 32 160 or more KVM
Note: Power IQ performance can vary widely due to a number of factors including but not limited to, the number of con-current users, network bandwidth and the types of PDUs (some PDUs provide MUCH more data than others)
Note: Performance can be improved significantly by using Solid State Drives (SSD) in place of the mechanical harddrives.
Create the Virtual Machine and Install the ISO(VMware)
This section walks you through creating the virtual machine and installing the ISO using VMware. See the Virtual MachineRequirements in the online help for information on the number of virtual processors and the amount of memory allocatedfor the virtual machine.
Note: The following steps are provided as an example of a VMware virtual machine installation. If you are using Hyper-V,see Create the Virtual Machine and Install the ISO (Hyper-V) in the Power IQ online help. If you are using Linux, seeCreate the Virtual Machine and Install the ISO (KVM) in the Power IQ online help.
1. Connect to the VMware server using the VMware ESXi 6.5 web GUI.2. Ensure you are logged in as a user that has permission to create, start, and stop virtual machines.3. On the Virtual Machine page (check that Virtual Machines is selected in the left Navigator pane), click Create/Re-
gister VM.
40

41
4. The New virtual machine wizard opens. In Step 1 of the New virtual machine wizard, Select the Create a new virtualmachine option. Click the Next button.

5. On Step 2, type in the name of your virtual machine and select the Guest OS family and verions. For the Guest OSfamily, select Linux. For the Guest OS version, select CentOS 8 (64-bit) or higher. If CentOS 8 (64-bit) is not avail-
42

43
able, select Other Linux (64-bit). Click the Next button.

6. On Step 3, select a destination storage location for the virtual machine files. Click the Next button.
7. On Step 4, configure the VM hardware with the appropriate specifications based on the Virtual Machine Require-ments and Recommendations for VMware and your network. In this example, the follow specifications are used:
a. CPU: 4 (Note: Adjust the number of CPUs allocated for the virtual machine based on your minimum con-figuration or number of PDUs.)
b. Memory: 8192 MB (Note: Adjust the amount of memory allocated for the virtual machine to at least the min-imum required.)
c. Hard disk: 200 GB (Note: 160 GB is the recommended minimum.)a. Expand the Hard Disk options by clicking the arrow to the left of the field.b. Under Disk Provisioning, select one of the following depending on your needs.
i. Thin Provision to save storage space. For the thin disk, you provision as much datastorespace as the disk would require based on the value that you enter for the disk size. However,the thin disk starts small and at first, uses only as much datastore space as the disk needs forits initial operations.
ii. Thick Provisioned, Lazily Zeroed. Creates a virtual disk in a default thick format. Spacerequired for the virtual disk is allocated when the virtual disk is created. Data remaining onthe physical device is not erased during creation, but is zeroed out on demand at a later timeon first write from the virtual machine.
iii. Thick Provisioned, Eager Zeroed. A type of thick virtual disk that supports clustering featuressuch as Fault Tolerance. Space required for the virtual disk is allocated at creation time. Incontrast to the flat format, the data remaining on the physical device is zeroed out when the
44

45
virtual disk is created. It might take much longer to create disks in this format than to createother types of disks.
d. SCSI Controller: VMware Paravirtuale. Network Adapter: Select an available network adapter based on your own configuration and access. Ensure
that the Connect checkbox next to this field is checked.f. CD/DVD Drive: Datastore ISO file (Note: Ensure that the Connect at power box next to this field is checked.)
g. CD/DVD Media: When you select Datastore ISO file in the previous field, you will be prompted to select anISO image for the CDROM. Click the Browse button to select the dcTrack file for the CDROM.
Leave the other options at their default values.

8. On Step 5, review your selections. Click Finish to create the virtual machine.
9. Verify the Firmware option is set to BIOS. This may be set to EFI by default, but you must change it to BIOS toensure the VM can be booted successfully.
46

47
10. Power on your virtual machine.
Install the Application on the Virtual Machine (VMware)
1. Select VM and right click Edit Settings.2. Select Options > Advanced > Boot Options and select Force BIOS Setup.3. Click "Power on" to power up the virtual machine.4. Click on the CD/DVD ROM icon at the top of the console window and select "Connect to ISO image on datastore."5. Locate and upload the ISO file you saved locally after downloading it from the Sunbird Support portal.6. Select the datastore.7. Select the ISO.8. Click on the Console tab, then click inside the console window.9. Verify in the BIOS Boot menu that the CD-ROM has priority over the hard drive.
10. Exit the BIOS by selecting Exit Saving Changes and pressing the Enter key. The Kickstart page opens.11. Press Enter to begin the installation.12. When the installation completes, press Enter. The virtual machine reboots and then displays a console prompt.
Installing Power IQ with Hyper-V

Virtual Machine Requirements (Hyper-V)
Outlet-Metered Rack PDUs
Minimum Con-figuration (Num-ber of PDUs)*
RAM(GB)
CPU(Cores)
Datastore(GB)
Microsoft
Up to 100 8 4 160 or more Hyper-V
101-1500 16 8 160 or more Hyper-V
1501-3000 32 16 160 or more Hyper-V
3001-5000 64 24 160 or more Hyper-V
5001-6000 128 32 160 or more Hyper-V
Inlet-Metered Rack PDUs
Minimum Con-figuration (Num-ber of PDUs)*
RAM(GB)
CPU(Cores)
Datastore(GB)
Linux
Up to 100 8 4 160 or more Hyper-V
101-1500 16 8 160 or more Hyper-V
1501-5000 32 16 160 or more Hyper-V
5001-7000 64 24 160 or more Hyper-V
7001-10000 128 32 160 or more Hyper-V
*These requirements assume the following: 32 outlets per facility item, 10-minute data polling interval, and 10-minutehealth polling rate. For facility items that support data logging, a 10-minute sample rate is supported for the configurationsprovided in the table.
48

49
Create the Virtual Machine and Install the ISO(Hyper-V)
This section walks you through creating the virtual machine and installing the ISO using Hyper-V. See Virtual MachineRequirements in the Power IQ online help for information on the recommended number of virtual processors and theamount of memory allocated for the virtual machine.
Note: The following steps are provided as recommended guidelines for a virtual machine installation using MicrosoftHyper-V. If you are using VMware, see Create the Virtual Machine and Install the ISO (VMware) in the Power IQ onlinehelp. If you are using Linux, see Create the Virtual Machine and Install the ISO (KVM) in the Power IQ online help.
1. Open Hyper-VManager. From the left navigation pane in Hyper-VManager, select the machine running Hyper-V.

2. Right-click on the machine running Hyper-Vand select New > Virtual Machine.
Note: Alternatively, in the Actions pane on the right, select New > Virtual Machine.
50

51
3. The New Virtual Machine wizard launches. On the Before You Begin page, click Next.
Note: The New Virtual Machine wizard walks you through two different ways to create a virtual machine: default and cus-tomized. You must click Next to create a customized virtual machine with the values required to run PowerIQ. If you clickFinish, the wizard creates a virtual machine with a default configuration.
Throughout the New Virtual Machine wizard, click Next to proceed to the following page. To make changes to your pre-viously selected options, click Previous or navigate to the appropriate page through the navigational pane on the left.

4. On the Specify Name and Location page, enter the name of the virtual machine and click Next.
52

53
5. On the Specify Generation page, select Generation 1 and click Next.

6. On the Assign Memory page, enter 4096 MB as the amount of RAM to allocate to the virtual machine and click Next.
Note: When initially installing Power IQ, you must use the minimal amount (4GB) of RAM. After completing the install-ation, power off the virtual machine and increase the allocation to the recommended RAM or greater.
Note: It is strongly recommended that you do not use Dynamic Memory for the virtual machine. If Dynamic Memory isenabled, Power IQ will balloon its memory and will not release the memory for other hypervisor guests.
54

55
7. On the Configure Networking page, select the appropriate connection and click Next.
Note: Running Hyper-Von Microsoft Windows Server 2012 or Windows Server 2012 R2 with Broadcom NetXtreme 1-gig-abit network adapters may result in loss of network connectivity and/or unusually slow performance. For more informationon troubleshooting this issue, see this Microsoft KB article.

8. On the Connect Virtual Hard Disk page, select Create a Virtual Hard Disk. Enter the Name, Location, and Size for the vir-tual hard disk. Click Next.
56

57
9. On the Installation Options page, select Install an operating system from a bootable CD/DVD-ROM. Select Image file(.iso) and use the Browse dialog to specify the path to the Power IQ installation file. Click Next.

10. To complete the New Virtual Machine wizard, on the Summary page, confirm your selections and click Finish.
To make changes to your previously selected options, click the Previous button or navigate to the appropriate pagethrough the navigational pane on the left.
11. To configure the virtual machine you have just created, right-click on the virtual machine in Hyper-VManager and clickSettings.
Alternatively, in the Action pane under the virtual machine name, click Settings. When you are finished configuring your vir-tual machine, click Apply and OK.
Note: Your settings may vary based on your installation preferences.
58

59
12. On the BIOS page, set the startup order of your boot devices. Select the device and click Move Up or Move Down tochange the order.
After creating the virtual machine, you can do one of the following:
a. Make the CD-ROM the first boot device and then disconnect the CD-ROM after installation.b. Make the Hard Disk the first boot device. If it is a new hard disk image, it will not have an operating system to boot
and initially will boot from the CD-ROM by default.
Note: You can change the order of your boot devices after installation.

13. On the Memory page, you can modify the memory settings, including dynamic memory settings, for your virtualmachine.
Note: When initially installing Power IQ, you must use the minimal amount (4GB) of RAM. After completing the install-ation, power off the virtual machine and increase the allocation to the recommended RAM or greater.
Note: It is strongly recommended that you do not use dynamic memory for this virtual machine.
60

61
14. On the Processor page, you can specify the number of processors for your virtual machine and other resources basedon the expected load. Set the number of virtual processors to four (4).
Note: When initially installing Power IQ, you must set the number of virtual processors to four (4). After completing theinstallation, power off the virtual machine and increase the number of processors to the recommended allotment orgreater.

15. Under IDEController 0, go to the Hard Drive page. Under Media, select Virtual hard disk and use the Browse dialog tospecify the path.
62

63
16. Under IDEController 1, go to the DVD Drive page. Under Media, select Image file and use the Browse dialog to specifythe path to the .iso file.
Note: Ensure that the disk image is created as an IDEdevice. If it is created as a SCSI device, the installation will fail.

17. Under Network Adapter, specify the network adapter configuration.
Note: Running Hyper-Von Microsoft Windows Server 2012 or Windows Server 2012 R2 with Broadcom NetXtreme 1-gig-abit network adapters may result in loss of network connectivity and/or unusually slow performance. For more informationon troubleshooting this issue, see this Microsoft KB article.
64

65
18. Click Apply and then OK.
19. In Hyper-VManager, right-click the name of the virtual machine and click Connect. The Virtual Machine Connectiontool launches.
20. From the Action menu in the Virtual Machine Connection window, click Start to power on your virtual machine and pro-ceed with installation.

Install the Application on the Virtual Machine (Hyper-V)
Note: If you have not already done so, you will need to configure the virtual machine to access the installation media.
1. Open Hyper-VManager.2. From the Virtual Machines pane in Hyper-VManager, right-click the name of the virtual machine and click Connect.
Alternatively, select the virtual machine, and in the Actions pane on the right, click Connect.3. The Virtual Machine Connection tool opens.4. From the Action menu in the Virtual Machine Connection window, click Start to power on your virtual machine.5. The installation package loads.6. Proceed with installation.
Troubleshooting Power IQ Installations with Hyper-V
This section provides information for troubleshooting common issues that you may encounter when creating a virtualmachine and/or installing the Power IQ application with Hyper-V. If you require further assistance, contact Sunbird Tech-nical Support via the support portal: https://support.sunbirddcim.com.
66

67
Issue: Installation fails when a large amount of memory is allocated to the virtualmachine.
Description: When attempting to install Power IQ on a virtual machine with allocated memory greater than 4GB, the install-ation may fail.
Resolution: This issue can be resolved by installing Power IQ on a virtual machine with the minimal amount (4GB) of RAM.After completing the installation, power off the virtual machine and increase the allocation to the recommended RAM orgreater. The amount of allocated RAM can be set when creating a new virtual machine (during the New Virtual Machinewizard) or on the Memory page in the Settings section after the virtual machine has been created.
Issue: Installation fails when the virtual machine is configured for a large number ofCPUs.
Description: When attempting to install Power IQ on a virtual machine with more than four (4) allocated virtual processors,the installation may fail.
Resolution: This issue can be resolved by installing Power IQ on a virtual machine with four virtual processors. After com-pleting the installation, power off the virtual machine and increase the number of processors to the recommended allot-ment or greater. The number of virtual processors can be changed on the Processor page in the Settings section, after thevirtual machine has been created.
Issue: Installation fails when using a hard drive on a SCSI controller.
Description: When attempting to install Power IQ on a hard drive on SCSI Controller, the hard drive may fail to be detected,causing the installation to fail.
Resolution: Power IQ must be installed on a hard drive on an IDE controller. You can select the controller type on the Hard-ware page in the Settings section, after the virtual machine has been created.
Issue: Degraded/slow performance or loss of network connectivity
Description: Running Hyper-Von Microsoft Windows Server 2012 or Windows Server 2012 R2 with Broadcom NetXtreme1-gigabit network adapters may result in loss of network connectivity and/or unusually slow performance. You may see thefollowing warning message: "Power IQ is experiencing degraded performance due to heavy load."
Resolution: This issue may be resolved by updating the driver version or disabling VMQ (Virtual Machine Queues) on theaffected network adapters. For more information on troubleshooting this issue, see this Microsoft KB article.
Installing Power IQ with KVM

Outlet-Metered Rack PDUs
Minimum Con-figuration (Num-ber of PDUs)*
RAM(GB)
CPU(Cores)
Datastore(GB)
Linux
Up to 100 8 4 160 or more KVM
101-1500 16 8 160 or more KVM
1501-3000 32 16 160 or more KVM
3001-5000 64 24 160 or more KVM
5001-6000 128 32 160 or more KVM
*These requirements assume the following: 32 outlets per facility item, 10-minute data polling interval, and 10-minutehealth polling rate. For facility items that support data logging, a 10-minute sample rate is supported for the configurationsprovided in the table.
Inlet-Metered Rack PDUs
Minimum Con-figuration (Num-ber of PDUs)*
RAM(GB)
CPU(Cores)
Datastore(GB)
Linux
Up to 100 8 4 160 or more KVM
101-1500 16 8 160 or more KVM
1501-5000 32 16 160 or more KVM
5001-7000 64 24 160 or more KVM
7001-10000 128 32 160 or more KVM
68

69
Create the Virtual Machine and Install the ISO(KVM)
This section walks you through creating the virtual machine and installing the ISO using a Linux KVM. See the VirtualMachine Requirements in the online help for information on the number of virtual processors and the amount of memoryallocated for the virtual machine.
Note: The following steps are provided as an example of a virtual machine installation using the Linux kernel-based virtualmachine (KVM). If you are using Hyper-V, see Create the Virtual Machine and Install the ISO (Hyper-V) in the Power IQonline help. If you are using VMware, see Create the Virtual Machine and Install the ISO (VMware) in the Power IQ onlinehelp. Note that your instructions may differ depending on your KVM management tool.
Note: Power IQ on KVM does not support auto memory ballooning. You should set the current memory and max memoryallocations for guest instances on KVM to the same value.
1. Open Virtual Machine Manager.2. Click the Create a New Virtual Machine icon. Virtual Machine Manager will walk you through a wizard to create a
new virtual machine.3. In Step 1, make your selection for how you would like to install the OS based on where you have saved the Power
IQ ISO file. For the purposes of this example, we've selected Local install media (ISO image or CDROM).
4. Click the Forward button.

5. In Step 2, select your boot media.
Click the Browse button. Select the Power IQ ISO file in the Choose Storage Volume dialog by either double-click-ing the file or selecting the ISO file and clicking the Choose Volume button.
70

71
6. Back on Step 2 of the wizard, select Linux as the OS type. The version should be the highest CentOS 6.x versionsupported.
7. Click the Forward button.8. In Step 3, specify your memory and CPU settings. See the Virtual Machine Requirements in the online help for
information on the number of virtual processors and the amount of memory allocated for the virtual machine. Forthis example, the RAM is set to 8192 MB and the CPUs to 4.

9. Click the Forward button.10. In Step 4 of the wizard, specify the storage for your virtual machine. Sunbird recommends 160 GB or more for
Power IQ. The Enable storage for this virtual machine box should be checked.
72

73
11. Click the Forward button.12. In Step 5, name your virtual machine and select the network of your choice. This example uses the default.
13. Click the Finish button to complete the wizard and create the virtual machine.
Once created, you make need to apply the following changes to your virtual machine. Otherwise, skip to Step 17.

14. Ensure that the appropriate boot options are selected.
If booting from a CDROM, ensure that it is mounted to the correct media.
74

15. Ensure that your Disk bus type is one of the supported types: VirtIO, SCSI, or SATA. VirtIO is recommended.
16. Ensure that the virtual interface is attached to a bridged physical interface. Note: It should not go through thedefault local to the host NAT device, because the VM needs to be accessed from outside the host.
76

17. Run Power IQ on the Linux KVM appliance.
Install the Application on the Virtual Machine (KVM)
Note: If you have not already done so, you will need to configure the virtual machine to access the installation media.
1. Open Virtual Machine Manager or the KVM manager you are using.2. Select the virtual machine created to run Power IQ.3. Power on the virtual machine.4. Select to install Power IQ on the Linux KVM appliance.5. The installation package loads.6. Proceed with installation.
78

Chapter 2: Initial Configuration ofPower IQ
After installing the application, you must configure the system for access over the network.
Note: Hardware versions only: Connect a keyboard, mouse, and monitor to the Power IQ device.
Open Port Requirements
You must ensure that certain ports are open for Power IQ to work.
See Support Connections for details about open port requirements for support connections to Sunbird Technical Support.
Ports Open Between Power IQand PDUs
l Port 161 (UDP): Required for all PDUs.l Port 162 (UDP): Required for all PDU traps to be sent to Power IQ.l Port 443 (TCP): Required for Raritan PXPDU firmware upgrades performed through Power IQ.l Port 623 (UDP): Required for PX1 firmware 1.5.20 and earlier.
Ports Open Between Clients and Power IQ
l Port 443 (TCP): Allows the web interface.l Port 5432 (TCP): Allows ODBC access. Optional.l Port 22 (SSH): Allows Sunbird Technical Support to log into the shell.l Port 80 (HTTP): Insecure connection to the web UI that immediately forwards to 443 (HTTPS)l Port 135 (rpcbind): For graceful shutdown only.
Configure Network Access
After installing the application, you must configure it for access over your network.
1. Attach a monitor, keyboard and mouse to the Dell R640.2. When prompted to log in, enter the username config and the password sunbird. The configuration page
opens.
79

3. Select Networking Setup, then select Setup LAN 1 to configure the primary Ethernet port.4. Press the Space bar to select "Enable this LAN Port".5. To manually assign the network settings to the application:
l Type the IP address and network masks into the appropriate fields.l Otherwise, select the "Use DHCP" option to allow your DHCP server to automatically assign an address.l Select Accept to reset the network interface when completed.
6. To setup the gateway IP address, select Setup IPv4 Network Routes and type the appropriate IP address inthe Default Gateway Route field.
7. Select Accept to reset the network interface.o If using DHCP, note the address. There must be a DHCP server available on the LAN.
8. If you are using a second network interface, configure it by selecting Setup LAN 2 from the Network Con-figuration menu, then perform the same steps as you did for LAN 1.
9. Optional Select Ping Network Test to ensure the application is communicating over the network.10. Select Name Servers under Network Configuration to setup the server names.
Optional If server names are not set up, DNS names cannot be resolved.
Note: Failing to configure DNS servers causes LDAP integration issues.
11. Optional To increase security, it is advisable to disable SSH remote access.12. Select /Networking Setup/Setup Access Controls .13. Enable Block SSH. By default, the config account has access to the application. SSH is re-enabled if a support
connection is created.14. Select Exit from the main menu. You can now access the application from any client on the network.
80

Chapter 3:Connecting to Power IQ
1. Connect to Power IQ using a web browser on any machine on the network.2. In the browser's address bar, enter the IP address or hostname assigned to Power IQ. For example:
https://192.168.1.103. Answer yes to any security alerts and accept all certificates. If this is your first time connecting to Power IQ, you
must upload your license and accept the End User Licensing Agreement before logging in. If this is not your firsttime connecting to Power IQ, skip to step 4.
Licenses are .LIC files. Repeat this step to add incremental licenses if needed.
Note: You will receive an email with your license from Sunbird.
4. Log in with the default username admin and password sunbird.
The Power IQ dashboard opens.
81

83
As of Power IQ version 8.0.0 the Settings tab is rendered with a left side navigation panel. This panel provides a logicalgrouping of all the Settings features allowing you to quickly navigate to the feature of your choice. Features previously dis-played on a single page with multiple panels requiring you to search for the desired feature, are now rendered as logicallygrouped menu options.
Menus
About
l Appliance Informationl Appliance Services
Appliance Administration
l Power IQ Settingsl Audit Logl Software Upgradesl Product Licensingl Server Settingsl Application Settingsl Dynamic Pluginsl Default Thresholds
Data Management
l Data Backupsl Remote Storagel ODBC Access

l Data Rollup Retentionl Enterprise Relationships
Authorization and Authentication
l User Accountsl AD and LDAP Server Settingsl User Groupsl Door Access Control
Security and Encryption
l HTTPS Certificatel Data Backup Encryptionl IP Based Access Controll Single Sign Onl Password Requirementsl Other Security Settingsl Trusted Certificates
84

Chapter 4:Additional ConfigurationTasks
This section includes information on configuring additional features of PowerIQ, including data rollup retention, enterprisepower, event management, and graceful shutdown.
For more information on a specific configuration task, see the associated topic.
85

Configuring Logging through Syslog
External Syslog servers can be used to record events occurring on Power IQ. Using a Syslog provides a separate externallog of events.
All servers listed under Current Syslog Destinations record events on Power IQ. Recorded events include new users, con-figuration changes, and failed login attempts.
1. In the Settings tab, click Server Settings in the Appliance Administration section.
2. In the Syslog Destinations box, click Add, then type the IP address of a Syslog server in the "Syslog server address" field.This must be in the form of a numeric address.
3. Click OK. The server appears on the list of current Syslog Destinations.
86

87
Configuring Health Polling
Enabling the Health Poller allows Power IQ to get information on PDU health more quickly than using the Data Polleralone. The Health Poller pings PDUs to verify that they are network-reachable. The Data Poller records whether PDUs suc-cessfully respond to data collection attempts. Power IQ uses this combined information to update the PDU Health status,and to create events when the connectivity of a PDU changes. See PDU Connectivity Status Changes on page 89.
The Health Poller uses ICMP Ping. You can configure the ping intervals to poll PDUs from every 15 seconds, up to everyhour. All PDUs will be pinged at the selected interval. If a PDU does not respond, the ping is retried twice by default, with atimeout as configured in the advanced settings. See Advanced Health Polling Settings on the next page.
Note: ICMP echo and reply packets exchanges must be allowed in the firewall before enabling Health Poller.
1. In the Settings tab, click Power IQ Settings in the Appliance Administration section.2. In the Health Poller Settings section, check the Enable Health Poller checkbox to start the pings.3. Select the ping frequency in the Health polling interval field. The interval selected must be less than, or equal to the
Data Poller interval.
4. Click Save Poller Settings.

Advanced Health Polling Settings
WARNING: Advanced Data and Health Polling Settings, including Advanced SNMP Settings, AdvancedICMP Settings, and Advanced Thread Pooling Settings, should only be used with Sunbird Technical Sup-port guidance, or by expert users. Changes to these values can negatively affect Power IQ performance,or result in loss of data.
The default settings are shown.
Advanced ICMP Settings:
l Ping retries: Possible range 0-5. Default 2.l Ping timeout (in milliseconds): Possible range 500-8000. Default is 4000.
Advanced Thread Pooling Settings:
l See Advanced Thread Pooling Settings.
88

89
PDU Connectivity Status Changes
The PDU connectivity status will change based on the PDU response or lack of response to the Health and Data Pollers.Data Polling is enabled automatically, but you must enable the Health Poller manually.
See PDU Connectivity Health Statuses and PDU ConnectivityLost and Restored Events.

Configuring Polling Intervals
At each polling interval Power IQ collects data from PDUs under its management.
1. In the Settings tab, click Power IQ Settings in the Appliance Administration section.2. In the Polling Settings box, select a time period from the "Polling interval" drop-down list. The time period indicates
how much time passes before Power IQ starts a new polling cycle3. Click Save Poller Settings.
Note: When managing a large number of PDUs you may need to configure a longer time period for the polling interval. Set-ting a longer time period helps ensure that all PDUs are polled within a given cycle. A warning message appears if PowerIQ is unable to poll all PDUs within the configured time period. See Recommended Polling Intervals on the facing pagefor details on settings that help Power IQ poll faster.
90

91
Recommended Polling Intervals
The optimal polling interval depends on your business needs, the number of PDUs you have deployed, their types and theplatform you are running Power IQ on. Outlet metered PDUs are a larger system load than unit-level metered PDUs. SomePDUs have a unique feature to store readings. Storing readings gives you the added flexibility to set a poll rate and asample rate.
Start with a longer polling and sample interval to ensure system operation. Gradually shorten the polling and sample inter-val as business needs require.
Your actual results may vary based upon local conditions. PDUs that provide less data tend to have a lower system load.You can therefore likely poll those PDUs at the stated sample rate for a given configuration.
To allow faster polling, disable the storage of raw sensor readings in CSVfiles to the Power IQ disk. Disabling this settingallows Power IQ to poll more devices at a faster polling interval, but you won't have access to raw readings in CSVformat.See Configuring Raw Sensor Readings Storage for details.
See Configuring Polling Intervals for details on changing these settings.
Polling Intervals with buffered data retrieval:
Number of PDUs Sample Rate Polling Interval Memory
1,000 outlet metered PDUs 5 minutes 30 minutes 8 GB RAM
1,500 outlet metered PDUs 5 minutes 30 minutes 16 GB RAM
2,000 outlet metered PDUs 5 minutes 30 minutes 24 GB RAM
3,200 unit metered PDUs 10 minutes 30 minutes 8 GB RAM
Polling Intervals without buffered data retrieval:
Number of PDUs Polling Interval Memory
2,100 outlet metered PDUs 10 minutes 8 GB RAM

Configuring Raw Sensor Readings Storage
In Power IQ releases before 4.0.0, raw sensor readings collected by Power IQ are automatically stored in daily CSVfileswhich are compressed into ZIP files at the end of each day. Power IQ retains a maximum of eight full days of compressedCSVfiles depending on available disk space.
Power IQ 4.0.0 and later can poll at faster rates than older Power IQ releases. The more sensor readings that Power IQ col-lects, the more likely it becomes that the disk partition where these CSVfiles are stored will run out of space. This couldprevent the Power IQ poller from functioning properly.
In 4.0.0 and later, if you require access to the raw sensor readings in CSVformat, you must enable this feature. Dependingon your Power IQ polling configuration, such as number of managed PDUs, polling interval, sample rate, Power IQ may notbe able to store eight full days of readings. In some configurations, it may not be possible to write sensor readings to CSVbecause the number of raw sensor readings in a day will consume too much disk space.
If you do not require access to raw sensor readings in CSVformat, the feature should remain disabled. Disabling this fea-ture will improve the performance of the Power IQ poller and will free system resources for other tasks.
When the feature is disabled, you can still access two hours of raw sensor data stored in the database before values arerolled up, and the raw data deleted from the database. This raw sensor data can be retrieved using ODBC access andreporting tools. See Appendix A: ODBC Access.
See Data Storage Configuration Calculator for details on a tool you can use to determine if your system configuration iscompatible with writing raw sensor readings to CSV.
See Enable or Disable Storing Raw Readings in CSVFiles on Disk for instructions on changing the setting.
Enable or Disable Storing Raw Readings in CSVFiles on Disk
Depending on your configuration, storage of raw sensor readings in CSVfiles may not be supported, and could lead to per-formance issues with the Power IQ poller.
Use the Power IQ data storage configuration calculator tool to determine if storage of raw sensor readings is supportedwith your configuration.
You can download data storage configuration calculator at http://sup-port.sunbirddcim.com/support/solutions/articles/6000055029-tools-
Data Storage Configuration Calculator
The Data Storage Configuration Calculator is a tool that can help you determine if storing raw readings in CSVfiles is sup-ported for your configuration.
You can download the data storage configuration calculator at http://sup-port.sunbirddcim.com/support/solutions/articles/6000055029-tools-
92

93
Buffered Data Retrieval
Important: The PDU system clock must be set and configured correctly in order to ensure proper datareporting to Power IQ.
Raritan PXPDUs version 1.2.5 and higher have the ability to temporarily buffer power measurements. This allows Power IQto receive more data with less frequent polling. Enabling buffered data retrieval instructs Power IQ to retrieve these buf-fered measurements instead of collecting a single point of data at the time of polling. This results in increased efficiencywhen gathering data from Raritan PXPDUs.
See Enabling Buffered Data Retrieval from Raritan PX1.2.5 or Higher for instruction on enabling the feature.
You must set a Sample Interval when using buffered data retrieval. The polling interval controls how often Power IQrequests buffered data from Raritan PXPDUs, the sample interval controls how granular the buffered data is.
Example:
With a polling interval of 1 hour, and a sample interval of 1 minute, Raritan PXPDUs under Power IQ management col-lect measurements each minute and store the data in the Raritan PX's data buffer. Every hour, Power IQ then retrievesthe data buffer with the last hour's measurements from each Raritan PX.
Shorter sample intervals cause Raritan PXPDUs to fill their buffers more quickly. As a result, Power IQ may limit the pollinginterval to prevent data loss due to filled buffers.
When buffered data retrieval is in use, Power IQ polls other PDUs that do not support this feature at the Sample Interval.This helps maintain a consistent granularity of measurements across all readings.
The Buffered Data Retrieval feature may consume the space available for data storage rapidly since it allows Power IQ toretrieve a great deal of data at once.
Note: To configure Raritan PXsampling rates, Power IQ must have SNMP write access to those PDUs. First make surethe Raritan PXSNMP agents are enabled. Then ensure that they have been added to Power IQ management using anSNMP community string that has write access.

Set Polling Intervals and Sample Rates at Even Multiples
Set your sample rate at even multiple of your polling interval, when data buffering is enabled. This enables Power IQ to col-lect an even number of data points.
94

95
Enabling Buffered Data Retrieval from Raritan PX1.2.5 or Higher
Note: All Power IQs using buffered data retrieval that are polling the same PDU must use the same Sample Interval set-ting to prevent each instance of Power IQ from attempting to change the sample interval to its own setting.
See Buffered Data Retrieval for more details.
To retrieve buffered data from Raritan PX1.2.5 or higher:
Make sure that Raritan PXPDUs have been added to Power IQ with a Write Community String, or buffered data retrievalwill not work. See Editing PDUs under Power IQ Management for details on editing PDU credentials.
1. In the Settings tab, click Power IQ Settings.2. In the Polling Settings section, select the "Enable buffered data retrieval on Raritan PDUs" checkbox.3. Select a sample period from the Sample Interval drop-down list. This configures the sample interval that Raritan PX
PDUs use to buffer power measurements.
Example
If 1 minute is selected, every minute a Raritan PXPDU takes a power measurement and stores it in its internal buffer forretrieval.
Note: The polling interval and sample interval should not be set to the same time period. Set the polling interval to a
longer time period than the sample interval. For example: 30 minute polling interval with a 10 minute sample inter-
val. See Configuring Polling Intervals.
4. Click Save Poller Settings.

External Sensor Data from Raritan PX
Raritan PXmodel PDUs version 1.6 and higher support buffered data for external sensors.
For Raritan PXmodel PDU versions earlier than 1.6, external sensor data is not recorded at the sample interval whenBuffered Data Retrieval is enabled. The external sensor data is recorded at the polling interval.
96

97
Use NTPServers with Buffered Data Retrieval
If you enable Buffered Data Retrieval, Raritan strongly suggests enabling NTP and configuring Power IQ and your RaritanPXPDUs to use the same NTP servers. This ensures that all recorded data is in sync, whether generated by Power IQ orRaritan PX.
Difference in time between Power IQ and PDUs can cause incorrect values on the capacity gauges on the dashboard.

Advanced Data Polling Settings
WARNING: Advanced Data and Health Polling Settings, including Advanced SNMP Settings, AdvancedICMP Settings, and Advanced Thread Pooling Settings, should only be used with Sunbird Technical Sup-port guidance, or by expert users. Changes to these values can negatively affect Power IQ performance,or result in loss of data.
If you have PDUs in the "Connectivity: Data Collection Failed" state, changing the default SNMP settings may help. Do notproceed without Sunbird Technical Support guidance. See Troubleshooting Connectivity: Data Collection Failed Status inPDUs for details on possible causes. See Advanced SNMP Settings for details on the settings.
Advanced SNMPSettings
Changing the SNMP settings may help if you have too many PDUs in "Connectivity: Data Collection Failed" state.
See Troubleshooting "Connectivity: Data Collection Failed" Status in PDUs for details on possible causes and other solu-tions.
Warning: You should only change these settings if you are an expert SNMP user, or with Technical Sup-port's help. Changes to these values can negatively affect Power IQ performance, or result in loss of data.
Recommended changes:
l Increase how many times Power IQ will attempt an individual SNMP request and how long Power IQ will wait for anindividual SNMP request. A poll of a PDU can potentially involve hundreds of individual SNMP requests. It is recom-mended to gradually increase the "Read timeout" and Retries settings and allow several poll intervals to pass togauge the impact of the change before making additional changes.
l If you see a large number of unexplained outages for Raritan PX1 or PX2 PDUs, it may also be necessary todecrease the "Maximum rows per request (PX)" setting. In a small number of cases the default value of 10 may res-ult in SNMP response packets that are too large for customer networks to handle correctly due to packet frag-mentation. This is related to PDUs being managed remotely over a WAN. Decreasing this value results in someloss of efficiency because Power IQ has to send more SNMP requests to the target PDU, given that a smaller set ofdata is sent back in each SNMP response.
By default, Power IQ uses the following default SNMP settings:
l Read timeout: 5000 millisecondsl Write timeout: 5000 millisecondsl SNMPv3 timeout: 20000 millisecondsl Retries: 2l Total number of attempts= retries + 1. The default number of attempts is 3.l Maximum rows per request (default): 1. his value is used for non-Raritan PDUsl Maximum columns per request (default): 5=. This value is used for non-Raritan PDUsl Maximum rows per request (PX): 10. This value is used for Raritan PDUsl Maximum columns per request (PX): 15. This value is used for Raritan PDUs
98

99
Advanced Thread Pooling Settings
Warning! The configured thread pool settings determine how many Power IQ resources are allocated to polling PDUs.The default settings are designed to work for most use cases and should not need to be changed. If you are exper-iencing performance issues related to polling, Sunbird Technical Support can work with you to determine if changingthe thread pool settings will be beneficial.
Warning! Do not change these settings without the guidance of Sunbird Technical Support.
l Threads per core: If dynamic sizing is disabled, this value will be used to calculate thread pool size. (default value:10) This parameter affects poller operation when dynamic thread pool sizing is enabled or disabled.
l Maximum size of dynamic thread pool: Defines the maximum possible size of the dynamic poller thread pool.(default: 225 threads)
l Dynamic thread pool size: Dynamically calculated ideal thread pool size (default: 0)l Maximum CPU utilization: Target CPU utilization for polling PDUs. (default: .80)l Dynamic restart threshold: Defines how large the delta between the configured max pool size and the calculated
ideal pool size must be before a Poller JVM restart is justified. (default: 5)l Minimum time between restarts (in minutes): Defines minimum time between Poller restarts due to thread pool res-
izing (default: 1440, that is, only allow Poller to restart once every 24 hours to adjust thread pool size)l Interval between thread pool evaluations (in minutes): Defines how frequently the Poller service will evaluate the
thread pool size to determine if resizing is needed. (default: 60)l Low water mark: Thread pool scheduler low water mark. Low water mark controls how aggressively threads are
removed from the thread pool. This water mark represents the ratio of threads to items in the queue. The higher thevalue the more likely a thread will be removed from the pool. (default: .01)
l High water mark: Thread pool scheduler high water mark. High water mark controls how aggressively threads areadded to the thread pool. This water mark represents the ratio of threads to items in the queue. The smaller thevalue the more likely a thread will be added to the pool. (default: .10)
l Data Polleronly. Maximum number of active database connections: Upper limit on number of database con-nections that may be used by the poller thread pool. (default: 350) This parameter affects poller operation whendynamic thread pool sizing is enabled or disabled.
Troubleshooting "Connectivity: Data Collection Failed" Status in PDUs
A PDU in "Connectivity: Data Collection Failed" state usually has one of these problems.
1. The user has configured Power IQ with the wrong community string for the PDU.2. There is a network connectivity issue between Power IQ and the PDU.3. The PDU is powered off or not connected to the network.

If you have checked and corrected these problems, and the status does not change, there may be an SNMP setting that iscausing the problem. These problems are much less common. These problems may be solved by changing the SNMP set-tings, but you should only change these settings if you are an expert SNMP user, or with Technical Support's help. SeeAdvanced SNMP Settings.
1. The configured SNMP timeout and retry value are insufficient for your use case.
Example
You need to manage remote PDUs over a WAN. Network latency or bandwidth do not work well with the defaultSNMP settings, resulting in a large number of SNMP timeouts that show up as "Connectivity: Data CollectionFailed" state PDUs.
2. The SNMP agent on the PDU is not responding to requests. The PDU's processor may be busy handling other tasksand is temporarily unable to respond to SNMP requests.
100

101
Setting the Default SNMPVersion for PDUs
1. In the Settings tab, click Power IQ Settings in the Appliance Administration section.2. In the Polling Settings box, select 1/2c or 3 as the default SNMP version for new PDUs added to Power IQ.3. Click Save Poller Settings.4. You can change the default value when you add the PDU.
SNMPv3 May Require Longer Polling Interval
Enabling SNMPv3 represents about twice the load on Power IQ as SNMPv1/2.
You may need to increase the polling interval to enable Power IQ to poll all pdus when SNMPv3 is enabled.
See Setting the Default SNMP Version for PDUs.
See Configuring Polling Intervals.

Setting Default Estimated Voltages
Power IQ can estimate active power for PDUs that do not directly provide Active Power measurements.
If a PDU does not provide one of the following values, the default estimated voltage will be applied.
l Inlet Voltagel Outlet Voltagel Active Power
This default value can be changed per PDU, in the Edit PDU page. These voltage values are only editable when they areNOT coming from the PDU. See Configuring Estimated Voltages.
1. In the Settings tab, click Power IQ Settings.2. In the Polling Settings box, enter a default estimated voltage for single phase PDUs and a default estimated inlet
and outlet voltage for three phase PDUs. Optional.3. Click Save Poller Settings.
102

103
Note on Geist and Rittal PDUs
Geist and Rittal PDUs are marked as single or three phase at the second polling interval after discovery.
If a PDU is not marked after two polls, mark the phase manually.
Configuring Polling Path Redundancy (Backup IPAddressSupport) for PDUs
Power IQ 5.2 and above support Polling Path Redundancy, configuration of a backup (secondary or redundant) IP addressthat can be used for polling and data collection in case the primary IP address that the user adds a PDU with is unavail-able to Power IQ. Whenever a PDU is not reachable through its primary IP address, Power IQ will try to reach the PDUusing its backup IP address.
Backup IP addresses can be added to PDUs through the following methods:
l Redundant IP addresses can be added to existing PDUs by editing the PDU smart page. For more information, seeAdding, Editing, or Deleting a Backup IP Address for an Existing PDU on the next page.
l Redundant IP addresses can also be added to new PDUs at the time they are created. For more information, seeAdding a New PDU and Specifying a Backup IP Address below.
l Redundant IP addresses can be added through CSVimport. For more information, see Bulk Adding, Editing, orDeleting Backup IP Addresses Using CSVImport on page 105.
Both IPv4 and IPv6 IP addresses are supported. Users can manually add no more than one backup IP address to eachPDU.
Viewing a Backup IPAddress
A PDU’s backup (secondary or redundant) IP address is listed on the PDU’s smart page.
1. In the Facility Items tab, click the PDU with the backup IP address you want to view. Doing so will take you to thePDU’s smart page.
2. On the PDU smart page, scroll down to the Details section (at the bottom of the PDU smart page).3. The backup IP address is displayed if available.
Note: The backup IP address will be displayed only if it is manually entered by the user and the Show Facility Item IPAddress option is selected for Facility Item Labels under Display Settings (click the Settings tab > Application Settings >Display Settings > Show Facility Item IP Address). Otherwise, the Backup IP Address field in the Details section of thesmart page will remain blank.
Adding a New PDU and Specifying a Backup IPAddress
A backup (secondary or redundant) IP address can be added when you add a new PDU to Power IQ.
1. In the Facility Items tab, click the Add button and icon under the Facility Items List. The Add a New PDU Page willappear.

2. Enter the relevant details in each field.3. In the Backup IP section, enter the desired backup IP address. Note: Both IPv4 and IPv6 addresses are supported.
4. Click the Add button to add the PDU. A dialog indicating that the PDU is being added will appear.5. Click OK in the Adding PDU dialog once the task has been completed successfully to return to the Facility Items
List page.
Note: You can specify only one backup IP address manually.
Adding, Editing, or Deleting a Backup IPAddress for an ExistingPDU
A backup (secondary or redundant) IP address can be added, edited, or deleted for an existing PDU manually by the userthrough Power IQ.
1. In the Facility Items tab, click on the PDU you want to add or edit the backup IP address for. The PDU’s smartpage will appear.
104

105
2. On the smart page, click Actions > Edit. The Change Credentials for PDU (Edit) page will appear.3. In the Backup IP section, make the appropriate change.
a. Add a new backup IP address by typing it in the Backup IP Address field.b. Edit the existing backup IP address by making your changes in the Backup IP Address field.c. Delete the backup IP address by checking the Delete Backup IP Address box.
d. Click the Save button to save your changes and return to the smart page.
Note: You can specify only one backup IP address manually.
Note: You also can add backup IP addresses in bulk via CSVimport. For more information, see Bulk Adding, Editing, orDeleting Backup IP Addresses Using CSVImport below.
Bulk Adding, Editing, or Deleting Backup IPAddresses Using CSVImport
Backup (secondary or redundant) IP addresses can be added in bulk via CSVImport.
1. On the Import PDUs page, download the Import file template.2. Open the file.3. In the Step 1: Add PDUs worksheet in the CSVfile, add backup IP addresses to the desired PDUs. The backup IP
addresses are entered in the Backup IP Address column.4. Back on the Import PDUs page, use the Browse dialog to select your CSVfile.5. Click Import PDUs.
You also can configure backup IP addresses for individual PDUs on the PDU's smart page. For more information, seeAdding, Editing, or Deleting a Backup IP Address for an Existing PDU on the previous page.
Note: In the Step 1: Add PDUs worksheet, the Backup IP Address column is located between the Proxy Index and PXUserName column.
Note on Bulk Editing and Deleting: If you import through CSVa PDU that already exists and has a backup IP address spe-cified in Power IQ, the existing backup IP address will be overwritten with the backup IP address specified in the CSV. If abackup IP address is not specified in the CSVfile for a PDU that already exists and has a backup IP address specified inPower IQ, then the backup IP address will be deleted for that PDU.

Trap Support for Backup IPAddresses
If a trap is received from a backup (secondary or redundant) IP address, Power IQ will associate the trap with the IPaddress of the primary PDU so the trap will display as if it is coming from the primary PDU.
When Power IQ loses connectivity with the primary and begins polling the backup IP address, Power IQ will create atimestamped, Warning-severity event called “Failover IP address in use” with the summary description, “Data collection isbeing performed using a failover IP address.” The target will be the primary IP address and/or the PDU name.
Note: To clear the Failover event, Power IQ must lose connectivity with the backup IP address and connectivity to theprimary IP address must be restored.
Polling Path Redundancy for CPI PDUs (Secure Array Support)
This section highlights support considerations for Power IQ's Polling Path Redundancy specific to Chatsworth Products,Inc. (CPI) PDUs and Secure Array IP Consolidation, which enables users to link up to 32 PDUs under a single IP addressusing standard Ethernet cables.
When you add a supported CPI PDU, Power IQ will find the backup (secondary or redundant) IP address configured for theunit automatically.
For CPI PDUs, you can have up to two backup IP addresses: one automatically discovered and one manually entered. Themanually entered backup IP address will be displayed on the PDU’s smart page.
If there are multiple backup IP addresses associated with a PDU, there is no specific polling order. If the primary is unavail-able, the backup will be the IP address that is found first. When the primary becomes available, Power IQ will switch to theprimary.
Due to hardware limitations for the PDUs, there could be a delay of 2-7 minutes before the primary and backup PDUsrecognize that they have lost connectivity with each other, so multiple polls may occur before Power IQ switches to thebackup IP address. In the interim after the primary becomes unavailable and before Power IQ switches to the backup IPaddress, the PDU will display a unit health state.
If both the primary and alternate units are unavailable to Power IQ, after approximately one hour (depending on your pollerconfiguration settings), a Data Connectivity: Lost communication event will be created.
106

107
For more information on Polling Path Redundancy, see Configuring Polling Path Redundancy (Backup IP Address Support)for PDUs on page 103.
For more information on CPI PDU support in Power IQ, see Native Support for Chatsworth eConnect PDUs on page 477.

Support for IPv6
l You can assign Power IQ an IPv6 address.l Power IQ supports IPv6 communication for the following functions.l Add PDUs with IPv6 addressesl Add PDUs with IPv6 addresses using CSVimportl Add IT devices with IPv6 addressesl Enable access controls using IPv6 addressl Use SNMP diagnostics over IPv6 network.l Allow IPv6 hosts to connect to the ODBC databasel Configuring NTP servers with IPv6 addressesl Do network diagnostics using ping, traceroute over IPv6 network. Serial console only.l Enable static routes using IPv6 addresses. Serial console only.
Valid IPv6 Address Formats
Power IQ accepts IPv6 addresses written in any of the valid formats.
IPv6 addresses need to be enclosed in square brackets when used in the browser.
These examples show several valid versions of the same IPv6 address, and one invalid example.
Chapter 4 Valid IPv6 addressformats:
l FE00:0000:0000:0001:0000:0000:0000:0056l FE00::1:0:0:0:56l FE00:0:0:1::56l In a browser: https://[FE07:2fa:6cff:2113::101]/login
Chapter 4 Invalid IPv6 addressformats:
Note: The :: abbreviation, meaning one or more quartets of all 0s, cannot be used twice.
l The abbreviation FE00::1::56 is not valid.
PDU Autodiscovery
Autodiscover PDUs on your network to quickly add them to Power IQ.
To use this feature:
l PDUs must be set on the network with an IP address.l PDUs must be configured with SNMP v1, v2 or v3l PDUs can be on multiple subnets.l The SNMP configuration may differ among the PDUs (for example community strings).
108

109
Note: When a Server Technology primary PDU is autodiscovered within an IP address range, the daisy-chained PDUsattached to the primary will also be discovered.
Note: If you do not have enough licenses, you receive an error message indicating you've exceeded the license. You can-not add PDUs without purchasing additional licenses.
1. Click the Facility Items tab in Power IQ to open the Facility Items List.2. Click the Add link under Facility Items List.
3. On the Add PDUs page, click the "discover PDUs on the network" link to open the PDU Autodiscovery page.

4. The Discover PDUs on the Network page displays. Enter the required information.
5. Enter the Starting IP Address.6. Enter the Quantity. This is the number of PDUs on the specific string that you want to discover.7. Select the SNMP version.8. Enter PDU access credentials.9. Enter the community string of the PDUs, if applicable.
10. Click Start Discovery.11. When prompted, confirm you want to begin.
Note: To stop autodiscovery once it has begun, you must restart the poller.
Note: If the autodiscovery process is interrupted, the event is recorded in the audit log.
110

111
Autodiscovery runs in the background and you can work in other screens while it runs.
PDUs located by autodiscovery are listed on the PDUs page.

How to Add PDUs to Power IQAdding PDUs to Power IQ Manually
Once Power IQ is configured, add PDUs. Power IQ can then gather data from these PDUs. If you're adding a PDU thatuses a custom dynamic plugin, see Adding PDUs with Custom Dynamic Plugins in the online help or user guide.
You can also add PDUs to Power IQ by uploading a CSVfile containing the information. See Adding PDUs in Bulk with CSVFiles.
1. In the Facility Items tab, click the Add link.2. Enter the IP address of the PDU.3. Optional: If the PDU is in a daisy-chained configuration or console server configuration, enter the PDU's position
number in the chain or serial port number in the Proxy Index fields.For PDUs that use the MAC address as a proxy index, enter the last six digits of the address separated by a colon(for example: 01:89:ab).
You can also specify branch circuit monitors using the Proxy Index field.
Leave this value blank if the PDU does not support or is not using this configuration.
Note: As a best practice when renaming outlets and other objects in the EDM in Power IQ, Sunbird recommends
exporting the current data to a CSV file that you can edit and then import. This will ensure that the Proxy Index
value corresponds to the correct integer representation for the MAC.
4. Enter an asset tag number or other asset management code in the External Key field. Optional.5. Enter data in Custom Field 1 and Custom Field 2. Optional. The labels may have been changed in Power IQ to
identify these fields.6. If the PDU is a Raritan PX-series or Server Technology PDU, enter a valid Username and Password for the PDU in
the PDU Administrative Credentials section. Re-enter the password in the Password Confirm field. Optional.7. Select the SNMP Version.
l For SNMP version 1/2c PDUs, enter an SNMP Community String that has at least READ permissions to this PDU.This enables polling the PDU for data. Enter an SNMP community string that has both READ and WRITEper-missions to the PDU to enable power control, outlet naming, sensor naming, and buffered data retrieval.
l For SNMP version 3 PDUs, enter the Username and select an Authorization Level. The authorization levels are:l noAuthNoPriv - No Authentication Passkey, No Encoding Passkeyl authNoPriv - Authentication Passkey, No Encoding Passkeyl authPriv - Authentication Passkey, Encoding Passkey
a. Depending on the Authorization Level selected, you must enter additional credentials for Authorization and Pri-vacy.
b. Authorization Protocol: Select MD5 or SHA.c. Enter the PDU's Authorization Passkey, then re-enter the passkey in the Authorization Passkey Confirm field.d. Privacy Protocol: Select DES or AES.e. Enter the PDU's Privacy Passkey, then re-enter the passkey in the Privacy Passkey Confirm field.
Note: You must enable the SNMP agent on all PDUs added to Power IQ.
112

113
8. Select "Validate and wait for discovery to complete before proceeding" to check credentials and view the discoveryprocess status as you add this PDU. Optional.
Note: When Power IQ discovers a primary Server Technology PDU, its daisy-chained PDUs will also be discoveredand added to the Facility Items list. If the daisy-chained PDUs are already in Power IQ, those PDUs will not berediscovered and will retain their PDU IDs.
9. Click Add.
Note: PDU discovery is complete once the PDU model type is determined. SNMP fields such as contact or location
values are not determined until this device is polled for the first time.
Once added, the PDU appears in the Facility Items List. Power IQ begins polling the PDU for sensor data. You can con-figure how often Power IQ polls PDU.
Note: If you change the administrator password used by Power IQ for a Server Technology PDU through the PDU UI, youmust restart the PDU to ensure that the Server Technology SNAP API will correctly authenticate requests from Power IQ.However, if you change the administrator password through the Power IQ UI, Power IQ will restart the PDU without anyadditional action by the user.

Discovery Progress Status
Viewing the discovery process displays a status result for each PDU. See PDU ConnectivityHealth Statuses.
114

115
Validating PDU Credentials
When adding PDUs to Power IQ individually, you can specify whether the admin credentials are validated.
Check the "Validate and wait for discovery to complete before proceeding" checkbox on the Add a New PDU page. SeeAdding PDUsto Power IQ for details on adding PDUs.
When you specify validation, the PDU will not be added if the credentials are incorrect. If you opt not to validate, all PDUswill be added, and those added with incorrect credentials will trigger an event called PDUCredentialsInvalid.
When adding PDUs to Power IQ with a CSVfile, the admin credentials are not validated before the PDU is added. Whencredentials are found to be incorrect, an event is logged.
Power IQ can poll PDUs without the correct credentials. You cannot upgrade PDUs or use bulk configuration without thecorrect credentials.

Editing PDUs under Power IQManagement
Editing a PDU allows you to reconfigure the SNMP community string for a PDU, or change the username and passwordused to access that PDU.
If you need to maintain the PDU or physically remove it without deleting its data from Power IQ, you have to edit the PDUto change its connectivity state. See Managing Removed or Out of Service Items on page 776.
1. In the Facility Items tab, click a PDU to open the PDU's smart page.2. Choose Actions > Edit.3. Enter an asset tag number or other asset management code in the External Key field. Optional.4. To set the PDU to the maintenance mode, select the Maintenance Mode checkbox. To decommission the PDU,
select the Decommissioned checkbox. If both checkboxes are selected, the PDU is considered decommissioned.5. Enter data in Custom Field 1 and Custom Field 2. Optional. The labels may have been changed in Power IQ to
identify these fields.6. Select the SNMP Version. Then, use the fields that display to enter the credentials. To delete previous credentials
for either SNMP version, select the "Delete SNMP v2 community credentials" checkbox.
l For SNMP version 1/2c PDUs, enter an SNMP Community String that has at least READ permissions to this PDU.Use an SNMP community string that has both READ and WRITEpermissions to the PDU to enable power control,outlet renaming, and buffered data retrieval. Re-enter the string in the Community String Confirm field.
l For SNMP version 3 PDUs, enter the Username and select an Authorization Level. The authorization levels are:
l noAuthNoPriv: No Authentication Passkey, No Encoding Passkey
l authNoPriv: Authentication Passkey, No Encoding Passkey
l authPriv: Authentication Passkey, Encoding Passkeya. Depending on the Authorization Level selected, you must enter additional credentials for Authorization and
Privacy.b. Authorization Protocol: Select MD5 or SHA.c. Enter the PDU's Authorization Passkey, then re-enter the passkey in the Authorization Passkey Confirm
field.d. Privacy Protocol: Select DES or AES.e. Enter the PDU's Privacy Passkey, then re-enter the passkey in the Privacy Passkey Confirm field.
7. PDU Phase:l When Power IQ can detect the phase, the Automatic option is selected, and the phase displays. For
example, "Automatic (determined to be single phase)."l When a PDU does not report phase, the Ignored option is selected. You can keep this setting to ignore
phase, or set the phase manually.l To set the phase manually, either if it cannot be determined automatically, or is incorrect, select the "Manu-
ally set to single phase" or "Manually set to three phase" option.8. If the PDU is a Raritan PX/PX2/PX3/EMXor a Server Technology PDU, enter a valid Username and Password for the
PDU in the PDU Administrative Credentials section. Re-enter the password in the Password Confirm field. Leavethe fields blank to keep using the password already configured. If you want to use a blank password, select the"Delete PXcredentials" checkbox. Optional.
9. Enter the backup IP address. Optional. Leave the field blank if not using a backup IP address. To delete an existingbackup IP address, check the "Delete Backup IP Address" checkbox.
10. Click Save.
116

117
Note: If you change the administrator password used by Power IQ for a Server Technology PDU through the PDU UI, youmust restart the PDU to ensure that the Server Technology SNAP API will correctly authenticate requests from Power IQ.However, if you change the administrator password through the Power IQ UI, Power IQ will restart the PDU without anyadditional action by the user.

Configuring Estimated Voltages
Power IQ can estimate Active Power for PDUs that do not directly provide Active Power measurements.
If a PDU does not provide one of the following values, the default estimated voltage will be applied. See Setting DefaultEstimated Voltages on page 102.
l Inlet Voltagel Outlet Voltagel Active Power
These voltage values are only editable when they are NOT coming from the PDU.
1. In the Facility Items tab, select a PDU then click the Edit this PDU icon in the Actions column.2. For three-phase PDUs, enter the voltages in the Manually Configured Inlet Voltage and Manually Configured Outlet
Voltage fields.3. For single-phase PDUs, enter the inlet voltage in the Manually Configured Voltage field.
If no value is entered, the default value is used.
4. Click Save.
118

119
Adding PDUs in Bulk with CSV
Structure of the Add PDUs CSVFile
The structure of the CSVfile is as follows:
l One line per PDU to import.l No header row.l Each line has only the following value columns, in the following order:
1. IP address2. Proxy index: If the PDU is in a daisy-chained configuration or console server configuration, enter the PDU's
position number in the chain or serial port number. See Proxy Index Details. For PDUs that use the MACaddress as a proxy index, enter the last six digits of the address separated by a colon (for example:01:89:ab).
Leave blankifnot configuring a backup IP address.
3. Backup IP Address
Leave blankif the PDU isnot in thistype ofconfiguration.
4. Raritan PXusername5. Raritan PXpassword
Leave the Raritan PXusername and Raritan PXpassword fieldsblankforotherPDUs.
6. SNMP Community String
Leave the SNMP CommunityString blankif it doesnot applyfora PDU.
7. SNMPv3 enabled: true or false.
Leave columns8-13 blankifSNMPv3 isset to false.
8. SNMPv3 username9. SNMPv3 authorization level: noAuthNoPriv, authNoPriv or authPriv.
10. Authorization protocol: MD5 or SHA.11. Authorization passkey: no commas allowed12. Privacy protocol: DES or AES13. Privacy passkey: no commas allowed14. External key15. Custom field 116. Custom field 2
For example:
Example
192.168.43.184,,,admin,raritan,private
192.168.44.101,,,,,PDUread

The first line in this example represents a Raritan PXPDU. The second line represents a PDU from another vendor. Upload-ing this CSVfile would instruct Power IQ to add two PDUs to management. The first PDU is located at 192.168.43.184, anduses the login/password combination admin/raritan for authentication. Its SNMP Community String is set to private. Thesecond PDU is located at 192.168.44.101 and does not use a user name and password for authentication. Its SNMP Com-munity String is set to PDUread.
Note: When a Server Technology primary PDU is imported into Power IQ via CSV import, its daisy-chained PDUs will alsobe imported. However, a CSVimport file with only daisy-chained PDUs will not result in the import of the primary PDU.
Proxy Index Details
For stand-alone PDUs, the proxy index field should be left blank.
For PDUs acting in a daisy-chain, or for PDUs that are being proxied through another PDU, the proxy index field should con-tain the number of the PDU's position.
For daisy chained systems, the proxy index field should be set to the PDU's position within the chain. The head-end orprimary system should have a proxy index value of 1. The second system in the chain would have a proxy address of 2 andso on.
For PDUs that use the MAC address as a proxy index, enter the last six digits of the address separated by a colon (forexample: 01:89:ab).
For element managed systems, such as PDUs behind a serial proxy, the proxy index field should contain the serial portnumber to which the PDU is attached on the management console.
120

121
Adding Raritan Power Meter and Power Meter Branch Circuit Mon-itor (BCM)
You can add a Raritan Power Meter and Power Meter Branch Circuit Monitor (PMM and PMB) to Power IQ the same wayyou add a PDU.
1. Add the meter using the IP address of the Power Meter Controller (PMC) module.2. If your PMC manages more than one PMM/PMB, enter the dip-switch setting as the Proxy Index to identify the cor-
rect module. Power IQ checks which modules are connected to your PMC to determine how to add the unit.l If Power IQ discovers the PMM alone, it is added as a Standalone Power Meter.l If Power IQ discovers the PMM with the PMB connected, it is added as a Power Panel.l Power IQ discovers new circuits automatically, but does not recognize other changes made in the PMC
interface. Decommission and add the unit again to get the updated configuration.

l Asset management strips and environmental sensors connected to Raritan Power Meters are not supported
in Power IQ 5.0.
122

123
Adding Raritan EMX
You can add a Raritan EMXto Power IQ the same way you add a PDU. All information in this help that refers to PDUs canbe applied to EMX, with a few exceptions.
Power IQ collects and displays sensor and asset strip data from a EMXin the same way as other PDUs with attachedsensors or asset strips. EMXdoes not have any outlets.
You cannot upgrade or use bulk configuration for EMXthrough Power IQ.

Adding MRVPDUs
For MRVPDUs, make sure you have configured the get and set clients with the same community string, and use that com-munity string when adding the PDU to Power IQ.
124

125
Adding Rack Transfer Switches
You can add a supported Rack Transfer Switch to Power IQ the same way you add a PDU.
You can upgrade or use bulk configuration for Raritan PX3TS transfer switches through Power IQ.

Adding Veris Branch Circuit Monitors with Acquisuite
Use the Add a PDU function to add a Veris branch circuit monitor (BCM) connected to a Veris or Obvius Acquisuite mod-bus to Power IQ.
For more information, see How to Add PDUs to Power IQ on page 112.
Specify the following information when adding the Veris BCM to ensure Power IQ connects to the correct panel.
Field name in Add aPDU page Modbus/BCM information
IP Address IP address of the Acquisuite modbus.
Proxy IndexREQUIRED
Device number of the BCM panel.
Example: The device number of the panel as configured in the Acquisuite. This inform-ation can be found in the Acquisuite web client.
Each panel displays as a PDU with up to 42 outlets. Each branch displays as an outlet.
Each single-phase branch is monitored independently as a single-phase circuit.
Groupings into multi-phase circuits is not supported.
126

127
Adding PDUs Managed by Dominion SX
You can add PDUs that are managed by a Dominion SXserial console to Power IQ.
Specify the following information when adding the PDU to ensure Power IQ connects to the correct SX-managed PDU.
See How to Add PDUs to Power IQ on page 112
Field name in Add a PDU page Modbus/BCM information
IP Address IP address of the Dominion SX
Proxy Index Dominion SXport number that the PDU is connected to
PDU Administrative Credentials
Username, Password, Password ConfirmDominion SXusername and password
SNMP fields Leave blank.

Adding PDUs with Custom Dynamic Plugins
When adding a PDU that uses a custom dynamic plugin, use the same Add a PDU feature as any other addition. See Howto Add PDUs to Power IQ on page 112.
When Power IQ detects that there is at least one custom dynamic plugin configured, a Plugin drop-down field displays.
128

Automatic: Use Automatic to allow Power IQ to determine the correct plugin for the PDU you are adding. Automaticattempts to find an exact match between the PDU and the plugin for SysObjectID, PDU Model name, and Proxy ID.
If there is no exact match, but several dynamic plugins are eligible to manage the PDU, based on sysObjectID, then PowerIQ selects from among the eligible plugins. If automatic mode does not select the desired dynamic plugin, delete the PDUand add it again, selecting the specific custom dynamic plugin from the list.
Alternatively, select the specific custom dynamic plugin from the list.
For more information, see How Power IQ Associates Facility Items with a Structured or Custom Plugin on page 734.
130

131
Adding Raritan PDUs in Port Forwarding Configuration
Raritan PDUs can be cascaded via USB cables to share an Ethernet connection. The first PDU in the chain is the primarydevice, and all PDUs connected to it are extension devices.
Power IQ USB-cascading chains have been tested with a total of eight PDUs, however there is no upper limit to the num-ber of devices in the chain.
Note: Power IQ only recognizes Raritan "PX2" and "PX3" PDU models in a USB-cascading chain. For details, see theUSBCascading Solution Guide on the PX2 web page (http://www.raritan.com/support/product/px2/) of the Raritan web-site.
Chains can be built using USB, network or a mixture of both. It is transparent to Power IQ, i.e. Power IQ can not see howthe chain is built, still it supports any of those chains.
Add primary and extension PDUs in Port Forwarding mode the same way you add a standalone Raritan PDU. See How toAdd PDUs to Power IQ on page 112.
Power IQ includes built-in validations and protections, and displays notification messages when the port forwarding con-figuration order is changed.
Specify the following information when adding primary and extension PDUs in Port Forwarding mode.
Field name in Add a PDUpage Primary PDU Extension PDU
IP Address IP address of the primary PDU Same IP address as the primary PDU
Proxy IndexREQUIRED
1 8
External KeyAny unique entry different from the IPaddress
Any unique entry different from the IPaddress
PDU Administrative Credentials
Username, Password, PasswordConfirm
The primary PDU's credentials The extension PDU's credentials
SNMP fields The primary PDU's SNMP strings The extension PDU's SNMP strings

Adding Server Technology PDUs
Many Server Technology PDUs follow a configuration with a primary PDU and daisy-chained PDUs. This configuration ishandled in Power IQ as follows:
When adding PDUs through the Power IQ GUI, when Power IQ discovers a primary Server Technology PDU, its daisy-chained PDUs will also be discovered and added to the Facility Items list. If the daisy-chained PDUs are already in PowerIQ, those PDUs will not be rediscovered and will retain their PDU IDs.
Autodiscovery of Server Technology PDUs
When a Server Technology primary PDU is autodiscovered within an IP address range using Power IQ's autodiscovery fea-ture, the daisy-chained PDUs attached to the primary will also be discovered as separate units, starting at Proxy Index 2.The feature also applies when a Server Technology primary PDU is added either manually or through CSVimport.
Adding Server Technology PDUs via CSVImport
When a Server Technology primary PDU is imported into Power IQ via CSV import, its daisy-chained PDUs will also beimported. However, a CSVimport file with only daisy-chained PDUs will not result in the import of the primary PDU.
Server Technology PDU Names in Power IQ
In naming PDUs, Power IQ typically uses a PDU's sysName value as is commonly seen on the SNMP MIB to display thePDU name in the GUI. However, to improve identification of daisy-chained Server Technology PDUs, Power IQ now usesthe the sysName value for primary PDUs and the PDU's Tower Name for the daisy-chained Server Technology PDUs.
For the primary PDU:
l Power IQ will show the sysName valuel When the user changes the PDU Name in Power IQ, Power IQ will update both the sysName value and the Tower
Name for that PDU
For the daisy-chained PDUs:
l Power IQ will show the Tower name value for each PDUl When the user changes the PDU Name in Power IQ, Power IQ will only update the Tower Name for that PDU
Server Technology PDU Firmware Version and X.509 CertificateIssues
This section covers potential issues related to Server Technology PDU firmware versions and X.509 security certifications.It provides recommendations to avoid or address these issues on Server Technology PDUs.
Power IQ supports discovery and data collection for Server Technology PDUs running pre-v7.0m firmware. However, somenew features, including administrator credential validation, bulk configuration, and firmware upgrades are supported forPDUs running only v7.0m or higher firmware.
132

133
On Server Technology PDU’s running v7 firmware, Power IQ will generate an “Admin Credentials Invalid” event and dis-play the PDU in a Warning state for the following reasons:
l Credentials don’t match those of an "Administrator" user on the PDUl PDU is running pre-v7.0m firmwarel PDU has an older X.509 certificate that was generated with an older encryption protocol that is no longer con-
sidered secure. As a result, Power IQ is not able to authenticate their administrator credentials. Refer to the recom-mendations section for instructions on how to generate a new certificate on the PDU.
Recommendations for Server Technology PDUs in Power IQ 6.2
Sunbird makes the following recommendations to customers to address these issues:
1. Prior to upgrading to Power IQ6.2, upgrade all Server Technology PDUs to the latestavailable firmware (at a minimum v7.0m).
After upgrading the Server Technology PDU firmware, you should generate a new X.509 certificate for any Server Tech-nology PDU which was purchased prior to 2016 and has never had a new certificate generated.
To do so, log in to the Server Technology PDU web GUI. Then navigate to Tools > Restart and initiate a system restart thePDU with the "Restart and generate a new X.509 certificate" option. Please refer to your ServerTech PDU documentationfor further instructions.
2. After upgrading to Power IQ6.2, update your Server Technology PDUadministratorcredentials.
After upgrading to Power IQ 6.2, you should update the configuration of all your Server Technology PDUs that are man-aged in Power IQ to include administrator credentials. This is required to be able to take advantage of all the new ServerTechnology related functionality in Power IQ 6.2.
Note: If you change the administrator password used by Power IQ on a Server Technology PDU through the PDU UI, youmust restart the PDU to ensure that the Server Technology SNAP API will correctly authenticate requests from Power IQ.However, if you change the administrator password through the Power IQ UI, Power IQ will restart the PDU without anyadditional action by the user.

Bulk Configuration of PDUs
Bulk configuration capabilities in Power IQ are supported for Raritan and Server Technology PDUs.
134

135
Requirements for Bulk Configuration
Bulk configuration is supported for Raritan and Server Technology PDUs only.
NOTE: For Raritan PX2s, the Bulk Configuration feature can be used to copy configuration files to other PXdevices of thesame model and firmware version. On Raritan PX2s running firmware 2.5.30 or higher, the model is considered the samewhen the only differences are the length of the line cord (option A or L), the color of the line cord (Option B), or the PDUColor (option K).
l Each PDU must be configured with an IP address and be under Power IQ management.l A configuration backup file from a configured Raritan or Server Technology PDU.

Planning a New Rollout
1. In the Facility Items tab, choose Activities > Bulk Configuration Activities.2. On the Bulk Configuration Activities page, select Clone and Restore Configuration Files.3. On the Bulk PDU Configuration page, click Plan a new rollout or, if an existing unexecuted plan exists in the sys-
tem, click the Activities menu > Plan a new rollout. The Bulk PDU Configuration rollout planning wizard starts.4. Enter a name for the plan and click Continue.
A summary of plan options appears at the top of the page. Continue adding details of your plan at the bottom of thepage, or click the links in the summary list to add details.
5. In the Choose a PDU Configuration File section, you can add a new PXbackup file or select a previously uploadedfile. Configuration backup files are .XML files for PX2 configurations, and do not show a file extension for PX1 con-figurations.
6. To add a new file, click the Upload a New File tab, then click Browse to select the file. Enter comments. ClickUpload. The file is automatically selected for the plan.
7. To select a previously uploaded file, click the Available Files tab, then select a file from the list, and click Continue.8. All PDUs available for the rollout appear in a list. Select the checkboxes for the PDUs you want to configure, then
click Selected PDUs to add them to the "PDUs selected for this plan" list at the bottom of the page. Or, click AllPDUs to add all available PXPDUs to the list.
9. To remove PDUs from the plan, click Selected PDUs or All PDUs in the bottom list. Only PDUs in the bottom list willbe configured.
10. Click Continue. Click the Plan Options link in the summary at top.
11. On the Plan Options page, edit the plan name, if needed, and set other preferences.12. Select the "Abort on failure" checkbox if you want Power IQ to cancel all remaining configurations in the plan if a
configuration failure occurs. This could help prevent a configuration problem from affecting other Raritan PXPDUsin the plan.
13. Select the "Allow simultaneous rollouts" checkbox if you want Power IQ to configure multiple Raritan PXPDUs atonce. This makes batch configurations faster by allowing up to 25 configurations to run at the same time.
14. Click Continue. Review the summary of the plan. Click Add Comment if you want add notes to the plan. Click Addor Remove PDUs if you want to edit the list of PDUs to configure.
15. Click Save. The completed plan summary page opens.16. Click Start Rollout to execute the plan immediately. The rollout starts, and the status page displays. You can also
execute the saved plan later.
See Viewing a Status of Rollout Plans in Progress for details on checking rollouts in progress.
See Viewing Completed Rollout Plans for details on checking completed rollouts.
136

137
Viewing Saved/Current Rollout Plans
View saved rollout plans to verify and edit their details before executing a plan.
1. In the Facility Items tab, select Activities > Bulk Configuration Activities.2. On the Bulk Configuration Activities page, select Clone and Restore Configuration Files.3. On the Bulk PDU Configuration page, saved rollout plans are available in the Saved Plans section.4. Click the plan name link to view the details and edit if needed.
Note: You can also view saved rollout plans on the Saved PDU Configuration Rollout Plans page under Activities > Viewstatus of current rollouts.

Editing a Saved Rollout Plan
Saved rollout plans can be edited to change details, add or remove PDUs, or change the configuration file.
You can only edit rollout plans that you created.
1. In the Facility Items tab, select Activities > Bulk Configuration Activities.2. On the Bulk Configuration Activities page, select Clone and Restore Configuration Files.3. On the Bulk PDU Configuration page, saved rollout plans are available in the Saved Plans section.4. Click the Plan name link to view the plan summary page.5. Click the Edit link on the Plan Summary page to edit the plan.6. Click the blue links on the Edit page to edit the plan name, choose a configuration plan, select PDUs for the plan,
edit plan options, and add comments.7. Click the Save link to save your changes.
See Plan a New Rollout for details of plan settings.
Note: Plans with edits in progress are displayed in the Plan Edits in Progress section on the Bulk PDU Configuration homepage. Click the plan name link to access the Edit page.
138

139
Executing a Saved Rollout Plan
1. In the Facility Items tab, select Activities > Bulk Configuration Activities.2. On the Bulk Configuration Activities page, select Clone and Restore Configuration Files.3. On the Bulk PDU Configuration page, saved rollout plans are available in the Saved Plans section.4. Select the saved plan you want to execute to view its plan summary page.5. On the plan summary page, click Start Rollout to execute the plan.
See Viewing Status of Rollout Plans in Progress for details on checking rollouts in progress.
See Viewing Completed Rollout Plans for details on checking completed rollouts.
Rollout Timing
Each PDU configuration takes approximately 30 seconds.
If you select "Allow simultaneous rollouts" in the plan options, 25 configurations will begin simultaneously, and each batchof 25 will take approximately 30 seconds.

Viewing Status of Rollout Plans
Rollout plans have three possible statuses when in progress.
l Init: Initializing to prepare the PDU for configurationl Login: Logging in to the PDUl Verify: Verifying the PDU is responsive after configuration is complete
The status page for plans in progress displays when you execute the plan. You can return to the status page at any time,even after the plan has finished.
1. In the Facility Items tab, select Activities > Bulk Configuration Activities.2. On the Bulk Configuration Activities page, select Clone and Restore Configuration Files.3. On the Bulk PDU Configuration page, select Activities > View previously completed rollouts.4. Click the link for the plan you executed to view the plan summary page. At the top of the page, a status message
will be displayed. The message will vary based on the status of the plan.
5. Click the View detailed rollout status messages to view the detailed status messages for each PDU selected for theplan.
140

141
Viewing Completed Rollout Plans
When a plan has been executed, you can view details of the plan status and results of each PDU included in the plan.
1. In the Facility Items tab, select Activities > Bulk Configuration Activities.2. On the Bulk Configuration Activities page, select Clone and Restore Configuration Files.3. On the Bulk PDU Configuration page, select Activities > View previously completed rollouts.4. On the Completed PDU Configuration Roll Outs page, click the link for the plan you executed to view the plan sum-
mary page. At the top of the page, a status message will be displayed. The message will vary based on the status ofthe plan.
l If the plan completed successfully, a success message displays at the top of the plan details.l The list of PDUs included in the plan includes a Success or Failure message.
5. Click the "View detailed upgrade status messages" link for more information about each PDU.6. Click Delete Plan to delete it.

Managing Uploaded Configuration Files
You can upload different configuration files for use in rollout plans, and view previously uploaded configurations.
Configuration files are .DAT files. Configuration files are created by backing up a Raritan or Server Technology facility item.
1. In the Facility Items tab, select Activities > Bulk Configuration Activities. 2. On the Bulk Configuration Activities page, select Clone and Restore Configuration Files.3. On the Bulk PDU Configuration page, click Activities > Manage Uploaded Configuration Files. The PDU Con-
figuration Files page opens.4. To delete a file, select the checkbox for the configuration file you want to delete, then click Delete.5. To upload a new file, scroll down to the Upload New Configuration File section.
a. Enter the model name that the file is for in the Model Name field.b. Click Browse to select the .DAT file.c. Click Upload. The file is added to the list and will be available to select when creating a new rollout plan.
See Plan a New Rollout.
Note: You can also upload, delete, and edit firmware in the Firmware Update panel under Manage Bulk Con-figuration Templates > Templates Firmware Update.
142

143
Viewing the Run History and Report for a Bulk Configuration Tem-plate
You can view the run history for a specific bulk configuration template or plan within Power IQ. You can also view thereports for specific dates and times from the Run History page. Reports are created automatically when a template hasbeen run. If a template has not been run, you will not be able to view its run history.
To view the run history for a specific template:
1. In the Facility Items tab, select Activities > Bulk Configuration Activities.
2. On the Bulk Configuration Activities page, select Manage Bulk Configuration Templates.3. On the Templates page, select the existing template you would like to view the run history for.
4. Click the Run History link to view the run history page.
On the Run History page, you can select the template report you would like to view by clicking the Report link in the farright column of the report you would like to view. Reports can be filtered by the following:
l Statel Summary

l Start Date and Timel Completion Date and Time
Template/Plan Reports
The following screenshot shows an example template report for updating a password.
Each report includes the following sections:
Actions
The Actions section provides titles and descriptions for the actions performed (e.g., Update Password).
Summary
The Summary section provides the dates and times the actions were completed. It also indicates who executed the planand the number of facility items that were included and updated in the plan.
Details
The Details section provides date- and time-stamped messages for each facility item that indicate the state of each facil-ity item as the plan is executed (e.g., Waiting to run, Started tasks).
Reports also can be exported to PDF.
144

145
CSVSummary Report
A downloadable CSVsummary report is also available by clicking the Summary Report link on the Run History page. Thisreport can be used for sorting and filtering the data in Excel and for emailing to others on your team.
The CSVfile captures PDU information and whether the desired actions were completed successfully. It includes the fol-lowing columns:
l Label: The IP address or host name of the PDUl Name: The name of the PDUl Location: The location of the PDUl Manufacturer: The manufacturer or make of the PDUl Model: The model of the PDUl Password Update: Indicates the status of the action: Success, Fail, or Warning (completed but with errors or warn-
ings)l Firmware Update: Indicates the status of the action: Success, Fail, or Warning (completed but with errors or warn-
ings)l Trap Destinations: Indicates the status of the action: Success, Fail, or Warning (completed but with errors or warn-
ings)l SNMP Configuration: Indicates the status of the action: Success, Fail, or Warning (completed but with errors or
warnings)
The order of the actions may vary by which action were included in the template. For example, if only the PasswordUpdate action was included, only the Password Update column would be included in the report.

Managing Bulk Configuration Templates
Bulk configuration templates or plans are used to make configuration changes to one or more facility items in Power IQ.These templates are useful for making changes on facility items in bulk, without logging in to each device individually. Tem-plate also save time when you need to repeat the same action every so often (for example, changing the passwords onyour facility items every six months.)
You can change the administrator password, trap destinations, and SNMP settings using bulk configuration templates.Click the links below for detailed instructions for completing each action.
l Updating Firmware for Facility Items in Bulk on page 151l Changing the Administrator Password for Facility Items in Bulk on page 155l Setting Power IQ as the SNMP Trap Destination for Facility Items in Bulk on page 158l Configuring SNMP Settings for Facility Items in Bulk on page 162
To use bulk configuration template to make changes across a range of facility items:
1. Create a new template or edit an existing template2. Make your desired updates in the appropriate sections for one or more of the above actions.3. Select the facility items that you would like to update.4. Run the template.
Bulk configuration template can be created, edited, copied and deleted through Power IQ. You can also run an existingtemplate and view its run history. For more information, see Bulk Configuration Template Activities on the facing page
To manage bulk configuration templates:
1. In the Facility Items tab, select Activities > Bulk Configuration Activities.
2. On the Bulk Configuration Activities page, select Manage Bulk Configuration Templates.3. Click the Next button. The Templates page displays.
146

147
4. On the Templates page, select the existing plan you would like to run or click the Add button to create a new plan.Plans can be filtered based on the following: Name, Summary, Creator, Number of Runs, and Latest Run State.
Bulk Configuration Template Activities
The following actions are available on the Templates page for managing bulk configuration templates or plans. Click eachlink for detailed instructions.
l Adding a Bulk Configuration Template on the next pagel Editing a Bulk Configuration Template on the next pagel Copying a Bulk Configuration Template on page 149l Deleting a Bulk Configuration Template on page 149l Running a Bulk Configuration Template on page 150l Viewing Run History on page 150
To initiate each action, click on their respective links in the top bar on the Templates page in the Power IQ GUI.

Adding a Bulk Configuration Template
To add a bulk configuration template, click the Add link on the Bulk Configuration Templates page. A new template willautomatically be created, and you will be direction to the Actions page.
Note: To edit the plan's name or summary, return to the Templates page, select the plan, and click the Edit link.
Editing a Bulk Configuration Template
Two types of edits are available for bulk configuration templates:
1. Edit the template name and summary: To edit the template's name or summary, select the template and click theEdit link. Make your desired changes in the Name and Summary fields in the popup.
148

149
2. Edit the template actions: To edit the actions performed when the template is executed, click the Next button.a. On the Actions page, click the Reset button under any action to remove that action from the template. Click
the Save button in the appropriate action panel to save your changes.b. On the Add PDUs page, add or remove desired PDUs.c. Click the Run button to run the template.
Copying a Bulk Configuration Template
Copying a bulk configuration template can save time when you are creating multiple templates or plans with the sameactions.
To copy a bulk configuration template:
1. Select the template you want to copy.2. Click the Copy link on the Templates page. The Edit popup will display prepopulated with the original template's
name, time- and date-stamped and appended with "copy." The Summary will be the same as the original template.
3. Change the name and summary as desired.
The new template will appear in the Templates list.
Deleting a Bulk Configuration Template
Clean up your templates list by deleting old or unused bulk configuration templates/plans.
To delete a bulk configuration template:

1. On the Templates page, select the template you want to Delete.2. Click the Delete link.3. When prompted, click the Yes button to confirm the deletion.
The template will be removed from the Templates list.
Running a Bulk Configuration Template
1. Running a bulk configuration template or plan enables you to re-run the template as-is, without making changes toit.
2. To run a bulk configuration template:3. Select the template you want to run.4. Click the Run link on the Template page.5. A popup will display asking you to confirm that you want to apply the settings to selected facility items on the tem-
plate. Click the Yes button to proceed. Click the No button to cancel.6. If you select Yes, you will be redirected to the live status page. A success message will display once the run has
completed.
Viewing Run History
You can view the run history for a specific bulk configuration template or plan within Power IQ. You can also view thereports for specific dates and times from the Run History page. Reports are created automatically when a template hasbeen run. If a template has not been run, you will not be able to view its run history.
For detailed instructions, see Viewing the Run History and Report for a Bulk Configuration Template on page 143
150

151
Updating Firmware for Facility Items in Bulk
Site Administrators can update firmware for Raritan and Server Technology facility items in bulk.
Updating firmware for one or more Raritan and Server Technology facility items requires creating a new bulk configurationtemplate/plan or editing an existing template for uploading or selecting the firmware, selecting the desired facility items,and then running the plan to update the facility items with the new firmware.
For the change to take place, the facility item must have the administrator credentials set in Power IQ.
Note: Before performing bulk configuration actions on PDUs, Sunbird recommends putting them into Maintenance Mode.This will prevent events related to lost connectivity and admin credential checks from being generated while the actionsare running. After the bulk configuration plan has completed, be sure take the PDUs out of Maintenance Mode by usingthe Return to Service option.
To update firmware:
1. In the Facility Items tab, select Activities > Bulk Configuration Activities.
2. On the Bulk Configuration Activities page, select Manage Bulk Configuration Templates.3. On the Templates page, select the existing template you would like to run or click the Add link to create a new
template. Templates can be filtered based on the following: Name, Summary, Creator, Number of Runs, andLatest Run State.
Note: If you click the Add link, a new template will automatically be created, and you will be directed to theActions page, without clicking the Next button. Proceed to Step 5. To edit the template's name or summary,return to the Templates page, select the template, and click the Edit link.

4. Click the Next button. The Actions page will display.
152

153
5. In the Firmware Update section, select a firmware version from the table. You can only select one firmware ver-sion at a time.
6. Click the Save button in the Firmware section to save your changes. If successful, a success message will dis-play.
Note: On the Actions page, you can also update passwords, set Power IQ as a trap destination, and configureSNMP community credentials without the need to create a new plan. For more information, see Changing theAdministrator Password for Facility Items in Bulk on page 155, Setting Power IQ as the SNMP Trap Destinationfor Facility Items in Bulk on page 158 and Configuring SNMP Settings for Facility Items in Bulk on page 162respectively.

7. Click the Next link in the upper right corner.8. Select your desired PDUs from the list of available PDUs and click the Add PDUs link to add your desired PDUs to
the selected PDUs. If you have selected an ineligible PDU based on your current configuration, you will need toeither change the configuration or remove the ineligible PDUs.
Note: Since Power IQ only communicates with the primary PDU in the chain, Power IQ will only display theprimary Server Technology PDUs in the list of available PDUs. When you successfully change the password on aprimary Server Technology PDU, Power IQ will internally update the username and password for the PDU Admin-istrative Account on the daisy-chained PDUs to the same credentials. Updates to both the primary and daisy-chained PDUs are captured in the Power IQ audit log.
Note: You can also review the template actions in the Template Actions section at the top of the page. The Tem-plate Actions section will also note the supported facility items for each action.
9. Click the Run button.
Upon completion, the firmware will be updated.
Note: This feature is supported only for Raritan PX2, PX3, and EMXand Server Technology facility items.
154

155
Changing the Administrator Password for Facility Items in Bulk
Site Administrators can change the administrator password (used by Power IQ to poll facility items) on Raritan and ServerTechnology facility items, provided they have the current password.
Changing the administrator password for one or more multiple Raritan and Server Technology facility items requires cre-ating a new bulk configuration template/plan or editing an existing template for updating the password, verifying the oldand new passwords, selecting the desired facility items, and then running the plan to update the facility items with the newpassword.
For the change to take place, the facility item must have the administrator credentials set in Power IQ. A successful pass-word change will set the new password in both Power IQ and the facility item. The change will not take effect if the cre-dentials for the user who is initiating the change are incorrect or outdated.
Note: Before performing bulk configuration actions on PDUs, Sunbird recommends putting them into Maintenance Mode.This will prevent events related to lost connectivity and admin credential checks from being generated while the actionsare running. After the bulk configuration plan has completed, be sure take the PDUs out of Maintenance Mode by usingthe Return to Service option.
To change the administrator password:
1. In the Facility Items tab, select Activities > Bulk Configuration Activities.
2. On the Bulk Configuration Activities page, select Manage Bulk Configuration Templates.3. On the Templates page, select the existing template you would like to run or click the Add link to create a new
template. Templates can be filtered based on the following: Name, Summary, Creator, Number of Runs, andLatest Run State.
Note: If you click the Add link, a new template will automatically be created, and you will be directed to theActions page, without clicking the Next button. Proceed to Step 6. To edit the template's name or summary,return to the Templates page, select the template, and click the Edit link.

4. Click the Next button. The Actions page will display.5. In the Password Update section, provide the old password and desired new password in the appropriate fields.
6. Click the Save button in the Password Update section to save your changes. If successful, a success messagewill display.
Note: On the Actions page, you can also update firmware, set Power IQ as a trap destination, and configureSNMP community credentials without the need to create a new plan. For more information, see Updating Firm-ware for Facility Items in Bulk on page 151, Setting Power IQ as the SNMP Trap Destination for Facility Items inBulk on page 158 and Configuring SNMP Settings for Facility Items in Bulk on page 162 respectively.
7. Click the Next link in the upper right corner.8. Select your desired PDUs from the list of available PDUs and click the Add PDUs link to add your desired PDUs to
the selected PDUs.
Note: Since Power IQ only communicates with the primary PDU in the chain, Power IQ will only display theprimary Server Technology PDUs in the list of available PDUs. When you successfully change the password on a
156

157
primary Server Technology PDU, Power IQ will internally update the username and password for the PDU Admin-istrative Account on the daisy-chained PDUs to the same credentials. Updates to both the primary and daisy-chained PDUs are captured in the Power IQ audit log.
Note: You can also review the template actions in the Template Actions section at the top of the page.
9. Click the Run button.
Upon completion, the password will be updated.
Note: This feature is supported only for Raritan PX2, PX3, and EMXand Server Technology facility items.
Note: If you change the administrator password used by Power IQ for a Server Technology PDU through the PDU UI, youmust restart the PDU to ensure that the Server Technology SNAP API will correctly authenticate requests from Power IQ.However, if you change the administrator password through the Power IQ UI, Power IQ will restart the PDU without anyadditional action by the user.

Setting Power IQ as the SNMPTrap Destination for Facility Items in Bulk
Site Administrators can set Power IQ as the SNMP trap destination on Raritan and Server Technology facility items.
Setting Power IQ as an SNMP trap destination for one or more Raritan or Server Technology facility items requires cre-ating a new bulk configuration template/plan or editing an existing template, enabling traps, setting the host to a Power IQIP address, selecting the desired facility items, and then running the template to update the facility items with the new trapdestination.
This feature supports SNMP v1/v2 trap configuration only.
Note: Since Power IQ only communicates with the primary PDU in the chain, Power IQ will only display the primaryServer Technology PDUs in the list of available PDUs. When you successfully change the password on a primary ServerTechnology PDU, Power IQ will internally update the username and password for the PDU Administrative Account on thedaisy-chained PDUs to the same credentials. Updates to both the primary and daisy-chained PDUs are captured in thePower IQ audit log.
Note: The trap port and community string on the facility item should be set to 162 and "public," respectively.
To set Power IQ as the SNMP trap destination:
1. In the Facility Items tab, select Activities > Bulk Configuration Activities.
2. On the Bulk Configuration Activities page, select Manage Bulk Configuration Templates.3. On the Templates page, select the existing template you would like to run or click the Add link to create a new
template. Tempates can be filtered based on the following: Name, Summary, Creator, Number of Runs, andLatest Run State.
Note: If you click the Add link, a new template will automatically be created, and you will be direction to the
Actions page, without clicking the Next button. Proceed to Step 6. To edit the template's name or sum-
mary, return to the Templates page, select the template, and click the Edit link.
158

159
4. Click the Next button. The Actions page displays.5. In the Change Trap Destinations panel, use the Enable Traps dropdown to enable, disable, or leave traps
unchanged. Select from Enable, Disable, or Unchanged respectively.
Note: The Host 2 IP Address is supported for Server Technology PDUs and for SNMPv2c on Raritan PDUs.
The Host 3 IP Address is supported for SNMPv2c on Raritan PDUs.
6. For one or more hosts, use the Host dropdown to select an IP address for Power IQ or to type in an IP address foranother system. Both IPv4 and IPv6 addresses are supported. You can specify up to three hosts. To remove ahost, select the Clear option.

Note: We strongly recommend that you ensure that one of the host destinations is set to Power IQ's IP Addressso that Power IQ can report on the events.
7. Click the Save button in the Change Trap Destinations panel to save your changes. If successful, a success mes-sage will display.
Note: On the Actions page, you can also change the administrator password and configure SNMP communitycredentials without the need to create a new plan. For more information, see Changing the Administrator Pass-word for Facility Items in Bulk on page 155 and Configuring SNMP Settings for Facility Items in Bulk on page 162respectively.
8. Click the Next link in the upper right corner.9. Select your desired PDUs from the list of available PDUs and click the Add PDUs link to add your desired PDUs to
the selected PDUs.
Note: Since Power IQ only communicates with the primary PDU in the chain, Power IQ will only display theprimary Server Technology PDUs in the list of available PDUs. When you successfully change the password on aprimary Server Technology PDU, Power IQ will internally update the username and password for the PDU Admin-istrative Account on the daisy-chained PDUs to the same credentials. Updates to both the primary and daisy-chained PDUs are captured in the Power IQ audit log.
Note: You can also review the plan actions in the Template Actions section at the top of the page.
160

161
10. Click the Run button.
Upon completion, the trap destinations will be updated.
Note: When running bulk configuration templates, if both SNMP settings and trap destinations are configured in the sametemplate, SNMP settings are configured before trap destinations are configured. As a result, the SNMP configuration onthe PDU and as known to Power IQ will be set to its target state prior to the trap destinations being updated to ensurethat trap destinations are changed accurately.
Note: You may need to enable the SNMP agent on Server Technology PDUs for the traps to be handled appropriately. Ifyou disable traps on a Server Technology PDU, you will need to re-enter the hosts values to enable traps at a later date.
Note: This feature is supported only for Raritan PX2, PX3, and EMXand Server Technology facility items.

Configuring SNMPSettings for Facility Items in Bulk
Site Administrators can configure SNMP community credentials on Raritan, CPI and Server Technology facility items inPower IQ.
Configuring SNMP community credentials for Power IQ polling for one or more Raritan, CPI and Server Technology facilityitems requires creating a new bulk configuration template/plan or editing an existing template, specifying SNMP v1/v2 orSNMP v3 settings, updating the appropriate fields, selecting the desired facility items, and then running the plan to updatethe facility items with the new configuration.
Note: Before performing bulk configuration actions on PDUs, Sunbird recommends putting them into Maintenance Mode.This will prevent events related to lost connectivity and admin credential checks from being generated while the actionsare running. After the bulk configuration plan has completed, be sure take the PDUs out of Maintenance Mode by usingthe Return to Service option.
Note: CPI facility items cannot support both SNMPv2 and SNMPv3 polling simultaneously. A warning message will dis-play if you attempt to configure both v1/v2c and v3 credentials for CPI facility items.
To configure SNMP community settings:
1. In the Facility Items tab, select Activities > Bulk Configuration Activities.
2. On the Bulk Configuration Activities page, select Manage Bulk Configuration Templates.3. On the Templates page, select the existing template you would like to run or click the Add link to create a new
template. Templates can be filtered based on the following: Name, Summary, Creator, Number of Runs, andLatest Run State.
162

163
Note: If you click the Add link, a new plan will automatically be created, and you will be direction to the
Actions page, without clicking the Next button. Proceed to Step 6. To edit the plan's name or summary,
return to the Templates page, select the template, and click the Edit link.
4. Click the Next button. The Actions page will display.5. In the SNMP Configuration panel on the Actions Page, use the Credentials to Use for Power IQ Polling dropdown
to select the SNMP type. Select from Read Community, Write Community (SNMP v1/v2) or SNMP v3.
6. In either the SNMP v1/v2 or SNMP v3 section, use the Enable on PDU dropdown to enable, disable, or leave thesettings unchanged. Select from Enable, Disable, or Unchanged respectively. (Note: CPI PDUs cannot supportboth SNMPv2 and SNMPv3 polling simultaneously. A warning message will display if you attemp to configure bothv1/v2c and v3 credentials for CPI PDUs.)
7. If you choose Read Community or Write Community from the Credentials to Use for Power IQ Polling dropdown,you must provide the Read Community String or Write Community String in the appropriate fields. (required)

8. If you choose SNMP v3 from the Credentials to Use for Power IQ Polling dropdown, you will need to provide the fol-lowing (the required settings will vary based on your selection):
a. Username
b. Authentication Level (Select from noAuthNoPriv, authNoPriv, or authPriv)
c. Authentication Protocol (Select from MD5 or SHA. Note that SHA is not supported for Server TechnologyPDUs, only CPI and Raritan PDUs.)
d. Authentication Passkey
e. Privacy Protocol (Select from AES or DES. Note that AES is not supported for Server Technology PDUs,only CPI and Raritan PDUs.)
f. Privacy Passkey
9. Click the Save button in the SNMP Configuration panel to save your changes. If successful, a success messagewill display.
Note: On the Actions page, you can also update firmware, set Power IQ as a trap destination, and change theadministrator password without the need to create a new plan. For more information, see Updating Firmware forFacility Items in Bulk on page 151, Setting Power IQ as the SNMP Trap Destination for Facility Items in Bulk onpage 158, and Changing the Administrator Password for Facility Items in Bulk on page 155 respectively.
10. Click the Next link in the upper right corner.11. Select your desired PDUs from the list of available PDUs and click the Add PDUs link to add your desired PDUs to
the selected PDUs.
12. Note: If you add CPI facility items to your plan that are part of a secure array, you must add both the primary andalternate facility items in order for secure array failover to function properly. Power IQ will provide the option toadd the missing alternate facility items, change the configuration, or remove the facility items.
Note: Since Power IQ only communicates with the primary PDU in the chain, Power IQ will only display theprimary Server Technology PDUs in the list of available PDUs. When you successfully change the password on aprimary Server Technology PDU, Power IQ will internally update the username and password for the PDU Admin-istrative Account on the daisy-chained PDUs to the same credentials. Updates to both the primary and daisy-chained PDUs are captured in the Power IQ audit log.
Note: You can also review the template actions in the Template Actions section at the top of the page.
164

165
13. Click the Run button.
Upon completion, the SNMP configuration will be updated.
Note: When running bulk configuration templates, if both SNMP settings and trap destinations are configured in the sametemplate, SNMP settings are configured before trap destinations are configured. As a result, the SNMP configuration onthe PDU and as known to Power IQ will be set to its target state prior to the trap destinations being updated to ensurethat trap destinations are changed accurately.
Note: This feature is supported only for CPI facility items running firmware version 4.4 or higher, Raritan PX2, PX3, andEMXand Server Technology facility items.

Backing Up Facility Item Configuration Files
Users can clone and restore facility item configuration files in Power IQ.
When enabled, backups are made automatically as part of the scheduled database backup. The most recent backup, aswell as the backups from the first days of the current and previous months, will be retained.
If you selected a configuration file that was a backup of a facility item, by default that facility item will be added to the selec-ted PDUs list when running the plan.
The backup and the date and time when captured will be displayed on the Choose a PDU Configuration page when editinga plan or creating a new plan.
Note: Users can backup and restore PDU configuration files for Raritan PX1, PX2, PX3, and EMXdevices only.
Enabling/Disabling Facility Item Configuration Backups
Site Administrators can enable or disable backing up of facility item configurations through the Settings tab.
To enable or disable this feature, check or uncheck the “Backup configuration files from supported facility items” checkboxunder Settings > Power IQ Settings > Backup Facility Item Configurations.
By default, the box will be checked.
Note: The most recent backup, as well as the backups from the first days of the current and previous months, will beretained.
Cloning and Restoring Facility Item Configuration Files
Bulk configuration files can be cloned or restored to facility items on the Choose a PDU Configuration File page when cre-ating a new rollout plan or editing an existing plan.
The Choose a PDU Configuration File page is the second step in the rollout plan wizard (after naming the plan). It can alsobe accessed by clicking the Choose a configuration file link (next to PDU Configuration file) on a plan summary page. Formore information, see Plan a New Rollout.
Backup files are listed in the first tab on the page. Backup files can be grouped, sorted and filtered by any of the following:
166

167
l Namel IP Addressl Locationl Typel Manufacturerl Modell Data Centerl Floorl Rooml Aislel Rowl Rackl PDUl Backup Date
To clone or restore a backup configuration file to a PDU:
1. In the Facility Items tab, select Activities > Bulk Configuration Activities.
2. On the Bulk Configuration Activities page, select Clone and Restore Configuration Files.3. Click the Next button.4. On the Bulk PDU Configuration page, select the plan you would like to change the PDU configuration file for.5. On the plan summary page, click the Choose a configuration file link. If creating a new rollout, proceed to the second
step of the wizard.
6. On the Choose a PDU Configuration File page, select the desired configuration file. You must select a file to continue.7. Click the Continue link.8. Select your desired PDUs. If you selected a configuration file that was a backup of a facility item, by default that facility
item will be added to the selected PDUs list.9. Click the Continue button.
10. Click the Save link.11. Click Start Roll Out to execute the plan.
To upload a file:

1. On the Choose a PDU Configuration File page, click the Upload File tab.2. Type in the desired model name.3. Click the Choose File button to choose your desired configuration file.4. Click the Upload link to upload the file.5. Once the file is uploaded, go to the Uploaded Files tab.6. Select the desired configuration file.7. Click the Continue link to save your changes.
Note: You can also upload a new configuration file on the PDU Configuration Files page (under Activities > ManageUploaded Configuration Files).
168

169
PDU Outlet Naming and Setting System Attributes
Power IQ enables you to export all the current PDU Outlet and System Attribute names to a CSVfile that you can edit, andthen re-import new names. See Naming Outlets in Bulk with CSVFiles on page 171. Change individual names manuallyby clicking a field and editing. See Naming Individual Outlets on the next page.
Raritan PDU outlet names can be up to 32 characters in length, with no character restrictions. See the manufacturer's spe-cification for naming requirements for other brands of PDUs.
Note: PDUs must be configured in Power IQ with an SNMP community string that has write-level access to allow outletnaming.
The following PDUs have manufacturer limitations that affect renaming via SNMP: Outlet and system attribute naming isnot available via SNMP for Avocent or Geist PDUs. Outlet naming via SNMP is not available for Tripp Lite PDUs or theEaton Pulluzi model PDU. The standard Eaton model does support outlet naming. System attribute naming via SNMP isnot available for Baytech PDUs. Names for Servertech PDUs cannot contain spaces. Setting the MIB-II sysContact valueis not supported for Chatsworth (CPI) PDUs. When importing Chatsworth PDUs via CSVimport, leave the sysContactvalue blank.

Naming Individual Outlets
1. In the Facility Items tab, click the link for a PDU to open the smart view.2. Scroll down to the Outlets list.3. Double-click the outlet name, then enter the new name in the field. Use only UTF-8 characters.4. Press Enter to save the name.
The names are written back to the PDU. If you connect to the PDU directly, the outlets appear there with their new names.
170

171
Naming Outlets in Bulk with CSVFiles
When you import an outlet name CSVfile, Power IQ names the outlets according to the values in the file. The names arewritten back to the PDU. If you connect to the PDU directly, the outlets appear there with their new names.
1. In the Facility Items tab, choose Activities > Bulk Configuration Activities.2. From the list of Bulk Configuration Activities, select Update via CSVImport/Export.3. Click Next.4. In the Import PDU Outlet Names section, click Browse to select your updated CSVfile.5. Click Import to initiate the file import.
You can export a CSVfile of the current outlet names from the Import PDU Outlet Names page. For more information, see Exporting Outlet Names to a CSVFile on page 174
For details on creating the outlet name CSVfile, see Structure of the Outlet Name CSVFile on page 173.

Setting SNMPSystem Attributes for PDUs
In addition to naming the outlets of PDUs, the Outlet Names CSVfile can be used to set three SNMP system attributes.These attributes are SYS_CONTACT, SYS_NAMEand SYS_LOCATION. These settings are optional values in the CSVfile.
1. SYS_CONTACT: is used to identify a person to contact regarding the PDU. For example, the IT administrator.2. SYS_NAME: is used to set the name of the PDU.3. SYS_LOCATION: is used to describe where the PDU is located. For example, "Sales Rack - Server Closet 2."
Note: Setting SNMP system attributes is not available for Raritan PXversions lower than 1.3, Baytech, Eaton, Geist,Liebert, or Avocent PDUs. Leave these fields blank for those PDUs.
172

173
Structure of the Outlet Name CSVFile
The CSVfile used for outlet naming and setting SNMP system attributes uses the following structure. There is one facilityitem per line/row.
Use only UTF-8 characters.
Note: The following facility items have manufacturer limitations that affect renaming via SNMP: Outlet and system attrib-ute naming is not available via SNMP for Avocent or Geist facility items. Outlet naming via SNMP is not available for TrippLite facility items or the Eaton Pulluzi model facility item. The standard Eaton model does support outlet naming. Systemattribute naming via SNMP is not available for Baytech facility items. Names for Servertech facility items cannot containspaces. Setting SNMP system attributes is not available for Raritan PXversions lower than 1.3, Baytech, Eaton, Geist,Liebert, or Avocent facility items. Leave these fields blank for those facility items.
l The first column is an IP address identifying a facility item.l The second column is the Proxy Index value. Leave this value blank if the facility item does not support or is not
using this configuration. You cannot change the Proxy Index value via CSVimport. See Proxy Index Details.l Optional The third column is the SNMP SYS_CONTACT value..l Optional The fourth column is for the SNMP SYS_NAMEvalue.l Optional The fifth column is for the SNMP SYS_LOCATION value.
Each value/column following the SYS_LOCATION represents an outlet on that facility item. Outlets start at 1 and increasesequentially with each column.
These values indicate only what is changed by the naming operation:
If an IP address does not appear in the file, no naming operations occur on that facility item.
If an outlet value is blank, its name does not change.
Example:192.168.77.102,,Michael,Test PX2,RACK1,KVMSwitch1,KVMSwitch2,,Sales FTP Server
A facility item at 192.168.77.102 would receive the system name "Test PX2". Its first outlet would be renamed to"KVMSwitch1" and its second outlet renamed to "KVMSwitch2." The third outlet would not be renamed. The fourth outletwould be renamed to "Sales FTP Server."
Note: For proxy indexed facility items, such as those in daisy chains for the BCM2 modules, the pduName will be updatedin place of the sysName.

Exporting Outlet Names to a CSVFile
You can export the outlet names in Power IQ to a CSVfile.
You can edit the file to change outlet names, then import it. See Naming Outlets in Bulk with CSVFiles on page 171.
Note: The following PDUs have manufacturer limitations that affect renaming via SNMP: Outlet and system attribute nam-ing is not available via SNMP for Avocent or Geist PDUs. Outlet naming via SNMP is not available for Tripp Lite PDUs orthe Eaton Pulluzi model PDU. The standard Eaton model does support outlet naming. System attribute naming via SNMPis not available for Baytech PDUs. Names for Servertech PDUs cannot contain spaces. Setting SNMP system attributesis not available for Raritan PXversions lower than 1.3, Baytech, Eaton, Geist, Liebert, or Avocent PDUs. Leave these fieldsblank for those PDUs.
1. In the Facility Items tab, choose Activities > Bulk Configuration Activities.2. Click the Update via CSVImport/Export link.3. Click the Export a CSVfile of the current outlet names link.4. In the Save As... dialog, provide a name for the CSVfile.5. Click the Save button.
174

175
Bulk Change PDU IPAddresses and View Run HistoryReports
You can update the IP addresses of multiple PDUs, including facility items such as Floor PDUs, Floor UPS, Power Panels,and so on, using a CSVimport. This is useful if you need to repartition a network and move PDUs from one subnet toanother.
l Power IQ will report lost connectivity events until the systems are aligned after the bulk IP address change is com-plete.
l Polling will be interrupted by the bulk IP address change.l The CSVfile is validated at import.l IP addresses must be properly formatted.l IPv4 and IPv6 addresses are supported.l Existing IP addresses cannot be reused as new IP addresses.l If the existing IP address in your CSVfile is not found in Power IQ, that change is rejected.l New IP addresses that already exist in Power IQ are rejected.
Note: For CPI facility items, if you wish to use an IPv6 address, ensure that an IPv4 address is not specified for the facilityitem. CPI facility items will not accept an IPv6 address if an IPv4 address is available.
Create and Upload the CSVImport File to Change PDU IPAddresses in Bulk
Create the CSVimport file. See Bulk Change PDU IP Address File Requirements on the next page.
1. In the Facility Items tab, select the Activities menu > Bulk Configuration Activities.2. From the list of Bulk Configuration Activities, select Update IP Addresses.3. Click the Next button.4. In the Facility Item IP Address Change Upload section, click Browse, then select the CSVfile.5. Click the Submit button.

l If the upload is successful, Power IQ displays the Live Status page, which displays the status of each operation.l If any changes fail, an error is displayed in the Import page, and nothing is imported. Correct the errors in the file,
and try the import again.l A history of previous import attempts can be viewed in the Previous Import Attempts section.
Bulk Change PDU IPAddress File Requirements
The CSVimport file for changing PDU IP address should follow this format.
176

177
Column A Column B Column C Column D Column E
Old IPaddress
New IPaddress
Change on
Power IQ
AND Facil-
ities Item
New Subnet
mask
New Gateway
To help you create the CSVfile, you can download the IP_Address_change_upload_template file from the Facility Item IPAddress Change Upload page in Power IQ, then follow the instructions in the file to edit the file to prepare it for import.
1. In the Facility Items tab, choose Activities > Bulk Configuration Activities.2. Select Bulk Update IP in Power IQ.3. Click the Next button.4. In the Facility Item IP Address Change Upload section, click the Download Template link.5. Save or open the file using the dialog that appears.6. Edit the exported file to contain the following:
a. Column A: Old IP addresses (required)b. Column B: New IP addresses (required)c. Column C: Whether the change should take place on Power IQ only or on both Power IQ and the facility
item itself (required). Choose from POWERIQ or BOTH for each PDU.
Note: The BOTH option, which allows you to change IP addresses on both Power IQ and the facility item, issupported for Raritan PX2, PX3, EMXPDUs, CPI facility items running firmware version 4.4 and higher andServer Technology PDUs only. However, you can change IP addresses for non-Raritan and non-Server-Tech PDUs in Power IQ only using this feature.
d. Column D: New subnet mask of the new IP address (required for BOTH; should not be included forPOWERIQ)
e. Column E: New gateway/router for the facility item (required for BOTH; should not be included forPOWERIQ)
7. Save the file.8. Upload the file on the Facility Item IP Address Change Upload page.
Note: For CPI PDUs, the network settings will revert after a few seconds unless the "Manually Configure IPv4" and the"Manually Configure IPv6" settings are enabled via the PDU GUI.
Viewing a Bulk Change PDU IPAddress Import Attempt Run History
You can view the run history of a previous PDU IP address change and its associated report via the Facility Item IP AddressChange Upload page. This is useful when looking for a summary of previous changes or to confirm that a change has beenmade.
To view the run history for a specific plan:
1. In the Facility Items tab, choose Activities > Bulk Configuration Activities.2. Select Update IP Addresses.3. Click the Next button.

4. In the Facility Item IP Address Change Upload section, under Previous Import Attempts, select the previous importattempt whose run history you want to view.
5. Click the Run History link to view the run history page. To delete a previous import attempt, select the previousimport attempt you want to delete, and click the Delete link.
On the Run History page, you can select the report you would like to view by clicking the Report link in the far right columnof the import attempt you would like to view. The contents of the Run History table can be filtered by the following:
l Statel Summaryl Start Datel End Date
Plan Reports
Report
The following screenshot shows an example plan report for updating an IP address.
Each report includes the following sections:
178

179
Actions
The Actions section provides titles and descriptions for the actions performed (e.g., Change the IP Address of PDUs onPower IQ).
Summary
The Summary section provides the dates and times the actions were completed. It also indicates who executed the planand the number of facility items that were included and updated in the plan.
Details
The Details section provides date- and time-stamped messages for each facility item that indicate the state of each facil-ity item as the plan is executed (e.g., Waiting to run, Started tasks).
Reports also can be exported to PDF.

Configuring Proxy Connections to Power IQ
If network restrictions prevent some users from connecting directly to Power IQ, they may need access through a proxyserver that is authorized to make the connection.
Check your firewall and security settings to ensure that communication between the proxy server and Power IQ is allowed.
1. In the Settings tab, click Server Settings in the Application Administration section.2. In the Proxy Configuration section, select the web protocol the proxy server communicates over, HTTP or HTTPS.3. Enter the IP address of the proxy server in the Proxy Host field. Power IQ only accepts proxy communication from
this address.4. Enter the communications port the proxy server uses in the Proxy Port field.5. If the proxy server is required to authenticate with Power IQ, select Yes in the Authentication Required field, and
enter a Username and Password. These fields must use a valid Power IQ username and password combination.6. Click Save Proxy Settings.
180

181
Configuring Facility Item Display Settings - View Facility Itemsby IPor Name
Select whether you want all facility items in the system to be identified by facility item name or IP address in the Settingstab. This setting affects all pages where facility items are listed, and is used in email notifications when identifying facilityitems. This setting applies to all users in the system.
Facility item names are retrieved from the facility item, via SNMP, NOT from the network. Facility item name is not guar-anteed to be unique. If a facility item name is not available, the facility item label is set to "Unnamed" and the IP address isincluded.
The facility item display setting affects the Quick Search feature. If IP address is selected in the display settings, you cansearch facility items by either name or IP address. If facility item name is selected, only searching by facility item name ispermitted. Devices can always be searched by either name or IP address regardless of the facility item display preference.
1. In the Settings tab, click Application Settings in the Appliance Administration section.2. In the Display Settings box, select Show Facility Item IP Address or Show Facility Item Name, then click Save Dis-
play Settings.

Customizing Your View of Facility Items, ITDevices, andEvents
Each user can save their own customized views of Facility Items, IT Devices, and Events lists in Power IQ. Once you save acustomized view, it is retained even if you leave the tab and return, or use a different browser or client.
Note: If you open the Facility Items List by clicking on a health chart, your view will be filtered by the chart. For example,click the red bar of a health chart to view only the items with red health status.
1. In the Facility Items, IT Devices, or Events tab, drag and drop columns to customize your view. Hover the mouse ona column heading then click the arrow to view a drop-down list of other options. You can hide or show eachcolumn, set the ascending or descending order of data, or enter a search term to filter the column to include onlyitems that match the search term.
l See Filter the Events List on page 267.l See Filter the Facility Items List on page 432.
2. Click the Panel Options button in the upper right corner of the list view, then select Save Current Grid Configurationto save your view.
3. In the Facility Items, IT Devices, or Events tab, click the Panel Options button in the upper right corner of the listview, then select Use Default Grid Configuration to revert to the default configuration.
How to Restore and Clone Sever Technology and RaritanDevice Configurations
The following information applies to all Raritan devices and Server Technology version 8.x devices. The devices to be con-figured must be of the same make, model and firmware of the configuration source device.
182

183
l Power IQ automatically collects each device’s “Configuration File” if this feature is enabled . Click “Settings” tab;click “Power IQ Settings” link; click enable in the following panel at the bottom of the page
l It collects it at the admin configurable Power IQ full system back-up time. Click “Settings” tab; click “DataBackups” link; Set the time you want in the following panel at the bottom.
l Three “Configuration Files” are retained for each device. Todays back-up, the first calendar day of the currentmonth and the first calendar day of last month.
l The Raritan “Configuration File” file does NOT contain any “Device Specific Information” like the following list.
l Device name
l SNMP system name, contact and location
l Part of network settings (IP address, gateway, netmask and so on)
l Device logs
l Names, states and values of environmental sensors and actuators
l TLS certificate
l Server monitoring entries
l Asset strip names and rack unit names
l Outlet names and states

l The Server Technology “Configuration File” contains all settings for a complete restore of a device. Power IQremoves the “Device Specific Information” when you select the clone operation.
l The Server Technology “Configuration File” is an editable text file. You can download it from a Server Tech deviceGUI and edit it in note pad to include only the settings you want to change on one or more devices. You can thenupload it to Power IQ via the “Uploaded Config” page. It will be saved as a template you can use in plan to “Clone”or “Restore” only the specific settings to one or more devices.
l Steps:
1. Click the “Facility Items”2. Select “Bulk Configuration Activities” from the “Activities” drop down3. Click “Manage Bulk Configuration Templates” link4. Click “Add” button to create a template5. Filter the table and select the “Device Configuration” file you was to use by clicking the check symbol. Only
one file can be selected at a time.6. Select the “Restore “ radio button to push the “Configuration” to one device or “Clone” operation to push to
one or more devices.7. Click the “Save” button at the bottom of the panel to save your selection.8. Click the “Next” button in the upper right of the page. You will be presented with a table of target devices to
select from.9. Filter the table and select one or more devices as appropriate.
10. Click the “Add PDUs” button to add them to the plan. Devices in the plan are shown in the second table.11. Click the “Run” button in the upper right of the page when you are happy with your plan and what it to run.
You can run and export a report of the operation.
Note: The device from the selected “Configuration” is automatically included to the list so you will need toremove it if you don’t want to restore/clone the configuration to it.
For additional information please see the video at
How To Restore and Close Raritan and Server Tech Device Configurations
184

185
Adjusting Event Severities
The following information is applicable to all Power IQ events.
Users may adjust the severity of any or all Power IQ “Events”. All device traps, Power IQ system events, Power IQthresholds and Power IQ failed polls convert into a Power IQ “Event” with a “Default Severity”. There are over 600 uniquePower IQ “Events”. Now you can adjust their “Current Severity” so you are only alerted for the “Events” that are importantto your organization. The “Event Severity” is a system wide setting. The “Current Event Severity” is what determines thered/yellow/green color of an “Event” in the event list and on the dashboard. Critical is red, warning is yellow and Inform-ational will be green. Severity is also a field filter for email notifications such that you can set a filter to only send emails forcritical “Events”.
Steps:
1. Click the “Events” tab2. Click the “Manage Event Severities” button;3. Enter text in any of the columns to filter on one or more “Events”4. Click the “Down Arrow” button in the “Current Severity” column.5. Select the “Severity Value” of your choice.
For additional information please see the video at
Adjust Event Severities
Report and Monitor 3 Phase Power
The following information is applicable to all 3 phase devices that are metered for AMPs on each inlet. These devices canbe rack PDUs, rack UPSs, meters, busway drops, end of busway meters, RPPs, panels, floor PDUs and UPSs.
The monitoring feature can be enabled or disabled by the admin. It is disabled by default.

Power IQ collects the 3 phase inlet amp readings and rating (if available) during each poll.
It calculates an “Unbalanced Current %” with the following equation: “Unbalanced Current %” = (max difference of anyone phase from the average of all three phases)/(average of all three phases).
It displays the above readings in a sortable, filterable and exportable table along with other related information such as loc-ation, facility item name, inlet name, type, model and health. You can also save your favorite table configuration.
Steps:
1. Click “Sensor” tab; click “Inlets” button2. Filter on one or more columns;3. Click the 3 dot icon to show/hide columns, export report & save grid configuration.
For additional information please see the video at
Report and Monitor 3 Phase Power
Report and Monitor Circuit Breakers
The following information is applicable to all devices for which Power IQ collects circuit breaker information. Thesedevices are typically rack PDUs and busway drops.
The monitoring feature needs to be enabled by the admin.
Steps:
1. Click the “Sensor” tab2. Click the “Default Thresholds” button3. Check the “Enable Circuit Breaker State Thresholding” check box
Power IQ collects each circuit breaker state, load and rating(if available) during each poll.
It displays the above readings in a sortable, filterable and exportable table along with other related information such as loc-ation, facility item name, circuit breaker name, type, model and health. You can also save your favorite table configuration.
186

187
Steps:
1. Click the “Sensor” tab
2. Click the “Circuit Breakers” button3. Filter on one or more columns4. Click the 3 dot icon to show/hide columns, export report & save grid configuration.
For additional information please see the video at
Report and Monitor Circuit Breakers

Chapter 7:Event and Trap Man-agement
Power IQ can receive SNMP traps from supported PDUs and display them as events. You can also set power thresholdsfor racks based on capacity, and Power IQ will generate events when the thresholds are exceeded. See Rack Thresholdson page 260.
You can also enable notifications, so that Power IQ sends an email message for specific events.
188

User Permissions for Event Management
You must have the Event Manager role to view the Events tab. See Assign Roles to a User on page 344.
You must have the Create Event Notifications role to manage event notifications. See Assigning Roles for User Per-missions on page 341.
189

190
Prepare PDUs for Power IQ Event Management
Power IQ receives and displays supported events in the Events tab, and sends notifications if enabled.
You must configure PDUs to send the supported SNMP traps to Power IQ. SNMP v1 and SNMP v2/v3 trap types are sup-ported. See Supported Events on the next page.
PDU trap names differ by vendor, so Power IQ maps the trap names to common event names to highlight the commontraps across PDUs.

Supported Events
Power IQ supports SNMP traps from the following vendors and products and converts the traps into Power IQ events. Seethe vendor/product below for supported events.
l APC Netbotz Supported Events on page 199l APC Rack PDU Supported Events on page 193l APC Transfer Switch Supported Events on page 198l APC UPS Supported Events on page 195l Aphel Supported Events on page 201l Avocent Supported Events on page 202l Baytech Supported Events on page 204l CPI Supported Events on page 206l Cyberswitching Supported Events on page 207l Eaton eAm004 Supported Eventsl Geist Supported Events on page 210l Geist EM Supported Events on page 211l Geist RCXSupported Events on page 213l Geist V3 Supported Events on page 214l Hewlett Packard Supported Events on page 216l Hewlett Packard PDU2 Supported Events on page 217l Knurr Supported Events on page 218l Liebert Supported Events on page 221l MRVSupported Events on page 222l Netbotz Supported Events on page 223l Raritan PX/PX2/PX3 Supported Events on page 232l Raritan EMXSupported Events on page 224l Raritan PX3TS Transfer Switch Supported Events on page 243l Raritan Power Meter Supported Events on page 227l Rittal Supported Events on page 246l Schleifenbauer Supported Events on page 248l Servertech Supported Events on page 250l Servertech PRO2 (Sentry4) Supported Events on page 251l Sinetica Supported Events on page 254l Starline Supported Events on page 257l Tripplite Supported Events on page 257
191

192
APC Supported Events
The APC standard plugin can be used to manage APC rack PDUs, UPSs, transfer switches, and APC Netbotz devices. Formore information on the supported events for each device type, see the following topics:
l APC Rack PDU Supported Events on the next pagel APC UPS Supported Events on page 195l APC Transfer Switch Supported Events on page 198l APC Netbotz Supported Events on page 199

APC Rack PDU Supported Events
APC Rack PDU Supported Events
Event description Trap name Common event name
Underload Threshold rPDULowLoad inletCurrentLowerWarning
Underload ConditionCleared
rPDULowLoadCleared inletCurrentLowerWarningClear
Low Overload Threshold rPDUNearOverload inletCurrentUpperWarning
Low Overload Thresholdcleared
rPDUNearOverloadCleared inletCurrentUpperWarningClear
Overload Threshold rPDUOverload inletCurrentUpperCritical
Overload Thresholdcleared
rPDUOverloadCleared inletCurrentUpperCriticalClear
Outlet Turned on rPDUOutletOn outletPowerOn
Outlet Turned off rPDUOutletOff outletPowerOff
High temperaturethreshold violated on theprobe
envHighTempThresholdViolation envTemperatureUpperCritical
High temperaturethreshold violation clearedon the probe
envHighTempThresholdViolationCleared envTemperatureUpperCriticalClear
Low temperaturethreshold violated on theprobe
envLowTempThresholdViolation envTemperatureLowerCritical
Low temperaturethreshold violation clearedon the probe
envLowTempThresholdViolationCleared envTemperatureLowerCriticalClear
High humidity thresholdviolated on the probe
envHighHumidityThresholdViolation envHumidityUpperCritical
193

194
APC Rack PDU Supported Events
Event description Trap name Common event name
High humidity thresholdviolation cleared on theprobe
envHigHumidityThresholdViolationCleared envHumidityUpperCriticalClear
Low humidity thresholdviolated on the probe
envLowHumidityThresholdViolation envHumidityLowerCritical
Low humidity thresholdviolation cleared on theprobe
envLowHumidityThresholdViolationCleared envHumidityLowerCriticalClear
Trap used to test SNMP
trap functionalityapcTestTrap testTrap

APC UPS Supported Events
APC UPS Supported Events
Event description Trap name Common event name
UPS load is greater than
100% of its rated capa-
city
upsOverload upsOverload
UPS load is greater than
100% of its rated capa-
city cleared
upsOverloadClear upsOverloadClear
UPS failed diagnostics
self-testupsDiagnosticsFailed upsDiagnosticsFailed
UPS failed diagnostics
self-test clearedupsDiagnosticsPassed upsDiagnosticsFailedClear
UPS batteries are dis-
chargedupsDischarged upsDepletedBattery
UPS batteries are dis-
charged cleareddischargeCleared upsDepletedBatteryClear
UPS has switched to bat-
tery backup powerupsOnBattery upsOnBattery
UPS has switched to bat-
tery backup power
cleared
powerRestored upsOnBatteryClear
UPS batteries are low
and will soon be
exhausted
lowBattery upsLowBattery
UPS batteries are low
and will soon bereturnFromLowBatteryInfo upsLowBatteryClear
195

196
APC UPS Supported Events
Event description Trap name Common event name
exhausted cleared
UPS batteries need
replacementupsBatteryNeedsReplacement upsBatteryNeedsReplacement
UPS batteries need
replacement clearedupsBatteryReplaced upsBatteryNeedsReplacementClear
UPS on bypass due to
internal faulthardwareFailureBypass upsBypassFailure
UPS on bypass due to
internal fault clearedreturnFromBypass upsBypassFailureClear
UPS battery temperature
threshold has been
reached
batteryOverTemperature upsBatteryOverTemperature
UPS battery temperature
threshold has been
reached cleared
batteryOverTemperatureCleared upsBatteryOverTemperatureClear
UPS internal over tem-
perature condition existsupsInternalOverTemperature upsInternalOverTemperature
UPS internal over tem-
perature condition exists
cleared
upsInternalOverTemperatureCleared upsInternalOverTemperatureClear
UPS inverter over tem-
perature condition existsupsInverterOverTemperature upsInverterOverTemperature
UPS inverter over tem-
perature condition exists
cleared
upsInverterOverTemperature upsInverterOverTemperatureClear
UPS battery over voltage upsBatteryOverVoltage upsBatteryOverVoltage

APC UPS Supported Events
Event description Trap name Common event name
condition exists
UPS battery over voltage
condition exists clearedupsBatteryOverVoltageCleared upsBatteryOverVoltageClear
High temperaturethreshold violated on theprobe
envHighTempThresholdViolation envTemperatureUpperCritical
High temperaturethreshold violationcleared on the probe
envHighTempThresholdViolationCleared envTemperatureUpperCriticalClear
Low temperaturethreshold violated on theprobe
envLowTempThresholdViolation envTemperatureLowerCritical
Low temperaturethreshold violationcleared on the probe
envLowTempThresholdViolationCleared envTemperatureLowerCriticalClear
High humidity thresholdviolated on the probe
envHighHumidityThresholdViolation envHumidityUpperCritical
High humidity thresholdviolation cleared on theprobe
envHigHumidityThresholdViolationCleared envHumidityUpperCriticalClear
Low humidity thresholdviolated on the probe
envLowHumidityThresholdViolation envHumidityLowerCritical
Low humidity thresholdviolation cleared on theprobe
envLowHumidityThresholdViolationCleared envHumidityLowerCriticalClear
Trap used to test SNMP
trap functionalityapcTestTrap testTrap
197

198
APC Transfer Switch Supported Events
APC Transfer Switch Supported Events
Event description Trap name Common event name
Transfer Switch Active InletChanged
atsSourceSwitchedtransferSwitchActiveInletChangedCritical
transferSwitchActiveInletChangedWarning
Transfer Switch Operating StateChange
atsLostRedundancy
atsLostRedundancy
atsRedundancyRestored
transferSwitchOperatingStateNonRedundant
transferSwitchOperatingStateStandby
transferSwitchOperatingStateNormal

APC Netbotz Supported Events
Note: Netbotz devices may be managed by either the APC standard plugin or the Netbotz standard plugin. The MIB usedby the target device will determine which standard plugin is used. For supported events for the Netbotz plugin, see Netbotz Supported Events on page 223.
APC Netbotz Supported Events
Event descrip-tion Trap name Common event name
Temp Env Sensor
High Threshold
apcEnvHighTempThresholdViolation
apcEnvHighTempThresholdViolationCleared
apcEnvMaxTempThresholdViolation
apcEnvMaxTempThresholdViolationCleared
envOverTemperatureWarning
envOverTemperatureWarningClear
envOverTemperatureCritical
envOverTemperatureCriticalClear
Temp Env Sensor
Low Threshold
apcEnvLowTempThresholdViolation
apcEnvLowTempThresholdViolationCleared
apcEnvMinTempThresholdViolation
apcEnvMinTempThresholdViolationCleared
envUnderTemperatureWarning
envUnderTemperatureWarningClear
envUnderTemperatureCritical
envUnderTemperatureCriticalClear
Humidity Env
Sensor High
Threshold
apcEnvHighHumidityThresholdViolation
apcEnvHighHumidityThresholdViolationCleared
apcEnvMaxHumidityThresholdViolation
apcEnvMaxHumidityThresholdViolationCleared
envOverHumidityWarning
envOverHumidityWarningClear
envOverHumidityCritical
envOverHumidityCriticalClear
Humidity Env
Sensor Low
Threshold
apcEnvLowHumidityThresholdViolation
apcEnvLowHumidityThresholdViolationCleared
apcEnvMinHumidityThresholdViolation
apcEnvMinHumidityThresholdViolationCleared
envUnderHumidityWarning
envUnderHumidityWarningClear
envUnderHumidityCritical
envUnderHumidityCriticalClear
Contact Closure
apcWarningDiscreteInputContactStateAbnormal
apcWarningDiscreteInputContactStateNormal
apcCriticalDiscreteInputContactStateAbnormal
apcCriticalDiscreteInputContactStateNormal
envContactSensorWarning
envContactSensorWarningClear
envContactSensorCritical
envContactSensorCriticalClear
Powered Dry apcOutputRelayStateAbnormal envPoweredDryContactCritical
199

200
APC Netbotz Supported Events
Event descrip-tion Trap name Common event name
Contact apcOutputRelayStateNormal envPoweredDryContactCriticalClear
Trap used to test
SNMP trap func-
tionality
apcTestTrap testTrap

Aphel Supported Events
Aphel Supported Events
Event description Trap name Common event name
Inlet Current Upper Critical ThresholdampsCT1TRAP
ampsCT8TRAPinletCurrentUpperCritical
201

202
Avocent Supported Events
Note: The table below lists all Avocent supported events. Not all events are supported for all PDU models.
Avocent Supported Events
Event description Trap name Common event name
Outlet Turned onavctPmOutletStatusOnTrap
avctPmOutletCmdOnTrapoutletPowerOn
Outlet Turned offavctPmOutletStatusOffTrap
avctPmOutletCmdOffTrapoutletPowerOff
Inlet/Inlet Pole/Circuit Breaker/Outlet Cur-rent Upper Critical Threshold
avctPmPduMaxLoadHighTrap
inletOverCurrentCritical
inletOverCurrentCritical
cbOverCurrentCritical
outletOverCurrentCritical
Inlet/Inlet Pole/Circuit Breaker/Outlet Cur-rent Low Critical Threshold
avctPmPduMinLoadLowTrap
inletUnderCurrentCritical
inletUnderCurrentCritical
cbUnderCurrentCritical
outletUnderCurrentCritical
Inlet/Inlet Pole/Circuit Breaker/Outlet Cur-rent Upper Warning Threshold
avctPmPduWarnLoadTrap
inletOverCurrentWarning
inletOverCurrentWarning
cbOverCurrentWarning
outletOverCurrentWarning
Inlet/Inlet Pole/Circuit Breaker/Outlet Cur-
rent Low Warning ThresholdavctPmPduLowLoadLowTrap
inletUnderCurrentWarning
inletUnderCurrentWarning
cbUnderCurrentWarning
outletUnderCurrentWarning
Current Threshold Cleared avctPmPduMaxLoadBackTrap
inletOverCurrentCriticalClear
inletOverCurrentCriticalClear
cbOverCurrentCriticalClear

Avocent Supported Events
Event description Trap name Common event name
outletOverCurrentCriticalClear
Note: The Current Threshold Cleared event clears any active current threshold event, regardless of event severity. ThepmTrapObjectPduElementName varbind value will indicate which PDU element ordinal is specifically targeted. The inletpole inletOverCurrentCriticalClear event has an event parameter that identifies the specific inlet pole involved.
203

204
Baytech Supported Events
Baytech Supported Events
Event description Trap name Common event name
Outlet Turned on outletOn outletPowerOn
Outlet Turned off outletOff outletPowerOff
Inlet Current Upper CriticalThreshold
currentThresholdViolation inletCurrentUpperCritical
Inlet Current Upper CriticalThreshold Cleared
currentThresholdViolationCleared inletCurrentUpperCriticalClear
Inlet Current Low CriticalThreshold
currentUnderThresholdViolation inletCurrentLowerCritical
Inlet Current Low CriticalThreshold Cleared
currentUnderThresholdViolationCleared inletCurrentLowerCriticalClear
Inlet Voltage Upper CriticalThreshold
voltageOverThresholdViolation inletVoltageUpperCritical
Inlet Voltage Upper CriticalThreshold Cleared
voltageOverThresholdViolationCleared inletVoltageUpperCriticalClear
Inlet Voltage Lower CriticalThreshold
voltageUnderThresholdViolation inletVoltageLowerCritical
Inlet Voltage Lower CriticalThreshold Cleared
voltageUnderThresholdViolationCleared inletVoltageLowerCriticalClear
Circuit Breaker Tripped circuitBreakerAlarm cbTripped
Circuit Breaker Recovered circuitBreakerAlarmClearTrap cbRecovered
Temp Env Sensor HighThreshold
sensorTempThreshHiAlarmTrap envTemperatureUpperCritical
Temp Env Sensor HighThreshold Cleared
sensorTempThreshHiAlarmClearedTrap envTemperatureUpperCriticalClear

Baytech Supported Events
Event description Trap name Common event name
Temp Env Sensor LowThreshold
sensorTempThreshLoAlarmTrap envTemperatureLowerCritical
Temp Env Sensor LowThreshold Cleared
sensorTempThreshLoAlarmClearedTrap envTemperatureLowerCriticalClear
205

206
CPI Supported Events
Note: Events marked with an asterisk (*) are only generated when doors have been created and configured with the appro-priate sensors correctly. For more information, see Door Access Management on page 543.
CPI Supported Events
Event description Trap name Common event name
Branch Maximum Current maxCurrent cbOverCurrentCritical
Branch Minimum Current minCurrent cbUnderCurrentCritical
Inlet Maximum Voltage maxVolt inletOverVoltageCritical
Inlet Minimum Voltage minVolt inletUnderVoltageCritical
Maximum Temperature Sensor maxTemperature envOverTemperatureCritical
Minimum Temperature Sensor minTemperature envUnderTemperatureCritical
Maximum Humidity Sensor maxHumidity envOverHumidityCritical
Minimum Humidity Sensor minHumidity envUnderHumidityCritical
Outlet Threshold Triggered outletMaxCurrent outletOverCurrentCritical
Door Locked/Unlocked State Change*easLockOpenAlert
easLockCloseAlert
envPoweredDryContactCritical
electronicallyUnlocked*
envPoweredDryContactCriticalClear
electronicallyLocked*
Door Opened/Closed State Change*easDoorOpenAlert
easDoorCloseAlert
envContactSensorCritical
doorOpen*
envContactSensorCriticalClear
doorClosed*

Cyberswitching Supported Events
Cyberswitching Supported Events
Event description Trap name Common event name
Inlet Current Upper Critical Threshold tricomG2UnitCurrentCritical inletCurrentUpperCritical
Inlet Current Upper Warning Threshold tricomG2UnitCurrentWarning inletCurrentUpperWarning
Outlet Current Upper Warning Threshold tricomG2OutletHighCurrentWarning outletCurrentUpperWarning
Outlet Current Lower Warning Threshold tricomG2OutletLowCurrentWarning outletCurrentLowerWarning
Circuit Breaker Tripped tricomG2OutletTripped cbTripped
Eaton eAM004 Supported Events
Eaton eAm004 Supported Events
Enterprise OID - 1.3.6.1.4.1.534.6.6.7
Event description Trap name Common event name
Temperature Sensor Threshold notifyTemperatureThStatus
envOverTemperatureCriticalClear,
envOverTemperatureCritical,
envOverTemperatureWarningClear,
envOverTemperatureWarning,
envUnderTemperatureCriticalClear,
envUnderTemperatureCritical,
envUnderTemperatureWarningClear,
envUnderTemperatureWarning
Humidity Sensor Threshold notifyHumidityThStatus envOverHumidityCriticalClear,
207

208
Eaton eAm004 Supported Events
Enterprise OID - 1.3.6.1.4.1.534.6.6.7
Event description Trap name Common event name
envOverHumidityCritical,
envOverHumidityWarningClear,
envOverHumidityWarning,
envUnderHumidityCriticalClear,
envUnderHumidityCritical,
envUnderHumidityWarningClear,
envUnderHumidityWarning
Outlet Current Threshold notifyOutletCurrentThStatus
outletOverCurrentCriticalClear,
outletOverCurrentCritical,
outletOverCurrentWarningClear
outletOverCurrentWarning,
outletUnderCurrentCriticalClear,
outletUnderCurrentCritical,
outletUnderCurrentWarningClear,
outletUnderCurrentWarning
Outlet Voltage Threshold notifyOutletVoltageThStatus
outletOverVoltageCriticalClear,
outletOverVoltageCritical,
outletOverVoltageWarningClear,
outletOverVoltageWarning,
outletUnderVoltageCriticalClear,
outletUnderVoltageCritical
outletUnderVoltageWarningClear,
outletUnderVoltageWarning
Inlet Current Threshold notifyInputCurrentThStatus
inletOverCurrentCriticalClear,
inletOverCurrentCritical,
inletOverCurrentWarningClear,
inletOverCurrentWarning,

Eaton eAm004 Supported Events
Enterprise OID - 1.3.6.1.4.1.534.6.6.7
Event description Trap name Common event name
inletUnderCurrentCriticalClear,
inletUnderCurrentCritical,
inletUnderCurrentWarningClear,
inletUnderCurrentWarning
Inlet Voltage Threshold notifyInputCurrentThStatus
inletOverVoltageCriticalClear,
inletOverVoltageCritical,
inletOverVoltageWarningClear,
inletOverVoltageWarning,
inletUnderVoltageCriticalClear,
inletUnderVoltageCritical,
inletUnderVoltageWarningClear,
inletUnderVoltageWarning
209

210
Geist Supported Events
Geist Supported Events
Event description Trap name Common event name
Inlet Current Upper Critical Threshold
totalDeciAmpsPhaseATRAP
totalDeciAmpsPhaseBTRAP
totalDeciAmpsPhaseCTRAP
inletCurrentUpperCritical
Inlet Current Upper Critical ThresholdCleared
inletCurrentUpperCriticalClear
Circuit Breaker Current Upper CriticalThreshold
outlet1ADeciAmpsTRAP
outlet12CDeciAmpsTRAPCBCurrentUpperCritical
Circuit Breaker Current Upper CriticalThreshold Cleared
CBCurrentUpperCriticalClear
Outlet Current Upper Critical Thresholdoutlet1ADeciAmpsTRAP
outlet12CDeciAmpsTRAPOutletCurrentUpperCritical
Outlet Current Upper Critical ThresholdCleared
OutletCurrentUpperCriticalClear

Geist EM Supported Events
Geist EM Supported Events
Event description Trap name Common event name
Circuit Breaker Current ThresholdWarning Event
mainChannelDeciAmps01WARN
mainChannelDeciAmps07WARN
Circuit Breaker Current ThresholdCritical Event
mainChannelDeciAmps01ALARM
mainChannelDeciAmps07ALARM
Outlet Current Threshold WarningEvent
auxChannelDeciAmps01WARN
auxChannelDeciAmps32WARN
outlet1AB-1DeciAmpsWarningTRAP
outlet24CA-8DeciAmpsWarningTRAP
OutletCurrentUpperCritical
Outlet Current Threshold WarningEvent Cleared
Outlet Current Threshold CriticalEvent
auxChannelDeciAmps01ALARM
auxChannelDeciAmps32ALARM
outlet1AB-1DeciAmpsTRAP
outlet24CA-8DeciAmpsTRAP
OutletCurrentUpperCritical
Outlet Current Threshold CriticalEvent Cleared
OutletCurrentUpperCriticalClear
Phase Current Threshold WarningEvent
totalDeciAmpsPhaseAWarningTRAP
totalDeciAmpsPhaseCWarningTRAPinletCurrentUpperWarning
Phase Current Threshold WarningEvent Cleared
inletCurrentUpperWarningClear
Phase Current Threshold CriticalEvent
totalDeciAmpsPhaseATRAP
totalDeciAmpsPhaseCTRAPinletCurrentUpperCritical
Phase Current Threshold CriticalEvent Cleared
inletCurrentUpperCriticalClear
211

Geist RCXSupported Events
Geist RCX Supported Events
Event description Trap name Common eventname
Ctrl3ChDELTADeciAmpsA = Three Phase InletPhase A Current
gstCtrl3ChDELTADeciAmpsANOTIFY(10606)
Ctrl3ChDELTADeciAmpsB = Three Phase InletPhase B Current
gstCtrl3ChDELTADeciAmpsBNOTIFY(10607)
Ctrl3ChDELTADeciAmpsC = Three Phase InletPhase C Current
gstCtrl3ChDELTADeciAmpsCNOTIFY(10608)
Pow3ChDeciAmpsA = Three Phase Inlet Phase ACurrent
gstPow3ChDeciAmpsANOTIFY(11110)
Pow3ChDeciAmpsB = Three Phase Inlet Phase BCurrent
gstPow3ChDeciAmpsBNOTIFY(11119)
Pow3ChDeciAmpsC = Three Phase Inlet PhaseC Current
gstPow3ChDeciAmpsCNOTIFY(11128)
Ctrl3ChIECDeciAmpsA =Three Phase Inlet PhaseA Current
gstCtrl3ChIECDeciAmpsANOTIFY(12508)
Ctrl3ChIECDeciAmpsB =Three Phase Inlet PhaseB Current
gstCtrl3ChIECDeciAmpsBNOTIFY(12516)
Ctrl3ChIECDeciAmpsC =Three Phase InletPhase C Current
gstCtrl3ChIECDeciAmpsCNOTIFY(12524)
213

214
Geist V3 Supported Events
Geist V3 Supported Events
Event description Trap name Common event name
Temperature Threshold High Violation
gstTempSensorTempCNOTIFY
gstTempSensorTempFNOTIFY
gstClimateTempCNOTIFY
gstClimateTempFNOTIFY
(alarmTripType = 2)
Temperature Threshold Low Violation
gstTempSensorTempCNOTIFY
gstTempSensorTempFNOTIFY
gstClimateTempCNOTIFY
gstClimateTempFNOTIFY
(alarmTripType = 1)
Temperature Threshold Clear
gstTempSensorTempCNOTIFY
gstTempSensorTempFNOTIFY
gstClimateTempCNOTIFY
gstClimateTempFNOTIFY
(alarmTripType = 0)
Humidity Threshold High ViolationgstClimateHumidityNOTIFY
(alarmTripType = 2)
Humidity Threshold Low ViolationgstClimateHumidityNOTIFY
(alarmTripType = )1
Humidity Threshold CleargstClimateHumidityNOTIFY
(alarmTripType = 0)
Outlet Current Threshold High ViolationgstCtrlOutletDeciAmpsNOTIFY
(alarmTripType = 2)

Geist V3 Supported Events
Event description Trap name Common event name
Outlet Current Threshold Low Violation -gstCtrlOutletDeciAmpsNOTIFY
(alarmTripType = 1)
Outlet Current Threshold Violation CleargstCtrlOutletDeciAmpsNOTIFY
(alarmTripType = 0)
215

216
Hewlett Packard Supported Events
Note: This plugin supports most HP rack PDUs. For supported events for rack PDUs with HP power strips that use thePDU2 section of the HP-Compaq Power MIB, such as the HP D9N15A (8.6kVA 208V3Ph 21out NA/JP mPDU) model, see Hewlett Packard PDU2 Supported Events on the next page.
Hewlett Packard Supported Events
Event description Trap name Common event name
Voltage High Critical trapCritical inletOverVoltageCritical
Voltage High Critical Clear trapCleared inletOverVoltageCriticalClear
Voltage Low Critical trapCritical inletUnderVoltageCritical
Voltage Low Critical Clear trapCleared inletUnderVoltageCriticalClear
Current Critical trapCritical inletOverCurrentCritical
Current Critical Clear trapCleared inletOverCurrentCriticalClear
Voltage High Warning trapWarning inletOverVoltageWarning
Voltage High Warning Clear trapCleared inletOverVoltageWarningClear
Voltage Low Warning trapWarning inletUnderVoltageWarning
Voltage Low Warning Clear trapCleared inletUnderVoltageWarningClear
Current Warning trapWarning inletOverCurrentWarning
Current Warning Clear trapCleared inletOverCurrentWarningClear

Hewlett Packard PDU2 Supported Events
Note: This plugin supports rack PDUs with HP power strips that use the PDU2 section of the HP-Compaq Power MIB,such as the HP D9N15A (8.6kVA 208V3Ph 21out NA/JP mPDU) model. For supported events for other HP hardware, see Hewlett Packard Supported Events on the previous page.
Hewlett Packard PDU2 Supported Events
Event description Trap name Common event name
Voltage High Critical trapCritical inletOverVoltageCritical
Voltage High Critical Clear trapCleared inletOverVoltageCriticalClear
Voltage Low Critical trapCritical inletUnderVoltageCritical
Voltage Low Critical Clear trapCleared inletUnderVoltageCriticalClear
Current High Critical trapCritical inletOverCurrentCritical
Current High Critical Clear trapCleared inletOverCurrentCriticalClear
Voltage High Warning trapWarning inletOverVoltageWarning
Voltage High Warning Clear trapCleared inletOverVoltageWarningClear
Voltage Low Warning trapWarning inletUnderVoltageWarning
Voltage Low Warning Clear trapCleared inletUnderVoltageWarningClear
Current High Warning trapWarning inletOverCurrentWarning
Current High Warning Clear trapCleared inletOverCurrentWarningClear
Current Low Critical trapCritical inletUnderCurrentCritical
Current Low Critical Clear trapCleared inletUnderCurrentCriticalClear
Current Low Warning trapWarning inletUnderCurrentWarning
Current Low Warning Clear trapCleared inletUnderCurrentWarningClear
217

218
Knurr Supported Events
Knurr Supported Events
Event description Trap name Common event name
Inlet Pole Current Upper Warning Threshold
pdu-M1TrapPreWarnPh1
pdu-M1TrapPreWarnPh2
pdu-M1TrapPreWarnPh3
pdu-M2TrapPreWarnPh1
pdu-M2TrapPreWarnPh2
pdu-M2TrapPreWarnPh3
pdu-M3TrapPreWarnPh1
pdu-M3TrapPreWarnPh2
pdu-M3TrapPreWarnPh3
pdu-M4TrapPreWarnPh1
pdu-M4TrapPreWarnPh2
pdu-M4TrapPreWarnPh3
inletOverCurrentWarning
Inlet Pole Current Upper Critical Threshold
pdu-M1TrapAlarmPh1
pdu-M1TrapAlarmPh2
pdu-M1TrapAlarmPh3
pdu-M2TrapAlarmPh1
pdu-M2TrapAlarmPh2
pdu-M2TrapAlarmPh3
pdu-M3TrapAlarmPh1
pdu-M3TrapAlarmPh2
pdu-M3TrapAlarmPh3
pdu-M4TrapAlarmPh1
pdu-M4TrapAlarmPh2
pdu-M4TrapAlarmPh3
inletOverCurrentCritical
Inlet Pole Current Lower Warning Thresholdpdu-M1TrapInfoPh1
pdu-M1TrapInfoPh2inletUnderCurrentWarning

Knurr Supported Events
Event description Trap name Common event name
pdu-M1TrapInfoPh3
pdu-M2TrapInfoPh1
pdu-M2TrapInfoPh2
pdu-M2TrapInfoPh3
pdu-M3TrapInfoPh1
pdu-M3TrapInfoPh2
pdu-M3TrapInfoPh3
pdu-M4TrapInfoPh1
pdu-M4TrapInfoPh2
pdu-M4TrapInfoPh3
Inlet Pole Current Threshold Clear - All
pdu-M1TrapRetToNormPh1
pdu-M1TrapRetToNormPh2
pdu-M1TrapRetToNormPh3
pdu-M2TrapRetToNormPh1
pdu-M2TrapRetToNormPh2
pdu-M2TrapRetToNormPh3
pdu-M3TrapRetToNormPh1
pdu-M3TrapRetToNormPh2
pdu-M3TrapRetToNormPh3
pdu-M4TrapRetToNormPh1
pdu-M4TrapRetToNormPh2
pdu-
inletOverCurrentWarningClear
inletOverCurrentCriticalClear
inletUnderCurrentWarningClear
219

220
Knurr Supported Events
Event description Trap name Common event name
M4TrapRetToNormPh3
Inlet Unbalanced Current Upper WarningThreshold
pdu-M1TrapOutOfBal
pdu-M2TrapOutOfBal
pdu-M3TrapOutOfBal
pdu-M4TrapOutOfBal
inletOverUnbalancedCurrentWarning

Liebert Supported Events
Liebert Supported Events
Event description Trap name Common event name
Outlet turned on lgpEventRcpPowerStateChangeOn outletPowerOn
Outlet turned off lgpEventRcpPowerStateChangeOff outletPowerOff
"Active:Alarm:Branch Breaker Open[Label]Branch A"
"Cleared:Alarm:Branch Breaker Open[Label]Branch A"
lgpSysNotificationcbTripped
cbTrippedClear
"Active:Warning:PDU Over Current L3[Label]MPH2 [Pole]L3 [Value]1.18A[Threshold]3%"
"Cleared:Warning:PDU Over CurrentL3[Label]MPH2"
lgpSysNotificationinletOverCurrentWarning
inletOverCurrentWarningClear
221

222
MRVSupported Events
MRV Supported Events
Event description Trap name Common event name
Temp Env Sensor High Threshold irTempHighTholdAlarmRaised envTemperatureUpperCritical
Temp Env Sensor High ThresholdCleared
irTempHighTholdAlarmCleared envTemperatureUpperCriticalClear
Temp Env Sensor Low Threshold irTempLowTholdAlarmRaised envTemperatureLowerCritical
Temp Env Sensor Low ThresholdCleared
irTempLowTholdAlarmCleared envTemperatureLowerCriticalClear
Humidity Env Sensor HighThreshold
irHumidityHighTholdAlarmRaised envHumidityUpperCritical
Humidity Env Sensor HighThreshold Cleared
irHumidityHighTholdAlarmCleared envHumidityUpperCriticalClear
Humidity Env Sensor LowThreshold
irHumidityLowTholdAlarmRaised envHumidityLowerCritical
Humidity Env Sensor LowThreshold Cleared
irHumidityLowTholdAlarmCleared envHumidityUpperCriticalClear

NetbotzSupported Events
Note: Netbotz devices may be managed by either the APC standard plugin or the Netbotz standard plugin. The MIB usedby the target device will determine which standard plugin is used. For Netbotz supported events for the APC plugin, seeAPC Netbotz Supported Events on page 199.
Netbotz Supported Events
Event description Trap name Common event name
Temp Env Sensor High Threshold netBotzTempTooHigh envTemperatureUpperCritical
Temp Env Sensor High ThresholdCleared
netBotzTempTooHighRTN envTemperatureUpperCriticalClear
Temp Env Sensor Low Threshold netBotzTempTooLow envTemperatureLowerCritical
Temp Env Sensor Low ThresholdCleared
netBotzTempTooLowRTN envTemperatureLowerCriticalClear
Humidity Env Sensor High Threshold netBotzHumidityTooHigh envHumidityUpperCritical
Humidity Env Sensor High ThresholdCleared
netBotzHumidityTooHighRTN envHumidityUpperCriticalClear
Humidity Env Sensor Low Threshold netBotzHumidityTooLow envHumidityLowerCritical
Humidity Env Sensor Low ThresholdCleared
netBotzHumidityTooLowRTN envHumidityLowerCriticalClear
223

224
Raritan EMXSupported Events
Note: Events marked with an asterisk (*) are only generated when doors have been created and configured correctly. Formore information, see Door Access Management on page 543.
Raritan EMX Supported Events
Event description Trap name Common event name
Server Reachability from PDUserverReachable
serverNotReachable
serverNotReachableClear
serverNotReachable
External Sensor Slot State ChangeExternal sensor '[EXTSENSORNAME]' in slot '[EXTSENSORSLOT]' is closed.
SensorContactOpen
SensorContactClosed
Contact Closure externalSensorStateChangeenvContactSensorCritical
envContactSensorCriticalClear
Powered Dry Contact externalSensorStateChangeenvPoweredDryContactCritical
envPoweredDryContactCriticalClear
Door Open Sensor State Change* externalSensorStateChangedoorOpen
doorOpenClear
Handle Open Sensor State
Change*externalSensorStateChange
handleOpen
handleOpenClear
Electronic Lock Sensor State
Change*externalSensorStateChange
electronicallyUnlocked
electronicallyUnlockedClear
Water externalSensorStateChange
envWaterSensorCritical
envWaterSensorCriticalClea
envWaterSensorUnavailable
envWaterSensorUnavailableClear
Smoke externalSensorStateChange
envSmokeSensorCritical
envSmokeSensorCriticalClea
envSmokeSensorUnavailable

Raritan EMX Supported Events
Event description Trap name Common event name
envSmokeSensorUnavailableClear
Vibration externalSensorStateChange
envVibrationSensorCritical
envVibrationSensorCriticalClear
envVibrationSensorUnavailable
envVibrationSensorUnavailableClear
Temperature externalSensorStateChange
envOverTemperatureCritical
envOverTemperatureCriticalClear
envOverTemperatureWarning
envOverTemperatureWarningClear
envUnderTemperatureCritical
envUnderTemperatureCriticalClear
envUnderTemperatureWarning
envUnderTemperatureWarningClear
envTemperatureSensorUnavailable
envTemperatureSensorUnavailableClear
Humidity externalSensorStateChange
envOverHumidityCritical
envOverHumidityCriticalClear
envOverHumidityWarning
envOverHumidityWarningClear
envUnderHumidityCritical
envUnderHumidityCriticalClear
envUnderHumidityWarning
envUnderHumidityWarningClear
envHumiditySensorUnavailable
envHumiditySensorUnavailableClear
Air Flow externalSensorStateChange
envOverAirFlowCritical
envOverAirFlowCriticalClear
envOverAirFlowWarning
225

226
Raritan EMX Supported Events
Event description Trap name Common event name
envOverAirFlowWarningClear
envUnderAirFlowCritical
envUnderAirFlowCriticalClear
envUnderAirFlowWarning
envUnderAirFlowWarningClear
envAirFlowSensorUnavailable
envAirFlowSensorUnavailableClear
Air Pressure externalSensorStateChange
envOverAirPressureCritical
envOverAirPressureCriticalClear
envOverAirPressureWarning
envOverAirPressureWarningClear
envUnderAirPressureCritical
envUnderAirPressureCriticalClear
envUnderAirPressureWarning
envUnderAirPressureWarningClear
envAirPressureSensorUnavailable
envAirPressureSensorUnavailableClear

Raritan Power Meter Supported Events
Raritan Power Meter Supported Events
Event description Trap name Common event name
Circuit VoltagecircuitSensorStateChange
circuitPoleSensorStateChange
circuitOverVoltageCriticalClear
circuitOverVoltageCritical
circuitOverVoltageWarningClear
circuitOverVoltageWarning
circuitUnderVoltageCriticalClear
circuitUnderVoltageCritical
circuitUnderVoltageWarningClear
circuitUnderVoltageWarning
circuitVoltageSensorUnavailable
circuitVoltageSensorUnavailableClear
Circuit Current circuitSensorStateChange
circuitPoleSensorStateChange
circuitOverCurrentCriticalClear
circuitOverCurrentCritical
circuitOverCurrentWarningClear
circuitOverCurrentWarning
circuitUnderCurrentCriticalClear
circuitUnderCurrentCritical
circuitUnderCurrentWarningClear
circuitUnderCurrentWarning
circuitCurrentSensorUnavailable
circuitCurrentSensorUnavailableClear
Circuit Active PowercircuitSensorStateChange
circuitPoleSensorStateChange
circuitOverActivePowerCriticalClear
circuitOverActivePowerCritical
circuitOverActivePowerWarningClear
circuitOverActivePowerWarning
circuitUnderActivePowerCriticalClear
circuitUnderActivePowerCritical
227

228
Raritan Power Meter Supported Events
Event description Trap name Common event name
circuitUnderActivePowerWarningClear
circuitUnderActivePowerWarning
circuitActivePowerSensorUnavailable
circuitActivePowerSensorUnavailableClear
Circuit Apparent Power circuitSensorStateChange
circuitPoleSensorStateChange
circuitOverApparentPowerCriticalClear
circuitOverApparentPowerCritical
circuitOverApparentPowerWarningClear
circuitOverApparentPowerWarning
circuitUnderApparentPowerCriticalClear
circuitUnderApparentPowerCritical
circuitUnderApparentPowerWarningClear
circuitUnderApparentPowerWarning
circuitApparentPowerSensorUnavailable
circuitApparentPowerSensorUnavailableClear
Circuit Power Factor circuitSensorStateChange
circuitPoleSensorStateChange
circuitOverPowerFactorCriticalClear
circuitOverPowerFactorCritical
circuitOverPowerFactorWarningClear
circuitOverPowerFactorWarning
circuitUnderPowerFactorCriticalClear
circuitUnderPowerFactorCritical
circuitUnderPowerFactorWarningClear
circuitUnderPowerFactorWarning
circuitPowerFactorSensorUnavailable
circuitPowerFactorSensorUnavailableClear
Circuit Phase AnglecircuitSensorStateChange
circuitPoleSensorStateChange
circuitOverPhaseAngleCriticalClear
circuitOverPhaseAngleCritical
circuitOverPhaseAngleWarningClear
circuitOverPhaseAngleWarning
circuitUnderPhaseAngleCriticalClear

Raritan Power Meter Supported Events
Event description Trap name Common event name
circuitUnderPhaseAngleCritical
circuitUnderPhaseAngleWarningClear
circuitUnderPhaseAngleWarning
circuitPhaseAngleSensorUnavailable
circuitPhaseAngleSensorUnavailableClear
Circuit FrequencycircuitSensorStateChange
circuitPoleSensorStateChange
circuitOverFrequencyCriticalClear
circuitOverFrequencyCritical
circuitOverFrequencyWarningClear
circuitOverFrequencyWarning
circuitUnderFrequencyCriticalClear
circuitUnderFrequencyCritical
circuitUnderFrequencyWarningClear
circuitUnderFrequencyWarning
circuitFrequencySensorUnavailable
circuitFrequencySensorUnavailableClear
Water externalSensorStateChange
envWaterSensorCritical
envWaterSensorCriticalClea
envWaterSensorUnavailable
envWaterSensorUnavailableClear
Smoke externalSensorStateChange
envSmokeSensorCritical
envSmokeSensorCriticalClea
envSmokeSensorUnavailable
envSmokeSensorUnavailableClear
Vibration externalSensorStateChange
envVibrationSensorCritical
envVibrationSensorCriticalClear
envVibrationSensorUnavailable
envVibrationSensorUnavailableClear
Temperature externalSensorStateChange envOverTemperatureCritical
229

230
Raritan Power Meter Supported Events
Event description Trap name Common event name
envOverTemperatureCriticalClear
envOverTemperatureWarning
envOverTemperatureWarningClear
envUnderTemperatureCritical
envUnderTemperatureCriticalClear
envUnderTemperatureWarning
envUnderTemperatureWarningClear
envTemperatureSensorUnavailable
envTemperatureSensorUnavailableClear
Humidity externalSensorStateChange
envOverHumidityCritical
envOverHumidityCriticalClear
envOverHumidityWarning
envOverHumidityWarningClear
envUnderHumidityCritical
envUnderHumidityCriticalClear
envUnderHumidityWarning
envUnderHumidityWarningClear
envHumiditySensorUnavailable
envHumiditySensorUnavailableClear
Air Flow externalSensorStateChange
envOverAirFlowCritical
envOverAirFlowCriticalClear
envOverAirFlowWarning
envOverAirFlowWarningClear
envUnderAirFlowCritical
envUnderAirFlowCriticalClear
envUnderAirFlowWarning
envUnderAirFlowWarningClear
envAirFlowSensorUnavailable
envAirFlowSensorUnavailableClear

Raritan Power Meter Supported Events
Event description Trap name Common event name
Air Pressure externalSensorStateChange
envOverAirPressureCritical
envOverAirPressureCriticalClear
envOverAirPressureWarning
envOverAirPressureWarningClear
envUnderAirPressureCritical
envUnderAirPressureCriticalClear
envUnderAirPressureWarning
envUnderAirPressureWarningClear
envAirPressureSensorUnavailable
envAirPressureSensorUnavailableClear
231

232
Raritan PX/PX2/PX3 Supported Events
Some Raritan PXmodels support Event Rules, so that you can specify which events will be sent to Power IQ
Set up rules to reduce the number of traps sent to Power IQ. Optional.
Once rules are created, associate the rule with the SNMP Trap Action, with Power IQ as the trap destination.
See Event Rules or Actions in the Raritan PXUser Guide.
Note: Model numbers that begin with "PX2" or "PX3" support Event Rules.
Note: Events marked with an asterisk (*) are only generated when doors have been created and configured correctly. Formore information, see Door Access Management on page 543.
Raritan PX Supported Events
Eventdescription Trap name Common event name
Server Reach-
ability from PDU
serverReachable
serverNotReachable
serverNotReachableClear
serverNotReachable
Peak Current inletSensorStateChange
inletOverPeakCurrentCriticalClear
inletOverPeakCurrentCritical
inletOverPeakCurrentWarningClear
inletOverPeakCurrentWarning
inletUnderPeakCurrentCriticalClear
inletUnderPeakCurrentCritical
inletUnderPeakCurrentWarningClear
inletUnderPeakCurrentWarning
inletPeakCurrentSensorUnavailable
inletPeakCurrentSensorUnavailableClear
Unbalanced Cur-rent
inletSensorStateChange
inletOverUnbalancedCurrentCriticalClear
InletOverUnbalancedCurrentCritical
inletOverUnbalancedCurrentWarningClear
inletOverUnbalancedCurrentWarning
inletUnderUnbalancedCurrentCriticalClear

Raritan PX Supported Events
Eventdescription Trap name Common event name
inletUnderUnbalancedCurrentCritical
inletUnderUnbalancedCurrentWarningClear
inletUnderUnbalancedCurrentWarning
inletUnbalancedCurrentSensorUnavailable
inletUnbalancedCurrentSensorUnavailableClear
Active Power inletSensorStateChange
inletOverActivePowerCriticalClear
inletOverActivePowerCritical
inletOverActivePowerWarningClear
inletOverActivePowerWarning
inletUnderActivePowerCriticalClear
inletUnderActivePowerCritical
inletUnderActivePowerWarningClear
inletUnderActivePowerWarning
inletActivePowerSensorUnavailable
inletActivePowerSensorUnavailableClear
Apparent Power inletSensorStateChange
inletOverApparentPowerCriticalClear
inletOverApparentPowerCritical
inletOverApparentPowerWarningClear
inletOverApparentPowerWarning
inletUnderApparentPowerCriticalClear
inletUnderApparentPowerCritical
inletUnderApparentPowerWarningClear
inletUnderApparentPowerWarning
inletApparentPowerSensorUnavailable
inletApparentPowerSensorUnavailableClear
Power Factor inletSensorStateChange
inletOverPowerFactorCriticalClear
inletOverPowerFactorCritical
inletOverPowerFactorWarningClear
233

234
Raritan PX Supported Events
Eventdescription Trap name Common event name
inletOverPowerFactorWarning
inletUnderPowerFactorCriticalClear
inletUnderPowerFactorCritical
inletUnderPowerFactorWarningClear
inletUnderPowerFactorWarning
inletPowerFactorSensorUnavailable
inletPowerFactorSensorUnavailableClear
Frequency inletSensorStateChange
inletOverFrequencyCriticalClear
inletOverFrequencyCritical
inletOverFrequencyWarningClear
inletOverFrequencyWarning
inletUnderFrequencyCriticalClear
inletUnderFrequencyCritical
inletUnderFrequencyWarningClear
inletUnderFrequencyWarning
inletFrequencySensorUnavailable
inletFrequencySensorUnavailableClear
Phase Angle inletSensorStateChange
inletOverPhaseAngleCriticalClear
inletOverPhaseAngleCritical
inletOverPhaseAngleWarningClear
inletOverPhaseAngleWarning
inletUnderPhaseAngleCriticalClear
inletUnderPhaseAngleCritical
inletUnderPhaseAngleWarningClear
inletUnderPhaseAngleWarning
inletPhaseAngleSensorUnavailable
inletPhaseAngleSensorUnavailableClear
Residual Current inletSensorStateChange inletOverResidualCurrentCriticalClear

Raritan PX Supported Events
Eventdescription Trap name Common event name
inletOverResidualCurrentCritical
inletOverResidualCurrentWarningClear
inletOverResidualCurrentWarning
inletUnderResidualCurrentCriticalClear
inletUnderResidualCurrentCritical
inletUnderResidualCurrentWarningClear
inletUnderResidualCurrentWarning
inletResidualCurrentSensorUnavailable
inletResidualCurrentSensorUnavailableClear
Power Quality inletSensorStateChange
powerQualityUnavailable
powerQualityUnavailableClear
powerQualityWarning
powerQualityWarningClear
powerQualityCritical
powerQualityCriticalClear
Voltage Line toNeutral
InletPoleSensorStateChange
inletOverVoltageLnCriticalClear
inletOverVoltageLnCritical
inletOverVoltageLnWarningClear
inletOverVoltageLnWarning
inletUnderVoltageLnCriticalClear
inletUnderVoltageLnCritical
inletUnderVoltageLnWarningClear
inletUnderVoltageLnWarning
inletVoltageLnSensorUnavailable
inletVoltageLnSensorUnavailableClear
Peak Current outletSensorStateChange
outletOverPeakCurrentCriticalClear
outletOverPeakCurrentCritical
outletOverPeakCurrentWarningClear
235

236
Raritan PX Supported Events
Eventdescription Trap name Common event name
outletOverPeakCurrentWarning
outletUnderPeakCurrentCriticalClear
outletUnderPeakCurrentCritical
outletUnderPeakCurrentWarningClear
outletUnderPeakCurrentWarning
outletPeakCurrentSensorUnavailable
outletPeakCurrentSensorUnavailableClear
Unbalanced Cur-rent
outletSensorStateChange
outletOverUnbalancedCurrentCriticalClear
outletOverUnbalancedCurrentCritical
outletOverUnbalancedCurrentWarningClear
outletOverUnbalancedCurrentWarning
outletUnderUnbalancedCurrentCriticalClear
outletUnderUnbalancedCurrentCritical
outletUnderUnbalancedCurrentWarningClear
outletUnderUnbalancedCurrentWarning
outletUnbalancedCurrentSensorUnavailable
outletUnbalancedCurrentSensorUnavailableClear
Active Power outletSensorStateChange
outletOverActivePowerCriticalClear
outletOverActivePowerCritical
outletOverActivePowerWarningClear
outletOverActivePowerWarning
outletUnderActivePowerCriticalClear
outletUnderActivePowerCritical
outletUnderActivePowerWarningClear
outletUnderActivePowerWarning
outletActivePowerSensorUnavailable
outletActivePowerSensorUnavailableClear
Apparent Power outletSensorStateChange outletOverApparentPowerCriticalClear

Raritan PX Supported Events
Eventdescription Trap name Common event name
outletOverApparentPowerCritical
outletOverApparentPowerWarningClear
outletOverApparentPowerWarning
outletUnderApparentPowerCriticalClear
outletUnderApparentPowerCritical
outletUnderApparentPowerWarningClear
outletUnderApparentPowerWarning
outletApparentPowerSensorUnavailable
outletApparentPowerSensorUnavailableClear
Power Factor outletSensorStateChange
outletOverPowerFactorCriticalClear
outletOverPowerFactorCritical
outletOverPowerFactorWarningClear
outletOverPowerFactorWarning
outletUnderPowerFactorCriticalClear
outletUnderPowerFactorCritical
outletUnderPowerFactorWarningClear
outletUnderPowerFactorWarning
outletPowerFactorSensorUnavailable
outletPowerFactorSensorUnavailableClear
Frequency outletSensorStateChange
outletOverPowerFactorCriticalClear
outletOverPowerFactorCritical
outletOverPowerFactorWarningClear
outletOverPowerFactorWarning
outletUnderPowerFactorCriticalClear
outletUnderPowerFactorCritical
outletUnderPowerFactorWarningClear
outletUnderPowerFactorWarning
outletPowerFactorSensorUnavailable
237

238
Raritan PX Supported Events
Eventdescription Trap name Common event name
outletPowerFactorSensorUnavailableClear
Phase Angle outletSensorStateChange
outletOverPhaseAngleCriticalClear
outletOverPhaseAngleCritical
outletOverPhaseAngleWarningClear
outletOverPhaseAngleWarning
outletUnderPhaseAngleCriticalClear
outletUnderPhaseAngleCritical
outletUnderPhaseAngleWarningClear
outletUnderPhaseAngleWarning
outletPhaseAngleSensorUnavailable
outletPhaseAngleSensorUnavailableClear
Voltage Line toNeutral
outletPoleSensorStateChange
outletOverVoltageLnCriticalClear
outletOverVoltageLnCritical
outletOverVoltageLnWarningClear
outletOverVoltageLnWarning
outletUnderVoltageLnCriticalClear
outletUnderVoltageLnCritical
outletUnderVoltageLnWarningClear
outletUnderVoltageLnWarning
outletVoltageLnSensorUnavailable
outletVoltageLnSensorUnavailableClear
Outlet PowerState On/Off
outletSensorStateChange
outletPowerStateUnavailable
outletPowerStateUnavailableClear
outletPowerStateOff
outletPowerStateOffClear
outletPowerStateOn
outletPowerStateOnClear

Raritan PX Supported Events
Eventdescription Trap name Common event name
Circuit BreakerPeak Current
overCurrentProtectorSensorStateChange
cbOverPeakCurrentCriticalClear
cbOverPeakCurrentCritical
cbOverPeakCurrentWarningClear
cbOverPeakCurrentWarning
cbUnderPeakCurrentCriticalClear
cbUnderPeakCurrentCritical
cbUnderPeakCurrentWarningClear
cbUnderPeakCurrentWarning
cbPeakCurrentSensorUnavailable
cbPeakCurrentSensorUnavailableClear
Contact Closure externalSensorStateChangeenvContactSensorCritical
envContactSensorCriticalClear
Powered Dry
ContactexternalSensorStateChange
envPoweredDryContactCritical
envPoweredDryContactCriticalClear
Door Open
Sensor State
Change*
externalSensorStateChangedoorOpen
doorOpenClear
Handle Open
Sensor State
Change*
externalSensorStateChangehandleOpen
handleOpenClear
Electronic Lock
Sensor State
Change*
externalSensorStateChangeelectronicallyUnlocked
electronicallyUnlockedClear
Water externalSensorStateChange
envWaterSensorCritical
envWaterSensorCriticalClea
envWaterSensorUnavailable
envWaterSensorUnavailableClear
239

240
Raritan PX Supported Events
Eventdescription Trap name Common event name
Smoke externalSensorStateChange
envSmokeSensorCritical
envSmokeSensorCriticalClea
envSmokeSensorUnavailable
envSmokeSensorUnavailableClear
Vibration externalSensorStateChange
envVibrationSensorCritical
envVibrationSensorCriticalClear
envVibrationSensorUnavailable
envVibrationSensorUnavailableClear
Temperature externalSensorStateChange
envOverTemperatureCritical
envOverTemperatureCriticalClear
envOverTemperatureWarning
envOverTemperatureWarningClear
envUnderTemperatureCritical
envUnderTemperatureCriticalClear
envUnderTemperatureWarning
envUnderTemperatureWarningClear
envTemperatureSensorUnavailable
envTemperatureSensorUnavailableClear
Humidity externalSensorStateChange
envOverHumidityCritical
envOverHumidityCriticalClear
envOverHumidityWarning
envOverHumidityWarningClear
envUnderHumidityCritical
envUnderHumidityCriticalClear
envUnderHumidityWarning
envUnderHumidityWarningClear
envHumiditySensorUnavailable
envHumiditySensorUnavailableClear

Raritan PX Supported Events
Eventdescription Trap name Common event name
Air Flow externalSensorStateChange
envOverAirFlowCritical
envOverAirFlowCriticalClear
envOverAirFlowWarning
envOverAirFlowWarningClear
envUnderAirFlowCritical
envUnderAirFlowCriticalClear
envUnderAirFlowWarning
envUnderAirFlowWarningClear
envAirFlowSensorUnavailable
envAirFlowSensorUnavailableClear
Air Pressure externalSensorStateChange
envOverAirPressureCritical
envOverAirPressureCriticalClear
envOverAirPressureWarning
envOverAirPressureWarningClear
envUnderAirPressureCritical
envUnderAirPressureCriticalClear
envUnderAirPressureWarning
envUnderAirPressureWarningClear
envAirPressureSensorUnavailable
envAirPressureSensorUnavailableClear
Motion Detection motionDetection
envMotionDetectionCritical
envMotionDetectionCriticalClear
envMotionDetectionUnavailable
envMotionDetectionUnavailableClear
Tamper Detec-
tiontamperDetection
envTamperDetectionCritical
envTamperDetectionCriticalClear
envTamperDetectionUnavailable
envTamperDetectionUnavailableClear
241

Raritan PX3TSTransfer Switch Supported Events
Raritan PX3TS Supported Events
Event description Trap name Common event name
Transfer Switch Active InletChanged
transferSwitchStateChange
transferSwitchActiveInletChangedCritical
transferSwitchActiveInletChangedCriticalClear
transferSwitchActiveInletChangedWarning
Transfer Switch OperatingState Change
transferSwitchStateChangetransferSwitchOperatingStateNormal
transferSwitchOperatingStateStandby
Water externalSensorStateChange
envWaterSensorCritical
envWaterSensorCriticalClea
envWaterSensorUnavailable
envWaterSensorUnavailableClear
Smoke externalSensorStateChange
envSmokeSensorCritical
envSmokeSensorCriticalClea
envSmokeSensorUnavailable
envSmokeSensorUnavailableClear
Vibration externalSensorStateChange
envVibrationSensorCritical
envVibrationSensorCriticalClear
envVibrationSensorUnavailable
envVibrationSensorUnavailableClear
Temperature externalSensorStateChange
envOverTemperatureCritical
envOverTemperatureCriticalClear
envOverTemperatureWarning
envOverTemperatureWarningClear
envUnderTemperatureCritical
envUnderTemperatureCriticalClear
envUnderTemperatureWarning
243

244
Raritan PX3TS Supported Events
Event description Trap name Common event name
envUnderTemperatureWarningClear
envTemperatureSensorUnavailable
envTemperatureSensorUnavailableClear
Humidity externalSensorStateChange
envOverHumidityCritical
envOverHumidityCriticalClear
envOverHumidityWarning
envOverHumidityWarningClear
envUnderHumidityCritical
envUnderHumidityCriticalClear
envUnderHumidityWarning
envUnderHumidityWarningClear
envHumiditySensorUnavailable
envHumiditySensorUnavailableClear
Air Flow externalSensorStateChange
envOverAirFlowCritical
envOverAirFlowCriticalClear
envOverAirFlowWarning
envOverAirFlowWarningClear
envUnderAirFlowCritical
envUnderAirFlowCriticalClear
envUnderAirFlowWarning
envUnderAirFlowWarningClear
envAirFlowSensorUnavailable
envAirFlowSensorUnavailableClear
Air Pressure externalSensorStateChange
envOverAirPressureCritical
envOverAirPressureCriticalClear
envOverAirPressureWarning
envOverAirPressureWarningClear
envUnderAirPressureCritical
envUnderAirPressureCriticalClear

Raritan PX3TS Supported Events
Event description Trap name Common event name
envUnderAirPressureWarning
envUnderAirPressureWarningClear
envAirPressureSensorUnavailable
envAirPressureSensorUnavailableClear
245

246
Rittal Supported Events
Rittal Supported Events
Event description Trap name Common event name
Inlet Current Upper Critical Threshold
alarmUnit1
alarmUnit2
alarmUnit3
alarmUnit4
inletCurrentUpperCritical
Inlet Current Upper Critical Threshold Cleared
alarmUnit1
alarmUnit2
alarmUnit3
alarmUnit4
inletCurrentUpperCriticalClear
Inlet Current Lower Critical Threshold
alarmUnit1
alarmUnit2
alarmUnit3
alarmUnit4
inletCurrentLowerCritical
Inlet Current Lower Critical Threshold Cleared
alarmUnit1
alarmUnit2
alarmUnit3
alarmUnit4
inletCurrentLowerCriticalClear
Inlet Voltage Upper Critical Threshold
alarmUnit1
alarmUnit2
alarmUnit3
alarmUnit4
inletVoltageUpperCritical
Inlet Voltage Upper Critical Threshold Cleared
alarmUnit1
alarmUnit2
alarmUnit3
alarmUnit4
inletVoltageUpperCriticalClear

Rittal Supported Events
Event description Trap name Common event name
Inlet Voltage Lower Critical Threshold
alarmUnit1
alarmUnit2
alarmUnit3
alarmUnit4
inletVoltageLowerCritical
Inlet Voltage Lower Critical Threshold Cleared
alarmUnit1
alarmUnit2
alarmUnit3
alarmUnit4
inletVoltageLowerCriticalClear
Temp Env Sensor Upper Critical
alarmUnit1
alarmUnit2
alarmUnit3
alarmUnit4
envTemperatureUpperCritical
Temp Env Sensor Upper Critical Cleared
alarmUnit1
alarmUnit2
alarmUnit3
alarmUnit4
envTemperatureUpperCriticalClear
Temp Env Sensor Low Critical
alarmUnit1
alarmUnit2
alarmUnit3
alarmUnit4
envTemperatureLowerCritical
Temp Env Sensor Low Critical Cleared
alarmUnit1
alarmUnit2
alarmUnit3
alarmUnit4
envTemperatureLowerCriticalClear
Humidity Env Sensor Upper Critical
alarmUnit1
alarmUnit2
alarmUnit3
envHumidityUpperCritical
247

248
Rittal Supported Events
Event description Trap name Common event name
alarmUnit4
Humidity Env Sensor Upper Critical Cleared
alarmUnit1
alarmUnit2
alarmUnit3
alarmUnit4
envHumidityUpperCriticalClear
Humidity Env Sensor Lower Critical
alarmUnit1
alarmUnit2
alarmUnit3
alarmUnit4
envHumidityLowerCritical
Humidity Env Sensor Lower Critical Cleared
alarmUnit1
alarmUnit2
alarmUnit3
alarmUnit4
envHumidityLowerCriticalClear
Schleifenbauer Supported Events
Schleifenbauer Supported Events
Event description Trap name Common event name
Temperature High
ThresholdsdbDevSsTemperatureAlertDetected envOverTemperatureCritical
Inlet Current High Threshold sdbDevSsInputCurrentAlertDetected inletOverCurrentCritical
Outlet Current High
ThresholdsdbDevSsOutletCurrentAlertDetected outletOverCurrentCritical
Inlet Voltage High Threshold sdbDevSsInputVoltageAlertDetected inletOverVoltageCritical
Outlet Current Low sdbDevSsOutletCurrentDropAlertDetected outletUnderCurrentCritical

Schleifenbauer Supported Events
Event description Trap name Common event name
Threshold
Inlet Current Low Threshold sdbDevSsInputCurrentDropAlertDetected inletUnderCurrentCritical
Outlet Voltage Low
ThresholdsdbDevSsOutletVoltageDropAlertDetected outletUnderVoltageCritical
Trap Used for Clearing
EventssdbDevSsDeviceStatusCodeChanged
envOverTemperatureCriticalClear
inletOverCurrentCriticalClear
inletUnderCurrentCriticalClear
inletOverVoltageCriticalClear
outletOverCurrentCriticalClear
outletUnderCurrentCriticalClear
outletUnderVoltageCriticalClear
Note: To work optimally with PIQ, the Auto Reset Alert option under Settings > Reset in the Schleifenbauer PDU settingsshould be enabled and set to one-minute intervals (the shortest possible time interval).
Note: Power IQ natively supports Schleifenbauer hybrid PDUs but can also manage Classic PDUs in a daisy chain con-figuration where a hybrid PDU is the primary or head PDU of the chain.
249

250
Servertech Supported Events
Note: This plugin supports hardware prior to Server Technology’s next-generation “PRO2" series of CDU (cabinet dis-tribution unit). For supported events for PRO2 series hardware, see Servertech PRO2 (Sentry4) Supported Events on thenext page.
Servertech Supported Events
Event description Trap name Common event name
Infeed Current High Threshold infeedLoadEventinletCurrentUpperCritical
inletCurrentUpperCriticalClear
Infeed Current Low Threshold infeedLoadEventinletCurrentLowerCritical
inletCurrentLowerCriticalClear
Outlet Current High Thresholds outletLoadEventoutletCurrentUpperCritical
outletCurrentUpperCriticalClear
Outlet Current Low Thresholds outletLoadEventoutletCurrentLowerCritical
outletCurrentLowerCriticalClear
Outlet Current Status Change outletChangeEventoutletPowerOn
outletPowerOff
Temp Env Sensor High Threshold tempHumidSensorTempEventenvTemperatureUpperCritical
envTemperatureUpperCriticalClear
Temp Env Sensor Low Threshold tempHumidSensorTempEventenvTemperatureLowerCritical
envTemperatureLowerCriticalClear
Humidity Env Sensor High Thresholds tempHumidSensorHumidEventenvHumidityUpperCritical
envHumidityUpperCriticalClear
Humidity Env Sensor Low Thresholds tempHumidSensorHumidEventenvHumidityLowerCritical
envHumidityLowerCriticalClear
WaterenvWaterSensorCriticalClear
envWaterSensorCritical

Servertech Supported Events
Event description Trap name Common event name
Contact ClosureenvContactSensorCriticalClear
envContactSensorCritical
Servertech PRO2 (Sentry4) Supported Events
Note: The Sentry4 plugin supports Server Technology’s next-generation “PRO2" series of CDU (cabinet distribution unit).For supported events for the original Servertech plugin, which supports hardware prior to the PRO2 series, see Servertech Supported Events on the previous page.
Note: To access the environmental sensors, water sensor, and dry contact closure door sensors available on the Server-tech EMCU-1-1B unit, you must first add the EMCU-1-1B to Power IQ with a proxy ID of 5 that extends the existing Startopology.
Servertech Supported Events
Eventdescription Trap name Common event name
Inlet Active Power st4InputCordActivePowerEvent
inletOverActivePowerCriticalClear
inletOverActivePowerCritical
inletOverActivePowerWarningClear
inletOverActivePowerWarning
inletUnderActivePowerCriticalClear
inletUnderActivePowerCritical
inletUnderActivePowerWarningClear
inletUnderActivePowerWarning
Inlet ApparentPower
st4InputCordApparentPowerEvent
inletOverApparentPowerCriticalClear
inletOverApparentPowerCritical
inletOverApparentPowerWarningClear
inletOverApparentPowerWarning
inletUnderApparentPowerCriticalClear
251

252
Servertech Supported Events
Eventdescription Trap name Common event name
inletUnderApparentPowerCritical
inletUnderApparentPowerWarningClear
inletUnderApparentPowerWarning
Inlet Power Factor st4InputCordPowerFactorEvent
inletUnderPowerFactorCriticalClear
inletUnderPowerFactorCritical
inletUnderPowerFactorWarningClear
inletUnderPowerFactorWarning
Inlet Voltage st4InputCordVoltageEvent
inletOverVoltageCriticalClear
inletOverVoltageCritical
inletOverVoltageWarningClear
inletOverVoltageWarning
inletUnderVoltageCriticalClear
inletUnderVoltageCritical
inletUnderVoltageWarningClear
inletUnderVoltageWarning
Inlet Unbalanced
Currentst4InputCordOutOfBalanceEvent
inletOverUnbalancedCurrentCriticalClear
inletOverUnbalancedCurrentCritical
inletOverUnbalancedCurrentWarningClear
inletOverUnbalancedCurrentWarning
Outlet Current st4OutletCurrentEvent
outletOverCurrentCriticalClear
outletOverCurrentCritical
outletOverCurrentWarningClear
outletOverCurrentWarning
outletUnderCurrentCriticalClear
outletUnderCurrentCritical
outletUnderCurrentWarningClear
outletUnderCurrentWarning

Servertech Supported Events
Eventdescription Trap name Common event name
Outlet ActivePower
st4OutletActivePowerEvent
outletOverActivePowerCriticalClear
outletOverActivePowerCritical
outletOverActivePowerWarningClear
outletOverActivePowerWarning
outletUnderActivePowerCriticalClear
outletUnderActivePowerCritical
outletUnderActivePowerWarningClear
outletUnderActivePowerWarning
Outlet PowerFactor
st4OutletPowerFactorEvent
outletUnderPowerFactorCriticalClear
outletUnderPowerFactorCritical
outletUnderPowerFactorWarningClear
outletUnderPowerFactorWarning
Circuit Protector
(Breaker) Trippedst4OcpStatusEvent
cbTrippedClear
cbTripped
Outlet PowerStatus Change
st4OutletStateChangeEventoutletPowerStateOff
outletPowerStateOn
Contact Closure
Sensor Statusst4CcSensorStatusEvent
envContactSensorCriticalClear
envContactSensorCritical
Water Sensor
Statusst4WaterSensorStatusEvent
envWaterSensorCriticalClear
envWaterSensorCritical
TemperatureSensor Status
st4TempSensorEvent
envOverTemperatureCriticalClear
envOverTemperatureCritical
envOverTemperatureWarningClear
envOverTemperatureWarning
envUnderTemperatureCriticalClear
envUnderTemperatureCritical
envUnderTemperatureWarningClear
253

254
Servertech Supported Events
Eventdescription Trap name Common event name
envUnderTemperatureWarning
Humidity SensorStatus
st4HumidSensorEvent
envOverHumidityCriticalClear
envOverHumidityCritical
envOverHumidityWarningClear
envOverHumidityWarning
envUnderHumidityCriticalClear
envUnderHumidityCritical
envUnderHumidityWarningClear
envUnderHumidityWarning
Sinetica Supported Events
Note: The Sinetica plugin supports Unite Technologies/Panduit PDUs.
Note: Events marked with an asterisk (*) are only generated when doors have been created and configured correctly. Formore information, see Door Access Management on page 543.
Event description Trap name Common event name
Temp Env Sensor High Threshold
alarmCritical
alarmWarning
alarmCleared
envOverTemperatureCritical
envOverTemperatureWarning
envOverTemperatureCriticalClear
envOverTemperatureWarningClear
Temp Env Sensor Low Threshold
alarmCritical
alarmWarning
alarmCleared
envUnderTemperatureCritical
envUnderTemperatureWarning
envUnderTemperatureCriticalClear
envUnderTemperatureWarningClear
Humidity Env Sensor High ThresholdalarmCritical
alarmWarning
envOverHumidityCritical
envOverHumidityWarning

Event description Trap name Common event name
alarmCleared envOverHumidityCriticalClear
envOverHumidityWarningClear
Humidity Env Sensor Low Threshold
alarmCritical
alarmWarning
alarmCleared
envUnderHumidityCritical
envUnderHumidityWarning
envUnderHumidityCriticalClear
envUnderHumidityWarningClear
Contact ClosurealarmCritical
alarmCleared
envContactSensorCritical
envContactSensorCriticalClear
Powered Dry ContactalarmCritical
alarmCleared
envPoweredDryContactCritical
envPoweredDryContactCriticalClear
Inlet Voltage High Threshold
alarmCritical
alarmWarning
alarmCleared
inletOverVoltageCritical
inletOverVoltageWarning
inletOverVoltageCriticalClear
inletOverVoltageWarningClear
Inlet Voltage Low Threshold
alarmCritical
alarmWarning
alarmCleared
inletUnderVoltageCritical
inletUnderVoltageWarning
inletUnderVoltageCriticalClear
inletUnderVoltageWarningClear
Inlet Current High Threshold
alarmCritical
alarmWarning
alarmCleared
inletOverCurrentCritical
inletOverCurrentWarning
inletOverCurrentCriticalClear
inletOverCurrentWarningClear
Inlet Current Low Threshold
alarmCritical
alarmWarning
alarmCleared
inletUnderCurrentCritical
inletUnderCurrentWarning
inletUnderCurrentCriticalClear
inletUnderCurrentWarningClear
255

256
Event description Trap name Common event name
Inlet Apparent Power High Threshold
alarmCritical
alarmWarning
alarmCleared
inletOverApparentPowerCritical
inletOverApparentPowerWarning
inletOverApparentPowerCriticalClear
Inlet Active Power High Threshold
alarmCritical
alarmWarning
alarmCleared
activePowerCritical
activePowerWarning
activePowerCriticalClear
activePowerWarningClear
Inlet Power Factor ThresholdalarmCritical
alarmCriticalCleared
inletOverPowerFactorCritical
inletOverPowerFactorCriticalClear
Inlet Frequency ThresholdalarmCritical
alarmCriticalCleared
inletOverFrequencyCritical
inletOverFrequencyCriticalClear
Door Open Sensor State Change*alarmCritical
alarmCriticalCleared
doorOpen
doorOpenClear
Handle Open Sensor State Change*alarmCritical
alarmCriticalCleared
handleOpen
handleOpenClear
Electronic Lock Sensor State Change*alarmCritical
alarmCriticalCleared
electronicallyUnlocked
electronicallyUnlockedClear
PSU FailurealarmCritical
alarmCriticalCleared
pduInternalFault
pduInternalFaultClear

Starline Supported Events
Starline Supported Events
Event description Trap name Common event name
Circuit Current
cpmDcInfOvCurrAssertEv
cpmDcInfOvCurrDeassertEv
cpmDcInfUnCurrAssertEv
cpmDcInfUnCurrDeassertEv
cpmAcInfOvCurrAssertEv
cpmAcInfOvCurrDeassertEv
cpmAcInfUnCurrAssertEv
cpmAcInfUnCurrDeassertEv
inletCurrentUpperCritical
inletCurrentUpperCriticalClear
Circuit Voltage
cpmDcInfOvVoltAssertEv
cpmDcInfOvVoltDeassertEv
cpmDcInfUnVoltAssertEv
cpmDcInfUnVoltDeassertEv
cpmAcInfOvVoltAssertEv
cpmAcInfOvVoltDeassertEv
cpmAcInfUnVoltAssertEv
cpmAcInfUnVoltDeassertEv
circuitOverVoltageCritical
circuitUnderVoltageCritical
Tripplite Supported Events
Tripplite Supported Events
Event description Trap name Common event name
Environmental sensor events tlUpsTrapAlarmEntryAdded envTemperatureUpperCritical
257

258
Tripplite Supported Events
Event description Trap name Common event name
envTemperatureUpperWarning
envHumidityUpperCritical
envHumidityUpperWarning
tlUpsTrapAlarmEntryRemoved
envTemperatureUpperCriticalClear
envTemperatureUpperWarningClear
envHumidityUpperCriticalClear
envHumidityUpperWarningClear

PDU Connectivity Lost and Restored Events
Power IQ generates PDU connectivity events when connectivity with a PDU changes.
When Health Polling is enabled, the Health Poller and Data Poller work together to report events on these two aspects ofconnectivity: responding to ping and responding to data collection, each based on the specified intervals. The PDU'shealth status will change to red when connectivity is lost. Loss of connectivity is a critical severity event.
The Data Poller checks for data connectivity every 15 minutes. If a PDU remains inaccessible for 1 hour, the ConnectivityLost event is generated. Once communication with the PDU is restored, the Connectivity Restored event is generated,and the health status will update.
The Health Poller checks for network connectivity and device operational status by sending a ping and getting a response.The Health Poll process is generally quicker than a data poll.
In Power IQ 5.2 and above, backup IP addresses are supported for PDUs. Health Poller will poll all of the IP addresses avail-able for a PDU. If at least one IP address is reachable, no event will be created. Health Poller will continue to poll thebackup IP address until it becomes unreachable. For more information, see Configuring Backup IP Addresses for PDUs.
To configure email notifications for this event, see Configuring Notification Filters on page 275. Event notifications must beenabled. See Enable or Disable Event Notifications on page 273.
The event details are in the table.
Event description Event name
A PDU has not responded to the Health Poller pings after all retries. Lost Connectivity: Ping Failed
A PDU has not responded to the Data Poller's data collection attempts afterall retries.
Lost Connectivity: Data CollectionFailed
A PDU becomes responsive to the Data Poller. Persistent Data Collection Failed Clear
A PDU becomes responsive to the Health Poller pings. Ping Failed Clear
A PDU has an unsupported device configuration change and cannot be man-aged anymore.
Unsupported PDU ConfigurationChange Event
259

260
Rack Thresholds
Rack thresholding creates events and event notifications when a rack reaches a set percentage of the rack’s capacity,measured using active power (kW).
Calculations use the maximum active power reading found for each inlet, during each polling period, and the total activepower for each circuit associated with an IT device in the rack. The maximum values are summed to determine the rackactive power. If the summed value exceeds a set threshold, an event is triggered.
The threshold calculation interval is based on the configured polling interval. For example, with a polling interval of 15minutes, Power IQ will also run a rack threshold calculation every 15 minutes.
Note: Calculations are estimates. Raritan PDUs with buffered data retrieval ("data logging") enabled will give more accur-ate maximum readings. Other PDU types may have less accurate maximum readings, which can cause false negativesor false positives.
Warning or critical rack threshold events are not cleared unless all inlets on all PDUs in a rack are responding. A new warn-ing or critical event will still be issued even when a rack has PDUs that are not responding, if the collected readings fromthe PDUs that are responding are enough to exceed the configured capacity threshold.
You can set rack thresholds under Power IQ settings > Threshold Settings or on rack smart pages. For more information,see:
l Configuring Default Threshold Settings.l Set Rack Capacity and Override Threshold Percentages.
To receive event notifications, configure notification filters to include Rack events. See Configuring Notification Filters onpage 275.
Configuring Default Threshold Settings
When you enable calculating of rack thresholds, Power IQ calculates each rack's active power at the polling interval. Thecalculation uses the inlet active power of each PDU. For PDUs with buffered data retrieval, the maximum active powerreading is used.
Power IQ uses the threshold percentages to determine when a rack is nearing capacity.
l Default upper warning threshold: 80%l Default upper critical threshold: 90%
These percentages apply to all racks, unless you set an override at the rack level. See Set Rack Capacity and OverrideThreshold Percentages.
Events are triggered when the calculated capacity of the rack equals or exceeds the threshold.
Each rack must have a configured capacity for rack thresholds to be calculated. See Set Rack Capacity and OverrideThreshold Percentages.
To edit default thresholds:

1. Click the Settings Tab.2. Under Appliance Administration, click the Default Thresholds link.3. On the Default Thresholds page, check the Enable Power, Temperature, and Humidity Thresholding box.
Note: To disable thresholding, uncheck the Enable Power, Temperature, and Humidity Thresholding box. However,if you disable thresholding, a message will display indicating that changing polling options requires the poller soft-ware to restart, which may take up to a few seconds. To confirm and continue, click the OK button. Otherwise,click the Cancel button to return to the Default Thresholds page.
4. To edit the lower warning, lower critical, upper warning, and upper critical thresholds, double-click in each cell.5. Your changes are saved automatically. A green success message will display at the top of the page when a
threshold change has successfully been saved.
Set Rack Capacity and Override Threshold Percentages
Power IQ uses the rack capacity to calculate when a threshold has been exceeded, and generate an event. Power IQ usesthe default threshold unless you set a different percentage at the rack level, to override the default setting.
To set capacity and override threshold percentages for multiple racks simultaneously, use the EDM import function. SeeImport EDM Object Mappings.
1. In the Data Centers tab, select the rack. The Rack smart view opens.2. Click Actions, then choose Edit Details.3. Enter the capacity for the rack in kW.4. Enter a percentage in the Critical or Warning level fields to override the default global thresholds. When these fields
are blank, the defaults are used. See Configure Default Threshold Settings.
261

262
Viewing Events
The Events tab displays all events that Power IQ receives from configured facility items. For each event, it includes thedate- and time-stampled:
l Severityl Eventl Summaryl IP or Name of the Target Devicel Status
Additional EDM location information is also available on the Event Details pages and the Event Listing on the Events tab.For more information, see EDM Location Information for Events on the next page and EDM Locations in the Events Tab onpage 264.
Each column can be sorted or filtered. See Filter the Events List on page 267 for more information.
To view event details:
1. Click the Events tab. The Events Listing displays.2. Click the links in the Events column to open the Event details pages for different events.
Note: For Raritan PX, PX2 and EMX, Power IQ also displays the actual measured reading values for the event wheneverthat information is available in notifications.

Events Page Auto-Refresh
The Events panel on the Events tab auto-refreshes every 30 seconds. This simplifies event management for users whowant to monitor for new events by watching this tab.
The refresh is based on your current settings for filters, sort order, and page (e.g., page 5 of 20). When the panel is set tosort descending based on “Occurred at,” newer events appear at the top when the page is auto-refreshed.
EDM Location Information for Events
A Location value displays in the details for all non-internal Power IQ services events and notifications, showing the EDMpath to the target item and ending with its parent.
For internal Power IQ services events, the Location field displays "System."
263

264
EDM Locations in the Events Tab
Additionally, EDM locations are available in the Event Listing on the Events tab. A column for each EDM level that is a pos-sible parent of the target item of the event displays in the Event Listing:
l Data Centerl Floorl Rooml Aislel Rowl Rack

EDM Location Information in Event Notifications
EDM location information is also available in email and HTTP event notifications.
For email notifications for events, the "Located in" field will display the EDM location.
Location fields are included in the notification JSON sent to the specified HTTP end point for event notifications. The loc-ation fields include:
265

266
l data_center_namel data_center_idl floor_namel floor_idl room_namel room_idl aisle_namel aisle_idl row_namel row_idl rack_namel rack_idl door_namel door_id

Filter the Events List
You can customize your view of the Events list by using filters and sorting.
See Customizing Your View of Facility Items, IT Devices, and Events on page 182
1. In the Events tab, all events in the system display in a list.2. All columns of data contain a filter criteria selection. Enter the filter criteria in the filter boxes located below each
column header.3. Filter by date: The Occurred At column accepts valid date ranges. To enter a date range select the Year, Month
and Day using the Calendar Selector for both the "From" and "To" dates and click "Apply".
267

268
4. Filter by event severity: In the Severity column filter, select the checkbox for the severity of events you want to view.Select multiple options as needed.
5. Filter by event name: In the Event column filter, enter an event name to view.6. Filter by PDU associated with the event: In the Associated PDU column filter, enter a PDU name or IP address to
view events associated with a PDU.7. Filter by event status: In the Status column filter, select the checkbox for the status of events you want to view,
either active, or cleared. Select multiple options as needed.

Exporting the Events List to CSV
Export the Events list to create a CSVfile that contains all the information in the grid on the Events tab.
If you have applied filters, the same filters will apply to the exported information. Export includes all records matching the fil-ter criteria. The export is not limited by the number of events shown in the list grid.
1. In the Events tab, click the Settings icon in the upper right corner of the grid.2. Select the Export Grid Data to CSVoption.
3. The following is the list of exported columns:
l Occurred At
l Cleared By
l Cleared At
l Notification Status
l HTTP Notification Status
269

270
l Created At
l Region Name
l Country Name
l Territory
l Name
l City Name
l Data Center Name
l Floor Name
l Room Name
l Aisle Name
l Row Name
l Rack Name
l Door Name
l Region ID
l Country ID
l Territory ID
l City ID
l Data Center ID
l Floor ID Room ID
l Aisle ID
l Row ID
l Rack ID
l Door ID
l Type Seen in Events
l ID Seen in Events
l Name Summary
l Severity Code
l Severity
l Name Seen in Events

Clearing Events
Events can be automatically cleared by other events, or you can clear them manually.
1. In the Events tab, select the checkbox for an event in the list. Select multiple checkboxes to choose multipleevents to clear.
2. Click Clear Selected Events.3. To clear an event from the Events details page:4. In the Events tab, click the link for an event to open the Event details page. The link to open Event details is in the
Events column.5. In the Event details page, click "Clear this event".
271

272
Automatic Delete of Cleared Events
Power IQ automatically deletes cleared events from the system hourly.
Cleared events will only be deleted when there are more than 100,000 events in the database.
The oldest events in the system are eligible to be deleted first. If there are 100,000 or fewer events in the database at thehourly check, then no events will be deleted.
Only cleared events are eligible to delete. Power IQ will not delete active events.
You can access events and event configurations via ODBC views. If you need to keep a log of all generated events, run ascript periodically that retrieves event data via ODBC before Power IQ deletes cleared events automatically.
Events generated by dynamic plugins are not automatically cleared. See Event Clearing on page 684.

Enable or Disable Event Notifications
Enable or Disable Event Notifications via Email
If you would like to receive email notification for events that Power IQ receives, you must enable event notifications. Whenevent notification is enabled, Power IQ sends an email message for every event. Set up notification filters if you want toreceive emails for every event. See Configuring Notification Filters on page 275.
1. In the Settings tab, click Power IQ Settings in the Application Administration section.2. In the Event Notification Settings box, select the "Enable e-mail delivery of event notifications" checkbox to enable
event notifications.
or
3. Deselect the "Enable e-mail delivery of event notifications" checkbox to disable event notifications.4. Click Save.
After enabling event notifications, the "Configure event notifications for your account" link appears. Click this link to use fil-ters to manage your notifications.
After enabling, configure the SMTP settings for your system. See SMTP Server Settings on page 277
You can also receive event notifications via JSON. For more information, see Enable or Disable Event Notifications viaJSON on the facing page.
273

274
Enable or Disable Event Notifications via JSON
In addition to event notifications via email, you can also receive event notifications via JSON over HTTP or HTTPS throughan endpoint that you choose. Only Site Administrators can enable or disable event notification settings within Power IQ.
1. In the Settings tab, click Power IQ Settings in the Application Administration section.2. In the Event Notification Settings box, select the "Enable HTTP delivery of event notifications" checkbox to enable
event notifications via JSON.
or
3. Deselect the "Enable HTTP delivery of event notifications" checkbox to disable event notifications via JSON.4. If enabling, provide the following information:
a. Endpoint (required)b. Username (optional)c. Password (optional)
5. Click the Save Event Notification Settings button to save your changes.
Note: The endpoint is required and must start with http:// or https://. Username and password are optional to allow you toset up basic authentication for your endpoint (if preferred).
When event notifications via JSON are enabled or disabled, the changes will be captured in the system audit log.
Send events using the same format as when retrieving them via the API. For more info, see the Power IQ API Guide.

Configuring Notification Filters
When event notification is enabled, Power IQ sends an email message for every event. Set up notification filters if you wantto receive emails for every event.
1. Click your username link, next to the Logoff link in the upper right corner of Power IQ.2. Click Manage Event Notifications.3. Click "Add a filter."4. Select the Enable this Filter checkbox.5. Select the Severity levels of the events for which you want Power IQ to send email notifications: Critical, Warning,
and Informational.6. Select the Sources of the events for which you want Power IQ to send email notifications: Outlet, Inlet, Circuit
Breaker, Environmental Sensors, PDU Connectivity, Rack, and Internal Power IQ Services.l PDU connectivity events is for failed communication events reported by Health or Data Poller.l Rack sources is for rack capacity threshold events.l Power IQ Internal services is for Enterprise Power IQ extraction failure events.
7. Select "Send notifications for all PDUs" to receive email notifications for all PDUs that meet the Severity level andSource criteria selected.
or
8. Select "Send notifications only for the following PDUs" and then enter IP addresses for PDUs or values for CustomFields associated with PDUs.
9. Enter a value in either or both custom fields to receive email notifications only for PDUs that have those customfield values assigned. Custom Field 1 and Custom Field 2 may be renamed in your system. See Configuring Cus-tom Fields.
10. Click Add to enter the IP addresses of the PDUs for which email notifications should be sent. Enter a partial IPaddress to specify a group of PDUs in sequence.
For example, enter 192.168.45 to specify all IP addresses beginning with that sequence. Click See Matching PDUsto verify the list of PDUs for which Power IQ will send email notifications.
Note: IP address filters do not apply to rack events or internal Power IQ service events.
11. Click Save.
275

276
Managing Event Notifications for Users
Users with the Site Administrator role can manage other user's event notification settings.
1. In the Settings tab, click User Accounts in the Authorization and Authentication section.2. Click the username link for the user whose event notification settings you want to view.3. Click "Manage event notifications."4. Change the settings as needed and click Save. See Configure Notification Filters for details.

SMTPServer Settings
Configure the SMTP server settings to determine how email notifications are sent when Power IQ receives events.
You must reboot Power IQ after changing the encryption method in the SMTP server settings. See Shutting Down andRestarting Power IQ.
1. In the Settings tab, click Server Settings in the Appliance Administration section.2. In the SMTP Server Settings section, enter the basic settings for the SMTP server.
l Server name/IP address: Enter the email server's domain name or IP address.l Port: The default port is 25. Change this number if you use a different port.l "Sender email address": Enter the Power IQ's IP address.l In the Authentication and Encryption Settings section, select the method for your SMTP server.l Authentication type: Select None or Password. If you select Password, enter the Username, Password, and
Confirm password.3. Select an Encryption method.4. Click Send a Test Email to enter your email address and try sending an email message using the settings you con-
figured. If you see a success message, click Save SMTP Settings.5. If you see a failure message, edit your settings and try again. A password must be entered in the page to test the
settings. Once saved, passwords do not display in the page for security.
277

278
Events That Clear Quickly
If two events occur, active and cleared, within 30 seconds, only one event notification is sent, for the cleared event. Forexample, if a PDU experiences a temperature spike, but the temperature returns to normal within one second, only theevent notification for the cleared event is sent.
The event notification contains information indicating when the original event occurred and when that event was cleared.

SNMPTrap Filtering and Event-Based Trap Forwarding
In Power IQ 5.2 and above, users with the global Site Administrator role are able to specify the traps that they want to dis-card or filter out (trap filtering) and to forward SNMP traps from PDUs to other network devices (trap forwarding) based onPower IQ events.
The SNMP Trap Settings panel is accessible through the Event Listings page or on the Power IQ Settings page. Fordetailed instructions, see Accessing the SNMP Trap Settings Panel on the facing page.
Individual filters can be created for both trap forwarding and trap filtering. For more information, see Managing IndividualTrap Drop Filters on page 284 and Managing Individual Trap Forwarding Filters on page 294.
Note: Trap forwarding is supported only for SNMPv1/v2 traps. SNMPv3 trap forwarding not supported.
279

280
Accessing the SNMPTrap Settings Panel
SNMP trap settings can be configured by users with the Site Administrator role from the SNMP Trap Settings panel. Userscan access the SNMP Trap Settings panel through the Event Listings page or on the Power IQ Settings page.
l From the Event Listings page: Click the Manage SNMP Settings button and icon in the upper right corner of theEvent Listings grid. A new page with the SNMP Trap Settings panel will load.
l From the Power IQ Settings page: Click the Settings tab > Power IQ Settings > SNMP Trap Settings to load theSNMP Trap Settings panel.

SNMPTrap Settings Panel
The SNMP Trap Settings panel contains three distinct subpanels that can be updated independently of each other. Formore information on how to access SNMP Trap Settings in Power IQ, see Accessing the SNMP Trap Settings Panel.
Below is an example screenshot of the SNMP Trap Settings panel, followed by the details of each subpanel.
Trap Filtering (Pre-Fuse)
The Trap Filtering (Pre-Fuse) sub-panel is located at the top of the panel and provides controls for enabling/disabling trapfiltering, which allows you to specify which traps you wish to filter out or discard, and for configuring specific individual trapfilters. You can configure trap filters by clicking the Manage Trap Filters button, which will take you to the Manage TrapDrop Filters page. For more information, see Managing Individual Trap Drop Filters.
Note: “Pre-Fuse” refers to the fact that traps that are filtered out do not count toward tripping the fuse. They are droppedbefore the fuse. For more information, see Trap Fuse Handling on page 288.
Trap Fuse Settings (Advanced)
The Trap Fuse Settings (Advanced) subpanel is located in middle of the SNMP Trap Settings panel and provides controlsfor you to customize the settings for Power IQ’s trap fuse. For more information, see Trap Fuse Handling on page 288.
281

282
Note: This section is expandable/collapsible and will be collapsed by default when the SNMP Trap Settings panel isloaded initially.
Trap Forwarding
The Trap Forwarding subpanel is located at the bottom of the SNMP Trap Settings panel and provides controls forenabling/disabling trap forwarding and for configuring specific individual event-based trap forwarding filters. You can con-figure trap forwarding filters by clicking the Manage Forwarding Filters button, which will take you to the Manage Trap For-warding Filters page. For more information, see Managing Individual Trap Forwarding Filters on page 294.

Enabling/Disabling Trap Filtering
Users with the Site Administrator role can enable/disable trap drop filtering from the SNMP Trap Settings panel.
1. Click Events > Manage SNMP Settings to load a new page with the SNMP Trap Settings panel.2. In the Trap Filtering (Pre-Fuse) subpanel, check/uncheck the box labeled Enable Trap Filtering.
a. Check the Enable Trap Filtering box to enable trap filtering.b. Uncheck the Enable Trap Filtering box to disable trap filtering.
3. Click the Save SNMP Trap Settings button at the bottom of the SNMP Trap Settings panel to save your changes.
Note: By default, trap forwarding is disabled.
283

284
Managing Individual Trap Drop Filters
You can enable/disable and add/edit/delete individual trap filters from the Manage Trap Drop Filters page, which is access-ible by clicking the Manage Trap Filters button (via the SNMP Trap Settings panel > Trap Filtering (Pre-Fuse) subpanel).
Trap filters are organized by name, which is in bold at the top of the trap filter’s details. Whether the trap filter is enabled ordisabled will be indicated in parentheses to the right of the trap filter name.
Editable fields on the Manage Trap Drop Filters page include the Filter Name, Trap OID, and Source IP. Traps can befiltered by Trap OID and Source IP. For more information on filtering criteria for the Trap OID and Source IP, see Trap DropFiltering Criteria on page 287.
The details of each trap filter can be expanded/collapsed by clicking the button next to the trap filter name. By default, onlythe first filter will be expanded when the page is initially loaded; all other filters will be collapsed. To expand/collapse thedetails of all trap filters, click Expand All/Collapse All in the upper-left corner.
Adding a New Trap Filter
1. On the Manage Trap Drop Filters page, click the Add a filter link and icon.2. A new filter with its details expanded will display.3. Edit the Filter Name: The Filter Name can be edited by making your changes to the Filter Name text field.

4. Edit the Trap OID: The Trap OID can be specified by making your changes to the Trap OID text field. The Trap OIDfield supports a single wild card in the last position.
For example: 1.3.6.1.4.1.13742.6.*
5. Add/Edit/Delete Source IP address patterns: One or more Source IP address patterns can be specified. Click theAdd button to add a new Source IP address. You can edit or delete Source IP addresses once they have beenadded. Both IPv4 and IPv6 addresses are supported.
a. Add a New Source IP Address Pattern: Click the Add link and icon next to Source IP. A new IP AddressPattern will be added to the box. The default IP displayed will be 0.0.0.0. Click the new IP Address Patternto edit it with your desired IP.
b. Edit a Source IP Address: Simply click the Source IP to edit it. The Trap IP address field supports a singlewild card in the last position.
For example: 10.10.10.*
c. Delete a Source IP Address: Click the IP address pattern to select it, then click the Remove button. TheIP address pattern will be deleted. If no IP address is selected, the Remove button will be grayed out.
6. Optional: To generate a list of PDUs matching your filtering criteria, click the See Matching PDUs button. Formore information on filtering the Trap OID and Source IP, see Trap Filtering Criteria.
7. On the Manage Trap Drop Filter panel, click the Save button to save your changes. 8. Click the Back to SNMP Trap Settings link to return to the SNMP Trap Settings panel.
Editing an Existing Trap Filter
1. On the Manage Trap Drop Filters page, click the trap filter name to expand the filter details.2. Edit the Filter Name: The Filter Name can be edited by making your changes to the Filter Name text field.3. Edit the Trap OID: The Trap OID can be edited by making your changes to the Trap OID text field.4. Add/Edit/Delete Source IP addresses: Existing Source IP address patterns can be edited or deleted, or you can
add a new Source IP. Both IPv4 and IPv6 addresses are supported.
a. Add a New Source IP Address Pattern: Click the Add link and icon next to Source IP. A new IP AddressPattern will be added to the box. The default IP displayed will be 0.0.0.0. Click the new IP Address Patternto edit it with your desired IP.
b. Edit a Source IP Address: Simply click the Source IP to edit it.c. Delete a Source IP Address: Click the IP address pattern to select it, then click the Remove button. The
IP address pattern will be deleted. If no IP address is selected, the Remove button will be grayed out.
5. Optional: To generate a list of PDUs matching your filtering criteria, click the See Matching PDUs button. Formore information on filtering the Trap OID and Source IP, see Trap Filtering Criteria.
6. On the Manage Trap Drop Filter panel, click the Save button to save your changes. 7. Click the Back to SNMP Trap Settings link to return to the SNMP Trap Settings panel.
Deleting an Existing Trap Filter
1. On the Manage Trap Drop Filters page, click the trap filter name to expand the filter details.2. Click the Remove button.3. The trap filter will be deleted.
285

286
4. On the Manage Trap Drop Filter panel, click the Save button to save your changes. 5. Click the Back to SNMP Trap Settings link to return to the SNMP Trap Settings panel.

Trap Drop Filtering Criteria
Incoming traps are discarded or filtered out based on criteria defined in each filter. Filters must be defined for traps to bediscarded.
Traps can be filtered by trap OID and/or IP pattern. Filtering for both the trap OID and the IP address can be based on anexact match or a partial match via wildcard. If both the trap OID and IP address are specified in a filter, then filtering occursonly if the trap matches both criteria.
Power IQ supports a single asterisk (*) as the wildcard character. The wildcard must be the last character of the trap OIDor IP address. If no wildcard is specified, then filtering occurs based on an exact match of the filtering criteria.
For more information, see Managing Individual Trap Drop Filters on page 284.
287

288
Trap Fuse Handling
The trap fuse is a precautionary measure in place to protect Power IQ and guard against performance issues caused by anexcessive amount of incoming traps (a trap storm).
Power IQ receives traps, processes them, and, when applicable, converts the traps into events. The trap fuse is tripped ifthe rate of the incoming traps exceeds the configured threshold. When the trap fuse is tripped, any new traps received willbe discarded until the incoming trap rate drops to an acceptable rate, and the fuse is reset.
By default, the trap fuse is tripped when the sustained incoming trap rate exceeds 15 traps per second for 10 seconds, anda tripped trap fuse will reset (resume processing traps) when the incoming trap rate drops 30% below the configuredtraps/second threshold.
Users with the Site Administrator role can customize the default values for Power IQ’s trap fuse under SNMP Trap Settings> Trap Fuse Settings (Advanced). For more information, see Configuring Trap Fuse Settings on the next page.
Note: The trap rate is recalculated and the fuse state reevaluated every time a trap is received. Therefore, a tripped trapfuse will be reset only after a subsequent trap is received, and the trap rate is determined to have dropped sufficiently.
When the fuse is tripped, Power IQ will create an event indicating that the fuse has been tripped and including the traprate. When the fuse is reset, the event will be cleared.
Note: Although traps from facility items in Maintenance Mode will be dropped (they will not be processed), they will stillimpact the trap fuse and could contribute to the fuse tripping resulting in other traps being dropped.

Configuring Trap Fuse Settings
Power IQ utilizes an event/trap fuse that trips when the rate of traps received exceeds the maximum allowed. Power IQ willstop processing traps until after the fuse has been reset. For more information, see Trap Fuse Handling on the previouspage.
Users with the Site Administrator role can configure trap fuse settings from the SNMP Trap Settings panel.
1. Click Events > Manage SNMP Settings to load a new page with the SNMP Trap Settings panel.2. In the Trap Fuse Settings (Advanced) subpanel, change the default values to your desired values.
a. Trap rate to trigger fuse: The number of traps received per second that is required to trip the fuse. Thedefault is 15 with a maximum of 999.
b. Duration for measuring trap rate: The length of time in seconds over which the number of traps receivedis divided. The default is 10 seconds with a maximum of 300 seconds.
c. Drop in rate to reset fuse: The percentage drop in the rate of traps received to reset the fuse. The defaultis 30%.
289

290
3. Optional: To restore the default values, click the Restore Defaults button.4. Click the Save SNMP Trap Settings button at the bottom of the SNMP Trap Settings panel to save your changes.
Note: Editing these settings is not recommended unless the trap fuse is tripping often. For help with determining theappropriate values for your environment, please contact Sunbird Technical Support.

Enabling/Disabling Event-Based Trap Forwarding
Users with the Site Administrator role can enable/disable trap forwarding from the SNMP Trap Settings panel.
1. Click the Events tab > Manage SNMP Settings to load a new page with the SNMP Trap Settings panel.2. In the Trap Forwarding subpanel, check/uncheck the box labeled Enable Trap Forwarding.
a. Check the Enable Trap Forwarding box to enable trap forwarding.b. Uncheck the Enable Trap Forwarding box to disable trap forwarding.
3. Click the Save SNMP Trap Settings button at the bottom of the SNMP Trap Settings panel to save your changes.
291

292
Configuring Trap Forwarding Destinations
Once trap forwarding is enabled, users with the Site Administrator role are able to configure up to four IP addresses as trapforwarding destinations. Trap destinations must be unique. Both IPv4 and IPv6 addresses are supported.
To enable trap forwarding, select the Enable Trap Forwarding box via the SNMP Trap Settings panel > Trap Forwarding sub-panel.
Note: To edit trap destinations, trap forwarding must be enabled. If trap forwarding is disabled, the trap destinations will begrayed out and will not be editable.
Adding a New Trap Forwarding Destination
1. Click the Events tab > Manage SNMP Settings to load a new page with the SNMP Trap Settings panel.2. In the Trap Forwarding subpanel, click the Add link and icon next to Destinations.3. Destination: A new destination will be added. The default IP displayed will be 0.0.0.0. Click the new destination to
edit it with your desired IP address.4. Port: Click the field under Port to edit the field with your desired port. Power IQ will accept non-standard ports for
this field.5. Community: Click the field under Community to edit the field with your desired community string.6. Click the Save SNMP Trap Settings button to save your changes.

Editing an Existing Trap Destination
1. Click the Events tab > Manage SNMP Settings to load a new page with the SNMP Trap Settings panel.2. In the Trap Forwarding subpanel, click the destination you wish to edit.3. Destination: Click the destination to edit it with your desired IP address.4. Port: Click the field under Port to edit the field with your desired port. Power IQ will accept non-standard ports for
this field.5. Community: Click the field under Community to edit the field with your desired community string.6. Click the Save SNMP Trap Settings button to save your changes.
Deleting an Existing Trap Destination
1. Click the Events tab > Manage SNMP Settings to load a new page with the SNMP Trap Settings panel.2. In the Trap Forwarding subpanel, click the destination you wish to delete to select it. If no destination is selected,
the Remove button will be grayed out.3. Click the Remove button. The destination will be removed.4. Click the Save SNMP Trap Settings button to save your changes.
293

294
Managing Individual Trap Forwarding Filters
Users with the global Site Administrator role can enable/disable and add/edit/delete individual trap forwarding filters fromthe Manage Trap Forwarding Filters page, which is accessible by clicking the Manage Forwarding Filters button (in theTrap Forwarding subpanel of the SNMP Trap Settings panel).
When a trap is received, Power IQ will convert the trap and generate an event. If trap forwarding is enabled and the criteriafor forwarding traps is defined, Power IQ will evaluate the event against the defined criteria. If the event matches the cri-teria, Power IQ will forward the original trap that generated the event.
The following severity and source criteria can be defined for trap forwarding filters:
l Severity: Available options include Critical, Warning, and/or Information.l Source: Available options include PDU, Inlet, Transfer Switch, UPS, Circuit Breaker, Circuit, Outlet, Environmental
Sensor, Asset Strip, Door, and/or Dynamic Plugin.
At least one selection each must be made for Severity and Source. The event must match both the Severity and Sourcecriteria for the underlying trap to be forwarded.
Trap forwarding filters are organized by name, which is in bold at the top of the filter’s details. Whether the trap forwardingfilter is enabled or disabled will be indicated in parentheses to the right of the filter name.
The details of each trap forwarding filter can be expanded/collapsed by clicking the button next to the trap filter name. Bydefault, only the first filter will be expanded when the page is initially loaded; all other filters will be collapsed. To expand/-collapse the details of all trap filters, click Expand All/Collapse All in the upper-left corner.

Adding a New Trap Forwarding Filter
1. On the Manage Trap Forwarding Filters page, click the Add a filter link and icon.2. A new filter will display with its details expanded.3. Edit the Filter Name: The Filter Name can be edited by making your changes to the Filter Name text field.4. Select the Severity: Check/uncheck the boxes to select/deselect the appropriate Severity. Multiple boxes can be
checked.
295

296
5. Select the Source: Check/uncheck the boxes to select/deselect the appropriate trap Source. Multiple boxes canbe checked.
6. On the Manage Trap Drop Filter panel, click the Save button to save your changes. 7. Click the Back to SNMP Trap Settings link to return to the SNMP Trap Settings panel.
Editing an Existing Trap Forwarding Filter
1. On the Manage Trap Forwarding Filters page, click the trap filter name to expand the filter details.2. Edit the Filter Name: The Filter Name can be edited by making your changes to the Filter Name text field.3. Select the Severity: Check/uncheck the boxes to select/deselect the appropriate Severity. Multiple boxes can be
checked.4. Select the Source: Check/uncheck the boxes to select/deselect the appropriate trap Source. Multiple boxes can
be checked.5. On the Manage Trap Drop Filter panel, click the Save button to save your changes. 6. Click the Back to SNMP Trap Settings link to return to the SNMP Trap Settings panel.
Deleting an Existing Trap Forwarding Filter
1. On the Manage Trap Forwarding Filters page, click the trap filter name to expand the filter details.2. Click the Remove button.3. The trap filter will be deleted.4. On the Manage Trap Drop Filter panel, click the Save button to save your changes. 5. Click the Back to SNMP Trap Settings link to return to the SNMP Trap Settings panel.

Trap Queue Handling
Power IQ 6.0.2 introduces improvements to how SNMP traps are processed, including new configuration options for hand-ling the trap backlog (the queue of traps to be processed). Once the maximum trap backlog queue size has been reached,trap handling will be disabled, the trap backlog will be processed, and incoming traps will be dropped until the backlogqueue size has dropped to within the specified trap backlog recovery percentage. At that point, new incoming traps willonce again be added to the queue for processing.
The following options are configurable via the database:
l trap_handling_pool_threads_per_core (default: 5)l trap_max_backlog_threshold_per_core (default: 500)l trap_backlog_threshold_warning_percentage (default: .50)l trap_backlog_threshold_critical_percentage(default: .80)l trap_max_backlog_recovery_percentage (default: .15)
New events and audit log messages have been added for cases when the trap handling queue is backlogged or if traps arebeing dropped because the backlog threshold is exceeded.
The table below summarizes the trap queue handling events and audit log messages:
Description Event Name EventText
EventSummary
AuditLog Mes-sage
When the trap backlog statetransitions from NORMAL orCRITICAL to WARNING, a warn-ing event is generated.
trapHandlingBacklogWarningTrapbacklogwarning
Trap backlogwarningthresholdexceeded.
Trap backlogwarningthresholdexceeded.
When the trap backlog statetransitions from WARNINGtoNORMAL, a clearing event isgenerated.
trapHandlingBacklogWarningClear N/A N/A
Trap backlogstate hasreturned tonormal.
When the trap backlog statetransitions from NORMAL orWARNINGto CRITICAL, a crit-ical event is generated.
trapHandlingBacklogCriticalTrapbacklogcritical
Trap criticalthresholdexceeded.
Trap backlogcriticalthresholdexceeded.
When the trap backlog statetransitions from CRITICAL toNORMAL, a clearing event isgenerated.
trapHandlingBacklogCriticalClear N/A N/A
Trap backlogstate hasreturned tonormal.
When the trap backlog reachesthe maximum permitted trap trapHandlingHaltedDueToBacklog
Traphandling
Trap handlingtemporarily
Trap hand-ling tem-
297

298
Description Event Name EventText
EventSummary
AuditLog Mes-sage
backlog size, a critical event isgenerated.
halteddue tobacklog
halted due totrap backlog.
porarily hal-ted due totrap backlog.
If a trapHand-lingHaltedDueToBacklog eventis active, when the trap backlogdrops below the maximum trapbacklog recovery percentage, aclearing event is generated.
trapHand-lingHaltedDueToBacklogClear
N/A N/A
Trap hand-ling backloghas beencleared suf-ficiently toresume trapprocessing.
Note: Contact Sunbird Technical Support for assistance with modifying the trap backlog threshold values.
Note: Clearing events simply clear active events but are not persisted as events in Power IQ.

Configuring Event (Trap) Notification Settings for APCDevices
This topic provides instructions for how to configure APC devices (including APC Netbotz devices and Rack PDUs) thatsupport repeating and non-repeating modes for sensor threshold traps so that the devices work most effectively withPower IQ.
All sensor threshold-related event (trap) notifications should be configured via the APC web user interface with the fol-lowing settings:
l Event notification repeating should be disabledl All critical threshold event notifications should be configured with a five-second delayl All warning threshold event notifications should be configured with a zero-second delay
These recommendations eliminate the possibility of race conditions that affect trap reception in Power IQ. With these set-tings, if a sensor state changes, Power IQ should receive and process the traps in the correct order. In this case, if a sensorstate changes from normal to critical, Power IQ should receive the warning trap before the critical trap.
The APC web user interface provides two options for configuring event notification settings:
l Configure by event: Configure settings for an individual event. For more information, see Configuring Notificationsby Individual Event on the facing page.
l Configure by group: Configure settings for a group of events. For more information, see Configuring Notificationsby Event Group on page 305.
299

300
Configuring Notifications by Individual Event
To configure notifications for an individual event in the APC web user interface:
1. Select the Administration tab > Notification on the top menu bar > Event Actions in the left navigation bar > by event.The main (right) pane displays the Event Actions for Individual Events page, which lists event categories and sub-cat-egories.
2. In the main pane under Devices, select Sensor to display the sensor sub-category events.
3. Click the name of an event notification to view or change its current configuration.
Note: In these example screenshots, the critical event Rack PDU: Maximum temperature threshold violation is selected.

4. Under Trap, choose a trap receiver to view or configure its notifications for the selected event.
Note: You must have at least one trap receiver configured to select this option.
301

302
5. The Event Notification Parameters page for the trap receiver displays.

Set the following parameters:
Event Para-meter Description Configuration for Power IQ
Delay x timebefore sending
If the event persists for the specified time, a noti-fication is sent.
If the condition clears before the time expires,no notification is sent.
Set parameter checkbox to checked.
Set parameter to 5 seconds for criticalthreshold event notifications.
Set parameter to 0 seconds for warningthreshold event notifications.
Repeat at an inter-val of x time
The notification is sent at the specified interval.
Set parameter checkbox to unchecked to dis-able repeating.
Up to x times During an active event, the notification repeats Disabled when repeating is disabled. No con-
303

304
Event Para-meter Description Configuration for Power IQ
for this number of times. figuration required.
Until conditionclears
The notification is sent repeatedly until the con-dition clears or is resolved.
Disabled when repeating is disabled. No con-figuration required.
6. Click Apply to save your changes.

Configuring Notifications by Event Group
To configure notifications for a group of events:
1. Select the Administration tab > Notification on the top menu bar > Event Actions in the left navigation bar > by groupunder Event Actions. The main (right) pane will display the Event Actions for Groups of Events page, which lists options forgrouping event actions.
2. In the main pane, choose Events by Severity and select select the severity level to be configured.
Note: The severity levels include: Critical, Warning, and Informational events. In these example screenshots, the optionfor All Critical Events has been selected.
3. Click Next>> to proceed.
4. On the Group Event Actions page, select Trap Receivers under Event Actions.
Note: You must have at least one trap receiver configured to select this option.
305

306
5. Click Next>> to proceed.
6. Under Event Action: Trap, choose a trap receiver to configure its notification parameters for the selected group ofevents.

7. Under Notification Parameters: Trap, select Enable Notifications.
307

308
Set the following parameters:
Event Para-meter Description Configuration for Power IQ
Delay x timebefore sending
If the event persists for the specified time, a noti-fication is sent.
If the condition clears before the time expires,no notification is sent.
Set parameter checkbox to checked.
Set parameter to 5 seconds for criticalthreshold event notifications.
Set parameter to 0 seconds for warningthreshold event notifications.
Repeat at an inter-val of x time
The notification is sent at the specified interval.
Set parameter checkbox to unchecked to dis-able repeating.
Up to x times During an active event, the notification repeats Disabled when repeating is disabled. No con-

Event Para-meter Description Configuration for Power IQ
for this number of times. figuration required.
Until conditionclears
The notification is sent repeatedly until the con-dition clears or is resolved.
Disabled when repeating is disabled. No con-figuration required.
8. Click Next>> to proceed.
9. Select whether to leave the newly configured event action enabled for this group of events or to disable the action.
309

Chapter 8:User Configuration
You can add both LDAP and locally authenticated users. All user permissions are authorized locally.
310

Change the Administrator Username and Password
Administrators can change the default admin account username and password. It is important to change the defaultadmin account password as soon as possible. This helps prevent unauthorized administrator access to Power IQ.
The password must follow the requirements selected in Settings > Password Requirements. See Configuring PasswordRequirements.
To change the admin user name:
1. Select the Settings tab > User Accounts (Under the Authorization and Authentication section). A list of all the useraccounts created for the system will display.
2. Click the admin user to view the user information for the admin account.3. Click Edit for the admin user.4. In the Login field, type the desired user name.5. Click Save.
Note: Even if the default admin username has been changed, the password will still work.
To change the admin password:
1. Select the Settings tab > User Accounts (Under the Authorization and Authentication section). A list of all the useraccounts created for the system will display.
2. Click the admin user to view the user information for the admin account.3. Click the Change Password link.4. In the Change Password dialog, type the desired password.5. Click the OK button.
311

312
Note: If your are logged in as the admin, you can also change your password by clicking on the admin username link inthe top right corner to access the user information for the admin account, and then clicking the Change Password link.

Adding, Editing, and Deleting Users
Add a User
1. In the Settings tab, in the Authorization and Authentication panel, click the User Accounts link.2. Click the Add User link. A blank user information page opens.3. Enter the Common User Information.4. Enter a username with at least 3 characters, but not more than 40 characters. Required.5. Enter the user's first name, last name, and email address.6. Required Password and Confirm Password: Enter a password for this user. Default password strength requires at
least 8 characters, including one numerical character, one uppercase character, one lowercase character, andone of the following special characters: ~!@#$%^&*()_+{ } | :"<>?/.,';] [=-` "). See Configuring Password Require-ments).
7. In the Description field, enter comments about the user. Optional.8. Click the Create User button to create the user.
Edit a User
1. In the Settings tab, in the Authorization and Authentication panel, click the User Accounts link.2. In the User Accounts panel, click the blue username login link for the user you want to edit.3. In the User Information panel, click the Edit button. The panel will display the fields that can be edited.4. Edit the information as needed.
l Login: 3 characters minimum. 40 characters maximum.l First Name: 1 character minimum.l Last Name: 1 character minimum.
313

314
l Email: Must contain a correctly formatted email address.l Description: Optional
5. Make any changes to the roles and groups assigned to the user. For more information, see Assigning Roles forUser Permissions on page 341.
6. Click the Save button to save your changes.
Delete One or Multiple User(s)
1. In the Settings tab, in the Authorization and Authentication panel, click the User Accounts link.2. In the User Accounts panel, click the checkbox next to the user you want to delete. You can check multiple check-
boxes to select multiple users.

3. Click the Remove Users link.
4. A confirmation popup will appear with the following message: "Remove these users?All data, roles, scheduledtasks and public shared dashboards and reports, possibly used by other users, for these Power IQ users will bedeleted."
5. Click the Delete Users button in the popup to delete the selected users or click the Cancel button to abort.6. Upon successful deletion, the User Accounts list will refresh with the deleted users removed.
315

316
Configuring the LDAPServer Settings
The LDAP server settings enable Power IQ to connect to your LDAP server.
Note: Power IQ version 7.2.0 introduced support for One Time Passwords via LDAP. Prior releases required issuing 2requests to authenticate a user, one to authenticate and one to gather the user's details. As a result the second requestfailed if the user was flagged with a One Time Password. In Power IQ 7.2.0 and beyond a single request is issued whichwill both authenticate the user as well as gathering the user's details.
Gather Active Directoryand LDAP Server Configuration InformationYou need the information listed below in order to configure Active Directory and/or LDAP servers in Power IQ. You shouldgather this information before beginning the add server process in Power IQ..
Two worksheets are provided below: one to help you gather Active Directory information and another to help you gatherthe LDAP information. Use the worksheet that applies to your needs.
If you are not familiar with this information, ask your LDAP administrator to help you gather it.
For additional information please see the Power IQ LDAP Feature video demonstration.
Microsoft® Active Directory Server Information
Server Domain (for Active Directory), or server hostname or IP address:
Portencryp-tion type:
TLS SSL No Encryption
Port - encrypted defaults to Port 636, no encryption defaults toPort 389, but the port can be changed.
Other (if applic-able):
The Bindtype oftheserver:
Standard Bind Configure Anonymous Bind
The Base DN (this is where the search for users starts):
Base DNLoginNameAttribute:
sAMAccountName(default)
Other (if applic-able):

Microsoft® Active Directory Server Information
Search Filter (if applicable):
Searchscopeobject fil-ters (ifapplic-able,chooseone):
The Base DN and onelevel below the Base DN.("One" is the option inGUI.)
The Base DN and the entire subtree below.("Subtree" is the option in the GUI)
Searchcre-dentials(chooseone):
No search credentials;user credentials providedat login are used
AnonymousAdmincre-dentials
AdminDN andAdminpass-word, ifsearchscoperequiresAdmincre-dentials.
Admin Credentials:Admin Pass-word:
Group search DN (ifapplicable):
Group IDattribute,such asname (ifapplic-able):
sAMAccountName(default)
Other:
Groupmemberattribute(if applic-able):
Member (default) Other:
317

318
Microsoft® Active Directory Server Information
Groupsearch fil-ter:
(objectClass=group)(default)
Other:
LDAP Server Information
Server Hostname or IPAddress:
PortEncryp-tion Type:
TLS SSL No Encryption
Port - encrypted defaults to Port 636, no encryptiondefaults to Port 389, but the port can be changed.
Other (if applic-able):
The BindType oftheserver:
Anonymous Bind Standard Bind
The Bind Base DN (this is where the search for usersstarts):
LoginNameAttribute:
uid (default)Othe-r:
Search Filter (ifapplicable):
SearchScope (ifapplic-able):
The Base DN and one levelbelow the Base DN. ("One"is the option in GUI.)
The Base DN and the entire sub-tree below. ("Subtree" is the optionin the GUI)
SearchCre-dentials(chooseone):
No search credentials; usercredentials provided atlogin are used
AnonymousAdmincre-dentials

LDAP Server Information
AdminDN andAdminpass-word, ifsearchrequiresAdmincre-dentials:
Admin Credentials:Admin Pass-word:
Group search DN (ifapplicable):
Group IDattribute.
gidNumber (default) Other:
Groupmemberattribute(if applic-able):
memberUid (default) Other:
Groupsearch fil-ter:
(objectClass=posixGroup)(default)
Other:
Add a Remote Server
1. Click Add Server on the LDAP Servers page.
319

Complete the fields in each section that apply to your specific needs. Use the configuration information you gatheredearlier to complete each section.
Note: Configuration settings vary slightly between Active Directory and LDAP.
Active Directory Server Configuration in Power IQ
General Information
321

322
1. Select Active Directory Server as the server type.
2. Select the order in which the server will be listed in the LDAP Servers table. This dictates the order in which Power IQcommunicates with the servers when multiple servers are configured.
3. Select the Active checkbox to enable the server, or leave it deselected and return to activate it at a later time. It mustbe active in order to be in use.
The information you enter in the remaining sections is specific to the server type you are configuring: either Active Dir-ectory or LDAP.
For this reason, Active Directory and LDAP settings are broken out into two sections on this page: Active Directory ServerConfiguration in Power IQ and LDAP Server Configuration in Power IQ
Scroll down the page to view LDAP setting instructions.
Connection Information
4. Domain - applies if Active Directory only. The domain name of the server.
5. Use Host - select if you want to use a specific hostname or IP Address to access the Active Directory server.
6. Hostname/IP Address - enter the Active Directory server's hostname or IP address if Use Host is selected.
7. Use TLS/SSL - select if using TLS/SSL encryption.
8. Port - the default is Port 389 if TLS/SSL encryption is not enabled, and Port 636 is the default if TLS/SSL encryption isenabled. The port number can be edited to a different value, if necessary.

(Optional) Manage Certificates
9. If you need to validate certificates, select Check Server Certificate.
10. Next, click the Manage Certificates link to open the Trusted Certificates page.
11. Click Import Certificate to open the Import Trusted Certificate page.
12. Click on the "Choose File" text box to open your browser to locate the certificate, then click Import to import the cer-tificate.
You can use the Back button in your browser to return to the Add LDAP Server page.
323

324
Bind InformationThe information entered here identifies where searches are performed to locate users on the server.
13. Base DN - specify a Base DN (directory level/entry) under which the authentication search query will begin. Power IQcan do a recursive search downward from this Base DN..
For example, depending on the scope of the search, if the Base DN is dc=sunbird,dc=com, the search query for the userentry will be made over the whole directory structure.
If the Base DN is cn=Administrators,cn=Users,dc=sunbird,dc=com, the search query will begin in the Administrators sub-directory (entry).
14. Login Name Attribute - the login name that corresponds to the server type. The default for Active Directory is sAMAc-countName.
15. Search Filter - enter a user's attributes in this field if you want the search query to be restricted to only those entriesthat meet the criteria. The default for Active Directory is (objectClass=user).
16. Search Scope - level of the server directory to look for users; either the Base DN and one level below the Base DN, orthe Base DN and the entire subtree below.
17. Follow Referrals - select this option to allow the Power IQ LDAP client to follow referrals provided by the LDAP server ifreferral objects are encountered.
18. Search Credentials:
n Leave "no search" to use the credentials provided by the user on log in.
n Select "anonymous" if no credentials are required.
n Select "use admin credentials" and enter the admin user credentials in the Admin DN and Admin Password fields.The admin credentials will be used for the service account when conducting searches.
Groups Information
19. User Groups for Authorization and Common Setting – ‘Sync Group Members’ will be used to enable the ability to auto-matically add and manage users from imported user groups.

20. Use Group Search DN - select to specify the group DN to search. Select this option if the group DN search is differentthan the search used for users.
21. Group Search DN - this is where the search for the user group will begin in the directory.
22. Group ID Attribute - the default for Active Directory is sAMAccountName.
23. Group Member Attribute - the default for Active Directory is member.
24. Group Search Filter - the default for Active Directory is (objectClass=group).
25. Group Search Scope - level of the server directory to look for groups; either the Base DN and one level below the BaseDN, or the Base DN and the entire subtree.
26. Optional Test Connection is to test with an account. If you have a known, valid test account to use to test the serversetup, you can test from here without having to try to login with that account.
27. Click Save to save the settings and add the server.
Once added, the server is listed on the Add LDAP Server page.
325

326
LDAPServer Configuration in Power IQ
General Information
1. Select LDAP Server as the type.
2. Select the order in which the server will be listed on the LDAP Servers table. This dictates the order in which Power IQcommunicates with the servers when multiple servers are configured.
3. Select the Active checkbox to enable the server, or leave it deselected and return to activate it at a later time. It mustbe active in order to be in use.
The following steps describe LDAP settings you configure. Scroll up to view Active Directory settings if you are configuringan Active Directory server.
Connection Information
4. Domain - does not apply to LDAP.
5. Use Host - select to use a specific hostname or IP address to access the LDAP server.
6. Hostname/IP Address - enter the LDAP server's hostname or IP address when Use Host is selected.
7. Use TLS/SSL - select if using TLS/SSL encryption.
8. Port - the default is Port 389 if TLS/SSL encryption is not enabled, and Port 636 is the default if TLS/SSL encryption isenabled. The port number can be edited to a different value, if necessary.

(Optional) Manage Certificates
9. If you need to validate certificates, select Check Server Certificate.
10. Next, click Manage Certificates to open the Trusted Certificates page.
11. Click Import Certificate to open the Import Trusted Certificate page.
12. Click on the "Choose File" text box to open your browser to locate the certificate, then click Import to import the cer-
327

328
tificate.
You can use the Back button in your browser to return to the Add LDAP Server page.
Bind InformationThe information entered here identifies where searches are performed to locate users on the server.
13. Base DN - specify a Base DN (directory level/entry) under which the authentication search query will begin. Power IQcan do a recursive search downward from this Base DN.
For example, depending on the scope of the search, if the Base DN is dc=sunbird,dc=com, the search query for the userentry will be made over the whole directory structure.
If the Base DN is cn=Administrators,cn=Users,dc=sunbird,dc=com, the search query will begin in the Administrators sub-directory (entry).
14. Login Name Attribute - login name that corresponds to the server type. The default is the user ID.
15. Search Filter - enter a user's attributes in this field so the search query will be restricted to only those entries that meetthis criterion. The default is (objectClass=inetOrgPerson).
16. Search Scope - level of the server directory to look for users; either the Base DN and one level below the Base DN, orthe Base DN and the entire subtree below.
17. Follow Referrals - select this option to allow the Power IQ LDAP client to follow referrals provided by the LDAP server ifreferral objects are encountered.
18. Search Credentials - leave "no search" selected if no search is required.
n Select "anonymous" if no credentials are required.
n Select "use admin credentials" and enter the Admin DN username and Admin Password. These credentials willbe used for the service account when conducting searches.

Groups Information
19. User Groups for Authorization and Common Setting – ‘Sync Group Members’ are used to enable automatically addingand managing users from imported user groups.
20. Use Group Search DN - select to specify the group DN to search. Select this option if the group DN search is differentthan the search used for users.
21. Group Search DN - this where the search for user groups will begin in the directory.
22. Group ID Attribute - the default is gidNumber.
23. Group Member Attribute - the default is memberUid.
24. Group Search Filter - the default is(objectClass=posixGroup).
25. Group Search Scope - level of the server directory to look for groups; either the Base DN and one level below the BaseDN, or the Base DN and the entire subtree.
329

330
26. Optional Test Connection is to test with an account. If you have a known, valid test account to use to test the serversetup, you can test from here without having to try to login with that account.
27. Click Save to save the settings and add the server.
Once added, the server is listed on the Add LDAP Server page.
Search for Remote Usersand/or User Groupsand Add Them to Power IQ
1. On the Add LDAP Server page, click Search.
The Search for LDAP Users and Groups page opens.
2. Select the server you want to search.
The remaining server information is completed based on the server you selected earlier, or you can edit the information byentering a new server to search.
3. Select the type of search - Users or Groups, depending on how the server is configured in Power IQ.
4. Select the Follow Referrals checkbox, if desired.

5. Search Scope is prepopulated based on the scope you defined when adding the server.
You can change the scope of the search, if desired.
This is the level of the server directory to look for users or groups. You can search just the Base DN by selecting "Base",search the Base DN and one level below the Base DN by selecting "One", or search the Base DN and the entire subtree byselecting "Subtree".
6. Click Search to locate users or user groups on the server.
7. A list of results is displayed once found. You can now add users and/or groups to Power IQ from those found.
To add users or groups found in an LDAP search, select the checkbox next to each user and/or user group in the list, thenclick Add.
In order to search and add user groups, the ‘Use Groups for Authorization’ option must be enabled on the Server page.
When searching for and adding user groups, one or more groups can be selected at a time. The users will not be auto-matically added unless the Common Settings – ‘Sync Group Members’ is enabled.
331

332
When searching for and adding user groups, clicking on a user group causes the group members to be listed below theuser group grid. One or more group members can be selected to be added.

Successfully added users/user groups are listed as "Exists as LDAP user" and the checkbox next to the name is removed.
Once added, individual users are granted distinct permissions and authenticated on a per user basis.
Users in user groups are granted common access to specific features or functionality.
Any changes you make to a user or user group on the server are reflected in Power IQ. For example, if you delete a userfrom a user group, they are no longer able to access the features they previously could in Power IQ.
Edit User Information and Configure Power IQ Login CredentialsThis information can be edited and configured now or at a later time.
8. To edit user information or login credentials, navigate to Settings > User Accounts.
333

334
You can easily identify users added via LDAP since the LDAP DN field is populated in their row.
9. Click on a user's name to open their User Information page.
10. Click Edit on the User Information page.
11. All editable fields are activated.

12. Login is required and must contain the username. 3 characters minimum. 40 characters maximum.
Important: If authentication is required by your email system, the Power IQ username must be the same as the user'semail account username*. If the usernames do not match, emails cannot be successfully sent from Power IQ.
For example, if the username assigned to an email account is jqpublic, the Power IQ username must be jqpublic.
If authentication is not required by your system, usernames do not have to match.
13. Required Mail is required and must contain a correctly formatted email address.
Note: Account username refers to the username assigned to the email account; it does not refer to the name portion ofthe user's email address. Typically, the username and name portion of an email are the same, but this may not be thecase.
Configure Common Server Settings
335

336
Power IQ allows you to configure common settings that control the number of users and/or user groups returned in asearch. This feature also allows you to enable LDAP syncing. LDAP syncing controls the interval between when Power IQand the LDAP server are synchronized.
There are several times when group synchronization will occur. Note that in each of these scenarios both the "Sync GroupMembers" option found on the Common Settings page and the "Use Groups for Authorization" option found on the Set-tings page for each individual server must be enabled. If either of these options is not enabled, group synchronization willnot occur.
Group Synchronization occurs:
l During periodic sync as determined by the Sync Interval defined in Common Settingsl When performing a manual sync by clicking the "Sync Now" button in Common Settingsl When a new user that does not exist in Power IQ but does exist in LDAP/AD logs into Power IQ for the first time
When an existing Power IQ user logs in, his groups are not automatically synchronized. Groups for existing users will besynchronized during the next manual or periodic sync. The user information for existing users (Name, Email) however isupdated each time the user logs into Power IQ.
1. Click Common Settings on the Add LDAP Servers dialog opens.
The Editing Common LDAP Settings page opens.
2. Select Enabled to enable the Power IQ LDAP client
3. Select the Max Search Results from the drop-down.
4. Select the Enable LDAP Sync checkbox to enable LDAP server syncing.
5. When "Sync Group Members" and "Use Groups for Authorization" are enabled, users will be added to Power IQ auto-matically or removed from Power IQ once the user groups are imported into Power IQ.
6. Select the Synch Interval from the drop-down. Updates will be made whenever a user logs in or the specified syncinterval whichever comes first.
7. To sync immediately, click Save and then click Sync Now.

8. Click Save to save the settings. You can use the Back button in your browser to return to the Add LDAP Server page.
9.
Enable or Disable LDAP in Power IQThis enables or disables LDAP support in dcTrack. It does not enable or disable a specific LDAP server.
1. If LDAP is disabled, click the "LDAP is disabled" button to enable it.
2. Once enabled, the button changes to "LDAP is enabled". Click the button again to disable LDAP.
Delete an LDAP Server
1. Click the Xlink in the row of the LDAP server you want to delete.
337

Adding, Editing, and Deleting User Groups
Default User Groups
There are two default user groups, All Users and Site Administrators.
The All Users group contains every user you add to Power IQ, and has the View role assigned to it.
The Site Administrators group contains the Admin user, and has the Site Administrator role assigned to it. The Site Admin-istrator role allows users to do all tasks in Power IQ.
You can change the roles assigned to both groups.
339

340
Limiting View Permissions
By default in Power IQ, all users are assigned to a group called All Users. You cannot remove users from this group.
The All Users group includes the View role by default. If you wanted to limit the viewing permissions of your users, you mustremove the View role from the All Users group.
Your users will need to be assigned view permissions in some other way. There are several ways to do this.
Make sure each user is in a group with the View role assigned at the appropriate EDM node.
Make sure each user is in a group with another role assigned that includes View permissions, such as Operator.
Assign the View role, or another role that includes View permissions, such as Operator, directly to the user.

Assigning Roles for User Permissions
Power IQ Role Definitions
Assign these roles to users or user groups to allow the permissions for operations within Power IQ.
You can assign any role to apply globally, meaning access to perform the tasks will be granted for every object in PowerIQ.
Example
A user assigned a global Power Control role can perform power control on any PDU or IT device, no matter where it is inthe enterprise data model.
See Assign Roles to a User Group on page 346 and Assign Roles to a User on page 344.
Or, you can assign the Administrator, Operator, View, and Power Control roles to apply only to a certain object in yourenterprise data model, such as a rack. See Assign Roles within a Data Center on page 348. When these roles areassigned to the user or user group directly at the EDM-node-level via the Data Centers tab, the permission allowed will belimited to the selected enterprise data object, and all levels beneath it.
Role Tasks Applies To
Site Administrator
The Site Admin-istrators group isassigned this role bydefault, and containsthe Admin user.
"Super user"
Every task in Power IQ.
Full permissions to Settings tab.
Full permissions to Dashboards tab.
Full permissions to create Tags in theReports tab, and to tag nodes in theEDM.
Full permissions of View, Power Con-trol, Door Control, Create Reports andDashboards, and Event Manager.
Power IQ
Global only.
Administrator
Administrator role includes the per-missions of View, Power Control,Create Reports and Dashboards,and Event Manager.
Full permissions to Dashboards tab.
Permission to tag nodes in the EDM.
Excludes the Settings tab, otherthan personal user profile settings.
Global, when applied in Settings > Authorization &Authentication > User Accounts page.
Selected EDM node and down, when applied inData Centers tab. NOTE: Applying Administratorin the Data Centers tab also excludes permissionto view the Analytics tab and the Events tab.
Operator Operator role includes the permissions Global, when applied in Settings > Authorization &
341

342
Role Tasks Applies To
of View and Door Control.
View permissions to Dashboards tabreports; upload drawing permission forFloor Maps in Dashboards tab.Excludes creating reports in Dash-boards tab.
Permission to tag nodes in the EDM.
Excludes the Settings tab other thanpersonal user profile settings, PowerControl, Door Control, Create Reportsand Dashboards, and Event Manager.
Authentication > User Accounts page.
Selected EDM node and down, when applied inData Centers tab
View
View role has permission to:
View EDM in the Data Centers tab.
View EDM nodes in Floor Maps.
View data from EDM nodes in Reportstab.
View door smart pages.
View all other tabs in Power IQ with theexception of the Events tab
View personal user profile settings inthe Settings tab.
Global, when applied in Settings > Authorization &Authentication > User Accounts page.
Selected EDM node and down, when applied inData Centers tab
Power Control
Power Control role has permission to:
Power control.
Create device groups.
View devices, device groups, PDUs,Data Centers tab, and Dashboards tab.
Global, when applied in Settings > Authorization &Authentication > User Accounts page.
Selected EDM node and down, when applied inData Centers tab
See Permissions for Power Control on a DeviceGroup on page 349 for details on this task.
Door ControlDoor Control role has permission to:
Lock/Unlock doors.
Global, when applied in Settings > Authorization &Authentication > User Accounts page.
Selected EDM node and down, when applied inData Centers tab.
Individual doors.
View Tag GroupsView Tag Groups role has permissionto:
Global, when applied in Settings > Authorization &Authentication > User Accounts page.

Role Tasks Applies To
View Tags and Tag Groups.Selected EDM node and down, when applied inData Centers tab.
Create Analytics
Create Analytics role has permissionto:
Create reports and charts in the Ana-lytics tab.
Global only, applied in Settings > Authorization &Authentication > User Accounts page.
The information a user can include or view in areport or chart is based on View permissions.
A user with this role also needs the View role, oranother role that includes View permission.
Create Dashboards
Create Dashboards role has per-mission to:
Create dashboards in the Dashboardstab.
Global only, applied in Settings > Authorization &Authentication > User Accounts page.
The information a user can include or view in adashboard is based on View permissions.
A user with this role also needs the View role, oranother role that includes View permission.
Create Event Noti-fications
Create Event Notifications role has per-mission to:
View the Manage Event Notificationsscreen.
Create event notification filters.
Global only, applied in Settings > Authorization &Authentication > User Accounts page.
A user with this role also needs the Event Man-ager role to view the Events tab.
Event Manager
Event Manager role has permission to:
View the Events tab.
View and clear events.
View events in the Smart views.
View Floor Maps in the Dashboard.
Global only, applied in Settings > Authorization &Authentication > User Accounts page.
Keypad PIN"Keypad PIN" role has the permissionto create or change their own KeypadPIN code.
Global only, applied in Settings > Authorization &Authentication > User Accounts page.
343

344
Assign Roles to a User
Roles assigned to groups or users in the Settings tab give permissions that apply to all Data Centers, PDUs and Devices inPower IQ. These are sometimes referred to as "global" roles.
You can also assign the Administrator, Operator, Power Control, and View roles to a user or user group, but limit the role toonly a specific level of a data center. To limit the permission, assign the role in the Data Centers tab, in the Permissionssection of the data center level the role should cover. See Assign Roles within a Data Center.
You must be assigned the Site Administrator role to assign roles.
1. In the Settings tab, click User Accounts. Select a user then click Edit.2. In the User Roles section, select roles in the drop-down list, then click Add to assign the permission to the user.
Roles assigned to the user appear in the list.
Users can perform the tasks allowed by the roles assigned.

Remove Roles from a User
1. Click Settings.2. Click User Accounts.3. Select a user and click Edit.4. In the User Roles list, select a role, then click Remove. The user can no longer perform the tasks allowed by the
role.
345

346
Assign Roles to a User Group
Roles assigned to users or user groups in the Settings tab give permissions that apply to all Data Centers, PDUs andDevices in Power IQ.
You can also assign the Administrator, Operator, Power Control, and View roles to a user or user group, but limit the role toonly a specific level of a data center. To limit the permission, assign the role in the Data Centers tab, in the Permissionssection of the data center level the role should cover. See Assign Roles within a Data Center.
You must be assigned the Site Administrator role to assign roles.
1. In the Settings tab, click User Groups.2. Select a user group, then click Edit.3. In the Group Roles section, select roles in the drop-down list, then click Add to assign the permission to the group.
Roles assigned to the group appear in the list.4. Users can perform the tasks allowed by the roles assigned to the group.

Remove Roles from a User Group
1. In the Settings tab, click User Groups.2. Select a user group then click Edit.3. Select a role, then click Remove. Users in the group can no longer perform the tasks allowed by the role.
OR
1. In the Settings tab, click User Groups.2. Select a user group then click Edit.3. In the Group Roles section, click Empty.
347

348
Assign Roles within a Data Center
You can control what individual users or user groups can see and do in Power IQ at each level in each data center. Per-missions extend to levels nested below the selected level.
You can also assign global permissions for users and user groups for all levels of all data centers in Power IQ, and to PDUsnot mapped into a data center. See Assign Roles to a User and Assign Roles to a User Group .
Permissions are included in different roles that you assign.
You must be assigned the Site Administrator role to assign roles.
1. In the Data Centers tab, select a data center level, such as a rack. The details page opens. At the Rack and PDUlevels, the Smart Rack or Smart PDU view opens. See Smart Rack View and Smart PDU View
2. Permissions are accessed differently for Racks and PDUs than all other enterprise data model levels. l For Data Centers, Rooms, Aisles, and Rows, use the Permissions section in the Data Centers tab to view or
assign roles.l For Racks, click Configure Rack Details in the Smart Rack view to open a dialog that contains permissions
settings.l For PDUs, click Configure PDU Details in the Smart PDU view to open a dialog that contains permissions
settings.3. Click Add Role to > Add User Role or Add Role to > Add Group Role. Adding a Group Role will give permissions
selected to all users in the group. Then, select the user or group who needs permission to this object. level of thedata center.
4. Select the role to allow in the Roles list. Click OK.

Permissions for Power Control on a Device Group
To perform power control operations on a device group, your permissions must satisfy one of the following.
l You have the global power control role.
OR
l You are the creator of the device group AND you have the power control role assigned within the Data Centers tabfor every device in the device group.
349

Chapter 9:Dashboard
The Power IQ dashboard allows each user to customize collections of charts and widgets in a single view. You can createmultiple versions of your dashboard and select which one to view, or start a slideshow for all or selected dashboards.
The default dashboard configuration includes two rows. The top row includes a health chart that shows overall PDUhealth. The second row is a device chart that shows average active power over the past 24 hours.
You must have the Create Dashboards role to edit the dashboard.
350

Manage Dashboards
Add a Dashboard Folder
1. In the Dashboards tab, click the "+ Add" button
2. Select "Add Folder"
3. Click "My Folder" and backspace to delete the default name and replace with a the name of your choice
351

352
Adding a Dashboard
You can configure more than one version of the dashboard so that each has different widgets, charts or layouts.
If any dashboard version is not needed anymore, you can remove it, but you can only remove the dashboards that you cre-ated.
1. In the Dashboards tab, click the folder you want to create the dashboard in
2. Click the "+ Add" button

354
4. Click "My Dashboard" and backspace to delete the default name and replace with a the name of your choice
5. With the dashboard selected, click the "+ Add" button6. Select "Add or Edit Widgets"7. Select one of the four "layout" options. This determines the number of rows you will have in the dashboard

8. Select your desired "Dashboard Height" optionl "Fit to Screen" - All rows will be visible on the screen. This is a good option if you are projecting the dash-
board on a large screen in your network operations center for all to seel "2x Screen", "3x Screen", "4x Screen" - For these options your dasboard wil be "x" times larger than your
screen size and provide a scroll bar for scrolling. This is a good option when placing multiple widgets(charts, gauges, floorplans etc.) on a single dashboard
9. Drag and Drop the widgets into the desired position10. Click "Save" to save your settings
This will present your dashboard. You will now need to mouse-over each widget and select the widgets settings icon whichis three horizontal bars often called a hamburger icon. The settings icon is only visible when your mouse is hovering overthe widget.
Sharing Dashboards
1. Select the dashboard folder that contains one or more of the dashboards you want to share with all users who havepermission to view dashboards.
2. Click the “Share” checkbox in the row of the reports you want to share. This will share the folder and all the selec-ted dashboards. The actual data other users see will depend on their permissions. For example: a Power IQ has twodata centers – Paris and London. Paris has a load of 300 KWand London has a load of 400KW. a user will only seethe data for London if their permission is limited to London hence see a load of 400KWon the total power loadgauge.
Hiding a Shared Dashboard
1. Select the dashboard folder that contains one or more shared dashboards you want to hide.2. Uncheck the “Visible” checkbox in the row of the reports you want to hide. This will hide the dashboard. If you hide
all dashboards in the shared folder then it will delete the folder and dashboards from your dashboards tab.
Deleting Dashboard Folders and Dashboards
1. Select the dashboard folder and or a dashboard you want to delete.2. Click the “-“ button
Dashboard Slide Show Mode
355

356
1. Click the slideshow button that is above your dashboard folder structure.
2. Select the dashboards(click on the dashboard name) you want to be in slideshow mode. Hold the Ctrl key to selectmultiple dashboards.
3. Click the “Play Slideshow” button and select from the dropdown the time period you want each dashboard to dis-play for.

Note that the data on each dashboard will refresh with each display or 30 seconds which ever interval is shorter.
4. Click “Exit Full Screen” to stop the slide show.
For additional information see the video on New Dashboard Features
357

358
Configuring Widgets
Widgets are the configurable tools and charts you can add to the dashboard layout.
Active Events Widget
The active events widget displays the 10 highest severity, active events in a list.
You must have the Event Manager role assigned to view events. See Assign Roles to a User.
The list refreshes automatically every 30 seconds.
1. Click the button in the upper right corner of the Dashboards tab. The Dashboard Configurationdialog appears.
2. Drag and drop the Active Events widget icon into a row. See Manage Dashboards for details.
3. Click Save. The widget is added to the dashboard.
4. Click an event link to open the event details page, where you can clear the event. See Clearing Events.
See Enable or Disable Event Notifications for details on receiving email notifications of events.
Device Chart Widget
The device chart widget displays a default setting of average active power over the past 24 hours.
You can configure the device chart to display power measurements for different parts of the data center. Devices must bemapped to rack PDU outlets or circuits in the EDM before the data can be charted. See Creating Your EDM.
Note: Use the Facilities Chart widget to display power measurements for your facility items. See Facilities Chart Widget.
1. Click the button in the upper right corner of the Dashboards tab. The Dashboard Configurationdialog appears.
2. Drag and drop the Device Chart widget icon into a row. See Manage Dashboards for details. See Device Chart Set-tings for details on configuring this chart.
3. Click Save. The widget is added to the dashboard.
To use the device chart widget:

l Click the export icon to export all data in the chart to a .CSVfile.
The chart will automatically refresh at each polling interval. Click the refresh icon to refresh the chart manually.
PDU Health Chart Widget
The default PDU health chart widget shows overall health of all PDUs in the system.
You can configure the chart to show overall health, which includes connectivity and active events, or active events only, orconnectivity only. You can also set the chart to include all PDUs in the system, or just the PDUs in a specific level of a datacenter. The chart refreshes automatically every minute.
1. Click the button in the upper right corner of the Dashboards tab. The Dashboard Configurationdialog appears.
2. Drag and drop the PDU health chart widget icon into a row. See Manage Dashboards for details.
3. Click the Settings icon .4. Enter a name for the chart in the Title field in the Basics section.5. In the Data From field, select All to include all PDUs in the system in the chart. Select Data Center or other section
of the data center to filter the next field's selections. For example, select Racks to filter the Contained In field toinclude the racks in your system.
6. In the Contained In field, select the location of the PDUs you want to include in the Health chart.7. In the Options section, select the health measurement.8. Select Overall Health to view a health chart that combines connectivity and active events to create an overall
health status of the selected PDUs.9. Select Event Health Only to exclude connectivity from the health status.
10. Select Connectivity Health Only to exclude active events from the health status.11. Click Save.
See Overall PDU Health for details on how health status is determined.
12. Click a color-coded bar in the graphic to view the list of PDUs with the selected health status.
The chart will automatically refresh to show the new health status based on any new and cleared events. Click the refreshicon to refresh the chart manually.
Capacity Forecast Chart Widget
The capacity forecast chart widget tracks maximum active power of a data center. Based on the capacity settings, thechart displays how many days of supply remain before your data center reaches capacity, or it will indicate that you haveadequate capacity.
359

360
You must have configured the enterprise data model and have a minimum of 2 days of daily rollup of KWdata. 30 days ofdaily rollup data is recommended for more accurate forecasts. The capacity field must be set for the data center nodeselected. Power capacity is set in KWwith granularity of 2 decimal places, such as 5.04 KW. You can configure the capa-city for different locations in your data center as part of your enterprise data model configuration. See Enterprise Rela-tionships (see Enterprise Relationshipsand the EDM. To set individual capacities, see Set a Capacity.
1. Click the button in the upper right corner of the Dashboards tab. The Dashboard Configurationdialog appears.
2. Drag and drop the Capacity Forecast Chart widget icon into a row. See Manage Dashboards for details.
3. Click the Settings icon .4. Enter a name in the Title field.5. In the Show field, click the browse button, then select the data center node whose capacity you want to show in the
chart. Expand or collapse the nodes by clicking the plus and minus signs. The name of the node selected displaysin the field at the bottom on the dialog. Click Select Node.
6. In the Period field, select the time period to include in the forecast.7. Click Save. The widget is added to the dashboard.
l The blue line shows the observed data.l The purple line is the linear trend line.l The red line following the trend line shows the projected data.l The chart legend will indicate "Adequate Capacity" when the trend does not cross the capacity line for the
time period. If the trend line crosses the capacity line, the chart legend will indicate the number of days ofsupply remaining until capacity is reached: "Projected Xdays of capacity remaining."
Set a Capacity
Capacity in kilowatts can be set with up to 2 decimal places.
Capacity for Racks can only be set in the Data Centers tab. Capacity for data center, room, aisle, and row can be seteither in the Data Center tab, or by importing the enterprise data model .CSVfile. See Importing EDM Object Mappings.
1. In the Data Centers tab, select a data center level, such as a room. The details page opens.2. Enter the capacity in the Capacity (kW) field. On the Data Center level, first expand the Ratings and Settings sec-
tion to find the Capacity field.
Note: For the Rack level, choose Actions > Edit Details in the Rack smart view to find the Capacity field. See Set
Rack Capacity and Override Threshold Percentages.
3. Click Save.

Capacity Gauge Widget
The capacity gauge widget shows how much power a selected node of your data center has consumed over a specifiedtime period. The gauge shows a tick mark for minimum, maximum and average power consumed during the time period.The dial points to the real time active power reading.
1. Click the button in the upper right corner of the Dashboards tab. The Dashboard Configurationdialog appears.
2. Drag and drop the Capacity Gauge widget icon into a row. See Manage Dashboards for details.
3. Click the Settings icon .4. Enter a name in the Title field.5. In the Show field, click the browse button, then select the data center node whose power consumption you want to
show in the dial. Expand or collapse the nodes by clicking the plus and minus signs. The name of the node selecteddisplays in the field at the bottom on the dialog. Click Select Node.
6. In the Period field, select the time period of power consumption to include in the dial.7. Click Save. The widget is added to the dashboard.
Image Widget
The image widget displays an image that you upload on the dashboard.
The maximum images size is 800 pixels high by 800 pixels wide. The maximum file size is 2MB for dashboard images.Images uploaded for logo usage can be up to 512KB.
Uploading a new image to an image widget removes the previously uploaded image.
For details on adding a logo to every page in Power IQ, see Display a Logo on Every Page.
1. Click the button in the upper right corner of the Dashboards tab. The Dashboard Configurationdialog appears.
2. Drag and drop the Image widget icon into a row. See Manage Dashboards for details.
3. Click the Settings icon .4. Click the Browse button, select the image and click Open.5. Click Save. The widget is added to the dashboard.
361

362
Dashboard Heading Widget
The dashboard heading widget allows you to add and format text on the dashboard. Position the report heading widgetabove or next to other widgets to use it as a heading.
1. Click the button in the upper right corner of the Dashboards tab. The Dashboard Configurationdialog appears.
2. Drag and drop the Dashboard Heading widget icon into a row. See Manage Dashboards for details.
3. In the Text field, enter the text you would like to display in the dashboard. Maximum title length is 64 characters.4. Select the font type in the Font field.5. Select the font size in the Size drop-down list.6. Select the text color in the Color drop-down list.7. In the Align field, select Left, Center or Right to specify how text will be oriented in the widget space on the dash-
board.8. Select the Bold or Italic checkboxes to format the text.9. Click Save. The widget is added to the dashboard.
10. Once added to the dashboard, you can edit the text only, without changing style or layout, directly from the dash-board.
11. In the Dashboards tab, double click heading text and edit in the text box that appears. Press Enter to save changes.
HTML Widget
The HTML widget enables you to add your custom HTML portlet to the dashboard. Use this widget to add a weather tool,maps, a video camera, or anything you can code using HTML.
HTML portlets may have security implications. You must allow them before you can add an HTML widget to the Dash-boards tab. See Allow HTML Widgets on Dashboard.
In Internet Explorer, you must accept a security warning the first time you view a dashboard containing an HTML widget.
Note: If your HTML widget contains active content, newer versions of Firefox and Chrome may block the content. Clickthe shield icon in the address bar to allow the content.

1. Click the button in the upper right corner of the Dashboards tab. The Dashboard Configurationdialog appears.
2. Drag and drop the HTML widget icon into a row. See Manage Dashboards for details.
If you don't see the HTML widget icon, you must allow HTML portlets. See Allow HTML Widgets on Dashboard.
3. Click the Settings icon .4. Enter your HTML code in the HTML field.5. Click Save. The widget is added to the dashboard.
Configuring an HTML Widget to Display a Webcam Connected to a PDU
1. On the PDU, ensure that you have created a user with permissions to view the webcam.
2. In Power IQ, add the following code to an HTML widget (adapt hostname, username and password as needed):
<iframe width="100%" height="100%" frameborder="0" style="border:0" src="https://my-pdu.-domain.example/webcam/livepreview/livepreview.html?user=webcam&password=webcam"></iframe>
3. In case there are multiple webcams connected to a PDU, you can select one by appending an URL parameter like web-cam=1_3 (copy the ID from the webcam's URL in the web GUI).
Note: If you see unexpected changes in your dashboard after adding an HTML widget, you can reset it by disabling HTMLportlets in the Settings tab. See Allow HTML Widgets on Dashboard.
Cooling Chart Widget
Cooling charts enable you to compare your data center's sensor readings against industry recommendations.
American Society of Heating, Refrigerating and Air-Conditioning® (ASHRAE) is an industry consortium that providesguidelines for energy efficient data center operations.
ASHRAErecommends certain safe and energy-efficient operating temperatures and humidity levels. This data displays onthe psychrometric chart in Power IQ. ASHRAEoffers two different sets of recommendations, one from 2004, and one from2008. The 2008 recommendations allow for slightly higher temperatures. When viewed on the chart, ASHRAErefers tothese recommended regions of data as "envelopes."
363

364
In Power IQ, you configure the chart to display your data center's humidity and temperature readings on the same psychro-metric chart as ASHRAE's recommendations. You can also specify smaller sections within a data center, such as a roomor rack. This allows you to determine how your readings compare to an ASHRAErecommendation. You can also specifyyour own custom target operating zones. See Create a Custom Region.
1. Click the button in the upper right corner of the Dashboards tab. The Dashboard Configurationdialog appears.
2. Drag and drop the cooling chart widget icon into a row. See Manage Details for details.
3. Click the Settings icon .4. In the Show field, click the browse button to select a node from your enterprise data model. You can select any
level, up to and including the data center. Potential energy savings is calculated only when a data center is selec-ted.
5. In the Sensor Position field, select Inlet, Outlet, or Outside Air. Inlet specifies a "cold aisle" chart, and uses datafrom inlet located sensors. Outlet specifies a "hot aisle" chart, and uses data from outlet located sensors. Outsideair uses data from outside located sensors. See Specify Inlet, Outlet, or Outside Air Location for EnvironmentalSensors.
6. Select the region to display on the chart. See ASHRAE® Envelope Descriptions for details of each region.7. All regions display in blue on the chart. Custom regions have default settings you can change. Select Custom, then
select the Min Temperature and Max Temperature and the Min Humidity and Max Humidity.8. Select Zoom In or Zoom Out to specify a more or less detailed view of the chart to display.9. Enter a name for the chart, or check the Auto Name checkbox to accept the system name. The system name for a
cooling chart contains the level of the enterprise data model, such as data center, and the sensor location inform-ation.
10. Click Save. The widget is added to the dashboard.11. Hover your mouse over the sensor data points to view details. See Viewing Sensor Data Point Details.12. Click the export icon to export sensor data in the chart to a .CSVfile. See Exporting Sensor Data.13. The chart will automatically refresh at each polling interval. Click the refresh icon to refresh the chart manually.14. To calculate savings, see Calculate Potential Cooling Energy Savings.
Requirements for Cooling Charts
Cooling charts use data from the humidity and temperature sensors in your data center.
You must have at least 1 temperature sensor and at least 1 humidity sensor connected to use Cooling charts.
ASHRAEEnvelope Descriptions
ASHRAE® operating envelopes comprise the following settings.
l X-Axis: Temperaturel Y-Axis: Humidity Ratio, with the relative humidity percentage calculated along curves on the chart

The area inside the region created by plotting the thresholds for these data points are recommended by ASHRAEto besafe and energy-efficient zones of operation for a data center.
There are two ASHRAEenvelopes available for display in Power IQ, based on recommendations issued by ASHRAEin2004 and in 2008.
You can also create a custom region to display on the chart, in addition to ASHRAEregions. See Create a Custom Region.
ASHRAE2004 Envelope:
The ASHRAE2004 recommended operating envelope is a rectangular area with the following coordinates.
l 20 Celsius (68 F), 40% RHl 20 Celsius (68 F), 55% RHl 25 Celsius (77 F), 40% RHl 25 Celsius (77 F), 55% RH
ASHRAE2008 Envelope:
The ASHRAE2008 recommended operating envelope is a pentagon-shaped area with the following coordinates.
l 18 Celsius (64.4 F), 42% RHl 18 Celsius (64.4 F), 60% RHl 22.7 Celsius (73 F), 60% RHl 27 Celsius (80.6 F), 49% RHl 27 Celsius (80.6 F), 25%RH
Cooling Chart Details - How Your Sensor Data is Charted
By default, Power IQ considers all environmental sensors to be inlet located. You can specify a sensor as outlet, inlet, oroutside air located in the PDU details page. See Specify Inlet, Outlet, or Outside Air Location for Environmental Sensors.
For each sensor data point, the cooling chart will display the details of the associated humidity and temperature sensors.See Viewing Sensor Data Point Details.
Each data point requires two coordinates: temperature and humidity. For each temperature measurement, Power IQ cor-relates the corresponding humidity value. If the same sensor does not support both humidity and temperature readings,then the nearest humidity sensor is used to correlate temperature measurement with humidity measurement. The determ-ination of the nearest humidity sensor is based on the Power IQ Enterprise Data Model hierarchy.
Example
Floor -> Room -> Aisle -> Row ->Rack
Viewing Sensor Data Point Details
On a cooling chart, the data points for your sensors display as green points.
You can verify whether the points are inside the recommended region you chose to display. The cooling chart allows youto view the details of each data point, and access the associated PDU details page.
365

366
Note: If more than one sensor has the same reading, the points will appear stacked, so that 2 points appear to be 1. Hoverthe mouse over the point to view the details of each stacked point. Export the sensor data to view the details of eachpoint in a text file. See Exporting Sensor Data.
1. In the Dashboards tab, locate your cooling chart. Hover the mouse over a green data point.
The sensor data point details display in a pop-up.
2. Humidity Sensor Reading3. Humidity Sensor Location - (EDM Hierarchy Rack location)4. Temperature Sensor Reading5. Temperature Sensor Location - (EDM Hierarchy Rack location)6. Click the green data point. The Sensor List For Data Point dialog appears.7. Click a row of data to open the PDU details page for the PDU where the sensor is located. Pop-up blockers may pre-
vent this page from opening.
Exporting Sensor Data
To view pairs of sensor readings in a CSVfile, export the data. The exported file contains a column called In Region, and alist of points. Points inside the region are listed as TRUE. Points outside the region are listed as FALSE.
Calculate Potential Cooling Energy Savings
Power IQ calculates the estimated cost savings you may experience by raising the temperature of your data center to ahigher temperature while remaining within the guidelines of a selected ASHRAE® or custom region.
The potential cooling energy savings displays at the bottom of a cooling chart automatically when a data center is selec-ted as the EDM node included.
Potential cooling energy savings can only be calculated at the data center level, not at lower levels, such as room, or rack.
All temperature sensor data points must be below the upper temperature limit for the region selected, or the calculationwill show as 0%. The calculation works by showing you a potential estimated savings based on raising your highest tem-perature to the maximum allowed by the selected region.
Industry estimates show that you could save 3.9% for each 1 degree Fahrenheit that you raise the data center tem-perature; or 7% for each 1 degree Celsius that you raise the data center temperature. Your actual savings will vary. Youcan adjust the savings percentage used in the calculation.
1. In the Data Centers tab, select the data center node.2. In the Ratings and Settings section, enter the percentage to use in the calculation in the Savings % per degrees C
field.

The Savings % is set to a default: 7% for Celsius readings. Readings for Fahrenheit are calculated based on theCelsius percentage, and estimated at 3.9%.
3. Click Save. Go back to the cooling chart in the Dashboard to view updated potential cooling energy savings.
PUETrend Chart Widget
The PUEtrend chart allows you to see how your data center's PUEhas changed over a time period you select. Either dailyor monthly calculations may be used. The length of the trend depends on how much data Power IQ has collected, as wellas your selection.
Monthly data comes from a rollup conducted on the first of each month, using the previous month's data. Monthly datacharts will update after each rollup. Monthly adjustments will affect this chart. See List PUECalculationsand Adjustments.Note that daily values cannot include adjustments. A daily chart may be significantly different than a monthly chart whenmonthly adjustments are used.
You must configure your system before PUEis calculated. See RequirementsforPUE.
1. Click the button in the upper right corner of the Dashboards tab. The Dashboard Configurationdialog appears.
2. Drag and drop the PUEtrend chart widget icon into a row. See Manage Details for details.
3. Click the Settings icon .4. In the Granularity field, select the data you want plotted in the chart, either Monthly or Daily .5. In the Time Selection section, select Period or Range.6. Select Period to show constantly updated measurement.7. Select Range to show measurements from a custom Start Date and End Date. Select the start and end dates using
the calendar dialogs.8. Enter a name for the chart, or check the Auto Name checkbox to accept the system name.9. Select the Include Legend checkbox to display a legend with the data center names included on the chart.
10. To select or deselect any data center, click the Data Centers tab, and select or deselect any checkbox of a datacenter.
11. Click Save. The widget is added to the dashboard.
Set PUEThresholds
An ideal PUEis 1.0. You can set warning and critical thresholds for your data center, and Power IQ uses those values tohelp visualize your PUEin the dashboard. See Latest PUEReading Gauge Widget for details on the widget that displaysthis data.
PUEis calculated only at the data center level.
367

368
1. In the Data Centers tab, click a data center node.2. In the Ratings and Settings section, set the threshold values for PUEWarning Threshold and PUECritical
Threshold.
3. Click Save. See Latest PUEReading Gauge Widget for details on configuring the widget that uses these values.
Latest PUEReading Gauge Widget
The latest PUEreading gauge allows you to see where your data center's PUEfalls in the threshold range you have con-figured. You can set a warning and critical threshold level for each data center. Warning and critical threshold levels aredisplayed as yellow and red in the gauge. See Setting PUEThresholds.
The gauge also shows the minimum PUEcalculation and the maximum PUEcalculation for a time period you specify. Thisdata displays as tick marks, and may overlap.
Either daily or monthly calculations may be used. The latest PUEcalculation is used. For daily gauges, the previous day isused. For monthly gauges, the previous full month is used. Monthly data comes from a rollup conducted on the first of eachmonth, using the previous month's data. Monthly gauges will update after each rollup.
You must configure your system before PUEis calculated. See Requirements for PUE.

1. Click the button in the upper right corner of the Dashboards tab. The Dashboard Configurationdialog appears.
2. Drag and drop the latest PUEreading gauge widget icon into a row. See Manage Details for details.
3. Click the Settings icon .4. Enter a Title for the gauge.5. Select the Data Center whose PUEyou want to display.6. In the Granularity field, select the calculation you want to display, either Monthly or Daily .7. In the Min/Max Period field, select the time period to include in the gauge calculation. The gauge displays the min-
imum and maximum of PUEvalues over the time period selected. The values are indicated with tick marks.8. Click Save. The widget is added to the dashboard.
Facilities Chart Widget
The facilities chart widget enables you to display active power or energy readings for one or more facility items, such as aCRAC, floor PDU, floor UPS, power panel, or standalone meter, in your data center.
Rack PDUs are excluded from this chart.
Facilities items must be mapped in the EDM before the data can be charted. See Creating YourEDM.
1. Click the button in the upper right corner of the Dashboards tab. The Dashboard Configurationdialog appears.
2. Drag and drop the Facilities Chart widget icon into a row. See Manage Details for details.
369

370
3. Configure the settings.4. Measurement: Active Power or Energy5. Time Range: Period or Custom6. Period shows preconfigured time options, such as Past hour, Past week, Past month, and so on. Select the time
period from the drop-down list. See What's the difference between "Past"and "Last" time periods?7. Custom show measurements between the Start Date and End Date chosen in the calendar dialogs.
l Granularity: Monthly, Daily, Hourly, Poll Intervall Monthly, Daily, and Hourly show 1 data point per month/day/hour for the time period the chart includes. The
time period must be longer than the granularity.8. Poll Interval shows 1 data point per poll interval for the time period the chart includes. The Poll Interval must be set
to 5 minutes or longer to use Poll Interval granularity.l Statistic: Minimum, Maximum, or Average readings for each data point.l Title: Automatic or Custom. Automatic chart title is Statistic + Measurement + Time Range. For example,
Average Active Power - Past 24 Hours.l Lines: Show one line per data source, or Sum all data sources into one line. A data source is one facility
item selected in the Data Sources table.9. In the Data Sources table, click Add, then select the facility items to include. Use Control-Click to select multiple
objects. Click Select Nodes. The table displays your selections.10. Click Save. The widget is added to the dashboard.
Floor Map Widget
The floor map widget uses a drawing of your data center, combined with information from your EDM and events, to createa color-coded health map of your data center.
The floor map widget supports the display of information regarding racks and facility items.
Power IQ supports the following facility items:
l CRACl Floor PDUl Floor UPSl Power panell Standalone meter
Objects represented in the drawing must be mapped in the EDM before they can display health in the floor map. See Creat-ing Your EDM.
Make sure your data center drawing is a .DWGfile that follows the requirements. See Floor Map Drawing Files.
Object names in the drawing must be unique and match the object names in the EDM.

1. Click the button in the upper right corner of the Dashboards tab. The Dashboard Configurationdialog appears.
2. Drag and drop the Floor Map widget icon into a row. See Manage Details for details.
Tip: Floor Maps may look better as the only widget in a dashboard. You can create multiple dashboards.
3. Once the layout is saved, the blank floor map displays. Click the icon in the upper right corner ofthe widget to open the Floor Map Settings. Choose the location in the EDM for the floor map drawing you want touse. Click Select Node.
You can create one floor map per Data Center, Floor, or Room. If a drawing has already been associated with anode, it will appear automatically when the location is chosen.
4. In the Title field, select Automatic, or select Custom and add a name for the floor map. Click Save.5. Click Setup to toggle to the setup options, then click Upload.
6. Click Browse, select the .dwg file, and click Upload. A success message displays when the drawing loads. The draw-ing displays with color-coded objects, indicating whether each object name has synced to the EDM. See SyncingFloor Map Drawing with EDM.
371

372
Syncing the Floor Map Drawing with EDM
In Setup mode, check the color-coding of each object in your floor map drawing to make sure it is synced to the EDM.
l GREEN: Objects in drawing that uniquely match an object in the EDM.l YELLOW: Objects in drawing that have duplicate names, or that cannot be matched to a unique object in EDMl RED: Objects in drawing not found in EDM.
1. Status legend2. Objects in DB list: This list contains all objects found in the EDM for the location selected. The status reports
whether the object was found in the drawing, and aligns with the colors and statuses in the legend.
Click a drawing object or a list object to highlight the matching object, if any.
3. The Setup button toggles to show Setup mode, or View mode. This is Setup mode. You can upload or download thedrawing and check sync status. To view Health, Rack Inspector, and click through to smart views, toggle to Viewmode.
Using the Floor Map
In View mode, racks and facility items are color coded based on event severity. If a facility item, the rack itself, or any PDUsor sensors contained in the rack have warning or critical active events, the facility item or rack is shown as warning or

critical level.
l GREEN: Normal. No warning or critical events.l YELLOW: Warning. Warning level events reported.l RED: Critical. Critical level events reported.l GRAY: No Data. Object not found in EDM, or you do not have permission to view this object.
1. Status legend2. Rack Inspector: Select an object in the floor map to view readings and active events.
Click the rack, facility item or PDU link in the Rack Inspector to go to the smart view.
3. The selected object has a blue outline.4. The Setup button toggles to show Setup mode, or View mode. This is View mode. You can view Health, Rack
Inspector, and click through to smart views. To upload or download the drawing and check sync status, toggle toSetup mode.
Floor Map Data Refresh Rates
Rack threshold events appear and clear at the polling interval. See Rack Thresholds.
The drawing and the Rack Inspector refresh at 30-second intervals.
373

374
Floor Map User Permissions
User permissions required to upload a drawing to a floor map:
l Administrator, Site Administrator, or Operator
User permissions required to view a floor map:
l View permissions to objects represented in the map. If user does not have View permission for a rack, for example,the rack appears gray in the drawing, and none of its data is included.
l Events Manager
Facilities Chart Widget
The facilities chart widget enables you to display active power or energy readings for one or more facility items, such as aCRAC, floor PDU, floor UPS, power panel, or standalone meter, in your data center.
Rack PDUs are excluded from this chart.
Facility items must be mapped in the EDM before the data can be charted. See Creating YourEDM.
1. Click the Add or Edit Widgets button in the upper right corner of the Dashboards tab. The Dashboard Configurationdialog appears.
2. Drag and drop the Facilities Chart widget icon into a row. See Manage Dashboards for details.
1. Configure the settings.2. Measurement: Active Power or Energy3. Time Range: Period or Custom4. Period shows preconfigured time options, such as Past hour, Past week, Past month, and so on. Select the time
period from the drop-down list. See What's the difference between "Past"and "Last" time periods?5. Custom show measurements between the Start Date and End Date chosen in the calendar dialogs.
l Granularity: Monthly, Daily, Hourly, Poll Interval.l Monthly, Daily, and Hourly show one data point per month/day/hour for the time period the chart includes.
The time period must be longer than the granularity.
Note: "Past Hour" graphs in facilities charts require a granularity of "Poll Interval" to produce a plot.
6. Poll Interval shows one data point per poll interval for the time period the chart includes. The Poll Interval must beset to 5 minutes or longer to use Poll Interval granularity.
l Statistic: Minimum, Maximum, or Average readings for each data point.l Title: Automatic or Custom. Automatic chart title is Statistic + Measurement + Time Range. For example,
Average Active Power - Past 24 Hours.l Lines: Show one line per data source, or Sum all data sources into one line. A data source is one facility
item selected in the Data Sources table.7. In the Data Sources table, click Add, then select the facility items to include. Use Control-Click to select multiple
objects. Click Select Nodes. The table displays your selections.8. Click Save. The widget is added to the dashboard.

How Does Power IQ Calculate the Sum of a Data CenterNode?
Power IQ uses a formula for charting a whole data center node, such as a Room, that prevents duplication of data.
The sum of a node is the sum of the inlets of all rack PDUs under the node, plus the sum of all non-duplicate Circuits in allPower Panels, Floor PDUs, and UPSs contained by the node. See Floor PDUs, Power Panels, UPS, Standalone Meters inthe Data Center Browser
If a node contains a rack that contains an IT device mapped to a floor PDU outside that node, the IT device is not part ofthe sum of that node.
An HVAC system's power is part of the sum of the power for charts drawn for the physical location it serves, as position inthe Data Center browser. See CRACs in the Data Center Browser.
375

Chapter 10:Security and Encryption
Installing an HTTPS Certificate
A PEM file upload is required to replace the current certificate and private key. The PEM file needs to contain both an RSAprivate key and an X509 certificate.
Note: Power IQ does not provide a Certificate Signing Request (CSR). OpenSSL or any other utility can be used to gen-erate CSR. Power IQ does not use encrypted private keys. You must remove the password from the Private key before itcan be used. To remove the encryption from the key, issue a command like: "openssl rsa -in server.key -out server2.key".Use "server2.key" when using openSSL utility.
It is not required to provide root certificate of CA signing Power IQ certificate signing request (CSR).
Step 1: Generate a private key
This example procedure is for generating a private key using OpenSSL on a Linux server.
This command creates an RSA key with Triple DES 1024 byte encryption.
openssl genrsa -des3 -out server.key 1024
Remember the key password from this command.
Generate a Certificate Signing Request. Be prepared to complete the following information:
l private key passwordl two character country codel full state or province namel city namel company namel organizational unit or leave it blankl servers common name or fully qualified domain namel admin email addressl other attributes can be left blank
1. Create the request.
openssl req -new -key server.key -out server.csr
2. Display the CSR request.
cat server.csr
376

3. Copy the CSR request and send it to the certificate authority to be signed. Make sure to copy everything betweenthe first "-----" and the last "-----".
4. Submit CSR to certificate authority and receive signed X.509 certificate.5. Modify the server key to remove the password.
cp server.key server.key.secureopenssl rsa -in server.key.secure -out server.key
Warning: The server.key file must be kept private and secure. If this key file is compromised, the cer-tificate should be removed and then reissued.
6. Create PEM file.7. The PEM file should contain both the RSA private key without password and the X.509 certificate.8. Concatenate the unprotected private key to the signed X.509 certificate file from the top level certificate authority.9. Use this file in the upload in Step 2.
Step 2: Upload the PEM file to Power IQ:
You may want to manually load the certificate in your browser first to prevent issues while everything loads and refreshesin Power IQ. If you see any issues, such as bad labels or a partially loaded UI, refresh your browser to resolve.
1. In the Settings tab, click HTTPS Certificate in the Security and Encryption section.2. If uploaded, the currently HTTPS certificate displays. To replace it or add a new certificate, click Browse and select
the PEM file.3. Click Upload.
377

378
Restricting Web and Shell Access Based on IPAddress
To increase security, Power IQ can be configured to restrict web interface and SSH access by IP address.
l When trusted hosts are specified, Power IQ blocks attempts to connect from addresses not specified.l When no hosts are specified, ports 22, 80, 443, 5432 are open to all hosts.
1. In the Settings tab, click IP based Access Control in the Security and Encryption section.
The global options will override any options that allow access to the SSH and ODBC service.
l Allow ICMP ping responsesl Block all SSH accessl Block all ODBC access: See ODBC Access.
2. Identify the hosts to allow access to in the Trusted Hosts fields.
You can enter an IP address, or a subnet using CIDR notation such as 192.168.45.0/24.
3. For each address, select how it is permitted to access Power IQ.4. Select the Enable SSH to allow SSH access checkbox.5. Select the Enable HTTP/HTTPS checkbox to enable access through the web interface.6. Select Enable ODBC to allow third party access.7. Click Save.

Configuring Password Requirements
To specify password strength for Power IQ users, select from a list of password requirements. Users that are locally authen-ticated will be required to use passwords that comply with the settings. For example, you may require that all passwordscontain a number and are longer than 8 characters.
Password requirements apply to locally authenticated users only. If LDAP is enabled, the password requirements selectedare not followed.
Changes to the password requirements apply only to future new and changed passwords. Users whose passwords werecreated before the password requirement change will not be forced to change passwords to comply with the require-ments.
1. In the Settings tab, click Password Requirements in the Security and Encryption section.2. In the Minimum Password Length field, select the minimum number of characters a password must include.3. In the Maximum Password Length field, select the maximum number of characters a password may include.4. Select the checkboxes for each requirement you want included in locally-authenticated user passwords.
l a lowercase character: Password must contain any lowercase letter.l an uppercase character: Password must contain any capital letter.l a numeric character: Password must contain a number.l a special character: Password must contain any special character, including: ~!@#$%^&*()_+{ } | :"<>?/.,';]
[=-\`
5. Click Save.
379

380
Encrypting Data Backup Files
Power IQ encrypts data backup files using a GnuPG/PGP public key that you generate.
You can generate PGP Encryption Keys using free tools. Go to https://www.gnupg.org and look for a binary for your oper-ating system on the Downlaods page.
Important! Make sure to save both the public and private keys that you generate. You need the public key for backup fileencryption and the private key for backup file decryption. See Decrypt Backup FilesBefore Restoring
1. In the Settings tab, click Data Backup Encryption in the Security and Encryption section.2. Select the Encrypt Backups checkbox.3. Click Browse, then select and upload a GnuPG/PGP Public Key to Power IQ.4. Click Save.

Enabling Single Sign On for Raritan Products
You can launch the web interface of a Raritan PX1 or PX2 PDUs or a Raritan EMXby clicking the Launch link on the PDUdetails page. When single sign on is not enabled, users must then login manually.
Enable single sign on to allow users to automatically authenticate with their Power IQ credentials.
Users must have identical credentials on Power IQ and on the target Raritan product, and be logged in to Power IQ withthose credentials for single sign on to succeed. Single sign on must be enabled in Settings > Single Sign On.
See Launch the Web Interface for a Raritan PXPDU.
1. In the Settings tab, click Single Sign on in the Security and Encryption section.2. Select the "Enable single sign on to Raritan PDUs" checkbox to enable, or deselect the checkbox to disable single
sign on.3. Click Save.
381

382
Enabling the WS API
To get started with the WS API, the API needs to be enabled through the Settings Tab. It is disabled by default.
1. In the Settings tab, click Other Security Settings in the Security and Encryption section.2. In the Web API Settings, select the Enable Web API checkbox, then click Save.

Enabling the Web API User Account
The Web API user account is a locally authenticated user that can be used for Web API scripts that require user cre-dentials. The username is "web_api." The password for the account can be configured.
The Web API account is configurable only on the Settings > Other Security Settings page. The Web API user is alwaysauthenticated locally, even when LDAP is enabled.
The Web API account is assigned the administrator role. This role assignment cannot be changed.
1. In the Settings tab, click Other Security Settings in the Security and Encryption section.2. In the Web API Settings, select the "Enable web API user web_api" checkbox.3. In the Web API user password field and the Confirm password field, enter a password.
The password must follow the requirements selected in Settings > Password Requirements. See Configuring Pass-word Requirements.
4. Click Save SOAP Web API Settings.
383

384
Change Web User Session Timeouts
You can set Power IQ to log out any web users who have been inactive for a certain period of time.
1. In the Settings tab, click Other Security Settings in the Security and Encryption section.2. In the User Session Timeout box, select a time from the "Log users out" list. The time indicates how long users can
remain idle on the Power IQ web interface before being logged out. Select Never to disable this feature.3. Click Save Timeout.

Configuring the Authorization Warning Message
The authorization warning message displays on the Power IQ login page. You can change the default message.
Warning: Do not use html scripts in the message. Some scripts could cause the system to lock you out.
1. In the Settings tab, click Other Security Settings in the Security and Encryption section.2. In the Authorization Warning message section, enter the message you want to display on the login page.
l Header: Text entered in this field displays on the login page in a bold font, as the heading to the messagel Body: Text entered in this field displays in a normal font, as the main content of the message.
3. Click Save. Log out of Power IQ to return to the login page and view the message.
385

386
Configuring Enterprise Power IQ Settings
Enterprise Power IQ must use the password configured to communicate with a local Power IQ installation.
1. In the Settings tab, click Other Security Settings in the Security and Encryption section.2. Enter the password that will be required in Enterprise Power IQ to communication with this local Power IQ.3. Enter the password again to confirm.4. Click Save Enterprise Power IQ Settings.

Chapter 11:Data Management
This section provides information on the configuration and management of data and data storage, including data rollupretention policies, backups, and EDM relationships.
387

Data Backups
Power IQ creates a daily system configuration backup file.
You can download the files to another location. Downloading System Configuration Backup Files.
To automatically download daily backup files, setup a remote storage location. See Configuring Remote Storage ofArchive Files.
You can also create a new system configuration backup file at any time, and/or schedule a recurring time a daily backupwill occur. See Create a System Configuration Backup File.
If needed, you can use a backup file to restore your Power IQ to an earlier, backed-up configuration. See Restoring SystemConfiguration Backups.
388

389
Downloading System Configuration Backup Files
The configuration of your Power IQ is backed up and archived once each day. Administrators should copy these backupfiles to an external server for redundancy purposes. Saving a backup of your Power IQ system configuration file is criticalfor safeguarding your Power IQ configuration and data and recovering from human error.
Note: Back Up Your System Before You Upgrade! Before you upgrade to a new Power IQ release, we stronglyrecommend that you generate a backup of your Power IQ system configuration and save it to another location, such asyour hard drive or an external server. We also strongly recommend that you set up remote storage for backup files to auto-matically push all daily backups to a remote storage location.
The backup files are saved in the .DAT file format.
Each backup file is date- and time-stamped and includes the Power IQ build version and the file size.
To download a system configuration backup file:
1. In the Settings tab, click the Data Backups link in the Data Management section.
2. The Data Backups page opens. In the Backup Archives section on the Data Backups page, click the file name linkto download the backup file to your computer.

Note: You can also manually create an archive of the system configuration by clicking Create at any time. For moreinformation, see Creating a System Configuration Backup File on the facing page.
390

391
Creating a System Configuration Backup File
Power IQ creates a daily backup file. You can create a new backup file at any time and/or schedule a recurring time a dailybackup will occur. By default, the daily backup is scheduled to occur at 1:15 PM EDT.
Note: Back Up Your System Before You Upgrade! Before you upgrade to a new Power IQ release, we stronglyrecommend that you generate a backup of your Power IQ system configuration and save it to another location, such asyour hard drive or an external server. We also strongly recommend that you set up remote storage for backup files to auto-matically push all daily backups to a remote storage location.
1. In the Settings tab, click Data Backups in the Data Management section.
2. In the Backup Archives section on the Data Backups page, click the Create button.
3. The backup archive creation process will begin immediately after you click the Create button. A Creating backuparchive bar will display. Note that the time required to create the backup archive may vary based on the size of yourdatabase.

4. Optional. If needed, you can set a time at which to schedule the backup to occur. Select a time from the DailyBackup Schedule drop-down in the Back Scheduling section of the page.
5. The file is created immediately or at the scheduled time, and added at the top of the list in the Backup Archives sec-tion. An MD5 file is also created for verification.
392

393
Decrypt Backup Files Before Restoring
You must decrypt encrypted backup files before they can be used to restore a Power IQ system.
Use the openssl Linux command to decrypt a X.509/MIMEencrypted backup file.
Example
[root@localhost ~]# openssl smime -decrypt -in /root/backup-3.1.0.30-
20111118010513.dat -inkey user-private-key -inform DER -recip user-public-key >un-
encrypted-backup.dat
To decrypt a PGP encrypted backup file:
Use the gpg Linux commands to decrypt a PGP encrypted backup file.
Example
[root@dhcp-209 ~]# gpg --import PGP_private_key2.txtgpg: directory `/root/.gnupg'createdgpg: new configuration file `/root/.gnupg/gpg.conf' createdgpg: WARNING:options in `/root/.gnupg/gpg.conf' are not yet active during this rungpg: keyring`/root/.gnupg/secring.gpg' createdgpg: keyring
Example
`/root/.gnupg/pubring.gpg' createdgpg: key 41965311: secret key importedgpg:/root/.gnupg/trustdb.gpg: trustdb createdgpg: key 41965311: public key "[email protected]" importedgpg: Total number processed: 1gpg: imported: 1 (RSA:1)gpg: secret keys read: 1gpg: secret keys imported: 1
[root@dhcp-209 ~]# gpg --decrypt --output /root/unencypted.dat /root/backup-4.0.2.8-20130220153455.dat
You need a passphrase to unlock the secret key foruser: "[email protected]"1024-bit RSA key, ID 41965311, created 2013-02-19
can't connect to `/root/.gnupg/S.gpg-agent': No such file or directorygpg-agent[9705]: directory `/root/.gnupg/private-keys-v1.d' createdgpg: encrypted with1024-bit RSA key, ID 41965311, created 2013-02-19"[email protected]"gpg: WARNING:message was not integrity protected

Restoring System Configuration Backups
If your system configuration backup file is encrypted, see Decrypt Backup Files Before Restoring.
Restoring a system configuration backup file returns Power IQ's configuration to the settings captured when the backupwas made.
Note: If you restore a backup containing an SSL security certificate that is different from the one currently installed on thesystem, the progress bar for "Restoring the system and restarting..." will not complete. This happens because the browserwill not accept any messages from Power IQ until you establish a secure connection using the restored certificate. Starta new browser session and you can log into the system once the former certificate has been restored.
1. Navigate to Settings > Data Management > Data Backup section.
2. In the Restore a Backup Archive section, click Browse, then select a backup file.
394

395
3. Click Upload.4. The Power IQ data and configuration settings are restored to the backup's configuration settings, and the server is
rebooted.
Note: Database versions prior to 7.0 can not be applied directly on Power IQ version 8.0.0. If you are running an earlierPower IQ version you must first upgrade to at lease version 7.0 and then to 8.0.

System Configuration Backup File Retention
Power IQ retains backup for four days. A file older than four days is deleted automatically, unless it is the only storedbackup file. One backup file is always kept, regardless of age.
396

397
Configuring Remote Storage of Archive Files
You can configure a remote storage server to automatically store your archive files in the Power IQ Settings tab.
All files that are not being actively written to are automatically stored on the configured server. Sensor reading archivesare often being actively written to, so their storage may be approximately one day delayed.
Supported remote storage service types include: Amazon Web Services, SCP, SFTP, and FTP. You can also discontinueremote storage by selecting the None option.
Note: To configure an SFTP or SCP server, you will need a host key. For information on retrieving the host key, see the onpage 399 section below.
Two file types are eligible for automatic remote storage:
l System configuration archives (system configuration backup files, including daily automatic backups and manuallycreated backups).
Note: When using an SCP remote storage service, only automatic backups are moved. Manually created backupsare not affected.
l Sensor reading archive files
To configure remote storage in Power IQ:
1. In the Settings tab, click the Remote Storage link in the Data Management section.

2. Select the remote storage service type:l None: Option to stop automatic remote storagel Amazon Web Servicesl SCPl SFTPl FTP
398

399
3. Select the checkboxes for the file types you want to automatically store on a remote server.l Store backup archivesl Store sensor reading archives
4. Complete the authentication and location information for your selected remote server.
Note: The authentication and location information will vary based on your selected remote storage service.
5. Click Save.

How to Retrieve the Host Key for an SFTPor SCPServer
To configure remote storage using an SFTP or SCP server, you will need to provide a host key during the authenticationand location information step outlined above. To do so, you can use the ssh-keyscan utility.
1. From a Linux box, run this command to get the host key:
ssh-keyscan -p 22 -t rsa techftp.sunbirddcim.com 2>/dev/null| awk '{print $2,$3}'
Note: If you are copying and pasting from the example above, make sure to change the bolded text—the port (22) andhost server (techftp.sunbirddcim.com)—to reflect your own environment.
2. Copy the lines returned into the Host Key box under SCP/SFTP Settings under Remote Storage Settings in Power IQ(Step 4 in the previous section).
3. Click Save.
400

401
More Information on ssh-keyscan
The syntax for the command is as follows:
ssh-keyscan -p [PORT] -t [TYPE] [HOST] 2>/dev/null| awk '{print $2,$3}'
With the following options:
Tag Description
-p [PORT] Port to connect to on the host
-t [TYPE] Specifies the type of the key to fetch from the host. Use rsa as in the example above.
The host is the server IP address or host name, such as techftp.sunbirddcim.com.

Configuring Remote Access to Database
Power IQ's ODBC interface allows ODBC compliant applications access to the power data of managed devices. Forexample, an ODBC compliant reporting application like Crystal Reports can access Power IQ data to create customizedreports.
See ODBC Access for details on configuration and queries.
402

403
Configuring Data Rollup Retention
Power IQ performs periodic roll-ups. During a roll-up, the values over that period are averaged and stored along with theminimum and maximum values that were measured. As time passes, the stored roll-up data itself is rolled up into largersets of data. Raw data measurements are rolled up every hour, and 24 hourly roll-ups are rolled up every day, and so on.
Data does not have to be purged immediately after a roll-up occurs.
Example
Raw data is rolled up every hour but a set of raw data can still be made available five hours later. You can configure howlong Power IQ retains each level of data.
Ideally, you should adjust the data retention periods before adding facility items to Power IQ management. You should alsorevisit these settings after adding a large number of facility items.
Note: Power IQ collects a lot of data. Keeping this data for long periods of time consumes large amounts of storage spaceand may affect performance. If you need long term access to the raw poll data, you should download daily sensor read-ings regularly. See Downloading Daily Sensor Readings.
Before making any changes to this configuration, enter your settings in the data storage calculator to ensure adequatedatabase capacity. Improper configuration may result in data loss. Access the data storage calculator by clicking the linkon the Settings > Data Rollup Retention page in Power IQ.
1. In the Settings tab, click Data Rollup Retention, in the Data Management section.2. In the Data Retention Configuration for SQL Standard Tables panel, start with the "Retain raw data" row. Use the
drop-down lists in that row to select how long Power IQ should keep this raw data.3. In the Retain hourly averages of data row, configure how long hourly roll-ups are stored.4. In the Retain daily averages of data row, configure how long daily roll-ups should be stored.5. In the Retain monthly averages of data row, configure how long monthly roll-ups should be stored by Power IQ.
On this page, in the Data Retention Configuration for SQL Archive Tables panel, you can also enable and configure theretention of archived data. For more information, see Configuring Data Rollup Retention.

Enabling and Configuring the Data Archive (BETA)
Power IQ allows users to store and analyze archived data so that users can retain the raw data for a long time period whileminimizing system performance impact. This feature is useful in cases where users need to audit a past event on a spe-cific facility item or rack.
To use the data archive feature, you first must enable it through the Power IQ Settings.
1. Under Settings > Data Management, select Data Rollup Retention
2. In the Data Retention Configuration for SQL Archive Tables panel, check the Enable long-term data archive forraw data checkbox.
3. You can also specify the duration to retain the raw data. The default is two days. Optional.4. Click the Save button to save your changes. A “Data archival configuration updated successfully” message will
display once your changes have been saved.
You can now use the data archive feature. For more information on how to chart archived data using a device chart, see Charting Archive Data Using the Device Chart (BETA) on page 594.
Note: Archive data is included in backups and restores. As a result, systems with large archives may take longer to backup and restore.
Note: Power IQ will delete data from the archive tables in accordance with the retention policies specified under PowerIQ Settings > Data Management > Data Rollup Retention. Additionally, raw data is moved to the archive only when theretention policy for the SQL Standard Tables has expired. For more information on setting the standard retention policies,see Configuring Data Rollup Retention on the previous page.
404

405
Enterprise Relationships and the EDM
One of Power IQ's advanced features is the ability to model the IT equipment infrastructure within your data center. PowerIQ can model something as simple as a single rack, or as large as a building with multiple server rooms.
In Power IQ, this hierarchical representation of your data center is called the enterprise data model, or EDM. The EDMshows the relationships between objects in your data center and enables Power IQ to:
l Display a representation of your equipment in the Data Centers tab.l Generate charts in the Analytics tab.l Generate charts and gauges on the Dashboard.l Calculate PUE.

What is an Enterprise Data Model (EDM) Object?
An object is an item that is a part of your data center.
The objects are mapped by relationships of parent and child, creating a hierarchy.
Higher-level objects contain and organize lower-level objects. For example, a Rack is an object that contains Devices, aRow is an object that can contain Racks, and an Aisle is an object that can contain Rows. See Object Types and their Hier-archy.
The lowest-level objects are called Devices. Devices are items such as servers, KVM drawers, network switches, or otherequipment commonly installed in server racks. Generally speaking, these are items you provide power to.
There are a couple of special exceptions. You can map circuits and outlets as part of your EDM, but these objects don'tshow in the main hierarchy in the Data Centers tab. Since their associations are to your IT devices, circuits display in thedevice details pages, and outlets display in both the device details pages, and rack PDU smart pages.
406

407
What are Mappings and Relationships?
All objects, except for the Data Center, must have a larger object as a parent. Generally speaking, a parent object is a lar-ger object that contains a smaller object.
The Data Center object is the largest object. It has no parent object.
This ability to identify an object's parent is a single mapping. Mapping each object to its parent describes a model of equip-ment and how it is organized to Power IQ.
Your model does not have to include every level, as long as it follows the rules for parent-child relationships. See ObjectTypes and their Hierarchy.

Object Types and Their Hierarchy
From the top of the hierarchy to the bottom:
l Regionl Countryl Territoryl Cityl DATA_CENTER: The data center object type. This object has no parent.l FLOOR: The floor object type. This object can only have a DATA_CENTER as a parent.l ROOM: The room object type. This object can have a DATA_CENTER or FLOOR as a parent.l AISLE: The aisle object type. This object can have a DATA_CENTER, FLOOR, or ROOM as a parent.l ROW: The row object type. This object can have a DATA_CENTER, FLOOR, ROOM, or AISLEas a parent.l RACK: The rack object type. This object can have a DATA_CENTER, FLOOR, ROOM, AISLE, or ROWas a parent.l DEVICE: The IT Device object type. This object can only have a RACK as a parent.l DOOR: The door object type. This object can have a DATA CENTER, FLOOR, ROOM, AISLE, ROW, or RACK as a
parent.
These objects represent PDUs and sensors:
l PDU: The PDU object type. This object represents all types of PDUs in Power IQ, including Rack PDUs, Rack Trans-fer Switches, CRACs, Floor PDUs, Floor UPS, Power Panels, and Standalone Meters. This object can have a DATA_CENTER, FLOOR, ROOM, AISLE, ROW, or RACK as a parent.
l SENSOR: The sensor object type. This object can have a DATA_CENTER, FLOOR, ROOM, AISLE, ROW, or RACKas a parent.
For more information on EDM levels please see the New EDM Levels video.
408

409
Requirements for Creating EDM
All PDUs included in your EDM must already be added to Power IQ. See Adding PDUs to Power IQ Management.

Creating Your EDM
There are several ways to create your EDM:
l Import a CSVfile containing the EDM object mappings. See Importing EDM Object Mappings.l Add items manually in the Data Centers tab, using drag-and-drop to arrange the hierarchy. See Creating an EDM
Manually.l Generate a default EDM. A default EDM gives you a starting point for customization using the other methods, and
enables you to start using dashboard charts immediately. See Generate a Default EDM.
410

411
Creating an EDM Manually
The Data Centers tab has menu options to add each EDM object manually, and associate PDUs and sensors. Onceobjects are added, drag and drop them to arrange the hierarchy that represents your data center. See Object Types andtheir Hierarchy for details on each object and how it can be used in the EDM.
Note: If you want to move an EDM item within the hierarchy it needs to be selected first. Just left-clicking and draggingwill not work (Left Click - Release - Left Click Drag - Release).
See Importing EDM Object Mappings for an alternative to creating the EDM manually.
Prerequisite: PDUs must be added to Power IQ before creating an EDM. See Adding PDUs to Power IQ Management.
You can add Region, Country, Territory, City, Data Center, Floor, Room, Aisle, Row, Rack, and IT Device objects.
1. Click Add, then select the object and name it when it appears in the tab.
2. To associate PDUs in the EDM, you must add them to Power IQ first. Use the Facility Item Association menu optionto find PDUs that are not yet in the EDM, and place them in the hierarchy. Power IQ automatically adds yoursensors to the EDM when you associate their PDUs. And, Power IQ moves your sensors when they have the sameparent as the PDU. See Automatically Associate Sensors in the EDM.
Note: Only PDUs and sensors that are unassociated will appear as options. PDUs include facility items.
To associate outlets and circuits with IT devices:
l Outlets and circuits can be associated with IT Device objects only. See Associate a Circuit or Outlet with an ITDevice.

Automatically Associate Sensors in the EDM
Power IQ automatically associates your sensors into the EDM. See Enterprise Relationships and the EDM.
Every five minutes, Power IQ checks for sensors that are not part of the EDM. If the sensor's PDU is in the EDM, Power IQadds the sensor to the PDU's parent object, usually a rack. Click Refresh in the Data Centers tab to view the updated EDM.
When you associate a PDU in the EDM, Power IQ adds the sensors to the PDU's parent object.
When you remove a PDU from the EDM, Power IQ unassociates sensors that are associated with the PDU's parent object.But, any sensor that were associated to other EDM objects stay where they are.
When you move a PDU in the EDM, Power IQ moves the sensors that had the same parent to the new parent. But, anysensors that were associated to other EDM objects stay where they are.
Note: Because unassociated sensors attached to an associated PDU will be re-associated every five minutes, you can-not remove a sensor from the EDM if its PDU is in the EDM.
You can also associate sensors manually and by import. See Create an EDM Manually and Import EDM Object Mappings.
412

413
Icons for EDM Objects
The following icons are used to represent each object in the EDM.
Icon Object
Data Center
Floor
Room
Aisle
Row
Rack
IT Device
Rack PDU
Sensor
Door
CRAC
Floor PDU
Floor UPS
Power Panel
Standalone Meter
Rack Transfer Switch

Importing EDM Object Mappings
One method to create or add to an EDM is to import the objects and their mappings. These mappings are imported as oneor more Comma Separated Value (CSV) files. Additional CSVfiles append to the EDM, except when objects are duplicatedin the CSVfiles. In the case of duplicates, the last uploaded object updates the previous entries.
If an EDM already exists, you can export it as a single CSVfile. This file can then be edited to make additions, or used as atemplate to create a new file. See Exporting an EDM.
For details on creating the CSVfile, see Structure of the EDM Import File.
Note: All PDUs must be added to Power IQ first, before importing an EDM. Importing a CSVfile that lists a PDU not addedto Power IQ results in an error. See Adding PDUs to Power IQ Management.
To import EDM object mappings:
1. In the Settings tab, click Enterprise Relationships.2. In the CSVData Mapping Actions area, click Browse, and select the CSVfile.3. Click Import.
A status window indicates any issues that occurred when the upload completes. If any errors have occurred, none of theobjects in the file are added. Edit the CSVfile to correct any issues and try again.
CSVColumns for OUTLETObjects
A line that describes an Outlet object has the following attribute columns in this order:
l object_type - this value is always "OUTLET"l pdu_ip - The IP address of the PDU that this is attached to.l pdu_proxy_address - If the PDU is in a daisy-chained configuration or console server configuration, enter the PDU's
position number in the chain or serial port number.l outlet_number - The outlet number on the side of the PDU for this outlet.l parent_object_type - This value is always "DEVICE"l parent_external_key - The unique identifier for the DEVICEthat this outlet serves.
Power IQ automatically creates Outlet objects when Raritan PXPDUs are placed under its management. If you create anOutlet object with a pdu_ip not under Power IQ management, the CSVfile generates an error.
CSVColumns for PDUObjects
You must add all PDUs to Power IQ before you can map them in the EDM.
A line that describes a PDU object has the following attribute columns in this order:
l object_type - This value is always PDU.l pdu_ip - The IP address of the PDU.
414

415
l pdu_proxy_address - If the PDU is in a daisy-chained configuration or console server configuration, enter the PDU'sposition number in the chain or serial port number.
l parent_object_type - One of DATA_CENTER, FLOOR, ROOM, AISLE, ROW, RACK.l parent_external_key - The unique identifier for the parent object. It can be a name, number, or any other kind of
text. This field must be unique to that parent object. Many "child" objects may have the same parent.
CSVColumns for CIRCUITObjects
You must add all PDUs to Power IQ before you can map them in the EDM.
A line that describes a CIRCUIT object has the following attribute columns in this order:
l object_type - This value is always CIRCUIT.l pdu_ip - The IP address of the PDU.l pdu_proxy_address - If the PDU is in a daisy-chained configuration or console server configuration, enter the PDU's
position number in the chain or serial port number.l panel_number - If the circuit is located in a panel, enter the panel number.l circuit_number - The circuit's numberl parent_object_type - A circuit's parent_object is always DEVICE.l parent_external_key - The parent DEVICE's external key. This field must be unique to that parent object. Many
"child" objects may have the same parent.
CSVColumns for SENSORObjects
Sensors must have unique labels.
A line that describes a SENSOR object has the following attribute columns in this order:
l object_type - This value is always SENSOR.l pdu_ip - The IP address of the PDU the sensor is attached to.l pdu_proxy_address - If the PDU is in a daisy-chained configuration or console server configuration, enter the PDU's
position number in the chain or serial port number.l type - One of the following values: AIR_FLOW,, AIR_PRESSURE, CONTACT_CLOSURE, HUMIDITY, SMOKE,
TEMPERATURE, VIBRATION, WATER.l ordinal: The number of the sensor's position on the PDU.l parent_object_type - A sensor's parent_object is one of the following: DATA_CENTER, FLOOR, ROOM, AISLE,
ROW, RACK.l parent_external_key - The parent DEVICE's external key. This field must be unique to that parent object. Many
"child" objects may have the same parent.
Importing More than 2500 Objects
The EDM import file may contain a maximum of 2500 lines, one line per object. If you have an EDM with more than 2500objects, create multiple CSVfiles.

In this case, the contents of each CSVfile, and the order in which you import them is important.
All objects except for Data Center must have a valid parent when added. Importing a child object in file #1, and the parentobject in file #2, results in an error.
Make sure each file contains a parent object for each object, or import all high-level parent objects first, such as DataCenter and Room, then import the lower-level child objects in subsequent files.
416

417
Structure of the EDM Import File
The EDM import file must be in .CSVformat.
General structure:
l One Object per line.l All Objects except for a Data Center list another valid object as a parent.l All Objects have a unique key for their type.
Within a single CSVfile, object order is not important. All objects are processed at the same time.
The CSVfile has a maximum length of 2500 lines, meaning a maximum of 2500 objects can be imported at one time. SeeImporting More than 2500 Objects for details on importing multiple files. Object order and import order are important inthis case.
Object key:
l An object's unique identity is a combination of its object type and its object key, which is called an external key.This means you could have two objects with the same name, as long as they are different types of objects.
However, if two lines are both type "DEVICE" and both have an external key "Sales1", Power IQ sees only onedevice object with the key "Sales1". In this case, it uses the last DEVICEobject identified as "Sales1" as the descrip-tion for that device.
l The columns required for each object varies, depending on the object type.l All columns are separated by a comma.l Most columns containing text information can be up to 64 characters long. These columns can contain any char-
acter except for a comma.l The custom_field_1, custom_field_2, external_key and parent_external_key fields can be up to 255 characters
long. These columns can contain any character except for a comma.
Note: Currently import EDM does not support objects above Data Centers i.e Region, Country, Territory, City

CSVColumns for DATA_CENTER Objects
A line that describes a Data Center object has the following attribute columns in the order listed.
All columns are separated by a comma.
Note: The attribute columns toward the end. For example: by providing the cost of energy for the data center, Power IQcan calculate the cost of running the data center in an Analytics report. Report can be filtered to include only a smallerobject, such as a Rack. See Configuring Charts.
l object_type - this value is always "DATA_CENTER"l external_key - The unique identifier for this object. It can be a name, number, or any other kind of text. This field
must be unique.l name - The name of the data center.l contact_name - The name of the contact for this data center.l contact_phone - The phone number for the contact for this data center.l contact_email - The email address of the contact for this data center.l company_name - The name of the company that owns this data centerl city - The city where the data center resides.l state - The state/province where the data center resides.l country - The country where the data center resides.l peak_kwh_rate - The cost per kilowatt hour during peak hoursl off_peak_kwh_rate - The cost per kilowatt hour during off-peak hoursl peak_begin - The time the peak hours begin.l peak_end - The time the peak hours end.l co2_factor - The co2 factor for this site. This indicates thse amount of carbon dioxide produced per kWh.l cooling_factor - The cooling factor per kw energy used. This is the energy used for cooling, or how many kilowatts of
energy are used to cool 100 kilowatts of power consumption.l custom_field_1 - A custom field for the user to specify.l custom_field_2 - A second custom field for the user to specify.l capacity - The peak capacity in kilowatts, specified with up to two decimal places.
418

419
CSVColumns for FLOOR, ROOM, AISLE, and ROWObjects
Lines that describe a Floor, Room, Aisle, or Row have the following attribute columns in this order:
l object_type - One of the following values: FLOOR, ROOM, AISLE, ROWl external_key - The unique identifier for this object. It can be a name, number, or any other kind of text. This field
must be unique.l name - The name of the object.l parent_object_type - One of DATA_CENTER, FLOOR, ROOM, or AISLE, as described previously.l parent_external_key - The unique identifier for the parent object. It can be a name, number, or any other kind of
text. This field must be unique to that parent object (however, many "child" objects may have the same parent).l capacity - The peak capacity in kilowatts, specified with up to two decimal places.

CSVColumns for RACK Objects
A line that describes a Rack has the following attribute columns in this order:
l object_type - RACKl external_key - The unique identifier for this object. It can be a name, number, or any other kind of text. This field
must be unique.l name - The name of the object.l parent_object_type - One of DATA_CENTER, FLOOR, ROOM, AISLE, or ROW, as described previously.l parent_external_key - The unique identifier for the parent object. It can be a name, number, or any other kind of
text. This field must be unique to that parent object (however, many "child" objects may have the same parent).l location - an optional field that can be used to identify where rack sits in a row or aisle.l capacity - The peak capacity in kilowatts, specified with up to two decimal places.l override_upper_critical_percent - Value to override the default upper critical percent for rack threshold. See Set
RackCapacityand Override Threshold Percentages.l override_upper_warning_percent - Value to override the default upper warning percent for rack threshold. See Set
RackCapacityand Override Threshold Percentages.
The Rack model object is similar to the Floor, Room, Aisle and Row objects. The exception is the location value. Thisvalue is intended to make the rack easier to identify, and can be given a location value. For example: "3rd Rack" to indic-ate the third rack in a particular row.
It can also use some other identifying trait. For example: "Yellow" if the rack has a yellow color.
420

421
CSVColumns for DEVICEObjects
A line that describes a Device object has the following attribute columns in this order:
l object_type - this value is always "DEVICE"l external_key - The unique identifier for this object. It can be a name, number, or any other kind of text. This field
must be unique.l name - The name of the data center.l parent_object_type - This value is always "RACK".l parent_external_key - The external key for the parent rack.l customer - The customer using this device.l device_type - The type of device. For example: "exchange server" or "test unit".l power_rating - The power rating of this device in watts or VA.l decommissioned - Indicates whether this device has been decommissioned or not. This value is either "true" or
"false".l custom_field_1 - A custom field for the user.l custom_field_2 - A second custom field for the user.l device_ip - The IP address of the device. Required when also importing a graceful shutdown command.l shutdown_command_name - The name of the shutdown command assigned to this device. See Add Shutdown
Commands.l shutdown_wait_time - The number of seconds Power IQ should wait for the shutdown to complete before powering
off the associated outlet. See Enable Graceful Shutdown for an IT Device.
Sample CSVfor a device with a graceful shutdown command:
DEVICE,Device -- 54,Web Server 7,RACK,Rack -- 12,Marketing,Linux Server,,false,Dell PowerEdge R910,Tag#
336549,192.168.43.142,Marketing Linux Servers Shutdown Commands,5
Sample CSVfor a device without a graceful shutdown command:
DEVICE,Device -- 55,Router,RACK,Rack -- 12,Marketing,Cisco Router,,false,Cisco 7600 Router,Tag#044142,,,

Exporting an EDM
Power IQ can export the existing EDM, as well as any unmapped PDUs, circuits, and sensors, as a CSVfile. Use the file toedit and re-import, as a backup, or as a template for creating a new file.
Power IQ exports all object mappings as a single CSVfile, regardless of how many objects it contains. If you want to re-import a file that contains more than 2500 objects, separate them into multiple CSVfiles.
Note: To find unmapped PDUs, circuits, and sensors in the exported file, look for objects with a blank "parent_external_key".
1. In the Settings tab, click Enterprise Relationships.2. In the CSVData Mapping Actions area, click Export Relationships.
422

423
Generate a Default EDM
If you've added PDUs to Power IQ, you can generate a default EDM. You can customize the default EDM using the menuoptions in the Data Centers tab, or use export, edit the file, and re-import.
Generating a default EDM deletes all mappings already configured.
The default EDM contains:
l 1 data centerl 1 rooml 1 aislel 1 row per type of facility item, including CRAC, floor PDU, floor UPS, power panel, standalone meterl 1 rack per rack PDU
1. In the Settings tab, click Enterprise Relationships in the Data Management section.2. Click Generate Default Enterprise Relationships in the CSVData Mapping Actions section.3. Click OK to confirm.

Associate a Circuit or Outlet with an ITDevice
To allow for power control functions for outlets, you must associate your IT devices with their outlet. To allow for chartingdevices, the IT devices must be associated to their circuits or outlets.
1. In the Data Centers tab, select the IT device in its rack. The IT device details page opens.2. In the Power Connections section, click Associate, then choose Outlets or Circuits.
3. The Associate Entity dialog opens. Begin typing the circuit or outlet name in the Search field. A list of unassociatedcircuits or outlets appears that match your search.
Note: If a list does not appear, there are no unassociated outlets or circuits in Power IQ.
4. Select the circuit or outlet in the list, then click Add.
424

425
Clearing Enterprise Relationships
Clearing the enterprise relationships deletes the EDM. Deleting the EDM will disrupt all configured charts that are based onEDM relationships.
1. In the Settings tab, click Enterprise Relationships in the Data Management section.2. In the CSVData Mapping Actions box, click Clear Enterprise Relationships.3. Click "Clear all enterprise relationships" in the warning message to confirm.

Viewing Enterprise Relationship Summaries
The summary of enterprise mappings provides an overview of the EDM configured in Power IQ.
l In the Settings tab, click Enterprise Relationships. The summary is in the top left corner.
426

427
Viewing Orphaned Systems Information
The Orphaned Systems information shows whether there are any PDUs in Power IQ that are not mapped to a parentobject in the EDM. PDUs that are not in the EDM cannot be included in charts.
l In the Settings tab, click Enterprise Relationships in the Data Management section of the page.
The Orphaned Systems information is in the top right section of the page that opens.
See the table for explanations and possible action required.
All Outlets Mapped Some Outlets Mapped No Outlets Mapped
PDU Mappedto the Enter-prise
The number of PDUs that aremapped to a parent object,such as a rack, and have alloutlets mapped to an ITdevice.
No action is required.
The number of PDUs that aremapped to a parent object, suchas a rack, and have at least oneoutlet mapped to an IT device.
No action is required.
The number of PDUs that aremapped to a parent object,such as a rack, but do not haveany outlets mapped to ITdevices.
No action is required.
PDU NotMapped tothe Enter-prise
The number of PDUs that arenot mapped to a parentobject, such as a rack, buthave all outlets mapped to ITdevices.
Action required!
If you have unmapped PDUs,you must assign them to a par-ent object for analytics to per-form correctly.
See Finding UnmappedPDUs on the next page.
The number of PDUs that are notmapped to a parent object suchas a rack but have at least oneoutlet mapped to an IT device.
Action required!
If you have unmapped PDUs, youmust assign them to a parentobject for analytics to performcorrectly.
See Finding Unmapped PDUson the next page.
The number of PDUs that arenot mapped to a parent object,such as a rack, and have zerooutlets mapped to a device.
Action required!
If you have unmapped PDUs,you must assign them to a par-ent object for analytics to per-form correctly.
See Finding Unmapped PDUson the next page.

Finding Unmapped PDUs
There are several ways to find unmapped PDUs so that you can map them to parent objects in the EDM.
All PDUs must be mapped to a parent object, such as a rack. PDUs that are not in the EDM cannot be included in charts.
See Viewing Orphaned Systems Information.
To find unmapped PDUs in CSVfile export:
1. In the Settings tab, click Enterprise Relationships.2. Click Export Relationships.3. In the CSVfile, find the section labeled "# The following section contains the current list of PDUs and the PDU
column headers for use during import."4. In that section, find the "parent_object_type" column. Rows without data in the "parent_object_type" column are
unmapped PDUs.5. Map the unmapped PDUs to parent objects in a data center.
This method maps unmapped PDUs to an "Unassigned Data Center" parent object so that you can view the PDUs in theData Centers tab. Then, you can drag and drop the PDUs to the correct position beneath a parent object, such as a rack.
1. In the Settings tab, click Enterprise Relationships.2. Click Generate Default Enterprise Relationships.3. When the generation completes successfully, click the Data Centers tab and find the Unassigned Data Center.4. Expand the Unassigned Data Center. All the previously unmapped PDUs are assigned to this data center object.5. Drag and drop the PDU objects to assign them to the correct parent objects, such as racks, within the correct data
center.6. When you attempt to manually associate PDUs to a parent object in the Data Centers tab, only unmapped PDUs
are available in the search tool.7. In the Data Centers tab, select the parent object, such as a rack, that you want to associate an unmapped PDU
with.8. Click Add > Facility Item association.9. In the Associate a PDU dialog, select an unmapped PDU in the PDU IP Address field, and click OK. The PDU is
mapped to the data center parent object.
428

429
Configuring Custom Fields
The Data Center, Device, and PDU items each contain two custom field values.
Custom fields display in the Data Centers tab's hierarchy on the object page, for all 3 types of custom field. PDU customfields also display in the Facility Items tab in the PDU Details. IT Device custom fields also display in the IT Devices tab inthe Device Details. You can use custom field values as filters when configuring charts. See Configuring Charts.
By default, these are named:
l Data Center Custom Field 1 and Data Center Custom Field 2l IT Device Custom Field 1 and IT Device Custom Field 2l PDU Custom Field 1 and PDU Custom Field 2
Rename the field to specify the information it will contain.
Example
To add data about the department that uses a group of devices, rename the IT Device Custom field "Department," andenter department names in the field for each device in Power IQ.
1. In the Settings tab, click Enterprise Relationships in the Data Management section.2. In the Configure Custom Fields box, enter the new field name next to each custom field.3. To assign data to the field, enter the data in the newly renamed custom field in either the Data Centers tab on the
objects page or in the Facilities Items or IT Devices tab in the details page. Data Center custom fields can only beaccessed in the Data Centers tab. Alternatively, you can use CSVimport to update the information. See ImportingEDM Object Mappings.

Chapter 12:Facility Items
Power IQ can manage your data center's facility items, including CRACs, UPSs, Floor PDUs, Standalone Meters, andPower Panels.
You can work with these objects in Power IQ the same way you work with rack PDUs. The Facility Items tab, which lists allrack PDUs, also contains all facility items.
When you flag your facility items as part of your data center's total power, Power IQ calculates your Power Usage Effect-iveness (PUE). See PUE- Power Usage Effectiveness.
Note: Screenshots of smart pages are for illustration purposes only, and do not contain real, polled data.
430

Using the Facility Items Tab
The Facility Items tab contains a list of all PDUs added to Power IQ, even if they have not been mapped in the EDM. SeeCreating Your EDM.
The Facility Items List can be configured to meet your needs:
l Filter the Facility Items List on the facing pagel Configuring the Number of Items in the Facility Items List on page 438
431

432
Filter the Facility Items List
You can customize your view of the Facility Items List by using filters, sorting, and hiding or displaying columns of data.
See Customizing Your View of Facility Items, IT Devices, and Events on page 182.
l In the Facility Items tab, all items in the system display in a list.l The Facility Items list can be filtered by specifying the search criteria for any of the available columns.
l For filtering on numeric columns we can enter numerical operators (>,<,<=,>=,=,null,!null) in the filter box. Forexample entering “10>” would only display values greater than 10

l Columns can be sorted by clicking in the field header to toggle between Ascending and Descending order, or byclicking the arrow in the column header and selecting the desired sort option.
l Columns can be arranged by dragging and dropping into place.
433

434
l You can choose which columns appear in the grid by clicking the Show/Hide icon in the grid.

l Activities can be selected by clicking the Activities button in the toolbar
435

436
l Filter by PDU health: In the Health column filter, select the health statuses you want to view: Good, Warning, Crit-ical, Maintenance, or Decommissioned. For Good, Warning, or Critical, select the source for each status, eitherConnectivity or Active Events. Select multiple options as needed.
l If a PDU has multiple line readings in the Current column, all values are shown separated by commas. This columncan be filtered using numerical operators (>,<,<=,>=,=,null,!null) in the filter box.” For example entering “10>” wouldonly display values greater than 10.
l Filter by inlet temperature: In the Inlet Temperature (C) column filter box, enter the number of degrees Celsius aswell as any of the numerical operators (>,<,<=,>=,=,null,!null) to view only PDUs with inlet temperature sensor read-ings in the correct range.
l The inlet temperature shown is the maximum reading for all inlet-positioned temperature sensors associated withthe PDU.
l Filter by PDU Type: Types of PDU include rack PDUs and facility items managed by dynamic plugin, such asCRACs or Floor PDUs. Add the Type column by selecting the checkbox.

438
Configuring the Number of Items in the Facility Items List
The number of PDU’s displayed is determined by the user's screen size and resolution. Use the vertical scroll bar to viewall of the Items in the grid.

Exporting the Facility Items List to CSV
Export the Facility Items to create a CSVfile containing all the data listed in the grid on the Facility Items tab.
If you have applied filters, the same filters will apply to the exported information.
The export PDUs CSVfile is not the same as the file used for importing PDUs into Power IQ. See Adding PDUs in Bulk withCSVFiles.
1. In the Facility Items tab, click the Settings icon in the upper right corner of the grid and select the Export Grid Datato CSVoption.
439

440
2. Save or open the file using the dialog that appears.
The exported file contains the following columns:
l Region Name
l Country Name
l Territory Name
l City Name

l Data Center Name
l Floor Name
l Room Name
l Aisle Name
l Row Name
l Rack Name
l Door Name
l Region ID
l Country ID
l Territory ID
l City ID
l Data Center ID
l Floor ID Room ID
l Aisle ID
l Row ID
l Rack ID
l Door ID
l ID
l Location
l MAC Address
l Serial Number
l Model
l Manufacturer
l Firmware Version
l Inlet Name
l Name
l Dynamic Plugin Name
l Current Status
l Overall Health (raw)
l Overall Health
l Proxy Index
l Health Label
l External Key
441

442
l Custom Field 1
l Custom Field 2
l Decommissioned At
l Maintenance Enabled
l Name
l Type Code
l Inlet Temperature (F)
l IP Address
l Latest Active Power (W)
l Latest Apparent Power (VA)
l Latest Current (A)
l Latest Pole Current (A)
l Latest Status Start Time
l Latest Status End time
l Latest Status (raw)
l Latest Status
l Severity of Latest Status (raw)
l Severity of Latest Status

Launch the Web Interface for a Raritan PXPDU
You can launch the web interface for a Raritan PXPDU in Power IQ.
Users must have identical credentials on Power IQ and on the target Raritan product, and be logged in to Power IQ withthose credentials for single sign on to succeed. Single sign on must be enabled in Settings > Single Sign On. See EnablingSingle Sign On for Raritan PDUs.
1. In the Facility Items tab, select a Raritan PXPDU.2. Hover your mouse on the Actions column, then click the center icon to go directly to this PDU in a new window. If
single sign on is not enabled, log in.
443

444
Quick Search for Facility Items, Racks, Doors, and ITDevices
You can use the Quick Search field at the top of the Power IQ interface to search for a facility item, rack, door, or IT device.
Simply type the name of a facility item, rack, door, or IT device to search by name.
Type the IP address of a facility item or IT device into the Quick Search field to search by IP address.
If a match is found, Power IQ displays the appropriate smart view.
Note: The facility item display setting affects the Quick Search feature. If IP address is selected in the display settings,you can search facility items by either name or IP address. If facility item name is selected, only searching by facility itemname is permitted. Devices can always be searched by either name or IP address regardless of the PDU display pref-erence. See Configuring Facility Item Display Settings - View Facility Items by IP or Name on page 181.

Adding Facility Items to Power IQ Management
You can add facility items to Power IQ using the dynamic plugins function. The process for adding facility items is:
1. Create a dynamic plugin capable of managing your object. See Dynamic Plugins.2. Add the object using the Add a PDU function. See Adding PDUsto Power IQ. If you use a custom mapping dynamic
plugin, see Adding PDUs with Custom Dynamic Plugins.3. Make sure the object is included in your enterprise data model (EDM), which displays in the Data Centers tab.
Objects must be in the EDM for inclusion in PUEcalculations and Dashboard charts. See Enterprise Relationshipsand the EDM. See also Organizing Facility Items in the Data Center Browser.
Note: Some rack transfer switches are supported, and you do not need to create a dynamic plugin.
445

446
Viewing a Facility Item
Each facility item has a smart view page, which you can access from different tabs.
For details on the smart views:
l RackPDU Smart Viewl RackSmart Viewl CRAC Smart Viewl FloorPDUsSmart Viewl FloorUPS Smart Viewl PowerPanelsSmart Viewl Standalone MetersSmart View
View a PDU in the Data Centers tab:
l The Data Centers tab displays your EDM. See Enterprise Relationshipsand the EDM. Find your PDU within the EDMhierarchy, and click it to access the smart view.

Rescanning Facility Items
You can rescan a facility item to poll it and update its status from the Facility Items list or the item's smart page. You canrescan items in bulk from the Facility Items list.
1. In the Facility Items tab > Facility Items list, select the PDUs you would like to rescan. Click the Rescan link.
2. The selected items will be rescanned. Click the Dismiss button to dismiss the status popup.3. When the task is completed, click the OK button.
To rescan from the item's smart page:
1. On the item's smart page, click the Actions menu > Rescan.2. The rescan task will run.3. When the task is complete, click the OK button.
Note: SNMPv3 PDUs will not manually re-scan after powering Off/On. The re-scan does not occur until after the nextpolling cycle.
447

PDUs
In the GUI and in this documentation, Power IQ uses the term PDU to encompass any device that Power IQ polls togather power or sensor data. In some cases, PDU and Facility Item may be used interchangeably.
When you see the terms PDU and Facility Items in the product interface, remember that they include every polled object:rack PDUs, CRACs, floor PDUs, floor UPSs, power panels, standalone meters, and environmental sensor aggregators.
In this guide, the following terms are also used:
l Rack PDUl Facility Items: CRAC, floor PDU, floor UPS, power panel, and standalone meter.
448

Rack PDU Smart View
A rack PDU smart view may contain the following sections, depending on the PDU:
l Rack PDU Energy Trends on the facing pagel PDU Elements - Rack Smart View and Rack PDU Smart View on page 463l Rack IT Devices on page 460l Rack PDU Readings on page 451l Rack PDU Sensors on page 454l Rack PDU Details on page 454l Rack PDU Event Listing on page 455l Rack PDU Asset Strips on page 456
449

450
Rack PDU Energy Trends
Energy Trends display at the top of the rack PDU smart view.
l Active Powerl IT Energyl Line Current - one trend-line for each line in the PDUl Circuit Breaker Current - one trend-line for each circuit breaker in the PDU

Rack PDU Readings
The Readings section of the Smart PDU view contains the power readings for the PDU.
The Inlet Readings shows the Voltage, Current, Active Power, Apparent Power, Power Factor, and Energy for each inlet ofthe PDU. Readings are shown for each inlet on a multiple inlet PDU.
The Inlet/Outlet Readings section for an inline meter shows the Voltage, Current, Active Power, Apparent Power, PowerFactor, and Energy for each inlet/outlet.
The Line Readings section shows Voltage, Current, and the available current for each line.
The Circuit Breakers Readings section shows the Current in amps and the available current for each circuit breaker.
The Sensor Readings section shows the latest reading for each attached sensor, and the ordinal number of the sensor onthe PDU.
The status at the bottom of the Readings section shows the latest reading time.
451

452
Inlet Readings and Line Readings for Three Phase PDUs
For three phase PDUs, the Inlet Current and Voltage readings are maximum current and minimum voltages of the indi-vidual line readings of the inlet.
The line readings voltages are "line-to-line."
Description Example
The inlet voltage reading is the Minimum of the line voltages. Min Line Voltage
The inlet current reading is the maximum of the line currents. Max Line Current
The line voltage readings are from line to line.
L1 = L1-L2
L2 = L2-L3
L3 = L3-L1

Multi-Inlet PDUReadings
A multi-inlet PDU displays readings for each inlet, and for each line of each inlet, the same as single inlet PDUs.
The Readings section of the rack PDU smart view contains this information.
Residual Current Readings
Residual current monitoring is available in Power IQ 6.1.0 and above for Raritan PX3s.
Residual current can be monitored on a facility item smart page, under Inlet Readings in the Readings section. The Resid-ual Current column is located by default between the Current and Active Power columns.
The unit for residual current is amps. If the value in Power IQ is null, "N/A" will be displayed in the Residual Current column.
The Residual Current value in Power IQ is mapped to the Residual Operating Current in the Raritan PDU.
Note: Residual current monitoring is supported for Raritan PX3 facility items only.
453

454
Rack PDU Sensors
A sensors list displays in the rack PDU smart view when attached sensors are detected.
The sensor label is clickable and opens the sensor smart view. If the sensor is not associated in the EDM, the label is notclickable, and there is no smart view. See Sensors.
Rack PDU Details
The Details section contains all information about the PDU except for the IP address, which may or may not displaydepending on the PDU display setting. See Configuring PDU DisplaySettings- ViewPDUsbyIP orName.
Click the Belongs To link to view the rack, or other parent object in the EDM.

Rack PDU Event Listing
The Event Listing section of the rack PDU smart view shows all events for the PDU.
1. Click an Event link to open the Event details page.2. Select the checkbox for one or more events, then click Clear Selected Events to clear them. See Clearing Events.
455

456
Rack PDU Asset Strips
Power IQ can detect asset management strips connected to rack PDUs.
The asset strip information displays in the rack PDU smart view.
1. In the row of the asset tag whose color you want to change, double click the hexadecimal color code.2. Select the new color from the chart of colors.
The LED color on the strip changes.
3. Copy the asset tag ID number from the PDU smart view for the PDU connected to the asset strip.4. In the IT Devices tab, select the device you want to associate with the asset tag.5. In the Device details page, paste the code into the Asset Tag Id field then click Save.

Asset Strip and Tag Events
Power IQ can receive an event whenever an asset strip or tag is moved.
457

458
Rack PDU Smart View
A rack PDU smart view may contain the following sections, depending on the PDU:
l Rack PDU Energy Trends on page 450l PDU Elements - Rack Smart View and Rack PDU Smart View on page 463l Rack IT Devices on page 460l Rack PDU Readings on page 451l Rack PDU Sensors on page 454l Rack PDU Details on page 454l Rack PDU Event Listing on page 455l Rack PDU Asset Strips on page 456

Rack Energy and Environmental Trends
The rack smart view shows Energy and Environmental Trends at the top of the page.
The first and last data points in the trend are shown at the left end of the chart.
The minimum and maximum values in the trend are shown at the right end of the chart.
l Environmental sensor chartsl Temperature, one chart per sensor.l Humidity, one chart per sensor.
Total Active Power for all devices and PDUs in the rack, including circuits associated with devices in the rack.
459

460
Rack IT Devices
The IT Devices section of the Smart Rack view contains a list of all devices that are connected to one or more outlets orcircuits. If a device does not have any associated outlets or circuits, it will not appear in this list. Devices without asso-ciated outlets or circuits do still appear in the tree view.
Devices that have associated circuits display the current and active power of the circuit. You cannot control power to cir-cuits.
The outlets associated with each device display beneath the IT device. There is a checkbox for each outlet, to select it forpower control operations.
Each outlet shows a Trend chart showing the active power trend.
Each device shows outlet status and an Active Power reading, per device and per outlet.
l Outlets that are powered on display in black with ON as the status in the Status column.l Outlets that are powered off display in gray with OFF as the status in the Status column.
At the bottom of the IT Devices section, select the readings and time period to include in the fields.
l Trend: minimum, maximum or average readings. Not available for past hour readings.l For the past: hour, day, week, month.
To perform power control on devices:
l Select the checkboxes for each outlet associated with a device. All outlets are grouped beneath the device.
To select all devices in a rack, select the top checkbox.
l Choose Power Control > On, Power Control > Off, or Power Control > Cycle.

Note: Power Off and Power Cycle operations on this page do not use graceful shutdown, even if it is enabled for a selec-ted device.
461

462
Rack Details
The Actions button on the Smart Rack view opens options for changing the rack name, location, external key, and capa-city, editing for user permissions on this rack, and tags.
1. Click the Actions button, then choose an option.2. Choose Edit Details.3. Enter a new rack name, location, external key, or capacity and overrides. See Set Rack Capacity and Override
Threshold Percentages for details on these fields. Click OK.4. Choose Edit Permissions.5. View and change the roles and permissions assigned for users of this rack. See Assign Roles within a Data Center
for more details.6. Click Add Role to > Add User Role or Add Role to > Add Group Role. Adding a Group Role will give permissions
selected to all users in the group. Then, select the user or group who needs permission to this object. rack.7. Select the role to allow in the Roles list. Click OK.8. Choose Edit Tags.9. Tags are used in tabular reports. See Reports and Tags.

PDU Elements - Rack Smart View and Rack PDU Smart View
The PDU Elements section appears in both the rack and rack PDU smart views.
This section contains a list of all outlets in the rack, or all outlets on the PDU, respectively.
Note: Circuit breaker information is in the rack PDU's Readings section.
The trend chart's topics is selected via the dropdown at the bottom of the section: active power or current. Data includedin the trend chart is filtered by the minimum/maximum/average selection, and the time period dropdown can be used todisplay data for the past hour, day, week, or month.
The last column shows the latest poll data for either Active Power or Current, as selected. The min/max/average and timeperiod selections do not affect this reading. For Active Power (W), the latest poll reading is shown. For Current (A), thelatest poll reading is shown.
Each outlet shows the outlet status and a trend chart showing the active power trend or the current (amps) trend.
Note: In Internet Explorer 7 and 8, click Load Chart to view the trend chart.
463

464
l Outlets that are powered on display in black with ON as the status in the Status column.l Outlets that are powered off display in gray with OFF as the status in the Status column.
Apparent Power, Voltage, and Unutilized Capacity columns also display in the Rack PDU Elements section. Thesecolumns do not display at the rack level.
The minimum/maximum/average setting and the time period setting change what data is included in the small trendcharts. The last column always displays the latest poll data.
At the bottom of the PDU Elements section, select the readings and time period to include in the fields.
l Trend: minimum, maximum or average readings. Not available for past hour readings.l For the past: hour, day, week, month.
Select either Active Power or Current in amps.
To perform power control on outlets:

1. Select the checkboxes for each outlet.2. To select all outlets in a rack, select the top checkbox.3. Choose Power Control > On, Power Control > Off, or Power Control > Cycle.
Note: Power Off and Power Cycle operations on this page do not use graceful shutdown, even if it is enabled for a selec-ted device.
465

466
3 Phase PDU Outlet Readings for Raritan PX1
Power IQ uses the following algorithm to convert three line readings into one outlet reading for current and voltage only.This algorithm applies only to 3 phase PX1 inline meters.
In the algorithm, "LineX_Readings" is a list of all the readings for a given time period.
MAX = MAX(MAX(Line1_Readings), MAX(Line2_Readings), MAX(Line3_Readings))AVG = MAX
(AVG(Line1_Readings), AVG(Line2_Readings), AVG(Line3_Readings))MIN = MAX(MIN
(Line1_Readings), MIN(Line2_Readings), MIN(Line3_Readings))

PDUs with Fuses
Most Raritan PDUs monitor load at the internal PDU circuit breaker. Some PDUs have fuses instead of circuit breakers.
If a PDU has fuses, information about them displays in Power IQ with the "Circuit Breaker" label.
PXmodels with an F1 suffix have a fuse instead of a circuit breaker.
467

468
Rack Transfer Switches
Rack Transfer Switches are high speed switches that provide power from one of two sources depending on settings andavailablity. Power IQ supports several Raritan and APC rack transfer switches.

Transfer Switch Smart View
The header in the transfer switch smart view shows the switch's operating status, such as Normal or Standby.
Transfer Switch Energy Trends
Energy Trends display at the top of the rack transfer switch smart view.
l Active Powerl Energyl Inlet Current - one trend-line for each line in the transfer switchl Circuit Breaker - one trend-line for each circuit breaker in the transfer switch
Some data may not be supported by your transfer switch model.
Transfer Switch Readings
Readings display in the second section of the smart view.
Configure the columns by clicking the arrow in a heading, then selecting options to display, hide, or sort.
Transfer switch readings come from the inlets, lines, circuit breakers, and sensors.
This sample smart view shows one possible configuration of a transfer switch.
To see details on the transfer switch status, see the Details section of the smart view. See Transfer Switch Details.
Transfer Switch Elements
Elements display in the third position in the smart view. The title "PDU Elements" is used for all types of PDUs and facilityitems.
The default Elements view for transfer switches includes this information:
l PDU Element: outletsl IT Device: IT devices associated with outlets include a link to the IT device page.l Trend: small trend chart for active power. Change the trend to min/max/average active power or current using the
fields below it.l Active Power (W): latest poll reading for active power. Change the latest poll reading to Current using the field
below it.
Transfer Switch Details
Details are the fourth section in the smart view.
See the details section for the ordinal of the Active and Preferred Inlet of the transfer switch.
469

470
Transfer Switch Event Listing
Event listing is the fifth section in the smart view.
Events are created from transfer switch traps. For transfer switch functions, state change traps are supported. For RaritanPX3TS transfer switches, additional traps are supported for other functions.
See supported traps here:
l APC Transfer Switch Supported Eventsl Raritan PX3TS Transfer Switch Supported Events
To export the events to CSV, click the Save icon at upper right.
To clear events, select the checkboxes, then click Clear selected events.
To view event details, click the Event link.

PDU Connectivity Health Statuses
These statuses appear in the mouse-over text when your mouse hovers over the Health column for a PDU on the PDU list-ings page. The statuses also appear in the Health section of the PDU smart view.
When Health Polling is enabled, results of both the Health Pollers' pings and the Data Poller's data collection attempts areused to update the status. See Configuring Health Polling.
Status Explanation
OK Most recent polls of the target PDU was successful.
NewThe system has not yet completed a successful scan or poll of the PDU. This is typical for sys-tems that have been recently added.
UnknownThe system has not yet completed a successful scan or poll of the PDU. This is typical for sys-tems that have been recently added.
Degraded
This status indicates certain non-critical aspects of the poll failed. The issue is most commonlycaused when data-buffered data retrieval is enabled in Power IQ but is configured with a "read"SNMP community string instead of a "write" community string. In this case, Power IQ can stillperform a poll, but it won't be able to enable data buffering and set the appropriate sample rateon PDUs that support data buffering. Other possible causes of this error are incompatibilityissues with the PDU running older firmware revisions, or if Power IQ is unable to persist sensorreadings data to CSVfile.
Poll incomplete
Certain aspects of the scan or poll failed, such as retrieving the model name, persisting outletsensor data to CSVfile, or retrieving information via SNMP. This can be due to an incompatibilitywith this version of the PDU or because the SNMP is misconfigured or the agent is disabled onthe target PDU.
Make sure the PDU's SNMP settings are correct. See Editing PDUs under Power IQ Man-agement.
Application error
If the PDU is associated with a dynamic plugin, an index mapping may have failed to resolve.Check the dynamic plugin log for mapping resolution errors.
If the PDU is not associated with a dynamic plugin, this indicates an unexpected applicationerror. Contact Professional Services on the Sunbird Support portal at http://sup-port.sunbirddcim.com/support/home.
No contact
This indicates that Power IQ was unable to communicate with the PDU over any of the sup-ported management protocols and so can't discover and manage the PDU. The most oftenused protocol is SNMP, but a few PDU models are managed using other protocols like HTTP.There are a number of possible root causes for this.
This may indicate that the IP address is incorrect.
471

472
Status Explanation
Correct the PDU's IP address. See Editing PDUsunderPower IQ Management
Invalid Login Cre-dentials
This indicates that the PDU was configured with an invalid administrative username or pass-word. SNMP communication is still possible and Power IQ can manage the PDU, but firmwareupgrades will not work.
Missing credentialsThis indicates invalid or missing credentials.
Correct the PDU's credentials. See Editing PDUs under Power IQ Management.
Unmanageable
This indicates that Power IQ contains no plug-in capable of managing the PDU. The target PDUis not supported by this version of Power IQ, or the plug-in requires a proxy index and one wasnot specified.
Specify an appropriate proxy index if one is required but was not specified.
Make sure Power IQ supports the PDU. See the list of supported PDUs on the Sunbird AddonsSite.
Create a dynamic plugin for the PDU. See Dynamic Plugins
Data CollectionFailed
This indicates a PDU has not responded to the Data Poller after all retries.
Event is generated: "Lost Connectivity: Data Collection Failed"
Ping FailedThis indicates a PDU has not responded to the Health Poller's pings after all retries.
Event is generated: "Lost Connectivity: Ping Failed."
No Com-munication
This indicates a PDU has not responded to the Health Poller OR the Data Poller after all retries.

Troubleshooting Connectivity Health
A PDU's Ping Failed, No Communication, or Data Collection Failed Connectivity health status may be caused by one ofthese common problems. Troubleshoot using the following checklist.
Cause Solution
The user has configured Power IQ with the wrong com-munity string for the PDU.
Verify that Power IQ is configured with the correct SNMP com-munity string.
The user has configured Power IQ with the wrong IPaddress for the PDU.
Verify that Power IQ is configured with the correct IP address.
There is an actual network connectivity issue betweenPower IQ and the target PDU.
Make sure the required ports are open between Power IQ andthe PDU. See Ports Open Between Power IQ and PDUs.
Verify that there aren't any other network issues preventingcommunication between Power IQ and the target PDU.
The PDU is powered off or not connected to the net-work.
Confirm that the PDU is powered on and is responding torequests over the network. For example, responding to ICMPecho or PINGrequests.
SNMP support is disabled on the PDU.
Some PDUs allow the SNMP agent to be started and stoppedthrough the PDU's management interface. Verify that SNMPis running on the PDU and that it is responding to SNMPrequests by running SNMP diagnostics from Power IQ orthrough 3rd party tools.
The configured SNMP timeout and retry value areinsufficient for your use case. For example, managingremote PDUs over a WAN and due to network latencyor bandwidth limitations, the default SNMP settingsresult in a large number of SNMP timeouts.
If you suspect that the default SNMP settings used by PowerIQ are insufficient it may be possible to correct the issue bymodifying the default SNMP settings used by Power IQ. SeeAdvanced Thread Pooling Settings.
The SNMP agent on the target PDU is not respondingto requests. One possible reason is that the PDU's pro-cessor is busy handling other tasks and is temporarilyunable to respond to SNMP requests.
Verify that SNMP is running on the PDU and that it is respond-ing to SNMP requests by running SNMP diagnostics fromPower IQ or through 3rd party tools. If the SNMP agent on thePDU is the issue, restarting the SNMP agent on the PDU orrebooting the PDU may correct the problem.
473

474
Trend Chart Settings in Smart Views
The large trend charts at the top of each smart view are configurable.
At the bottom of the trend charts section, select the readings and time period to include in the fields.
l Trend: minimum, maximum or average readings. Not available for past hour readings.l For the past: hour, day, week, month.

Active Power Trends for Devices
In the Data Centers tab, an IT device displays the Energy and Environmental Trends at the top of its page. Only ActivePower data is available in the trend chart.
If the device has zero or only one connection to outlets or circuits, the trend chart displays the total active power only.
If the device has more than one connection to outlets or circuits, the trend chart displays both the total active power andone active power chart per connection.
The first and last data points in the trend are shown at the left end of the chart.
The minimum and maximum values in the trend are shown at the right end of the chart.
To change the trend chart settings, see Trend Chart Settings in Smart Views.
475

476
Actions Menu in Smart Views
Smart views for rack PDUs and other facility items include an Actions menu in the top right corner.
1. Choose Actions> Edit to open the edit page for PDU credentials. See Editing PDUs under Power IQ Management.2. Choose Actions> Remove to delete the PDU from Power IQ. The PDU and all data collected from it are deleted
when you remove a PDU. Click Remove PDU(s) and Data to confirm.3. Choose Actions> Rescan to poll the PDU.4. Choose Actions> Edit Permissions to view and change the roles and permissions assigned for users of this PDU.
See Assign Roles within a Data Center for more details.5. Click Add Role to > Add User Role or Add Role to > Add Group Role. Adding a Group Role will give permissions
selected to all users in the group. Then, select the user or group who needs permission to this object.6. Choose Actions> SNMP Diagnostics to run SNMP walk on the PDU.7. Choose Actions> Launch to open the web interface for Raritan PXPDUs only. See Launch the Web Interface for a
Raritan PXPDU.

Native Support for Chatsworth eConnect PDUs
Power IQ 5.1.1 and higher have a built-in plug-in for Chatsworth e-Connect PDUs. When adding a PDU via the GUI, enter-ing the Proxy Index as an Integer or in Hex is now supported. When a user enters in Hex, it will convert to an Integer andvice versa.
The standard plugin will allow for Power Monitoring, Environmental Monitoring and Power Control.
Note: When entering the proxy index in Hex for PDUs that use the MAC address as the proxy index, including Chatsworthe-Connect PDUs, enter the last six digits of the MAC address only.
477

478
Once the Chatsworth PDU is discovered via SNMP, a smart page will be created. The smart page will displayMin/Max/Avg values for Power, Energy, Intel Currents, as well as Humidity and Temperature values. If the PDU has outlets,these will also be available to view the monitored data and to perform power control, and power cycling of the outlets.

Launching the Web Browser of the Chatsworth PDU
From the Actions menu on the PDU smart page, the user will be able to launch the web browser of the Chatsworth PDU.
To launch the browser, click Actions > Launch.
479

480
After clicking Launch, the user will be brought to the login page of the PDU itself.

Organizing Facility Items in the Data Center Browser
Some facility items you want to manage in Power IQ, such as floor PDUs, power panels, and UPSs may provide power tomultiple locations.
Objects may only have one location in the hierarchical Data Centers browser, so associate the object in the enterprisedata model using it's physical location. Standalone meters may be placed where it best helps you understand their data.
Example
A floor PDU is physically located on Floor A, but provides power to several locations, not all on that floor. Organize thefloor PDU on Floor A.
481

482
CRACs in the Data Center Browser
You can add a Computer Room Air Conditioner (CRAC) as a node in the Data Centers browser. Place the CRAC in theEDM in the location where it manages air, rather than the physical location of the CRAC controls.
Example
A CRAC serves Rooms 1, 2, and 3 of your data center. Organize the CRAC in the EDM at the Floor level that contains
these rooms.

CRACs
Computer Room Air Conditioners (CRAC) refers to any HVAC system that manages the temperature or humidity of a com-puter room. It does not refer to a standalone raised-floor unit that sits on the data center floor.
CRAC Smart View
Power IQ gathers power readings from the CRAC's inlet and inlet lines.
Note: The data Power IQ can gather depends on how you configure the dynamic plugin that manages the object. SeeDynamic Plugins. Power IQ displays all data gathered in a smart view. Access the smart view by clicking on the objecteither in the Facility Items tab or in the Data Centers tab.
A fully populated CRAC smart view includes:
l CRAC Energy Trendsl CRAC Readingsl CRAC Details
CRAC Energy Trends
Energy Trends display in the top section of the smart view.
Trend charts display data for the whole unit.
The trend can be configured to show minimum, maximum, or average over a selected time period, using the fields belowit.
CRAC energy trends show a trend line for two readings.
l Active powerl Energyl Current for each inlet pole
CRAC Readings
Readings display in the second section of the smart view.
Configure the columns by clicking the arrow in a heading, then selecting options to display, hide, or sort.
CRAC readings include the inlet and the inlet lines.
CRAC Inlet Readings shows the Voltage, Current, Active Power, Apparent Power, Power Factor, and Energy.
CRAC Inlet Line Readings for each line shows the Voltage, Current, and Unutilized Capacity
The status at the bottom of the Readings section shows the latest reading time.
483

484
CRAC Details
Details are the fourth section in the smart view.

Floor PDUs
Floor PDUs refers to an intelligent floor PDU system with inlets, panels, and branch circuits.
Floor PDUs Smart View
Power IQ gathers power readings from the FPDU inlets, panel inlets, circuits, and circuit poles.
The mapping of the inlets to panels to circuits and circuit poles is achieved through your dynamic plugin configuration.
Note: The data Power IQ can gather depends on how you configure the dynamic plugin that manages the object. SeeDynamic Plugins.
Power IQ displays all data gathered in a smart view. Access the smart view by clicking on the object either in the FacilityItems tab or in the Data Centers tab.
A fully populated FPDU smart view includes:
l FloorPDU EnergyTrendsl FloorPDU Elementsl FloorPDU Readingsl FloorPDU Details
Floor PDU Energy Trends
Energy Trends display in the top section of the smart view.
Trend charts display data for the whole unit.
The trend can be configured to show minimum, maximum, or average over a selected time period, using the fields belowit.
Floor PDU energy trends include a trend line for several types of readings.
l Active Powerl Energy
Current for each line of the primary inlet, if applicable. If the FPDU does not have a primary inlet, trend line for current doesnot display.
Floor PDU Readings
Readings display in the second section of the smart view.
Configure the columns by clicking the arrow in a heading, then selecting options to display, hide, or sort.
Floor PDU readings come from the inlets, panel inlets, circuits and circuit poles. floor PDUs come in many different con-figurations. Your configuration may vary.
This sample smart view shows one possible configuration of a three-phase floor PDU.
485

486
l 1 primary inlet with 3 linesl 2 panelsl Each panel has a panel inlet with 3 lines, and 2 circuitsl Each circuit has 3 circuit poles
Readings start from the "highest level" or top of the power chain. The top of the powerchain is the first section of readings, progressing down the page to lower points in the
power chain.
The primary inlet of this floorPDU has three lines.

Readings start from the "highest level" or top of the power chain. The top of the powerchain is the first section of readings, progressing down the page to lower points in the
power chain.
Below the primary inlet, thepanel inlets display, grouped bypanel. Panel readings are col-lapsed by default, see Panel 1 inthe image.
This floor PDU's Panel 2 hasone panel inlet with three lines.
Below the line readings for thepanel inlet, the circuit readingsdisplay.
This floor PDU's Panel 2 has 2circuits, each with 3 circuitpoles.
Floor PDU Elements
Elements display in the third position in the smart view. The title "PDU Elements" is used for all types of PDUs and facilityitems.
The floor PDU's circuits are grouped by panel if mapped accordingly. The Elements section is blank for floor PDUs that donot have circuits.
The default Elements view for floor PDU includes this information:
l PDU Element: circuits grouped by panell IT Device: IT devices associated with circuits include a link to the IT device page.
487

488
l Trend: small trend chart for active power. Change the trend to min/max/average active power or current using thefields below it.
l Active Power (W): latest poll reading for active power. The last column can be changed from latest poll reading foractive power (W) to latest poll reading for current (A) by selecting Current from the drop-down list below the PDUElements section.
l Apparent Power, Voltage, and Unutilized Capacity

490
Floor UPS
Floor UPS refers to an intelligent, standalone Uninterruptible Power Supply (UPS) device. Rack UPS is not supported.
Floor UPSSmart View
Power IQ gathers power readings from the Floor UPS inlets and inlet lines, circuits, and circuit poles.
The mapping of the circuit poles to circuits is achieved through your dynamic plugin configuration.
Note: The data Power IQ can gather depends on how you configure the dynamic plugin that manages the object. SeeDynamic Plugins.
Power IQ displays all data gathered in a smart view. Access the smart view by clicking on the object either in the FacilityItems tab or in the Data Centers tab.
A fully populated Floor UPS smart view includes:
l Floor UPS Energy Trendsl Floor UPS Elementsl Floor UPS Readingsl Floor UPS Details
Floor UPSEnergy Trends
Energy Trends display in the top section of the smart view.
Trend charts display data for the whole unit.
The trend can be configured to show minimum, maximum, or average over a selected time period, using the fields belowit.
Floor UPS energy trends includes a trend line for active power.
Floor UPS Readings
Readings display in the second section of the smart view.
Configure the columns by clicking the arrow in a heading, then selecting options to display, hide, or sort.

This sample smart view shows one possible configuration of a three-phase Floor UPS.
l 1 inlet with 3 linesl 2 circuitsl Each circuit has 3 circuit poles
Readings start from the "highest level" or top of the power chain. The top of the powerchain is the first section of readings, progressing down the page to lower points in the
power chain.
The inlet of this Floor UPS hasthree lines.
Readings come from the wholeinlet, and from each line for three-phase inlets.
Below the inlet and line readings,the circuit and circuit pole read-ings display.
This Floor UPS has 2 circuits.
Circuit1 has 3 circuit poles.
Floor UPSElements
Elements display in the third position in the smart view. The title "PDU Elements" is used for all types of PDUs and facilityitems.
The default Elements view for Floor UPS includes this information:
491

492
l PDU Element: circuitsl IT Device: IT devices associated with circuits include a link to the IT device page.l Trend: small trend chart for active power. Change the trend to min/max/average active power or current using the
fields below it.l Active Power (W): latest poll reading for active power. Change the latest poll reading to Current using the field
below it.l Apparent Power, Voltage, and Unutilized Capacity
Floor UPSDetails
Details are the fourth section in the smart view.

Power Panel
Power Panel refers to a single intelligent power panel on a wall that may contain inlets, circuits and circuit poles.
Anything with multiple panels should be added as a floor
Power Panels Smart View
Power IQ gathers power readings from the Power Panel's inlets, circuits, and circuit poles.
The mapping of the panels to circuits and circuit poles is achieved through your dynamic plugin configuration.
Note: The data Power IQ can gather depends on how you configure the dynamic plugin that manages the object. SeeDynamic Plugins.
Power IQ displays all data gathered in a smart view. Access the smart view by clicking on the object either in the FacilityItems tab or in the Data Centers tab.
A fully populated Power Panels smart view includes:
l Power Panels Energy Trendsl Power Panels Elementsl Power Panels Readingsl Power Panels Details
Power Panels Energy Trends
Energy Trends display in the top section of the smart view.
Trend charts display data for the whole unit.
The trend can be configured to show minimum, maximum, or average over a selected time period, using the fields belowit.
Power panel energy trends include a trend line for several types of readings.
l Active Powerl Energyl Current, when the power panel has inlet poles
493

494
Power Panels Readings
Readings display in the second section of the smart view.
Configure the columns by clicking the arrow in a heading, then selecting options to display, hide, or sort.
Power Panel readings come from the inlets, circuits, and circuit poles. Power panels come in many different con-figurations. Your configuration may vary.
This sample smart view shows one possible configuration of a three-phase Power Panel.
l 1 inlet with 3 linesl 2 circuitsl Each circuit has 3 circuit poles

Readings start from the "highest level" or top of the power chain. The top of the powerchain is the first section of readings, progressing down the page to lower points in the
power chain.
The inlet of this Power Panel hasthree lines.
Readings come from the wholeinlet, and from each line for three-phase inlets.
Below the inlet and line readings,the circuit and circuit pole read-ings display.
This Power Panel has 2 circuits.
Circuit1 has 3 circuit poles.
Power Panels Elements
Elements display in the third position in the smart view. The title "PDU Elements" is used for all types of PDUs and facilityitems.
The default Elements view for Power Panels includes this information:
l PDU Element: circuitsl IT Device: IT devices associated with circuits include a link to the IT device page.l Trend: small trend chart for active power. Change the trend to min/max/average active power or current using the
fields below it.l Active Power (W): latest poll reading for active power. Change the latest poll reading to Current using the field
below it.l Apparent Power, Voltage, and Unutilized Capacity
495

496
Power Panels Details
Details are the fourth section in the smart view.

Standalone Meters
Standalone Meters refers to a standalone power meter that may be used throughout the data center.
Standalone Meters Smart View
Power IQ gathers power readings from the Standalone Meter's circuits and circuit poles.
The mapping of the circuits and circuit poles is achieved through your dynamic plugin configuration.
Note: The data Power IQ can gather depends on how you configure the dynamic plugin that manages the object. SeeDynamic Plugins.
Power IQ displays all data gathered in a smart view. Access the smart view by clicking on the object either in the FacilityItems tab or in the Data Centers tab.
A fully populated Standalone Meter smart view includes:
l Standalone Meter Energy Trendsl Standalone Meter Elementsl Standalone Meter Readingsl Standalone Meter Details
Standalone Meter Energy Trends
Energy Trends display in the top section of the smart view.
Trend charts display data for the whole unit.
The trend can be configured to show minimum, maximum, or average over a selected time period, using the fields belowit.
Standalone Meter energy trends include a trend line for several types of readings.
l Active Powerl Current: one trend line for single phase circuits and one trend for each line of three-phase circuits
497

498
Standalone Meter Readings
Readings display in the second section of the smart view.
Configure the columns by clicking the arrow in a heading, then selecting options to display, hide, or sort.
Standalone Meter readings come from the circuits and circuit poles. Your configuration may vary.
This sample smart view shows one possible configuration of a three-phase Standalone Meter.
1 circuit with 3 circuit poles

Readings start from the "highest level" or top of the power chain. The top of the powerchain is the first section of readings, progressing down the page to lower points in the
power chain.
The circuit of this StandaloneMeter has 3 circuit poles.
Readings come from the wholecircuit, and from each line forthree-phase circuits.
Standalone Meter Elements
Elements display in the third position in the smart view. The title "PDU Elements" is used for all types of PDUs and facilityitems.
The default Elements view for Standalone Meters includes this information:
l PDU Element: circuitsl IT Device: IT devices associated with circuits include a link to the IT device page.l Trend: small trend chart for active power. Change the trend to min/max/average active power or current using the
fields below it.l Active Power (W): latest poll reading for active power. Change the latest poll reading to Current using the field
below it.
Standalone Meter Details
Details are the fourth section in the smart view.
499

Chapter 14:Sensors
When you add a PDU to Power IQ, the attached sensors are discovered.
Sensors can be viewed and managed using the Sensors grid in the Sensors tab. For more information, see Using theSensors Tab below.
You can view the list of sensors attached to a PDU in the PDU's smart view. See Rack PDU Smart View.
Power IQ automatically associates your sensors into the EDM when their PDU is in the EDM. See Automatically AssociateSensors in the EDM.
You can change this automatic association to place a sensor in the EDM at any room, row, aisle, or rack level. View yoursensors in the EDM hierarchy in the Data Centers tab. See Creating Your EDM.
Once associated in the EDM, you can access the sensor smart view. In the smart view, you can edit sensor label and pos-ition. The sensor smart view also has a configurable trend line. See Sensor Smart View.
Using the Sensors Tab
The Sensors tab displays a grid that lists the sensors in Power IQ and provides information about them, including name,associated facility item, type, and thresholds. In this tab, users can easily view and manage all sensors in Power IQ:
l Edit sensor information, including name, position in rack, height in rack, and thresholds (high warning, high critical,low warning, and low critical thresholds) in bulk or by double-clicking to edit
l Sort, filter, and group sensors by any of the available column criterial Aggregate numeric columns using count, sum, minimum, maximum, and average aggregate functionsl Show/hide the columns in the Sensors grid and save the modified grid configuration as the defaultl Export the data to CSV
You can view a sensor's smart page by click on the blue link with the sensor's name in the Name column. You can viewthe associated facility item's smart page by clicking the associated IP address link in the Facility Item column.
Editing Sensors in the Sensors Tab
Sensor name, position in rack, height in rack, and thresholds (high warning, high critical, low warning, and low critical) canbe edited via the Sensors grid in the Sensors tab.
To end sensor information:
1. Select one or more sensors in the Sensors grid. Note that the information will be changed for each sensor selec-ted.
2. Click the Edit button. If no sensors are selected, the Edit button will be grayed out and inaccessible.3. In the Updating Sensor popup, make your desired changes to the following fields:
a. Nameb. Position in Rack: Inlet, Outlet, Outside Air
501

c. Height in Rack: Top, Middle, Bottomd. Critical High Threshold (leave blank to use the default)e. Warning High Threshold (leave blank to use the default)f. Warning Low Threshold (leave blank to use the default)
g. Critical Low Threshold (leave blank to use the default)4. Click the Submit button.
A success message will display if your updates are successful.
Following the success message, the popup will automatically close. You will be returned to the Sensors grid.
Default values for temperature and humidity sensors can be set through the Power IQ settings. For more information, seeConfiguring Default Threshold Settings.
Sorting, Filtering, and Grouping Sensors
On the Sensors grid, you can sort, filter, aggregate, and group sensors by any of the available columns.
To sort, click on the downward chevron in next to the column name in the header row. A dropdown menu will display withthe options to sort, hide or group columns. For numeric columns, you'll also see options for the following aggregate func-tions: count, sum, minimum, maximum, and average.
502

503
Type text to filter by that text in the filter text box fields directly under the name of each column. Numeric filters (less than,equal to, and greater than) can be used in any of the numeric columns.
To clear filters, click the cancel (X) in each filter text field, or click the grid configuration icon and select the Clear all filtersoption.
To group sensors, click the downward chevron next to the name of the column you want to group by, then select the Groupoption.
When you group sensors by criteria, all of the sensors will be organized based on your selected criteria. The column youwant to group by will be set to the first column in the grid. To view the sensors in each group, click the plus sign in the leftcolumn to expand each group. To ungroup, click the download chevron next to the name of the column you are groupingby, and then select the Ungroup option.

Exporting Data to CSV
Column data in the Sensors grid can be exported to a CSVfile for further analysis. You can export either all of the sensordata in the grid or only the visible columns.
To export data to CSV:
1. On the Sensors grid, click the Grid Configuration icon in the upper right corner of the grid.2. A dropdown menu will display.
504

505
3. To export all data in the grid, select the Export all data as csv option. To export only the data you can see in the cur-rent view, select the Export visible data as csv option.
4. In the Save As dialog, name your file and click the Save button.
Sensor Grid Columns
The following columns are available in the Sensors grid:
l Name (always shown)l Facility Item (always shown)l Sensor Typel Serial Numberl Position in Rack: Inlet, Outlet, Outside Airl Height in Rack: Top, Middle, Bottoml Status: Critical, Warning, Good, Commissioned, Maintenance, Decommissioned

l Statel Latest Readingl 30 Day Highl 30 Day Moving Averagel 30 Day Lowl Unit of Measure (hidden by default)l EDM Information Columns
l Data Centerl Floorl Rooml Aislel Rowl Rack
l Critical Lowl Warning Lowl Warning Highl Critical High
Sensor Thresholds
Sensor thresholding creates events and event notifications when a temperature or humidity sensor reading exceeds or isbelow the threshold settings. The readings are based on the latest readings collected by Power IQ via the associated facil-ity item.
You can set default sensor thresholds under the Settings tab > Appliance Administration > Threshold Settings or overridethe default values individually on the Sensors grid in the Sensors tab. Note that environmental thresholding is auto-matically enabled if rack power thresholding is already enabled on your system. Otherwise, it’s disabled by default. Youcan configure the setting on the Settings > Default Thresholds page. For more information, see:
l Configuring Default Threshold Settings.l Using the Sensors Tab on page 501
To receive event notifications, configure notification filters to include environment sensor events. See Configuring Noti-fication Filters on page 275.
Configuring Default Threshold Settings
To edit default thresholds:
1. Click the Settings Tab.2. Under Appliance Administration, click the Default Thresholds link.3. On the Default Thresholds page, check the Enable Power, Temperature, and Humidity Thresholding box.
Note: To disable thresholding, uncheck the Enable Power, Temperature, and Humidity Thresholding box. However,if you disable thresholding, a message will display indicating that changing polling options requires the poller soft-
506

507
ware to restart, which may take up to a few seconds. To confirm and continue, click the OK button. Otherwise,click the Cancel button to return to the Default Thresholds page.
4. To edit the lower warning, lower critical, upper warning, and upper critical thresholds, double-click in each cell.5. Your changes are saved automatically. A green success message will display at the top of the page when a
threshold change has successfully been saved.

Sensor Smart View
Once a sensor is associated in the EDM, you can access the smart view.
All environmental sensor smart views contain:
l Sensor Environmental Trends
A sensor smart view may contain the following options, depending on the sensor type:
l Specify Inlet, Outlet, or Outside Air Location for Environmental Sensorsl Naming Environmental Sensors
508

509
Sensor Environmental Trends
The top section of the sensors smart view is a trend line. Configure the trend time period using the field below the trend.
Note: If you need to release and then re-manage a sensor associated with a Raritan PDU, always use the manual assign-ment option to ensure the accuracy of sensor environmental trends. See Sensor Assignment Guideline.

Specify Inlet, Outlet, or Outside Air Location for EnvironmentalSensors
You can specify whether a sensor is inlet or outlet located or if the sensor is for outside air. By default, Power IQ considersall environmental sensors to be inlet located.
Sensors are editable only when included in the EDM. See Creating Your EDM.
All sensor types can be included in Cooling charts on the dashboard. See Cooling Chart Widget.
In the sensors smart view, select the Sensor Location: Inlet, Outlet, or Outside Air.
510

511
Naming Environmental Sensors
Environmental sensors have sensor labels that you can change in Power IQ.
The following PDUs support naming environmental sensors, depending on model: APC, Eaton, Baytech, Liebert, Raritan,Servertech, Sinetica.
Sensor names cannot include only white space characters. The maximum name length is 256 characters. The maximumname length for PX1 sensors is 33 characters.
Sensor labels must be unique. During polling, if Power IQ finds two sensors of the same type with the same name, thesensor readings for those sensors are not saved. Power IQ adds an error message to the audit log.
SNMP read and write access to the PDU is required to name sensors. See Adding PDUsto Power IQ.
l In the sensors smart view, enter a unique name in the label field, then click Save.

Sensors Connected to PX1 and PX2 PDUs
Raritan PX1 and PX2 PDUs support environmental and contact closure sensors, which you can poll through Power IQ.
The sensors must be setup and configured correctly via PX1 or PX2 before they will work correctly with Power IQ.
See the online help for your PXmodel PDU here:
l http://www.raritan.com/support/product/px/l http://www.raritan.com/support/product/px2/
512

States of Managed Sensors
An environmental sensor shows the state after being managed.
Available sensor states vary depending on the sensor type -- numeric or discrete sensors. For example, a contact closuresensor is a discrete (on/off) sensor so it switches between three states only -- unavailable, alarm and normal.
Note: Numeric sensors show both numeric readings and sensor states to indicate environmental or internal conditionswhile discrete (on/off) sensors show sensor states only to indicate state changes.
Sensor states Applicable to
unavailable All sensors
Alarm Discrete sensors
Normal Discrete sensors
ok Numeric sensors
below lower critical Numeric sensors
below lower non-critical Numeric sensors
above upper non-critical Numeric sensors
above upper critical Numeric sensors
Note: The state change of a contact closure sensor occurs only if the sensor enters the new state for at least 1 con-secutive sample.
513

Sensor Assignment Guideline
A Raritan PDU allows users to release managed sensors and then bring them back under management, using either auto-matic or manual assignment option.
l Automatic assignment: This option may change the sensor ID on the PDU. Therefore, sensor indexes of the samesensor type are likely to swap in Power IQ, causing the sensor readings to swap as well. Power IQ users must notuse this option.
l Manual assignment: This option permits users to specify the original sensor ID so that no sensor indexes and read-ings are swapped in Power IQ. Always use this option to ensure the sensor data accuracy in Power IQ.
514

Chapter 15:Power Control
Power control is only available for PDUs that support this feature.
Power IQ must have valid SNMP write access to the PDU for power control to work.
515

Enable or Disable Power Control
Only authorized users can control power. See Power IQ Role Definitions.
1. In the Settings tab, click Power IQ Settings in the Appliance Administration section.2. In the Power Control Settings box, select the "Enable power control" checkbox to enable power control.3. Click Save Power Control Settings.
516

517
Configuring Power Control Options
1. In the Settings tab, click Power IQ Settings in the Appliance Administration section.2. In the Power Control Settings box:3. Select the "Enable power control" checkbox to enable power control.4. Select the "Require reason message for power control operations" checkbox to require users to log a reason for all
power control operations.5. Select the "Allow ad hoc power control for rooms, aisles, rows, and racks" to allow authorized users to control
power at the room, aisle, row and rack levels of the data center.6. Select the "Allow scheduled power control" checkbox to allow authorized users to schedule power control tasks.7. Click Save Power Control Settings.

Control Power to Outlets in a Data Center
You must enable power control. See Enable or Disable Power Control.
Power control is available at the outlet and IT device outlet group level, unless you also enable higher levels, such as alloutlets in a rack, row, aisle, or room. See Configure Power Control Options.
You must be assigned a role that permits power control.
For details about controlling power in the Smart Rack and Smart PDU views, see RackIT Devicesand PDU Elements -Smart Views.
Warning: Graceful shutdown is not supported when controlling power from the Smart Rack or Smart PDUpages, which are accessed by clicking the rack or PDU in the EDM/Data Centers tab. Use the right-clickoption on the rack or PDU in the EDM, or the power control options in the IT Devices tab for graceful shut-down.
1. In the Data Centers tab, select the data center level, such as a rack, that contains the outlets you want to control.2. Select the checkboxes of the outlets you want to control in the IT Devices or PDU Elements section.3. Click Power Control > On or Power Control > Off.4. If required, enter a reason message for the power control operation, and click OK to confirm.
5. In the Data Centers tab, right-click an IT device, or higher level, if enabled, then select On or Off.6. If required, enter a reason message for the power control operation, and click OK to confirm.
7. In the Facility Items tab, select a PDU, then click View.8. Select the checkboxes of the outlets you want to control in the Readings section.9. Click Power Control > On, Power Control > Off, or Power Control > Cycle.
10. If required, enter a reason message for the power control operation, and click OK to confirm.
11. In the IT Devices tab, select a device.12. Click Power Control > On or Power Control > Off.13. If required, enter a reason message for the power control operation, and click OK to confirm.
518

519
Control Power to Devices in a Group
You can manually control power to devices in a group, or schedule a task to run a power control operation at a specifiedtime.
1. In the IT Devices tab, choose Activities > Device Groups.2. Select the checkbox for the device group you want to control power to.3. Click Power Control > On or Power Control > Off.
All devices in the group are powered on or off sequence specified in the group settings.
4. Devices are powered off in sequence, and powered on in the reverse sequence.
See Creating Device Groups for Power Control.
Devices in the group that are configured with graceful shutdown will be shutdown when a power off operation is selectedhere. The configured graceful shutdown delay is used. See Configuring Graceful Shutdown.
See Add a Power Control Task.

Power Cycle a Device
The power cycle feature enables you to hard power cycle devices that are mapped to one or more outlets. This can be use-ful in the event of a major software failure.
Graceful shutdown does not apply when using power cycle. There is a 30 second delay after the last outlet is turned offbefore turning the first outlet back on.
1. In the IT Devices tab, click the IT device name link in the IT Devices tab to go to the IT device page in the DataCenters tab. The EDM expands to show the IT device.
2. Find the power cycle button in either of these locations.3. Right-click the IT Device in the EDM, choose Power Control > Cycle.
4. Click Power Cycle in the center of the IT Device details page.
5. If required, enter a reason message for the power control operation, and click OK to confirm.
A status bar shows progress and success or failure message.
520

521
Scheduling Power Control
You can schedule power control for device groups only.

Adding a Power Control Task
Schedule a power control task to control power to a device group at a specified time. You can schedule a task that runsonly once, or that recurs on a regular schedule.
You must create device groups before you add power control tasks. See Create Device Groups for Power Control.
1. In the IT Devices tab, choose Activities > Add New Task. The New Power Scheduling Task page opens.2. Select Power On or Power Off. If Graceful Shutdown is configured for a device in the device group, a power-off task
will use graceful shutdown automatically, unless you select the Skip Graceful Shutdown checkbox in the next step.3. Select the Skip Graceful Shutdown checkbox to force a hard shutdown for all devices in the device group, even if
graceful shutdown is enabled.4. Select the Leave Outlets On checkbox to leave outlets powered on in cases where devices have been powered off
using graceful shutdown.5. Select the Device Group for the power control operation.6. Specify when the task should run.7. To schedule a task that runs only once, select the Date from the calendar in the Run Once section.8. To schedule a task that recurs, select the checkboxes for the days of the week the task should run in the Recurring
section.9. For both types, select the time the task should run in the Hour and Minute fields.
10. Select the Active checkbox to allow this task to run. Deselect this checkbox to stop the task from running.11. Click Save.
522

523
Viewing Power Control Task Results
View the results of power control tasks that have been scheduled.
Note: Make sure that power control and scheduled power control are enabled. See Enable orDisable PowerControl.
1. In the IT Devices tab, choose Activities > View Task Results. The Power Scheduling Task Results page opens.2. Click a task name link to view the results.

Configuring Graceful Shutdown
You can configure Power IQ to send a graceful shutdown command to a server before powering off outlets. Power IQallows you to define a set of system-wide shutdown commands with credentials to use across multiple devices. Power IQsupports both SSH and NetRPC commands to shutdown either Unix or Windows servers.
Process for Configuring Graceful Shutdown in Power IQ:
l Enable power control. See Enable or Disable Power Control.l Prepare your servers for graceful shutdown: check open ports, define accounts for authentication, test authen-
tication methods. See Open PortsforGraceful Shutdown and Preparing Servers for Graceful Shutdown.l Add the shutdown commands to Power IQ. See Adding Shutdown Commands.l Enable graceful shutdown for the server, known as an IT Device in Power IQ, specify the command and wait time,
and test the connection. See Enable Graceful Shutdown for an IT Device.l To shutdown servers, use the power control functions.l Add a power control task to schedule the power off for a device group. See Adding a Power Control Task.
OR
l Power off an individual outlet. See Control Power to Outlets in a Data Center.
524

525
Adding Shutdown Commands
Add shutdown commands if you want to enable graceful shutdown to occur on servers before Power IQ switches off out-lets. Graceful shutdown will occur both when you manually power outlets off or when a scheduled power control task runs.
You can test the commands you configure when you enable graceful shutdown for a particular device. See Enable Grace-ful Shutdown for an IT Device on the next page.
Add shutdown commands using Windows Remote Shutdown
Windows Remote Shutdown is the most common choice for shutting down Windows systems.
1. In the IT Devices tab, choose Activities > Shutdown Commands. The Add New Shutdown Command page opens.2. Click Add.3. Select Using Windows Remote Shutdown and click Next.4. In the Name field, enter a name to describe this shutdown command. This name appears in the list of shutdown
commands to be selected when you enable graceful shutdown for a server. See Enable Graceful Shutdown for anIT Device on the next page.
5. In the Login field, enter the username of the account to be authenticated on each server to be shutdown.6. Login can include letters, digits, underscores, dots, and hyphens.7. In the Password and Password Confirmation fields, enter the password for the username in the Login field.8. In the Comment field, enter the message to display to users of the server when it is shutdown.9. Click Add.
Add shutdown commands using SSH:
1. SSH is the most common choice for shutting down Linux, Unix, or other systems:2. In the IT Devices tab, choose Activities > Shutdown Commands. The Add New Shutdown Command page opens.3. Click Add.4. Select SSH and click Next.5. In the Name field, enter a name to describe this shutdown command. This name appears in the list of shutdown
commands to be selected when you enable graceful shutdown for a server. See Enable Graceful Shutdown for anIT Device on the next page.
6. In the Login field, enter the username of the account to be authenticated on each server to be shutdown.7. Login can include letters, digits, underscores, dots, and hyphens.8. Enter the appropriate credentials for the account specified in the Login field. See Basic Configuration for SSH Shut-
down on page 532 for more details on authentication. The following options are valid.l Password and Password Confirmationl Private Keyl Private Key and Passcode and Passcode Confirmation
9. In the Command field, enter the command. See Sample SSH Shutdown Commands on page 533 for examples.10. Click Add.

Enable Graceful Shutdown for an ITDevice
Enable graceful shutdown for an IT Device if you want Power IQ to send a shutdown command that you configure to aserver before powering it off.
You must add the shutdown commands before enabling graceful shutdown. See Adding Shutdown Commands.
1. In the Data Centers tab, select a device that requires graceful shutdown to be enabled.2. Make sure the IP address for the device is completed in the IP Address field.3. Expand the Graceful Shutdown section of the IT Device details page and select the Graceful Shutdown checkbox.4. Select the command to send to the server from the Shutdown Command list. You must add commands to Power
IQ before selecting a command here. See Adding Shutdown Commands.5. In the Shutdown Wait field, enter the number of seconds Power IQ should wait for the shutdown to complete before
powering off the associated outlet.6. Click Test Connection. Power IQ attempts to connect to the device using the selected command. If you see a suc-
cess message, click Save. If you see an error message, click View Log in the dialog to troubleshoot the failure.7. Click Save to save all changes.
526

527
Disable Graceful Shutdown for an ITDevice
There are two methods for disabling graceful shutdown for an IT Device.
Remove the IT device from the shutdown command details page:
1. In the IT Devices tab, choose Activities > Shutdown Commands.2. Select the shutdown command that you want to disable for the IT device.3. Select the IT device in the Devices Using Shutdown Command list and click Remove.4. Click Yes to confirm. The command is removed from the IT device and graceful shutdown is disabled.
Disable graceful shutdown from the Data centers tab:
1. In the Data Centers tab, select a device that requires graceful shutdown to be disabled.2. Expand the Graceful Shutdown section of the IT Device details page and deselect the Graceful Shutdown check-
box.3. Click Save.

Viewing the ITDevices Using a Shutdown Command
View the shutdown command details to see a list of IT Devices using each shutdown command.
1. In the IT Devices tab, choose Activities > Shutdown Commands.2. Select the shutdown command whose usage you want to view and click Edit.
The list of IT devices that are using the shutdown command displays below the command details.
528

529
Remove a Shutdown Command from Power IQ
When you remove a shutdown command from Power IQ, you can assign a different command to the IT devices that wereusing the removed command. Or, you can disable graceful shutdown for those devices.
1. In the IT Devices tab, choose Activities > Shutdown Commands link.2. Select the command you want to remove from Power IQ and click Remove.3. If the command is being used by any IT devices, a dialog appears. an option and click4. Select Remove Command from Devices and Disable Graceful Shutdown, and click OK to remove the command
from Power IQ and not assign a different shutdown command to the IT devices.
OR
5. Select Assign Another Shutdown Command to Devices, and then select a different shutdown command from thelist, and click OK, to assign a different shutdown command to the IT devices.

Preparing Servers for Graceful Shutdown
Servers must be configured to allow the shutdown commands to run when you enable graceful shutdown from Power IQ.
530

531
Open Ports for Graceful Shutdown
Servers that will receive graceful shutdown commands from Power IQ must have the following open ports.
l TCP 22: For SSH commands only. Custom SSH ports are not supported.
Windows:
l TCP 139: NetBIOS Session Service, for Windows systems only.l TCP 445 : For NetRPC commands only.

Basic Configuration for SSH Shutdown
l Open Portsl Open port 22.
Authentication for SSH:
Power IQ can send a shutdown command via SSH to systems that share an authentication method, including the fol-lowing methods.
l common user directoriesl common username and passwordl common username and password (users managed by a common LDAP server)l common username and encrypted key: Append the public key file as a string to the ~/.ssh/authorized_keys file of
the user on each machine to be shut down.
The user must have permission to shut down the machines using the authentication method.
Each authentication method must be tested from the command line.
Shutdown Commands:
l There are two types of shutdown commands that you can use in Power IQ.
A call to the native shutdown command, which varies by Unix type
OR
l A common shutdown script that carries out a backup
Each method must be tested from the command line of each machine to be shut down
The command has 30 minutes to complete before Power IQ stops trying. If the time expires, Power IQ closes the SSH con-nection, logs an error, and does NOT power off the outlet.
If the command returns stderr, Power IQ assumes a failure. Power IQ logs stdout and stderr.
Error details are written to the Power IQ log.
532

533
Sample SSH Shutdown Commands
Resources for information on writing SSH shutdown commands:
l http://www.unix.com/man-page/OpenSolaris/1m/shutdown/
Sample Linuxcommand:
/sbin/shutdown -h now
Sample OpenSolariscommand:
sudo -E /usr/sbin/shutdown -y -i5 -g5

Basic Configuration for Windows Remote Shutdown
NetRPC shutdown commands can be used to shutdown Windows machines remotely.
Open ports:
l Open port 445.
Authentication:
l The Windows Remote Shutdown command requires a user account whose security policy allows shutdowns from aremote system.
l Each server that will receive graceful shutdown commands must accept the user account's username and pass-word.
Windows Server Configuration:
l RPC commands must be enabled on each Windows server that you will shutdown via Power IQ.
534

535
When Will Graceful Shutdown Abort?
If there is any error between beginning to connect with the server and the server returning from the shutdown script with anon-zero code, that is, no errors in the script, then the attempt is marked as failed and the outlet task does not proceed.

Creating a Device Group
To create device groups for power control:
1. Make sure power control and scheduled power control is enabled. See Enable orDisable PowerControl and Con-figuring PowerControl Options.
2. In the IT Devices tab, select the devices you want to add to the group.3. Click Add to Device Group > Create a new device group.4. In the "Create a new device group" dialog, enter a name for the group, then click "Create device group".5. The group is created, and the selected devices are added. A success message displays. Click "View device group"
to open the device group details, where you can set the default power control delays and sequence of devices forpower control operations. See Configuring the Power Control Settings for a Device Group.
536

537
Creating a Device Group
To create device groups for power control:
1. Make sure power control and scheduled power control is enabled. See Enable orDisable PowerControl and Con-figuring PowerControl Options.
2. In the IT Devices tab, select the devices you want to add to the group.3. Click Add to Device Group > Create a new device group.4. In the "Create a new device group" dialog, enter a name for the group, then click "Create device group".5. The group is created, and the selected devices are added. A success message displays. Click "View device group"
to open the device group details, where you can set the default power control delays and sequence of devices forpower control operations. See Configuring the Power Control Settings for a Device Group.

Adding Devices to an Existing Device Group
Once groups have been created, you can add devices to the group in the IT Devices tab.
1. In the IT Devices tab, select the devices you want to add to the group.2. Click Add to Device Group, and the list of groups that have been created displays beneath the "Create a new
group" option. Select the group you want to add the devices to.
538

539
Adding Devices to a Group in the Data Centers Tab
You can add one device or all devices within a data center, row, rack, and so on, to a group in the Data Centers tab.
1. In the Data Centers tab, select a device to add to the group. To add all devices from a section of the data center,select the room, or aisle, or rack. You can select any level, up to and including the data center.
2. Right-click the selected level, select "Add devices to a device group", then select the group. To add a group, select"Create a new device group", enter a device group name then click "Create device group."

Configuring the Power Control Settings for a Device Group
Configure each device group to set the default power control delay and the sequence of devices for power control oper-ations.
1. In the IT Devices tab, choose Activities > Device Groups.2. Click a device group Name link. The Edit Device Group page opens.3. Set the Default Power On Delay (sec), which is the number of seconds that Power IQ delays after powering on each
device in the sequence of devices in a group. These settings are the default power-on delay for all new devices youadd to the group.
4. Set the sequence for power control operations. Select a device, then click Up, Down, Top, Bottom, and Move To toarrange the device list in the sequence that power control operations should occur.
5. Devices will power off in the sequence set.6. Devices will power on in the REVERSEsequence set.
540

541
Remove a Device from a Group
1. In the IT Devices tab, choose Activities > Device groups.2. Click the device group Name link.3. Select the device you want to remove, then click Remove. The device is removed from the group, but not removed
from Power IQ.

Set a Different Power On Delay for a Device
Power IQ will follow the default delay setting for power-on sequences, unless you specify a different delay setting for adevice. Delays are for power-on sequences only. The delay occurs after each power-on operation completes.
1. In the IT Devices tab, click a device group Name link in the Device Groups column. The Edit Device Group pageopens.
2. Select the device in the Devices in This Group list, then double-click the Power On Delay value and enter a newvalue in the field.
542

Chapter 16:Door Access Man-agement
Power IQ 5.2 and above support the ability to control door access and door locks on cabinet and containment area doors.
Doors can be added and deleted via the EDM in the Data Centers tab.
The door smart page view displays details on the door’s status, sensor mappings, placement, and associated card read-ers. For more information, see Door Smart Page on the next page.
Users with the appropriate authorization can manage door access permissions and authentication through Power IQ forsupported devices. For more information, see Door Control Permissions on the next page.
Door status is tracked via contact closure and powered dry contact sensors mapped to door, handle, and electronic lockcomponents. Contact closure sensors can be mapped to door or handle components only. Powered dry contact sensorscan be mapped to electronic lock components only. Only one sensor at a time can be mapped to each door component.For more information, see Configuring a Door on page 548.
Doors, sensor mappings, and values for the override relock timer also can be added, edited, and deleted via CSVimport inbulk. For more information, see Bulk Configuring Doors Using CSVon page 550.
Card readers can be added to doors to electronically control physical access to them. For more information, see CardReader Access Support.
Note: Door access management is supported for CPI, Raritan, and Panduit devices only. Card reader access man-agement is supported for Raritan facility items only.
543

Door Control Permissions
Power IQ 5.2 introduces the Door Control role to manage access to doors. The Door control role can apply globally, to indi-vidual EDM nodes and their children, and to individual doors.
Users with the View and Door Control roles will be able to lock/unlock the doors they have access to from the doors'respective smart pages in Power IQ, but they cannot edit the door details.
Users with the Operator role and above can edit a door's name and other details, map/unmap sensors, and add a door tothe EDM. Operators also can add a door via drag-and-drop to nodes that they have access to.
In addition to the door-related tasks available to Operators, Site Administrators and Administrators have the ability toassign and revoke the Door Control role on specific nodes and individual doors. Site Administrators can lock/unlock anydoor in the system, while Administrators can lock/unlock only those doors that they have Administrator privileges for. OnlySite Administrators can assign the Door Control role globally.
For more information on assigning roles in Power IQ, see Assigning Roles for User Permissions on page 341.
Door Smart Page
The door smart page displays information related to the door details, including the door status, its sensor mappings, andthe door’s name, external key, and placement. The door smart page also displays the relock timer default and the value forthe override relock timer if configured.
Users with the View role are able to read the door smart page but will be unable to edit it. Users with the Door Control rolecan lock/unlock doors. Users with the Operator role and above can edit the details for the doors they have access to.
Click on the door in the EDM to view the door smart page.
544

The door smart page includes the following sections:
Door Control
This section provides controls to lock/unlock the door. The button aligning to the door’s current state (Locked or Unlocked)will be grayed out.
Sensors and Door Status
This section provides controls to map/unmap sensors for the door components. There is one row for each door, handle,and electronic lock component.
Components are mapped by dragging-and-dropping sensors from the Available Sensors list on the right to the appropriatecomponent. Only sensors that are siblings to the door node (listed under the same parent node in the EDM hierarchy) willbe displayed under Available Sensors.
The status of the component is noted in each row. For door and handle sensors, the status can be Open or Closed. ForLock Sensors, the status can be Unlocked or Locked. For door components without a sensor mapped to them, the statusarea will be blank.
Sensor mappings also can be imported via CSVin bulk. For more information, see Bulk Configuring Doors Using CSVonpage 550.
Door
This section displays the fields where you edit the door name, external key, placement, and override relock timer value.
The external key is a unique attribute that is used to identify the door when importing and exporting enterprise rela-tionships through a CSVfile.
The override relock timer is an optional feature that allows users with the Operator role or above to override the global doorrelock timer on the individual doors that they have access to. If this option is not configured, the door will automaticallyrelock based on the global door relock timer value. For more information, see Enabling/Disabling the Global Door RelockTimer on page 552 and Enabling/Disabling the Door Override Relock Timer on page 553.
Placement is an optional setting defined using tags for the Door Placements tag group. For more information on editingtags for this group, see Setting Door Placement with Tags and Tag Groups on page 551
Card Readers
This section displays the card readers associated with the door and the facility items that have the card readers attached.You also can add or remove a card reader from this section. For more information, see Card Reader Support.
Users with the View role on a door (but not Operator or above) have permissions to view a list of associated card readers.Users with the Operator role or above on a door, on the Door smart page have permissions to see a list of associated cardreaders, with the ability to add or remove them.
Note: Card reader access management is supported for Raritan facility items only.
546

547
Adding or Deleting a Door
Doors can be added or deleted through the EDM in the Data Centers tab.
Adding a Door
Users with the Operator role and above can add doors to the EDM via the Data Centers tab.
1. In the EDM hierarchy, highlight the node where you want to add the door.2. Click the Add icon and select Door from the dropdown menu.
3. The door will be added as a child of the node highlighted in Step 1.
Note: The default name for a new door is “My Door.” You can rename the door by left-clicking on it twice (first to select thedoor and second to rename it) or by right-clicking and selecting the Rename option.

Deleting a Door
Users with the Operator role and above can delete doors in the EDM via the Data Centers tab.
1. Right-click the door in the EDM hierarchy in Power IQ and select the Remove option.
Alternatively, highlight the door you want to remove and click the Remove icon in the EDM menu.
2. You will be asked to confirm the deletion.
Note: Deleting a door will delete the door and the audit history for the door.
3. Click the Delete Door and Audit History button to delete the door. To cancel out of the dialog, click the Cancel but-ton.
Once the deletion is confirmed, the EDM will automatically refresh, and the door with be removed.
Configuring a Door
Once added, the door can be edited or configured by users with the appropriate permissions.
Click on the door in the EDM to view the door smart page and edit its details.
548

549
1. In the Door Control section, select the Lock or Unlock button to request the door be locked or unlocked.2. In the Sensors and Door Status section, drag-and-drop sensors to map/unmap them to the door components:
door, handle, and electronic lock.
a. Available sensors are located in the Available Sensors panel on the right.b. To replace a mapped sensor, drag the available replacement sensor to the mapped sensor you want to
replace.

c. To unmap a sensor, click the Unmap icon ( ) to the right of the sensor. The unmapped sensor will belisted in the Available Sensors panel. If there is no sensor to be removed, the icon will be grayed out.
d. Only one sensor at a time can be mapped to each door component. Contact closure sensors can bemapped to door or handle components only. Powered dry contact sensors can be mapped to electroniclock components only.
3. In the Door section, change the name, external key, and placement of the door.
a. The external key is a unique attribute that is used to identify the door when importing and exporting enter-prise relationships through a CSVfile.
b. The placement of the door is an optional field. Placement is defined using tags for the Door Placementstag group. For more information on editing tags for this group, see Setting Door Placement with Tags andTag Groups on the facing page.
4. Click the Save button to save your changes.
Note: Doors and sensor mappings also can be added, edited, and deleted via CSVimport/export in bulk. For more inform-ation, see Bulk Configuring Doors Using CSV.
For more information on the details available on the door smart page, see Door Smart Page on page 544.
Bulk Configuring Doors Using CSV
Users with the appropriate permissions can add, edit, and delete doors and sensor mappings via CSVimport/export.
1. In the Data Centers tab, click the Import/Export button on the EDM menu to go to the Enterprise Relationshipspage. Alternatively, go to Settings > Data Management > Enterprise Relationships.
2. Export the existing EDM relationships to CSVby clicking the Export Relationships link in the CSVData MappingActions section. The resulting CSVfile will include all doors and their associated sensors.
3. To map a door to its parent, add or edit the attributes in the following door columns in the CSVfile:
a. parent_object_type (required)b. parent_external_key (required)c. override_relock_timer (optional; configure to enable/disable the override relock timer on the door)d. object_typee. external_keyf. name
4. To map a sensor to a door, add or edit the attributes in the following door columns in the CSVfile.
a. parent_object_type (required; specify as DOOR)b. parent_external_key (required)c. door_component (required; specify as DOOR, HANDLE, ELECTRONIC_LOCK/ELECTRONIC
LOCK/ELECTRONIC-LOCK)d. object_typee. pdu_ipf. pdu_proxy_address
g. typeh. ordinal
5. Import your edited CSVfile.
550

551
Note: Attempting an import without the required fields completed will display an error.
Note: Contact closure sensors can be mapped to door or handle components only. Powered dry contact sensors can bemapped to electronic lock components only. An error will be displayed on import if you attempt to map sensors to incom-patible components.
Locking, Unlocking, and Automatic Relocking of Doors
Users with the Door Control role can lock/unlock a door from the door smart page.
In the Door Control section, select the Lock or Unlock button to request the door be locked or unlocked. The button align-ing to the door’s current state (Locked or Unlocked) will be grayed out.
In the screenshot below, the door is locked. The user can request to unlock the door by clicking the Unlock button.
Unlocked doors will be automatically scheduled to relock based on either the global door relock timer value or the overriderelock timer value on the individual door if configured. If both the global door relock timer and the local override relocktimer on the door are disabled, Power IQ will not attempt to relock the door. For more information, see Enabling/Disablingthe Global Door Relock Timer on the next page and Enabling/Disabling the Door Override Relock Timer on page 553.
When a relock attempt is successful, the door will be locked, and an event indicating relock success via the relock timerwill be created in Power IQ.
When a relock attempt is unsuccessful, the door will remain unlocked, and an event indicating the relock failure will be cre-ated in Power IQ. Power IQ will attempt to relock the door every 60 seconds afterward for up to 20 retries or until theattempt is successful.
For more information, see Door Smart Page on page 544.
Setting Door Placement with Tags and Tag Groups
Placement is an optional dropdown field in the Door section of the door smart page. On the door smart page, select theappropriate dropdown option to set the door placement.
Placement is defined using tags from the Door Placements tag group.
Users with the Manage Tag Groups role or Site Administrator role will see a Manage Door Placements link to the right ofthe Placement drop-down menu on the door smart page. Clicking on the link will direct the user to the Manage Tags andTag Groups page.

By default, in Power IQ 5.2 and above, there is a Door Placements tag group containing Front and Back tags.
Users can add tags to this tag group to define placement. For more information, see Adding Tag Groups and Tags onpage 636.
Tags also can be added via CSVimport.
Note: Only add one Door Placement tag for each door. If you add multiple Door Placement tags, only the oldest tag (thetag added earliest) will be displayed on the door smart page and will be used to determine door placement.
Enabling/Disabling the Global Door Relock Timer
The global door relock timer is an optional setting that allows you to set a default duration before unlocked doors are auto-matically relocked. As a global setting, the door relock timer affects all doors in Power IQ.
Only users with the Site Administrator role can enable/disable the global door relock timer.
The global door relock timer is set in seconds. It can be disabled by setting the value to 0. In the example screenshotbelow, the relock timer is set for 120 seconds.
1. In the Settings tab, click Power IQ Settings (in the Appliance Administration section).2. Under Door Settings, set the relock timer value in seconds.
552

553
3. Click the Save Relock Timer Setting button to save your changes.
Note: This global setting can be overridden locally when the override relock timer is enabled on an individual door. Formore information, see Enabling/Disabling the Door Override Relock Timer below.
Enabling/Disabling the Door Override Relock Timer
The override relock timer is an optional setting on each individual door that allows you to override the global door relocktimer on the individual doors that they have access to. If this option is disabled, the door will automatically relock based onthe global door relock timer value, which is displayed in seconds for convenience below the Override Relock Timer field.For more information, see Enabling/Disabling the Global Door Relock Timer on the previous page.
Note: If the global door relock timer is set to 0, the default value under the Override Relock Timer field will display as dis-abled.
The override relock timer value can also be set via CSVimport. For more information, see Bulk Configuring Doors UsingCSVon page 550.
Only users with the Operator role or above can configure the door override relock timer.
The override relock timer is set in seconds. It can be disabled by setting the value to 0. In the example screenshot below,the override relock timer is disabled, and the global door relock timer value is set to 120 seconds.
1. In the Data Centers tab, click the door you want to edit to display its smart page.2. On the door smart page, in the Door section, set the override relock timer value.
a. The override relock timer value must be set in seconds. For example, a desired value of two minutesshould be set as 120 seconds (1 minute = 60 seconds).
b. To disable the override relock timer, set the value to 0.
3. Click the Save button to save your changes.

Card Reader Access Support
Power IQ 6.0 and above support electronic access control via cards and card readers.
Card readers are added to Power IQ via discovery. Upon polling, discoverable card readers that are attached to supporteddevices are added to the Power IQ database.
Once in the system, card readers can be associated with doors. For more information, see Adding and Removing CardReaders from the Door Smart Page on page 558.
Card readers can be decommissioned and recommissioned by 1) decommissioning or recommissioning the facility itemwhere the card reader is attached respectively, or 2) unplugging the card reader from the facility item. For more inform-ation, see Decommissioning and Recommissioning Card Readers on page 561.
The card reader smart page provides information on a reader’s name, manufacturer, serial number, doors it is associatedwith, and permissions. For more information, see Card Reader Smart Page on page 556.
Cards can be assigned to users in the Card Access Control panel, which lists card assignment details, including the cardnumber, status, first and last name, user login, and user email. Users with the Site Administrator role and above have per-missions to create, deactivate, and reactivate cards and to edit card assignments. For more information, see Creating,Activating, Deactivating, and Assigning Cards on page 562.
554

555
Adding Card Readers in Power IQ
Card readers are added to Power IQ via discovery. Upon polling, discoverable card readers that are attached to supporteddevices are added to the Power IQ database. If there are multiple card readers attached for each front and back door, bothcard readers will be found by Power IQ.
The default card name assigned is the card serial number.
Once in the system, card readers can be associated with doors. For more information, see Adding and Removing CardReaders from the Door Smart Page on page 558.
Note: When a card reader is associated to a facility item, PIQ will automatically associate it with the facility item's parentin the EDM hierarchy.

Card Reader Smart Page
The card reader smart page provides information on a reader’s name, manufacturer, serial number, doors it is associatedwith, and permissions.
Users with the Operator role and above on the card reader have permissions to edit the smart page. Users with the Viewrole on the card reader have permissions to see a read-only view of the card reader smart page.
Click on the card reader EDM node to view the smart page. Card readers can be placed under any of the following in theEDM hierarchy: data center, floor, room, aisle, row, or rack. Card readers cannot be placed under a door.
A card reader smart page includes the following sections.
556

557
Card Reader
This panel provides information to identify the card reader, including its name, manufacturer, serial number, and asso-ciated PDU or facility item.
Power IQ assigns a default name when the card reader is added to the database. Only the Name field can be edited byusers with the appropriate permissions. The manufacturer, serial number, and PDU/Facility Item fields cannot be edited.
Doors
This panel lists the doors associated with the card reader. You will only see doors for which you have the View role orabove. The name or IP address of each door links to its smart page.
Permissions
This panel lists the roles and permissions for the card reader. Users with the appropriate permissions are able to add orremove roles.

Adding and Removing Card Readers from the Door Smart Page
Users with the Operator role and above on a door can add or remove readers from the door smart page. The reader mustalready be in your Power IQ system to be added to the door. You can add one card reader at a time.
Adding a Card Reader from the Card Readers Panel
1. In the Card Readers panel, click the Add button.2. In the Associate Entity panel, search for the card reader. The readers attached to the door’s parent object in the
EDM will be displayed at the top of the search results. The list shall show the card reader name and the facilityitem label. The facility item label will display either the name of the facility item or its IP address, based on yourPower IQ settings.
3. Select the desired card reader.4. Click the Add button to add the card reader. Click the Cancel button to close the dialog box.
Removing a Card Reader from the Card Readers Panel
1. In the Card Readers panel, select the card reader that you want to remove.2. Click the Remove button.
558

559
Renaming and Removing Card Readers from the EDM Hierarchy
Card readers can be renamed and removed from the EDM in Power IQ.
Renaming a Card Reader
1. In the Data Centers tab, in the EDM, select the node of the card reader you want2. Right-click to display the Rename or Remove buttons3. Click the Rename button4. Rename the card reader5. The EDM will display the card reader node with the new name
Removing a card reader disassociates the card reader from the parent node. The card reader will no longer be visible inthe EDM; however, the card reader will still be available in the system, and no data will be deleted.
Removing a Card Reader
1. In the Data Centers tab, in the EDM, select the node of the card reader you want2. Right-click to display the Rename or Remove buttons3. Click the Remove button4. In the Warning dialog, confirm that you want to remove the card reader.5. The EDM will refresh with the card reader removed
Note: Like a sensor node, if a card reader node is removed from the EDM, it will be “refound’ within five minutes and willbe placed under the same parent node as the facility item it is attached to.

561
Decommissioning and Recommissioning Card Readers
Card readers can be decommissioned and recommissioned by 1) decommissioning or recommissioning the facility itemwhere the card reader is attached respectively, or 2) unplugging the card reader from the facility item.
Note: A decommissioned card reader will be identified with “(Decommissioned)” at the end of its name in the door smartpage, EDM hierarchy, and card reader smart page.
If you decommission a facility item with an attached card reader, the card reader will also be decommissioned. If yourecommission a facility item with an attached card reader, that the card reader will also be recommissioned.
Note: If a facility item with an attached card reader is set to maintenance mode, Power IQ to continue to process cardreader events. For more information on facility item maintenance, see Maintenance Mode on page 778.
If a card reader is unplugged from a facility item, when that facility item is polled, the card reader will be decommissioned.If a card reader is removed from one facility item and added to another, the card reader will be added or recommissioned(if it had been previously attached to the new card reader) on the next polling cycle.

Creating, Activating, Deactivating, and Assigning Cards
Users with the Site Administrator role and above have permissions to create, deactivate, and reactivate cards and to editcard assignments. Any updates made to card assignments, including when cards are created, activated, and deactivated,will create entries in the Power IQ audit log.
Cards can be assigned to users in the Card Access Control panel, which lists card assignment details, including the cardnumber, status, first and last name, user login, and user email. Select a card to activate, deactivate, or edit its assignment.
Users can be assigned multiple cards. To assign a user to a newly created card, first create the card, and then edit itsassignment.
Note: To unlock a door, the user must have the Door Control role for the specified door.
Note: For auditing purposes, Power IQ does not allow a user to delete a card from the system. Users with the appropriatepermissions can, however, deactivate a card or change who is assigned it. Power IQ tracks the history of who wasassigned to each card for the purposes of generating the door security audit report and to show accurate informationwhen viewing an event.
Creating a New Card
1. Go to Settings > Authorization and Authentication > Card Access Control2. In the Card Access Control panel, click the Add link3. In the Add New Card panel, add the card number4. Click the Add button
Deactivating a Card
1. Go to Settings > Authorization and Authentication > Card Access Control2. In the Card Access Control panel, select the cards that you want to deactivate.3. Click the Deactivate link to make the card inactive.
Activating a Card
1. Go to Settings > Authorization and Authentication > Card Access Control2. In the Card Access Control panel, select the cards that you want to activate.
562

563
3. Click the Activate link to activate the card.
Editing a Card’s Assignment
1. Go to Settings > Authorization and Authentication > Card Access Control2. In the Card Access Control panel, select the card whose assignment you want to edit. Note: You can only edit one
card assignment at a time.3. In the Assign Card to User dialog, search for and select the user you want to assign the card to.4. Click the Assign to User button.

Card Reader Events and Audit Log Entries
Power IQ tracks the history of who was assigned to each card for the purposes of generating the door security audit reportand to show accurate information when viewing an event and in the audit log.
Power IQ processes events from the facility item that has a card reader to determine when access has been authorizedvia the card reader.
All events for successful card access authorizations have a severity of Informational. All events for failed card accessauthorizations have a severity of Warning.
When a card reader event is processed:
l The door security audit report will display the user, the requested action, and a summary of the request. For moreinformation on the door security audit report, see Creating a Door Security Audit Report on page 621.
l A date- and time-stamped event is created with the event name, severity, target (the card reader), and a sum-mary of the event.
l A date- and time-stamped entry is created in the audit log with a message indicating whether the attempt wassuccessful, the card reader name, card number, user (if applicable) and reason the authorization attempt suc-ceeded or failed.
Additionally, users with the appropriate permissions will see entries in Power IQ’s audit log for each time they:
l Create a cardl Deactivate a cardl Activate a cardl Assign a card to a userl Update a card assignment
The table below summarizes card reader events and audit log entries in Power IQ.
Description EventName
Event Sum-mary Audit Log Message
Card number is valid, but the cardeither isn’t associated to a user or isdeactivated.
Card readerauthorizationfailed
A failed card author-ization attempt wasmade at reader<reader_name>. Reason: Card iseither deactivated ornot associated with auser.
Power IQ: Failed card author-ization attempt <attempt_id> atreader <reader_name> usingcard number <card_number>:Card is either deactivated or notassociated with a user.
Card number is associated to an act-ive user, but that user does not haveDoor Control permissions to any ofthe doors associated to the cardreader. This also applies when no
Card readerauthorizationfailed
A failed card author-ization attempt wasmade at reader<reader_name>. Reason: User <user>
Power IQ: Failed card author-ization attempt <attempt_id> atreader <reader_name> usingcard number <card_number>. User <user_name > is not author-
564

565
Description EventName
Event Sum-mary Audit Log Message
doors are associated to the cardreader.
is not authorized. ized.
Card number is associated to an act-ive user and that user has Door Con-trol permissions to one or more of thedoors associated to the card reader.
Card readerauthorizationsucceeded
A successful cardauthorizationattempt was madeby user <user> atcard reader <reader_name>.
Power IQ: Successful cardauthorization attempt <attempt_id> at reader <reader_name>using card number <card_number>. User <user_name >has access to <authorized_doors> of <controlled_doors>doors.
Note: There are no automatic clearing events.

Bulk Card Reader Configuration via CSV
Users with the appropriate permissions can configure card readers via CSVimport/export.
1. In the Data Centers tab, click the Import/Export button on the EDM menu to go to the Enterprise Relationshipspage. Alternatively, go to Settings > Data Management > Enterprise Relationships.
2. Export the existing EDM relationships to CSVby clicking the Export Relationships link in the CSVData MappingActions section.
Note: You must have an EDM in your Power IQ to export existing EDM relationships via CSV. For more
information, see Creating Your EDM on page 410.
3. Use the CSVfile to configure card readers.4. Import your edited CSVfile back into Power IQ.
Mapping a Card Reader to Its Parent
To map a card reader to its parent, add or edit the following attributes in the card reader columns in the CSVfile (spe-cifying parent_object_type and parent_external_key will map a card reader to its parent):
1. object_type (required; specify as CARD_READER)2. pdu_ip (required)3. pdu_proxy_address4. serial_number (required)5. parent_object_type (required)6. parent_external_key (required)
Mapping a Card Reader to a Door
To map a card reader to a door, add or edit the following attributes in the CSVfile (specifying these attributes and door_external_key will associate the door with the card reader):
l object_type (required; specify as DOOR_CARD_READER_MAPPING)l pdu_ip (required)l pdu_proxy_addressl serial_number (required)l door_external_key (required)
Note: Attempting an import without the required fields completed will result in an error.
Electronic Access Control for CPI Doors and Locks
Power IQ 5.2.2 and above provide centralized cabinet-level Electronic Access Control (EAC) for doors and electronic locksconnected to supported Chatsworth Products, Inc. (CPI) PDUs, including eConnect Monitored, Monitored Pro, Switched,
566

567
and Switched Pro PDUs.
When you associate a supported CPI PDU that has door sensors in the Power IQ EDM (data model), doors and door sensormappings are automatically created. For more information, see Autoconfiguration of CPI Doors and Door Mappings below.
After a door is created or identified, the sensors will be mapped to it. Contact closure sensors are mapped to the door com-ponent. Powered dry contact closures are mapped to the electronic lock component. For more information, see SupportedCPI Door and Electronic Lock Sensor Statuses on the next page.
CPI doors can only be unlocked, not locked or relocked, through Power IQ. For more information, see Unlocking CPI Doorson the next page.
Autoconfiguration of CPI Doors and Door Mappings
When you associate a supported CPI PDU that has door sensors in the Power IQ EDM (data model), doors and door map-pings are automatically created. Tags for door placement also are applied as appropriate to the created doors.
Doors are created as siblings to the PDU in the EDM. Doors are tagged for the door placement as either Front for the frontdoor or as Back for the rear door. Contact closure door status sensors and powered dry contact closure electronic locksensors are created for each door attached to the PDU. For more information, see Supported CPI Door and ElectronicLock Sensor Statuses on the next page.
A door named Front Door is created if either a front contact closure or powered dry contact closure exists. If a front dooralready exists, that door will be tagged with a Front tag, and no new door will be created. Similarly, a door named Back

Door will be created if either a rear contact closure or powered dry contact closure exists. If a rear door already exists, thatdoor will be tagged with a Back tag, and no new door will be created.
Note: Front and Back tags will be created if the tags do not already exist. For more information on door placement, seeSetting Door Placement with Tags and Tag Groups on page 551.
Supported CPI Door and Electronic Lock Sensor Statuses
After a CPI door is created or identified, the sensors will be automatically mapped to it. Contact closure sensors aremapped to the door component. Powered dry contact closures are mapped to the electronic lock component. Door andelectronic lock sensors and their statuses can be viewed on the Door smart page > Sensors and Door Status > SensorMappings section.
Supported contact closure door sensor statuses include:
l Openl Closedl N/A
Supported powered dry contact closure electronic lock sensor statuses include:
l Onl Offl N/A
Note: Door handle sensors are not supported in 5.2.2.
Unlocking CPI Doors
568

569
Door control for CPI doors allows only unlocking through Power IQ. To unlock a locked CPI door, click the Unlock button onthe door’s smart page. If the door is already unlocked, the Unlock button will be disabled.
CPI doors currently do not support locking/relocking through Power IQ.
The global door relock timer and override relock timer are ignored for CPI doors. If a door is unlocked through Power IQ,Power IQ will not attempt to relock the door.
If you attempt to lock a CPI door through Power IQ, a failure message will be displayed.
Note: CPI doors can be set to automatically lock/relock after a user-configured timeout has elapsed through the CPI inter-face.
Raritan Electronic Door Locks
Power IQ version 8.0.0 and beyond provides the following enhanced support for Raritan Electronic Door Locks running Rar-itan’s Xerus Firmware v3.6.10 or higher.
This includes support for:
a. Authorization via keypad connected to a Raritan Facility Item (RFI)b. A new Authorization Method that supports authorization at the RFI that is independent of the network availability
resulting in a quicker response. The remote authorization via Power IQ is still an option that can be set by theadmin. The admin should select one mode of operation.
c. Authorization rules configured in Power IQ and pushed to the RFIs upon configuration or change.d. Automatic push of LDAP and AD changes to the RFIs.

Requirements to setup to push rules.
Facility Item
l firmware 3.6.10.5-46551 or newerl configured to send traps to Power IQ (PIQ)l door hardware attached
PIQ
l PIQ configured for Facility Item door authorizationl Door EDM Nodel Door Handle Lock of Facility Item mapped to PIQ Door Lock componentl Card Reader associated to Door (for card auth)l Keypad associated to Door (for keypad auth)l User with Key Card (active card assignment)l User with PINl User has Door Control role for doorl User has an access schedule (there is a default schedule to allow all users)
What pushes rules:
Daily Cron Task
l daily Cron task 01:05
PIQ will send door rules on-demand. Update when any of the following conditions are met:
l The user enables PDU-based authenticationl The PIN is edited, added, or removed from a user(s)l A keypad to door mapping or card to door mapping is removed or addedl Access scheduling gets modifiedl Door control role added or removed from userl Card is assigned, deactivated or reassigned to user
570

571
Setting the Door Access Control Authorization Method
1. Navigate to Settings >Authorization and Authentication > Door Access Control
2. In the Authorization Method panel, select the appropriate radio button to enable authorization via either Power IQor the Facility Item (RFI)

Set or Change the Keypad PIN Code and Assign Keypad PINRole to Users
1. Navigate to Settings > Authorization and Authentication > User Accounts2. Select a User by clicking the hyperlink in the list.
3. Click the "Add Keypad PIN" to set the code (this button is labeled "Change Keypad PIN" when a code was pre-viously set).
4. In the Authorization Keypad PIN codes are associated with a User. The admin can set or change the Keypad PINcode for all users.
572

573
5. To allow individual users to manage their own Keypad PIN codes, assign the Keypad PIN role from the User Rolespanel. See Assigning Roles for User Permissions.

Assign Door Control Role to Users and Groups
The site admin can assign the Door Control Role to Users or Groups. The Role can be assigned globally from Setting >Authorization & Authentication as described above, or you can grant the Role locally to a specific Door. Users with theDoor Control Role are authorized to Lock/Unlock doors.
To assign local privileges:
1. Click the Data Centers tab on the Power IQ main tool bar.2. Select the Door (note, this process can be applied to any object in the hierarchy).
3. Click the Actions button in the upper right corner and select the Edit Permissions option
574

5. Click the Add Role button
6. You can select whether you want to add a Role to a User or Group.
576

8. Select the Door Control role from the list of permissions
9. Click the Add button to add the Role.
Associate Door, Lock and Handle Sensors
Administrators can associate Door, Lock and Handle Sensors via the GUI in the Data Centers tab.
578

579
1. Click the Data Centers tab on the Power IQ main tool bar.2. Select a Door.
Drag and drop the appropriate available sensor to the appropriate door, lock or handle box.
Associate Keypads with One or More Doors
Administrators can associate Keypads with Doors via the GUI in the Data Centers tab or in bulk via csv import.
1. Click the Data Centers tab on the Power IQ main tool bar.2. Select a Door.

3. Click “Add” in the keypad panel. This enables the keypad to unlock a door when correctly authorized via a user.
580

Assign Users and Groups Access Schedules
The Site Administrator can assign one or more Access Schedules to users and groups to control the times access is per-mitted.
1. Navigate to Settings > Authorization and Authentication > Door Access Control2. Select the "Add" button in the Access Scheduling sub panel3. Select Groups or Users, then select the Group or User from the drop down list.
4. To create a recurring schedule select the "Recurring" check box and enter the Start and End Dates and Times.
582

583
5. Click Save
Note: Raritan firmware can handle 64 rules. Each Schedule for each User is a Rule. For example, 5 Users with one Sched-ule each equates to 5 Rules. Additionally Raritan firmware supports Weekly Schedules only.

Chapter 17:Analytics
What are Power IQ Analytics?
The Analytics tab allow you to create and view custom reports based on Power IQ's knowledge of your data center andthe power measurements it takes.
Reports are created as a way to organize charts. See Adding Reports to the Analytics Page.
Each report can contain one or more charts. There are two chart types: Device and Health. See Creating a Chart.
Device charts show power measurements of your devices. See Device Chart Settings.
Health charts show connectivity and event statuses of your PDUs. See PDU Health Chart Settings.
This list contains some examples of the types of information you can include in charts:
l The Active Power consumed by Test Rack #2 over the past hour.l How many Kilowatt Hours were used by Rows A, B and C in the Data Center last month.l If power costs $0.062 per kWh, what did the IT server room cost to power last year?l What is the health status of all PDUs in the system, based on connectivity and events received?
You must configure an Enterprise Data Model before using Analytics. The Enterprise Data Model populates the DataCenter tab with a hierarchical representation of your data center. See Enterprise Relationshipsand the EDM.
584

Adding Reports to the Analytics Page
The analytics page can include multiple report pages. A report page is a collection of one or more charts. Creating mul-tiple reports is a good way to organize the Analytics information by category or specific need.
1. Click Add in the Reports column and enter a name for the report.2. In the Reports toolbar, select the Share This Report checkbox to make the report and charts public.
To view a report:
1. In the Analytics tab, select a report in the Reports column. The report opens in the main section of the page.2. If the report has been shared by another user, you cannot edit it. Shared reports are marked as "Shared by user-
name."
585

586
Sharing Reports on the Analytics Page
Choose to share a report when you want to make it public. Sharing reports gives other Power IQ users access to thereport, and the charts it contains.
Users must have the View and the Create Analytics roles assigned to view your shared reports.
Reports that are shared are marked in the list as "shared by you." Reports that have been shared by other users aremarked as "shared by username."
The data that displays in a report is based on each individual user's permissions in Power IQ. If another user does not havepermission to see information about a rack or datacenter, for example, that you have shared a report about, the user willnot see the data.
Users that you share a report with cannot edit your report. You cannot edit reports that you did not create.
1. In the Analytics tab, select a report on the left side of the page.2. In the Reports toolbar, select the Share This Report checkbox to make the report and charts public.
3. In the Analytics tab, select a report on the left side of the page.4. In the Reports toolbar, deselect the Share This Report checkbox to remove the report from public view.

Creating a Chart
You must add a report before you can create a chart. See Adding Reports to the Analytics Page.
1. In the Analytics tab, select a report on the left side of the page.2. Click Add Chart, then select Device Chart or Health Chart.3. Device charts show power measurements of your devices. See Device Chart Settings.4. Health charts show connectivity and event statuses of your PDUs. See PDU Health Chart Settings.5. You can change the location of any chart by clicking on the title bar of the chart and dragging it to its new position.
587

588
Configuring Charts
Configure a chart to select the data you want to analyze.
Charts created in the Analytics tab can only be viewed in the Analytics tab. Charts configured in the Dashboards tab canbe viewed in the Dashboards tab, or in a Dashboard slide show. See Dashboard.
l For device chart details, see Device Chart Settings.l For PDU health chart details, see PDU Health Chart Settings.

Device Chart Settings
A device chart displays power measurements for the devices in your data centers. Devices must be mapped to rack PDUoutlets or circuits in the EDM before the data can be charted. See Creating YourEDM.
You can configure a device chart on the Analytics tab or on the Dashboards tab.
To chart facility items, see Facilities Chart Widget.
1. In the Analytics tab, select a Report. The charts contained in the Report open. On the chart you want to configure,click the Settings icon. See Creating a Chart for details on adding a new chart.
OR
2. In the Dashboards tab, add a device chart widget, then click the Settings icon in the widget.
The Device Chart Settings dialog appears.
3. In the Measurement field, select the type of measurement you want to analyze from the drop-down list.
The measurement is represented on the y-axis of the chart.
See Device Chart Measurements.
4. In the Time Selection field, select Period or Range.a. Select Period to show constantly updated measurement, such as power consumption over the Past hour,
Past week, Past month, and so on. Select the time period from the drop-down list. See What's the differencebetween "Past" and "Last" time periods?
b. Select Range to show measurements from a custom Start Date and End Date. Select the start and enddates using the calendar dialogs.
The time selection is represented on the x-axis of the chart. Your time selection will affect the available selectionsfor Granularity.
5. In the Granularity field, if available, select the level of granularity of data to chart.a. If you select Period for your time selection, your choices for Granularity will be Hourly or Poll Interval. Hourly
will show one data point per hour for the time period the chart includes, when the time period is 24 hours orlonger. Poll Interval will show one data point per poll interval for the time period the chart includes. Hourly isthe default selection. The Poll Interval must be set to five minutes or longer to use Poll Interval granularity.
b. If you select Range for your time selection, your choice for Granularity will be Automatic or Archive. Auto-matic is the default selection. Select Archive for data from only the archive tables. If you select Archive,user-configurable time selectors will appear next to the selectors for the start and end dates. The date is dis-played in mm/dd/yyyy format, with the default start date being the previous day and the default end datebeing the current day (i.e., yesterday and today respectively). The time is displayed in the 24-hour format,and the default times are based on the current system time.
6. In the Line Configuration field, select an option to determine how many lines are on a chart, and how the lines areconfigured.
a. Select "Manually define" to choose the data for each line individually. You can add data from different sec-tions of the data center to the same chart with this option. See Manually Define Individual Device ChartLines. Click the Individual Lines (Advanced) tab to configure the lines. Note that if you select to manuallydefine lines, the options in the Series field will not be available.
589

590
b. Select "Automatically define" then select a node from your enterprise data model in the Show field to showone line of data in the chart.
7. In the Node field, select the desired level in the EDM hierarchy.8. In the Series field, select from the following options: Selected Node, Children, or Outlets. Selected Node is the
default. Select the Children option to view one line of data per child of the location selected in the Node field. TheOutlets option will show one line per outlet and is only available as an option if you are charting a single rack or facil-ity item, as selected in the Node Field.
For example, selecting Children when a data center is selected in the Node field may show one line per room. Par-ent-child relationships are determined by the structure of your enterprise data model, as configured in the DataCenters tab.
When charting outlets, the series label on the chart will display the device name (when available), outlet name, andfacility item label or IP address.
Note: Humidity and Temperature measurements cannot be represented as one line per child. To chart one line per
humidity or temperature sensor, select "Manually define" in the Line Configuration field.
9. In the External Key field, enter the external key of the PDU to filter the chart's data by that value.10. In the Custom Fields 1 and 2, which may be renamed in your system, enter a PDU custom field value to filter the
chart's data by that value.11. Select Minimum, Maximum, or Average to specify whether you want the lowest values, highest values, or an aver-
age of the data for the measurement you selected. Min/Max/Average is not available for all measurements.12. Click View Matching PDUs to view the list of PDUs to be included in the chart data.13. The text in the Name field displays as the chart title. Select the Auto Name checkbox to allow the name to con-
figure automatically, based on the criteria of the chart. Deselect the Auto Name checkbox to enter a name manu-ally.
14. The Include Legend checkbox is enabled by default, and a chart legend for the data will be included. Deselect theInclude Legend checkbox to remove the legend.
15. Removing the legend can make a chart more readable, depending on how many lines of data are included.16. Click OK to save the settings and view the chart.

Manually Define Individual Device Chart Lines
You can manually define individual device chart lines to choose the data for each line individually.
You can add data from different sections of the data center to the same chart with this option.
See Device Chart Settings to start the chart configuration. In the Chart Settings, select "Manually define lines" to enablethe Individual Lines (Advanced) tab.
1. In the Individual Lines (Advanced) tab, select a line in the Lines column.2. By default there is one line, called Power IQ, that represents the whole system.3. In the "Select what you want to see on this line" field, click the browse button, then select the data center node you
want to chart on this line. Expand or collapse the nodes by clicking the plus and minus signs. The name of the nodeselected displays in the field at the bottom on the dialog. Click Select Node to save the line.
4. To add more lines, click Add, then select the line and repeat step 2 to configure it.5. To filter a line to a more granular level, select the line in the Lines column, then enter your criteria in the fields in the
Filter by Device Properties section.
For example, to configure a chart that includes 1 line per rack or row for a certain customer, add 1 line for each rackor row, then enter the name of the customer in the Customer Name field of each line.
Note: Filtering for Device Type, Customer, Custom Field 1 and Custom Field 2 will include any match that includes
your search term, not just exact matches. For example, "ABC" will include "ABC" and "ABC123".
6. The text in the Name field displays as the line name in the legend of the chart, when legends are enabled. Selectthe Auto Name checkbox to allow the name to configure automatically, based on the criteria of the line. Deselectthe Auto Name checkbox to enter a name manually.
7. Click the Chart Settings tab to finish the other chart configurations. See Device Chart Settings.8. Click Save.
591

592
What's the difference between "Past" and "Last" time periods?
A Past measurement indicates the selected period of time up to the current moment.
Forexample:If you view a device chart on Tuesday, and the period is set to Past Week, the chart includes data from last Tuesdaythrough this Tuesday.
A Last measurement indicates the most recent completed period of time.
Forexample:
If you view a device chart on Tuesday, and the period is set to Last Week, the chart includes data from last Sunday
through last Saturday. The chart shows the last full week.

Device Chart Measurements
Device charts can be configured for many kinds of measurements.
Power Reading Charts:
l Active Power (W)l Current (amp)l IT Energy (kWh)l CO2 Footprint (CO2 Kg)l IT Energy Cost ($ or other currency)l Total Energy Including Cooling (kWh)l Total Energy Cost Including Cooling ($ or other currency)
Temperature Charts:
l Measurement taken as degrees Celsius or Fahrenheit, based on system setting in Settings > Application Settings >Language and Locale Settings.
l Inlet Temperaturel Outlet Temperaturel Outside Air Temperature
Humidity Charts:
l Measurement taken as percentage humidity.l Inlet Humidity (%)l Outlet Humidity (%)l Outside Air Humidity (%)
Air Flow and Pressure Charts:
l Measurements taken as meters per second for air flow, and pascals for air pressure.l Air Flow (m/s)l Air Pressure (Pa)
Vibration Charts:
l Vibration (g)
593

594
Charting Archive Data Using the Device Chart (BETA)
Note: The data archive is an exciting and powerful beta feature that may require additional resources dedicated to PowerIQ. Please contact Sunbird Technical Support at [email protected] or via the Sunbird Support Portal with your sys-tem logs before enabling this feature to ensure a graceful implementation.
In Power IQ, you can use a device chart to display power and environmental measurements for the devices in your datacenters from the data archive.
Note: Devices must be mapped to rack PDU outlets or circuits in the EDM before the data can be charted. See CreatingYour EDM on page 410 for more information.
Note: The Data Archive feature must be enabled before you can chart archived data. See Enabling and Configuring theData Archive (BETA) on page 404 for more information.
You can configure a device chart on the Analytics tab and on the Dashboards tab. For more information, see Device ChartSettings on page 589.
To configure a device chart to chart archive data:
1. In the Analytics tab, select a Report. The charts contained in the Report open. On the chart you want to configure,click the Settings icon. See Creating a Chart on page 587 for details on adding a new chart.
OR
2. In the Dashboards tab, add a device chart widget, then click the Settings icon in the widget.
The Device Chart Settings dialog appears. See Device Chart Settings on page 589 for more information.
3. In the Measurement field, select the type of measurement you want to analyze from the dropdown list.
The measurement is represented on the y-axis of the chart.
See Device Chart Measurements on the previous page for more information.
4. In the Time Selection field, select Range to show measurements from a custom Start Date and End Date. Selectthe start and end dates using the calendar dialogs. Note that charting archive data is limited to a time range of 24hours or less.
The time selection is represented on the x-axis of the chart.
5. In the Granularity field, select Archive for data from only the archive tables. User-configurable time selectors willappear next to the selectors for the start and end dates. The date is displayed in mm/dd/yyyy format, with thedefault start date being the previous day and the default end date being the current day (i.e., yesterday and todayrespectively). The time is displayed in the 24-hour format, and the default times are based on the current systemtime.
6. In the Line Configuration field, select an option to determine how many lines are on a chart, and how the lines areconfigured.
a. Select "Manually define" to choose the data for each line individually. You can add data from different sec-tions of the data center to the same chart with this option. See Manually Define Individual Device Chart

Lines on page 591. Click the Individual Lines (Advanced) tab to configure the lines. Note that if you selectto manually define lines, the options in the Series field will not be available.
b. Select "Automatically define" then select a node from your enterprise data model in the Show field to showone line of data in the chart.
7. In the Node field, select the rack, PDU, or device for the node to be charted.8. In the Series field, select from the following options: Selected Node, Children, or Outlets. Selected Node is the
default. Select the Children option to view one line of data per child of the location selected in the Node field. TheOutlets option will show one line per outlet and is only available as an option if you are charting a single rack or facil-ity item, as selected in the Node Field.
Note: Select “Outlets” for the Series option if you wish to chart the outlets of the PDUs in the Rack, on the PDUs,or associated with the device that you selected. When charting outlets, the series label on the chart will displaythe device name (when available), outlet name, and facility item label or IP address.
For example, selecting Children when a data center is selected in the Node field may show one line per room. Par-ent-child relationships are determined by the structure of your enterprise data model, as configured in the DataCenters tab.
When charting outlets, the series label on the chart will display the device name (when available), outlet name, andfacility item label or IP address.
Note: Humidity and Temperature measurements cannot be represented as one line per child. To chart one lineper humidity or temperature sensor, select "Manually define" in the Line Configuration field.
9. In the External Key field, enter the external key of the PDU to filter the chart's data by that value.10. In the Custom Fields 1 and 2, which may be renamed in your system, enter a PDU custom field value to filter the
chart's data by that value.11. Select Minimum, Maximum, or Average to specify whether you want the lowest values, highest values, or an aver-
age of the data for the measurement you selected. Min/Max/Average is not available for all measurements.12. Click View Matching PDUs to view the list of PDUs to be included in the chart data.13. The text in the Name field displays as the chart title. Select the Auto Name checkbox to allow the name to con-
figure automatically, based on the criteria of the chart. Deselect the Auto Name checkbox to enter a name manu-ally.
14. The Include Legend checkbox is enabled by default, and a chart legend for the data will be included. Deselect theInclude Legend checkbox to remove the legend.
15. Removing the legend can make a chart more readable, depending on how many lines of data are included.16. Click OK to save the settings and view the chart.
595

596
Example Chart Using Archive Data
The following is an example Average Active Power chart, charting outlets from the data archive:

598
PDU Health Chart Settings
A PDU health chart displays connectivity and event statuses of your PDUs.
You can configure a PDU health chart on the Analytics tab or on the Dashboards tab.
1. In the Analytics tab, select a Report. The charts contained in the Report open. On the chart you want to configure,click the Settings icon. See Creating a Chart for details on adding a new chart.
OR
2. In the Dashboards tab, add a PDU health chart widget, then click the Settings icon in the widget. See PDU HealthChart Widget.
The Health Chart Settings dialog appears.
3. Click the Settings icon.4. Enter a name for the chart in the Title field in the Basics section.5. In the Data From field, select All to include all PDUs in the system in the chart. Select Data Center or other section
of the data center to filter the next field's selections. For example, select Racks to filter the Contained In field toinclude the racks in your system.
6. In the Contained In field, select the location of the PDUs you want to include in the Health chart.7. In the Options section, select the health measurement.8. Select Overall Health to view a health chart that combines connectivity and active events to create an overall
health status of the selected PDUs.9. Select Event Health Only to exclude connectivity from the health status.
10. Select Connectivity Health Only to exclude active events from the health status.11. Click Save.

Overall PDU Health
Overall health in a PDU Health Chart comprises both connectivity health and active events health. The overall health isdetermined based on these criteria:
ColorCode Meaning Criteria
Green Good
A PDU is in good overall health if both its connectivity health is good and its active
events health is good. This indicates no unsuccessful polls, and no active warning or
critical severity events.
Yellow WarningA PDU is in warning level overall health if either its connectivity health is warning, orits active events health is warning, but neither is critical. This could indicate a warn-ing level active event and good connectivity.
Red Critical
A PDU is in critical overall health if either its connectivity health is critical or its act-
ive events health is critical. The overall health is critical even when only one of these
categories is critical.
Gray Maintenance
A PDU is in maintenance mode if both its connectivity health and active events
health indicates the PDU is in maintenance. A PDU in maintenance mode is not
polled and its traps are not acknowledged. This mode is helpful for preventing a PDU
from generating connectivity loss events in Power IQ.
Note: Decommissioned facility items are not included in the PDU Health Chart.
599

600
Exporting Charts
Export a chart to save the chart data to a .CSVfile.
1. In the Analytics tab, select a Report.2. The charts contained in the Report open. Click the Export icon in the chart.3. Use the dialog that appears to save the file.

Chapter 18:PUE - Power UsageEffectiveness
Power Usage Effectiveness (PUE) is the ratio of the total amount of power used by a data center to the power delivered toactual IT equipment. An ideal PUEis 1.0.
PUE =Total FacilityPower
IT Equipment Power
Power usage for anything that is not a computing device, such as lighting and cooling, is considered facility power usage.
Power IQ measures total power and IT power based on the flags set for each inlet, outlet or circuit. Flags indicate whetherthe kilowatt hours measured count toward total power, IT power, both, or neither. See Set PUEFlags and What PUEFlagsDoes Power IQ Set Automatically?.
Power IQ sums up the measured values on a daily and monthly basis, then uses the values to calculate PUE. Both dailyand monthly PUEcalculations are offered. Power IQ does a rollup of daily measurements on the first day of each month,using the previous month's data, to create a monthly PUEcalculation for each data center. You can adjust the monthlysums for total power and IT power as needed after the rollup.
All data represents the PUEflags and EDM configuration as set when the data was collected.
Power IQ displays the PUEcalculations in several ways.
l List PUECalculationsand Adjustments: a list of the monthly PUEcalculations for each data center that enablesyou to enter offset values to adjust the monthly total power and IT power readings.
l PUETrend Chart Widget: a dashboard chart that shows PUEcalculations over time.l Latest PUEReading Gauge Widget: a dashboard gauge that shows your latest PUEreading and where it falls
within the thresholds set.
601

Requirements for PUE
PUEcalculations can begin once your system is set up to include:
l Enterprise data model (EDM) is configured and includes the objects you want to flag as part of the PUEcalculation.See Enterprise Relationshipsand the EDM.
l Objects are flagged as Total Power and IT Power. See Set PUEFlags.
602

603
Set PUEFlags
You must identify the sources of IT power and total power using flags. Power IQ uses the flags to determine which readingsto use in the PUEcalculation.
IMPORTANT: When setting Total Power, make sure not to flag the same powermore than once. Set the flag at thehighest level source only.
l Total Power:
Set the flag for Total Power if the object supplies power to the data center. Avoid double-flagging Total Power in thestream. For example, flagging Total Power on a standalone meter AND the inlet to a downstream floor PDU woulddouble-flag the same energy.
Best practice is to measure Total Power at the main line in to the data center. For example, if you have a stan-dalone meter, flag it as Total Power.
Another method is to search for circuits of your Power IQ managed facility items, such as floor PDUs, power panels,UPS, and so on, and flag the highest level sources as Total Power.
Power IQ does not automatically flag Total Power.
IT Power:
l Set the flag for IT Power if the object supplies power for computing purposes only.l Outlets on Rack PDUsl Inlets on Rack PDUs without outlet meters
l Power IQ automatically flags rack PDUs as IT Power.
See What PUEFlags Does Power IQ Set Automatically?.
1. In the PUEtab, use the search criteria to list the objects you want to flag.2. Type: Circuits, Outlets, or Inlets.3. Filter by Node: Select an EDM node.4. Flagged as Total: Filters objects by their Total Power flag status.5. Flagged as IT: Filters objects by their IT Power flag status.6. Click Search.7. In the search results list, select the checkboxes under the Total and IT columns for each object to flag it.
Note: Use the All Total and All IT icons to automatically flag all objects in the search results, or to remove a flag
from all objects in the search results.

What PUEFlags Does Power IQSet Automatically?
Power IQ does not automatically flag for Total power.
Power IQ automatically sets some PUEflags for IT power.
When you upgrade to 4.1 or later:
Object Flagged as IT Power
Rack PDU or inline meter with outlets outlets
Rack PDU and inline meter without outlets inlets
When you add a new object :
Object Flagged as IT Power
Rack PDU or inline meter with outlets outlets
Rack PDU or inline meter without outlets inlets
Floor PDU, Power Panel, Standalone Meter, UPS, CRAC
Note: These facility items are added as PDUs, and supported using Dynamic Plu-gins. See Dynamic Plugins.
none
604

605
List PUECalculations and Adjustments
The PUEtab displays the monthly rollup PUEcalculations for each data center. Monthly data comes from a rollup con-ducted on the first of each month, using the previous month's data. You can adjust the monthly values for Total Power andIT Power for the month.
l Adjustments can be positive or negative Kilowatt hours.l Daily values are not displayed, and they cannot be adjusted.l Adjustments made will affect all PUEcharts in the dashboard that use monthly data.
1. In the PUEtab, choose Activities > List PUECalculations. The list includes a line for each month of data for eachdata center in your EDM.
2. Enter the number of Kilowatt hours for adjustments to Total Power or IT Power in the fields provided. Use a "-" signto make a negative adjustment to the number of hours.
l Total kWh Adj: Adjustment to Total Powerl IT kWh Adj: Adjustment to IT Power

Chapter 19:Reports and Tags
The Reports tab allows users to create reports and administer tags.
The reporting feature supports the following reports: Power\Energy, Temperature, and Rack Failover simulation.
Through the Activities menu, users can create and administer Tag Groups and the available Tags for those groups.
You choose the rows and columns you want to include, and how rows are grouped and filtered.
Filters can employ the tags assigned to EDM nodes to determine which PDUs and IT device readings are included in thereports.
See Creating a Report.
Reports are only available to the user who creates them. The data included is limited to the user's permissions to viewobjects in the EDM. If you do not have permission to view Data Center 1, for example, no data about Data Center 1, or anyroom , rack and so on contained by it, will be included in your reports.
Reports you create can be emailed to anyone you like. Set up a schedule for the report to be run and emailed, or send anexported report by email. See Schedule a Report and Exporting a Report to PDF or CSV.
Once a report has been run, the output is saved in the Report History. Report runs are kept in the report history until areport is deleted.
606

Creating a Report
Create a report to set the parameters of the data you want included. You can choose the rows and columns to include,and specify sorting and filtering.
Power IQ supports five types of reports:
l Creating a Power/Energy Report on the facing pagel Creating a Temperature Report on page 610l Creating a Rack Capacity and Failover Report on page 612l Creating a Door Security Status Report on page 618l Creating a Door Security Audit Report on page 621
607

608
Creating a Power/Energy Report
1. In the Reports tab, click New Report, and select Power/Energy Report.2. Enter a name for the report in the dialog and click OK. You can change it later if needed.3. The Preview/Edit page appears. In the Report Details section, select the data you want in the report rows.
l Row for each:l Time: each row is a time period. Select Day, Week, Month, or Yearl Tag: each row is a tag from the selected tag group. Select a Tag Group. See Adding Tag Groups and Tags.l EDM Node: each row is a node in your data center, as configured in your EDM. Select Data Center, Floor,
Room, Aisle, Row, Rack, PDU, or Device.l Data from:
l PDUs: readings are taken from the PDU inlets.l Devices: readings are taken from the PDU outlets or circuits mapped to the IT device.l Racks: readings are taken from the rack power data.
l Summary Function:l Nonel Suml Minimuml Maximuml Average
l Sort direction:l Ascending or Descending. Rows will be sorted by the Time, Tag, or EDM Node, unless you choose a meas-
urement in Sort by measure. The Sort by measure field becomes active after you add a measurement.l Sort by measure: Select the measurement as defined for the report columns. Select None to sort by the
Time, Tag, or EDM Node.l None, Energy, Average Active Power, Minimum Active Power, or Maximum Active Power, depending on the
column settings.l Time range:
l Period: Select a time period to limit the data included in the report.
l Yesterday – the day before today.
l Past Week – would be to count back exactly a week from now
l For example: If you view a device chart on Tuesday, and the period is set to Past Week, thechart includes data from last Tuesday through this Tuesday.
l Last Week – the calendar week preceding the present week.
l For example: If you view a device chart on Tuesday, and the period is set to Last Week, thechart includes data from last Sunday through last Saturday. The chart shows the last fullweek.
l Last Month – Starts at 12:00:00 a.m. the month before the current month and continues for nmonths. (The range does not include the current month.)
l Year to Date – is a period, starting from the beginning of the current year and continuing up to thepresent day.

l Past Year – means the 365 days preceding today. For example, if it was 14th Feb, 2016 today, thenthe past year would mean the time between 15th Feb, 2015 and 14th Feb, 2016
l Last Year - "Last year" refers to the previous calendar year.
l Custom: Select a custom date range. Use the calendar tool to select a beginning and ending date.
4. Click Save.5. In the Report Columns section, select the readings you want to include in the report columns. Click Add, then
select Energy or Active Power in the Measure field and specify one statistic type, if available, in the Statistic field.Repeat to add multiple measurements for a multi-column report.
l Energy: Readings are kilowatt hours. Data comes from daily rollups. No statistic options are available for thisreading.
l Active Power: Readings are active power in kilowatts. Data comes from daily rollups.l Three statistic types are available: Average, Maximum and Minimum.
6. In the Tag Filters section, select tags to filter what sources of data are included in the report. Only data from taggedsources is included. Click Add, then select Tag Group and Tag. Repeat to add more tag filters. If multiple tag filtersare applied to a report, an object must have all the tags in order to be included in the report.
7. Click Run Now to run the report. See Schedule a Report for adding scheduled email delivery.
609

610
Creating a Temperature Report
A temperature report shows inlet/outlet temperatures at a rack level. Therefore, the row of the report is always racks andcannot be configured.
Temperature units are either degrees Celsius or Fahrenheit, based on system settings in Settings > Application Settings >Language and Local Settings.
Users without View permissions or a role that includes View permissions for certain racks cannot retrieve the temperaturedata from those racks when running the temperature report. See Assigning Roles for User Permissions.
1. In the Reports tab, click New Report, and select Temperature Report.2. Enter a name for the report in the dialog and click OK. You can change it later if needed.
The Preview/Edit page appears.
3. In the Report Details section, select how you want the data to be presented.
4. Summary Function:l Nonel Averagel Minimuml Maximum
5. Ascending or Descending. The report is sorted by the rack names, unless you choose a measurement in Sort bymeasure. The Sort by measure field becomes active after you add a measurement.
6. Sort by measure: Select the measurement as defined for the report columns. Select None to sort by rack names.7. None, Average Inlet Temperature, Minimum Inlet Temperature, Maximum Inlet Temperature, Average Outlet Tem-
perature, Minimum Outlet Temperature, or Maximum Outlet Temperature, depending on the column settings.8. Time range:
l Period
l Yesterday – the day before today.
l Past Week – would be to count back exactly a week from now
l For example: If you view a device chart on Tuesday, and the period is set to Past Week, thechart includes data from last Tuesday through this Tuesday.
l Last Week – the calendar week preceding the present week.
l For example: If you view a device chart on Tuesday, and the period is set to Last Week, thechart includes data from last Sunday through last Saturday. The chart shows the last fullweek.
l Last Month – Starts at 12:00:00 a.m. the month before the current month and continues for nmonths. (The range does not include the current month.)
l Year to Date – is a period, starting from the beginning of the current year and continuing up to thepresent day.

l Past Year – means the 365 days preceding today. For example, if it was 14th Feb, 2016 today, thenthe past year would mean the time between 15th Feb, 2015 and 14th Feb, 2016
l Last Year - "Last year" refers to the previous calendar year.
l Custom: Select a custom date range. Use the calendar tool to select a beginning and ending date.9. Click Save.
10. In the Report Columns section, select the readings you want to include in the report columns. Click Add, thenselect a temperature type in the Measure field, and a statistic type in the Statistic field. Repeat to add multiplemeasurements for a multi-column report.
11. Measure: Inlet Temperature or Outlet Temperature.12. Statistic: Average, Maximum or Minimum.13. In the Tag Filters section, select tags to filter what sources of data are included in the report. Only data from tagged
sources is included. Click Add, then select Tag Group and Tag. Repeat to add more tag filters. If multiple tag filtersare applied to a report, an object must have all the tags in order to be included in the report.
14. Selected tags filter out not only racks but also temperature sensors, based on whether their parent nodes matchthe selected tags.
15. Click Run Now to run the report. See Schedule a Report for adding scheduled email delivery.
611

612
Creating a Rack Capacity and Failover Report
A Rack Capacity and Failover Report shows which rack PDUs may completely lose power when one of the two redundantpower sources fails or is turned off for maintenance.
The information in the report is organized by rack. For details on the data included in the report, see Information Availablein the Rack Capacity and Failover Report on page 614.
PDUs can be paired if they have the same number of inlets and circuit breakers and the same capacity ratings. In caseswhere two PDUs meet this criteria, they will be automatically paired; you do not have to manually pair them. In caseswhere more than two PDUs meet this criteria, the PDUs may be paired automatically or you can pair the PDUs by applyingthe appropriate tags to the PDUs. A PDU must have at least one inlet to be included in the report. For more information,see Pairing PDUs for Rack Capacity and Failover Reports on page 614.
Note: The report does not provide notification for loss of power but rather should be is used to help you preemptivelyidentify PDUs that are vulnerable in a failover simulation. This report makes assumptions about supported devices andshould not be used as the sole basis for the design of an effective failover plan. For more information, see AssumptionsAbout Supported Racks on page 616.
1. In the Reports tab, click New Report, and select Rack Capacity and Failover Report. Enter a name for the report inthe dialog and click the OK button. You can change it later if needed.

The Report Details page appears.
2. In Location, click the browse button to select the EDM node containing the racks you want to analyze. You canselect EDM nodes from Data Center to Row.
3. In Sort Rack by, select one of the following options:a. Rack Nameb. Rack Utilization (rack power utilization for rack-level analysis)c. Failover Utilization (rack failover utilization, for failover analysis similar to the previously available reports)
4. In Rack Sort Direction, select Descending or Ascending.5. In Pair Utilization Sort, select Descending or Ascending.6. In Time Range, select a period of time or set a custom range of dates. By default, this field is set to Last Complete
Poll. For more information, see Data Sources for Each Time Range on page 617.7. Click the Save button.8. Click the Run Now button to run the report. See Schedule a Report on page 627 for adding scheduled email deliv-
ery.
Note: To Edit the report details, click the Edit button on the report page. Make your edits on the Report Details page andclick the Save button.
613

614
Pairing PDUs for Rack Capacity and Failover Reports
PDUs can be paired if they have the same number of inlets and circuit breakers and the same capacity ratings.
In cases where two PDUs meet this criteria, they will be automatically paired; you do not have to manually pair them.
In cabinets with more than two rack PDUs, the PDUs may be paired automatically (randomly) or explicitly by tagging thePDUs with Failover Pair tags and Source tags.
The tag groups Failover Pair and Source are available by default in Power IQ 5.2 and later.
When there are more than two PDUs in a rack, specific PDUs can be paired together by tagging the PDUs with the sametag from the Failover Pair tag group. Tags in the Failover Pair tag group can be created by users.
Tags in the Source tag group can be created by users and indicate left versus right column placement in the report (fromleft to right based on alphabetical order). For example, a PDU tagged with Alpha will be in the left column, and a PDUtagged with Beta will be in the right column.
For more information on tagging, see Adding Tag Groups and Tags on page 636.
Information Available in the Rack Capacity and Failover Report
The following topics summarize the information available in the Rack Capacity and Failover Report.
RackSummaryA Rack Summary is located at the top of each rack section in the Rack Capacity and Failover Report. The Rack Summarydisplays the following information:
l Capacity (kW)l Load (kW)l Utilization
Note: Capacity can be set by the user in the Rack Details page (accessible from the Data Centers tab) or via CSVImportby entering the appropriate value(s) in the Capacity column in the CSVfile.
RackPDU Capacityand Failover InformationThe Rack Capacity and Failover Report displays the following PDUs in their own sub-sections:
l Paired (matched, compatible) PDUs within a single rackl Single (mismatched, non-pairable, non-compatible) PDUsl Transfer switches and multi-inlet PDUs
In addition to a Failover Simulation column that provides load and utilization information, each sub-section includes the fol-lowing information for each PDU:
l Type (indicating if the reading is for an inlet, inlet pole, or a circuit breaker)l Capacity (A)l Load (A)l Utilization

In the Failover Simulation column, the report shows the sum of the two PDU load values and compares it to the capacity ofeither one. When capacity is exceeded, the value is highlighted in red. When the load is within 80% of the capacity, thevalue is highlighted in yellow.
A section with an unpaired PDU will only show information for that PDU. Blank values will be displayed for Load and Util-ization in the column where the second paired PDU typically would be located as well as in in the Failover Simulationcolumn. A note clarifying the reason why the PDU is not paired also will be displayed. For example: “Unpaired because: Amatching PDU for failover simulation was not found on the rack.”
When a rack PDU has three-phase inlets, the report shows a row for each line and a row for each circuit breaker when avail-able.
Note: A row indicating the highest utilization is available only for paired PDUs.
Note: A PDU must have at least one inlet to be included in the report.
Note: Non-PDU facility items and environmental monitoring systems are not supported in this report.
615

616
Assumptions About Supported Racks
Supported racks in the Rack Capacity and Failover Report are assumed to follow these guidelines.
l The load of the servers is split between the two rack PDUsl IT Devices in the rack have an even number of cords. Half of the cords are connected to one PDU, and the other
half are connected to the other PDUl For 3-phase rack PDUs, IT Devices are connected to the same phase legs on both rack PDUs
The report disclaimer, included at the bottom of each Rack Capacity and Failover Report, details further assumptions andconditions regarding the accuracy and use of the report.
Report Disclaimer
For 3-phase Rack PDUs, a device is assumed to be connected to the same phase legs on both PDUs. This report may notbe accurate for racks with Rack PDUs that lost connectivity, lost power, or were decommissioned during the time periodselected for the report. Reports that specify a time range use average amp readings, while reports with Last Complete Polluse a recent reading. The report does not report peak loads such that while the report may indicate that on average yourrack would pass a failover situation, it cannot indicate that it will always pass. In general, this report relies on data col-lected in the past under a set of conditions. If these conditions change, this report will no longer be accurate. This reportshould not be used as the sole basis for the design of an effective failover plan.

Data Sources for Each Time Range
A different data source is used for each time range selection in the reports. The time range is set when you create or edit areport. For more information on setting the time range for a Rack Capacity and Failover Report, see Creating a Rack Capa-city and Failover Report on page 612.
Time Interval Data Source
Last Complete PollRaw readings from the last completed poll cycle: inlet currentand circuit breaker current
Yesterday
Custom range that is 1 or 2 days long
Hourly rollups: Inlet average current and circuit breaker averagecurrent
For each PDU, the average of all the hourly readings for the timeperiod is displayed in the report.
Last Week
Past Week
Last Month
Past Month
Month to Date
Custom range that is greater than 2 days and lessthan or equal to 62 days
Daily rollups: Inlet average current and circuit breaker averagecurrent
For each PDU, the report shows the average of all the daily read-ings for the time period.
Last Year
Past Year
Year to Date
Custom range greater than 62 days
Monthly rollups: Inlet average current and circuit breaker averagecurrent
For each PDU, the report shows the average of all the daily read-ings for the time period.
617

618
Creating a Door Security Status Report
The Door Security Status report provides security status information for doors within a specific location and its childrenand at the current date and time. This information is sorted into sections by the door space type (based on EDM parentnode) and name, with a separate row for each door included in the report.
The Door Security Status report displays only the doors in the selected location that you have View permissions for.
The report includes the following columns:
l The Space column lists the type of space (Data Center, Floor, Room, Aisle, Row, or Rack) and its name.l The Door column identifies each door included in the report and its placement (Front or Back). If placement has
not been set for the door, the placement cell will be blank.l The Status column lists the statuses for each door, handle, and electronic lock. The following statuses are sup-
ported: Locked/Unlocked and Open/Closed. If no sensor is mapped to the component, a dash (—) will be dis-played.
The data in the report can be exported to PDF or CSV.
Note: If there are no doors in the selected location, the report will display a message indicating that no doors have beenfound.
Note: The statuses in this report are as of the last successful PDU communication.
1. In the Reports tab, click New Report > Door Security – Status Report. Enter a name for the report in the dialog andclick OK. You can change it later if needed.

The Preview/Edit page appears. In the Report Details section, select the data you want to include.
2. In Location, click the browse button ( ) to select the EDM node containing the doors you want to include in thereport. You can select from the following EDM nodes: Data Center, Floor, Room, Aisle, Row, or Rack. Click theSelect Node button in the dialog to make your selection.
619

620
3. Back on the Preview/Edit page, click the Save button.4. Click the Run Now icon to run the report. See Schedule a Report on page 627 for adding scheduled email deliv-
ery.
Note on Editing and Deleting Reports: To Edit the Report Details, click the Edit button on the report page. Make your editson the Preview/Edit page and click the Save button. To delete the report, click the Delete icon on the Preview/Edit page.

Creating a Door Security Audit Report
The Door Security Audit Report provides door, door handle, and card reader access summaries for doors for a specific loc-ation and date range. This information is sorted into sections by the door space type (based on EDM parent node) andname, with a separate row for each request logged in the report.
Each request log is time- and date-stamped and indicates the user who initiated the request and an access summary.
Note: For doors accessed physically (when the request is not initiated in Power IQ), the Requested Action and Usercolumns will remain blank.
1. In the Reports tab, click New Report > Door Security – Audit Report. Enter a name for the report in the dialog andclick OK. You can change it later if needed.
621

622
The Preview/Edit page appears. In the Report Details section, select the data you want to include.

624
2. In Location, click the browse button ( ) to select the EDM node containing the doors you want to include in thereport. You can select from the following EDM nodes: Data Center, Floor, Room, Aisle, Row, or Rack. Click theSelect Node button in the dialog to make your selection.
3. Back on the Preview/Edit page, in Time Range, select a period of time or set a custom range of dates. By default,this field is set to Past Week.
l Period
l Yesterday – the day before today.
l Past Week – would be to count back exactly a week from now
l For example: If you view a device chart on Tuesday, and the period is set to Past Week, thechart includes data from last Tuesday through this Tuesday.
l Last Week – the calendar week preceding the present week.
l For example: If you view a device chart on Tuesday, and the period is set to Last Week, thechart includes data from last Sunday through last Saturday. The chart shows the last fullweek.
l Last Month – Starts at 12:00:00 a.m. the month before the current month and continues for nmonths. (The range does not include the current month.)
l Year to Date – is a period, starting from the beginning of the current year and continuing up to thepresent day.
l Past Year – means the 365 days preceding today. For example, if it was 14th Feb, 2016 today,then the past year would mean the time between 15th Feb, 2015 and 14th Feb, 2016

l Last Year - "Last year" refers to the previous calendar year.
l Custom: Select a custom date range. Use the calendar tool to select a beginning and ending date.4. Click the Save button.5. Click Run Now to run the report. See Schedule a Report on page 627 for adding scheduled email delivery.
Note: The data in the Door Security Audit report can be exported as a PDF file only.
Note on Editing and Deleting: To Edit the Report Details, click the Edit icon on the report page. Make your edits on the Pre-view/Edit page and click the Save button. To delete the report, click the Delete icon on the Preview/Edit page.
625

626
Run a Report
1. In the Reports tab, select the report in the Tabular Reports list. The last-run version of the report displays.2. Click Run Now. A status message displays while the report generates.
The new report appears in the Preview/Edit section.
3. Verify the report version by looking to the Report History column listing all versions of the report. Click other reportversions to view.

Schedule a Report
You can schedule a report to run at a selected interval. Scheduled reports are run after 1:30am on the day scheduled. Thereport is emailed to the recipient list shortly after the report run completes.
Scheduled report runs also appear in the Report History section in the Reports tab.
1. In the Reports tab, select the report you want to schedule.2. Click Edit.3. In the Schedules section at the bottom of the report parameters, click Add. A report may have more than one
schedule.4. In the Report Schedule dialog, set the schedule parameters:
l Email to: Enter the email addresses for all recipients of the report.l Frequency: Select Daily, Weekly, or Monthly. For Weekly or Monthly, specify the day or date.l Attachment: Select the file type for the report, CSVor PDF.
5. Click Save.
627

628
Exporting a Report to PDFor CSV
You can export most report data to either a PDF or CSVfile.
Failover reports can only export to PDF.
1. In the Reports tab, select the report you want to export.2. Choose Export > PDF or CSV.3. Save or open the file. Choices depend on your browser.
Note: If opening a temperature report in CSVwith Microsoft applications, such as Excel, a redundant character appearsprior to the degree symbol. This character is resulted from the default Microsoft encoding and can be ignored.

Report Examples
l Monthly Energy Report for One Internal Customer with Scheduled PDF Deliveryl Data Center Power Report for Past Weekl Load for All B-Side PDUs for Last Month
629

630
Monthly Energy Report for One Internal Customer with ScheduledPDFDelivery
This report shows how to create a monthly energy usage report for a customer, and schedule it for email delivery eachmonth.
Required Tagging:
l Add a Tag Group for Customer, with tags for each customer's name. See Adding Tag Groups and Tags.l Assign the customer name tag to each IT device in your EDM. See Assign Tags in the Data Centers Tab.

632
Data Center Power Report for Past Week
This report shows how to quickly find the past week power for your data centers.
Required Tagging:
l None.

634
Load for All B-Side PDUs for Last Month
This report shows how you could find the kWload on all B-side PDUs for the last month.
Tagging Required:
l Add a Tag Group: PDU Type, with tags for A-Side and B-Side. See Add Tag Groups and Tags.l Assign the B-Side tag to each PDU. See Assign Tags in the Data Centers Tab.

636
Adding Tag Groups and Tags
Adding tag groups and tags is the first step toward using filtering by tag in reports.
Tag groups and tags help you categorize objects in your data center. When you filter by tag in a report, the report auto-matically includes readings from only the tagged objects. If multiple tag filters are applied to a report, an object must haveall the tags in order to be included in the report.
Some examples of tag groups are Customer, Department, PDU Type, or Device Type. See Tag Example: Report on Racksby Customer Tag.
Tags must be added before you can assign them to EDM nodes. See Assign Tags in the Data Centers Tab.
1. In the Reports tab, choose Activities > Tags and Tag Groups.2. In the Tag Groups section, click Add, then add the names of a group of tags you want to add. Click Add.
Example
If you plan to tag by customer name, add a Tag Group called Customer.
3. In the Tags section, click Add, then select the Tag Group you want to add tags to, and enter the tag name in theName field. Click Add.
Example
If you have a Tag Group called Customer, enter your customer names as the Tags in that group.
4. Next step: Assign the tags to EDM nodes. See Assign Tags in the Data Centers Tab.

Tag Example: Report on Racks by Customer Tag
In a colocation facility, you may want to track racks by customer.
l Add a tag group called Customer.l Add tags for each customer name.l Assign the correct customer name tag to the racks in the EDM that the customer owns.
In tabular reports, there are two ways to use tags.
l Create a report with the Row for Each as Tag, then select Tag Group: Customer, and Tag: "Customer Name". Whenthe report runs, you see one row of data for each customer.
OR
l Create a report with the Row for Each as Time or EDM Node. Add a Tag Filter, for example, using Tag Group: Cus-tomer, then selecting Tag: Customer Name of your choice. When the report runs, you see one row of data for eachtime or node, but the data is filtered to include only nodes tagged with the specified customer name.
637

638
Migrating Existing Data to Tags
You can migrate some existing data in your EDM to tags.
l Data Centers, PDUs and IT Devices: Custom Field 1 and Custom Field 2l IT Devices: Customer and Device Type
You can find these fields on the Data Center, IT Device, and PDU objects in the Data Centers tab.
Migration creates tag groups from the field names, and creates tags from the data in the fields. Migration also applies thenewly created tags to the EDM nodes where they were originally entered.
Note: Migration does not remove the data from the original fields. The original fields are not linked to the new tags in
any way, so if you choose to maintain both data locations, you must do so manually. The best practice is to main-
tain this data as tag groups and tags, going forward.
See Migrate Custom Field Data for instructions to do the migration.
IT Devices, Data Centers, and PDUs:
l Each IT Device, Data Center and PDU contains two custom fields, Custom Field 1 and Custom Field 2. You mayhave edited the names.
l Upon migration, the name of the custom field becomes the tag group name, with the EDM node in parentheses, toidentify where the data came from.
EDMNode
Field Name: Con-tents
Migration Creates -> Tag Group: Tag
Data CenterCustom Field 1: Sales
Custom Field 2: Marketing
Custom Field 1 (Data Center): Sales
Custom Field 2 (Data Center): Mar-keting
IT DeviceCustom Field 1: Colo1
Custom Field 2: Colo2
Custom Field 1 (IT Device): Colo1
Custom Field 2 (IT Device): Colo2
PDUCustom Field 1: Facilities
Custom Field 2: IT
Custom Field 1 (PDU): Facilities
Custom Field 2 (PDU): IT
IT Devices:

l In addition to Custom Fields 1 and 2, IT devices also contain fields for Customer and Device Type that you canmigrate to tags.
Field Name: Contents Migration Creates -> Tag Group: Tag
Customer: Bank Device Customer: Bank
Device type: Dell PowerConnect 2848 Device Type: Dell PowerConnect 2848
639

640
Migrate Custom Field Data
The Migrate Custom Field Data tool creates new tags and tag groups based on existing custom and standard field data forPDUs, devices, and data centers.
See Migrating Existing Data to Tags for details.
If you use the migration tool more than once, duplicate tags and tag groups will not be created. If new data is found, newtags will be added to the existing tag groups.
1. In the Reports tab, choose Activities > Tags and Tag Groups.2. Click Migrate.3. To confirm, click Migrate Custom Field Data in the message that appears.
When complete, tag groups and tags appear in the Reports tab. The tags have also been applied to the EDM nodeswhere they originated.
4. To view the tags applied, go to the EDM node in the Data Centers tab, then scroll down to the Tags section. Forracks and PDUs, there is no Tags section. Choose Actions> Edit Tags to view tags.

Assign Tags in the Data Centers Tab
You can assign tags to EDM nodes in the Data Centers tab. To assign tags to multiple EDM nodes at once, use the CSVimport tool. See Assigning Tags with CSVImport.
Tags can be assigned to these EDM nodes:
l Data Centerl Floorl Rooml Rowl Aislel Rackl PDU: rack PDUs only, no facility itemsl IT Device
1. In the Data Centers tab, go to the EDM node you want to tag. Scroll down to the Tags section.2. Click Add, then select the Tag Group and Tag. Click Add. The assigned tags display in the list.
To assign tags to a rack or PDU in the Data Centers tab:
1. In the Data Centers tab, go to the rack or PDU you want to tag.2. Choose Actions > Edit Tags.3. Click Add, then select the Tag Group and Tag. Clck Add. The assigned tags display in the list.
To remove tags:
Note: This is the only way to remove a tag. You cannot remove a tag using CSVimport.
1. In the Data Centers tab, go to the EDM node you want to remove a tag from.2. Select the tag and click Remove.
641

642
Exporting and Importing Tags
Tag import is used to assign tags to EDM nodes. You cannot create tag groups and tags using import. See Assigning Tagswith CSVImport .
To export your existing tag assignments, use the export tool. See Exporting Existing Tag Assignments.
For help with import errors, see Import Errors for Tags.

Exporting Existing Tag Assignments
The tag export file includes all tagged EDM nodes.
You can use the export file as a template to add more tags to EDM nodes. Duplicate tags are not added. Each import addsnew tags, and does not change any existing assigned tags. See Assigning Tagswith CSVImport.
1. In the Reports tab, choose Activities > Export/Import Tag Entries.2. Click Export. Save or open the file. Choices depend on your browser.
643

644
Assigning Tags with CSVImport
To assign tags to multiple EDM nodes at once, use the CSVimport tool. The import uses the tag groups and tags you havealready created. Import cannot create new tag groups or tags. To create new, see Add Tag Groups and Tags.
Duplicate tags are not added. Each import adds new tags, and does not change any existing assigned tags.
The file is validated before import. If any errors are found, the whole file is rejected, and no changes are made. You canview error messages for each line of the file upon rejection. See Import Errors for Tags.
Tip: To export a CSVfile to use as a template, assign one tag manually, then export. See Assign Tags in the Data CentersTab and Export Existing Assigned Tags.
1. Create the CSVfile. The CSVfile must have 5 columns:
type external_key name tag_group tag
l type: The EDM node you're assigning the tag to. Not case sensitive. The following entries can be used.l DATA_CENTERl FLOORl ROOMl ROWl AISLEl RACKl PDUl DEVICE
l external_key: The EDM node's external key.l name: Include an EDM node name here for convenience when creating your import file. The import does not use or
change the name.l tag_group: The name of an existing tag group. The import cannot create a new tag group.l tag: The name of an existing tag in the tag group. The import cannot create a new tag.
2. Save the file as .CSV.3. In the Reports tab, choose Activities > Export/Import Tag Entries.4. Click Browse then select the .CSVfile and click OK. Click Import. The file is validated.
Success: All tags are assigned as described in the file.
l Error: If the file does not validate, click View Errors. The Import Errors display in the page. See Import Errors for Tags.

Import Errors for Tags
Each error includes the line number from the CSVfile, the error message, and the details.
Common errors and resolutions:
Error Resolution
Tag group does not exist
Tag does not exist
You must add tag groups and tags before you can assign them using the import.
See Adding Tag Groups and Tags.
Tag entry already exists The tag is already assigned to the EDM node specified in the CSVfile.
External key does not exist as anexternal key
The external key is incorrect for the EDM node. Verify the external key in the EDMnode in the Data Centers tab.
Tag can't be blank You must enter a tag for each line in the CSVfile.
Example error:
Line num-ber Error EDM Node
TypeEDM NodeExternal Key
TagGroup Tag
Line 160 hasError(s):
Tag entry alreadyexists in
[DEVICE,IT Device -- 3657,
DeviceType,
EthernetSwitch]
645

646
User Permissions for Reports and Tags
You must have the Site Administrator role to create tag groups and tags. This is the "admin" user role.
You must have Site Administrator, Administrator, or Operator role permissions to a node to assign a tag to it.
The reports you create will be limited based on your permissions to view the EDM.
View Tag Groups
Power IQ 5.1.1 and higher have enhancements to Tag Groups to limit the visibility of customer data. To accomplish this, anew user role has been added: View Tag Groups.
By default, all users will have the role assigned to them. Customers wishing to prevent a user from this role must removethe role from their settings.
To remove this role, the Site Administrator must click on the User Group> All Users > Group Roles > View Tag Groups >Remove.

The role Manage Tag Groups also has been added.
If a Site Administrator wishes to allow a particular user to be able to manage and view the Tag Groups, the Administratorcan simply assign this role to the user. By default, users will not have this role.
647

Chapter 20:Plugins
Power IQ uses two types of plugins to manage data center facility items: standard plugins and dynamic plugins.
Standard plugins are built in to Power IQ and provide native or "out of the box" support for devices. For more information,see Standard Plugins on the next page.
Dynamic plugins enable you to add data collection support for external PDUs and facility items that Power IQ does notsupport by standard plugin. There are two types of dynamic plugins: structured and custom. For more information, seeDynamic Plugins on page 650.
Note: During the PDU discovery process, dynamic plugins have priority over standard plugins. Therefore, if a PDU can bemanaged by either a dynamic or standard plugin, Power IQ will select the dynamic plugin, even if a standard plugin isavailable.
For a list of vendors supported by standard and dynamic plugins, see Supported Vendors on page 746. For complete listsof devices supported by standard and dynamic plugins, see the Sunbird Addons website.
648

Standard Plugins
Standard plugins are built in to Power IQ and provide native or "out of the box" support for devices. They do not have to beinstalled.
Users cannot add or remove standard plugins from Power IQ; however, they can create or download and install their owndynamic plugins. For more information on using dynamic plugins, see Dynamic Plugins on the facing page
For a list of vendors supported by standard plugins, see Supported Vendors on page 746. For a full list of devices supportedby standard plugin, see the Standard Plugins page on the Sunbird Addons website.
649

650
Dynamic PluginsDynamic plugins enable you to add data collection support for external PDUs and facility items that Power IQ does not sup-port by standard plugin.
Dynamic plugins work by mapping SNMP OIDs to Power IQ's database so that Power IQ can find and retrieve data fromthe device. Power IQ does not include dynamic plugins "out of the box"; rather, users may create or download and installthe appropriate dynamic plugins for free from the Sunbird Addons website.
During the PDU discovery process, dynamic plugins have priority over standard plugins. Therefore, if a PDU can be man-aged by either a dynamic or standard plugin, Power IQ will select the dynamic plugin, even if a standard plugin is available.
There are two types of dynamic plugins: structured and custom. For more information, see Types of Dynamic Plugins:Structured and Custom on page 652.
The following device types are supported in each type of dynamic plugin:
l CRACl Floor PDUl Floor UPSl Power Panell Rack PDUl Rack UPSl Standalone Meter
For a list of vendors supported by existing dynamic plugins, see Supported Vendors on page 746. For a full list of supporteddevices or to download existing plugins, see the Dynamic Plugins page on the Sunbird Addons website.

Limitations of Dynamic Plugins
There are a number of limitations that should be kept in mind when managing PDUs via dynamic plugins.
l Buffered data retrieval is not supported for PDUs added with dynamic plugins.l If the desire outcome is a dynamic plugin that only supports traps, then a structured plugin is preferred because a
structured plugin can pass validation without any sensor mappings being added. On the other hand, a custom plu-gin requires at least one sensor mapping to pass validation.
l Power IQ events created from traps via a dynamic plugin will never clear automatically like those managed bystandard plugins can. These events must be manually cleared by the end user.
l Under certain scenarios, depending upon what the relevant MIB supports, it may be necessary to hard code certainvalues in a custom dynamic plugin. For example, if it is not possible to determine from the MIB what type of externalsensor is attached at a particular port, it may be necessary to hard code the sensor type to a temperature or humid-ity as applicable. Assume a scenario with a Rack PDU with two ports, where the custom plugin is configured withPort 1 hard coded to a temperature sensor and Port 2 to a humidity sensor. This will work for all PDUs with this spe-cific configuration. However, if there are PDUs where Port 1 is the humidity sensor and Port 2 is temperature, thenPower IQ will show misleading data. It is important to keep this information in mind and to ensure a homogenousconfiguration across all managed PDUs if necessary.
651

652
Types of Dynamic Plugins: Structured and Custom
There are two types of dynamic plugins: structured and custom.
The structure of the PDU's SNMP MIB typically determines whether a structured or a custom dynamic plugin is mostappropriate.
Generally, if the MIB you are working with supports it, you should choose the structured dynamic plugin option.
Note: All dynamic plugins created before Power IQ release 4.1 were structured dynamic plugins. Upon upgrade, thedynamic plugin type for these existing plugins will be set to "Rack PDU." You cannot change the type, but the rest of thedynamic plugin can be edited.
Structured Dynamic PluginA structured dynamic plugin is derived from hierarchically structured MIBs. Typically, the values are organized in tables inthe MIB. For example, a hierarchical MIB for a rack PDU typically has separate tables for elements such as inlets, circuitbreakers, and outlets.
In a structured dynamic plugin, you define mappings and index mappings that represent a series of OID values to be col-lected. You do not have to provide a mapping for every single SNMP OID that you want Power IQ to collect. If the MIB sup-ports values that can be retrieved that indicate the number of inlets, outlets, circuits, and so on, or if the MIB containscolumnar values that can be counted, it is possible to create a structured dynamic plugin that is capable of managing avariety of PDU models. This is not possible with a custom dynamic plugin.
Custom Dynamic PluginA custom dynamic plugin requires a mapping for every desired reading. For example, you would map values for outlet 1voltage, outlet 1 current, outlet 2 voltage, outlet 2 current, etc. You must manually specify each object id you want PowerIQ to collect, and then map each object id into the Power IQ PDU/electrical device data model.
Custom dynamic plugins are useful when:
l You want to monitor a PDU that does not use SNMP for remote communication. These PDUs may use Modbus orBacnet protocols for remote communication. You can monitor these PDUs with an SNMP gateway. The SNMP gate-way gives the ability to convert Modbus, or other protocols, to SNMP. The custom dynamic plugin can use a com-bination of the SNMP OIDs and hard-coded values mapped to the data model of the PDU type to support yourspecific PDU. See SNMP Gateways and Custom Dynamic Plugins on page 744.
l The device's MIB does not contain data in tables, also known as a "flat" or "unstructured" MIB.

Mappings for Each PDU Type
This section lists the valid mappings supported by each type of PDU. Click below to jump to the appropriate section.
l Common Mappings belowl CRAC Mappings on the facing pagel Floor PDU Mappings on the facing pagel Floor UPS Mappings on page 656l Power Panel Mappings on page 658l Rack PDU Mappings on page 659l Rack UPS Mappings on page 661l Standalone Meter Mappings on page 664l External Temperature and Humidity Sensor Mappings on page 665l Temperature Unit Configuration Precedence on page 667l Binary Sensor Mappings - Custom Dynamic Plugins Only on page 668l Wildcard Index Mappings - Structured Dynamic Plugins Only on page 668l Wildcard Index Mapping Example on page 669
Note: The Index mappings listed below are supported in structured plugins only. They are not supported for custom plu-gins.
Common Mappings
The following mappings are supported across all the PDU types (except for Standalone Meters). All PDU types (except forStandalone Meters) may contain inlets, inlet poles, and external temperature and humidity sensors.
For information on external temperature and humidity sensors, see External Temperature and Humidity Sensor Mappingson page 665.
Structured Plugin Mapping Name Custom Plugin Mapping Name or Data ModelElement and Sensor Type Pairings
PDU Name PDU Name
PDU Firmware PDU Firmware
Inlet Index N/A
Inlet Apparent Power inlet[ordinal] apparent_power
653

654
Structured Plugin Mapping Name Custom Plugin Mapping Name or Data ModelElement and Sensor Type Pairings
Inlet Active Power inlet[ordinal] active_power
Inlet Power Factor inlet[ordinal] power_factor
Inlet Voltage inlet[ordinal] voltage
Inlet Current inlet[ordinal] current
Inlet Energy inlet[ordinal] energy
Inlet Pole Index N/A
Inlet Pole Active Power inlet[ordinal] inletpole[ordinal] active_power
Inlet Pole Voltage inlet[ordinal] inletpole[ordinal] voltage
Inlet Pole Current inlet[ordinal] inletpole[ordinal] current
External Temperature and Humidity SensorsSee External Temperature and Humidity Sensor Mappings on
page 665.
CRAC Mappings
A CRAC may contain inlets, inlet poles and external temperature and humidity sensors.
Only the Common Mappings on the previous page and binary sensor mappings are supported for CRAC PDUs. For inform-ation on binary sensors, see Binary Sensor Mappings - Custom Dynamic Plugins Only on page 668.
Floor PDU Mappings
A Floor PDU may contain inlets, inlet poles, power panels, panel inlets, panel inlet poles, circuits, circuit poles, andexternal temperature and humidity sensors.
In addition to the Common Mappings on the previous page, a Floor PDU supports:
Structured Plugin Map-ping Name
Custom Plugin Mapping Nameor Data Model Element and
Sensor Type PairingsNotes
Panel Index N/A
Panel Name panel[ordinal] name

Structured Plugin Map-ping Name
Custom Plugin Mapping Nameor Data Model Element and
Sensor Type PairingsNotes
Panel Inlet Index N/A
Panel Inlet Active Power panel[ordinal] inlet[ordinal] active_power
Panel Inlet Apparent Powerpanel[ordinal] inlet[ordinal] apparent_power
Panel Inlet Power Factor panel[ordinal] inlet[ordinal] power_factor
Panel Inlet Current panel[ordinal] inlet[ordinal] current
Panel Inlet Voltage panel[ordinal] inlet[ordinal] voltage
Panel Inlet Energy panel[ordinal] inlet[ordinal] watt_hour
Panel Inlet Pole Index N/A
Panel Inlet Pole Active Powerpanel[ordinal] inlet[ordinal] inletpole[ordinal active_power
Panel Inlet Pole Currentpanel[ordinal] inlet[ordinal] inletpole[ordinal] current
Panel Inlet Pole Voltagepanel[ordinal] inlet[ordinal] inletpole[ordinal] voltage
Circuit Index N/A
Circuit Apparent Powerpanel[ordinal] circuit[ordinal] apparent_power
Circuit Active Power panel[ordinal] circuit[ordinal] active_power
Circuit Power Factor panel[ordinal] circuit[ordinal] power_factor
Circuit Voltage panel[ordinal] circuit[ordinal] voltage
Circuit Current panel[ordinal] circuit[ordinal] current
Circuit Energy panel[ordinal] circuit[ordinal] energy
655

656
Structured Plugin Map-ping Name
Custom Plugin Mapping Nameor Data Model Element and
Sensor Type PairingsNotes
Circuit Pole Index N/A
Circuit Pole Namepanel[ordinal] circuit[ordinal] circuitpole[ordinal] name
Circuit Pole Phasepanel[ordinal] panel[ordinal] circuit[ordinal] circuitpole[ordinal] phase
Circuit Pole Positionpanel[ordinal] circuit[ordinal] circuitpole[ordinal] position
Circuit Pole Active Powerpanel[ordinal] circuit[ordinal] circuitpole[ordinal] active_power
Not displayed in Power IQ, butdata is rolled up to provide CircuitActive Power. Use this mapping ifyour PDU does not provide ActivePower data at the Circuit level.
Circuit Pole Voltagepanel[ordinal] circuit[ordinal] circuitpole[ordinal] voltage
Circuit Pole Currentpanel[ordinal] circuit[ordinal] circuitpole[ordinal] current
N/ASee Binary Sensor Mappings - CustomDynamic Plugins Only on page 668.
Floor UPS Mappings
A Floor UPS (Uninterruptible Power Supply) may contain inlets, inlet poles, circuits, circuit poles, batteries, outputs, outputpoles, and external temperature and humidity sensors.
In addition to the Common Mappings on page 653, a Floor UPS supports:
Structured PluginMapping Name
Custom Plugin MappingName or Data Model Ele-ment and Sensor Type
PairingsNotes
Circuit Index N/A
Circuit Apparent Power circuit[ordinal] apparent_power

Structured PluginMapping Name
Custom Plugin MappingName or Data Model Ele-ment and Sensor Type
PairingsNotes
Circuit Active Power circuit[ordinal] active_power
Circuit Power Factor circuit[ordinal] power_factor
Circuit Voltage circuit[ordinal] voltage
Circuit Current circuit[ordinal] current
Circuit Energy circuit[ordinal] energy
Circuit Pole Index N/A
Circuit Pole Namecircuit[ordinal] circuitpole[ordinal]name
Circuit Pole Phase circuit[ordinal] circuitpole[ordinal]phase
Circuit Pole Positioncircuit[ordinal] circuitpole[ordinal]position
Circuit Pole ActivePower
circuit[ordinal] circuitpole[ordinal]active_power
Not displayed in Power IQ, but data is rolled up toprovide Circuit Active Power. Use this mapping ifyour PDU does not provide Active Power data atthe Circuit level.
Circuit Pole Voltagecircuit[ordinal] circuitpole[ordinal]voltage
Circuit Pole Currentcircuit[ordinal] circuitpole[ordinal]current
Battery Index N/A
Please note that only a single battery per UPS iscurrently supported. Specifying a Battery Index isnot required so in most cases it is better to simplynot define a Battery Index.
657

658
Structured PluginMapping Name
Custom Plugin MappingName or Data Model Ele-ment and Sensor Type
PairingsNotes
Battery Capacitybattery[ordinal] capacity_per-centage
Battery RemainingRuntime
battery[ordinal] runtime_remaining
Battery Status battery[ordinal] status
Battery Current battery[ordinal] current
Battery Voltage battery[ordinal] voltage
Seconds on Battery battery[ordinal] seconds_on
Battery ReplacementIndicator
battery[ordinal] replacement_indic-ator
UPS Output Index N/A
Please note that only a single UPS output per UPSis currently supported. Specifying UPS OutputIndex is not required so in most cases it is betterto simply not define a UPS Output Index.
UPS Output Load Per-centage
ups_output[ordinal] load_per-centage
UPS Output Source ups_output[ordinal] source
UPS Output Pole Index N/A
UPS Output Pole LoadPercentage
ups_output[ordinal] ups_output_pole[ordinal] load_percentage
N/ASee Binary Sensor Mappings - Cus-tom Dynamic Plugins Only onpage 668.
Power Panel Mappings
A Power Panel may contain inlets, inlet poles, circuits, circuit poles, and external temperature and humidity sensors.

In addition to the Common Mappings, a Power Panel supports:
Structured PluginMapping Name
Custom Plugin Mapping Nameor Data Model Element and
Sensor Type PairingsNotes
Circuit Index N/A
Circuit Apparent Power circuit[ordinal] apparent_power
Circuit Active Power circuit[ordinal] active_power
Circuit Power Factor circuit[ordinal] power_factor
Circuit Voltage circuit[ordinal] voltage
Circuit Current circuit[ordinal] current
Circuit Energy circuit[ordinal] energy
Circuit Pole Index N/A
Circuit Pole Name circuit[ordinal] circuitpole[ordinal] name
Circuit Pole Phase circuit[ordinal] circuitpole[ordinal] phase
Circuit Pole Positioncircuit[ordinal] circuitpole[ordinal] pos-ition
Circuit Pole ActivePower
circuit[ordinal] circuitpole[ordinal] active_power
Not displayed in Power IQ, but data is rolledup to provide Circuit Active Power. Use thismapping if your PDU does not provide Act-ive Power data at the Circuit level.
Circuit Pole Voltage circuit[ordinal] circuitpole[ordinal] voltage
Circuit Pole Current circuit[ordinal] circuitpole[ordinal] current
N/ASee Binary Sensor Mappings - CustomDynamic Plugins Only on page 668.
Rack PDU Mappings
A Rack PDU may contain inlets, inlet poles, circuit breakers, outlets, outlet poles, and external temperature and humiditysensors.
659

660
In addition to the Common Mappings on page 653, a Rack PDU supports:
Structured Plu-gin Mapping
Name
Custom Plugin Mapping Name orData Model Element and Sensor
Type PairingsNotes
Circuit Breaker Index N/A
Circuit Breaker Cur-rent
circuitbreaker[ordinal] current
Circuit Breaker Name circuitbreaker[ordinal] name
Circuit Breaker State circuitbreaker[ordinal] state
Outlet Index N/A
Outlet Active Power outlet[ordinal] active_power
Outlet ApparentPower
outlet[ordinal] apparent_power
Outlet Name outlet[ordinal] name
Outlet Power Control outlet[ordinal] power_control
Outlet Power Factor outlet[ordinal] power_factor
Outlet State outlet[ordinal] state
Outlet Voltage outlet[ordinal] voltage
Outlet Energy outlet[ordinal] energy
Outlet Current outlet[ordinal] current
Outlet Pole Index N/A
Outlet Pole Current outlet[ordinal] outletpole[ordinal] current
Not displayed in Power IQ, but data is rolledup to provide Outlet Current. Use this map-ping if your PDU does not provide Currentdata at the Outlet level. Similarly, if activeor apparent power are not available at theoutlet but outlet pole current and voltageare available, then outlet power will be

Structured Plu-gin Mapping
Name
Custom Plugin Mapping Name orData Model Element and Sensor
Type PairingsNotes
estimated from the pole current and voltagereadings.
Outlet Pole Voltage outlet[ordinal] outletpole[ordinal] voltage
Not displayed in Power IQ, but data is rolledup to provide Outlet Voltage. Use this map-ping if your PDU does not provide Voltagedata at the Outlet level.
Outlet Pole ActivePower
outlet[ordinal] outletpole[ordinal] active_power
Not displayed in Power IQ, but data is rolledup to provide Outlet Active Power. Use thismapping if your PDU does not provide Act-ive Power data at the Outlet level. Pleasenote that Power IQ will first attempt to useoutlet pole current and voltage to estimateoutlet power. If current and voltage are NOTavailable at the outlet pole level will outletpole active power be used to estimate out-let active power.
Rack UPS Mappings
A Rack UPS may contain inlets, inlet poles, circuit breakers, outlets, outlet poles, batteries, outputs, output poles, andexternal temperature and humidity sensors.
In addition to the Common Mappings on page 653, a Rack UPS supports:
Structured Plu-gin Mapping
Name
Custom Plugin Mapping Name orData Model Element and Sensor
Type PairingsNotes
Circuit Breaker Index N/A
Circuit Breaker Cur-rent
circuit_breaker[ordinal] current
Circuit Breaker Name circuit_breaker[ordinal] name
Circuit Breaker State circuit_breaker[ordinal] state
Outlet Index N/A
661

662
Structured Plu-gin Mapping
Name
Custom Plugin Mapping Name orData Model Element and Sensor
Type PairingsNotes
Outlet Active Power outlet[ordinal] active_power
Outlet ApparentPower
outlet[ordinal] apparent_power
Outlet Name outlet[ordinal] name
Outlet Power Control outlet[ordinal] power_control
Outlet Power Factor outlet[ordinal] power_factor
Outlet State outlet[ordinal] state
Outlet Voltage outlet[ordinal] voltage
Outlet Energy outlet[ordinal] energy
Outlet Current outlet[ordinal] current
Outlet Pole Index N/A
Outlet Pole Current outlet[ordinal] outletpole[ordinal] current
Not displayed in Power IQ, but data is rolledup to provide Outlet Current. Use this map-ping if your PDU does not provide Currentdata at the Outlet level. Similarly, if active orapparent power are not available at the out-let but outlet pole current and voltage areavailable, then outlet power will be estim-ated from the pole current and voltage read-ings.
Outlet Pole Voltage outlet[ordinal] outletpole[ordinal] voltage
Not displayed in Power IQ, but data is rolledup to provide Outlet Voltage. Use this map-ping if your PDU does not provide Voltagedata at the Outlet level.
Outlet Pole ActivePower
outlet[ordinal] outletpole[ordinal] active_power
Not displayed in Power IQ, but data is rolledup to provide Outlet Active Power. Use thismapping if your PDU does not provide Act-ive Power data at the Outlet level. Pleasenote that Power IQ will first attempt to use

Structured Plu-gin Mapping
Name
Custom Plugin Mapping Name orData Model Element and Sensor
Type PairingsNotes
outlet pole current and voltage to estimateoutlet power. If current and voltage are NOTavailable at the outlet pole level will outletpole active power be used to estimate out-let active power.
Battery Index N/A
Please note that only a single battery perUPS is currently supported. Specifying a Bat-tery Index is not required so in most cases itis better to simply not define a Battery Index.
Battery Capacity battery[ordinal] capacity_percentage
Battery RemainingRuntime
battery[ordinal] runtime_remaining
Battery Status battery[ordinal] status
Battery Current battery[ordinal] current
Battery Voltage battery[ordinal] voltage
Seconds on Battery battery[ordinal] seconds_on
Battery ReplacementIndicator
battery[ordinal] replacement_indicator
UPS Output Index N/A
Please note that only a single UPS outputper UPS is currently supported. SpecifyingUPS Output Index is not required so in mostcases it is better to simply not define a UPSOutput Index.
UPS Output Load Per-
centageN/A
UPS Output Source N/A
UPS Output Pole
IndexN/A
663

664
Structured Plu-gin Mapping
Name
Custom Plugin Mapping Name orData Model Element and Sensor
Type PairingsNotes
UPS Output Pole
Load PercentageN/A
Standalone Meter Mappings
A Standalone Meter may contain circuits, circuit poles, and external temperature and humidity sensors.
For information on external temperature and humidity sensors, see External Temperature and Humidity Sensor Mappingson the next page.
For information on binary sensors, see Binary Sensor Mappings - Custom Dynamic Plugins Only on page 668.
A Standalone Meter supports:
Structured Plu-gin Mapping
Name
Custom Plugin Mapping Name orData Model Element and Sensor
Type PairingsNotes
PDU Name pdu_name
PDU Firmware pdu_firmware
Circuit Index N/A
Circuit ApparentPower
circuit[ordinal] apparent_power
Circuit Active Power circuit[ordinal] active_power
Circuit Power Factor circuit[ordinal] power_factor
Circuit Voltage circuit[ordinal] voltage
Circuit Current circuit[ordinal] current
Circuit Energy circuit[ordinal] energy
Circuit Pole Index N/A
Circuit Pole ActivePower
circuit[ordinal] circuitpole[ordinal] active_power
Not displayed in Power IQ, but data isrolled up to provide Circuit Active Power.

Structured Plu-gin Mapping
Name
Custom Plugin Mapping Name orData Model Element and Sensor
Type PairingsNotes
Use this mapping if your PDU does notprovide Active Power data at the Circuitlevel.
Circuit Pole Voltage circuit[ordinal] circuitpole[ordinal] voltage
Circuit Pole Current circuit[ordinal] circuitpole[ordinal] current
Circuit Pole Position circuit[ordinal] circuitpole[ordinal] position
External Tem-
perature and Humid-
ity Sensors
See External Temperature and Humidity
Sensor Mappings below
N/ASee Binary Sensor Mappings - Custom DynamicPlugins Only on page 668.
External Temperature and Humidity Sensor Mappings
Examine your MIB to determine how the external sensor data is arranged and choose the correct mapping.
Generic sensor mappingsGeneric sensor mappings do not include the "temperature" or "humidity" term in the mapping. Generic sensor mappingsare useful when you have an OID to determine the type of sensor, and all sensor data is encoded in a single MIB table.
In custom dynamic plugins, only the generic sensor mappings are supported.
The generic sensor mappings can be used to identify both external temperature and humidity sensors. Mappings specificto temperature and humidity are not required for custom dynamic plugins because you have the ability to control eachOID that is collected, and you can hard code any value that is not available through the MIB. If the MIB does not provide asensor type value, you must hard code it.
Structured PluginMapping Name
Custom Plugin MappingName or Data Model Ele-
ment and Sensor Type Pair-ings
Notes
External Sensor Index N/A Not supported for custom dynamic plugins
External Sensor Type external_sensor[ordinal] type
665

666
Structured PluginMapping Name
Custom Plugin MappingName or Data Model Ele-
ment and Sensor Type Pair-ings
Notes
External Sensor Name external_sensor[ordinal] name
External Sensor Value external_sensor[ordinal] value
External Sensor Unit external_sensor[ordinal] unit
For temperature only, specify Fahrenheit orCelsius. The unit for humidity is alwaysassumed to be a percentage. When all read-ings are given in the same unit, it's ofteneasier to set the Temperature Unit metadatavalue.
This mapping is needed only in the unlikelycase that a MIB gives some temperaturereadings in Fahrenheit and some in Celsius.If so, you must define this mapping for alltemperature and humidity sensors identifiedbecause the plugin requires the same totalnumber of mappings for each data modelelement. For example, if a plugin has fiveexternal sensor name mappings defined,then it must have exactly 0 or 5 unit map-pings defined.
External Sensor DecimalDigits
external_sensor[ordinal] decimal_digits
The Decimal Digits mapping works as a mul-
tiplier. Use this mapping when the MIB table
contains multiple sensor types and each
type has a different scaling. If the scalings
are the same, using a multiplier as needed
will work, and the multiplier is applied to all
sensors.
Sensor specific mappings for temperatureUse a sensor-specific mapping for temperature when all temperature readings are isolated in separate MIB tables fromother sensor types, or the MIB table contains both temperature and humidity readings in each row, or a single MIB tablecontains both temperature and humidity readings (one reading per row) but there is no column OID that indicates thesensor type.

Note: Sensor specific mappings for temperature cannot be used in custom dynamic plugins. Use the generic sensor map-pings instead.
Structured Plugin Map-ping Name
Custom Plugin Mapping Name or Data Model Element andSensor Type Pairings
Temperature Sensor Index N/A
Temperature Sensor Name N/A
Temperature Sensor Value N/A
Temperature Sensor Unit N/A
Sensor specific mappings for humidityUse a sensor-specific mapping for humidity when all humidity readings are isolated in separate MIB tables from othersensor types, or the MIB table contains both temperature and humidity readings in each row, or a single MIB table containsboth temperature and humidity readings (one reading per row) but there is no column OID that indicates the sensor type.
Note: Sensor specific mappings for humidity cannot be used in custom dynamic plugins. Use the generic sensor map-pings instead.
Structured Plugin Map-ping Name
Custom Plugin Mapping Name or Data Model Element andSensor Type Pairings
Humidity Sensor Index N/A
Humidity Sensor Name N/A
Humidity Sensor Value N/A
Temperature Unit Configuration Precedence
For flexibility to support many kinds of MIB structures, there are several ways of indicating what unit temperature readingsare displayed in.
They will be applied in the following order of precedence:
l If external_sensor_unit (generic) or external_sensor_temperature_unit (specific) mappings are configured and cor-responding Temperature Unit (Celsius) and Temperature Unit (Farhrenheit) metadata types are configured thenthe unit information retrieved from the SNMP agent of the target PDU will be used to determine temperature unit.
l If a Temperature Unit metadata type is configured then it will be used to determine the temperature reading units.l If no other means to determine temperature reading units is available then Celsius will be assumed.
667

668
Binary Sensor Mappings - Custom Dynamic Plugins Only
Note: All PDU types except rack PDUs and rack UPSs can use binary sensors.
Only custom dynamic plugins support binary sensors. Once the metadata has been added to the Binary Sensors section,the Mapping Type will be available in the Sensor Mappings section and will be selectable via the Mapping Type dropdownwhen you add a new sensor mapping. Currently, water, smoke, and on_off sensors are supported. See the Metadata forStructured and Custom Dynamic Plugins on page 671 topic for more information.
l The Object Mapping column may be used to specify an object identifier from which the Mapping Type value is to beretrieved or a hard-coded String value (when the Mapping Type value is 'name').
l The Data Model Element column will contain a 'binarysensor[ordinal] ' for a binary sensor, where the ordinal willindicate the position of the sensor relative to other binary sensors.
l The Mapping Type column for binary sensors supports two valid mapping types: 1) the binary sensor type asdefined in the Binary Sensors metadata section and 2) 'name' mappings which may be used to designate thename of the sensor.
Note: Mapping types must be unique. If the MIB defines more than one set of defined states for a particular sensor type,then you can create additional sensor types by appending an ordinal value to one of the supported mapping types, fol-lowing the format sensortype[ordinal] .
Wildcard Index Mappings - Structured Dynamic Plugins Only
Wildcard index mappings are valid for structured dynamic plugins only.
When a MIB has related OIDs grouped together and in a sequential order, but not in perfectly structured tables, wildcardindex mappings can help you make the information work in a structured dynamic plugin.
Use a wildcard index mapping when you need an index and the relevant stock index mappings have already been used, ordo not make sense. See Wildcard Index Mapping Example on the next page.

Wildcard Index Mappings Corresponding Variable Substitutions
Wildcard Index 1 { wildcard_one_index}
Wildcard Index 2 { wildcard_two_index}
Wildcard Index 3 { wildcard_three_index}
Wildcard Index 4 { wildcard_four_index}
Wildcard Index Mapping Example
Wildcard index mappings are useful for creating a structured dynamic plugin when the MIB is not logically organized intotables. A wildcard index mapping can be used as a substitution value in any structured dynamic plugin mapping.
For example, a structured MIB that supports outlet names and outlet current will typically have an outlet table where eachrow contains one outlet's name and its current (amperage) reading. However, imagine a scenario where the MIB supportsoutlet names and outlet current, but these values are not accessible through a table. Instead the values are organized asconsecutive OIDs in the MIB.
Example:
The MIB's outlet name OIDs:
1.3.6.1.4.1.999.1.2.1
1.3.6.1.4.1.999.1.2.2
1.3.6.1.4.1.999.1.2.3
1.3.6.1.4.1.999.1.2.4
The MIB's outlet current OIDs:
1.3.6.1.4.1.999.1.2.5
1.3.6.1.4.1.999.1.2.6
1.3.6.1.4.1.999.1.2.7
1.3.6.1.4.1.999.1.2.8
The last decimal value of the OID is the "index" for that value. The index values for the outlet name OIDs are: 1,2,3,4. Theindex values for the outlet current OIDs are: 5,6,7,8.
With a single 'outlet_index' mapping, you could not collect both outlet name and outlet current. To solve this problem, youcan use a wildcard index to generate a second series of index values needed, so that both sets of values can be collected.
The following screenshot depicts a setting of mappings that illustrate this:
669

Metadata for Structured and Custom Dynamic Plugins
The metadata information in this section applies to both structured and custom dynamic plugins.
Metadata Definitions
PDU manufacturers have a lot of flexibility when it comes to how they choose to implement the MIBs for their hardware. This includes the how they choose to represent status values and units for readings. In order to address this, it is neces-sary to “tell” PIQ how to map the values in the MIB into concrete status or unit values that PIQ understands.
For example, in the Circuit Breakers and Outlets section, it is possible to define the values that the MIB uses to indicatethat a Circuit Breaker is “OK” or is “Tripped”. If the MIB defines the possible circuit breaker states as Ok(1), Tripped(2), thenthe plugin author would add a value of 1 for metadata field ‘Circuit Breaker State OK’ and a value of 2 for ‘Circuit BreakerState Tripped’.
Similarly, if the possible values are the strings: “OK” and “TRIPPED” then those strings should be configured.
The following Metadata groupings are available:
l Circuits Breakers and Outletsl Environmental Sensorsl UPS Output Sourcel Binary Sensorsl Battery Statusl Battery Replacement Indicator
It is possible to use a wildcard asterisk (*) character when defining a metadata value. This indicates that any value that isNOT explicitly mapped to another field within the group is to be associated to that metadata field.
Also, it is possible to define a comma separated list of values when defining a metadata value. This indicates that any ofthe specified values in the list are to be mapped to that metadata field.
Wildcard and comma separated list of values are supported for the following metadata groups:
l Circuits Breakers and Outletsl UPS Output Sourcel Battery Status
Note: Metadata mapping values are case sensitive.
Metadata for Circuit Breakers and Outlets
Circuit Breaker State and Outlet State Metadata
The dynamic plugin uses the Circuit Breaker State and Outlet State metadata values to interpret values retrieved from atarget PDU during polling. The values entered must be based on information in the target PDU's MIB.
671

672
Example
The MIB indicates that an integer value of 1 indicates that an outlet is ON, and 2 indicates that an outletis OFF, you must specify those values in the metadata section so that Power IQ can interpret the 1 asON, and the 2 as OFF when those values are retrieved in polling.
Outlet Power Metadata
The dynamic plugin uses the Outlet Power metadata values when performing outlet power control on a target PDU. SomeMIBs will use the same value to indicate both the outlet state and power control operations. Some MIBs use different val-ues. All four Outlet State and Power metadata values must be configured properly for outlet power control to work.
Metadata for Environmental Sensors
In the metadata for environmental sensors, the fields work together with the mappings you add to determine your sensortypes, and the units used to interpret readings. See External Temperature and Humidity Sensor Mappings on page 665 fordetails. See External Temperature and Humidity Sensor Mappings Example Screenshots on page 731 for examples.
l Humidity Sensor Type: When the MIB contains a single sensor reading table, and there is a value you can use todetermine sensor type, use this field to set the value of the humidity sensor type.
l Temperature Sensor Type: When the MIB contains a single sensor reading table, and there is a value you can useto determine sensor type, use this field to set the value of the temperature sensor type.
l Temperature Unit: Set the value to C or F to hard code the units used to interpret readings, when the MIB does nothave sensor reading unit information, or when Temperature Unit (Celsius)/Temperature Unit (Fahrenheit) valuesare not found in this metadata section. This field is only used when a unit’s value is not specified on a per readingbasis using the external_sensor_unit (generic) or external_sensor_temperature_unit (specific) mappings.
l Temperature Unit (Celsius) and Temperature Unit (Fahrenheit): These fields work with the external_sensor_unit, orexternal_sensor_temperature_unit mappings. Your readings unit is determined by a match between the value spe-cified here, and the value returned from the MIB for either external_sensor_unit or external_sensor_temperature_unit.
Metadata for UPS Output Source
A UPS output source value indicates the present source of output power for the UPS. PIQ supports four UPS output sourcevalues: Unknown, Normal, Bypass and OnBattery. These metadata fields work in conjunction with the UPS Output Sourcemapping for Floor UPS and Rack UPS devices.
The plugin author should map each of the output source values in the target UPS’ MIB to one of the PIQ supported values.For example, consider the upsOutputSource OID from the standard UPS MIB:

In this case, an appropriate set of mappings might be:
or, using the wildcard for the Unknown field will get the same result and protect against possible future enhancements tothe MIB which may introduce new status values:
Metadata for Binary Sensors
In Power IQ 6.0.2, custom dynamic plugins have been enhanced to support binary sensors to help you better track theenvironmental conditions in your data center. The currently supported mapping types are as follows:
673

674
Mapping Type Description
water For water leak alarm status
smoke For fire or smoke alarm status
on_off For on/off status of floor PDUs and in-row cooling fans or for Running/Stop status of CRAH units
A section for Binary Sensors has been added to the Metadata section of the Edit Custom Dynamic Plugin page. Dynamicplugin authors can add the Mapping Type and indicate the State 0 and State 1 values based on the supported MIB values:
l State 0: Represents an Off or Normal state. Example relevant values include: 0, false, absent, not_detected, open,off, normal, not_tripped, unlocked, and inactive.
l State 1: Represents an On or Alarmed state. Example relevant values include: 1, true, present, detected, closed,on, alarmed, tripped, locked, and active.
Note: Mapping types must be unique. If the MIB defines more than one set of defined states for a particular sensor type,then you can create additional sensor types by appending an ordinal value to one of the supported mapping types, fol-lowing the format sensortype[ordinal] . For example: smoke, smoke1, water, water1, or on_off, on_off1.
For information on binary sensor mappings, see Binary Sensor Mappings - Custom Dynamic Plugins Only on page 668.
Metadata for Battery Status
A UPS battery status value indicates the present status of the UPS battery. PIQ supports five UPS battery status values: Unknown, Normal, Low, Depleted and Fault Condition. These Metadata fields work in conjunction with the Battery Statusmapping for Floor UPS and Rack UPS equipment.
The plugin author should map each of the UPS battery source values in the target UPS’ MIB to one of the PIQ supportedvalues. For example, consider the upsBatteryStatus OID from the standard UPS MIB:

In this case, an appropriate set of mappings would be:
Metadata for Battery Replacement Indicator
The battery replacement indicator indicates whether or not the battery of a UPS is no longer functioning properly andneeds to be replaced. There are two available metadata fields: True and False. These metadata fields work in con-junction with the Battery Replacement Indicator mapping for Floor UPS and Rack UPS equipment.
The plugin author must inspect the MIB supported by the UPS and determine what value indicates that the battery needsto be replaced and specify that value for the True field. Similarly, whatever MIB value indicates that the battery does NOTneed to be replaced must be specified as the value for the False field.
For example, if the MIB specifies that a value of 0 indicates that the UPS battery is normal and a value of 1 indicates thatthe UPS battery has issues and needs to be replaced, then the mappings would look like:
675

Trap Support in Dynamic Plugins - Structured or Custom
Trap support applies to both structured and custom dynamic plugins.
Power IQ can convert incoming SNMPv1 and SNMPv2/v3 traps from a PDU managed with a dynamic plugin into a PowerIQ event. To support this ability, you must add trap mappings to your dynamic plugin.
Note: Trap mapping is supported for proxied PDUs only when managed through custom dynamic plugins. Each proxiedPDU is managed by a unique dynamic plugin mapping. You must add an event filter on whatever trap parameter uniquelyidentifies the proxied PDU which is the target of the event.
Note: Trap mapping is not supported for proxied PDUs managed through a structured dynamic plugin mapping.
Traps can be mapped to one of these events:
l genericInfol genericWarningl genericCritical
The Power IQ events are generic. Because of this, it is necessary to define event summary text for each trap mapping togive meaning to the event.
Most of the information passed in an SNMP trap is encoded in what are called variable bindings, or "varbinds" for short.Variable bindings are a key value pair, where the key is an object identifier and the value is typically an integer or string. Inthis guide, for simplicity, trap variable bindings are referred to as trap parameters.
When configuring a trap mapping in Power IQ, the event summary text supports parameter expansion for any SNMP trapparameter contained in the trap. This means any relevant information encoded in a trap's parameters may be displayed inthe Power IQ event listing or event details pages through the event summary text. See Trap Mapping Variables andFormat on page 682
The best practice is to create a detailed, meaningful event summary text. Use filtering to map traps with values matchingthe filter to a specific event severity level and summary text.
When defining trap filters, you can define a regular expression in place of the trap filter value. You will need to check theEnable regular expression matching checkbox to use a regular expression as a trap filter value.
Note: To avoid duplication of an active event when using a regular expression in place of the trap filter value, you candefine regular expression named capture groups. To be considered duplicates, the following criteria must be met for boththe active event and the new event: 1) the trap mappings (including matching any specified regular expressions) mustmatch, and 2) all named capture group values (if in use) must match between the new and active events.
Forexamples, see:
l Example: Trap Mapping with Filters on page 693l Example: Event Summary Message with Variables on page 695l Traps can also be added to custom dynamic plugins based on SNMP-gateway managed devices. There are some
setup requirements. See Example: Trap Mapping with Filters for Babel Buster SPXSNMP Gateway on page 697
677

678
Identify Trap OIDs and Parameters
To create a dynamic plugin with trap support, follow this process to prepare your trap mappings.
l Identify the trap OIDs that you are interested in mapping.l Identify the key parameters in each trap that will be used to create event filters and the event summary text in the
trap mapping.
Trap OIDs
l Trap OIDs are used to identity the alarm or condition being reported. When creating the trap mapping in thedynamic plugin, you will specify the trap OID:
l The trap OID is specified in the Enterprise OID field for an SNMPv2/v3 trap.l The trap OID is specified in the Enterprise OID and Enterprise Specific ID field for an SNMPv1 trap.
Trap Parameters
l Trap parameters are typically useful for:l uniquely identifying the alarm or condition which is being reported. This is necessary if a single trap can
actually describe more than one alarm or condition.l providing sensor reading values and possibly the threshold value that was exceededl uniquely identifying the specific PDU that the alarm pertains to in a proxied or gateway scenario. Custom
mappings only.l any other trap details that may be useful to the Power IQ user
ToolsTo Help With Trap MappingA number of tools can be useful while trying to learn enough about a PDU's traps and their parameters to be able to definetrap mappings in Power IQ.
l The vendor's MIB.
The MIB defines the traps that the device can generate, as well as the variable bindings, that is, trap parameters,that will be sent in each trap. The order of the parameters is specified in the MIB as well. Parameter order is import-ant because you must know the order to define the parameter expansion values in the event summary text. Theevent summary text defines the message that will be generated for the Power IQ event that the trap is mapped to.
l A MIB browser.
A MIB browser, such as the free iReasoning MIB browser, is useful for viewing the contents of the MIB, and it has atrap receiver that you can use to listen for and decode SNMPv1 and SNMPv2/v3 traps. One good method is to firstconfigure your PDU to sent traps to the computer running the iReasoning browser, and then cause the alarm con-dition that generates the trap. The iReasoning browser receives and decodes the trap. You can see exactly whattraps your PDU is generating, what parameters are being sent, and in what order.
See Use a MIB Browser on page 702

Trap OID Wildcards
An OID wildcard is an asterisk (*) used in place of an object-identifer decimal value in an event filter OID value. OID wild-cards are useful when a trap parameter's OID value contains an index value, and the trap mapping being defined shouldapply to all index values.
For example, assume that a type of PDU can generate an 'outletSensorChange' trap. This trap can be used to indicate anover current or an over voltage condition on an outlet. One of the trap's parameters indicates whether the alarm is for an"over current" or an "over voltage" condition. The OID associated with this trap parameter has a decimal value that indic-ates the outlet number that the alarm pertains to. The OIDs for this scenario would look similar to these sample OIDs:
l Outlet 1: 1.3.6.1.4.1.9999.1.9.1l Outlet 2: 1.3.6.1.4.1.9999.1.9.2
and so on, up to the final outlet
l Outlet 30: 1.3.6.1.4.1.9999.1.9.30
Instead of creating a separate trap mapping in PIQ for each and every outlet, use the OID wildcard in place of the indexparameter and specify a filter with the OID:
l 1.3.6.1.4.1.9999.1.9.*
The filter will include all outlets without needing to map a trap for each outlet.
See Example: Trap Mapping with Filters for Babel Buster SPXSNMP Gateway on page 697.
679

680
Trap Filter Regular Expressions (Wildcards)
When defining trap filters, you can define a regular expression in place of the trap filter value. This serves as a way to addwildcards to trap filters and provides flexibility to handle unique traps.
You will need to check the Enable regularexpression matching checkbox to use a regular expression as a trap filter value.
In the example shown below the proxy id for the facility device is being returned at the end of the trap varbind string.
l String returned in varbind: InRow1FA_Fan1_Sts 1=Off/2=On/3=On -14
We want to filter the value at the end of the varbind string to match the proxy id used for that device.

Additional Resources
Regular Expression Test Page for Java
List of expression syntax commands
681

682
Trap Mapping Variables and Format
When creating trap mappings in Power IQ, the event summary message is important to give a detailed description of theevent that occurred.
To create the most useful event summary text, you can write a message that uses parameter expansion for any SNMP trapparameter contained in the trap.
Identify the trap parameters you want to include in your message. Use a trap receiver to view the list of parameters.Identify the parameters by number using the format shown.
The following format is supported: { trap.1} , { trap.2} and so on.
For example, the following table shows the first five trap parameters (varbinds) for a Raritan PX2 'inletSensorStateChange'trap. Two sets of parameters are shown to demonstrate how the SNMPv1 format trap works differently from the SNMPv2/v3format trap. Note that this is for illustration purposes only--a PX2 PDU cannot be configured to send SNMPv1 traps.
SNMPv2/v3 traps will always have a timestamp and a trap OID parameter as the first two parameters in the trap. SNMPv1traps do not. If the MIB indicates that a particular trap has five parameters, when it is sent as an SNMPv2/v3 trap, it willactually have seven parameters.
Number SNMPv1 Parameters SNMPv2/v3 Parameters Expansion Value
1 pduName Timestamp { trap.1}
2 pduNumber Trap OID { trap.2}
3 pxInetAddressType pduName { trap.3}
4 pxInetAddress pduNumber { trap.4}
5 inletLabel pxInetAddressType { trap.5}
See Example: Event Summary Message with Variables on page 695.

Duplicate Trap Handling
Some PDU SNMP agents send more than one trap for the same condition.
Power IQ checks if each newly created event matches an existing active event in the database. If there is already an act-ive event, the new event will be discarded. This prevents duplicate notifications for the same underlying condition.
683

684
Event Clearing
In PIQ 7.1 (& later) it is possible to configure trap mappings such that the events generated support automatic clearing.There are two new elements within trap mapping configuration that make this possible: event parameter mappings andevent labels.
Event Parameter Mappings
Event parameters are key/value pairs that are associated with PIQ events and contain meta data that is necessary for per-forming PDU element association (ie, associating the event to the proper target object in PIQ) and event correlation (ie,event clearing and de-duplication).
There are a limited number of event parameter keys that are currently supported. They are:
Event ParameterKey Description Format
inletLabel Identifiesspecific inlet String: I1,I2,..In
lineLabel Identifiesspecific lineString:L1,L2,L3 orL1-L2,L2-L3,L1-
L3
inletPoleNumber Identifiesspecific inlet pole Integer:1,2,..n
cbLabel Identifiesspecific circuit breaker String:CB1,CB2,...CBn
outletLabel Identifiesspecific outlet Integer:1,2,..n
outletPoleNumber Identifiesspecific outlet pole Integer:1,2,..n
externalSensorNumber Identifiesspecific external sensor Integer:1,2,..n
externalSensorNameIdentifiesspecific external sensor
based on userassigned nameString
externalSensorType
Identifiesthe type ofexternal
sensor. Varbind value must match
one ofthe configured external
sensor temp/humiditymeta data
values.
String

Event ParameterKey Description Format
circuitNumber Identifiesa specific circuit Integer:1..n
circuitPoleNumber Identifiesa specific circuit pole Integer:1..n
When configuring trap mappings there is a new Add Event Parameter button which may be used to add an event para-meter mapping. A drop-down is provided to permit selection of the desired event parameter key. In the example below, anoutletLabel event parameter key has been added. The OID identifies the variable binding whose value will be associatedwith the outletLabel key and subsequently used for identification and correlation during event processing.]
685

686
By adding event parameter mappings it is possible to get more granular control over what PIQ identifies as a duplicateevent. Consider the Outlet Switched Off trap from our example. Prior to this feature as soon as there was one active eventfor ANYoutlet any subsequent events would be discarded as duplicates. By specifying an outletLabel event parameter anyunique event (as determined by the outletLabel value) will no longer be discarded as a duplicate.
Also, with respect to external sensor events, provided there is a match, any defined externalSensor* event parameters willbe used to associate the resulting event to the external sensor EDM object rather than to the source PDU which generatedthe trap.

Note that within a given trap mapping, once an event parameter has been selected it will be removed from the drop-downlist.
Event parameter mapping values will appear on the event details page in the PIQ UI along with any SNMP variable bindingvalues that are sent with any given trap.
Event Labels
Trap mappings now support an Event Label field which allow a dynamic plugin author to create a event label string whichidentifies the event. This string value must be:
l unique within any given dynamic pluginl no longer than 64 characters
The event label field provides a more descriptive, user-friendly name and will appear in the PIQ UI in place of the genericevent text that is displayed currently. This is true on the event listing page as well as on the event details page.
Please note that event labels are not required and existing trap mappings will continue to function as beforeif an event label is not provided.
ClearingEvent Labels
Once at least one trap mapping has an event label defined, the Add Clearing Event button is enabled. Clicking the AddClearing Event button adds a clearing event field and the plugin author can choose the corresponding clearing event froma drop down list of configured event labels. In the example below the Outlet Switched On event is selected as a clearingevent for the Outlet Switched Off event.
687

Event ClearingDetail
An active event is considered a match for (or a duplicate of) a new event based on the following criteria:
• event type (genericInfo, genericWarning, genericCritical)
• trap OID
• target of the event (ie, PDU element: PDU, inlet, outlet CB, external sensor, etc...)
• sensor type (ie, current, voltage, onOff, temperature, humidity, etc..)
• for generic events, elements from the dynamic plugin trap mapping:
o user defined trap filters
o user defined event parameters
o user defined clearing events
Event ListingandDetail Page Changes
Prior to 7.1.0, the Event (Name) field on the event listing and event detail pages simply showed one of the following genericevent names for events generated by the dynamic plugin:
• Informational Event
• Warning Event
• Critical Event
In 7.1.0 and later the Event (Name) field now displays the user-defined event label when available rather than its cor-responding generic event name. From our example, the user will see Outlet Switched On instead of Informational Event. Ifno event label is defined the generic event name will continue to be used as the event name.
689

692
Please note that when sorting by Event (Name) on the event listing page generic events created by thedynamic plugin wil continue to be sorted based on the generic event names and therefore may appear outof order.
Expand/Collapse ConfiguredTrapMappings
The dynamic plugin UI can be cumbersome to navigate because of the number of sections and mappings that a dynamicplugin can contain. The Traps portion of the dynamic plugin UI can be particularly easy to get lost in when there are a sig-nificant number of traps supported.
In 7.1.0 we added the ability to expand or collapse configured trap mappings. This will help plugin authors significantly asthey work to add event clearing support to their existing mappings and develop new mappings.
By default, when a plugin mapping is edited, all existing trap mappings will be collapsed and only the trap mappings’ eventlabel will be displayed. Clicking the + will expand the selected trap mapping. If no event label is defined an auto-generatedtrap mapping descriptor will be generated using the format: Trap Mapping [ordinal]
UpgradingPIQWithExistingTrapMappingDefinitions
In a PIQ upgrade scenario where a PIQ system with existing dynamic plugin mappings is upgraded to PIQ 7.1.0 (or later)there are a few considerations to make note of.
If existing trap mapping definitions are not updated to take advantage of event clearing then trap to event conversion willremain unchanged after the upgrade.
After adding event clearing configuration to an existing trap mapping the plugin author should manually clear any match-ing active events to ensure that any newly generated matching events are not erroneously identified as a duplicate and dis-carded.

Example: Trap Mapping with Filters
This example uses Raritan PX2 details as a reference. Dynamic plugins are not needed for PX2 PDUs.
In this example, assume a dynamic plugin has been created for a Raritan PX2 PDU. The dynamic plugin will support trapmapping for one trap, with filtering added to create events with two severity levels.
Example Goal:
l To add trap mappings that show a Warning level event when the PX2's inlet sensor state is above the upper warn-ing level, and to show a Critical level event when the inlet sensor state is above the upper critical level.
PX2 MIB - Trap Information
inletSensorStateChange NOTIFICATION-TYPE
OBJECTS {
pduName,
pduNumber,
pxInetAddressType,
pxInetIPAddress,
inletLabel,
typeOfSensor,
measurementsInletSensorTimeStamp,
measurementsInletSensorValue ,
measurementsInletSensorState ,
oldSensorState,
sysContact,
sysName,
sysLocation }
STATUS current
DESCRIPTION
"Inlet Sensor State Change"
::= { traps 61 }
Steps:
1. Select SNMP v2c.
2. To add the Critical level mapping, click Add Trap, and add the Enterprise OID for the "inletSensorStateChange"trap for the PDU. Use the { pdu_system_oid} variable if desired.
693

694
3. Select Generic Critical for the Event Type.4. Write an event summary message that describes the critical event. Use variables for the trap parameters to be
included. The trap parameters expand when the message displays in the event details.
For example, the first variable specified in the MIB for this trap is 'pduName'. This is the user-assigned name of thePDU that generated the trap. This example shows an SNMPv2 trap, so the 'pduName' variable is sent as the thirdvariable in the trap. The first two varbinds of all SNMPv2 traps are 'timestamp' and 'trap oid'. See Identify Trap OIDsand Parameters and Trap Mapping Variables and Format.
5. To make sure that only critical-level, inlet state events are mapped to this message, add a filter that looks for the"above upper critical" value for the inlet sensor state. Click Add Filter. Enter a descriptive name for the filter. Enterthe OID for Inlet Sensor State, then enter the value for a critical event. This filter requires a value of "6", whichmeans "AboveUpperCritical".
To add the Warning level trapping, repeat the Add Trap and Add Filter process, with these changes:
l Event Type: Generic Warningl Event Summary: write text to describe warning condition, rather than criticall Filter Value: change from "6" to "5". A value of "5" for inlet sensor state means "AboveUpperWarning".

Example: Event Summary Message with Variables
Example of a trap mapping with trap parameters as variables in the Event Summary message, and the resulting EventDetails with complete summary shown.
The event summary text that is displayed in the Events tab list and in the event details is generated at the time of the eventcreation. Any configured { trap.N} substitutions defined in the event summary text of the matching trap mapping are expan-ded from the event's SNMP parameter values.
695

696
If event summary text cannot be generated because the relevant trap mapping was deleted or modified such that it is nolonger a match, then an error message displays, indicating that no matching trap mapping could be found.

Example: Trap Mapping with Filters for Babel Buster SPXSNMPGateway
Power IQ can receive threshold traps from SNMP gateways, such as Babel Buster, and convert them into meaningfulevents.
You must configure the Babel Buster to send traps before the traps can be mapped in the dynamic plugin.
To configure a Babel Buster device to generate traps that can be converted to Power IQ events, you must:
l Create uniquely named eventsl Configure threshold rules for the eventl Associate the event with a register you want to monitor the value of
See Tips for Babel Buster Configuration on the facing page.
Example:
l To configure the dynamic plugin to be capable of mapping these traps to Power IQ events, follow these examples.Check the numbers in the screenshot with the list that follows for an example of each item.
1. Configure the Enterprise OID with the Babel Buster 'eventStateChange' trap OID: 1.3.6.1.4.1.3815.1.2.2.2.0.1
Babel Buster only supports a single trap OID, so the enterprise trap OID will always have this value for any thresholdtrap you configure.
2. Select the appropriate Event Type based on the alarm condition being reported by the specific trap you are map-ping.
3. Configure meaningful Event Summary text using desired trap parameter expansion elements: { trap.1} , { trap.2} ...{ trap.N}
See Trap Mapping Variables and Format on page 682.
697

698
4. Add an Event Name filter. Use the unique event name as configured on the Babel Buster as the filter's Value.
Each filter OID must be specified such that it is an exact match for the OID of the targeted trap parameter.
One or more asterisks (*) may be substituted in any position in the OID in place of a decimal value. This asteriskacts as a wildcard and will cause the Power IQ trap handler to ignore that particular portion of the OID when per-forming matching. See Trap OID Wildcards on page 679.
This is helpful in the Babel Buster scenario because the second to last decimal value is an 'eventIndex' value whichindicates the row in 'eventTable' in the Babel Buster MIB. The 'eventIndex' value is dynamic and will change basedon the Babel Buster configuration. Specifying an asterisk in your filter OID mappings will prevent your configurationfrom having to be modified in the event that the Babel Buster threshold configuration changes in the future.
5. Add a 'Register Number' filter. Use the number of the register associated with the threshold configured on theBabel Buster as the Filter's Value. This step is optional if the 'Event Name' filter value is unique.
6. Add an 'Event State' filter. The event state trap parameter value indicates whether the alarm condition is active(asserted) or not active (de-asserted). An event state value of (1) indicates an active event, and a value of (0) indic-ates that the condition is not active. This means that an event state value of (0) indicates that the alarm conditionhas been cleared.
A common scenario would be to create two trap mappings for each Babel Buster Action Rule or Event Name. Onetrap mapping would be used to map the active trap, where EventState value is 1, and one trap mapping would beused to map the clearing trap, where EventState value is 0.
Tips for Babel Buster Configuration
BabelBuster Event State Change reference information: eventStateChange
Babel Buster devices allow you to configure a named threshold that will generate an eventStateChange trap.
Trap
eventStateChange NOTIFICATION-TYPE
OBJECTS {
eventRegNum,
eventRegName,
eventRegData,
eventName,
eventTestType,
eventTestVal,
eventState
}
STATUS current
DESCRIPTION
"This trap is sent when an event changes state

if notifications are enabled for the object that changed."
::= { bbx2Traps 1 }
VariablesEdit section
eventRegNum - (Integer) Register number referenced by this event.
eventRegName - (DisplayString) Name of register referenced by this event.
eventRegData - (DisplayString) Floating point ASCII string representation of register data.
eventName - (DisplayString) Name given to this event for identification purposes.
eventTestType - (Integer - undefined(0), greaterThan(1), greaterOrEqual(2), lessThan(3), lessOrEqual(4), equal(5),notEqual(6)) Event test type, comparision of register data against test value.
eventTestVal - (DisplayString) Floating point ASCII string representation of event test value.
eventState - (Integer - false(0), true(1)) State of event, true means register meets test defined by threshold rule, truemay imply alarm condition active
699

700
Structured Dynamic Plugins
Requirements
l MIB file for the device you want to manage. See Find the MIB File on the next page.l Ability to correctly identify OIDs in a MIB file.

Find the MIB File
To add a PDU using dynamic plugins, you must have the MIB file for the PDU.
To find the MIB file:
l MIBs are usually available in one of the following locations.
The product interface. For example, Raritan PXPDUs have a menu option to save the MIB file.
Note: PXPDUs are supported. You do not need to add dynamic plugins for Raritan PDUs.
l The product's website.
The product's technical support department.
701

702
Use a MIB Browser
A MIB browser is useful when creating your dynamic plugins. When adding traps to dynamic plugins, a trap receiver is alsohelpful.
iReasoning MIB Browser free personal edition is suggested. iReasoning also includes a trap receiver.
See Identify Trap OIDs and Parameters on page 678 for details on using a MIB browser to help with trap mapping.
Go to http://ireasoning.com/download.shtml.

Identify the OIDs for Mapping
Power IQ provides the ability to map OIDs for many components, attributes, and details of power devices. Power IQ cancollect and display data from the device based on the mappings you provide.
OIDs are documented in a product's MIB file.
In SNMP, the object identifier (OID) that uniquely identifies the make and model of an SNMP-managed device is the MIB-IISystem Object Identifier, commonly referred to as "sysObjectID", which is 1.3.6.1.2.1.1.2.0.
Within Power IQ, the value for "sysObjectID" is referred to as the "PDU System OID".
For example, the sysObjectID or "PDU System OID" for a Raritan model PXPDU is "1.3.6.1.4.1.13742.4". The "PDU Sys-
tem OID" is commonly used as the prefix for additional OIDs used to retrieve PDU attribute and component information.
See Mappings for Each PDU Type on page 653 for lists of values that you can map from your PDU to Power IQ.
For each feature that you want to map, you must find the OID, and enter it in the mapping form to create the dynamic plu-gin. See Creating a Custom Mapping Dynamic Plugin on page 714.
703

704
Creating a Structured Dynamic Plugin
Select the data you want to collect from your PDU and add the OID mappings for it to create the structured dynamic plu-gin.
When adding OIDs, you can use variables to simplify data entry and reduce errors. You must use the correct formatting,which is validated when you click Apply Changes or Save Plugin. See OID Variables and Format on page 706 for details.
For a full list of available data you can map, see Mappings for Each PDU Type on page 653.
For help with mapping external sensors on rack PDUs, see External Temperature and Humidity Sensor Mappings onpage 665.
For help with mapping traps, see Trap Support in Dynamic Plugins - Structured or Custom on page 677.
1. In the Settings tab, click Dynamic Plugins in the Appliance Administration section.2. Click Add, then click the type of device: CRAC, Floor PDU, Floor UPS, Power Panel, Rack PDU, Standalone Meter.
Do not select Custom when using a structured MIB to create the plugin. See Creating a Custom Mapping DynamicPlugin on page 714.
For environmental sensor aggregators, use Rack PDU.
Type cannot be changed once the dynamic plugin is created.
3. The new dynamic plugin page displays. Enter a name to identify this dynamic plugin, in the Name field. Use lower-case letters and underscores only.
4. Enter a description to identify this dynamic plugin in the Description field.5. Enter the manufacturer of the device you want to add using this dynamic plugin in the Manufacturer field.
6. The Model Name Filter field can be used to define a string value which will be used as a filter to determine whichPDU models will be managed by the plugin mapping. This is useful when the vendor’s MIB supports multiple mod-els and it is not possible to design a single plugin mapping capable of supporting them all. This is also useful whena standard plugin exists but one or more models have been encountered which are not managed by it in a sat-isfactory manner. Normally, model name comparisons must be an exact match for the plugin mapping to be selec-ted. However, a trailing asterisk character in the model name value is treated as a wildcard and may be used tohave the plugin mapping used with more than one model name. For example, a Model Name Filter value of “PX2-1000” will only match PDUs with a model name of PX2-1000. However, a Model Name Filter value of “PX2-*” willmatch on model names PX2-1000, PX2-2000, etc.
7. For Phase, select Automatic to allow Power IQ to determine the phase of the device by counting the number ofpoles on the inlets. Or, make a selection to hard-code the phase as Single Phase or Three Phase.
8. Check the Always Use SNMPv1 checkbox if the target device only supports SNMPv1. Leave the checkbox blank touse the default, SNMPv2/v3 communication.
9. In the Metadata section, enter the value used in the MIB to indicate each status or control value. Common MIBvalue pairs are Yes/No, On/Off, 1/2. See Metadata for Circuit Breakers and Outlets on page 671 for details.
l Circuit Breaker State OKl Circuit Breaker State Trippedl Outlet State Onl Outlet State Offl Outlet Power Onl Outlet Power Off

10. Enter values for the Environmental Sensors Metadata. These values work with external sensor mappings. See Metadata for Environmental Sensors on page 672 for details.
11. If needed, enter values for the UPS Output Source Metadata. These values work with the UPS Output Source map-ping. See Metadata for UPS Output Source on page 672 for details.
12. If needed, enter values for the Battery Status Metadata. These values work with the Battery Status mapping. See Metadata for Battery Status on page 674 for details.
13. If needed, enter values for the Battery Replacement Indicator Metadata. These values work with the BatteryReplacement Indicator mapping. See Metadata for Battery Replacement Indicator on page 675 for details.
14. Enter the PDU System OID and PDU Model OID for the devices that will use this dynamic plugin. See OID Vari-ables and Format on the facing page for details. Required. See Step 7 for the Model Filtering field, if you expect mul-tiple models to be returned.
15. To add features of the PDU, select an item from the "Add another mapping" drop-down list, then click Add. Theselinks contain the list of supported mappings for each device type.
l CRAC Mappings on page 654l Floor PDU Mappings on page 654l Floor UPS Mappings on page 656l Power Panel Mappings on page 658l Rack PDU Mappings on page 659l Rack UPS Mappings on page 661l Standalone Meter Mappings on page 664l Wildcard Index Mappings - Structured Dynamic Plugins Only on page 668
16. For each mapping you add, enter the OID. If the MIB does not have an OID for an Index item, enter an integer value,or a columnar OID whose rows will be SNMP walked during polling to determine the PDU element’s count. See Index Mapping Format on page 709 for details about mapping indices.
Some mappings require extra information, below the main mapping field.
17. Start and Step for Index mappings:a. Some MIBs number indices starting at a number other than 1, and in increments greater than 1. If your MIB
shows this, enter the starting number in the Start field, and the increment in the Step field.18. Proxied checkbox for Index mappings:
a. Select the Proxied checkbox when a columnar OID is entered.19. Multipliers for measurement mappings:
a. Power IQ expects power readings to be in the following units: Amps, Volts, Watts, VoltAmps, Degrees Fahren-heit/Celsius, and so on.
Many MIBs report power readings in different units than what Power IQ requires. The multiplier field is used to scalethe retrieved readings to the units required.
Example
If the MIB reports readings in KiloWatts a multiplier value of 1000 must be specified to scale KiloWatts to Watts. Avalue of 5KWreported by the SNMP agent is converted to 5000 Watts when the multiplier is applied.
705

706
20. To add mappings for traps sent by the PDU, select SNMP Version, v1 or v2c, then click Add Trap to display thefields. To add multiple traps, click Add Trap to display another set of fields.
21. For SNMP v1 traps, enter the Enterprise OID and the Enterprise Specific ID for the trap. For SNMP v2 traps, only theEnterprise OID for the trap is required.
22. Select the generic event this trap will map to: Generic Info, Generic Warning, Generic Critical.23. In the Event Summary, write the message that will appear in the event details. Use the trap's parameters as vari-
ables to create a complete, detailed summary of the event. See Trap Mapping Variables and Format on page 682for syntax. See Example: Event Summary Message with Variables on page 695 for a sample summary.
24. To filter the incoming traps, click Add Filter to display the fields. If a trap defined by the PDU's MIB can describe mul-tiple alarm conditions, and you would like to map an incoming trap to one of several Power IQ events based on aspecific alarm condition, then you must define event filters. The filters determine which Power IQ event an incom-ing trap should be mapped to.
a. Enter a name for the filter.b. Enter OID of the trap parameter that this filter applies to.c. Enter the value that the trap parameter must match. The trap parameter value must match exactly to be
considered a match.
See Example: Trap Mapping with Filters on page 693.
25. When you've finished with mappings, click Create Plugin.26. Add the PDU that uses the dynamic plugin. See How to Add PDUs to Power IQ on page 112and Check PDUs
Added with Dynamic Plugins on page 738.
OID Variables and Format
When creating a dynamic plugin mapping in Power IQ, there are a number of variable substitutions that are supported toassist with generating the desired set of Object Identifiers (OIDs) at poll time.
For example, consider the PDU System OID for a Raritan PX1 PDU which is 1.3.6.1.4.1.13742.
Virtually all OIDs from the Raritan PX1 MIB will have this identical prefix. Rather than specifying this prefix for all OIDs it ispossible to simply use the variable substitution { pdu_system_oid} in the OID definition when creating the mapping. Then,at poll time, the “{ pdu_system_oid} ” text will be replaced with the “1.3.6.1.4.1.13742” prefix to arrive at the complete OID.
The following variable substitutions are supported.
OID Variable Notes
PDU Sys-tem OID
{ pdu_system_oid}
PDU ProxyIndex
{ proxy_id}
CircuitBreakerIndex
{ circuit_breaker_index}
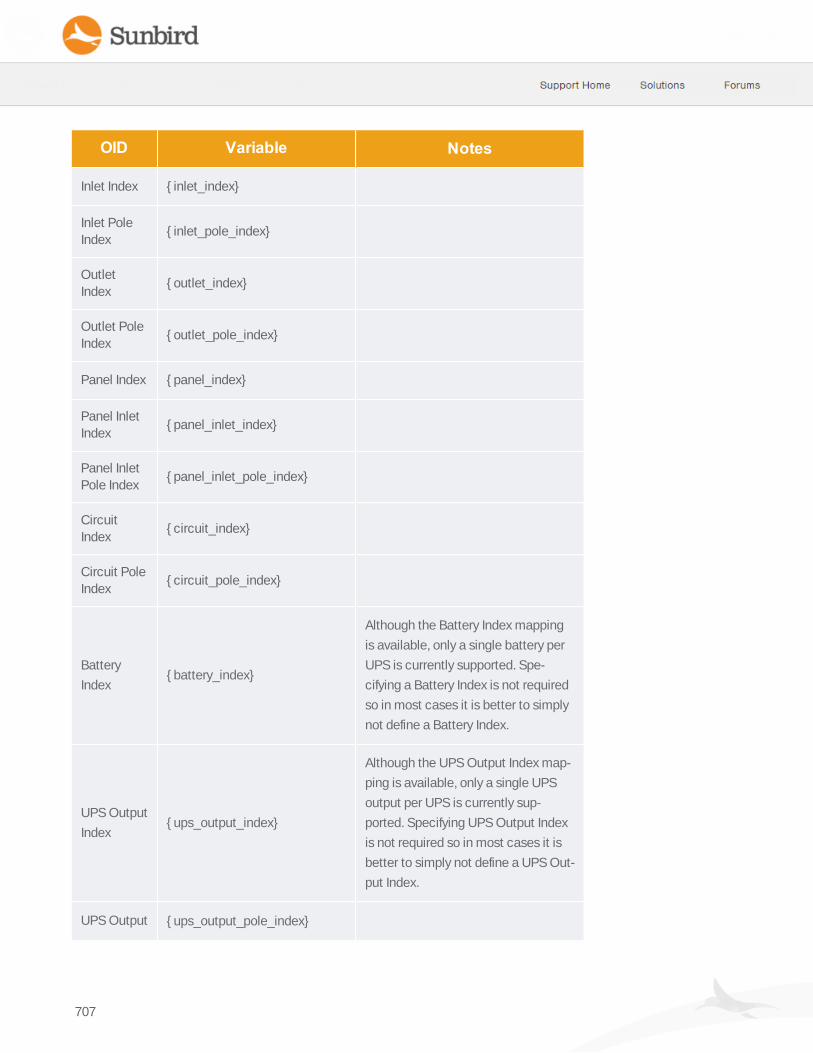
OID Variable Notes
Inlet Index { inlet_index}
Inlet PoleIndex
{ inlet_pole_index}
OutletIndex
{ outlet_index}
Outlet PoleIndex
{ outlet_pole_index}
Panel Index { panel_index}
Panel InletIndex
{ panel_inlet_index}
Panel InletPole Index
{ panel_inlet_pole_index}
CircuitIndex
{ circuit_index}
Circuit PoleIndex
{ circuit_pole_index}
Battery
Index{ battery_index}
Although the Battery Index mapping
is available, only a single battery per
UPS is currently supported. Spe-
cifying a Battery Index is not required
so in most cases it is better to simply
not define a Battery Index.
UPS Output
Index{ ups_output_index}
Although the UPS Output Index map-
ping is available, only a single UPS
output per UPS is currently sup-
ported. Specifying UPS Output Index
is not required so in most cases it is
better to simply not define a UPS Out-
put Index.
UPS Output { ups_output_pole_index}
707

708
OID Variable Notes
Pole Index
SensorIndexes
{ external_sensor_index}
{ external_sensor_temperature_index}
{ external_sensor_humidity_index}
WildcardIndexes
{ wildcard_one_index}
{ wildcard_two_index}
{ wildcard_three_index}
{ wildcard_four_index}
To use a variable in an OID, substitute the variable text for the numbers. You must use the curly brackets before and after,and the period after the final bracket. Follow the examples in the table.
OID with variable substitution Fully Expanded OIDs
{ pdu_system_oid} .1.1.13.0
PDU Name for a PX1:
1.3.6.1.4.1.13743.4.1.1.13.0
{ pdu_system_oid} .1.1.1.0
PDU Firmware for a PX1
1.3.6.1.4.1.13743.4.1.1.1.0
{ pdu_system_oid} .1.2.2.1.7.{ outlet_index}
Outlet Active Power OIDs for an 8-outlet PX1
1.3.6.1.4.1.13742.4.1.2.2.1.7.1
1.3.6.1.4.1.13742.4.1.2.2.1.7.2
1.3.6.1.4.1.13742.4.1.2.2.1.7.3
1.3.6.1.4.1.13742.4.1.2.2.1.7.4
1.3.6.1.4.1.13742.4.1.2.2.1.7.5
1.3.6.1.4.1.13742.4.1.2.2.1.7.6
1.3.6.1.4.1.13742.4.1.2.2.1.7.7
1.3.6.1.4.1.13742.4.1.2.2.1.7.8

Index Mapping Format
Structured dynamic plugins use index mappings to determine the number of PDU elements that a particular PDU has.PDU elements are inlets, inlet poles, circuit breakers, outlets, and so on.
There are 3 options for specifying index mapping values.
l SNMP OID: Specify an SNMP OID whose retrieved value indicates the PDU element's count.
l Proxied (Columnar OID): Specify a columnar OID and check the “proxied” option in the UI. At poll time, an SNMPwalk will be performed on the columnar OID to determine how many rows there are and that count will be used asthe PDU element’s count.
l Hard-coded Integer: Specify a hard-coded integer value to indicate the PDU element's count.
The advantage of the first two options is that a single dynamic plugin is capable of supporting a variety of different PDUmodels with different numbers of inlets, inlet poles, circuit breakers, outlets, and so on.
If the MIB supports a simple count object identifier, then the first option is the easiest and preferred.
Please note that it is possible to define an index mapping in terms of another defined index mapping via variable sub-stitution. For example, let’s assume that a PDU has multiple inlets and each inlet can have a different inlet pole count (i.e.,some single phase and some three phase). In this scenario, it is not possible to simply hard code a value or rely on a singleretrieved count value because each inlet can have a different number of poles.
Let’s say that the MIB defines a table that contains the number of inlet poles at each inlet with the inlet as the index to thetable. Similarly, inlet pole current and voltage are available in another table, which is indexed by inlet ordinal and inlet poleordinal. The mapping for this scenario could look like the following:
In some cases, the MIB may not define an OID whose value indicates the PDU element’s count. If the relevant PDU ele-ment information is contained within a table, it is possible to specify a columnar SNMP OID from the desired MIB table and
709

710
check the “proxied” option when you configure the plugin in Power IQ. During polling, Power IQ will perform an SNMP walkof all the rows of the specified table and use the count of the number of rows as the PDU element’s count.
If the MIB does not define OIDs that can be used to determine the count dynamically, you must provide a hard-codedinteger value. In this case, the dynamic plugin will likely only work for a specific model. You may also need to specify aModel name filter to ensure the dynamic plugin is only used with the appropriate model type.
Find a count object in the MIB that specifies the number of a particular component, such as outlets, that the target PDUhas. Specify the OID for the count as the value of the index.
When an OID is a scalar object, that is, not part of a table, add a ".0" to the end of the OID.
Example
The Raritan PXMIB supports an "outletCount" object with an OID of 1.3.6.1.4.1.13742.4.1.2.1.
Add a ".0" to the end of the OID to arrive at an OID of 1.3.6.1.4.1.13742.4.1.2.1.0.
Power IQ can then use this OID to perform an SNMP get request for the number of outlets on a specific PDU.
To map this value in the dynamic plugin, enter "1.3.6.1.4.1.13742.4.1.2.1.0" in the Outlet Index field.
Example
Staying with the previous example of the Raritan PXMIB, assume that the “outletCount” object was not available. Any ofthe columns from the private.enterprises.raritan.board.pdu.outlets.outletTable.outletEntry object can be used to determinethe number of rows in the table, and therefore the number of outlets on the PDU.
l The first accessible column in the “outletEntry” object is “outletLabel”, whose OID is 1.3.6.1.4.1.13742.4.1.2.2.1.2. l Power IQ can use this OID to perform an SNMP walk of all the entries in the outlet table and determine the number
of outlets on a specific PDU.l To map this value in the dynamic plugin, enter “1.3.6.1.4.1.13742.4.1.2.2.1.2" in the Outlet Index field, and check
the “Proxied” checkbox.
Example

The iReasoning MIB browser is useful when inspecting the objects in a MIB to determine what information is exposed andavailable for use in your dynamic plugin mapping.
For example, this screenshot shows the “outlets” portion of the Raritan PX1 MIB and a table view of the outletTable of an 8outlet PX1 PDU.
711

712
Custom Mapping Dynamic Plugins
Requirements:
l For custom mappings based on flat MIBs:l MIB file for the device you want to manage. See Find the MIB File on page 701.l Ability to correctly identify OIDs in a MIB file.
l For custom mappings based on SNMP-gateway managed devices:l A SNMP gateway device that converts Modbus/Bacnet to SNMPl A list of the registers for the PDU you want to manage. See Find the Modbus Register List on the next page.l Ability to correctly convert the registers to SNMP OIDs, using your SNMP-gateway device

Find the Modbus Register List
To add a Modbus device using a custom mapping dynamic plugin, you must have the register list for the device.
l Modbus register lists are usually available in one of the following locations.l The product's user guidel The product's website.l The product's technical support department.
713

714
Creating a Custom Mapping Dynamic Plugin
1. In the Settings tab, click Dynamic Plugins in the Appliance Administration section.2. Click Add, then click Custom. Do not select the type of device now.
The new dynamic plugin page displays.
3. Enter a name to identify this dynamic plugin, in the Name field.4. Lowercase letters and underscores only.
Tip for SNMP gateway use cases: When you have multiple devices using the same gateway, include proxy inform-ation in the name. This will help you identify the correct plugin when adding devices. See Proxy ID field.
5. Enter a description to identify this dynamic plugin in the Description field.6. Enter the manufacturer of the device you want to add using this dynamic plugin in the Manufacturer field.7. The Model Name Filter field can be used to define a string value which will be used as a filter to determine which
PDU models will be managed by the plugin mapping. This is useful when the vendor’s MIB supports multiple mod-els and it is not possible to design a single plugin mapping capable of supporting them all. This is also useful whena standard plugin exists but one or more models have been encountered which are not managed by it in a sat-isfactory manner. Normally, model name comparisons must be an exact match for the plugin mapping to be selec-ted. However, a trailing asterisk character in the model name value is treated as a wildcard and may be used tohave the plugin mapping used with more than one model name. For example, a Model Name Filter value of “PX2-1000” will only match PDUs with a model name of PX2-1000. However, a Model Name Filter value of “PX2-*” willmatch on model names PX2-1000, PX2-2000, etc.
8. Check the Always Use SNMPv1 checkbox if the target PDU only supports SNMPv1. Leave the checkbox blank touse the default, SNMPv2/v3 communication.
9. In the Metadata section, enter the value used in the MIB to indicate each status or control value. Common MIBvalue pairs are Yes/No, On/Off, 1/2. See Metadata for Circuit Breakers and Outlets on page 671 for details.
l Circuit Breaker State OKl Circuit Breaker State Trippedl Outlet State Onl Outlet State Offl Outlet Power Onl Outlet Power Off

10. Enter values for the Environmental Sensors Metadata. These values work with external sensor mappings. See Metadata for Environmental Sensors on page 672 for details.
11. If needed, enter values for the UPS Output Source Metadata. These values work with the UPS Output Source map-ping. See Metadata for UPS Output Source on page 672 for details.
12. If needed, enter values for the Battery Status Metadata. These values work with the Battery Status mapping. See Metadata for Battery Status on page 674 for details.
13. If needed, enter values for the Battery Replacement Indicator Metadata. These values work with the BatteryReplacement Indicator mapping. See Metadata for Battery Replacement Indicator on page 675 for details.
14. In the Mappings section, select the type of device: CRAC, Floor PDU, Floor UPS, Power Panel, Rack PDU, Stan-dalone Meter.
15. Type cannot be changed once the plugin is created.
16. Enter the device's name in the PDU Name field.17. Enter the System OID for the PDU.18. For SNMP gateway use cases, enter the gateway's System OID.19. The Proxy ID field is used to identify PDUs in daisy chained configurations, or managed by a serial device. In an
SNMP gateway use case, use this field to assign a proxy id to each PDU managed by the gateway. Best practice isto start with 1 for gateways, entering a unique proxy id for each PDU managed through the gateway.
715

716
20. Note: When you add the PDUs managed by the SNMP gateway to Power IQ, you will indicate the proxy index foreach one. This is how Power IQ differentiates the separate PDUs behind the same IP address.
21. Enter the PDU Model OID for the PDU that will use this dynamic plugin. Required. See Step 7 for the Model Filteringfield, if the MIB you are working with supports multiple models, and you want to limit this custom mapping to a spe-cific model. Hard code a value if the MIB does not provide a value.
22. Enter an OID for the firmware version in the PDU Firmware field.23. Enter or import Custom Mappings. See Sensor Mappings on the next page.
24. Enter Sensor Multipliers. See Sensor Multipliers on page 723.
25. To add mappings for traps sent by the PDU, select SNMP Version, v1 or v2c/v3, then click Add Trap to display thefields. To add multiple traps, click Add Trap to display another set of fields.
26. For SNMP v1 traps, enter the Enterprise OID and the Enterprise Specific ID for the trap. For SNMP v2/v3 traps, onlythe Enterprise OID for the trap is required.
27. Select the generic event this trap will map to: Generic Info, Generic Warning, Generic Critical.28. In the Event Summary, write the message that will appear in the event details. Use the trap's parameters as vari-
ables to create a complete, detailed summary of the event. See Trap Mapping Variables and Format on page 682for syntax. See Example: Event Summary Message with Variables on page 695 for a sample summary.
29. To filter the incoming traps, click Add Filter to display the fields. If a trap defined by the PDU's MIB can describe mul-tiple alarm conditions, and you would like to map an incoming trap to one of several Power IQ events based on aspecific alarm condition, then you must define event filters. The filters determine which Power IQ event an incom-ing trap should be mapped to.
30. Enter a name for the filter.31. Enter OID of the trap parameter that this filter applies to.32. Enter the value that the trap parameter must match. The trap parameter value must match exactly to be con-
sidered a match.
See Example: Trap Mapping with Filters on page 693.
See Example: Trap Mapping with Filters for Babel Buster SPXSNMP Gateway on page 697.

33. When you've finished with mappings, multipliers, and traps, click Create Plugin.34. Add the PDU that uses the dynamic plugin. See How to Add PDUs to Power IQ on page 11235. See Check PDUs Added with Dynamic Plugins on page 738.
Sensor Mappings
Sensor mappings are used in the custom dynamic plugin to identify each power sensor, or data point, you want Power IQto support for your PDU.
Sensor mappings can be entered manually, by entering and selecting values. Or, you can create a CSVfile with the inform-ation formatted correctly, and import the file.
To understand sensor mappings and view instructions for manual entry, see:
l Data Model Element on the facing pagel Sensor Type on page 720l Custom Dynamic Plugin Example Screenshots on page 727
To see instructions and an example of the CSVfile for importing mappings, see:
l Sensor Mapping CSVImport File Structure on page 722
To see rules that apply to mappings, see:
l Additional Custom Mapping Rules on page 725
Object Identifier
The object identifier is the SNMP OID for the sensor, such as an attribute or reading, you want to collect.
In some cases, when an OID is not available in the MIB, you can hard code a value.
Valid values:
l SNMP OID for the sensor
OR
l A hard-coded value for some sensor types. See Sensor Type on page 720.
Hard code a value when an OID is not available in the MIB. You can hard code circuit pole phase, circuit pole position on apanel, names, and any sensor type where a positive decimal number value would be returned. Hard coding for numeric val-
717

718
ues makes sense in some cases, such as voltage. Some other numeric values, such as active power, may be hard codedbut will not result in meaningful data.
Data Model Element
The data model element specifies where this sensor is associated in the model of the PDU.
Each device type support different data model elements. The data model elements have hierarchical parent-child rela-tionships. See Data Model Elements by PDU Type below.
You must identify the precise association of each sensor.
To identify the data model element:
1. In the list of data model elements, find the data model element you want to associate a sensor type with. See DataModel Elements by PDU Type below.
2. Append the number of the element to the end of each element's name. Leave one space between elements.
Examplepanel2 circuit10 circuitpole3
An amperage sensor for pole 3 on circuit 10 of a Floor PDU's second panel.
Data Model Elements by PDU Type
Data model elements have hierarchical parent-child relationships.
Rules for all PDU types:
l A panel may directly contain inlets and circuits or circuitpolesl An inlet must contain at least one inletpole. See Additional Custom Mapping Rules on page 725 for an example
mapping to follow when a device does not have inletpoles.l An outlet may contain outletpolesl A circuit may contain circuitpolesl A ups output may contain ups output_polesl CRAC
l inletl inlet inletpolel externalsensor
l FLOOR_PDUl inletl inlet inletpolel panell panel inletl panel inlet inletpolel panel circuitl panel circuit circuitpole

l panel circuitpolel circuitl circuit circuitpolel circuitpolel externalsensor
l FLOOR_UPSl inletl inlet inletpolel circuitl circuit circuitpolel batteryl ups_outputl ups_output_polel externalsensor
l POWER_PANELl inletl inlet inletpolel circuitl circuit circuitpolel circuitpolel externalsensor
l RACK_PDUl inletl inlet inletpolel circuitbreakerl outletl outlet outletpolel batteryl ups_outputl ups_output_polel externalsensor
l RACK_UPSl inletl inlet inletpolel circuitbreakerl outletl outlet outletpolel batteryl ups_outputl ups_output_polel externalsensor
l STANDALONE_METERl circuitl circuit circuitpolel externalsensor
719

720
Sensor Type
The sensor type identifies the type of reading expected from the sensor.
Valid val-ues
Valid for thesedata model ele-
mentsValid hard coded value in Object Identifier Field
active_powerinlet, inletpole, outlet,
circuit, circuitpolepositive decimal number
apparent_
powerinlet, outlet, circuit positive decimal number
currentinlet, outlet, circuit,
any pole, batterypositive decimal number
decimal_digits external sensor positive decimal number used to scale external sensor readings
name
outlet, circuit, cir-
cuitpole, cir-
cuitbreaker
name of the data model element
phase circuitpole
L1, L2, L3
A, B, C
X, Y, Z
1,2,3
See Set Phase Labels for Circuit Pole Phase on page 762.
position circuitpoleNumber greater than 0.
Specifies the circuit pole position on the panel.
power_control outlet Hard coding not supported for power control.
power_factor inlet, outlet, circuitpositive decimal number between 0 - 1.
Example: Power factor 98% is hard coded as .98. 100% is 1.0.
state outlet, circuit breakerHard coded value must match the configured metadata value.
See Metadata for Circuit Breakers and Outlets on page 671.

Valid val-ues
Valid for thesedata model ele-
mentsValid hard coded value in Object Identifier Field
type externalsensor
Example: T for Temperature, H for Humidity.
Hard coded value must match the configured metadata value for Humid-ity Sensor Type or Temperature Sensor Type.
See Metadata for Environmental Sensors on page 672.
unit externalsensor
Example: C for Celsius.
Hard coded value must match the configured metadata value for Tem-perature Unit (Celsius) or Temperature Unit (Fahrenheit).
See Metadata for Environmental Sensors on page 672.
value externalsensor decimal number
voltageinlet, outlet, circuit,any pole, battery
positive decimal number
watt_hourinlet, panelinlet, cir-cuit, outlet
positive decimal number
load_per-
centage
ups_output, ups_out-
put_pole
Percentage of UPS power capacity currently being used. Positive number
between 0 and 100 (inclusive).
source ups_output
Source of UPS output power. Hard coded value must match a configured
metadata value. See Metadata for UPS Output Source on page 672 for
details.
status batteryBattery health status. Hard coded value must match a configured
metadata value. See Metadata for Battery Status on page 674.
replacement battery
Indicates whether or not the battery needs to be replaced. Hard codedvalue must match a configured metadata value.
See Metadata for Battery Replacement Indicator on page 675 for details.
capacity_per-
centagebattery
Battery charge remaining expressed as percentage of full charge. Pos-
itive number between 0 and 100 (inclusive).
runtime_remain-
ingbattery
Time to battery depletion under present load conditions (in minutes). Pos-
itive number.
721

722
Valid val-ues
Valid for thesedata model ele-
mentsValid hard coded value in Object Identifier Field
seconds_on batteryElapsed time since the UPS last switched to battery power (in seconds).
Positive number.
Sensor Mapping CSVImport File Structure
To include sensor mappings for a custom dynamic plugin, you may import a CSVfile containing the information, instead ofentering and selecting the information manually.
These links include instructions and valid values for each column:
l Data Model Element on page 718l Sensor Type on page 720
To import the sensor mapping CSVfile:
1. In the custom plugin form, click Import in the Sensor Mappings section.2. Select the file and click Upload. If the file validates, the entries appear in the fields.3. The structure of the CSVfile:
l One line per sensor mappinigl No header rowl Each line has only the value columns, in the following order
Column 1:Object Identifier
Column 2:Data Model Element
Column 3:Sensor Type
Example

Sensor Multipliers
Power IQ expects power readings to be in the following units: Amps, Volts, Watts, VoltAmps, Degrees Fahrenheit/Celsius,and so on.
Many MIBs report power readings in different units than what Power IQ requires. The multiplier field is used to scale theretrieved readings to the units required.
1. In the custom dynamic plugin form, click Add to add a row to the Sensor Multipliers list.
The list has three fields for each entry.
2. Double-click the Data Element and Sensor Type fields to access a drop-down list of values.3. Double-click the Multiplier field to access a text field.
Data Element SensorType: Multiplier Value:
Select the data
model element this
multiplier is used
on.
Select the
sensor type this
multiplier is used
on.
Enter the decimal value the dynamic plugin will use to normalize the read-
ings into units supported by Power IQ.
723

724
Data Element SensorType: Multiplier Value:
circuit
circuit_pole_pos-
ition
circuit_pole_phase
circuit_breaker
circuit_breaker_
pole
inlet
inlet_pole
outlet
outlet_pole
external_sensor
external_sensor_
humidity
external_sensor_
temperature
panel_inlet
panel_inlet_pole
active_power
apparent_power
current
power_factor
voltage
watt_hour
value
For example: If an active power sensor OID returns a value of 5 kilowatts,
enter a multiplier of 1000 to normalize to 5000 watts.
ups_output ups_out-
put_pole
load_per-
centage
Percentage of UPS power capacity currently being used. Positive number
between 0 and 100 (inclusive). For example if sensor reports value of 0.50
(meaning 50%), specify multiplier of 100.
batterycurrent
voltageSpecify multiplier to normalize sensor reading to Amps or Volts.
batterycapacity_per-
centage
Battery charge remaining expressed as percentage of full charge. For
example if sensor reports value of 0.50 (meaning 50%), specify multiplier of
100.
batteryruntime_remain-
ing
Time to battery depletion under present load conditions (in minutes). For
example, if sensor reports remaining runtime in seconds, specify a mul-

Data Element SensorType: Multiplier Value:
tiplier of 0.0167 to normalize reading to minutes.
battery seconds_on
Elapsed time since the UPS last switched to battery power (in seconds).
For example, if sensor reports time on battery in minutes, specify a mul-
tiplier of 60 to normalize reading to seconds.
Additional Custom Mapping Rules
When creating your plugin, remember these additional rules to ensure your plugin validates, and that you get the best pos-sible data collection.
Make sure you correctly map the phase of your circuit poles to the phase of the building.
Add inlet poles in order (A, B, C).
In a group of like elements, for example, inlet_poles, each element must have the same type of sensors mapped, and mustindicate the same total number of the element.
Example
:If an inlet_pole has voltage mapped, than all inlet_poles for that plugin must have voltage mapped.
Example
If there are mappings for 3 voltage sensors for 'inlet_pole' then there must be exactly 3 current sensors configured, or 0
current sensors if current readings are not desired or available.
For a given sensor type and data model element, all mappings must be OIDs or hard-coded. A mix is not permitted.
PDU Proxy_Index substitution supports daisy-chained PDUs.
Every inlet must have at least one inlet pole. For devices that do not provide inlet pole level data, the inlet data for current,active_power, and voltage can be represented as an inlet pole instead.
Example
A device only provides inlet level data, but to meet the requirement for an inlet pole, the mappings should be modifiedas in this example:
l inletXinletpole1 voltagel inletXinletpole1 currentl inletXinletpole1 active_powerl inletXenergy
725

726
l inletXapparent_powerl inletXwatt_hour
Showing Accurate Circuit Pole Positions
To show accurate circuit pole positions, add the OIDs for each pole to the custom mapping in the correct order, or hardcode the circuit pole positions in the custom mapping.

Custom Dynamic Plugin Example Screenshots
This custom dynamic plugin example shows a Babel Buster SNMP gateway managing a Schneider PowerLogic PM710standalone meter.
727

Custom Dynamic Plugin Mapping Example - UPS
This custom dynamic plugin example shows the data model element, sensor type, and object mapping value syntax on asample UPS smart page.
The object mapping value refers to a value entered for the environmental metadata when the dynamic plugin is edited orcreated. For more information, see Metadata for Structured and Custom Dynamic Plugins on page 671.
Note: The data in this example is provided for educational purposes only and does not represent output from an actualUPS. For help with interpreting the mappings or creating your dynamic plugin, contact Sunbird Technical Support.
729

730

External Temperature and Humidity Sensor Mappings ExampleScreenshots
If temperature and humidity sensor information is available in a single table AND there is a way to uniquely determine thetype of the sensor:
If temperature and humidity information is available is a single table AND there is an OID that can be queried to determinethe type of the sensor, use the generic set of external_sensor_* mappings to collect sensor data.
Example
A PX1 192.168.45.236 has environmental sensor data available in a single table called 'externalSensors'. There is an
OID 'externalSensorType' that determines the type of each sensor. In this scenario, the generic set of external_sensor_*
mappings can collect the environmental sensor data.
For example, aMIBfor the PX1:
SensorMetadata and MappingsUsing the PX1 MIB:
731

732
If there is no OID to determine the sensor type, but there are separate OIDs for temperature and humidity sensor values:
l When the temperature and humidity sensor information is available in a single table AND there is no OID to determ-ine the sensor type, BUT there are separate OIDs for temperature and humidity sensor values, use the tem-perature_sensor_* and humidity_sensor_* mappings to collect sensor data.
Example
An APC 192.168.42.216-1 has one environmental probe that has both temperature and humidity sensors. The inform-
ation is available in a single table and there are separate OIDs for temperature and humidity readings. In this scenario,
the temperature_sensor_* and humidity_sensor_* mappings can collect the sensor data.
MIBfor the APC:

734
How Power IQAssociates Facility Items with a Structured or CustomPlugin
During the discovery process, facility items are automatically associated with the appropriate plugin. Power IQ will checkall available plugins. The appropriate plugin is selected from among the available plugins based on system ID (sysId),proxy ID, and/or model.
The tables below explain how Power IQ associates facility items with structured or custom plugins.
Structured Plugin Associations
Criteria Result
Plugin has the same sysID andmodel as the target device
Plugin is an exact match for the target device. With an exact match found, PowerIQ will associate the target device with the plugin and not check additional avail-able plugins.
Plugin has the same sysID as thetarget device but the model is notspecified
Plugin is a candidate to manage the target device, but Power IQ will continue tocheck additional plugins for an exact match.
Custom Plugin Associations
Criteria Result
Plugin has the same sysID, proxy ID, and model asthe target device
Plugin is an exact match for the target device. With an exactmatch found, Power IQ will associate the target device with theplugin and not check additional available plugins.
Plugin has the same sysID and model as the targetdevice but the plugin’s proxy ID is not specified andthe target device’s proxy ID is null
Plugin is an exact match for the target device. With an exactmatch found, Power IQ will associate the target device with theplugin and not check additional available plugins.
Plugin has the same sysID and model as the targetdevice but the plugin’s proxy ID is not specified andthe target device’s proxy ID is not null
Plugin is a candidate to manage the target device, but Power IQwill continue to check additional plugins for an exact match.
Plugin has the same sysID and proxy ID as the tar-get device but the model is not specified
Plugin is a candidate to manage the target device, but Power IQwill continue to check additional plugins for an exact match.
Plugin has the same sysID as the target device butthe model and proxy ID are not specified
Plugin is a candidate to manage the target device, but Power IQwill continue to check additional plugins for an exact match.

Adding PDUs with Custom Dynamic Plugins
When adding a PDU that uses a custom dynamic plugin, use the same Add a PDU feature as any other addition. See Howto Add PDUs to Power IQ on page 112.
When Power IQ detects that there is at least one custom dynamic plugin configured, a Plugin drop-down field displays.
735

Automatic: Use Automatic to allow Power IQ to determine the correct plugin for the PDU you are adding. Automaticattempts to find an exact match between the PDU and the plugin for SysObjectID, PDU Model name, and Proxy ID.
If there is no exact match, but several dynamic plugins are eligible to manage the PDU, based on sysObjectID, then PowerIQ selects from among the eligible plugins. If automatic mode does not select the desired dynamic plugin, delete the PDUand add it again, selecting the specific custom dynamic plugin from the list.
Alternatively, select the specific custom dynamic plugin from the list.
For more information, see How Power IQ Associates Facility Items with a Structured or Custom Plugin on page 734.
737

738
Check PDUs Added with Dynamic Plugins
After you add a PDU using a dynamic plugin, you should check the data collected to verify accuracy.
1. In the Facility Items tab, click the PDU link. The PDU details page opens.2. Examine the page to verify that all the data you created mappings for is available. If you do not see data you expec-
ted, check your mappings.3. Check power measurement values to make sure that multipliers were entered correctly.4. If you see issues, check all mappings and the log file to troubleshoot.5. In the Settings tab, click Dynamic Plugins in the Appliance Administration section.6. Click View Log.

Viewing PDUs Using a Dynamic Plugin
When a dynamic plugin is in use, you can view the PDUs that are associated with it.
1. In the Settings tab, click Dynamic Plugins in the Appliance Administration section.2. All dynamic plugins display in a list. In the PDU Count column, the number link shows how many PDUs use this
dynamic plugin. Click the link to view a list of the PDUs associated with the plugin.
739

740
Troubleshooting Dynamic Plugins
For each scenario, check the Dynamic Plugin Log file to help troubleshoot errors.
Add PDU fails with error "Unmanageable", or PDU connectivity is "Unmanageable":
The wrong PDU System OID, or the wrong PDU Model OID is specified in the dynamic plugin.
l Dynamic Plugin Log file excerpt sample when PDU System OID is wrong:
2011-05-12 13:44:40,394 INFO [DiscoverTask-192.168.100.100] PduDiscovery: sup-
portsSystemObjectId: target sysObjectId=1.3.6.1.4.1.13742.4 2011-05-12
13:44:40,450 INFO [DiscoverTask-192.168.100.100] PduDiscovery: sup-
portsSystemObjectId: no dynamic plugin capable of managing PDU w/ sysObjectID
1.3.6.1.4.1.13742.4
l Dynamic Plugin Log file excerpt sample when PDU Model OID is wrong:
2011-05-12 12:23:36,836 INFO [DefaultUDPTransportMapping_127.0.0.1/0] Snm-
pUtils: onResponse: got an exception varbind for oid
1.3.6.1.4.1.13742.4.1.1.120.0, 2011-05-12 12:23:36,836 WARN [DiscoverTask-
192.168.100.100] PduDiscovery: getModelName: failed to retrieve model name 2011-
05-12 12:23:36,837 INFO [DiscoverTask-192.168.100.100] PduDiscovery: discover:
Model Name not Found
l Information on PDU details page is wrong or missing:
If adding the PDU is successful, but information on the PDU details page is missing or wrong, an incorrect OID foroutlet active power may be specified in the dynamic plugin, for example.
l Dynamic Plugin Log file excerpt sample when Outlet Active Power is wrong:
2011-05-12 14:14:24,647 INFO [DefaultUDPTransportMapping_127.0.0.1/0] Snm-
pUtils: onResponse: got an exception varbind for oid
1.3.6.1.4.1.13742.4.1.2.2.1.56.1, 2011-05-12 14:14:24,647 INFO
[DefaultUDPTransportMapping_127.0.0.1/0] SnmpUtils: onResponse: got an exception
varbind for oid 1.3.6.1.4.1.13742.4.1.2.2.1.56.2, 2011-05-12 14:14:24,647 INFO
[DefaultUDPTransportMapping_127.0.0.1/0] SnmpUtils: onResponse: got an exception
varbind for oid 1.3.6.1.4.1.13742.4.1.2.2.1.56.3, 2011-05-12 14:14:24,647 INFO
[DefaultUDPTransportMapping_127.0.0.1/0] SnmpUtils: onResponse: got an exception
varbind for oid 1.3.6.1.4.1.13742.4.1.2.2.1.56.4, 2011-05-12 14:14:24,647 INFO
[DefaultUDPTransportMapping_127.0.0.1/0] SnmpUtils: onResponse: got an exception
varbind for oid 1.3.6.1.4.1.13742.4.1.2.2.1.56.5, 2011-05-12 14:14:24,647

INFO [DefaultUDPTransportMapping_127.0.0.1/0] SnmpUtils: onResponse: got an excep-
tion varbind for oid 1.3.6.1.4.1.13742.4.1.2.2.1.56.6, 2011-05-12 14:14:24,647
INFO [DefaultUDPTransportMapping_127.0.0.1/0] SnmpUtils: onResponse: got an excep-
tion varbind for oid 1.3.6.1.4.1.13742.4.1.2.2.1.56.7, 2011-05-12 14:14:24,648
INFO [DefaultUDPTransportMapping_127.0.0.1/0] SnmpUtils: onResponse: got an excep-
tion varbind for oid 1.3.6.1.4.1.13742.4.1.2.2.1.56.8, 2011-05-12 14:14:24,648
WARN [PollScheduler Scheduler-10 Pool-fiber09] SnmpOutletCollector: collect:
failed to retrieve data for mapping symbol 'outlet_active_power'
l Add PDU fails with error "Application Error" or PDU connectivity is "Application Error":
The dynamic plugin encountered an unexpected error that it cannot recover from while attempting to add the PDUto Power IQ. The PDU health shows as Critical in this case, if the PDU is added.
When the PDU state is "Application Error", this may indicate that one or more index mappings is failing to resolve.Check the dynamic plugin log output for mapping resolution errors.
741

742
When to Delete and Rediscover a PDU Using a Dynamic Plugin
Certain changes, either to a PDU, or to a plugin, may require you to delete and rediscover the PDU.
l Change mapping and PDU enters "Application Error" state.l Change mapping and the new mapping is not reflected in the PDU's details or smart page. For example, changes
to multiplier, sensor unit, number of circuit poles.

Troubleshooting Dynamic Plugin Trap Mapping
Problem: An incoming trap is mapped to the wrong event in Power IQ:
When mapping an incoming SNMP trap to a dynamic plugin trap mapping, Power IQ always takes the FIRST possiblematch. The dynamic plugin UI will attempt to alert a plugin author of duplicate trap mappings but it is possible for theauthor to configure multiple trap mappings that match a particular trap. This may occur when OID wildcards (*) are used.
To resolve, verify that the trap mappings are unique with the plugin.
Problem: In a custom dynamic plugin with proxied PDUs, such as in a Babel Buster gateway scenario, an incoming trap isassociated to the wrong PDU:
The incoming trap will have the IP address of the proxy and Power IQ must determine which of the proxied PDUs the trapis actually for. Power IQ iterates through each of the custom plugin's trap mappings used to manage the proxied PDUsand will take the FIRST possible match.
To resolve, verify that the configured trap mappings are unique across each of the proxy's custom plugins.
Problem: The event summary text for a particular event on the event listing or event details is not available:
Check the dynamic plugin to determine if the relevant trap mapping has been modified or deleted. Either scenario will pre-vent Power IQ from generating the desired event summary text when requested.
743

744
SNMPGateways and Custom Dynamic Plugins
The custom dynamic plugin works with SNMP-gateway devices to convert other protocols, such as Modbus or Bacnet, toSNMP. The SNMP gateway allows you to get the information you need to monitor an inteligent power device that does nothave an SNMP agent. Examples of SNMP gateways include Control Solutions Babel Buster SPXand FieldServer DCC1075gateways.
Example
Modbus can communicate data about your PDU. Each piece of data has a 16-bit integer register, and each register hasan address. A Modbus register address is similar to an SNMP OID. Each uniquely identifies a data point.
A SNMP-gateway works with Modbus devices in a serial primary-extension setup. The gateway device polls the exten-sion devices, reads the register data back, and stores it into the gateway device. The gateway makes the register dataavailable as SNMP OIDs.

Configuring the SNMPGateway
Configuring your SNMP gateway device to prepare for creating a custom dynamic plugin should include:
l Getting the Modbus register list for the PDU you want to monitor from the PDU manufacturer.l Configuring the gateway with the necessary registers to allow for data collection. This may include mappings for
line to line voltages, active power, apparent power, power factor, pole current, and other types supported by PowerIQ.
l Using your gateway to convert the registers to SNMP OIDs.l Understanding the units that each data point is reported in. The register list will specify the scaling factor for each
value. For example, watts or kilowatts, degrees or degrees multiplied by 100.
745

746
Importing and Exporting Plugin Files
Once you have created a dynamic plugin, you can export it to a .JSON file. Use the file to share the plugin with anotherPower IQ installation by importing it there. Or, use the file as a template to edit to create other dynamic plugins, and re-import.
1. In the Settings tab, click Dynamic Plugins in the Appliance Administration section.2. The list of dynamic plugins displays. Click Download on the plugin you want to export.3. Open or save the file.
Only .JSON files can be imported.
4. In the Settings tab, click Dynamic Plugins in the Appliance Administration section.5. Click Import, then click Browse and select the .JSON file. Click Import.
When the file imports, it displays in the list.
Supported Vendors
The table below summarizes the list of vendors whose products are currently supported in Power IQ by standard and/ordynamic plugin.
For a full list of supported models or to download plugins for Power IQ, visit addons.sunbirddcim.com.
For a list of supported events, see Supported Events on page 191.
Vendor NameSupported viaStandard Plugin
Supported viaDynamic Plugin
APC X X
Aphel X
Avocent X
Baytech X X
Chatsworth Products, Inc. X X
Cisco Energywise X
Climanveneta X
Cmatic X

Vendor NameSupported viaStandard Plugin
Supported viaDynamic Plugin
Control Solutions, Inc. X
Cyberex X
CyberSwitching X
Cyclades X
Eaton X X
Emerson X
FieldServer X
Geist X X
Gude X
HP X X
HW Group X
IBM X
Janitza X
Knurr X
Legrand X
Liebert X X
Masterguard X
Measurelogic X
Mitsubishi Electric X
MRV X
Netbotz X
747

748
Vendor NameSupported viaStandard Plugin
Supported viaDynamic Plugin
Northern Design X
NTI X X
Obvius X
Oracle X
Panduit X X
PDI X
Raritan X X
Riello X
Rittal X X
RLE X
RT Systems X
Schleifenbauer X X
Schneider Electric X X
Server Tech X X
Sinetica X
Socomec X
SquareD X
Starline X
Stulz X
Toshiba X
Tripp Lite X

Vendor NameSupported viaStandard Plugin
Supported viaDynamic Plugin
Unite Technologies X
United Power X
Universal Electric X X
USV-Masterguard X
Vertiv X
749

Chapter 21:Maintenance Tasks
Downloading Daily Sensor Readings
Storage of daily raw readings in CSVfiles can be enabled or disabled. When enabled, depending on your configuration,Power IQ can store up to 8 days of CSVfiles. See Configuring RawSensorReadingsStorage.
The daily sensor readings CSVfile includes the state of the circuit breakers for applicable Raritan PXPDUs. The circuitbreaker state is recorded to this file only once every polling interval, even if you enable buffered data retrieval underPolling Options.
Sensor readings include internal sensors and temperature, humidity, airflow, air pressure, and contact closure sensors.
See Configuring Remote Storage ofArchive Files for details on automatic remote storage of sensor reading archives.
1. In the Facility Items tab, choose Activities > Download PDU Sensor Readings. The Sensor Readings Archives pageopens.
2. The option is hidden when storage for sensor readings files is disabled. See Configuring Raw Sensor Readings Stor-age .
3. Click a filename link to download an archive of the sensor readings taken on that day. Filenames include the dateand time when the file was created. There may be more than one file per day, because Power IQ creates the filewhen a reasonable maximum file size is reached, before the file is too large to be usable in Excel. Or, click Down-load Latest Readings to download the current sensor readings CSVfile.
Tip: Use the time stamp of the file to find the beginning of a time period you are looking for, and the time stamp on
the next file for the end of this period. Note that with data logging or network outages, readings taken outside the
time stamp range may be in the file.
Note: To delete an archived file, select the checkbox next to the filename, then click Remove.
You can set up an external program to download the latest sensor readings file each day.
Example using wget:
wget-1.10.2.exe -t 3 --http-user=[username] --http-passwd=[password] --no-check-
certificate https://[hostname]/sensor_readings_csvs/latest
Example using curl:
750

curl --user [username]:[password] https://[hostname]/sensor_readings_csv/latest >
latest-csv-archive.zip
751

752
Downloading Daily Sensor Readings
Storage of daily raw readings in CSVfiles can be enabled or disabled. When enabled, depending on your configuration,Power IQ can store up to 8 days of CSVfiles. See Configure Raw Sensor Readings Storage.
The daily sensor readings CSVfile includes the state of the circuit breakers for applicable Raritan PXPDUs. The circuitbreaker state is recorded to this file only once every polling interval, even if you enable buffered data retrieval under PollingOptions.
Sensor readings include internal sensors and temperature, humidity, airflow, air pressure, and contact closure sensors.
See Configuring Remote Storage ofArchive Files for details on automatic remote storage of sensor reading archives.
1. In the Facility Items tab, choose Activities > Download PDU Sensor Readings. The Sensor Readings Archives pageopens.
2. The option is hidden when storage for sensor readings files is disabled. See Configure RawSensorReadingsStor-age .
3. Click a filename link to download an archive of the sensor readings taken on that day. Filenames include the dateand time when the file was created. There may be more than one file per day, because Power IQ creates the filewhen a reasonable maximum file size is reached, before the file is too large to be usable in Excel. Or, click Down-load Latest Readings to download the current sensor readings CSVfile.
Tip: Use the time stamp of the file to find the beginning of a time period you are looking for, and the time stamp on
the next file for the end of this period. Note that with data logging or network outages, readings taken outside the
time stamp range may be in the file.
Note: To delete an archived file, select the checkbox next to the filename, then click Remove.
You can set up an external program to download the latest sensor readings file each day.
Example using wget:
wget-1.10.2.exe -t 3 --http-user=[username] --http-passwd=[password] --no-check-
certificate https://[hostname]/sensor_readings_csvs/latest
Example using curl:
curl --user [username]:[password] https://[hostname]/sensor_readings_csv/latest >
latest-csv-archive.zip

Upgrading Power IQ Firmware
When new firmware is released, you can upgrade Power IQ to receive the latest in features and functionality.
See the Release Notes for any special instructions on upgrading.
Note: Back Up Your System Before You Upgrade! Before you upgrade to a new Power IQ release, we stronglyrecommend that you generate a backup of your Power IQ system configuration and save it to another location, such asyour hard drive or an external server. We also strongly recommend that you set up remote storage for backup files to auto-matically push all daily backups to a remote storage location.
1. In the Settings tab, click Software Upgrades in the Appliance Administration section. The Upgrade page opens.2. Click Browse, select the firmware file (usually a *.bin file).3. Click Upload. The new firmware uploads to the application.
753

754
Shutting Down and Restarting Power IQ
You can shut down and power off or restart Power IQ.
l In the Settings tab, click System Shutdown in the Appliance Services section.
The Power IQ shuts down and powers off.
l In the Settings tab, click System Restart in the Appliance Services section.
The Power IQ restarts.

Accessing Audit Logs
Power IQ Web Client audit logs can be viewed in a browser, or exported to a file for viewing or storage.
Warning: Audit logs are automatically deleted from the system after 3 calendar months. If you need tomaintain a complete audit trail, export logs regularly and store the files outside Power IQ.
1. In the Settings tab, click Audit Log in the Application Administration section.
l The Audit Log Entries page opens.
2. In the Settings tab, click Audit Log in the Application Administration section.3. Click the Download Audit Logs link. All audit log entries are exported to a text file.4. Save the file.
755

Chapter 22:Appliance Administration
Allow HTML Widgets on Dashboard
The Dashboards tab can include your custom HTML portlets as a widget. HTML portlets may have security implications.You must allow them before you can add an HTML widget to the Dashboards tab.
1. In the Settings tab, click Application Settings in the Appliance Settings section.2. In the Display Settings section, select the "Allow user-created HTML portlets on the dashboard" checkbox.3. Click Save.
756

Allow HTML Widgets on Dashboard
The Dashboards tab can include your custom HTML portlets as a widget. HTML portlets may have security implications.You must allow them before you can add an HTML widget to the Dashboards tab.
1. In the Settings tab, click Application Settings in the Appliance Settings section.2. In the Display Settings section, select the "Allow user-created HTML portlets on the dashboard" checkbox.3. Click Save.
757

758
Display a Logo on Every Page
Upload your company logo to display it on every page in Power IQ. This is useful for branding a dashboard presentation.
Logos must not exceed 150 pixels wide, 48 pixels high, or 512KB in size.
For details on adding a logo to the dashboard, see Image Widget .
1. In the Settings tab, click Application Settings in the Appliance Administration sections.2. In the Display Settings box, select the "Show a custom uploaded logo" checkbox.3. Click Browse to select the logo file, then click Open.4. If the file does not meet the logo criteria, error messages display. Edit the image as needed, then upload again.5. Click Save Display Settings. The logo appears in the top right corner of every page in Power IQ.

Configuring the System Clock
Power IQ uses the system clock to time-stamp events and data records. Set the system clock as soon as possible to keepan accurate record of events.
Using an NTP server is recommended to keep the system clock synchronized between Power IQ and the PDUs it man-ages.
Important! You must use the same NTP server for Power IQ and all Raritan PX PDUs managed to getaccurate readings from PX.
Note: If your Power IQ is integrated with dcTrack, it is important that both dcTrack and Power IQ are setup to use NTPwith the same NTP servers.
759

760
Configuring NTPServer Settings
The Configure Time Servers table lists the NTP servers Power IQ contacts to get date and time information. NTP must beenabled first.
1. In the Settings tab, click Application Settings in the Appliance Administration section.2. In the Time Settings box, click the arrow to expand the NTP Settings3. Select the Enable NTP checkbox.4. Click Add.5. Type the time server's IP address in the Time Server field then click OK.6. Click Save Time Settings.
To edit NTP server settings:
1. Select the server in the table and click Edit.2. Type the time server's IP address in the Time Server field3. Click Save Changes.
To remove an NTP server:
1. Select the server in the table.2. Click Remove.3. Click Yes in the confirmation message.

Configuring the System Clock Manually
1. In the Settings tab, click Application Settings in the Appliance Administration section.2. In the Time Settings section, select the Time Zone Power IQ server resides in from the Time Zone drop-down list.3. Select the date and time using the tools in the "Set time manually" fields. Select the date from the pop-up cal-
endar. Select the 24-hour time from the drop-down list.4. Click Save Time Settings.
761

762
Set Phase Labels for Circuit Pole Phase
Specify how circuit pole phases are labeled in Power IQ.
1. In the Settings tab, click Application Settings in the Appliance Administration section.2. In the Language and Locale Settings, select your Phase Label preference.
l A, B, Cl L1, L2, L3l X, Y, Zl 1, 2, 3
3. Click Save Locale Settings.

Set Fahrenheit or Celsius Temperature
Specify your system temperature unit to Fahrenheit or Celsius. This setting is used wherever temperatures are shown inPower IQ.
1. Temperature settings are global in Power IQ.2. In the Settings tab, click Application Settings in the Appliance Administration section.3. In the Language and Locale Settings, set Temperature Unit to Celsius or Fahrenheit.4. Click Save Locale Settings.
How to Secure a Sunbird Appliance
Change the ‘config’ user’spassword via the consoleA Sunbird appliance ships with a root user account that has a preconfigured password. By default, thisaccount is disabled such that no one can log in, even if they know the password. When the user providesaccess, this account is used by Sunbird’s support team to troubleshoot issues.
The ‘config’ user is the only user that can unlock this account. This password for the ‘config’ user is con-figurable through the console.
The "config" user account is an OS account, not a UI account.
The "config" user account password constraints cannot be changed from the PIQ UI Setting tab.
The constrant level is set to HIGH because of the DOD work and has the following constrants.
The new password must have one each of an upper case, lower case, numeric, and non-alphanumeric char-acter.
Minimum password length is 9 characters.
The ‘config’ user can also reset the password for the administrative account on A Sunbird appliance’s webapplication.
CAUTION: Do not lose the password for the ‘config’ user. If the root account is locked and you lose this pass-word, there is nothing Sunbird can do to help you recover from an error other than performing a clean installand restoring from a backup.
Consider using IP AccessControlThrough IP Access Control (settable in the console or via the Settings tab on the web interface), you can dis-able SSH access, ODBC access, and whether the appliance will respond ICMP pings. Alternately, you canlimit access to certain IP address ranges
763

764
Change the password for the administrative account on the applianceBy default, the username for the administrative user account is ‘admin’. This username can also bechanged.
Change the ‘odbcuser’ passwordIf you enable ODBC access to the appliance, be sure to change the password for the odbcuser account.Also consider limiting access to known good IP addresses. By default, ODBC access is disabled.
Monitor the Audit LogAll SSH and UI access attempts are logged to the audit log. Monitoring this can help you identify unau-thorized access attempts
Use an external System Log serverA Sunbird appliance can be configured to send audit log messages to an external system log server. Send-ing these to an external system helps to maintain an audit log and allows for searching\alerting on certainevents.
Install a valid HTTPS CertificateA Sunbird appliance ships with a default unsigned certificate. Installing a certificate that’s signed by a trus-ted certificate authority will allow clients to establish trust in the server.
Use encrypted backupsand leverage the appliance’sautomated remote backupfeatureA Sunbird appliance allows you to create encrypted backup and provides a feature to automatically pushthe daily backups to a separate system. Refer to the user’s guide on how to set these features up.
Keep the appliance up to dateSunbird provides regular maintenance and feature releases that include security updates. We frequentlyupdate the OS, database, and other components to keep the appliance secure.
Note: Sunbird performs penetration testing at the application and network level on every release.
Report security issues to Sunbird supportSunbird takes security seriously. Please report any security issues to our support team such that we canaddress them.

Chapter 23:Upgrading Raritan PX,Power Meter, and EMX
Upgrading Raritan PXPDUs, Raritan Power Meter's PMC module, or Raritan EMXdevices managed by Power IQ consistsof three steps.
1. Uploading firmware to Power IQ2. Creating an upgrade plan to distribute the firmware to the units.3. Executing the plan.
You can use the plans immediately or save them for later.
Warning: Never downgrade a PX to a lower version number. Downgrading causes damage to the PDU.
766

Plan a New Upgrade
Bulk upgrade plans are only applicable to Raritan PXPDUs, Raritan Power Meter's PMC module, and Raritan EMXunits.
When adding any PDU in a port forwarding configuration, it is NOT required to add all PDUs in the chain to the upgradeplan.
If the plan includes all PDUs in a port forwarding configuration, Power IQ automatically orders them so that the extensionPDU is upgraded first and then the primary PDU. This prevents the extension PDU from losing communications with PowerIQ when the primary PDU resets during the upgrade process.
It is recommended to put all PDUs into maintenance mode to prevent lost connectivity during the upgrade. See Main-tenance Mode.
Note: If an extension PDU is polled when the primary PDU resets, the extension PDU shows the communication loststate. Restart the poller in Settings > Appliance Administration > Restart Poller.
Appropriate firmware versions for supporting the port forwarding configuration are available in the USBCascading SolutionGuide, which can be downloaded from the PX2 web page (http://www.raritan.com/support/product/px2/) of the Raritanwebsite
1. In the Facility Items tab, choose Activities > Bulk Firmware Updates.2. Select Manage Firmware Upgrade Plans.3. Click the Next button.4. Choose Plan a new upgrade. The upgrade planning wizard starts.5. Enter a name for the plan and click Continue.6. A summary of plan options appears at the top of the page. Continue adding details of your upgrade plan at the bot-
tom of the page, or click the links in the summary list to add details.7. In the Choose Firmware Version section, you can add a new firmware file or select a previously uploaded firmware
file. Firmware files are .BIN files. If the file is zipped, unzip and upload the .BIN file.l To add a new file, click the Upload a New File tab, then click Browse to select the file. Enter comments.
Click Upload. The file is automatically selected for the plan.l To select a previously uploaded file, click the Available Files tab, then select a file from the list, and click
Continue.8. All PXPDUs available for the upgrade appear in a list. Select the checkboxes for the PDUs you want to upgrade,
then click Selected PDUs to add them to the "PDUs selected to this upgrade" list at the bottom of the page. Or,click All PDUs to add all available PXPDUs to the list.
9. To remove PDUs from the plan, click Selected PDUs or All PDUs in the bottom list. Only PDUs in the bottom list willbe upgraded.
10. Click Continue. Click the Plan Options link in the summary at top.11. On the Plan Options page, edit the plan name, if needed, and set other preferences.12. Select the "Abort on failure" checkbox if you want Power IQ to cancel all remaining upgrades in the plan if an
upgrade failure occurs. This could help prevent an upgrade problem from affecting other PDUs in the plan.13. Select the "Allow simultaneous rollouts" checkbox if you want Power IQ to upgrade the firmware of multiple Raritan
PXPDUs at once. This makes batch upgrades faster by allowing up to 25 upgrades to run at the same time.14. Click Continue. Review the summary of the plan. Click Add Comment if you want add notes to the plan. Click Add
or Remove PDUs if you want to edit the list of PDUs to upgrade.15. Click Save. The completed plan summary page opens.
767

768
16. Click Start Upgrade to execute the plan immediately. The upgrade starts, and the status page displays. You canalso execute the saved plan later. See Execute a Saved Upgrade Plan.
See View Status of Upgrade Plans in Progress for details on checking upgrades in progress.
See View Completed Upgrade Plans for details on checking completed upgrades.

Viewing Saved Upgrade Plans
View saved upgrade plans to verify and edit their details before executing a plan.
1. In the Facility Items tab, choose Activities > Bulk Firmware Updates.2. Select Manage Firmware Upgrade Plans.3. Click the Next button.4. Choose Activities > View status of current upgrades.5. Click the Plan name link to view the details and edit if needed.
769

770
Editing a Saved Upgrade Plan
Saved upgrade plans can be edited to change details, add or remove PDUs, or change the firmware version.
You can only edit upgrade plans that you created.
1. In the Facility Items tab, choose Activities > Bulk Firmware Updates.2. Select Manage Firmware Upgrade Plans.3. Click the Next button.4. Choose Activities > View status of current upgrades.5. Click the Plan name's link to view the details.6. Click the blue links in the plan summary to edit the plan. Or, scroll down to click Edit and use the wizard to edit.
See Plan a New Upgrade for details of plan settings.

Execute a Saved Upgrade Plan
Once a plan is saved, execute it to start the upgrade process.
If the plan includes all facility items in a port forwarding configuration, Power IQ automatically orders them so that theextension facility item is upgraded first and then the primary facility item. This prevents the extension facility item from los-ing communications with Power IQ when the primary facility item resets during the upgrade process.
It is recommended to put all facility items into maintenance mode to prevent lost connectivity during the upgrade. SeeMaintenance Mode.
Note: If an extension facility item is polled when the primary facility item resets, the extension facility item shows the com-munication lost state. Restart the poller in Settings > Appliance Administration > Restart Poller.
1. In the Facility Items tab, choose Activities > Bulk Firmware Updates.2. Select Manage Firmware Upgrade Plans.3. Click the Next button.4. Choose Activities > View status of current upgrades.5. Click the plan that you want to execute.6. Click Start Upgrade to execute the plan.
See Viewing Status of Upgrade Plans in Progress for details on checking upgrades in progress.
See Viewing Completed Upgrade Plans for details on checking completed upgrades.
771

772
Upgrade Timing
Each PXPDU upgrade takes approximately 5-10 minutes.
If you select "Allow simultaneous rollouts" in the plan options, 25 upgrades will begin simultaneously, and each batch of 25will take approximately 10 minutes.

Viewing Status of Upgrade Plans in Progress
l Upgrade plans in progress have three possible statuses.l Init: Rebooting the PDUl Login: Logging in to the PDUl Verify: Verifying the new firmware version on the PDU
The status page for plans in progress displays when you execute the plan. You can return to the status page at any time,even after the plan has finished.
1. In the Facility Items tab, choose Activities > Bulk Firmware Updates.2. Select Manage Firmware Upgrade Plans.3. Click the Next button.4. Choose Activities > View status of current upgrades.
773

774
View Completed Upgrade Plans
When a plan has been executed, you can view details of the plan status and results of each PDU included in the plan.
1. In the Facility Items tab, choose Activities > Bulk Firmware Updates.2. Select Manage Firmware Upgrade Plans.3. Click the Next button.4. Click the Plan name link to view the details.
If the plan completed successfully, a success message displays at the top of the plan details.
The list of PDUs included in the plan includes a Success or Failure message.
5. Click the "View detailed upgrade status messages" link for more information about each PDU.

Managing Firmware Versions
You can upload different versions of firmware for use in upgrade plans, and view previously uploaded firmware.
Firmware files are .BIN files. You can download firmware versions from the Raritan website, in the Support section. If the fileis zipped, unzip and use only the .BIN file.
1. In the Facility Items tab, choose Activities > Bulk Firmware Updates.2. Select Manage Firmware Upgrade Plans.3. Click the Next button.4. Choose Activities > Manage Firmware Versions. This link is not available if you do not have any uploaded firmware
files. The Manage Firmware Versions page opens.
All firmware versions previously uploaded appear in a list.
To delete a firmware version:
1. Select the checkbox for the firmware version you want to delete, then click Delete.2. Scroll down to the Upload New Firmware File section.3. Click Browse to select the .BIN file.4. Enter comments in the Comment box.5. Click Upload. The file is added to the list and will be available to select when creating a new upgrade plan. See
Plan a New Upgrade.
775

Chapter 23:Managing Removed orOut of Service Items
Once an item is physically removed, replaced, or being maintained, you can mark it as removed or out of service, ratherthan deleting it from Power IQ, so that its historic data remains available in Power IQ.
The facility items that can be marked as removed or out of service are facility items, IT devices, and sensors.
Power IQ provides two states for marking a facility item that is not in service: Maintenance and Decommissioned. Formore information, see Maintenance Mode on page 778 and Decommission a Facility Item on page 788 respectively.
For IT devices and sensors, only the decommissioning option is available. They do not have the maintenance mode statein Power IQ.
776

Available Setting Options
Power IQ provides two options for marking a facility item that is not in service: Maintenance Mode and Decommissioned. Ifboth options are enabled for a facility item, that item is considered decommissioned.
You can set any facility item in the USB-cascading configuration to the maintenance mode or decommission it.
For devices and sensors, only the decommissioning option is available. They do not have the maintenance mode option inPower IQ.
Note: You can only decommission a sensor by decommissioning the PDU or removing the sensor from the PDU via themanufacturer's process. For more information, see Decommission a Sensor on page 796.
777

778
Maintenance Mode
Maintenance mode applies to facility items only. Use this mode when a facility item is out of service due to upgrades, con-figuration updates, or other maintenance tasks.
A facility item in maintenance mode is not polled, its traps are not acknowledged, and its events are stopped. This mode ishelpful for preventing a facility item from generating events, such as connectivity loss events, in Power IQ.
You still can upgrade the facility item's firmware and change the configuration while in maintenance mode. Historic datafor facility items in maintenance mode is included in tabular reports.
Maintenance mode will override any other state, except the decommissioned state.

Setting Facility Items to Maintenance Mode
Before performing any maintenance task, such as firmware upgrade, set the facility item to maintenance mode.
You can set individual or multiple facility items to maintenance mode on the Facility Items list, or you can set an individualfacility item to maintenance mode by editing its details from the facility item smart page.
To set individual or multiple facility items to maintenance mode on the Facility Items list:
1. In the Facility Items tab > Facility Items list, select the facility items you would like to put in maintenance mode.Click the Maintenance link.
2. On the confirmation popup, click the Enter maintenance mode for facility item(s) button.
779

780
3. Maintenance mode will be enabled. Click the Dismiss button if you want to dismiss the status popup.

4. When maintenance mode is enabled, click the OK button.
5. The Health column for the selected facility items will display Maintenance as the state.
Alternatively, enable maintenance mode for an individual facility item on the facility item’s smart page.
1. Click a facility item link to open the facility item smart page.2. Choose Actions > Edit.3. On the Change Credentials panel, select the Maintenance Mode checkbox.4. Click Save.
781

782
Note: If you also select the Decommissioned checkbox, the facility item is considered decommissioned instead of
being in the maintenance mode. See Decommissioning a Facility Item
The Details section of the facility item smart page will show the following:
l Maintenance Mode field displaying a value set to truel Health field Connectivity displaying an In Maintenance Mode statel Health field Active events displaying a Maintenance state

Identify Facility Items in Maintenance Mode
To identify facility items in maintenance mode, you can either view the health of the facility items in the Facility Items list(for individual or multiple facility items) or view the Maintenance Mode and Health fields in the Details section of the facilityitem smart page (for individual facility items).
From the Facility Items list, look for the Maintenance state in the Health column to determine if the item is in maintenancemode.
Filtering the Facility Items List by Maintenance Health State
To filter the Facility Items list by the Maintenance Health state:
1. In the Facility Items list, click the Health column to display the Filter options.2. Select "Maintenance".
783

784
3. The Facility Items list will display only those items with a Health state of Maintenance.

Viewing Facility Items in Maintenance from the PDU Health Chart
Additionally, clicking on the gray Maintenance bar in a PDU Health bar chart will display all items with a Health state ofMaintenance in the Facility Items list.
Viewing Maintenance Mode on the Facility Item Smart Page
The Details section of an individual facility item smart page also indicates maintenance mode.
1. Click an item to open the facility item smart page.2. In the Details section of the facility item smart page, look for the following:
a. Maintenance Mode field displaying a value set to true.b. Health field Connectivity displaying an In Maintenance Mode state.c. Health field Active events displaying a Maintenance state.
785

Decommissioning in Power IQ
You can decommission facility items, IT devices, and sensors. Decommission a facility item when you physically remove,replace, or hot swap it with another one.
Decommissioned Facility Items
After a facility item is decommissioned, Power IQ stops polling it. It also stops receiving the item's traps or events.
A decommissioned facility item's historical data is still included in tabular report and PUEsearch. You cannot changedecommissioned item's configuration data.
The following features are prevented on a decommissioned item. Other features may also be prevented, depending on theitem.
l No pollingl No rescanningl No reception of traps or events associated with the decommissioned iteml No power control through the decommissioned item
Note: Power control on the IT devices mapped to the outlets of the decommissioned item must be performed
through a newly commissioned item, which replaces the decommissioned one and is associated with the IT
devices.
l All associated sensors become decommissioned and no longer display in the item smart viewl No firmware upgrade
Decommissioned ITDevices
l Configuration can be changed
l If a device 1) has an outlet associated from a facility item in service and 2) has an outlet associated from a decom-missioned facility item, power control on the device is allowed but it will only operate on the outlet from the facilityitem in service
Decommissioned Sensors
l Decommissioned sensors no longer display in the item smart view; however, the last sensor reading is displayed onthe item smart page
l Decommissioned external sensor readings are not displayed in EDM Tabular reports that contain historical sensordata
787

788
Decommission a Facility Item
You can decommission a facility item and then add a new one to replace it by using the same IP address. The replace-ment facility item can be a different model. You can also return the decommissioned facility item to service. See Return aFacility Item to Service on page 802.
If you are integrated with dcTrack, which does not support decommissioned facility items, you must modify the decom-missioned facility item's external key, which by default is the IP address.
After decommissioning a facility item, all sensors associated with it also get decommissioned.
To decommission individual or multiple facility items from the Facility Items list:
1. In the Facility Items tab > Facility Items list, select the item you would like to decommission. Click the Decom-mission link.

2. On the confirmation popup, click the Decommission PDU(s) button.
789

790
3. The selected facility items will be decommissioned. Click the Dismiss button to dismiss the status popup.

4. When decommissioning is completed, click the OK button.
791

792
5. The Health column for the selected items will display Decommissioned as the state.
To decommission a facility item from its smart page:
1. In the Facility Items tab, click a facility item link to open its smart page.2. Choose Actions > Edit.3. Optional. Modify the External Key field to make it different from the IP address. (This is required if you are using the
dcTrack integration which does not support decommissioned facility items.)4. Select the Decommissioned checkbox.5. Click Save.

The Details section of the facility item smart page will show the following:
l Decommissioned At field displaying a date and time stampl Health field Connectivity displaying a Decommissioned statel Health field Active events displaying a Decommissioned state
793

794
Do all of the following when using a newly commissioned facility item to replace a decommissioned one:
l Assign the IP address used by the decommissioned facility item to the new facility item.l Manually associate the new facility item with the original parent object of the decommissioned facility item, such
as the rack.l Manually associate outlets of the new facility item with all IT devices. Outlet associations of the new facility item
can be different from the outlet associations of the decommissioned facility item, and it is NOT required to removeold outlet associations.
l Manually add mappings for IT devices connected to the new facility item in the EDM.

Decommission an ITDevice
1. In the IT Devices tab, click the IT device name link in the IT Devices tab to go to the IT device page in the DataCenters tab. The EDM expands to show the IT device.
2. Select the Decommissioned checkbox.
3. Click Save.
795

796
Decommission a Sensor
There are two ways to decommission a sensor:
l Physically disconnect a sensor from the facility item.l Decommission the facility item with which the sensor is associated.

Identify a Decommissioned Facility Item
On the Facility Items list, you can sort items by Health state to display all items with the Decommissioned Health state.
To filter the Facility Items list by the Decommissioned Health state:
1. In the Facility Items list, click the Health column to display the Sort and Filter options.2. Select Filters > Decommissioned.3. The Facility Items list will display only those items with a Health state of Decommissioned.
After decommissioning a PDU, it is marked as decommissioned everywhere throughout Power IQ. The following are a fewillustrations.
In the Data Centers tab:
In the Facility Items tab:
797

798
In the facility item smart view title:
The Details section of the facility item smart page will show the following:
l Decommissioned At field displaying a date and time stampl Health field Connectivity displaying a Decommissioned statel Health field Active events displaying a Decommissioned state

800
Identify a Decommissioned ITDevice
Unlike decommissioned facility items, a decommissioned IT device is not marked as decommissioned. There are twoways to identify a decommissioned device.
In the Data Centers tab:
1. Select the IT device to open the IT device page.2. Examine whether the Decommissioned checkbox has been selected. For details, see Decommission a Device.3. In the IT Devices tab:
l Make the Decommissioned column visible in this tab.l To display the Decommissioned column, move the mouse pointer to any column header, and click the
arrow which appears in the column header.
4. Click the Columns, and select the Decommissioned checkbox. The Decommissioned column then displays.5. Examine the value shown in the Decommissioned column.
l true: Decommissioned.l false: Commissioned.

Identify a Decommissioned Sensor
A decommissioned sensor is marked as decommissioned in Power IQ, and it is no longer associated with its original PDU.
In the Data Centers tab:
801

802
Return a Facility Item to Service
You can restore a Facility Item to service from being decommissioned or in maintenance from the Facility Items list.
1. In the Facility Items tab > Facility Items list, select the PDUs you would like to return to service. Click the Return toService link.
2. On the confirmation popup, click the Return PDU(s) to Service button.
3. The selected items will be returned to service. Click the Dismiss button to dismiss the status popup.

Chapter 24:Support and Licensing
Support Connections
A support connection allows Sunbird Technical Support to access your Power IQ to diagnose a problem.
You should open a support connection only when Sunbird Technical Support requests one.
804

Prerequisites for Support Connections
The Power IQ device must be able to use DNS to resolve poweriq-access.sunbirddcim.com. The DNS server must be ableto do name resolution for external host names.
The Power IQ device must be able to make an outbound HTTPS request on port 443 to poweriq-access.sunbirddcim.com.You may have to require your firewall to allow this connection.
The Power IQ device must be able to make an outbound SSH request on port 22 to poweriq-access.sunbirddcim.com. Youmay have to require your firewall to allow this connection.
805

806
Creating a Support Connection
Make sure your Power IQ device meets the prerequisites before creating a support connection. See Prerequisites for Sup-port Connections.
To create a support connection:
1. In the Settings tab, click Get Support in the Appliance Services section.2. Click Start. A log appears.3. Make sure the final line of the log includes this text: support connection initialization complete.4. Contact Sunbird Technical Support with your Appliance ID number. The Appliance ID number is on the Settings
tab, in the Appliance Information section.
Example
e3b123f8-669e-4007-97bf-ca9d85c431f8. Sunbird Technical Support uses this number to identify your support con-
nection.

Stop a Support Connection
Once Sunbird Technical Support has finished using the support connection, you can stop it. Stopping the support con-nection will close the SSH connection from your Power IQ device to poweriq-access.sunbirddcim.com.
1. In the Settings tab, click Get Support in the Appliance Services section.2. Click Stop.
807

808
Save Support Logs
If you have trouble creating a support connection, the support logs may help Technical Support find the problem.
1. In the Settings tab, click Get Support in the Appliance Services section.2. Choose Activities > Download All System Logs.3. Click Save, then save the file using the dialog that appears.

Enable or Disable the Root Accounts for Support
Power IQ has the "sunbird" user account in place for Sunbird use when supporting the product. You may be asked toaccess the console as the "config" user to enable this account during the support process. You cannot change the pass-word for this account. When disabled, there is no external access to the system using this account.
New installations of Power IQ have this account disabled by default. Upgrading will not change the enable/disable statusof this account.
Note: Upgrading the system will reset the sunbird user account password to the default password.
809

810
Licensing
Power IQ requires a license. Licenses allow you to add a certain number of rack PDUs and facility items to Power IQ. Youmay need more than one license file to be allowed to add your full number of PDUs.

View Licenses
The licenses that you have uploaded to Power IQ are available to view.
1. If you have not already done so, get a Power IQ license file by contacting Customer Support.2. In the Web Client, click Admin > Appliance Settings. The Settings window opens.3. Click Product Licensing in the Application Administration panel.4. Click Add in the Licenses section.5. Use the browse function to locate and add the license file. The Licenses list contains all license files that you have
uploaded to Power IQ.
Item Description
Feature The feature that is allowed by this license.
TypeInitial: A required license to activate Power IQ and set the initial PDU capacity allowed.
Incremental: A secondary license type that allows you to add to the initial license's PDU capacity.
Count The number of PDUs that you can add to Power IQ under this license.
Licensee Your company name.
To view licensing summary:
l Licensing Summary contains information about how many PDUs your combined licenses allow you to add toPower IQ.
Item Description
Customer Name Your company name.
PDU License Capacity The total number of PDUs allowed by all your licenses.
PDU Licenses Available The number of PDUs remaining that you are allowed to add.
811

812
Adding a License File
If this is your first time logging in and you need to add a license file, see Connecting to Power IQ. Once you add a licensefile and log in for the first time, you can follow the instructions in this topic to add or remove license files as needed.
1. If you have not already done so, get a Power IQ license file by contacting Customer Support.2. In the Web Client, click Admin > Appliance Settings. The Settings window opens.3. Click Product Licensing in the Application Administration panel.4. Click Add in the Licenses section.5. Use the browse function to locate and add the license file.
Licenses are .LIC files. Repeat this step to add incremental licenses if needed.
Note: You will receive an email with your license from Sunbird..
6. If you see error messages AND you're unable to use Power IQ or to add the total licensed number of PDUs, contactSunbird Support. There may be a problem with your license file.

License Count Rules for Rack PDUs and Facility Items
Your license count defines how many rack PDUs you can add to Power IQ under your purchased license.
Different types of facility items count against your license count at higher rates.
Facility Item LicenseCount
CRAC 5
Floor PDU 5
Floor UPS 5
Power Panel 5
StandaloneMeter
1
813

Appendix A: ODBC Access
Power IQ's ODBC interface allows ODBC compliant applications access to the power data of managed devices. Forexample, an ODBC compliant reporting application like Crystal Reports can access Power IQ data to create customizedreports.
The Power IQ ODBC server listens on TCP Port 5432
Roll-up tables summarize data over one hour, twenty four hours, and one month. Upon summarization, detailed readingsare purged. For example, when you create a daily roll-up, the hourly poll data is purged from the database. You can con-figure the data retention settings. See Configuring Data Rollup Retention.
Power IQ ODBC Interface is backed by an PostgreSQL database.
814

815
Configuring ODBC Access to Power IQ
1. Specify the IP addresses that you authorize to make connections to the database.2. Click Settings.3. Click ODBC Access in the Data Management section. The ODBC Access page opens.4. Click Add, then double-click the 0.0.0.0/0 addresses to enter edit mode and type the ODBC network address with
the mask in CIDR format.5. CIDR format example: 192.168.43.0/24 instead of 192.168.43.0 and 255.255.255.0.6. Use the network mask value to specify a single address or a range of addresses.7. Use the default value 0.0.0.0/0 to allow access from all IP addresses.8. Repeat to add new addresses as needed. Select an address and click Remove to remove authorization from the
address.9. Click Save when all authorized addresses have been added. The Power IQ database restarts.
10. After the restart, ODBC compliant applications are allowed to access the database from the authorized IPaddresses.

816
Configuring ODBC User Credentials
Factory default user credentials for ODBC access in Power IQ are:
l Username: odbcuserl Password: sunbird
The ODBC user credentials can be customized as needed. After ODBC user credentials are modified, you must alsochange the user credentials entered in the ODBC Client and driver.
1. Click Settings.2. Click ODBC Access in the Data Management section. The ODBC Access page opens.3. In the Configure ODBC Security section, type the user name and password intended for ODBC authentication.
Note: For restrictions that apply to the ODBC user credentials, see Restrictions of ODBC User Credentials.
4. Click Save.

817
Restrictions of ODBC User Credentials
The ODBC username is NOT subject to the restrictions applied to a Power IQ user name.
Certain restrictions apply to the ODBC user name and password.
ODBC username:
l Support 1 to 63 characters longl Consist of alphanumeric characters and/or underscores only, including 0 to 9, a to z, and _l No number used for the first characterl No uppercase charactersl No support for multi-byte characters
Do not use names such as public, postgres, raritan, sunbird, odbc and floormaps
ODBC password:
l The password must follow the requirements selected in Settings > Password Requirements. See Configuring Pass-word Requirements.

818
ODBC Client Configuration
ODBC Client must install and configure a suitable PostgreSQL driver. PostgreSQL drivers are available at http://www.-postgresql.org/ftp/odbc/versions/msi/.
ODBC Client must configure Power IQ as a ODBC Data Source with the following credentials:
Database Name raritan
User ID and Password Same as the ODBC user credentials specified in Power IQ*
Port Number 5432
Server Power IQ IP Address
* For information on ODBC user credentials, see Configuring ODBC User Credentials.

819
Timezone Configuration for ODBC Data
ODBC tables use the Power IQ system time setting, which is EST/EDT. This setting is converted to your selected timezonewhen you are using the Power IQ web interface, but this conversion is not applied to ODBC connections.
The time data available via the ODBC connection can be changed on a per session basis. By using a specific SQL state-ment to adjust the client session, you can run reports and view information in the desired timezone.
This link contains documentation on setting the timezone for the database using an SQL statement: http://www.-postgresql.org/docs/9.2/static/sql-set.html
Use the "SET SESSION ...." syntax, because Power IQ ODBC users do not have super user privileges.

820
Advanced Reporting with Database and Reporting Programs
Create advanced reports and charts with reporting programs such as SQL report writer, Crystal Reports®, and MicrosoftAccess®. Follow these instructions to use Microsoft Access.
ODBC Access must be enabled. For more information, see Appendix A: ODBC Access on page 814.
You must install a PostgreSQL driver first. See Install and Configure a PostgreSQL Driver on the next page.

821
Install and Configure a PostgreSQL Driver
You must install and configure a PostgreSQL driver before you can use Microsoft® Access® to create table reports of yourPower IQ™data.
To install and configure a PostgreSQL driver:
1. Configure Power IQ to allow ODBC access from your client IP address. See Configuring ODBC Access to Power IQ.2. Go to http://www.postgresql.org/ftp/odbc/versions/msi/ and download the latest driver .ZIP file. Run the .MSI file con-
tained in the .ZIP to install the driver on your client.3. Go to Control Panel > Administrative Tools > Data Sources (ODBC).4. Click Add then select the driver, PostgreSQL Unicode, and click Finish.5. In the dialog that appears, enter the Power IQ database information:
l Database: raritanl Server: Power IQ IP addressl Description: Enter a name for this data sourcel SSL Mode: disablel Port: 5432l User Name and Password: Same as the ODBC user credentials specified in Power IQ*
* For information on ODBC user credentials, see Configuring ODBC User Credentials.
6. Click Test. If the test is successful, click Save.7. Click OK.

822
Link Database Tables in Microsoft® Access®
Use Microsoft Access to create links between the Power IQ database tables you want to query. See Correlated Fields inODBC Tables for details on which Power IQ tables can be linked.
These instructions refer to Access 2003. Other versions may vary.
Note: You only have to link database tables once in Microsoft Access, and the links are retained. You do not have torepeat this task each time you want to create queries or run reports.
1. Choose File > New then select Blank Database.2. Name the file and click Create.3. In the dialog that appears, Tables is selected by default in the Object list. Click New.4. Select Link Table and click OK.5. In the dialog that appears, select ODBC Databases in the "Files of type" list.6. In the dialog that appears, click the Machine Data Source tab, select the ODBC driver you installed, and click OK.7. A list of all ODBC tables appears. Select the table you want to link and click OK.8. Select the unique record identifier for the table and click OK. The unique record identifier is typically the first item in
the list. See the table details in this guide to check. See Power IQ ODBC Schema.
The linked table appears in the list. Repeat these steps to add other tables you want to query.
9. Identify the relationships between the linked tables.10. Choose Tools > Relationships.11. Select all the tables in the list and click Add. The tables appear with lists of their fields. Resize the tables to view the
field names.12. Link the fields that relate by dragging and dropping a field from one table to the field it relates to in another table.
See the Microsoft Access help on "Define relationships between tables" for details.
Note: Fields that have relationships are marked as "foreign key relationships" in the ODBC schema. See Power IQ
ODBC Schema view the lists of fields. See Correlated Fields in ODBC Tables for details and an example.

823
Correlated Fields in ODBC Tables
To find how tables in Power IQ relate to each other, look for the foreign key reference fields in each table. The tables are lis-ted in this help. See Power IQ ODBC Schema.
ExampleThe relationship between the PDUOutlets table and the PDUs table:
The PDUOutlets table has a relationship to the PDUs table, via the PDUID field in the PDUOutlets table.
PDUID Integer Foreign keyreference to PDUstable
See PDUOutlets and PDUs.
Both tables contain a field called PDUID. Link these fields in Microsoft® Access® to enable these tables to be queriedtogether. See Link Database Tables in Microsoft Access®.

824
Power IQ ODBC Schema
Power IQ makes a number of its data views available through the ODBC interface.
PDUOutlets
The PDUOutlets view shows the outlets associated with a PDU.
Field Type Notes
PDUOutletsID Integer Unique outlet number
PDUID Integer Foreign key reference to PDUs table
OutletID Integer PDU outlet number
OutletName VarChar(64) Outlet name
OutletState VarChar(64) Outlet state
ITDeviceID Integer Associated IT Device ID foreign key
PDUOutletNumber Integer PDU outlet number
OutletRatedAmps Integer The rated amps of the outlet
PDUCircuitPoles
Field Type Notes
PDUCircuitPoleID Integer Unique circuit pole ID
PDUCircuitID Integer Foreign key reference to PDUCircuits table
PDUPanelID Integer Foreign key reference to PDUPanels table
PDUID Integer Foreign key reference to PDUs table
CircuitPoleOrdinal Integer The circuit pole's number
Phase VarChar(64) The circuit pole's phase

825
PDUCircuits
Field Type Notes
PDUCircuitID Integer Unique circuit ID
PDUID Integer Foreign key reference to PDUs table
PDUPanelID Integer Foreign key reference to the PDUPanels table
CircuitOrdinal Integer Circuit number on the PDU
CircuitName VarChar (64) Name of the circuit
RatedAmps Integer Rated amps of the circuit
PDUCircuitBreakers
The PDUCircuitBreakers view shows the circuit breakers associated with a PDU.
Field Type Notes
PDUCircuitBreakersID Integer Unique CB Number
PDUID Integer Foreign key reference to PDUs table
CircuitBreakerOrdinal Integer Circuit breaker number on the PDU
CircuitBreakerState Integer 0 (closed) 1 (open) 3 (unknown)
CircuitBreakerLabel VarChar(64) Label assigned to a CB
CircuitBreakerRating Integer The rated amps of the circuit breaker in amps
CircuitBreakerRatedAmps Integer The rated amps of the circuit breaker in amps

826
PDULines
Field Type Notes
PDULinesID Integer Primary key for the table.
PDUInletsID Integer Foreign key reference to PDUInlets table
PDUID Integer Foreign key reference to PDUs table
LineNumber Integer The inlet line number on the PDU
PDUInlets
Field Type Notes
PDUInletsID Integer Primary key for the PDUInlets table.
PDUID Integer Foreign key reference to PDUs table
InletNumber Integer The number of the inlet on the PDU.
InletRatedAmps Integer The rated amps on the inlet.
PDUPanelID Integer Foreign key reference to PDUPanels
Source Boolean Whether main inlet
PDUPanels
Field Type Notes
PDUPanelID Integer Unique ID for each panel
PDUID Integer Foreign key reference to PDUs table
PanelOrdinal Integer The panel's number on the floor PDU.

827
Field Type Notes
PanelName VarChar (255) The panel's name, only for floor PDU panels, not standalone power panels.
PDUReadings
Note: This table will be deprecated soon. It is recommended to stop using it, and use the new PDUInletReadings table.See PDUInletReadings (on page 1).
The PDUReadings view shows the raw power data collected from PDUs. A data record is added for each PDU polled. Thisdata is summarized hourly in a PDUReadingsRollup view, and the readings in this view are purged.
Field Type Notes
PDUReadingsID Integer Unique ID for each reading
PDUID Integer Foreign key reference to PDU
TimeTimestamp withTimezone
Local timestamp
ActivePower Real Active power drawn by PDU
ApparentPower Real Apparent power drawn by PDU
WattHour RealCumulative watt-hours consumed by the PDU, if available for thePDU
MaxActivePower Real Maximum active power drawn by PDU
MinActivePower Real Minimum active power drawn by PDU
MaxApparentPower Real Maximum apparent power drawn by PDU
MinApparentPower Real Minimum apparent power drawn by PDU
PDUInletReadings
A PDU can have multiple inlets. To get a total reading for the PDU, you must to request the values for all inlets on a PDU.

828
Field Type Notes
PDUInletReadingsID bigint Unique ID for each reading
PDUID Integer Foreign key reference to PDUs table
InletID Integer Foreign key reference to PDUInlets table
InletNumber Integer Inlet number on the PDU
Timetimestampwith time zone
Local timestamp
Voltage Real Voltage at the inlet
MinVoltage RealMinimum voltage reading over the sample period. Applies to deviceswith data buffering enabled.
MaxVoltage RealMaximum voltage reading over the sample period. Applies to deviceswith data buffering enabled.
Current Real Current (Amps) drawn by the inlet
MinCurrent RealMinimum current (Amps) reading over the sample period. Applies todevices with data buffering enabled.
MaxCurrent RealMaximum current (Amps) reading over the sample period (applies todevices with data buffering enabled.
PowerFactor Real Power factor of the inlet
MinPowerFactor RealMinimum power factor reading over the sample period. Applies todevices with data buffering enabled)
MaxPowerFactor RealMaximum power factor reading over the sample period. Applies todevices with data buffering enabled.
ActivePower Real Active power (Watts) drawn by the inlet
MinActivePower RealMinimum active power (Watts) reading over the sample period. Appliesto devices with data buffering enabled.
MaxActivePower RealMaximum active power (Watts) reading over the sample period. Appliesto devices with data buffering enabled.

829
Field Type Notes
ApparentPower Real Apparent power (VA) drawn by the inlet
MinApparentPower RealMinimum apparent power (VA) reading over the sample period (appliesto devices with data buffering enabled)
MaxApparentPower RealMaximum apparent power (VA) reading over the sample period. Appliesto devices with data buffering enabled.
VoltAmpHours RealCumulative volt-amp-hours consumed by the inlet, if available for thePDU
WattHours Real Cumulative watt-hours consumed by the inlet, if available for the PDU
ResidualCurrent Real The Residual Current (Amps) value as measured at the inlet.
MinResidualCurrent RealThe Minimum Residual Current (Amps) reading over the sample period.
Applies to devices with data buffering enabled.
MaxResidualCurrent RealThe Maximum Residual Current (Amps) reading over the sample period
(applies to devices with data buffering enabled.
PDUInletReadingHourlyRollups
Field Type Notes
PDUInletReadingsRollupID Bigint Primary key for the table
PDUID Integer Foreign key reference to PDUs table
InletID Integer Foreign key reference to PDUInlets table
InletNumber Integer The number of the inlet on the PDU.
Time Timestamp Local timestamp
Voltage Real Average voltage reading during rollup interval

830
Field Type Notes
MinVoltage Real Minimum voltage reading during rollup interval
MaxVoltage Real Maximum voltage reading during rollup interval
Current Real Average current reading (Amps) during rollup interval
MinCurrent Real Minimum current reading (Amps) during rollup interval
MaxCurrent Real Maximum current reading (Amps) during rollup interval
PowerFactor Real Average Power factor reading during rollup interval
MinPowerFactor Real Minimum power factor reading during rollup interval
MaxPowerFactor Real Maximum power factor reading during rollup interval
ActivePower Real Average active power (Watts) reading during rollup interval
MinActivePower Real Minimum active power (Watts) reading during rollup interval
MaxActivePower Real Maximum active power (Watts) reading during rollup interval
ApparentPower Real Average apparent power (VA) reading during rollup interval
MinApparentPower Real Minimum apparent power (VA) reading during rollup interval
MaxApparentPower Real Maximum apparent power (VA) reading during rollup interval
MaxUnutilizedCapacity RealMaximum unutilized capacity (rated amps minus current) readingduring rollup interval
MinUnutilizedCapacity RealMinimum unutilized capacity (rated amps minus current) readingduring rollup interval
UnutilizedCapacity RealAverage unutilized capacity (rated amps minus current) readingduring rollup interval
VoltAmpHours RealMaximum of the cumulative volt-amp-hour meter readings over therollup interval
WattHours RealMaximum of the cumulative watt-hour meter readings over the rol-lup interval

831
Field Type Notes
ResidualCurrent Real Average Residual Current reading (Amps) during rollup interval
MinResidualCurrent Real Minimum Residual Current reading (Amps) during rollup interval
MaxResidualCurrent Real Maximum Residual Current reading (Amps) during rollup interval
PDUInletReadingDailyRollups
Field Type Notes
PDUInletReadingsRollupID Bigint Primary key for the table
PDUID Integer Foreign key reference to PDUs table
InletID Integer Foreign key reference to PDUInlets table
InletNumber Integer The number of the inlet on the PDU.
Time Timestamp Local timestamp
Voltage Real Average voltage reading during rollup interval
MinVoltage Real Minimum voltage reading during rollup interval
MaxVoltage Real Maximum voltage reading during rollup interval
Current Real Average current reading (Amps) during rollup interval
MinCurrent Real Minimum current reading (Amps) during rollup interval
MaxCurrent Real Maximum current reading (Amps) during rollup interval
PowerFactor Real Average Power factor reading during rollup interval
MinPowerFactor Real Minimum power factor reading during rollup interval
MaxPowerFactor Real Maximum power factor reading during rollup interval

832
Field Type Notes
ActivePower Real Average active power (Watts) reading during rollup interval
MinActivePower Real Minimum active power (Watts) reading during rollup interval
MaxActivePower Real Maximum active power (Watts) reading during rollup interval
ApparentPower Real Average apparent power (VA) reading during rollup interval
MinApparentPower Real Minimum apparent power (VA) reading during rollup interval
MaxApparentPower Real Maximum apparent power (VA) reading during rollup interval
VoltAmpHours RealMaximum of the cumulative volt-amp-hour meter readings over therollup interval
WattHours RealMaximum of the cumulative watt-hour meter readings over the rol-lup interval
ResidualCurrent Real Average Residual Current reading (Amps) during rollup interval
MinResidualCurrent Real Minimum Residual Current reading (Amps) during rollup interval
MaxResidualCurrent Real Maximum Residual Current reading (Amps) during rollup interval
PDUInletReadingMonthlyRollups
Field Type Notes
PDUInletReadingsRollupID Bigint Unique ID for each reading
PDUID Integer Foreign key reference to PDUs table
InletID Integer Foreign key reference to PDUInlets table
InletNumber Integer Inlet number on the PDU
Time TimestampLocal timestamp for the first day of the month over which the rollupwas calculated.

833
Field Type Notes
Voltage Real Average voltage reading during rollup interval
MinVoltage Real Minimum voltage reading during rollup interval
MaxVoltage Real Maximum voltage reading during rollup interval
Current Real Average current reading (Amps) during rollup interval
MinCurrent Real Minimum current reading (Amps) during rollup interval
MaxCurrent Real Maximum current reading (Amps) during rollup interval
PowerFactor Real Average Power factor reading during rollup interval
MinPowerFactor Real Minimum power factor reading during rollup interval
MaxPowerFactor Real Maximum power factor reading during rollup interval
ActivePower Real Active power drawn by the inlet in Watts
MinActivePower Real Minimum active power (Watts) reading during rollup interval
MaxActivePower Real Maximum active power (Watts) reading during rollup interval
ApparentPower Real Apparent power (VA) drawn by the inlet
MinApparentPower Real Minimum apparent power (VA) reading during rollup interval
MaxApparentPower Real Maximum apparent power (VA) reading during rollup interval
VoltAmpHours RealCumulative volt-amp-hours consumed by the inlet, if available forthe PDU
WattHours RealCumulative watt-hours consumed by the inlet, if available for thePDU
ResidualCurrent Real Average Residual Current reading (Amps) during rollup interval
MinResidualCurrent Real Minimum Residual Current reading (Amps) during rollup interval
MaxResidualCurrent Real Maximum Residual Current reading (Amps) during rollup interval

834
PDUOutletReadings
The PDUOutletReadings view shows the raw power data collected from PDU outlets. A data record is added for each out-let polled. This data is summarized hourly in a PDUOutletReadingsRollup view, and the outlet records in this view arepurged.
Field Type Notes
PDUOutletReadingsID Integer Unique ID for each reading
PDUID Integer Foreign key reference to PDUs table
OutletID Integer Foreign key reference to PDUOutlets table
OutletNumber Integer PDU outlet number
TimeTimestamp withTimezone
Local timestamp
CurrentAmps Real Amps drawn by the outlet
ActivePower Real Active power drawn by the outlet
ApparentPower Real Apparent power drawn by the outlet
WattHour RealCumulative watt-hours consumed by the outlet, if available forthe PDU
MaxCurrentAmps Real Maximum amps drawn by the outlet
MinCurrentAmps Real Minimum amps drawn by the outlet
MaxActivePower Real Maximum active power drawn by the outlet
MinActivePower Real Minimum amps drawn by the outlet
MaxApparentPower Real Maximum apparent power drawn by the outlet
MinApparentPower Real Minimum apparent power drawn by the outlet
Voltage Real Voltage drawn by the outlet

835
Field Type Notes
MinVoltage Real Minimum voltage reading
MaxVoltage Real Maximum voltage reading
PowerFactor Real Power factor of the outlet
MinPowerFactor Real Minimum power factor
MaxPowerFactor Real Maximum power factor
VoltAmpHours RealCumulative volt-amp-hours consumed by the outlet, if availablefor the PDU
PDULineReadings
The PDULineReadings view shows the power data collected from PDU current-carrying lines. A data record is added foreach line polled. Single-phase PDUs have 1 line. Three-phase PDUs have 3 lines. This data is summarized hourly in aPDULineReadingsRollup view, and the line readings in this view are purged.
Field Type Notes
PDULineReadingsID Integer Unique ID for each reading
PDUID Integer Foreign Key Reference To PDUs table
InletNumber Integer Inlet number on the PDU
LineNumber Integer Line number on this PDU
TimeTimestamp withTimezone
Local timestamp
CurrentAmps Real Amps drawn on this line
UnutilizedCapacity Real Available amps remaining on this line
MaxCurrentAmps Real Maximum amps drawn on this line
MinCurrentAmps Real Minimum amps drawn on this line

836
Field Type Notes
Voltage Real Voltage for the line
MinVoltage RealMinimum voltage reading over the sample period. Applies to deviceswith data buffering enabled.
MaxVoltage RealMaximum voltage reading over the sample period. Applies to deviceswith data buffering enabled.
PDUCircuitReadings
Field Type Notes
PDUCircuitReadingsID Big Integer Unique circuit number
PDUID Integer Foreign key reference to PDUs table
PDUCircuitID Integer Circuit number on the PDU
Time timestamp with time zone Local timestamp
Voltage Real Voltage drawn by the circuit
MinVoltage Real Minimum voltage reading
MaxVoltage Real Maximum voltage reading
Current Real Amps drawn by the circuit
MinCurrent Real Minimum amps drawn by the circuit
MaxCurrent Real Maximum amps drawn by the circuit
UnutilizedCapacity Real Available amps remaining on this circuit
MinUnutilizedCapacity Real Minimum amps remaining on this circuit
MaxUnutilizedCapacity Real Maximum amps remaining on this circuit
PowerFactor Real Power factor of the circuit

837
Field Type Notes
MinPowerFactor Real Minimum power factor
MaxPowerFactor Real Maximum power factor
ActivePower Real Active power drawn by the circuit
MinActivePower Real Minimum active power drawn by the circuit
MaxActivePower Real Maximum active power drawn by the circuit
ApparentPower Real Apparent power drawn by the circuit
MinApparentPower Real Minimum apparent power drawn by the circuit
MaxApparentPower Real Maximum apparent power drawn by the circuit
VoltAmpHour Real Cumulative volt-amp-hours consumed by the circuit
WattHour Real Cumulative watt-hours consumed by the circuit
PDUCircuitPoleReadings
Field Type Notes
PDUCircuitPoleReadingsID Big Integer Unique circuit pole number
PDUCircuitPoleID Integer Circuit pole number on the PDU
PDUID Integer Foreign key reference to PDUs table
Time timestamp with time zone Local timestamp
Voltage Real Voltage drawn by the circuit pole
MinVoltage Real Minimum voltage reading
MaxVoltage Real Maximum voltage reading
Current Real Amps drawn by the circuit pole

838
Field Type Notes
MinCurrent Real Minimum amps drawn by the circuit pole
MaxCurrent Real Maximum amps drawn by the circuit pole
UnutilizedCapacity Real Available amps remaining on this circuit pole
MinUnutilizedCapacity Real Minimum amps remaining on this circuit pole
MaxUnutilizedCapacity Real Maximum amps remaining on this circuit pole
PDUCircuitBreakersReadings
The PDUCircuitBreakerReadings view shows the power data collected from circuit breakers on the PDU. This view doesnot contain any data for PDUs that do not have circuit breakers. A data record is added for each circuit breaker polled. Thisdata is summarized hourly in a PDUCircuitBreakerReadingsRollup view, and the circuit breaker readings in this view arepurged.
Field Type Notes
PDUCircuitBreakerReadingsID Integer Unique ID for each reading
PDUID Integer Foreign key reference to PDUs table
CircuitBreakerNumber Integer Circuit breaker number on the PDU
CircuitBreakerID Integer Foreign key reference to PDUCircuitBreakers table
Time Timestamp with Timezone Local timestamp
CurrentAmps Real Current value in Amps
UnutilizedCapacity Real Available amps remaining on this circuit breaker
MaxCurrentAmps Real Maximum amps drawn on the circuit breaker
MinCurrentAmps Real Minimum amps drawn on the circuit breaker

839
PDUSensorReadings
The PDUSensorReadings view shows the data collected from PDU sensors. A data record is added for each sensor polled.This data is summarized hourly in a PDUSensorReadingsRollup view and the sensor readings in this view are purged.
Field Type Notes
PDUSensorReadingsID Integer Unique ID for each reading
SensorID Integer Database ID of the sensor as seen in PDUSensors
TimeTimestamp withTimezone
Local timestamp when the reading occurred
Value Real Sensor value
MinimumValue RealMinimum sensor value over the sample period. Applies to deviceswith data buffering enabled.
MaximumValue RealMaximum sensor value over the sample period. Applies to deviceswith data buffering enabled.
PDUOutletReadingsRollup - To Be Deprecated
Note: This table will be deprecated soon. It is recommended to stop using it, and use the new PDUOut-letReadingsHourlyRollup, PDUOutletReadingsDailyRollup, and PDUOutletReadingsMonthlyRollup tables. If you exper-ience any performance issues, move to the new tables.
The PDUOutletReadingsRollup view summarizes the outlet readings power data over the roll-up interval. Hourly roll-upsare rolled up once a day. Daily roll-ups are rolled up once a month. When data is rolled up, shorter interval roll-up entries inthe PDUOutletReadingsRollup view are purged.
Field Type Notes
PDUOutletReadingRollupID Integer Non-unique ID for each reading
PDUID Integer Foreign key reference to PDUs table
OutletID Integer Foreign key reference to PDUOutlets table
OutletNumber Integer Outlet number on the PDU

840
Field Type Notes
RollupInterval Integer
1: one hour
2: one day
3: one month
TimeTimestamp withTimezone
Timestamp when rollup was created
MinimumCurrent Real Lowest current (Amps) reading during rollup interval
MaximumCurrent Real Maximum current (Amps) reading during rollup interval
AverageCurrent Real Average current (Amps) reading during rollup interval
MinimumActivePower Real Lowest active power (Watts) reading during rollup interval
MaximumActivePower RealMaximum active power (Watts) reading during rollup inter-val
AverageActivePower Real Average active power (Watts) reading during rollup interval
MinimumApparentPower Real Lowest apparent power (VA) reading during rollup interval
MaximumApparentPower Real Maximum apparent power (VA) reading during rollup interval
AverageApparentPower Real Average apparent power (VA) reading during rollup interval
MinimumPowerFactor Real Minimum power factor reading during rollup interval
MaximumPowerFactor Real Maximum power factor reading during rollup interval
AverageActivePower Real Average power factor reading during rollup interval
MinimumVoltage Real Minimum voltage reading during rollup interval
MaximumVoltage Real Maximum voltage reading during rollup interval
AverageVoltage Real Average voltage reading during rollup interval
WattHours RealMaximum of the cumulative watt-hour meter readings overthe rollup interval

841
PDUOutletReadingHourlyRollups
Field Type Notes
PDUOutletReadingRollupID Integer Unique ID for each reading
PDUID Integer Foreign key reference to PDUs table
OutletID Integer Foreign key reference to PDUOutlets table
OutletNumber Integer Outlet number on the PDU
TimeTimestamp withTimezone
Timestamp when rollup was created
MinimumCurrent Real Lowest current (Amps) reading during rollup interval
MaximumCurrent Real Maximum current (Amps) reading during rollup interval
AverageCurrent Real Average current (Amps) reading during rollup interval
MinimumActivePower Real Lowest active power (Watts) reading during rollup interval
MaximumActivePower Real Maximum active power (Watts) reading during rollup interval
AverageActivePower Real Average active power (Watts) reading during rollup interval
MinimumApparentPower Real Lowest apparent power (VA) reading during rollup interval
MaximumApparentPower Real Maximum apparent power (VA) reading during rollup interval
AverageApparentPower Real Average apparent power (VA) reading during rollup interval
MinimumVoltage Real Minimum voltage reading during rollup interval
MaximumVoltage Real Maximum voltage reading during rollup interval
AverageVoltage Real Average voltage reading during rollup interval
VoltAmpHours RealMaximum of the cumulative volt-amp-hour meter readingsover the rollup interval

842
Field Type Notes
WattHours RealMaximum of the cumulative watt-hour meter readings overthe rollup interval
AveragePowerFactor Real Average power factor reading during rollup interval
MinimumPowerFactor Real Minimum power factor reading during rollup interval
MaximumPowerFactor Real Maximum power factor reading during rollup interval
PDUOutletReadingDailyRollups
Field Type Notes
PDUOutletReadingRollupID Integer Unique ID for each reading
PDUID Integer Foreign key reference to PDUs table
OutletID Integer Foreign key reference to PDUOutlets table
OutletNumber Integer Outlet number on the PDU
TimeTimestamp withTimezone
Timestamp when rollup was created
MinimumCurrent Real Lowest current (Amps) reading during rollup interval
MaximumCurrent Real Maximum current (Amps) reading during rollup interval
AverageCurrent Real Average current (Amps) reading during rollup interval
MinimumActivePower Real Lowest active power (Watts) reading during rollup interval
MaximumActivePower Real Maximum active power (Watts) reading during rollup interval
AverageActivePower Real Average active power (Watts) reading during rollup interval
MinimumApparentPower Real Lowest apparent power (VA) reading during rollup interval

843
Field Type Notes
MaximumApparentPower Real Maximum apparent power (VA) reading during rollup interval
AverageApparentPower Real Average apparent power (VA) reading during rollup interval
MinimumVoltage Real Minimum voltage reading during rollup interval
MaximumVoltage Real Maximum voltage reading during rollup interval
AverageVoltage Real Average voltage reading during rollup interval
VoltAmpHours RealMaximum of the cumulative volt-amp-hour meter readingsover the rollup interval
WattHours RealMaximum of the cumulative watt-hour meter readings overthe rollup interval
AveragePowerFactor Real Average power factor reading during rollup interval
MinimumPowerFactor Real Minimum power factor reading during rollup interval
MaximumPowerFactor Real Maximum power factor reading during rollup interval
PDUOutletReadingMonthlyRollups
Field Type Notes
PDUOutletReadingRollupID Integer Unique ID for each reading
PDUID Integer Foreign key reference to PDUs table
OutletID Integer Foreign key reference to PDUOutlets table
OutletNumber Integer Outlet number on the PDU
TimeTimestamp withTimezone
Local timestamp for the first day of the month over which therollup was calculated

844
Field Type Notes
MinimumCurrent Real Lowest current (Amps) reading during rollup interval
MaximumCurrent Real Maximum current (Amps) reading during rollup interval
AverageCurrent Real Average current (Amps) reading during rollup interval
MinimumActivePower Real Lowest active power (Watts) reading during rollup interval
MaximumActivePower Real Maximum active power (Watts) reading during rollup interval
AverageActivePower Real Average active power (Watts) reading during rollup interval
MinimumApparentPower Real Lowest apparent power (VA) reading during rollup interval
MaximumApparentPower Real Maximum apparent power (VA) reading during rollup interval
AverageApparentPower Real Average apparent power (VA) reading during rollup interval
MinimumVoltage Real Minimum voltage reading during rollup interval
MaximumVoltage Real Maximum voltage reading during rollup interval
AverageVoltage Real Average voltage reading during rollup interval
VoltAmpHours RealMaximum of the cumulative volt-amp-hour meter readingsover the rollup interval
WattHours RealMaximum of the cumulative watt-hour meter readings overthe rollup interval
AveragePowerFactor Real Average power factor reading during rollup interval
MinimumPowerFactor Real Minimum power factor reading during rollup interval
MaximumPowerFactor Real Maximum power factor reading during rollup interval
PDUReadingsRollup - To Be Deprecated
Note: This table will be deprecated soon. It is recommended to stop using it, and use the new PDUInletReadings tables.

845
The PDUReadingsRollup view summarizes the PDU readings power data over the roll-up interval. Hourly roll-ups are rolledup once a day. Daily roll-ups are rolled up once a month. When data is rolled up, shorter interval roll-up entries in thePDUReadingsRollup are purged.
Field Type Notes
PDUReadingsRollup Integer Non-unique ID for each reading
PDUID Integer Foreign key reference to PDU
RollupInterval Integer
1: one hour
2: one day
3: one month
TimeTimestamp withTimezone
Timestamp when rollup was created
MinimumActivePower Real Lowest active power (Watts) reading during rollup interval
MaximumActivePower Real Maximum active power (Watts) reading during rollup interval
AverageActivePower Real Average active power (Watts) reading during rollup interval
MinimumApparentPower Real Lowest apparent power (VA) reading during rollup interval
MaximumApparentPower Real Maximum apparent power (VA) reading during rollup interval
AverageApparentPower Real Average apparent power (VA) reading during rollup interval
WattHours RealMaximum of the cumulative watt-hour meter readings overthe rollup interval
PDULineReadingsRollup - To Be Deprecated
Note: This table will be deprecated soon. It is recommended to stop using it, and use the new PDULineRead-ingsHourlyRollup, PDULineReadingsDailyRollup, PDULineReadingsMonthlyRollup tables.
The PDULineReadingsRollup view summarizes the line readings power data over the roll-up interval. Hourly roll-ups arerolled up once a day. Daily roll-ups are rolled up once a month. When data is rolled up, shorter interval roll-up entries in thePDULineReadingsRollup is purged.

846
Field Type Notes
PDULineReadingsRollupID Integer Non-unique ID for each reading
PDUID Integer Foreign key reference to PDU
LineNumber Integer Line number on the PDU
InletNumber Integer Inlet number on the PDU
RollupInterval Integer
1: one hour
2: one day
3: one month
TimeTimestamp withTimezone
Timestamp when rollup was created
MinimumCurrent Real Lowest current (Amps) reading during rollup interval
MaximumCurrent Real Maximum current (Amps) reading during rollup interval
AverageCurrent Real Average current (Amps) reading during rollup interval
MinimumUnutilizedCapacity RealLowest unutilized capacity (Amps) during rollup inter-val
MaximumUnutilizedCapacity RealMaximum unutilized capacity (Amps) during rollupinterval
AverageUnutilizedCapacity RealAverage unutilized capacity (Amps) during rollup inter-val
PDULineReadingHourlyRollups
The PDULineReadingsHourlyRollup view summarizes the line readings power data over the hourly roll-up interval.
Field Type Notes
PDULineReadingsRollupID Integer Unique ID for each reading
PDUID Integer Foreign key reference to PDU

847
Field Type Notes
LineNumber Integer Line number on the PDU
InletNumber Integer Inlet number on the PDU
TimeTimestamp withTimezone
Timestamp when rollup was created
MinimumCurrent Real Lowest current (Amps) reading during rollup interval
MaximumCurrent Real Maximum current (Amps) reading during rollup interval
AverageCurrent Real Average current (Amps) reading during rollup interval
MinimumUnutilizedCapacity RealLowest unutilized capacity (Amps) during rollup inter-val
MaximumUnutilizedCapacity RealMaximum unutilized capacity (Amps) during rollupinterval
AverageUnutilizedCapacity RealAverage unutilized capacity (Amps) during rollup inter-val
PDULineReadingDailyRollups
The PDULineReadingsDailyRollup view summarizes the line readings power data over the daily roll-up interval.
Field Type Notes
PDULineReadingsRollupID Integer Unique ID for each reading
PDUID Integer Foreign key reference to PDU
LineNumber Integer Line number on the PDU
InletNumber Integer Inlet number on the PDU
TimeTimestamp withTimezone
Timestamp when rollup was created
MinimumCurrent Real Lowest current (Amps) reading during rollup interval

848
Field Type Notes
MaximumCurrent Real Maximum current (Amps) reading during rollup interval
AverageCurrent Real Average current (Amps) reading during rollup interval
MinimumUnutilizedCapacity RealLowest unutilized capacity (Amps) during rollup inter-val
MaximumUnutilizedCapacity RealMaximum unutilized capacity (Amps) during rollupinterval
AverageUnutilizedCapacity RealAverage unutilized capacity (Amps) during rollup inter-val
PDULineReadingMonthlyRollups
The PDULineReadingsMonthlyRollup view summarizes the line readings power data over the monthly roll-up interval.
Field Type Notes
PDULineReadingsRollupID Integer Unique ID for each reading
PDUID Integer Foreign key reference to PDU
LineNumber Integer Line number on the PDU
InletNumber Integer Inlet number on the PDU
TimeTimestamp withTimezone
Local timestamp for the first day of the month over which therollup was calculated
MinimumCurrent Real Lowest current (Amps) reading during rollup interval
MaximumCurrent Real Maximum current (Amps) reading during rollup interval
AverageCurrent Real Average current (Amps) reading during rollup interval
MinimumUnutilizedCapacity Real Lowest unutilized capacity (Amps) during rollup interval
MaximumUnutilizedCapacity Real Maximum unutilized capacity (Amps) during rollup interval

849
Field Type Notes
AverageUnutilizedCapacity Real Average unutilized capacity (Amps) during rollup interval
PDUCircuitReadingMonthlyRollups
Field Type Notes
PDUCircuitReadingMonthlyRollupsID Big Integer Unique ID for each reading
PDUID Integer Foreign key reference to PDUs table
PDUCircuitID Integer Foreign key reference to the PDUCircuits table
Timetimestamp withtime zone
Timestamp when rollup was created
Yeardoubleprecision
Year when rollup was created
Monthdouble pre-cision
Month when rollup was created
Voltage Real Average voltage reading during rollup interval
MinVoltage Real Minimum voltage reading during rollup interval
MaxVoltage Real Maximum voltage reading during rollup interval
Current Real Average current reading (Amps) during rollup interval
MinCurrent Real Minimum current reading (Amps) during rollup interval
MaxCurrent Real Maximum current reading (Amps) during rollup interval
UnutilizedCapacity RealAverage unutilized capacity (rated amps minus cur-rent) reading during rollup interval
MinUnutilizedCapacity RealMinimum unutilized capacity (rated amps minus cur-rent) reading during rollup interval

850
Field Type Notes
MaxUnutilizedCapacity RealMaximum unutilized capacity (rated amps minus cur-rent) reading during rollup interval
PowerFactor Real Average Power factor reading during rollup interval
MinPowerFactor Real Minimum power factor reading during rollup interval
MaxPowerFactor Real Maximum power factor reading during rollup interval
ActivePower RealAverage active power (Watts) reading during rollupinterval
MinActivePower RealMinimum active power (Watts) reading during rollupinterval
MaxActivePower RealMaximum active power (Watts) reading during rollupinterval
ApparentPower RealAverage apparent power (VA) reading during rollupinterval
MinApparentPower RealMinimum apparent power (VA) reading during rollupinterval
MaxApparentPower RealMaximum apparent power (VA) reading during rollupinterval
VoltAmpHour RealMaximum of the cumulative volt-amp-hour meter read-ings over the rollup interval
WattHour RealMaximum of the cumulative watt-hour meter readingsover the rollup interval
PDUCircuitReadingHourlyRollups
Field Type Notes
PDUCircuitReadingHourlyRollupsID Big Integer Unique ID for each reading

851
Field Type Notes
PDUID Integer Foreign key reference to PDUs table
PDUCircuitID Integer Foreign key reference to the PDUCircuits table
Timetimestamp withtime zone
Timestamp when rollup was created
Voltage Real Average voltage reading during rollup interval
MinVoltage Real Minimum voltage reading during rollup interval
MaxVoltage Real Maximum voltage reading during rollup interval
Current Real Average current reading (Amps) during rollup interval
MinCurrent Real Minimum current reading (Amps) during rollup interval
MaxCurrent Real Maximum current reading (Amps) during rollup interval
UnutilizedCapacity RealAverage unutilized capacity (rated amps minus current)reading during rollup interval
MinUnutilizedCapacity RealMinimum unutilized capacity (rated amps minus cur-rent) reading during rollup interval
MaxUnutilizedCapacity RealMaximum unutilized capacity (rated amps minus cur-rent) reading during rollup interval
PowerFactor Real Average Power factor reading during rollup interval
MinPowerFactor Real Minimum power factor reading during rollup interval
MaxPowerFactor Real Maximum power factor reading during rollup interval
ActivePower RealAverage active power (Watts) reading during rollup inter-val
MinActivePower RealMinimum active power (Watts) reading during rollupinterval
MaxActivePower RealMaximum active power (Watts) reading during rollupinterval

852
Field Type Notes
ApparentPower RealAverage apparent power (VA) reading during rollup inter-val
MinApparentPower RealMinimum apparent power (VA) reading during rollupinterval
MaxApparentPower RealMaximum apparent power (VA) reading during rollupinterval
VoltAmpHour RealMaximum of the cumulative volt-amp-hour meter read-ings over the rollup interval
WattHour RealMaximum of the cumulative watt-hour meter readingsover the rollup interval
PDUCircuitPoleReadingDailyRollups
Field Type Notes
PDUCircuitPoleReadingDailyRollupsID Big Integer Unique ID for each reading
PDUCircuitPoleID Integer Circuit pole number on the PDU
PDUID Integer Foreign key reference to PDUs table
Timetimestamp withtime zone
Timestamp when rollup was created
Date date Date when rollup was created
Voltage Real Average voltage reading during rollup interval
MinVoltage Real Minimum voltage reading during rollup interval
MaxVoltage Real Maximum voltage reading during rollup interval
Current Real Average current reading (Amps) during rollup interval
MinCurrent RealMinimum current reading (Amps) during rollup inter-val

853
Field Type Notes
MaxCurrent RealMaximum current reading (Amps) during rollup inter-val
UnutilizedCapacity RealAverage unutilized capacity (rated amps minus cur-rent) reading during rollup interval
MinUnutilizedCapacity RealMinimum unutilized capacity (rated amps minus cur-rent) reading during rollup interval
MaxUnutilizedCapacity RealMaximum unutilized capacity (rated amps minus cur-rent) reading during rollup interval
PDUCircuitPoleReadingMonthlyRollups
Field Type Notes
PDUCircuitPoleReadingMonthlyRollupsID Big Integer Unique ID for each reading
PDUCircuitPoleID Integer Circuit pole number on the PDU
PDUID Integer Foreign key reference to PDUs table
Timetimestamp withtime zone
Timestamp when rollup was created
Yeardouble pre-cision
Year when rollup was created
Monthdouble pre-cision
Month when rollup was created
Voltage Real Average voltage reading during rollup interval
MinVoltage Real Minimum voltage reading during rollup interval
MaxVoltage Real Maximum voltage reading during rollup interval
Current RealAverage current reading (Amps) during rollup inter-val

854
Field Type Notes
MinCurrent RealMinimum current reading (Amps) during rollupinterval
MaxCurrent RealMaximum current reading (Amps) during rollupinterval
UnutilizedCapacity RealAverage unutilized capacity (rated amps minus cur-rent) reading during rollup interval
MinUnutilizedCapacity RealMinimum unutilized capacity (rated amps minuscurrent) reading during rollup interval
MaxUnutilizedCapacity RealMaximum unutilized capacity (rated amps minuscurrent) reading during rollup interval
PDUCircuitPoleReadingHourlyRollups
Field Type Notes
PDUCircuitPoleReadingHourlyRollupsID Big Integer Unique ID for each reading
PDUCircuitPoleID Integer Circuit pole number on the PDU
PDUID Integer Foreign key reference to PDUs table
Timetimestamp withtime zone
Timestamp when rollup was created
Voltage Real Average voltage reading during rollup interval
MinVoltage Real Minimum voltage reading during rollup interval
MaxVoltage Real Maximum voltage reading during rollup interval
Current RealAverage current reading (Amps) during rollup inter-val
MinCurrent RealMinimum current reading (Amps) during rollup inter-val

855
Field Type Notes
MaxCurrent RealMaximum current reading (Amps) during rollup inter-val
UnutilizedCapacity RealAverage unutilized capacity (rated amps minus cur-rent) reading during rollup interval
MinUnutilizedCapacity RealMinimum unutilized capacity (rated amps minus cur-rent) reading during rollup interval
MaxUnutilizedCapacity RealMaximum unutilized capacity (rated amps minuscurrent) reading during rollup interval
PDUCircuitReadingDailyRollups
Field Type Notes
PDUCircuitReadingDailyRollupsID Big Integer
PDUID Integer Foreign key reference to PDUs table
PDUCircuitID Integer Foreign key reference to the PDUCircuits table
Timetimestamp withtime zone
Timestamp when rollup was created
Date date Date when rollup was created
Voltage Real Average voltage reading during rollup interval
MinVoltage Real Minimum voltage reading during rollup interval
MaxVoltage Real Maximum voltage reading during rollup interval
Current Real Average current reading (Amps) during rollup interval
MinCurrent Real Minimum current reading (Amps) during rollup interval
MaxCurrent Real Maximum current reading (Amps) during rollup interval

856
Field Type Notes
UnutilizedCapacity RealAverage unutilized capacity (rated amps minus current)reading during rollup interval
MinUnutilizedCapacity RealMinimum unutilized capacity (rated amps minus current)reading during rollup interval
MaxUnutilizedCapacity RealMaximum unutilized capacity (rated amps minus cur-rent) reading during rollup interval
PowerFactor Real Average Power factor reading during rollup interval
MinPowerFactor Real Minimum power factor reading during rollup interval
MaxPowerFactor Real Maximum power factor reading during rollup interval
ActivePower RealAverage active power (Watts) reading during rollup inter-val
MinActivePower RealMinimum active power (Watts) reading during rollup inter-val
MaxActivePower RealMaximum active power (Watts) reading during rollupinterval
ApparentPower RealAverage apparent power (VA) reading during rollup inter-val
MinApparentPower RealMinimum apparent power (VA) reading during rollup inter-val
MaxApparentPower RealMaximum apparent power (VA) reading during rollupinterval
VoltAmpHour RealMaximum of the cumulative volt-amp-hour meter read-ings over the rollup interval
WattHour RealMaximum of the cumulative watt-hour meter readingsover the rollup interval

857
PDUCircuitPoleReadingMonthlyRollups
Field Type Notes
PDUCircuitPoleReadingMonthlyRollupsID Big Integer Unique ID for each reading
PDUCircuitPoleID Integer Circuit pole number on the PDU
PDUID Integer Foreign key reference to PDUs table
Timetimestamp withtime zone
Timestamp when rollup was created
Yeardouble pre-cision
Year when rollup was created
Monthdouble pre-cision
Month when rollup was created
Voltage Real Average voltage reading during rollup interval
MinVoltage Real Minimum voltage reading during rollup interval
MaxVoltage Real Maximum voltage reading during rollup interval
Current RealAverage current reading (Amps) during rollup inter-val
MinCurrent RealMinimum current reading (Amps) during rollupinterval
MaxCurrent RealMaximum current reading (Amps) during rollupinterval
UnutilizedCapacity RealAverage unutilized capacity (rated amps minus cur-rent) reading during rollup interval
MinUnutilizedCapacity RealMinimum unutilized capacity (rated amps minuscurrent) reading during rollup interval
MaxUnutilizedCapacity RealMaximum unutilized capacity (rated amps minuscurrent) reading during rollup interval

858
PDUCircuitBreakerReadingsRollup - To Be Deprecated
Note: This table will be deprecated soon. It is recommended to stop using it, and use the new PDUCir-cuitBreakerReadingsHourlyRollup, PDUCircuitBreakerReadingDailyRollups, and PDUCir-cuitBreakerReadingMonthlyRollups tables. If you experience any performance issues, move to the new tables.
The PDUCircuitBreakerReadingsRollup view summarizes the circuit breaker readings power data over the roll-up interval.Hourly roll-ups are rolled up once a day. Daily roll-ups are rolled up once a month. When data is rolled up, shorter intervalroll-up entries in the PDUCircuitBreakerReadingsRollup view are purged.
Field Type Notes
PDUCircuitBreakerReadingsRollupID Integer Non-unique ID for each reading
PDUID Integer Foreign key reference to PDU
CircuitBreakerNumber Integer Circuit breaker number on the PDU
CircuitBreakerID IntegerForeign key reference to PDUCircuitBreakerstable
RollupInterval Integer
1: one hour
2: one day
3: one month
TimeTimestamp withTimezone
Timestamp when rollup was created
MinimumCurrent RealLowest current (Amps) reading during rollup inter-val
MaximumCurrent RealMaximum current (Amps) reading during rollupinterval
AverageCurrent RealAverage current (Amps) reading during rollupinterval
MinimumUnutilizedCapacity RealLowest unutilized capacity (Amps) during rollupinterval
MaximumUnutilizedCapacity RealMaximum unutilized capacity (Amps) during rol-lup interval

859
Field Type Notes
AverageUnutilizedCapacity RealAverage unutilized capacity (Amps) during rollupinterval
PDUCircuitBreakerReadingHourlyRollups
The PDUCircuitBreakerReadingHourlyRollup view summarizes the circuit breaker readings power data over the hourlyroll-up interval.
Field Type Notes
PDUCircuitBreakerReadingsRollupID Integer Unique ID for each reading
PDUID Integer Foreign key reference to PDU
CircuitBreakerNumber Integer Circuit breaker number on the PDU
CircuitBreakerID IntegerForeign key reference to PDUCircuitBreakerstable
TimeTimestamp withTimezone
Timestamp when rollup was created
MinimumCurrent RealLowest current (Amps) reading during rollup inter-val
MaximumCurrent RealMaximum current (Amps) reading during rollupinterval
AverageCurrent RealAverage current (Amps) reading during rollupinterval
MinimumUnutilizedCapacity RealLowest unutilized capacity (Amps) during rollupinterval
MaximumUnutilizedCapacity RealMaximum unutilized capacity (Amps) during rol-lup interval
AverageUnutilizedCapacity RealAverage unutilized capacity (Amps) during rollupinterval

860
PDUCircuitBreakerReadingDailyRollups
The PDUCircuitBreakerReadingsDailyRollup view summarizes the circuit breaker readings power data over the daily roll-up interval.
Field Type Notes
PDUCircuitBreakerReadingsRollupID Integer Unique ID for each reading
PDUID Integer Foreign key reference to PDU
CircuitBreakerNumber Integer Circuit breaker number on the PDU
CircuitBreakerID IntegerForeign key reference to PDUCircuitBreakerstable
TimeTimestamp withTimezone
Timestamp when rollup was created
MinimumCurrent RealLowest current (Amps) reading during rollup inter-val
MaximumCurrent RealMaximum current (Amps) reading during rollupinterval
AverageCurrent RealAverage current (Amps) reading during rollupinterval
MinimumUnutilizedCapacity RealLowest unutilized capacity (Amps) during rollupinterval
MaximumUnutilizedCapacity RealMaximum unutilized capacity (Amps) during rol-lup interval
AverageUnutilizedCapacity RealAverage unutilized capacity (Amps) during rollupinterval

861
PDUCircuitBreakerReadingMonthlyRollups
The PDUCircuitBreakerReadingsMonthlyRollup view summarizes the circuit breaker readings power data over themonthly roll-up interval.
Field Type Notes
PDUCircuitBreakerReadingsRollupID Integer Unique ID for each reading
PDUID Integer Foreign key reference to PDU
CircuitBreakerNumber Integer Circuit breaker number on the PDU
CircuitBreakerID Integer Foreign key reference to PDUCircuitBreakers table
TimeTimestamp withTimezone
Local timestamp for the first day of the month overwhich the rollup was calculated
MinimumCurrent Real Lowest current (Amps) reading during rollup interval
MaximumCurrent RealMaximum current (Amps) reading during rollup inter-val
AverageCurrent Real Average current (Amps) reading during rollup interval
MinimumUnutilizedCapacity RealLowest unutilized capacity (Amps) during rollup inter-val
MaximumUnutilizedCapacity RealMaximum unutilized capacity (Amps) during rollupinterval
AverageUnutilizedCapacity RealAverage unutilized capacity (Amps) during rollup inter-val
PDUSensorReadingsRollup - To Be Deprecated
Note: This table will be deprecated soon. It is recommended to stop using it, and use the new PDUSensorRead-ingsHourlyRollups, PDUSensorReadingsDailyRollups, and PDUSensorReadingsMonthlyRollups tables. If you experienceany performance issues, move to the new tables.

862
The PDUSensorReadingsRollup view summarizes the sensor readings power data over the roll-up interval. Hourly roll-upsare rolled up once a day. Daily roll-ups are rolled up once a month. When data is rolled up, shorter interval roll-up entries inthe PDUSensorReadingsRollup view are purged.
Field Type Notes
PDUSensorReadingsRollupID Integer Non-unique ID for each reading
SensorID Integer Database ID of the sensor as seen in PDUSensors
RollupInterval Integer
1: one hour
2: one day
3: one month
Time Timestamp with Timezone Timestamp when rollup was created
MinimumValue Real Lowest sensor reading during rollup interval
MaximumValue Real Maximum sensor reading during rollup interval
AverageValue Real Average sensor reading during rollup interval
PDUSensorReadingHourlyRollup
The PDUSensorReadingsHourlyRollup view summarizes the sensor readings power data over the roll-up interval. Hourlyroll-ups are rolled up once a day. Daily roll-ups are rolled up once a month. When data is rolled up, shorter interval roll-upentries in the PDUSensorReadingsRollup view are purged.
Field Type Notes
PDUSensorReadingsRollupID Integer Unique ID for each reading
SensorID Integer Database ID of the sensor as seen in PDUSensors
Time Timestamp with Timezone Timestamp when rollup was created
MinimumValue Real Lowest sensor reading during rollup interval
MaximumValue Real Maximum sensor reading during rollup interval
AverageValue Real Average sensor reading during rollup interval

863
PDUSensorReadingDailyRollup
The PDUSensorReadingsDailyRollup view summarizes the sensor readings power data over the roll-up interval. Hourlyroll-ups are rolled up once a day. Daily roll-ups are rolled up once a month. When data is rolled up, shorter interval roll-upentries in the PDUSensorReadingsRollup view are purged.
Field Type Notes
PDUSensorReadingsRollupID Integer Unique ID for each reading
SensorID Integer Database ID of the sensor as seen in PDUSensors
Time Timestamp with Timezone Timestamp when rollup was created
MinimumValue Real Lowest sensor reading during rollup interval
MaximumValue Real Maximum sensor reading during rollup interval
AverageValue Real Average sensor reading during rollup interval
PDUSensorReadingMonthlyRollup
The PDUSensorReadingsMonthlyRollup view summarizes the sensor readings power data over the roll-up interval. Hourlyroll-ups are rolled up once a day. Daily roll-ups are rolled up once a month. When data is rolled up, shorter interval roll-upentries in the PDUSensorReadingsRollup view are purged.
Field Type Notes
PDUSensorReadingsRollupID Integer Unique ID for each reading
SensorID Integer Database ID of the sensor as seen in PDUSensors
TimeTimestamp withTimezone
Local timestamp for the first day of the month over whichthe rollup was calculated
MinimumValue Real Lowest sensor reading during rollup interval
MaximumValue Real Maximum sensor reading during rollup interval
AverageValue Real Average sensor reading during rollup interval

864
PDUSensors
The PDUSensors view contains information about sensors attached to PDUs that Power IQ manages.
Field Type Notes
SensorID Integer Auto-generated ID
PDUID Integer Foreign key reference to PDUs table
PDUSensorID Integer ID of the sensor on the PDU, as gathered from the pdu
SensorNumber Integer Sensor number on the PDU
AttributeName VarChar(64) Type of sensor
Label VarChar(255) Sensor's label as gathered from the PDU
Removed VarChar(64) When the sensor was removed from the system, or null for current sensors
Position VarChar(10) Sensor position on the PDU: inlet, outlet or outside air
PDUTransferSwitchStates
This view represents the state of a Transfer Switch at a particular moment in time, normally recorded when the state of theswitch has changed.
Field Type Notes
PDUTransferSwitchStatesID BigInt The primary key for this view
PDUTransferSwitchesID Integer Foreign key reference to the PDUTransferSwitches view.
ActivePDUInletNumber VarChar(32) The ordinal of the active inlet.
OperatingStatus VarChar(32)A string representing the operating status reported by thePDU's MIB.
TimeTimestamp withTimezone
Local timestamp

865
PDUTransferSwitches
This view represents the physical transfer switch inside of a PDU of type ‘Rack Transfer Switch’.
Field Type Notes
PDUTransferSwitchesID Integer The primary key for this view
PDUID Integer Foreign key reference to the PDUs view.
CreatedAtTimestamp withTimezone
The date and time that the Transfer Switch was added to thesystem.
UpdatedAtTimestamp withTimezone
The date and time this Transfer Switch was last updated.

866
PDUs
The PDUs view contains information about the PDU device.
Field Type Notes
ID Integer Unique PDU number
CaptionVarChar(64)
PDU Name
Description TEXT MIB II SysDescr
IPAddress inet IP Address
PDUTypeVarChar(64)
Rack PDU or facility items
ProxyIndex IntegerSubtending unit ID applicable only to daisy-chained andconsole server connected PDU units
NameFormatVarChar(64)
ModelName TEXT PDU Model
Manufacturer TEXT PDU Manufacturer
Location TEXT MIB II SysLocation
ContactVarChar(256)
Contact name
PDUName TEXT PDU Name
Firmware TEXT PDU Firmware version
Serial Number TEXT PDU Serial Number
CurrentStatus TEXT PDU overall health status: Good, Warning, or Critical
EventHealth TEXTPDU active events health status: Good, Warning, or Crit-ical
ConnectivityHealth TEXT PDU connectivity health status: OK, LostComm,

Field Type Notes
NoContact, NoPlugin, and others.
PrimaryOwnerNameVarChar(64)
Owner name
PrimaryOwnerContactVarChar(256)
MIB II SysContact
InletTemperature FloatTemperature at the inlet of the PDU. Latest reading inCelsius from the first temperature sensor attached tothe PDU
External Key TEXTAn external key, such as asset tag number, associatedwith the PDU.
Custom Field 1 TEXT A custom field for the user to specify.
Custom Field 2 TEXT A custom field for the user to specify.
Current FloatLatest line current reading for the PDU, or the maximumof the line currents for three-phase PDUs
RatedVoltage TEXT The PDU's rated voltage.
RatedAmps TEXT The PDU's rated current.
RatedVoltAmps TEXT The PDU's rated volt-amps.
DefaultAssetStripConnectedLEDColor VarChar The color of the LED in hex when asset is connected.
DefaultAssetStripDisconnectedLEDColor VarChar The color of the LED in hex when asset is disconnected.
PDUOutlets
The PDUOutlets view shows the outlets associated with a PDU.
Field Type Notes
PDUOutletsID Integer Unique outlet number
PDUID Integer Foreign key reference to PDUs table
867

868
Field Type Notes
OutletID Integer PDU outlet number
OutletName VarChar(64) Outlet name
OutletState VarChar(64) Outlet state
ITDeviceID Integer Associated IT Device ID foreign key
PDUOutletNumber Integer PDU outlet number
OutletRatedAmps Integer The rated amps of the outlet
PDUCircuitPoles
Field Type Notes
PDUCircuitPoleID Integer Unique circuit pole ID
PDUCircuitID Integer Foreign key reference to PDUCircuits table
PDUPanelID Integer Foreign key reference to PDUPanels table
PDUID Integer Foreign key reference to PDUs table
CircuitPoleOrdinal Integer The circuit pole's number
Phase VarChar(64) The circuit pole's phase
PDUCircuits
Field Type Notes
PDUCircuitID Integer Unique circuit ID
PDUID Integer Foreign key reference to PDUs table
PDUPanelID Integer Foreign key reference to the PDUPanels table
CircuitOrdinal Integer Circuit number on the PDU

Field Type Notes
CircuitName VarChar (64) Name of the circuit
RatedAmps Integer Rated amps of the circuit
PDUCircuitBreakers
The PDUCircuitBreakers view shows the circuit breakers associated with a PDU.
Field Type Notes
PDUCircuitBreakersID Integer Unique CB Number
PDUID Integer Foreign key reference to PDUs table
CircuitBreakerOrdinal Integer Circuit breaker number on the PDU
CircuitBreakerState Integer 0 (closed) 1 (open) 3 (unknown)
CircuitBreakerLabel VarChar(64) Label assigned to a CB
CircuitBreakerRating Integer The rated amps of the circuit breaker in amps
CircuitBreakerRatedAmps Integer The rated amps of the circuit breaker in amps
PDULines
Field Type Notes
PDULinesID Integer Primary key for the table.
PDUInletsID Integer Foreign key reference to PDUInlets table
PDUID Integer Foreign key reference to PDUs table
LineNumber Integer The inlet line number on the PDU
869

870
PDUInlets
Field Type Notes
PDUInletsID Integer Primary key for the PDUInlets table.
PDUID Integer Foreign key reference to PDUs table
InletNumber Integer The number of the inlet on the PDU.
InletRatedAmps Integer The rated amps on the inlet.
PDUPanelID Integer Foreign key reference to PDUPanels
Source Boolean Whether main inlet
PDUPanels
Field Type Notes
PDUPanelID Integer Unique ID for each panel
PDUID Integer Foreign key reference to PDUs table
PanelOrdinal Integer The panel's number on the floor PDU.
PanelName VarChar (255) The panel's name, only for floor PDU panels, not standalone power panels.
PDUReadings
Note: This table will be deprecated soon. It is recommended to stop using it, and use the new PDUInletReadings table.See PDUInletReadings (on page 1).
The PDUReadings view shows the raw power data collected from PDUs. A data record is added for each PDU polled. Thisdata is summarized hourly in a PDUReadingsRollup view, and the readings in this view are purged.
Field Type Notes
PDUReadingsID Integer Unique ID for each reading

Field Type Notes
PDUID Integer Foreign key reference to PDU
TimeTimestamp withTimezone
Local timestamp
ActivePower Real Active power drawn by PDU
ApparentPower Real Apparent power drawn by PDU
WattHour RealCumulative watt-hours consumed by the PDU, if available for thePDU
MaxActivePower Real Maximum active power drawn by PDU
MinActivePower Real Minimum active power drawn by PDU
MaxApparentPower Real Maximum apparent power drawn by PDU
MinApparentPower Real Minimum apparent power drawn by PDU
PDUInletReadings
A PDU can have multiple inlets. To get a total reading for the PDU, you must to request the values for all inlets on a PDU.
Field Type Notes
PDUInletReadingsID bigint Unique ID for each reading
PDUID Integer Foreign key reference to PDUs table
InletID Integer Foreign key reference to PDUInlets table
InletNumber Integer Inlet number on the PDU
Timetimestamp withtime zone
Local timestamp
Voltage Real Voltage at the inlet
MinVoltage RealMinimum voltage reading over the sample period. Applies to deviceswith data buffering enabled.
871

872
Field Type Notes
MaxVoltage RealMaximum voltage reading over the sample period. Applies to deviceswith data buffering enabled.
Current Real Current (Amps) drawn by the inlet
MinCurrent RealMinimum current (Amps) reading over the sample period. Applies todevices with data buffering enabled.
MaxCurrent RealMaximum current (Amps) reading over the sample period (applies todevices with data buffering enabled.
PowerFactor Real Power factor of the inlet
MinPowerFactor RealMinimum power factor reading over the sample period. Applies todevices with data buffering enabled)
MaxPowerFactor RealMaximum power factor reading over the sample period. Applies todevices with data buffering enabled.
ActivePower Real Active power (Watts) drawn by the inlet
MinActivePower RealMinimum active power (Watts) reading over the sample period. Appliesto devices with data buffering enabled.
MaxActivePower RealMaximum active power (Watts) reading over the sample period. Appliesto devices with data buffering enabled.
ApparentPower Real Apparent power (VA) drawn by the inlet
MinApparentPower RealMinimum apparent power (VA) reading over the sample period (appliesto devices with data buffering enabled)
MaxApparentPower RealMaximum apparent power (VA) reading over the sample period. Appliesto devices with data buffering enabled.
VoltAmpHours RealCumulative volt-amp-hours consumed by the inlet, if available for thePDU
WattHours Real Cumulative watt-hours consumed by the inlet, if available for the PDU

PDUInletReadingHourlyRollups
Field Type Notes
PDUInletReadingsRollupID Bigint Primary key for the table
PDUID Integer Foreign key reference to PDUs table
InletID Integer Foreign key reference to PDUInlets table
InletNumber Integer The number of the inlet on the PDU.
Time Timestamp Local timestamp
Voltage Real Average voltage reading during rollup interval
MinVoltage Real Minimum voltage reading during rollup interval
MaxVoltage Real Maximum voltage reading during rollup interval
Current Real Average current reading (Amps) during rollup interval
MinCurrent Real Minimum current reading (Amps) during rollup interval
MaxCurrent Real Maximum current reading (Amps) during rollup interval
PowerFactor Real Average Power factor reading during rollup interval
MinPowerFactor Real Minimum power factor reading during rollup interval
MaxPowerFactor Real Maximum power factor reading during rollup interval
ActivePower Real Average active power (Watts) reading during rollup interval
MinActivePower Real Minimum active power (Watts) reading during rollup interval
MaxActivePower Real Maximum active power (Watts) reading during rollup interval
ApparentPower Real Average apparent power (VA) reading during rollup interval
MinApparentPower Real Minimum apparent power (VA) reading during rollup interval
873

874
Field Type Notes
MaxApparentPower Real Maximum apparent power (VA) reading during rollup interval
MaxUnutilizedCapacity RealMaximum unutilized capacity (rated amps minus current) readingduring rollup interval
MinUnutilizedCapacity RealMinimum unutilized capacity (rated amps minus current) readingduring rollup interval
UnutilizedCapacity RealAverage unutilized capacity (rated amps minus current) readingduring rollup interval
VoltAmpHours RealMaximum of the cumulative volt-amp-hour meter readings over therollup interval
WattHours RealMaximum of the cumulative watt-hour meter readings over the rol-lup interval
PDUInletReadingDailyRollups
Field Type Notes
PDUInletReadingsRollupID Bigint Primary key for the table
PDUID Integer Foreign key reference to PDUs table
InletID Integer Foreign key reference to PDUInlets table
InletNumber Integer The number of the inlet on the PDU.
Time Timestamp Local timestamp
Voltage Real Average voltage reading during rollup interval
MinVoltage Real Minimum voltage reading during rollup interval
MaxVoltage Real Maximum voltage reading during rollup interval
Current Real Average current reading (Amps) during rollup interval

Field Type Notes
MinCurrent Real Minimum current reading (Amps) during rollup interval
MaxCurrent Real Maximum current reading (Amps) during rollup interval
PowerFactor Real Average Power factor reading during rollup interval
MinPowerFactor Real Minimum power factor reading during rollup interval
MaxPowerFactor Real Maximum power factor reading during rollup interval
ActivePower Real Average active power (Watts) reading during rollup interval
MinActivePower Real Minimum active power (Watts) reading during rollup interval
MaxActivePower Real Maximum active power (Watts) reading during rollup interval
ApparentPower Real Average apparent power (VA) reading during rollup interval
MinApparentPower Real Minimum apparent power (VA) reading during rollup interval
MaxApparentPower Real Maximum apparent power (VA) reading during rollup interval
VoltAmpHours RealMaximum of the cumulative volt-amp-hour meter readings over therollup interval
WattHours RealMaximum of the cumulative watt-hour meter readings over the rol-lup interval
PDUInletReadingMonthlyRollups
Field Type Notes
PDUInletReadingsRollupID Bigint Unique ID for each reading
PDUID Integer Foreign key reference to PDUs table
InletID Integer Foreign key reference to PDUInlets table
InletNumber Integer Inlet number on the PDU
875

876
Field Type Notes
Time TimestampLocal timestamp for the first day of the month over which the rollupwas calculated.
Voltage Real Average voltage reading during rollup interval
MinVoltage Real Minimum voltage reading during rollup interval
MaxVoltage Real Maximum voltage reading during rollup interval
Current Real Average current reading (Amps) during rollup interval
MinCurrent Real Minimum current reading (Amps) during rollup interval
MaxCurrent Real Maximum current reading (Amps) during rollup interval
PowerFactor Real Average Power factor reading during rollup interval
MinPowerFactor Real Minimum power factor reading during rollup interval
MaxPowerFactor Real Maximum power factor reading during rollup interval
ActivePower Real Active power drawn by the inlet in Watts
MinActivePower Real Minimum active power (Watts) reading during rollup interval
MaxActivePower Real Maximum active power (Watts) reading during rollup interval
ApparentPower Real Apparent power (VA) drawn by the inlet
MinApparentPower Real Minimum apparent power (VA) reading during rollup interval
MaxApparentPower Real Maximum apparent power (VA) reading during rollup interval
VoltAmpHours RealCumulative volt-amp-hours consumed by the inlet, if available forthe PDU
WattHours RealCumulative watt-hours consumed by the inlet, if available for thePDU

PDUOutletReadings
The PDUOutletReadings view shows the raw power data collected from PDU outlets. A data record is added for each out-let polled. This data is summarized hourly in a PDUOutletReadingsRollup view, and the outlet records in this view arepurged.
Field Type Notes
PDUOutletReadingsID Integer Unique ID for each reading
PDUID Integer Foreign key reference to PDUs table
OutletID Integer Foreign key reference to PDUOutlets table
OutletNumber Integer PDU outlet number
TimeTimestamp withTimezone
Local timestamp
CurrentAmps Real Amps drawn by the outlet
ActivePower Real Active power drawn by the outlet
ApparentPower Real Apparent power drawn by the outlet
WattHour RealCumulative watt-hours consumed by the outlet, if available forthe PDU
MaxCurrentAmps Real Maximum amps drawn by the outlet
MinCurrentAmps Real Minimum amps drawn by the outlet
MaxActivePower Real Maximum active power drawn by the outlet
MinActivePower Real Minimum amps drawn by the outlet
MaxApparentPower Real Maximum apparent power drawn by the outlet
MinApparentPower Real Minimum apparent power drawn by the outlet
Voltage Real Voltage drawn by the outlet
MinVoltage Real Minimum voltage reading
MaxVoltage Real Maximum voltage reading
877

878
Field Type Notes
PowerFactor Real Power factor of the outlet
MinPowerFactor Real Minimum power factor
MaxPowerFactor Real Maximum power factor
VoltAmpHours RealCumulative volt-amp-hours consumed by the outlet, if availablefor the PDU
PDULineReadings
The PDULineReadings view shows the power data collected from PDU current-carrying lines. A data record is added foreach line polled. Single-phase PDUs have 1 line. Three-phase PDUs have 3 lines. This data is summarized hourly in aPDULineReadingsRollup view, and the line readings in this view are purged.
Field Type Notes
PDULineReadingsID Integer Unique ID for each reading
PDUID Integer Foreign Key Reference To PDUs table
InletNumber Integer Inlet number on the PDU
LineNumber Integer Line number on this PDU
TimeTimestamp withTimezone
Local timestamp
CurrentAmps Real Amps drawn on this line
UnutilizedCapacity Real Available amps remaining on this line
MaxCurrentAmps Real Maximum amps drawn on this line
MinCurrentAmps Real Minimum amps drawn on this line
Voltage Real Voltage for the line
MinVoltage RealMinimum voltage reading over the sample period. Applies to deviceswith data buffering enabled.

Field Type Notes
MaxVoltage RealMaximum voltage reading over the sample period. Applies to deviceswith data buffering enabled.
PDUCircuitReadings
Field Type Notes
PDUCircuitReadingsID Big Integer Unique circuit number
PDUID Integer Foreign key reference to PDUs table
PDUCircuitID Integer Circuit number on the PDU
Time timestamp with time zone Local timestamp
Voltage Real Voltage drawn by the circuit
MinVoltage Real Minimum voltage reading
MaxVoltage Real Maximum voltage reading
Current Real Amps drawn by the circuit
MinCurrent Real Minimum amps drawn by the circuit
MaxCurrent Real Maximum amps drawn by the circuit
UnutilizedCapacity Real Available amps remaining on this circuit
MinUnutilizedCapacity Real Minimum amps remaining on this circuit
MaxUnutilizedCapacity Real Maximum amps remaining on this circuit
PowerFactor Real Power factor of the circuit
MinPowerFactor Real Minimum power factor
MaxPowerFactor Real Maximum power factor
ActivePower Real Active power drawn by the circuit
879

880
Field Type Notes
MinActivePower Real Minimum active power drawn by the circuit
MaxActivePower Real Maximum active power drawn by the circuit
ApparentPower Real Apparent power drawn by the circuit
MinApparentPower Real Minimum apparent power drawn by the circuit
MaxApparentPower Real Maximum apparent power drawn by the circuit
VoltAmpHour Real Cumulative volt-amp-hours consumed by the circuit
WattHour Real Cumulative watt-hours consumed by the circuit
PDUCircuitPoleReadings
Field Type Notes
PDUCircuitPoleReadingsID Big Integer Unique circuit pole number
PDUCircuitPoleID Integer Circuit pole number on the PDU
PDUID Integer Foreign key reference to PDUs table
Time timestamp with time zone Local timestamp
Voltage Real Voltage drawn by the circuit pole
MinVoltage Real Minimum voltage reading
MaxVoltage Real Maximum voltage reading
Current Real Amps drawn by the circuit pole
MinCurrent Real Minimum amps drawn by the circuit pole
MaxCurrent Real Maximum amps drawn by the circuit pole
UnutilizedCapacity Real Available amps remaining on this circuit pole

Field Type Notes
MinUnutilizedCapacity Real Minimum amps remaining on this circuit pole
MaxUnutilizedCapacity Real Maximum amps remaining on this circuit pole
PDUCircuitBreakersReadings
The PDUCircuitBreakerReadings view shows the power data collected from circuit breakers on the PDU. This view doesnot contain any data for PDUs that do not have circuit breakers. A data record is added for each circuit breaker polled. Thisdata is summarized hourly in a PDUCircuitBreakerReadingsRollup view, and the circuit breaker readings in this view arepurged.
Field Type Notes
PDUCircuitBreakerReadingsID Integer Unique ID for each reading
PDUID Integer Foreign key reference to PDUs table
CircuitBreakerNumber Integer Circuit breaker number on the PDU
CircuitBreakerID Integer Foreign key reference to PDUCircuitBreakers table
Time Timestamp with Timezone Local timestamp
CurrentAmps Real Current value in Amps
UnutilizedCapacity Real Available amps remaining on this circuit breaker
MaxCurrentAmps Real Maximum amps drawn on the circuit breaker
MinCurrentAmps Real Minimum amps drawn on the circuit breaker
PDUSensorReadings
The PDUSensorReadings view shows the data collected from PDU sensors. A data record is added for each sensor polled.This data is summarized hourly in a PDUSensorReadingsRollup view and the sensor readings in this view are purged.
Field Type Notes
PDUSensorReadingsID Integer Unique ID for each reading
881

882
Field Type Notes
SensorID Integer Database ID of the sensor as seen in PDUSensors
TimeTimestamp withTimezone
Local timestamp when the reading occurred
Value Real Sensor value
MinimumValue RealMinimum sensor value over the sample period. Applies to deviceswith data buffering enabled.
MaximumValue RealMaximum sensor value over the sample period. Applies to deviceswith data buffering enabled.
PDUOutletReadingsRollup - To Be Deprecated
Note: This table will be deprecated soon. It is recommended to stop using it, and use the new PDUOut-letReadingsHourlyRollup, PDUOutletReadingsDailyRollup, and PDUOutletReadingsMonthlyRollup tables. If you exper-ience any performance issues, move to the new tables.
The PDUOutletReadingsRollup view summarizes the outlet readings power data over the roll-up interval. Hourly roll-upsare rolled up once a day. Daily roll-ups are rolled up once a month. When data is rolled up, shorter interval roll-up entries inthe PDUOutletReadingsRollup view are purged.
Field Type Notes
PDUOutletReadingRollupID Integer Non-unique ID for each reading
PDUID Integer Foreign key reference to PDUs table
OutletID Integer Foreign key reference to PDUOutlets table
OutletNumber Integer Outlet number on the PDU
RollupInterval Integer
1: one hour
2: one day
3: one month
TimeTimestamp withTimezone
Timestamp when rollup was created

Field Type Notes
MinimumCurrent Real Lowest current (Amps) reading during rollup interval
MaximumCurrent Real Maximum current (Amps) reading during rollup interval
AverageCurrent Real Average current (Amps) reading during rollup interval
MinimumActivePower Real Lowest active power (Watts) reading during rollup interval
MaximumActivePower RealMaximum active power (Watts) reading during rollup inter-val
AverageActivePower Real Average active power (Watts) reading during rollup interval
MinimumApparentPower Real Lowest apparent power (VA) reading during rollup interval
MaximumApparentPower Real Maximum apparent power (VA) reading during rollup interval
AverageApparentPower Real Average apparent power (VA) reading during rollup interval
MinimumPowerFactor Real Minimum power factor reading during rollup interval
MaximumPowerFactor Real Maximum power factor reading during rollup interval
AverageActivePower Real Average power factor reading during rollup interval
MinimumVoltage Real Minimum voltage reading during rollup interval
MaximumVoltage Real Maximum voltage reading during rollup interval
AverageVoltage Real Average voltage reading during rollup interval
WattHours RealMaximum of the cumulative watt-hour meter readings overthe rollup interval
PDUOutletReadingHourlyRollups
Field Type Notes
PDUOutletReadingRollupID Integer Unique ID for each reading
883

884
Field Type Notes
PDUID Integer Foreign key reference to PDUs table
OutletID Integer Foreign key reference to PDUOutlets table
OutletNumber Integer Outlet number on the PDU
TimeTimestamp withTimezone
Timestamp when rollup was created
MinimumCurrent Real Lowest current (Amps) reading during rollup interval
MaximumCurrent Real Maximum current (Amps) reading during rollup interval
AverageCurrent Real Average current (Amps) reading during rollup interval
MinimumActivePower Real Lowest active power (Watts) reading during rollup interval
MaximumActivePower Real Maximum active power (Watts) reading during rollup interval
AverageActivePower Real Average active power (Watts) reading during rollup interval
MinimumApparentPower Real Lowest apparent power (VA) reading during rollup interval
MaximumApparentPower Real Maximum apparent power (VA) reading during rollup interval
AverageApparentPower Real Average apparent power (VA) reading during rollup interval
MinimumVoltage Real Minimum voltage reading during rollup interval
MaximumVoltage Real Maximum voltage reading during rollup interval
AverageVoltage Real Average voltage reading during rollup interval
VoltAmpHours RealMaximum of the cumulative volt-amp-hour meter readingsover the rollup interval
WattHours RealMaximum of the cumulative watt-hour meter readings overthe rollup interval
AveragePowerFactor Real Average power factor reading during rollup interval
MinimumPowerFactor Real Minimum power factor reading during rollup interval

Field Type Notes
MaximumPowerFactor Real Maximum power factor reading during rollup interval
PDUOutletReadingDailyRollups
Field Type Notes
PDUOutletReadingRollupID Integer Unique ID for each reading
PDUID Integer Foreign key reference to PDUs table
OutletID Integer Foreign key reference to PDUOutlets table
OutletNumber Integer Outlet number on the PDU
TimeTimestamp withTimezone
Timestamp when rollup was created
MinimumCurrent Real Lowest current (Amps) reading during rollup interval
MaximumCurrent Real Maximum current (Amps) reading during rollup interval
AverageCurrent Real Average current (Amps) reading during rollup interval
MinimumActivePower Real Lowest active power (Watts) reading during rollup interval
MaximumActivePower Real Maximum active power (Watts) reading during rollup interval
AverageActivePower Real Average active power (Watts) reading during rollup interval
MinimumApparentPower Real Lowest apparent power (VA) reading during rollup interval
MaximumApparentPower Real Maximum apparent power (VA) reading during rollup interval
AverageApparentPower Real Average apparent power (VA) reading during rollup interval
MinimumVoltage Real Minimum voltage reading during rollup interval
MaximumVoltage Real Maximum voltage reading during rollup interval
885

886
Field Type Notes
AverageVoltage Real Average voltage reading during rollup interval
VoltAmpHours RealMaximum of the cumulative volt-amp-hour meter readingsover the rollup interval
WattHours RealMaximum of the cumulative watt-hour meter readings overthe rollup interval
AveragePowerFactor Real Average power factor reading during rollup interval
MinimumPowerFactor Real Minimum power factor reading during rollup interval
MaximumPowerFactor Real Maximum power factor reading during rollup interval
PDUOutletReadingMonthlyRollups
Field Type Notes
PDUOutletReadingRollupID Integer Unique ID for each reading
PDUID Integer Foreign key reference to PDUs table
OutletID Integer Foreign key reference to PDUOutlets table
OutletNumber Integer Outlet number on the PDU
TimeTimestamp withTimezone
Local timestamp for the first day of the month over which therollup was calculated
MinimumCurrent Real Lowest current (Amps) reading during rollup interval
MaximumCurrent Real Maximum current (Amps) reading during rollup interval
AverageCurrent Real Average current (Amps) reading during rollup interval
MinimumActivePower Real Lowest active power (Watts) reading during rollup interval
MaximumActivePower Real Maximum active power (Watts) reading during rollup interval

Field Type Notes
AverageActivePower Real Average active power (Watts) reading during rollup interval
MinimumApparentPower Real Lowest apparent power (VA) reading during rollup interval
MaximumApparentPower Real Maximum apparent power (VA) reading during rollup interval
AverageApparentPower Real Average apparent power (VA) reading during rollup interval
MinimumVoltage Real Minimum voltage reading during rollup interval
MaximumVoltage Real Maximum voltage reading during rollup interval
AverageVoltage Real Average voltage reading during rollup interval
VoltAmpHours RealMaximum of the cumulative volt-amp-hour meter readingsover the rollup interval
WattHours RealMaximum of the cumulative watt-hour meter readings overthe rollup interval
AveragePowerFactor Real Average power factor reading during rollup interval
MinimumPowerFactor Real Minimum power factor reading during rollup interval
MaximumPowerFactor Real Maximum power factor reading during rollup interval
PDUReadingsRollup - To Be Deprecated
Note: This table will be deprecated soon. It is recommended to stop using it, and use the new PDUInletReadings tables.
The PDUReadingsRollup view summarizes the PDU readings power data over the roll-up interval. Hourly roll-ups are rolledup once a day. Daily roll-ups are rolled up once a month. When data is rolled up, shorter interval roll-up entries in thePDUReadingsRollup are purged.
Field Type Notes
PDUReadingsRollup Integer Non-unique ID for each reading
PDUID Integer Foreign key reference to PDU
RollupInterval Integer 1: one hour
887

888
Field Type Notes
2: one day
3: one month
TimeTimestamp withTimezone
Timestamp when rollup was created
MinimumActivePower Real Lowest active power (Watts) reading during rollup interval
MaximumActivePower Real Maximum active power (Watts) reading during rollup interval
AverageActivePower Real Average active power (Watts) reading during rollup interval
MinimumApparentPower Real Lowest apparent power (VA) reading during rollup interval
MaximumApparentPower Real Maximum apparent power (VA) reading during rollup interval
AverageApparentPower Real Average apparent power (VA) reading during rollup interval
WattHours RealMaximum of the cumulative watt-hour meter readings overthe rollup interval
PDULineReadingsRollup - To Be Deprecated
Note: This table will be deprecated soon. It is recommended to stop using it, and use the new PDULineRead-ingsHourlyRollup, PDULineReadingsDailyRollup, PDULineReadingsMonthlyRollup tables.
The PDULineReadingsRollup view summarizes the line readings power data over the roll-up interval. Hourly roll-ups arerolled up once a day. Daily roll-ups are rolled up once a month. When data is rolled up, shorter interval roll-up entries in thePDULineReadingsRollup is purged.
Field Type Notes
PDULineReadingsRollupID Integer Non-unique ID for each reading
PDUID Integer Foreign key reference to PDU
LineNumber Integer Line number on the PDU
InletNumber Integer Inlet number on the PDU
RollupInterval Integer 1: one hour

Field Type Notes
2: one day
3: one month
TimeTimestamp withTimezone
Timestamp when rollup was created
MinimumCurrent Real Lowest current (Amps) reading during rollup interval
MaximumCurrent Real Maximum current (Amps) reading during rollup interval
AverageCurrent Real Average current (Amps) reading during rollup interval
MinimumUnutilizedCapacity RealLowest unutilized capacity (Amps) during rollup inter-val
MaximumUnutilizedCapacity RealMaximum unutilized capacity (Amps) during rollupinterval
AverageUnutilizedCapacity RealAverage unutilized capacity (Amps) during rollup inter-val
PDULineReadingHourlyRollups
The PDULineReadingsHourlyRollup view summarizes the line readings power data over the hourly roll-up interval.
Field Type Notes
PDULineReadingsRollupID Integer Unique ID for each reading
PDUID Integer Foreign key reference to PDU
LineNumber Integer Line number on the PDU
InletNumber Integer Inlet number on the PDU
TimeTimestamp withTimezone
Timestamp when rollup was created
MinimumCurrent Real Lowest current (Amps) reading during rollup interval
889

890
Field Type Notes
MaximumCurrent Real Maximum current (Amps) reading during rollup interval
AverageCurrent Real Average current (Amps) reading during rollup interval
MinimumUnutilizedCapacity RealLowest unutilized capacity (Amps) during rollup inter-val
MaximumUnutilizedCapacity RealMaximum unutilized capacity (Amps) during rollupinterval
AverageUnutilizedCapacity RealAverage unutilized capacity (Amps) during rollup inter-val
PDULineReadingDailyRollups
The PDULineReadingsDailyRollup view summarizes the line readings power data over the daily roll-up interval.
Field Type Notes
PDULineReadingsRollupID Integer Unique ID for each reading
PDUID Integer Foreign key reference to PDU
LineNumber Integer Line number on the PDU
InletNumber Integer Inlet number on the PDU
TimeTimestamp withTimezone
Timestamp when rollup was created
MinimumCurrent Real Lowest current (Amps) reading during rollup interval
MaximumCurrent Real Maximum current (Amps) reading during rollup interval
AverageCurrent Real Average current (Amps) reading during rollup interval
MinimumUnutilizedCapacity RealLowest unutilized capacity (Amps) during rollup inter-val
MaximumUnutilizedCapacity RealMaximum unutilized capacity (Amps) during rollupinterval

Field Type Notes
AverageUnutilizedCapacity RealAverage unutilized capacity (Amps) during rollup inter-val
PDULineReadingMonthlyRollups
The PDULineReadingsMonthlyRollup view summarizes the line readings power data over the monthly roll-up interval.
Field Type Notes
PDULineReadingsRollupID Integer Unique ID for each reading
PDUID Integer Foreign key reference to PDU
LineNumber Integer Line number on the PDU
InletNumber Integer Inlet number on the PDU
TimeTimestamp withTimezone
Local timestamp for the first day of the month over which therollup was calculated
MinimumCurrent Real Lowest current (Amps) reading during rollup interval
MaximumCurrent Real Maximum current (Amps) reading during rollup interval
AverageCurrent Real Average current (Amps) reading during rollup interval
MinimumUnutilizedCapacity Real Lowest unutilized capacity (Amps) during rollup interval
MaximumUnutilizedCapacity Real Maximum unutilized capacity (Amps) during rollup interval
AverageUnutilizedCapacity Real Average unutilized capacity (Amps) during rollup interval
PDUCircuitReadingMonthlyRollups
Field Type Notes
PDUCircuitReadingMonthlyRollupsID Big Integer Unique ID for each reading
891

892
Field Type Notes
PDUID Integer Foreign key reference to PDUs table
PDUCircuitID Integer Foreign key reference to the PDUCircuits table
Timetimestamp withtime zone
Timestamp when rollup was created
Yeardoubleprecision
Year when rollup was created
Monthdouble pre-cision
Month when rollup was created
Voltage Real Average voltage reading during rollup interval
MinVoltage Real Minimum voltage reading during rollup interval
MaxVoltage Real Maximum voltage reading during rollup interval
Current Real Average current reading (Amps) during rollup interval
MinCurrent Real Minimum current reading (Amps) during rollup interval
MaxCurrent Real Maximum current reading (Amps) during rollup interval
UnutilizedCapacity RealAverage unutilized capacity (rated amps minus cur-rent) reading during rollup interval
MinUnutilizedCapacity RealMinimum unutilized capacity (rated amps minus cur-rent) reading during rollup interval
MaxUnutilizedCapacity RealMaximum unutilized capacity (rated amps minus cur-rent) reading during rollup interval
PowerFactor Real Average Power factor reading during rollup interval
MinPowerFactor Real Minimum power factor reading during rollup interval
MaxPowerFactor Real Maximum power factor reading during rollup interval
ActivePower RealAverage active power (Watts) reading during rollupinterval

Field Type Notes
MinActivePower RealMinimum active power (Watts) reading during rollupinterval
MaxActivePower RealMaximum active power (Watts) reading during rollupinterval
ApparentPower RealAverage apparent power (VA) reading during rollupinterval
MinApparentPower RealMinimum apparent power (VA) reading during rollupinterval
MaxApparentPower RealMaximum apparent power (VA) reading during rollupinterval
VoltAmpHour RealMaximum of the cumulative volt-amp-hour meter read-ings over the rollup interval
WattHour RealMaximum of the cumulative watt-hour meter readingsover the rollup interval
PDUCircuitReadingHourlyRollups
Field Type Notes
PDUCircuitReadingHourlyRollupsID Big Integer Unique ID for each reading
PDUID Integer Foreign key reference to PDUs table
PDUCircuitID Integer Foreign key reference to the PDUCircuits table
Timetimestamp withtime zone
Timestamp when rollup was created
Voltage Real Average voltage reading during rollup interval
MinVoltage Real Minimum voltage reading during rollup interval
MaxVoltage Real Maximum voltage reading during rollup interval
893

894
Field Type Notes
Current Real Average current reading (Amps) during rollup interval
MinCurrent Real Minimum current reading (Amps) during rollup interval
MaxCurrent Real Maximum current reading (Amps) during rollup interval
UnutilizedCapacity RealAverage unutilized capacity (rated amps minus current)reading during rollup interval
MinUnutilizedCapacity RealMinimum unutilized capacity (rated amps minus cur-rent) reading during rollup interval
MaxUnutilizedCapacity RealMaximum unutilized capacity (rated amps minus cur-rent) reading during rollup interval
PowerFactor Real Average Power factor reading during rollup interval
MinPowerFactor Real Minimum power factor reading during rollup interval
MaxPowerFactor Real Maximum power factor reading during rollup interval
ActivePower RealAverage active power (Watts) reading during rollup inter-val
MinActivePower RealMinimum active power (Watts) reading during rollupinterval
MaxActivePower RealMaximum active power (Watts) reading during rollupinterval
ApparentPower RealAverage apparent power (VA) reading during rollup inter-val
MinApparentPower RealMinimum apparent power (VA) reading during rollupinterval
MaxApparentPower RealMaximum apparent power (VA) reading during rollupinterval
VoltAmpHour RealMaximum of the cumulative volt-amp-hour meter read-ings over the rollup interval
WattHour Real Maximum of the cumulative watt-hour meter readings

Field Type Notes
over the rollup interval
PDUCircuitPoleReadingDailyRollups
Field Type Notes
PDUCircuitPoleReadingDailyRollupsID Big Integer Unique ID for each reading
PDUCircuitPoleID Integer Circuit pole number on the PDU
PDUID Integer Foreign key reference to PDUs table
Timetimestamp withtime zone
Timestamp when rollup was created
Date date Date when rollup was created
Voltage Real Average voltage reading during rollup interval
MinVoltage Real Minimum voltage reading during rollup interval
MaxVoltage Real Maximum voltage reading during rollup interval
Current Real Average current reading (Amps) during rollup interval
MinCurrent RealMinimum current reading (Amps) during rollup inter-val
MaxCurrent RealMaximum current reading (Amps) during rollup inter-val
UnutilizedCapacity RealAverage unutilized capacity (rated amps minus cur-rent) reading during rollup interval
MinUnutilizedCapacity RealMinimum unutilized capacity (rated amps minus cur-rent) reading during rollup interval
MaxUnutilizedCapacity RealMaximum unutilized capacity (rated amps minus cur-rent) reading during rollup interval
895

896
PDUCircuitPoleReadingMonthlyRollups
Field Type Notes
PDUCircuitPoleReadingMonthlyRollupsID Big Integer Unique ID for each reading
PDUCircuitPoleID Integer Circuit pole number on the PDU
PDUID Integer Foreign key reference to PDUs table
Timetimestamp withtime zone
Timestamp when rollup was created
Yeardouble pre-cision
Year when rollup was created
Monthdouble pre-cision
Month when rollup was created
Voltage Real Average voltage reading during rollup interval
MinVoltage Real Minimum voltage reading during rollup interval
MaxVoltage Real Maximum voltage reading during rollup interval
Current RealAverage current reading (Amps) during rollup inter-val
MinCurrent RealMinimum current reading (Amps) during rollupinterval
MaxCurrent RealMaximum current reading (Amps) during rollupinterval
UnutilizedCapacity RealAverage unutilized capacity (rated amps minus cur-rent) reading during rollup interval
MinUnutilizedCapacity RealMinimum unutilized capacity (rated amps minuscurrent) reading during rollup interval
MaxUnutilizedCapacity RealMaximum unutilized capacity (rated amps minuscurrent) reading during rollup interval

PDUCircuitPoleReadingHourlyRollups
Field Type Notes
PDUCircuitPoleReadingHourlyRollupsID Big Integer Unique ID for each reading
PDUCircuitPoleID Integer Circuit pole number on the PDU
PDUID Integer Foreign key reference to PDUs table
Timetimestamp withtime zone
Timestamp when rollup was created
Voltage Real Average voltage reading during rollup interval
MinVoltage Real Minimum voltage reading during rollup interval
MaxVoltage Real Maximum voltage reading during rollup interval
Current RealAverage current reading (Amps) during rollup inter-val
MinCurrent RealMinimum current reading (Amps) during rollup inter-val
MaxCurrent RealMaximum current reading (Amps) during rollup inter-val
UnutilizedCapacity RealAverage unutilized capacity (rated amps minus cur-rent) reading during rollup interval
MinUnutilizedCapacity RealMinimum unutilized capacity (rated amps minus cur-rent) reading during rollup interval
MaxUnutilizedCapacity RealMaximum unutilized capacity (rated amps minuscurrent) reading during rollup interval
897

898
PDUCircuitReadingDailyRollups
Field Type Notes
PDUCircuitReadingDailyRollupsID Big Integer
PDUID Integer Foreign key reference to PDUs table
PDUCircuitID Integer Foreign key reference to the PDUCircuits table
Timetimestamp withtime zone
Timestamp when rollup was created
Date date Date when rollup was created
Voltage Real Average voltage reading during rollup interval
MinVoltage Real Minimum voltage reading during rollup interval
MaxVoltage Real Maximum voltage reading during rollup interval
Current Real Average current reading (Amps) during rollup interval
MinCurrent Real Minimum current reading (Amps) during rollup interval
MaxCurrent Real Maximum current reading (Amps) during rollup interval
UnutilizedCapacity RealAverage unutilized capacity (rated amps minus current)reading during rollup interval
MinUnutilizedCapacity RealMinimum unutilized capacity (rated amps minus current)reading during rollup interval
MaxUnutilizedCapacity RealMaximum unutilized capacity (rated amps minus cur-rent) reading during rollup interval
PowerFactor Real Average Power factor reading during rollup interval
MinPowerFactor Real Minimum power factor reading during rollup interval
MaxPowerFactor Real Maximum power factor reading during rollup interval
ActivePower RealAverage active power (Watts) reading during rollup inter-val

Field Type Notes
MinActivePower RealMinimum active power (Watts) reading during rollup inter-val
MaxActivePower RealMaximum active power (Watts) reading during rollupinterval
ApparentPower RealAverage apparent power (VA) reading during rollup inter-val
MinApparentPower RealMinimum apparent power (VA) reading during rollup inter-val
MaxApparentPower RealMaximum apparent power (VA) reading during rollupinterval
VoltAmpHour RealMaximum of the cumulative volt-amp-hour meter read-ings over the rollup interval
WattHour RealMaximum of the cumulative watt-hour meter readingsover the rollup interval
PDUCircuitPoleReadingMonthlyRollups
Field Type Notes
PDUCircuitPoleReadingMonthlyRollupsID Big Integer Unique ID for each reading
PDUCircuitPoleID Integer Circuit pole number on the PDU
PDUID Integer Foreign key reference to PDUs table
Timetimestamp withtime zone
Timestamp when rollup was created
Yeardouble pre-cision
Year when rollup was created
Monthdouble pre-cision
Month when rollup was created
899

900
Field Type Notes
Voltage Real Average voltage reading during rollup interval
MinVoltage Real Minimum voltage reading during rollup interval
MaxVoltage Real Maximum voltage reading during rollup interval
Current RealAverage current reading (Amps) during rollup inter-val
MinCurrent RealMinimum current reading (Amps) during rollupinterval
MaxCurrent RealMaximum current reading (Amps) during rollupinterval
UnutilizedCapacity RealAverage unutilized capacity (rated amps minus cur-rent) reading during rollup interval
MinUnutilizedCapacity RealMinimum unutilized capacity (rated amps minuscurrent) reading during rollup interval
MaxUnutilizedCapacity RealMaximum unutilized capacity (rated amps minuscurrent) reading during rollup interval
PDUCircuitBreakerReadingsRollup - To Be Deprecated
Note: This table will be deprecated soon. It is recommended to stop using it, and use the new PDUCir-cuitBreakerReadingsHourlyRollup, PDUCircuitBreakerReadingDailyRollups, and PDUCir-cuitBreakerReadingMonthlyRollups tables. If you experience any performance issues, move to the new tables.
The PDUCircuitBreakerReadingsRollup view summarizes the circuit breaker readings power data over the roll-up interval.Hourly roll-ups are rolled up once a day. Daily roll-ups are rolled up once a month. When data is rolled up, shorter intervalroll-up entries in the PDUCircuitBreakerReadingsRollup view are purged.
Field Type Notes
PDUCircuitBreakerReadingsRollupID Integer Non-unique ID for each reading
PDUID Integer Foreign key reference to PDU
CircuitBreakerNumber Integer Circuit breaker number on the PDU

Field Type Notes
CircuitBreakerID IntegerForeign key reference to PDUCircuitBreakerstable
RollupInterval Integer
1: one hour
2: one day
3: one month
TimeTimestamp withTimezone
Timestamp when rollup was created
MinimumCurrent RealLowest current (Amps) reading during rollup inter-val
MaximumCurrent RealMaximum current (Amps) reading during rollupinterval
AverageCurrent RealAverage current (Amps) reading during rollupinterval
MinimumUnutilizedCapacity RealLowest unutilized capacity (Amps) during rollupinterval
MaximumUnutilizedCapacity RealMaximum unutilized capacity (Amps) during rol-lup interval
AverageUnutilizedCapacity RealAverage unutilized capacity (Amps) during rollupinterval
PDUCircuitBreakerReadingHourlyRollups
The PDUCircuitBreakerReadingHourlyRollup view summarizes the circuit breaker readings power data over the hourlyroll-up interval.
Field Type Notes
PDUCircuitBreakerReadingsRollupID Integer Unique ID for each reading
PDUID Integer Foreign key reference to PDU
CircuitBreakerNumber Integer Circuit breaker number on the PDU
901

902
Field Type Notes
CircuitBreakerID IntegerForeign key reference to PDUCircuitBreakerstable
TimeTimestamp withTimezone
Timestamp when rollup was created
MinimumCurrent RealLowest current (Amps) reading during rollup inter-val
MaximumCurrent RealMaximum current (Amps) reading during rollupinterval
AverageCurrent RealAverage current (Amps) reading during rollupinterval
MinimumUnutilizedCapacity RealLowest unutilized capacity (Amps) during rollupinterval
MaximumUnutilizedCapacity RealMaximum unutilized capacity (Amps) during rol-lup interval
AverageUnutilizedCapacity RealAverage unutilized capacity (Amps) during rollupinterval
PDUCircuitBreakerReadingDailyRollups
The PDUCircuitBreakerReadingsDailyRollup view summarizes the circuit breaker readings power data over the daily roll-up interval.
Field Type Notes
PDUCircuitBreakerReadingsRollupID Integer Unique ID for each reading
PDUID Integer Foreign key reference to PDU
CircuitBreakerNumber Integer Circuit breaker number on the PDU
CircuitBreakerID IntegerForeign key reference to PDUCircuitBreakerstable
Time Timestamp with Timestamp when rollup was created

Field Type Notes
Timezone
MinimumCurrent RealLowest current (Amps) reading during rollup inter-val
MaximumCurrent RealMaximum current (Amps) reading during rollupinterval
AverageCurrent RealAverage current (Amps) reading during rollupinterval
MinimumUnutilizedCapacity RealLowest unutilized capacity (Amps) during rollupinterval
MaximumUnutilizedCapacity RealMaximum unutilized capacity (Amps) during rol-lup interval
AverageUnutilizedCapacity RealAverage unutilized capacity (Amps) during rollupinterval
PDUCircuitBreakerReadingMonthlyRollups
The PDUCircuitBreakerReadingsMonthlyRollup view summarizes the circuit breaker readings power data over themonthly roll-up interval.
Field Type Notes
PDUCircuitBreakerReadingsRollupID Integer Unique ID for each reading
PDUID Integer Foreign key reference to PDU
CircuitBreakerNumber Integer Circuit breaker number on the PDU
CircuitBreakerID Integer Foreign key reference to PDUCircuitBreakers table
TimeTimestamp withTimezone
Local timestamp for the first day of the month overwhich the rollup was calculated
MinimumCurrent Real Lowest current (Amps) reading during rollup interval
903

904
Field Type Notes
MaximumCurrent RealMaximum current (Amps) reading during rollup inter-val
AverageCurrent Real Average current (Amps) reading during rollup interval
MinimumUnutilizedCapacity RealLowest unutilized capacity (Amps) during rollup inter-val
MaximumUnutilizedCapacity RealMaximum unutilized capacity (Amps) during rollupinterval
AverageUnutilizedCapacity RealAverage unutilized capacity (Amps) during rollup inter-val
PDUSensorReadingsRollup - To Be Deprecated
Note: This table will be deprecated soon. It is recommended to stop using it, and use the new PDUSensorRead-ingsHourlyRollups, PDUSensorReadingsDailyRollups, and PDUSensorReadingsMonthlyRollups tables. If you experienceany performance issues, move to the new tables.
The PDUSensorReadingsRollup view summarizes the sensor readings power data over the roll-up interval. Hourly roll-upsare rolled up once a day. Daily roll-ups are rolled up once a month. When data is rolled up, shorter interval roll-up entries inthe PDUSensorReadingsRollup view are purged.
Field Type Notes
PDUSensorReadingsRollupID Integer Non-unique ID for each reading
SensorID Integer Database ID of the sensor as seen in PDUSensors
RollupInterval Integer
1: one hour
2: one day
3: one month
Time Timestamp with Timezone Timestamp when rollup was created
MinimumValue Real Lowest sensor reading during rollup interval

Field Type Notes
MaximumValue Real Maximum sensor reading during rollup interval
AverageValue Real Average sensor reading during rollup interval
PDUSensorReadingHourlyRollup
The PDUSensorReadingsHourlyRollup view summarizes the sensor readings power data over the roll-up interval. Hourlyroll-ups are rolled up once a day. Daily roll-ups are rolled up once a month. When data is rolled up, shorter interval roll-upentries in the PDUSensorReadingsRollup view are purged.
Field Type Notes
PDUSensorReadingsRollupID Integer Unique ID for each reading
SensorID Integer Database ID of the sensor as seen in PDUSensors
Time Timestamp with Timezone Timestamp when rollup was created
MinimumValue Real Lowest sensor reading during rollup interval
MaximumValue Real Maximum sensor reading during rollup interval
AverageValue Real Average sensor reading during rollup interval
PDUSensorReadingDailyRollup
The PDUSensorReadingsDailyRollup view summarizes the sensor readings power data over the roll-up interval. Hourlyroll-ups are rolled up once a day. Daily roll-ups are rolled up once a month. When data is rolled up, shorter interval roll-upentries in the PDUSensorReadingsRollup view are purged.
Field Type Notes
PDUSensorReadingsRollupID Integer Unique ID for each reading
SensorID Integer Database ID of the sensor as seen in PDUSensors
Time Timestamp with Timezone Timestamp when rollup was created
MinimumValue Real Lowest sensor reading during rollup interval
905

906
Field Type Notes
MaximumValue Real Maximum sensor reading during rollup interval
AverageValue Real Average sensor reading during rollup interval
PDUSensorReadingMonthlyRollup
The PDUSensorReadingsMonthlyRollup view summarizes the sensor readings power data over the roll-up interval. Hourlyroll-ups are rolled up once a day. Daily roll-ups are rolled up once a month. When data is rolled up, shorter interval roll-upentries in the PDUSensorReadingsRollup view are purged.
Field Type Notes
PDUSensorReadingsRollupID Integer Unique ID for each reading
SensorID Integer Database ID of the sensor as seen in PDUSensors
TimeTimestamp withTimezone
Local timestamp for the first day of the month over whichthe rollup was calculated
MinimumValue Real Lowest sensor reading during rollup interval
MaximumValue Real Maximum sensor reading during rollup interval
AverageValue Real Average sensor reading during rollup interval
PDUSensors
The PDUSensors view contains information about sensors attached to PDUs that Power IQ manages.
Field Type Notes
SensorID Integer Auto-generated ID
PDUID Integer Foreign key reference to PDUs table
PDUSensorID Integer ID of the sensor on the PDU, as gathered from the pdu
SensorNumber Integer Sensor number on the PDU

Field Type Notes
AttributeName VarChar(64) Type of sensor
Label VarChar(255) Sensor's label as gathered from the PDU
Removed VarChar(64) When the sensor was removed from the system, or null for current sensors
Position VarChar(10) Sensor position on the PDU: inlet, outlet or outside air
PDUTransferSwitchStates
This view represents the state of a Transfer Switch at a particular moment in time, normally recorded when the state of theswitch has changed.
Field Type Notes
PDUTransferSwitchStatesID BigInt The primary key for this view
PDUTransferSwitchesID Integer Foreign key reference to the PDUTransferSwitches view.
ActivePDUInletNumber VarChar(32) The ordinal of the active inlet.
OperatingStatus VarChar(32)A string representing the operating status reported by thePDU's MIB.
TimeTimestamp withTimezone
Local timestamp
PDUTransferSwitches
This view represents the physical transfer switch inside of a PDU of type ‘Rack Transfer Switch’.
Field Type Notes
PDUTransferSwitchesID Integer The primary key for this view
PDUID Integer Foreign key reference to the PDUs view.
CreatedAtTimestamp withTimezone
The date and time that the Transfer Switch was added to thesystem.
907

908
Field Type Notes
UpdatedAtTimestamp withTimezone
The date and time this Transfer Switch was last updated.

909
TagEntries
This view shows all of the tags that have been applied to an entity.
Field Type Notes
TagEntriesID Integer The primary key for this view
TagsID Integer Foreign key reference to the Tags view.
TaggableType VarChar(255) The type of EDM entity that was tagged (Room, Rack, PDU, etc.)
TaggableID Integer Foreign key reference to the appropriate entity view.
CreatedAt Timestamp with Timezone The date and time this Tag Entry was created.
UpdatedAt Timestamp with Timezone The date and time this Tag Entry was last updated.

910
TagGroups
This view lists all of the tag groups in Power IQ.
Field Type Notes
TagGroupsID Integer The primary key for this view
Name VarChar(255) Name of the Tag Group
CreatedAt Timestamp with Timezone The date and time this Tag Group was created.
UpdatedAt Timestamp with Timezone The date and time this Tag Group was last updated.

911
Tags
This view lists all of the tags in Power IQ and the shows which tag group they belong to.
Field Type Notes
TagsID Integer The primary key for this view
TagGroupsID Integer Foreign key reference to the TagGroups view.
Name VarChar(255) Name of the Tag
CreatedAtTimestamp with
TimezoneThe date and time this Tag was created.
UpdatedAtTimestamp with
TimezoneThe date and time this Tag was last updated.

912
DataCenters
The DataCenters view contains information about data center objects as part of the Enterprise Relationship Model. Thefields in this view correspond to the item attributes in the model.
Field Type Notes
DataCenterID Integer Auto-generated ID
Name VarChar(255) Human-assigned name for this data center object
CompanyName VarChar(255) Name of the company that owns this data center
ContactName VarChar(255) Name of the person to contact regarding data center
ContactPhone VarChar(255) Phone number for contact
ContactEmail VarChar(255) Email for contact
City VarChar(255) City location of data center
State VarChar(255) State location of data center
Country VarChar(255) Country location of data center
Capacity Real The Data Center capacity in kW
PeakKWHRate Double Energy cost per Kilowatt Hour during peak hours
OffPeakKWHRate Double Energy cost per Kilowatt Hour during off-peak hours
PeakBegin DoubleTime of day peak hours begin
For example 19.5 = 19:30 hours
PeakEnd Double Time of day peak hours end
CO2Factor Double CO2 computational factor
CoolingFactor Double Cooling factor for data center
CustomField1 VarChar(255) A user-defined field

913
Field Type Notes
CustomField2 VarChar(255) A user-defined field
ExternalKey VarChar(255) The unique code used by the Enterprise Model to identify this data center

914
Floors
The Floors view contains information about Floor objects as part of the Enterprise Relationship Model. The fields in thisview correspond to the item attributes in the model.
Field Type Notes
FloorID Integer Auto-generated ID
Name VarChar(255) Human-assigned name for this Floor object.
ExternalKey VarChar(255) The unique code used by the Enterprise Model to identify this Floor.

915
Rooms
The Rooms view contains information about Room objects as part of the Enterprise Relationship Model. The fields in thisview correspond to the item attributes in the model.
Field Type Notes
RoomID Integer Auto-generated ID
Name VarChar(255) Human-assigned name for this Room object.
ExternalKey VarChar(255) The unique code used by the Enterprise Model to identify this Room.

916
Aisles
The Aisles view contains information about Aisle objects as part of the Enterprise Relationship Model. The fields in thisview correspond to the item attributes in the model.
Field Type Notes
AisleID Integer Auto-generated ID
Name VarChar(255) Human-assigned name for this Aisle object.
ExternalKey VarChar(255) The unique code used by the Enterprise Model to identify this Aisle.

917
Rows
The Rows view contains information about Row objects as part of the Enterprise Relationship Model. The fields in this viewcorrespond to the item attributes in the model.
Field Type Notes
RowID Integer Auto-generated ID
Name VarChar(64) Human-assigned name for this Row object.
ExternalKey VarChar(256) The unique code used by the Enterprise Model to identify this Row.

918
Racks
The Racks view contains information about Rack objects as part of the Enterprise Relationship Model. The fields in thisview correspond to the item attributes in the model.
Field Type Notes
RackID Integer Auto-generated ID
Name VarChar (255) Human-assigned name for this Rack object.
SpaceIdentifier VarChar(255) Optional human-assigned value to identify this rack.
ExternalKey VarChar(255) The unique code used by the Enterprise Model to identify this Rack.
Capacity Integer Capacity of the rack in kW.
Rack Readings Rollups
The rack readings rollups views contain rollups of raw readings.
RackReadingHourlyRollups
Field Type Notes
RackReadingHourlyRollupsID Bigint Unique ID for each reading
RackID Integer ID of the rack
TimeTimestamp with timezone
Timestamp when rollup was created
ActivePower RealAverage active power (Watts) reading during rollupinterval
MinActivePower RealMinimum active power (Watts) reading during rollupinterval
MaxActivePower Real Maximum active power (Watts) reading during rollup

919
Field Type Notes
interval
RackReadingDailyRollups
Field Type Notes
RackReadingDailyRollupsID bigint Unique ID for each reading
RackID integer ID of the rack
Date date Date when rollup was created
ActivePower Real Average active power (Watts) reading during rollup interval
MinActivePower Real Minimum active power (Watts) reading during rollup interval
MaxActivePower Real Maximum active power (Watts) reading during rollup interval
RackReadingMonthlyRollups
Field Type Notes
RackReadingMonthlyRollupsID bigint Unique ID for each reading
RackID integer ID of the rack
Year double precision Year when rollup was created
Month double precision Month when rollup was created
ActivePower Real Average active power (Watts) reading during rollup interval
MinActivePower Real Minimum active power (Watts) reading during rollup interval
MaxActivePower Real Maximum active power (Watts) reading during rollup interval

920
ITDevices
The ITDevices view contains information about IT Device objects as part of the Enterprise Relationship Model. The fields inthis view correspond to the item attributes in the model.
Field Type Notes
ITDeviceID Integer Auto-generated ID
Name VarChar(255) Human-assigned name for this IT Device object
Customer VarChar(255) Name of the customer that owns this object
DeviceType VarChar(255) Type of device
PowerRating Integer Power in watts that this device is rated for
Decommissioned Boolean Whether this device should be considered decommissioned
CustomField1 VarChar(255) A user-defined field
CustomField2 VarChar(255) A user-defined field
ExternalKey VarChar(255) The unique code used by the Enterprise Model to identify this IT Device
ITDevice Readings Rollups
The IT device readings rollups views contain rollups of raw readings.
The following limitations apply:
l IT devices associated with Raritan PX1 and PX2 outlets only.l Data buffering must be enabled on the PDU.l Outlets from other PDUs are excluded from the rollups.
ITDeviceReadingDailyRollups
See IT Device ReadingsRollups for details on this view.
Field Type Notes
ITDeviceReadingDailyRollupsID bigint Unique ID for each reading

921
Field Type Notes
ITDeviceID integer ID of the IT Device
Date date Date when rollup was created
Current Real Average current reading (Amps) during rollup interval
MinCurrent Real Minimum current reading (Amps) during rollup interval
MaxCurrent Real Maximum current reading (Amps) during rollup interval
ActivePower Real Average active power (Watts) reading during rollup interval
MinActivePower Real Minimum active power (Watts) reading during rollup interval
MaxActivePower Real Maximum active power (Watts) reading during rollup interval
ApparentPower Real Average apparent power (VA) reading during rollup interval
MinApparentPower Real Minimum apparent power (VA) reading during rollup interval
MaxApparentPower Real Maximum apparent power (VA) reading during rollup interval
ITDeviceReadingHourlyRollups
See IT Device ReadingsRollups for details on this view.
Field Type Notes
ITDeviceReadingHourlyRollupsID Bigint Unique ID for each reading
ITDeviceID Integer ID of the IT Device
TimeTimestamp with timezone
Timestamp when rollup was created
Current RealAverage current reading (Amps) during rollup inter-val
MinCurrent RealMinimum current reading (Amps) during rollup inter-val

922
Field Type Notes
MaxCurrent RealMaximum current reading (Amps) during rollup inter-val
ActivePower RealAverage active power (Watts) reading during rollupinterval
MinActivePower RealMinimum active power (Watts) reading during rollupinterval
MaxActivePower RealMaximum active power (Watts) reading during rollupinterval
ApparentPower RealAverage apparent power (VA) reading during rollupinterval
MinApparentPower RealMinimum apparent power (VA) reading during rollupinterval
MaxApparentPower RealMaximum apparent power (VA) reading during rollupinterval
ITDeviceReadingMonthlyRollups
See IT Device ReadingsRollups for details on this view.
Field Type Notes
ITDeviceReadingMonthlyRollupsID bigint Unique ID for each reading
ITDeviceID integer ID of the IT Device
Yeardouble pre-cision
Year when rollup was created
Current Real Average current reading (Amps) during rollup interval
MinCurrent Real Minimum current reading (Amps) during rollup interval
MaxCurrent Real Maximum current reading (Amps) during rollup interval

923
Field Type Notes
ActivePower RealAverage active power (Watts) reading during rollup inter-val
MinActivePower RealMinimum active power (Watts) reading during rollup inter-val
MaxActivePower RealMaximum active power (Watts) reading during rollup inter-val
ApparentPower RealAverage apparent power (VA) reading during rollup inter-val
MinApparentPower RealMinimum apparent power (VA) reading during rollup inter-val
MaxApparentPower RealMaximum apparent power (VA) reading during rollup inter-val

924
EDMNodes
The EDMNodes view contains the relationship between EDM entities arranged as nested sets. EDM entities are part of adata hierarchy. Hierarchical data can be efficiently searched when arranged as a Nested set tree structure.
Field Type Notes
ID Integer Auto-generated EDMNodes ID
Lft Integer Auto-generated EDMNode Left ID
Rgt Integer Auto-generated EDMNode Right ID
edm_entity_type
VarChar(40)Entity Type. For example, DataCenter, Floor, Rack, Device, ComputerSystem,Sensors. Entity Type ComputerSystem represents a PDU system.
edm_entity_id
Integer Entity ID of the entity.
create_at Timestamp Create time stamp.
Updated_at Timestamp Update time stamp.
ParentID Integer Entity ID of the parent entity

925
AssetStrips
The AssetStrips view contains information about asset management strips attached to PDUs that Power IQ manages.
Field Type Notes
AssetStripID Integer Database id of the asset strip
PDUID Integer Database id of the attached PDU
Name VarChar (255) Name of the asset strip
State VarChar (64) ok, upgrading, unavailable, unsupported
AssetStripCreationTime Timestamp with time zone Time asset strip was created in the database
AssetStripLastUpdateTime Timestamp with time zone Time the asset strip last changed in the database
AssetStripOrdinal Integer The id of the asset strip on the PDU: 1 to n

926
RackUnits
The RackUnits view contains information about the rack units on asset strips connected to PDUs that Power IQ manages.
Field Type Notes
RackUnitID Integer Database id of rack unit
AssetStripID IntegerDatabase id of asset strip.
See AssetStrips.
AssetTagIDString VarChar (255)
Asset tag id string of any attached asset tag that plugs intothe asset strip.
Unique from the factory.
RackUnitOrdinal Smallint 1-n the number of the rack unit within the asset strip
RackUnitLEDState VarChar (64) LED state: on, off, blinking
RackUnitLEDMode VarChar (64) LED mode: automatic or manual
RackUnitLEDColor VarChar (6) LED color: hexadecimal code for the color
RackUnitCreationTimeTimestamp with timezone
When the rack unit was created in the database
RackUnitLastUpdateTimeTimestamp with timezone
When the rack unit was last changed in the database

927
PUECalculations
Field Type Notes
PUECalculationsID bigint Unique ID for each reading
DataCenterID integer Foreign key reference to DataCenters table
TotalEnergy integer PUEfacility energy
TotalAdjustment integer Facility Energy manual adjustment value
ITEnergy integer PUEIT energy
ITAdjustment integer IT Energy manual adjustment value
MeasuredOn date The date when rollup was created
Granularity text whether daily or monthly rollup
PDUBatteries
Field Type Notes
PDUBatteriesID integer Unique battery number
PDUID integer Foreign key reference to PDUs table
SecondsOnBattery integer
If the unit is on battery power, the elapsed time since the UPS last switched tobattery power, or the time since the network management subsystem was lastrestarted, whichever is less. Zero shall be returned if the unit is not on batterypower.

928
PDUBatteryReadings
Field Type Notes
PDUBatteryReadingsID Integer Unique battery reading number
PDUBatteriesID Integer Foreign key reference to the PDUBatteries table
Time VarChar(64) Local timestamp
CapacityPercentage VarChar(64) Capacity percentage from the battery
RuntimeRemaining Integer Estimated remaining runtime minutes from the battery
Voltage Integer Voltage from the battery
Current Integer Current from the battery
PDUBatteryReadingHourlyRollups
Field Type Notes
PDUBatteryReadingHourlyRollupID Integer Unique battery reading hourly number
PDUBatteriesID Integer Foreign key reference to the PDUBatteries table
Time Timestamp Local timestamp
MinCapacityPercentage RealMinimum capacity reading (Percentage) during rollup inter-val
MaxCapacityPercentage RealMaximum capacity reading (Percentage) during rollupinterval
CapacityPercentage RealAverage capacity reading (Percentage) during rollup inter-
val
MinRuntimeRemaining IntegerMinimum runtime remaing reading (minutes) during rollup
interval
MaxRuntimeRemaining Integer Maximum runtime remaing reading (minutes) during rollup

929
Field Type Notes
interval
RuntimeRemaining IntegerAverage runtime remaing reading (minutes) during rollup
interval
MinCurrent Real Minimum current reading (Amps) during rollup interval
MaxCurrent Real Maximum current reading (Amps) during rollup interval
Current Real Average current reading (Amps) during rollup interval
MinVoltage Real Minimum voltage reading (Volts) during rollup interval
MaxVoltage Real Maximum voltage reading (Volts) during rollup interval
Voltage Real Average voltage reading (Volts) during rollup interval
PDUBatteryReadingDailyRollups
Field Type Notes
PDUBatteryReadingDailyRollupID Integer Unique battery reading daily rollup number
PDUBatteriesID Integer Foreign key reference to the PDUBatteries table
Time Timestamp Local timestamp
MinCapacityPercentage RealMinimum capacity reading (Percentage) during rollup inter-val
MaxCapacityPercentage RealMaximum capacity reading (Percentage) during rollup inter-val
CapacityPercentage RealAverage capacity reading (Percentage) during rollup inter-
val
MinRuntimeRemaining Integer Minimum runtime remaing reading (minutes) during rollup

930
Field Type Notes
interval
MaxRuntimeRemaining IntegerMaximum runtime remaing reading (minutes) during rollup
interval
RuntimeRemaining IntegerAverage runtime remaing reading (minutes) during rollup
interval
MinCurrent Real Minimum current reading (Amps) during rollup interval
MaxCurrent Real Maximum current reading (Amps) during rollup interval
Current Real Average current reading (Amps) during rollup interval
MinVoltage Real Minimum voltage reading (Volts) during rollup interval
MaxVoltage Real Maximum voltage reading (Volts) during rollup interval
Voltage Real Average voltage reading (Volts) during rollup interval
PDUBatteryReadingMonthlyRollups
Field Type Notes
PDUBatteryReadingMonthlyRollupID Integer Unique battery reading monthly rollup number
PDUBatteriesID Integer Foreign key reference to the PDUBatteries table
Time Timestamp Local timestamp
MinCapacityPercentage RealMinimum capacity reading (Percentage) during rollupinterval
MaxCapacityPercentage RealMaximum capacity reading (Percentage) during rollupinterval
CapacityPercentage RealAverage capacity reading (Percentage) during rollup
interval

931
Field Type Notes
MinRuntimeRemaining IntegerMinimum runtime remaing reading (minutes) during rol-
lup interval
MaxRuntimeRemaining IntegerMaximum runtime remaing reading (minutes) during rol-
lup interval
RuntimeRemaining IntegerAverage runtime remaing reading (minutes) during rollup
interval
MinCurrent Real Minimum current reading (Amps) during rollup interval
MaxCurrent Real Maximum current reading (Amps) during rollup interval
Current Real Average current reading (Amps) during rollup interval
MinVoltage Real Minimum voltage reading (Volts) during rollup interval
MaxVoltage Real Maximum voltage reading (Volts) during rollup interval
Voltage Real Average voltage reading (Volts) during rollup interval
PDUBatteryReplacementStatusRecords
Field Type Notes
PDUBatteryReplacementStatusRecordID Integer Unique battery replacement status record number
PDUBatteriesID Integer Foreign key reference to the PDUBatteries table
StartTime Timestamp Time the status record was created
EndTime Timestamp Time the status ended
Status BooleanOne or more batteries have been determined to
require replacement

932
Sample ODBC Queries
This section contains sample ODBC queries that can be used to generate custom reports.
Obtain Active Power and Apparent Power Data for a PDU With IPAddress 66.214.208.92
Select "PDUs"."IPAddress", "PDUs"."PDUName", "PDUReadings"."ActivePower", "PDUReadings"."ApparentPower" ,“PDUReadings”.”Time” from "PDUs", "PDUReadings" where "PDUs"."IPAddress"=’66.214.208.91' AND "PDUs"."ID"-"="PDUReadings"."PDUID";
The table shows a sample custom report.
IP Address PDU Name Active Power Apparent Power Time
66.214.208.91 Sentry3_511c15 8 8 2009-12-08 12:46:21.753-05
66.214.208.91 Sentry3_511c15 8 8 2009-12-08 12:58:23.871-05
66.214.208.91 Sentry3_511c15 8 8 2009-12-08 16:29:26.032-05
66.214.208.91 Sentry3_511c15 8 8 2009-12-08 16:32:36.868-05
Obtain Active Power and Apparent Power for an ITDevice WithName “DBServer’’
raritan
Select "ITDevices"."Name", "PDUOutletReadings"."Time", "PDUOutletReadings"."ActivePower", "PDUOut-letReadings"."ApparentPower", "PDUOutletReadings"."CurrentAmps" from "ITDevices", "PDUOutlets", "PDUOut-letReadings" where "ITDevices"."Name"='DBServer' AND "PDUOutletReadings"."OutletID" ="PDUOutlets"."PDUOutletsID" AND "PDUOutlets"."ITDeviceID" = "ITDevices"."ITDeviceID";
The table shows a sample custom report.
Name Time Active Power Apparent Power Current Amps
DBServer 2009-12-08 14:16:31.759-05 0 0 0
DBServer 2009-12-08 16:11:27.017-05 0 0 0

933
Report Maximum Power Reading for Each ITDevice Since Added toPower IQ
To obtain the maximum power reading for an IT device since it was added to Power IQ, three queries are needed. Thesesample queries group data by device name. This assumes that device names are unique. If your device names are notunique, use IT Device ID for grouping.
l Query for all devices with all readings for all outlets.l Group, per device, per hour, all outlets of a device and sum up the outlet usagel Find the maximum power per device of the total power consumption.
List all outlet readings for all devices:
SELECT odbc_ITDevices.Name, odbc_PDUOutletReadingsRollup.Time, odbc_PDUOutlets.PDUOutletsID, odbc_PDUOutletReadingsRollup.MaximumActivePower
FROM odbc_ITDevices, odbc_PDUOutlets, odbc_PDUOutletReadingsRollup
WHERE(((odbc_PDUOutletReadingsRollup.RollupInterval)=1) AND ((odbc_PDUOutletReadingsRollup.OutletID)=[odbc_PDUOutlets] .[PDUOutletsID]) AND ((odbc_PDUOutlets.ITDeviceID)=[odbc_ITDevices].[ ITDeviceID]))
ORDER BYodbc_ITDevices.Name, odbc_PDUOutletReadingsRollup.Time, odbc_PDUOutlets.PDUOutletsID;
Group hourly outlet readings per IT device:
SELECT [List of all Devices with all readings for all outlets] .Name, [List of all Devices with all readings for all out-lets] .Time, Sum([List of all Devices with all readings for all outlets] .MaximumActivePower) AS SumOfMax-imumActivePower
FROM [List of all Devices with all readings for all outlets]
GROUP BY[List of all Devices with all readings for all outlets] .Name, [List of all Devices with all readings for all out-lets] .Time
ORDER BY[List of all Devices with all readings for all outlets] .Name;
Find the maximum power reading per IT device:
SELECT [Summation per Device of hourly readings].Name, Max([Summation per Device of hourly read-ings].SumOfMaximumActivePower) AS MaxOfSumOfMaximumActivePower
FROM [Summation per Device of hourly readings]
GROUP BY[Summation per Device of hourly readings].Name;

934
Creating Database Connection in Excel
1. On your Mac, launch Excel.2. Choose Excel > About Excel. If you are running Mac Lion or higher, make sure you have Excel version 14.1.2 or
higher.3. Create a new Workbook and save it. For example, "Power Consumption by Rack.xlsx"4. In the Excel toolbar, choose Data > Get External Data > New Database Query.
5. The "iODBC Data Source Chooser" dialog appears. In the User DSN tab, select the Power IQ data source that youcreated previously. Click OK.
6. If this is the first time you are using the data source in Excel, enter the username and password according to theODBC user credentials specified in Power IQ, and click Store password in Keychain then click OK.
For information on Power IQ's ODBC user credentials, see Configuring ODBC User Credentials.

935
Finding All Entities in a Rack
The following query shows all the entities, such as IT Devices and PDUs, contained in a specific rack. The example uses"Rack 4."
Retrieve the EDMNodes id for a rack with RackId=4.
oculan=> select id from "EDMNodes" where edm_entity_type='Rack' and edm_entity_id=4;
id
----
14
(1 row)
Use the EDMNodes id =14 to retrieve entities contained under this rack.
oculan=> select "EDMNodes".* FROM "EDMNodes", "EDMNodes" AS parent where (("EDMNodes".id != parent.id) AND("EDMNodes".lft >parent.lft AND "EDMNodes".rgt <=parent.rgt AND parent.id=14)) ORDER BY"EDMNodes".lft;
The table shows a sample custom report.
ID Lft Rgt EDM_Entity_Type
EDM_Entity_ID Created_at Updated_at
1 4 5 Device 32009-06-1911:16:48.257348-0
2009-06-1911:16:48.257348-04
2 6 7 Device 42009-06-1911:16:48.274988-0
2009-06-1911:16:48.274988-04
3 8 9 Device 52009-06-1911:16:48.276324-0
2009-06-1911:16:48.276324-04

936
ODBC Configuration and Sample Query for Apple Users
This section contains instructions for configuring ODBC and creating custom reports for Apple users.
These instructions apply to the following Apple products:
l Mac OS 10.7.x or higher. These instructions were tested in Lion.l Microsoft Excel 2011
The sample report provides the Max/Min/Avg power consumption of every rack in the data center.

937
Download and Install ODBC Client Driver for Mac
1. Go to http://www.actualtech.com/product_opensourcedatabases.php (see http://www.actualtech.com/product_opensourcedatabases.php - http://www.actualtech.com/product_opensourcedatabases.php) , to download theODBC Pack for Mac OSX.
Note: The driver is free to try. You can confirm that it works for you first, by following the steps in this guide.
2. Follow the usual Mac steps to install the "Actual ODBC Pack.pkg"

938
Download and Install Microsoft Query for Mac (included in Office2011 v14.1.2)
Make sure you have the latest updates for your version of Microsoft Excel.
If you are using Mac OS XLion or higher, you must use Microsoft Office 2011 v14.1.2 or higher.

939
Allow Your Mac to Access Power IQvia ODBC
1. Login to Power IQ.2. In the Settings tab, click ODBC Access in the Data Management section. The Configure ODBC Database Access
page opens.3. Click Add. Double-click the 0.0.0.0/0 Network Address, then enter the IP Address information of your Mac. Or, leave
the default 0.0.0.0/0 to allow access from all IP addresses.4. Click Save.

940
Adding Power IQas an ODBC Information Source to your Mac
1. On your Mac, launch /Applications/Utilities/ODBC Manager.app.
Note: ODBC Manager may need to be installed. It is not included with the operating system. You can download it
from www.odbcmanager.net.
1. Select the tab "User DSN", and click Add.2. Select Actual Open Source Databases and click OK. The Actual Open Source Databases DSN Configuration wiz-
ard opens.3. Click Continue.4. Name the Power IQ that you are connecting to, and select PostgreSQL as the database type. Click Continue.
5. Enter the IP address of your Power IQ server, and copy the rest of the settings exactly as pictured here. ClickContinue.
l Server: IP address of Power IQl Port: 5432
6. Do NOT select "Connect to server to obtain default settings for the additional configuration options".
7. Enter "raritan" as the database name. Make sure to select the checkbox labeled "Always include views in tablelists". Click Continue.
8. Click Test.
9. At the next prompt, enter the username and password based on the ODBC user credentials specified in Power IQ,and click OK. See Configuring ODBC User Credentials.
10. The test results should be successful. Click OK.
11. Click Done.
Note: If the test was successful, the ODBC driver works, and you can purchase it.
12. Launch /Applications/Utilities/ODBC Manager.app again. Select User DSN and highlight the Power IQ entry youjust created.
13. Click Configure.14. Click Licenses and follow instructions to buy and enter a license key.
Remember, the license you want to buy is the "Actual ODBC Driver for Open Source Databases."
Your Mac now can access all the data on the Power IQ server, and you can create reports using Microsoft Excel, FileMakerPro, or any ODBC-compliant reporting tool.
See Create Database Connection in Excel for instructions on using Microsoft Excel.

Creating Database Connection in Excel
1. On your Mac, launch Excel.2. Choose Excel > About Excel. If you are running Mac Lion or higher, make sure you have Excel version 14.1.2 or
higher.3. Create a new Workbook and save it. For example, "Power Consumption by Rack.xlsx"4. In the Excel toolbar, choose Data > Get External Data > New Database Query.
5. The "iODBC Data Source Chooser" dialog appears. In the User DSN tab, select the Power IQ data source that youcreated previously. Click OK.
6. If this is the first time you are using the data source in Excel, enter the username and password according to theODBC user credentials specified in Power IQ, and click Store password in Keychain then click OK.
For information on Power IQ's ODBC user credentials, see Configuring ODBC User Credentials.
941

942
Formulate a Database Query
After creating the database connection, Microsoft Excel ("Microsoft Query") shows a list of all data tables that Power IQmakes available. See Power IQ ODBC Schema.
These instructions will create a report providing the max/min/average power utilization of every PDU in Power IQ.
1. Click SQL View.2. Copy and paste this EXACT string, including every quotation mark, every capitalization, and so on. The string must
be used Exactly as shown.
SELECT "PDUReadingsRollup"."PDUID", "PDUs"."ID", "PDUs"."PDUName", "PDURead-
ingsRollup"."AverageActivePower", "PDUReadingsRollup"."AverageApparentPower",
"PDUReadingsRollup"."MaximumActivePower", "PDURead-
ingsRollup"."MaximumApparentPower", "PDUReadingsRollup"."MinimumActivePower",
"PDUReadingsRollup"."MinimumApparentPower", "PDUReadingsRollup"."Time"FROM
"PDUReadingsRollup", "PDUs"WHERE "PDUReadingsRollup"."PDUID" = "PDUs"."ID" AND
"PDUReadingsRollup"."Time" = '2012-09-10 00:00:00'
3. Click Return Data. A new window opens. Select "New Sheet", then click Properties.
4. Deselect the checkboxes for "Enable background refresh" and Use Table.
5. Click OK, then click OK again on the previous "New Sheet" dialog.
The report is generated. The query shows rollups from September 10, 2012. Change the query date in the string youcopied and pasted for data from other days.

Appendix B: Floor Map Drawing Files
To create floor map drawing files for Power IQ, you may find the dcTrack drawing file templates useful. This appendix containsinformation about downloading and using those templates.
Because a dcTrack floor map may require more information in the drawing file than a Power IQ floor map, you'll notice extradetails in the template.
Chapter B Power IQ Floor Map Drawing FilesMust:
l Be in .DWGfile format and created using either AutoCAD® 2012 (and earlier) or Microsoft Visio®.Only .DWGfiles canbe uploaded to the application.
Note: Drawings created in AutoCAD 2013 and 2014 are not supported by dcTrack.
l Represent a data center, floor or room in your EDM.l Contain all racks that you want to display in the floor map.l Include unique rack names that are exactly the same as the rack names in the EDM in Power IQ. Duplicate rack names
will not work.l Follow all drawing file requirements in either Microsoft Visio or AutoCAD. See Microsoft Visio Drawing File Require-
ments and AutoCAD Drawing File Requirements.
Terminology - Objects vs. Shapes
When discussing drawing files, 'objects' refers to graphical representations of cabinets, floor PDUs, UPS units and CRAC unitsin an AutoCAD drawing file and when explaining uploads to the application.
'Shapes' is used when referring to these same items in a Microsoft Visio drawing file.
Create Drawing Files or Download Templates
For the floor map widget, you can:
l Use Your Existing Drawing Files
Use your existing .DWGdrawing files as long as they are created using a supported version of Microsoft Visio® orAutoCAD®.
l Download Drawing File Templates
Sunbird provides generic Microsoft Visio and AutoCAD drawing file templates.
The templates include -
Layers for buildings, row labels, cabinet (rack) shapes, floor PDU shapes, UPS shapes and CRAC shapes.
Note: You are not required to create a layer for each of these elements and shapes in a drawing a file.
The Visio drawing file template provides predefined layers with various drawing shapes and elements.
943

944
Use the templates to create your drawing file or use them as examples to follow.
Whether you use your own file or a Sunbird template, review the information in this section to help ensure your file is format-ted correctly.
See Microsoft Visio Drawing File Requirements or AutoCAD Drawing File Requirements.
l Visio Stencil
A Visio stencil with Sunbird designed shapes and connectors is available as a download from the Sunbird supportportal.
This stencil is designed for both Power IQ and dcTrack use. Use the stencil with the Sunbird Visio templates, or withyour own Visio files.
To download the templates and/or stencils:
1. Go to: http://support.sunbirddcim.com/support/solutions/6000129540.2. Click on Tools under your product and version and download the template zip file.
Note: The stencil can be used for dcTrack or Power IQ drawings.
Microsoft Visio Drawing File Requirements
The following Microsoft Visio drawing file requirements must be met to successfully save the file in AutoCAD file format(.DWG), and visualize the floor map properly in the Power IQ Web Client and Classic View once the drawing file isuploaded.
l The file must be converted to a .DWGfile to upload it to Power IQ.l Shapes in Visio represent objects on a floor map in Power IQ.l Shape Outline Requirements - Visio Filesl A shape's border must be closedl Unless a shape is on a layer, the border outline can be black or any other color of your choosing.
For more information on border color when working with layers, see Shape Border Layer Requirements - Visio Files.
Shape Fill Requirements - Visio Files
l Each shape created in a Microsoft Visio file must use a solid fill color.l The fill color cannot be 01:White.
Aside from the colors used by the objects on the floor map generated from the drawing file, the shape's fill color does notimpact Power IQ.
Add a Fill Color to a Visio Shape
1. In the Microsoft Visio file, right-click the shape and select Format > Fill.
Tip: Select multiple shapes at once and apply a fill at the same time.

945
2. Select a color from the Color drop-down, or apply a custom color.3. Select 01:Solid from the Pattern drop-down. Even if it is selected by default, you must click on it to apply it.4. Click OK to apply the fill and close the dialog.
Shape Name Requirements for Power IQ - Visio Files
l The rack shapes in your drawing file must include unique rack names that are exactly the same as the rack namesin the EDM in Power IQ. Duplicate rack names will not work.
l Facility item shapes in your drawing file must also include unique names that are the same as the facility items inthe EDM. Power IQ supports the following facility items:
l CRACl Floor PDUl Floor UPSl Power panell Standalone meter
l All racks and facility items in the drawing file will be synced to the EDM.l Give each shape a unique name that matches the name in the EDM using the Text tool, or entering it directly into
the shape.l Shape names cannot contain the characters ' \ ?&
Add Text to a Visio Shape
1. Double-click on the object to put it in edit mode.2. Type the text ID, or use the Text Tool to add a text box and type the ID.3. Make sure the text box is inside the floor plan shape.
Shape Border Layer Naming Requirements - Visio Files
l Do not begin Microsoft Visio® layer names with the word "dcTrack" unless you are directed to do so.l Microsoft Visio layer names cannot contain spaces. Use underscores or dashes to separate words if needed. For
example, Layer1, Layer-1, or Layer_1l Shape Border Layer Requirements - Visio Filesl When using layers in a Microsoft Visio drawing file, a shape on a layer cannot have a black border.l If it does, when the file is converted from a .VSD file to a .DWGAutoCAD file and then uploaded to Power IQ, the
shape's fill is changed to black even if another fill color is applied to it.
For example, you create a rectangle with a black border and blue fill on a layer in a Visio file to represent a CRACunit object on the floor map.
l When the file is converted to a .DWGand then uploaded to Power IQ, when the CRAC unit object appears on thefloor map in Power IQ its fill is black, not blue.
l Avoid this by setting the shape's fill, border and layer to the same color - see Set a Shape's Border, Fill and VisioLayer to the Same Color.

946
Set a Shape's Border, Fill and Visio Layer to the Same Color
1. In Microsoft Visio, select View > Layer Properties. The Layer Properties dialog appears.2. Create a new layer for the objects by selecting the New... button, naming the layer in the New Layer dialog and
clicking OK.
Visio layer names cannot contain spaces. Use underscores or dashes if spaces are required.
Important: Do not begin Visio layer names with the word "dcTrack" unless you are directed to do so.
3. In the Layer Properties dialog, locate the row containing the layer you just created, then click on the layer's fieldunder the Color column. A checkmark appears in the field.
4. Select a color for the layer from the "Layer color:" drop-down, then click Apply.
The color is applied to the layer, and the Color field changes to the selected color.
5. Alternatively, create a custom color.6. Click OK.
Next, assign the shape to the layer.
7. Right-click on the shape, then click Format > Layer to open the Layers dialog.
8. Select the layer, then click OK.
The shape is assigned to the layer, and its border and fill are the same color as the layer.
Since the shape and layer colors are the same, in order to see the shape, a negative (or inverse) image may be dis-played.
If this is the case, the shape may appear as if it has no fill even though it does.
9. Finally, verify only the shape(s) you want are assigned to the layer.10. Click View > Toolbars then check the Format Shape option to enable that Format Shape toolbar.11. Click on an object that is on the layer you just created. The layer is displayed in the Layer drop-down on the Format
Shape toolbar.
Note: If you want shapes to have a black border even though their border and fill color are the same as their layer, there isa workaround. See Create a Border for Visio Shapes on a Layer (Workaround) (on page 463)
Create a Border for Visio Shapes on a Layer (Workaround)
Once a shape's border and fill are changed to the same color as the layer, the shapes do not have a black border to definethem from each other in the Microsoft Visio file.
If you want the Visio shapes to use a border that is a different color than the fill, do the following as a workaround.
l Draw an additional rectangle that has no fill (Pattern = None) around each object that is not assigned to a layer(Layer = { No Layer} ).

947
Note: This is similar to the way it would be done in AutoCAD, where the rectangle and the hatch are two separate
objects.
l To easily distinguish classes of objects, create separate layers and colors for each type of floor-standing object inthe data center such as a cabinet, floor PDU, CRAC or UPS.
l Text labels should be modified if the text wraps to multiple lines. Text wrapping causes AutoCAD to insert a dash atthe end of each line.
The workaround to this issue is to size the text box of the label to be wide enough so that the text does not wrap. Reducingthe font size also helps prevent wrapping.
AutoCAD Drawing File Requirements
Following are Power IQ's minimum, AutoCAD drawing file requirements.
Object Outlines - AutoCAD Files
l An object's outline must be closed
Object Name Requirements for Power IQ - AutoCAD Files
l The rack shapes in your drawing file must include unique rack names that are exactly the same as the rack namesin the EDM in Power IQ. Duplicate rack names will not work.
l Facility item shapes in your drawing file must also include unique names that are the same as the facility items inthe EDM. Power IQ supports the following facility items:
l CRACl Floor PDUl Floor UPSl Power panell Standalone meter
l All racks and facility items in the drawing file will be synced to the EDM.l Give each object a unique name that matches the name in the EDMl Object names cannot contain the characters ' \ ?&
Drawing File Layer Requirements - AutoCAD Files
l Do not begin AutoCAD® layer names with the word "dcTrack" unless you are directed to do so.
AutoCAD Drawing Object File Recommendations
l When using AutoCAD to create your floor map drawings, follow these recommendations.l Rack Object Recommendations - AutoCAD Drawing Filesl Rack Object - Commandsl Use the Pline command or the Rectangle command to draw a rack outline

948
l Make the Pline width of a rack outline equal to 0.75” or 1”l When creating a rack with a curved front, use a single Pline and draw the rack starting at the center rear.l Then, to create the curved front, draw several shorter straight lines while varying the angle each time to achieve
the curved look.
Rack Object - Layers
l Draw rack outlines on separate layers in the drawing file to make future modifications and global changes easier.l Object Outline Recommendations - AutoCAD Drawing Filesl Object Outline - Command: Create objects using a polylinel Object Outline - Layer: Create the object outline on a different layer than the hatchl Object Outline - Color: Set the color of the object outline by layerl Object Outline - Commandl Create objects using a polylinel Object Outline - Layers
l Create the object outline on a different layer than the hatchl Object Outline - Color
l Set the color of the object outline by layerl Object Hatch Recommendations - AutoCAD Drawing Filesl Object Hatch - Layer: Draw solid hatches on separate layers in the drawing file so it is easier to make future
modifications and global changes.l Create the hatch on a different layer than the object outline
l Object Hatch - Pattern: Use a solid pattern for the hatch within an outline.l Object Hatch - Color: Set the color of the hatch by layer
l Sunbird recommends using the following colors for hatch layers:l Color 81 for a cabinet Solid Hatchl Color 254 for PDU and CRAC Solid Hatchesl Color 151 for PT Solid Hatchesl Object Hatch - Layers
l Draw solid hatches on separate layers in the drawing file so it is easier to make future modifications and globalchanges.
l Create the hatch on a different layer than the object outline
Object Hatch - Pattern
l Use a solid pattern for the hatch within an outline
Object Hatch - Color
l Set the color of the hatch by layerl Sunbird recommends using the following colors for hatch layers:
l Color 81 for a cabinet Solid Hatchl Color 254 for PDU and CRAC Solid Hatchesl Color 151 for PT Solid Hatches

949
Object Label and Text Recommendations - AutoCAD DrawingFiles
l Names must be unique within each drawing file for each location. For more information, see Object Name Require-ments - AutoCAD Files.
l Object Labels - Layers: Draw object labels on separate layers in the drawing file so it is easier to makefuture modifications and global changes.
l Object Labels - Text Formatting: Object labels should use Arial Bold set to 9 inch height. The text heightassumes the AutoCAD drawing is drawn on a 1:1 scale.
l Use Multiline Text for object labels, and make sure they are contained within the object outline.l Create either a Standard Text label or Multiline Text label to identify each data center row represented in the draw-
ing file.l Cabinet Labels - Position in Row: Since Power IQ does not pull cabinet row position information from draw-
ing files during the sync AutoCAD drawing file process, the cabinet label can contain any number.
This means numbers that appear in cabinet labels can be part of the cabinet name, or used to represent thecabinet's position in the data center row.
l Once cabinets are added by syncing a drawing file, their row position can be assigned manually. Row positions areassigned on a cabinet's item page in the Web Client.
Example
A cabinet labeled "CAB1" in a drawing is can be assigned to position 4 of a row on its item page by selecting from thePosition in Row drop-down.
l Row Labels - Row Label Drop-Down: The row label in the drawing file should match a selection available in theRow Label drop-down on the Create New Item page in the Power IQ Web Client.
Select the row when creating a new cabinet for the data center location represented by the drawing file.
Object Labels - Text Formatting
Object labels should use Arial Bold set to 9 inch height. The text height assumes the AutoCAD® drawing is drawn on a 1:1scale
l Use Multiline Text for object labels, and make sure they are contained within the object outlinel Create either a Standard Text label or Multiline Text label to identify each data center row represented in the draw-
ing file
See Object Name Requirements for Power IQ - AutoCAD Files

Appendix C: Frequently Asked
QuestionsSecurity Questions
Question Answer
Are failed loginattempts recorded?
The audit log records all login attempts. You can also configure Power IQ to send syslog noti-fications for entries in the audit log.
Does Power IQ supportLDAP lock-out set-tings?
Power IQ respects the lock-out settings of an LDAP server. If a user attempts multiple invalidlogins, and the LDAP server set the account to be blocked, Power IQ no longer allows access.
Do session timeoutswork in an LDAP set-ting?
Session timeouts are applicable to LDAP users and local users.
PDU Questions
Question Answer
The status of my PDU says"Degraded."
Check to see if the SNMP agent is enabled on the PDU.
If enabled, check to see if the matching SNMP read strings are configured for the PDU andPower IQ.
Check to see if you are running the latest PXfirmware. For Raritan PXPDUs.
If you have enabled Buffered Data Collection, make sure the PXhas been configured withan SNMP write string. For Raritan PXPDUs.
Reduce the poll rate or increase the number of CPUs (VMware).
How do I configure my MRVPDU so that it will work withPower IQ's power controlfeature?
Make sure that the SNMP community string you use to configure the MRVPDU in Power IQsupports both SNMP v1 and v2c Gets and Sets. The community string must be configuredfor v1 and v2c access in both the Get Clients section and the Set Clients section on theMRVPDU.
950

951
Unable to Collect IPv4 Routing Table
The error "Unable to collect IPv4 routing table" may display when you attempt to launch a Power IQ virtual machine withmultiple NIC cards, using ESXi 5.1.
Renaming two files may be a workaround to this VMware Tools issue.
mv /usr/lib/vmware-tools/plugins32/vmsvc/libtimeSync.so /usr/lib/vmware-tools/plu-
gins32/vmsvc/libtimeSync.so.renamedmv /usr/lib/vmware-
tools/plugins64/vmsvc/libtimeSync.so /usr/lib/vmware-tools/plu-
gins64/vmsvc/libtimeSync.so.renamed

Index
3
3 Phase PDU Outlet ReadingsforRar-
itan PX1 466
A
Accessing Audit Logs 755
Accessing the SNMP Trap Settings
Panel 280
ActionsMenu in Smart Views 476
Active EventsWidget 358
Active PowerTrendsforDevices 475
Add a Dashboard Folder 351
Add a License File 812
Add a PowerControl Task 519, 522,524
Add a User 313
Add Devicesto a Group in the Data
CentersTab 539
Add Devicesto an Existing Device
Group 538
Add Power IQ asan ODBC Inform-
ation Source to yourMac 940
Add Shutdown Commands 421, 524-526
Add Tag Groupsand Tags 608, 630,634, 636, 644-645
Adding a NewPDU and Specifying a
Backup IP Address 103
Adding Facility Itemsto Power IQ
Management 445
Adding orDeleting a Dashboard 352
Adding orDeleting a Door 546
Adding PDUsin Bulkwith CSV
Files 112, 439
Adding PDUsManaged byDominion
SX 127
Adding PDUsto Power IQ 112, 127-128, 131, 409, 411, 414, 445,
511, 706, 717, 735
Adding PDUswith Custom Dynamic
Plugins 112, 128, 445, 735
Adding Raritan PDUsin Port For-
warding Configuration 112,131
Adding Raritan PowerMeterand
PowerMeterBranch Circuit
Monitor 121
Adding Reportsto the Analytics
Page 584-585, 587
Adding ServerTechnologyPDUs 132
Adding VerisBranch Circuit Monitors
with Acquisuite 126
Adding, Editing, and Deleting User
Groups 339
Adding, Editing, and Deleting
Users 313
952

Adding, Editing, orDeleting a Backup IP
Addressforan Existing PDU 103-104
Additional Configuration Tasks 85
Additional Configuring Polling Path Redund-
ancy(Backup IP AddressSupport) for
PDUsTasks 103
Additional Custom Mapping Rules 718, 725
Adjusting Event Severities 185
Advanced Reporting with Database and
Reporting Programs 820
Advanced Thread Pooling Settings 99, 473
Aisles 916
AllowHTML Widgetson Dashboard 362-363
AllowYourMac to AccessPower IQ via
ODBC 939
Analytics 584
APC Netbotz Supported Events 199
APC RackPDU Supported Events 193
APC Supported Events 192
APC TransferSwitch Supported Events 198,470
APC UPS Supported Events 195
Aphel Supported Events 201
Appliance Administration 756
ASHRAE® Envelope Descriptions 364
Asset Strip and Tag Events 457
AssetStrips 925-926
Assign Rolesto a User 189, 341, 344, 348,
358
Assign Rolesto a UserGroup 341, 346, 348
Assign Roleswithin a Data Center 341, 344,346, 348, 462, 476
Assign Tagsin the Data CentersTab 630,634, 636, 641, 644
Assigning RolesforUserPermissions 341,610
Assigning Tagswith CSVImport 641-644
Associate a Circuit orOutlet with an IT
Device 411, 424
AssumptionsAbout Supported Racks 616
Autoconfiguration ofCPI Doorsand DoorMap-
pings 567
Automatic Delete ofCleared Events 272
AutomaticallyAssociate Sensorsin the
EDM 411, 501
Available Setting Options 777
Avocent Supported Events 202
B
Basic Configuration forSSH Shutdown 525,532
Basic Configuration forWindowsRemote
Shutdown 534
Baytech Supported Events 204
BCM 121
BCM2 121
BinarySensorMappings 668
953

BulkAdding, Editing, orDeleting Backup IP
AddressesUsing CSVImport 103, 105
BulkChange PDU IP AddressFile Require-
ments 175-176
BulkChange PDU IP Addressesand View
Run HistoryReports 175
BulkConfiguring DoorsUsing CSV 550
C
Cabinet Capacityand RailoverRepor 612
Cabinet DoorLockControl 543
Calculate Potential Cooling Energy
Savings 364, 366
CapacityForecast Chart Widget 359
CapacityGauge Widget 361
Change the AdministratorUsername Pass-
word 311
Change Web UserSession Timeouts 384
Charting Archive Data Using the Device
Chart 594
Chatsworth ProductsSupported Events 206
CheckPDUsAdded with Dynamic
Plugins 706, 717, 738
ClearEvents 271, 358, 455
Clearing Enterprise Relationships 425
Common Mappings 653
Configure Default Threshold Settings 260-
261, 506
Configure Notification Filters 259-260, 273,275-276, 506
Configure PowerControl Options 517-518,536-537
Configure RawSensorReadingsStorage 92,750, 752
Configure the Numberof Itemsin the
List 431
Configure the PowerControl Settingsfora
Device Group 536-537, 540
Configuring APC Netbotz RackPDU Event
(Trap) Notification Settings 299
Configuring Charts 429, 588
Configuring Custom Fields 275, 429
Configuring Data Rollup Retention 403
Configuring Enterprise Power IQ Settings 386
Configuring Facility Item DisplaySettings-
ViewFacility ItemsbyIP orName 181
Configuring Graceful Shutdown 519, 524
Configuring Health Polling 87, 471
Configuring Logging through Syslog 86
Configuring NotificationsbyEvent Group 305
Configuring NotificationsbyIndividual
Event 300
Configuring NTP ServerSettings 760
954

Configuring ODBC UserCredentials 816,818, 821, 934, 940-941
Configuring Password Requirements 311,313, 379, 383, 817
Configuring PDU DisplaySettings- View
PDUsbyIP orName 181, 444, 454
Configuring ProxyConnectionsto Power
IQ 180
Configuring Remote Accessto
Database 402
Configuring Remote Storage ofArchive
Files 388, 397, 750, 752
Configuring the Authorization Warning Mes-
sage 385
Configuring the LDAP ServerSettings 316
Configuring the Numberof Itemsin the Facil-
ity ItemsList 438
Configuring the SNMP Gateway 745
Configuring the System Clock 759
Configuring the System ClockManually 761
Configuring Trap Forwarding
Destinations 292
Configuring Trap Fuse Settings 289
Configuring Widgets 358
Connecting to Power IQ 81, 812
Control Power to Devicesin a Group 519
Control Power to Outlets in a Data
Center 518, 524
Cooling Chart Details - HowYourSensor
Data isCharted 365
Cooling Chart Widget 363, 510
Correlated Fieldsin ODBC Tables 822-823
CPI Supported Events 206
CRAC Details 483-484
CRAC EnergyTrends 483
CRAC Mappings 654, 705
CRAC Readings 483
CRAC Smart View 446, 483
CRACs 483
CRACsin the Data CenterBrowser 375, 482
Create a Custom Mapping Dynamic
Plugin 704, 714
Create a Device Group 536-537
Create a Power/EnergyReport 608
Create a RackCapacityFailoverReport 617
Create a Report 606-607
Create a Structured Dynamic Plugin 703-704
Create a Support Connection 806
Create a System Configuration Backup
File 388, 391
Create a Temperature Report 610
Create an EDM Manually 410-412
Create Database Connection in Excel 934,940-941
Create Device GroupsforPowerControl 519,522
Creating a Chart 584, 587, 589, 594, 598
955

Creating a DoorSecurityAudit Report 607,621
Creating a DoorSecurityStatusReport 607,618
Creating a Power/EnergyReport 607
Creating a RackCapacityand Failover
Report 612
Creating a RackFailoverReport 607
Creating a Temperature Report 607
Creating YourEDM 358, 369-370, 374, 410,431, 501, 510, 589
CSVColumnsforCIRCUIT Objects 415
CSVColumnsforOUTLET Objects 414
CSVColumnsforPDU Objects 414
CSVColumnsforSENSOR Objects 415
Custom Dynamic Plugin 652
Custom Dynamic Plugin Example Screen-
shots 727
Custom Dynamic Plugin Mapping Example -
UPS 729
Custom Mapping Dynamic Plugins 712
Customizing YourViewofFacility Items, IT
Devices, and Events 182
Customizing YourViewofPDUs, Devices, and
Events 267, 432
Cyberswitching Supported Events 207
D
Dashboard 350, 588
Dashboard Heading Widget 362
Dashboard Slide ShowMode 355
Data Backups 388
Data CenterPowerReport forPast
Week 629, 632
Data Management 387
Data Model Element 718
Data Model ElementsbyPDU Type 718
Data SourcesforEach Time Range 617
DataCenters 912
Decommission a Device 800
Decommission a Facility Item 788
Decommission a Sensor 796
Decommission an IT Device 795
Decommissioning a Facility Item 782
Decommissioning an Object 787
Decrypt Backup FilesBefore Restoring 380,393-394
Default UserGroups 339
Deleting Dashboard Foldersand
Dashboards 355
Device Chart Measurements 589, 593-594
Device Chart Settings 584, 587-589, 591
956

Device Chart Widget 358, 589, 594
Disable Graceful Shutdown foran IT
Device 527
Displaya Logo on EveryPage 361, 758
DoorAccessManagement 543
DoorControl Permissions 544
DoorLockAccess 543
DoorLockControl 543
DoorLockOverride Timer 553
DoorLockPermissions 544
DoorLockRelockTimer 552
DoorLockReport 618, 621
DoorLocks 543
DoorSmart Page 544
Download and Install Microsoft QueryforMac
(included in Office 2011 v14.1.2) 938
Download and Install ODBC Client Driver for
Mac 937
Downloading DailySensorReadings 403
Downloading System Configuration Backup
Files 388-389
Duplicate Trap Handling 683
Dynamic Plugins 445, 472, 483, 485, 490,493, 497, 604, 650
E
EAC 566
Eaton eAm004 Supported Events 207
Edit a Saved Rollout Plan 138
Edit a Saved Upgrade Plan 770
Editing PDUsunderPower IQ
Management 471-472, 476
EDMNodes 924
Electronic AccessControl forCPI Doorsand
Locks 566
Electronic AccessControl System 566
Enable Graceful Shutdown foran IT
Device 421, 524-526
Enable orDisable Event Notifications 259,273, 358
Enable orDisable Event Notificationsvia
Email 273
Enable orDisable Event Notificationsvia
JSON 274
Enable orDisable PowerControl 516, 518,523-524, 536-537
Enable orDisable the Root AccountsforSup-
port 809
Enabling and Configuring the Data
Archive 404
Enabling Single Sign On forRaritan
Products 381, 443
Enabling the Web API UserAccount 383
Enabling the WS API 382
Enabling/Disabling the DoorOverride Relock
Timer 553
Enabling/Disabling the Global DoorRelock
Timer 552
Enabling/Disabling Trap Filtering 283
957

Encrypting Data Backup Files 380
Enterprise Relationshipsand the EDM 360,405, 412, 445-446, 584, 602
Event and Trap Management 188
Event Clearing 272, 684
EventsThat ClearQuickly 278
Example
Event SummaryMessage with
Variables 677, 682, 695, 706, 716
Trap Mapping with Filters 677, 693, 706,
716
Trap Mapping with FiltersforBabel Buster
SPXSNMP Gateway 677, 679,
697, 716
Execute a Saved Rollout Plan 139
Execute a Saved Upgrade Plan 771
Export a Report to PDF orCSV 606, 628
Export and Import Tags 642
Export Existing Tag Assignments 642-644
Export SensorData 364, 366
Export the EventsList to CSV 269
Export the Facility ItemsList to CSV 439
Exporting an EDM 414
Exporting Charts 600
Exporting Outlet Namesto a CSVFile 174
Exporting Outlet Namesto CSV 171
External SensorData from Raritan PX 96
External Temperature and HumiditySensor
Mappings 665, 672, 704
External Temperature and HumiditySensor
MappingsExample Screenshots 672,731
F
FacilitiesChart Widget 358, 369, 374, 589
Facility Items 430
Filter the EventsList 182, 267
Filter the Facility ItemsList 431
Filter the PDUsList 182, 432
Find the MIBFile 700-701, 712
Find the ModbusRegisterList 712-713
Finding All Entities in a Rack 935
Finding Unmapped PDUs 427-428
FloorMap Data Refresh Rates 373
FloorMap Drawing Files 370
FloorMap UserPermissions 374
FloorMap Widget 370
FloorPDU Details 485
FloorPDU Elements 485, 487
FloorPDU EnergyTrends 485
FloorPDU Mappings 654, 705
FloorPDU Readings 485
958

FloorPDUs 485
FloorPDUsSmart View 446, 485
FloorUPS Details 490, 492
FloorUPS Elements 490-491
FloorUPS EnergyTrends 490
FloorUPS Mappings 656, 705
FloorUPS Readings 490
FloorUPS Smart View 446, 490
Floors 914
Formulate a Database Query 942
G
Geist EM Supported Events 211
Geist RCXSupported Events 213
Geist Supported Events 210
Geist V3 Supported Events 214
Generate a Default EDM 410, 423
H
Hewlett Packard PDU2 Supported
Events 217
Hewlett Packard Supported Events 216
Hiding a Shared Dashboard 355
HowDoesPower IQ Calculate the Sum ofa
Data CenterNode? 375
HowPower IQ AssociatesFacility Itemswith
a Structured orCustom Plugin 734
Howto Add PDUsto Power IQ 112
Howto Secure a Sunbird Appliance 763
HTML Widget 362
I
Identifya Decommissioned Device 800
Identifya Decommissioned PDU 797
Identifya Decommissioned Sensor 801
IdentifyFacility Itemsin Maintenance
Mode 783
Identify the OIDsforMapping 703
IdentifyTrap OIDsand Parameters 678, 694,702
Image Widget 361, 758
Import and Export Plugin Files 746
Import EDM Object Mappings 261, 360, 410-412, 414, 429
Import ErrorsforTags 642, 644-645
Importing More than 2500 Objects 415, 417
IndexMapping Format 705, 709
Information Available in the RackCapacity
and FailoverReport 614
Inlet Readingsand Line ReadingsforThree
Phase PDUs 452
Installing an HTTPS Certificate 376
IT Device ReadingsRollups 920-922
ITDeviceReadingDailyRollups 920
ITDeviceReadingHourlyRollups 921
ITDeviceReadingMonthlyRollups 922
ITDevices 920
959

K
KnurrSupported Events 218
L
Latest PUEReading Gauge Widget 367-368,601
Launch the Web Interface fora Raritan PX
PDU 381, 443, 476
Launching the Web Browserof the Chats-
worth PDU 479
License Count RulesforRackPDUsand
Facility Items 813
Licensing 810
Liebert Supported Events 221
LimitationsofDynamic Plugins 651
Limiting ViewPermissions 340
LinkDatabase Tablesin Microsoft®
Access® 822
List PUECalculationsand Adjustments 367,601, 605
Load forAll B-Side PDUsforLast Month 629,634
Locking, Unlocking, and Automatic Relocking
ofDoors 551
M
Maintenance Mode 767, 771, 778
Manage Dashboards 351
Manage Event NotificationsforUsers 276
Manage Firmware Versions 775
Managing Individual Trap Drop Filters 284
Managing Individual Trap Forwarding
Filters 294
Managing Removed orOut ofService
Items 776
Managing Uploaded Configuration Files 142
ManuallyDefine Individual Device Chart
Lines 589, 591, 594
MappingsforEach PDU Type 653, 703-704
Metadata Definitions 671
Metadata forBinarySensors 673
Metadata forCircuit Breakersand
Outlets 671, 704, 714, 720
Metadata forEnvironmentalSensors 705
Metadata forSensors 672, 674-675, 715, 721
Metadata forStandard and Custom Dynamic
Plugins 671
Migrate Custom Field Data 638, 640
Migrating Existing Data to Tags 638, 640
MonthlyEnergyReport forOne Internal Cus-
tomerwith Scheduled PDF
Delivery 629-630
MRVSupported Events 222
Multi-Inlet PDU Readings 453
960

N
Naming Environmental Sensors 508, 511
Naming Individual Outlets 169-170
Naming Outlets in Bulkwith CSVFiles 169,171, 174
Native Support forChatsworth eConnect
PDUs 477
Netbotz Supported Events 223
Note on Geist and Rittal PDUs 103
O
Object Identifier 717
Object Typesand theirHierarchy 406-408,411
Obtain Active Powerand Apparent Power
Data fora PDU With IP Address
66.214.208.92 932
Obtain Active Powerand Apparent Power for
an IT Device With Name
“DBServer’’ 932
ODBC Access 402
ODBC Client Configuration 818
ODBC Configuration and Sample Queryfor
Apple Users 936
OID Variablesand Format 704-706
Open Port Requirements 79
Open PortsforGraceful Shutdown 524, 531
Organizing Facility Itemsin the Data Center
Browser 445, 481
Overall PDU Health 359, 599
P
Pairing PDUsforRackCapacityand Failover
Reports 614
PDU ConnectivityHealth Statuses 471
PDU ConnectivityLost and Restored
Events 259
PDU Elements- RackSmart Viewand Rack
PDU Smart View 449, 458, 463, 518
PDU Health Chart Settings 584, 587-588,598
PDU Health Chart Widget 359, 598
PDU Mappings 653
PDU Outlet Naming and Setting System
Attributes 169
PDUBatteries 927
PDUBatteryReadingDailyRollups 929
PDUBatteryReadingMonthlyRollups 930
PDUBatteryReadings 928
PDUBatteryReplacementStatusRecords 931
PDUCircuitBreakerReadingDailyRollups 860,902
PDUCircuitBreakerReadingHourlyRollups
859, 901
PDUCircuitBreakerReadingMonthlyRollups
861, 903
PDUCircuitBreakerReadingsRollup - To Be
Deprecated 858, 900
PDUCircuitBreakers 825, 869
PDUCircuitBreakersReadings 838, 881
961

PDUCircuitPoleReadingDailyRollups 852,895
PDUCircuitPoleReadingHourlyRollups 854,897
PDUCircuitPoleReadingMonthlyRollups 853,857, 896, 899
PDUCircuitPoleReadings 837, 880
PDUCircuitPoles 824, 868, 928
PDUCircuitReadingDailyRollups 855, 898
PDUCircuitReadingHourlyRollups 850, 893
PDUCircuitReadingMonthlyRollups 849, 891
PDUCircuitReadings 836, 879
PDUInletReadingDailyRollups 831, 874
PDUInletReadingHourlyRollups 829, 873
PDUInletReadingMonthlyRollups 832, 875
PDUInletReadings 827, 870-871
PDUInlets 826, 870
PDULineReadingDailyRollups 847, 890
PDULineReadingHourlyRollups 846, 889
PDULineReadingMonthlyRollups 848, 891
PDULineReadings 835, 878
PDULineReadingsRollup - To Be
Deprecated 845, 888
PDULines 826, 869
PDUOutletReadingDailyRollups 842, 885
PDUOutletReadingHourlyRollups 841, 883
PDUOutletReadingMonthlyRollups 843, 886
PDUOutletReadings 834, 877
PDUOutletReadingsRollup - To Be Deprec-
ated 839, 882
PDUPanels 826, 870
PDUReadings 827, 870
PDUReadingsRollup - To Be
Deprecated 844, 887
PDUs 448, 866
PDUswith Fuses 467
PDUSensorReadingDailyRollup 863, 905
PDUSensorReadingHourlyRollup 862, 905
PDUSensorReadingMonthlyRollup 863, 906
PDUSensorReadings 839, 881
PDUSensorReadingsRollup - To Be Deprec-
ated 861, 904
PDUSensors 864, 906
PDUTransferSwitches 865, 907
PDUTransferSwitchStates 864, 907
PermissionsforPowerControl on a Device
Group 342, 349
Plan a NewRollout 136, 138, 142
Plan a NewUpgrade 767, 775
Plugins 648
962

Polling Path RedundancyforCPI PDUs
(Secure Array 106
PortsOpen Between Power IQ and
PDUs 473
PowerControl 515
PowerCycle a Device 520
Power IQ ODBC Schema 822-824, 942
Power IQ Role Definitions 341, 344, 346, 348,516, 518
PowerPanel 493
PowerPanel Mappings 658, 705
PowerPanelsDetails 493, 496
PowerPanelsElements 493, 495
PowerPanelsEnergyTrends 493
PowerPanelsReadings 493-494
PowerPanelsSmart View 446, 493
Prepare PDUsforPower IQ Event Man-
agement 190
Preparing ServersforGraceful
Shutdown 524, 530
PrerequisitesforSupport Connections 805,806
ProxyIndexDetails 120, 173
PUE- PowerUsage Effectiveness 601
PUETrend Chart Widget 367, 601
PUECalculations 927
Q
QuickSearch forFacility Items, Racks, Doors,
and IT Devices 444
R
RackDetails 462
RackEnergyand Environmental Trends 459
RackIT Devices 449, 458, 460, 518
RackPDU Asset Strips 449, 456, 458
RackPDU Details 449, 454, 458
RackPDU EnergyTrends 449-450, 458
RackPDU Event Listing 449, 455, 458
RackPDU Mappings 659, 705
RackPDU Readings 449, 451, 458
RackPDU Sensors 449, 454, 458
RackPDU Smart View 446, 449, 458, 501
RackReadingsRollups 918
RackSmart View 446
RackThresholds 188, 260, 373
RackTransferSwitches 468
RackUPS Mappings 661, 705
RackReadingDailyRollups 919
RackReadingHourlyRollups 918
RackReadingMonthlyRollups 919
Racks 569, 918
RackUnits 926
Raritan Electronic DoorLocks 569
Raritan EMXSupported Events 224
Raritan PowerMeterSupported Events 227
963

Raritan PX/PX2/PX3 Supported Events 232
Raritan PX3TS TransferSwitch Supported
Events 243, 470
Remove a Device from a Group 541
Remove a Shutdown Command from Power
IQ 529
Remove Rolesfrom a User 345
Remove Rolesfrom a UserGroup 347
Report and Monitor3 Phase Power 185
Report and MonitorCircuit Breakers 186
Report Examples 629
Report Maximum PowerReading forEach IT
Device Since Added to Power IQ 933
Reportsand Tags 462, 606
RequirementsforBulkConfiguration 135
RequirementsforCooling Charts 364
RequirementsforCreating EDM 409
RequirementsforPUE 367-368, 602
Rescanning a Facility Item 447
Residual Current Monitoring 453
Residual Current Readings 453
Restore and Clone ServerTechnologyand
Raritan Device Configurations 182
Restoring System Configuration
Backups 388, 394
Restricting Web and Shell AccessBased on
IP Address 378
RestrictionsofODBC UserCredentials 816-817
Return a Facility Item to Service 802
Rittal Supported Events 246
Rollout Timing 139
Rooms 915
Rows 917
Run a Report 626
S
Sample ODBC Queries 932
Sample SSH Shutdown Commands 525, 533
Save Support Logs 808
Schedule a Report 606, 609, 611, 627
Scheduling PowerControl 521
SchleifenbauerSupported Events 248
Search forPDUsand Devices 181, 444
Securityand Encryption 376
SensorAssignment Guideline 509, 514
SensorEnvironmental Trends 508-509
SensorGrid 506
SensorMapping CSVImport File
Structure 722
SensorMappings 716-717
964

SensorMultipliers 716, 723
SensorSmart View 501, 508
SensorThresholds 506
SensorType 717, 720
Sensors 454, 501
SensorsConnected to PX1 and PX2
PDUs 512
ServerTechnologyPDU Firmware Version
and X.509 Certificate Issues 132
Servertech PRO2 (Sentry4) Supported
Events 251
Servertech Supported Events 250
Set a Capacity 360
Set a Different PowerOn Delayfora
Device 542
Set Facility Itemsto Maintenance Mode 779
Set Fahrenheit orCelsiusTemperature 763
Set Phase LabelsforCircuit Pole Phase 720,762
Set Polling Intervalsand Sample Ratesat
Even Multiples 94
Set PUEFlags 601-603
Set PUEThresholds 367-368
Set RackCapacityand Override Threshold
Percentages 260-261, 360, 420, 462
Setting Default Estimated Voltages 102, 118
Setting DoorPlacement with Tagsand Tag
Groups 551
Setting SNMP System Attributesfor
PDUs 172
Setting the Dashboard Layout 358-364, 367,369, 371, 374
Setting the Default SNMP Version for
PDUs 101
Settings 82
Sharing Dashboards 355
Sharing Reportson the AnalyticsPage 586
Showing Accurate Circuit Pole Positions 726
Shutting Down and Restarting Power IQ 277,754
Sinetica Unite Panduit Supported Events 254
SMTP ServerSettings 273, 277
SNMP Gatewaysand Custom Dynamic Plu-
gins 652, 744
SNMP Trap Filtering and Event-Based Trap
Forwarding 279
SNMP Trap SettingsPanel 281
Specify Inlet, Outlet, orOutside AirLocation
forEnvironmental Sensors 364-365,508, 510
Standalone MeterDetails 497, 499
Standalone MeterElements 497, 499
Standalone MeterEnergyTrends 497
Standalone MeterMappings 664, 705
Standalone MeterReadings 497-498
Standalone Meters 497
Standalone MetersSmart View 446, 497
965

StandardsPlugins 649
Starline Supported Events 257
StatesofManaged Sensors 513
Stop a Support Connection 807
Structure of the EDM Import File 414
Structure of the Outlet Name CSVFile 171,173
Structured Dynamic Plugin 652
Structured Dynamic Plugins 700
Support and Licensing 804
Support Connections 79, 804
Support for IPv6 108
Supported CPI Doorand Electronic Lock
SensorStatuses 568
Supported Drawing File Software and File
Format 370
Supported Events 190-191
Syncing the FloorMap Drawing with
EDM 371-372
System Configuration Backup File
Retention 396
T
Tag Example
Report on RacksbyCustomerTag 636-
637
TagEntries 909
TagGroups 910
Tags 911
Temperature Unit Configuration
Precedence 667
Timezone Configuration forODBC Data 819
TipsforBabel BusterConfiguration 697-698
TransferSwitch Details 469
TransferSwitch Elements 469
TransferSwitch EnergyTrends 469
TransferSwitch Event Listing 470
TransferSwitch Readings 469
TransferSwitch Smart View 469
Trap Drop Filtering Criteria 287
Trap FilterRegularExpressions 680
Trap FilterWildcards 680
Trap Fuse Handling 288
Trap Mapping Variablesand Format 677,682, 694, 697, 706, 716
Trap OID Wildcards 679, 698
Trap Queue Handling 297
Trap Support forBackup IP Addresses 105
Trap Support in Dynamic Plugins- Structured
orCustom 677, 704
Trend Chart Settingsin Smart Views 474-475
Tripplite Supported Events 257
966

Troubleshooting ConnectivityHealth 473
Troubleshooting Dynamic Plugin Trap Map-
ping 743
Troubleshooting Dynamic Plugins 740
TypesofDynamic Plugins
Structured and Custom 650, 652
U
Unlocking CPI Doors 568
Upgrade Timing 772
Upgrading Power IQ Firmware 753
Upgrading Raritan PX, PowerMeter, and
EMX 766
Use a MIBBrowser 678, 702
UserConfiguration 310
UserPermissionsforEvent Management 189
UserPermissionsforReportsand Tags 646
Using the FloorMap 372
Using the PDUsTab 431
Using the SensorTab 501
V
Valid IPv6 AddressFormats 108
ViewCompleted Rollout Plans 136, 139, 141
ViewCompleted Upgrade Plans 771, 774
ViewEvents 262
ViewLicenses 811
ViewPDUsUsing a Dynamic Plugin 739
ViewPowerControl TaskResults 523
ViewSaved Rollout Plans 137
ViewSaved Upgrade Plans 769
ViewSensorData Point Details 364-365
ViewStatusofRollout Plans 140
ViewStatusofRollout Plansin Progress 136,139
ViewStatusofUpgrade Plansin
Progress 771, 773
ViewTag Groups- Enhanced Tagsand Tag
Permissions 646
Viewthe IT DevicesUsing a Shutdown Com-
mand 528
Viewing a Backup IP Address 103
Viewing a Facility Item 446
Viewing Enterprise Relationship
Summaries 426
Viewing Orphaned SystemsInformation 427-428
Viewing the Run Historyand Report fora Bulk
Configuration Template 143
W
What's the difference between 370, 374, 589,592
What are Mappingsand Relationships? 407
What are Power IQ Analytics? 584
What isan Enterprise Data Model (EDM)
Object? 406
What PUEFlagsDoesPower IQ Set Auto-
matically? 601, 603-604
967

When to Delete and Rediscovera PDU Using
a Dynamic Plugin 742
When Will Graceful Shutdown Abort? 535
Wildcard IndexMapping Example 668-669
Wildcard IndexMappings- Structured
Dynamic PluginsOnly 668, 705
968


![SAP IQ Installation and Update Guide [Linux]](https://static.fdokumen.com/doc/165x107/6316cba2c72bc2f2dd053a67/sap-iq-installation-and-update-guide-linux.jpg)