Presentación de PowerPoint - Wear-IQ
40
Factores significativos en el proceso de desgaste de acero API 5L X65 por erosión- corrosión en el transporte de relave de cobre – Estudio experimental Dr.-Ing. Magdalena Walczak, PhD(c) Javiera Aguirre Pontificia Universidad Católica de Chile Escuela de Ingeniería Vicuña Mackenna 4860 Macul, Santiago, Chile Tel. +562 2354 4229 Email: [email protected]
-
Upload
khangminh22 -
Category
Documents
-
view
0 -
download
0
Transcript of Presentación de PowerPoint - Wear-IQ
Factores significativos en el proceso de desgaste de acero API 5L X65 por erosión-
corrosión en el transporte de relave de cobre – Estudio experimental
Dr.-Ing. Magdalena Walczak, PhD(c) Javiera Aguirre
Pontificia Universidad Católica de ChileEscuela de IngenieríaVicuña Mackenna 4860Macul, Santiago, ChileTel. +562 2354 4229Email: [email protected]
CORROMIN, July 2017, Magdalena Walczak & Javiera Aguirre
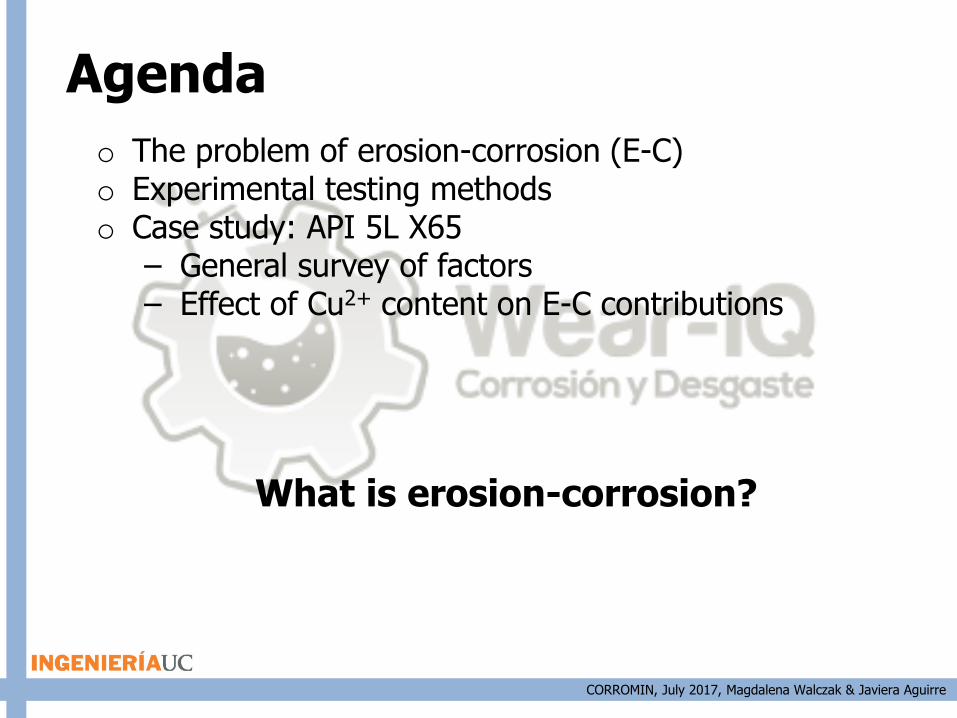
o The problem of erosion-corrosion (E-C)o Experimental testing methodso Case study: API 5L X65
– General survey of factors– Effect of Cu2+ content on E-C contributions
Agenda
What is erosion-corrosion?
CORROMIN, July 2017, Magdalena Walczak & Javiera Aguirre
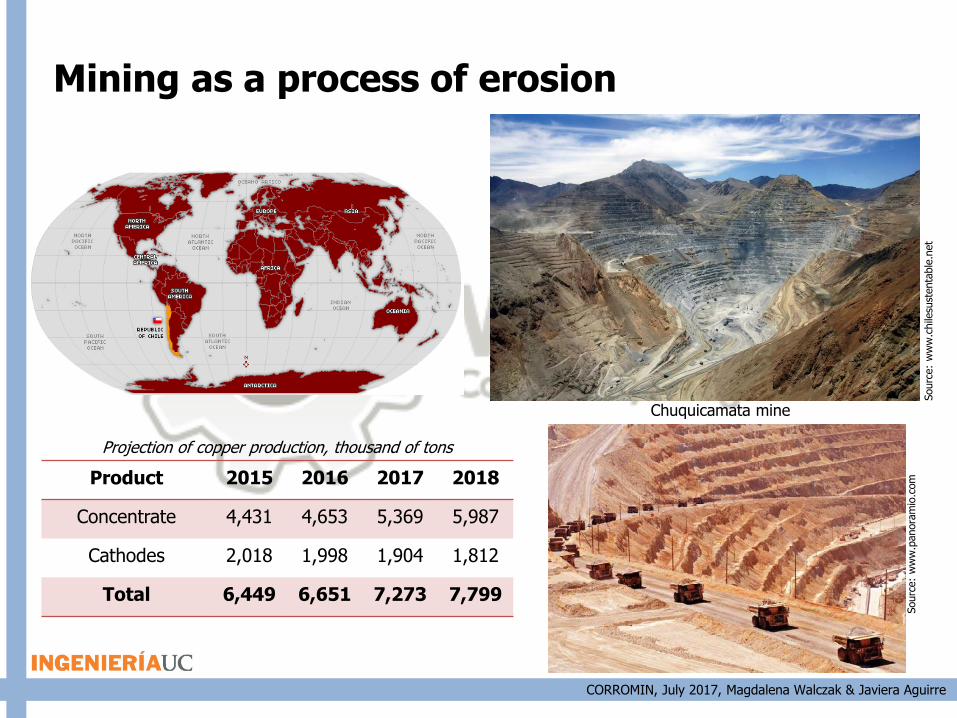
Chuquicamata mine
Sourc
e:
ww
w.p
anora
mio
.com
Sourc
e:
ww
w.c
hile
sust
enta
ble
.net
Product 2015 2016 2017 2018
Concentrate 4,431 4,653 5,369 5,987
Cathodes 2,018 1,998 1,904 1,812
Total 6,449 6,651 7,273 7,799
Projection of copper production, thousand of tons
Mining as a process of erosion
CORROMIN, July 2017, Magdalena Walczak & Javiera Aguirre
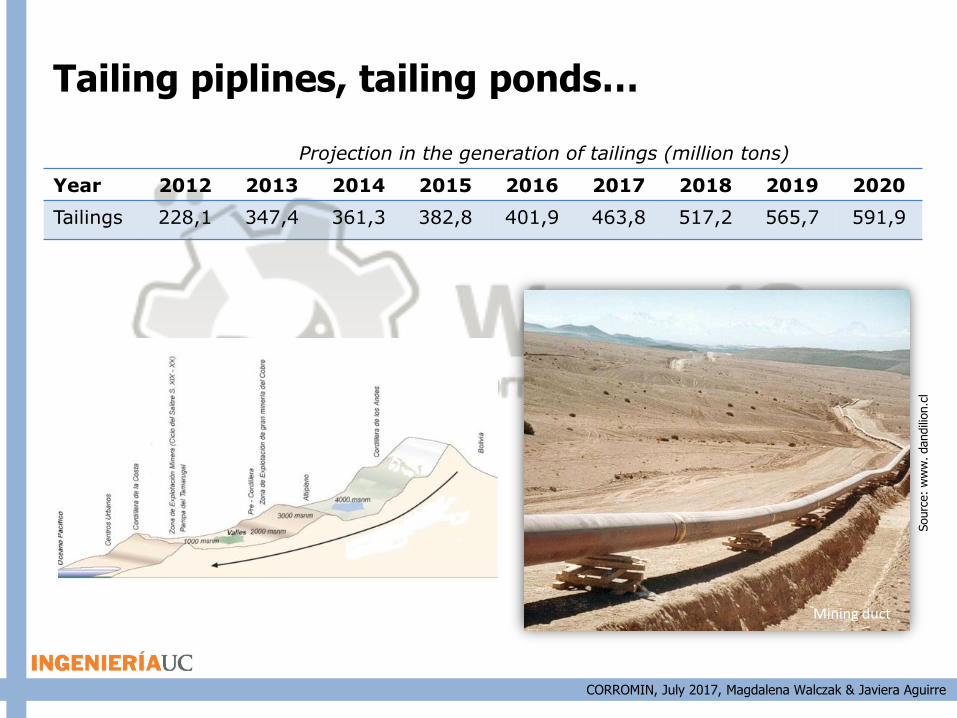
Tailing piplines, tailing ponds…
Mining duct
Sourc
e:
ww
w. dandili
on.c
l
Year 2012 2013 2014 2015 2016 2017 2018 2019 2020
Tailings 228,1 347,4 361,3 382,8 401,9 463,8 517,2 565,7 591,9
Projection in the generation of tailings (million tons)

CORROMIN, July 2017, Magdalena Walczak & Javiera Aguirre
Tailing piplines, tailing ponds…
Wear by erosion-corrosión in pump casings and impellers
Google Earh, June 2017
CORROMIN, July 2017, Magdalena Walczak & Javiera Aguirre
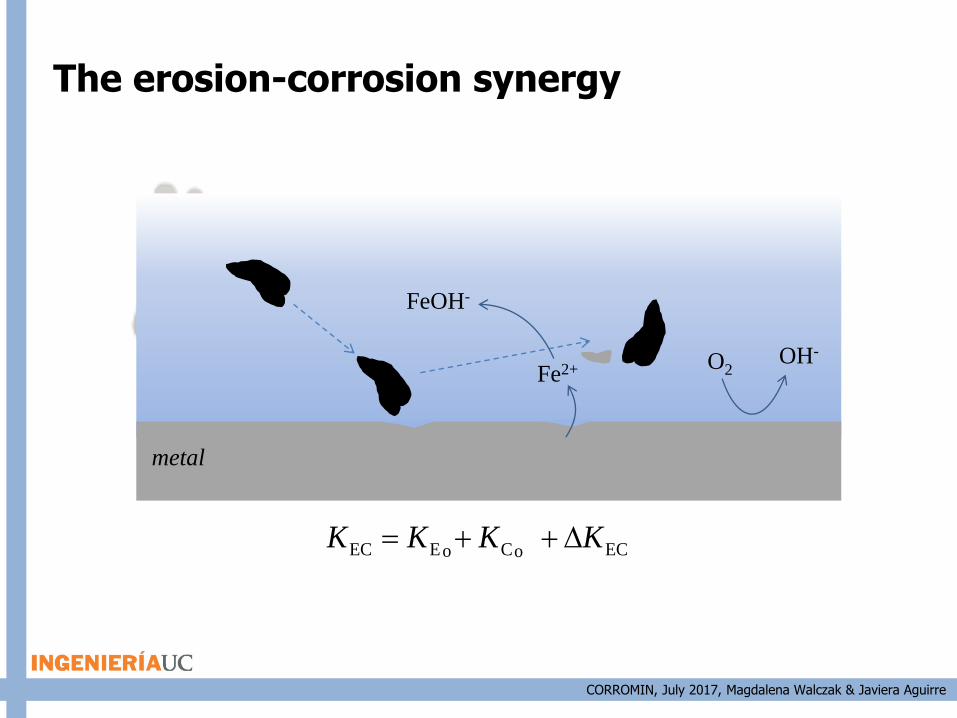
The erosion-corrosion synergy
metal
O2OH-
Fe2+
FeOH-
oEEC KK oCK ECK

CORROMIN, July 2017, Magdalena Walczak & Javiera Aguirre
oEEC KK oCK CE KK
metal
passive layer
O2OH-
Fe2+
FeOH-
Fe2O3/Fe3O4
The erosion-corrosion synergy
CORROMIN, July 2017, Magdalena Walczak & Javiera Aguirre
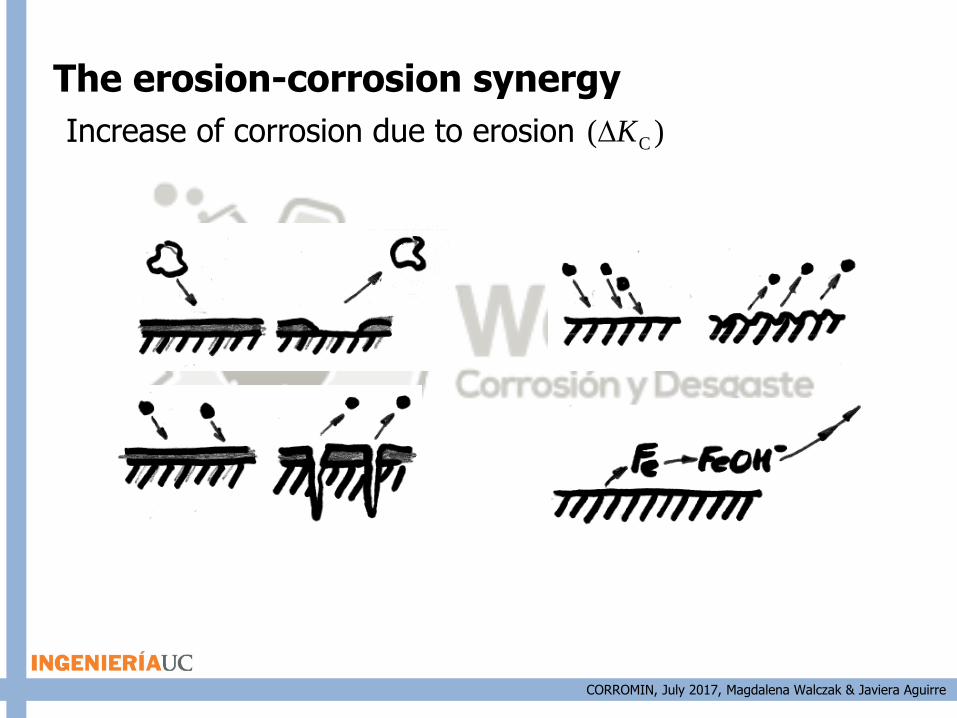
)( CKIncrease of corrosion due to erosion
The erosion-corrosion synergy

CORROMIN, July 2017, Magdalena Walczak & Javiera Aguirre
)( EKIncrease of erosion due to corrosion
The erosion-corrosion synergy
CORROMIN, July 2017, Magdalena Walczak & Javiera Aguirre
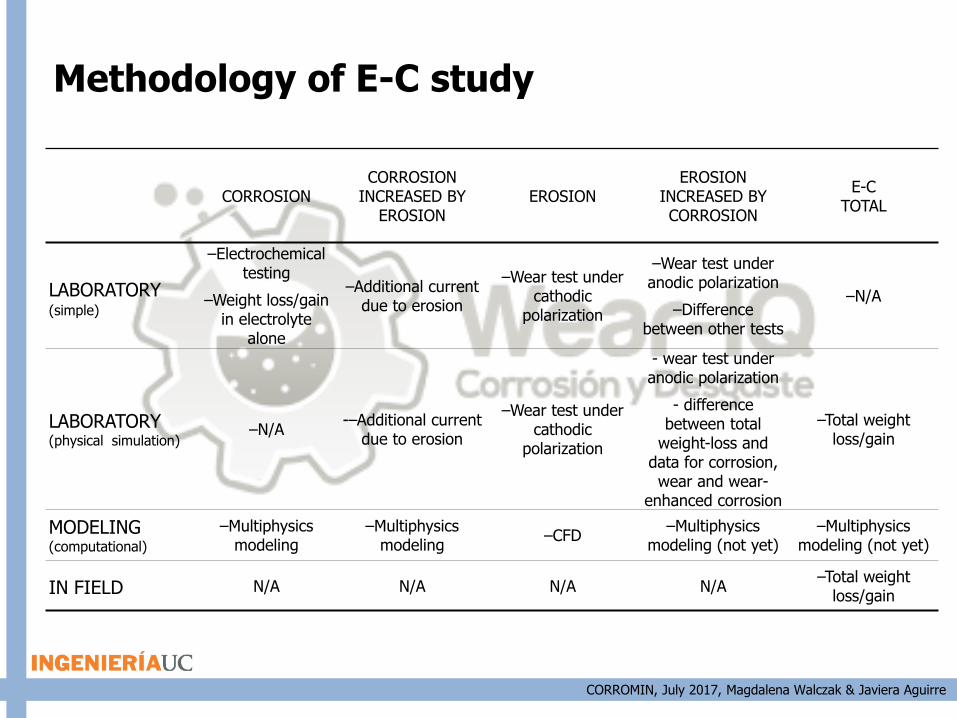
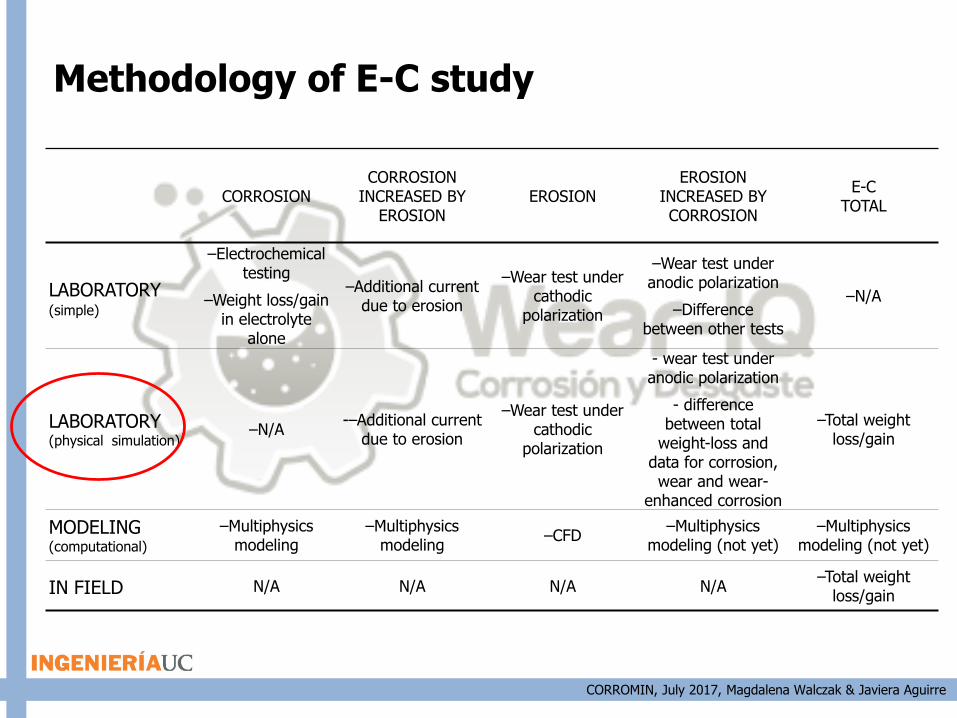
CORROSIONCORROSION
INCREASED BY EROSION
EROSIONEROSION
INCREASED BY CORROSION
E-C TOTAL
LABORATORY(simple)
–Electrochemical testing
–Weight loss/gainin electrolyte
alone
–Additional current due to erosion
–Wear test under cathodic
polarization
–Wear test under anodic polarization
–Difference between other tests
–N/A
LABORATORY (physical simulation)
–N/A-–Additional current
due to erosion
–Wear test under cathodic
polarization
- wear test under anodic polarization
- difference between total
weight-loss and data for corrosion, wear and wear-
enhanced corrosion
–Total weight loss/gain
MODELING(computational)
–Multiphysics modeling
–Multiphysics modeling
–CFD–Multiphysics
modeling (not yet)–Multiphysics
modeling (not yet)
IN FIELD N/A N/A N/A N/A–Total weight
loss/gain
Methodology of E-C study
CORROMIN, July 2017, Magdalena Walczak & Javiera Aguirre
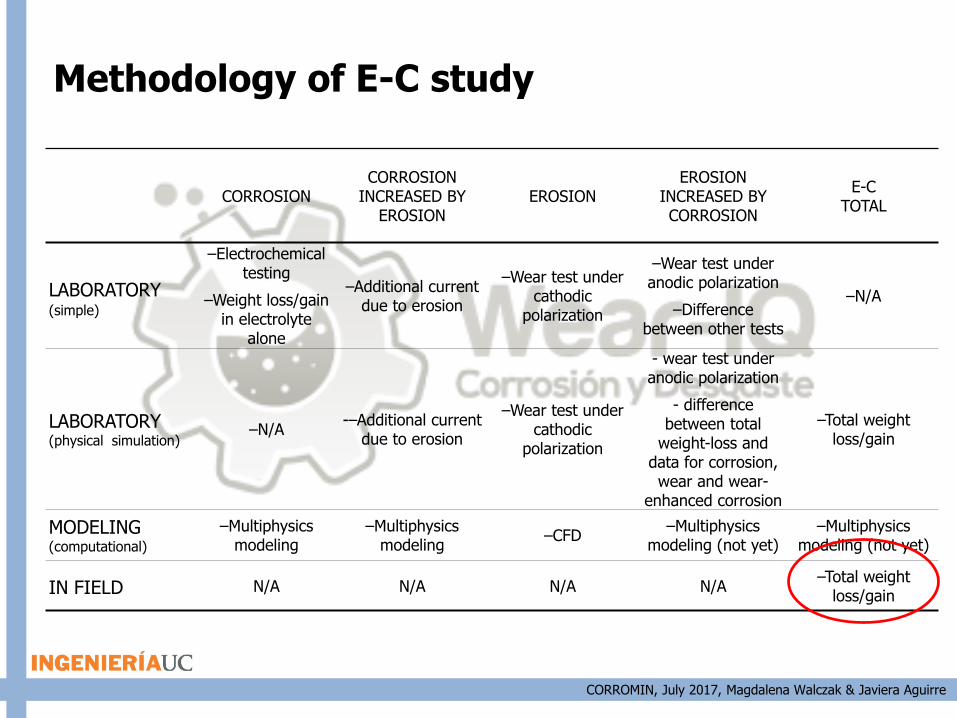
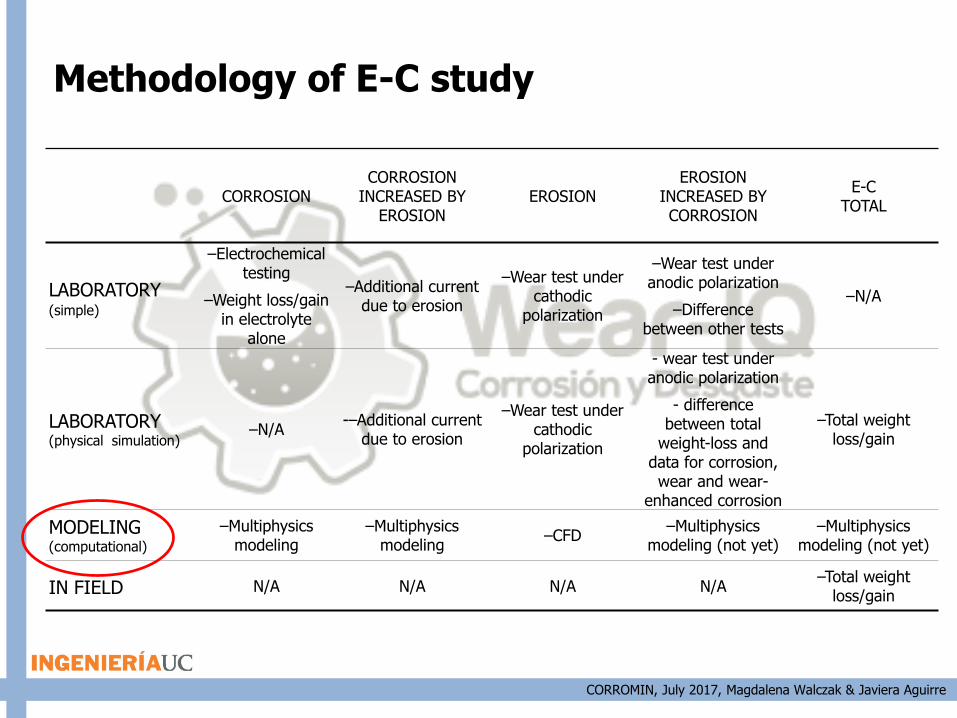
CORROSIONCORROSION
INCREASED BY EROSION
EROSIONEROSION
INCREASED BY CORROSION
E-C TOTAL
LABORATORY(simple)
–Electrochemical testing
–Weight loss/gainin electrolyte
alone
–Additional current due to erosion
–Wear test under cathodic
polarization
–Wear test under anodic polarization
–Difference between other tests
–N/A
LABORATORY (physical simulation)
–N/A-–Additional current
due to erosion
–Wear test under cathodic
polarization
- wear test under anodic polarization
- difference between total
weight-loss and data for corrosion, wear and wear-
enhanced corrosion
–Total weight loss/gain
MODELING(computational)
–Multiphysics modeling
–Multiphysics modeling
–CFD–Multiphysics
modeling (not yet)–Multiphysics
modeling (not yet)
IN FIELD N/A N/A N/A N/A–Total weight
loss/gain
Methodology of E-C study
CORROMIN, July 2017, Magdalena Walczak & Javiera Aguirre
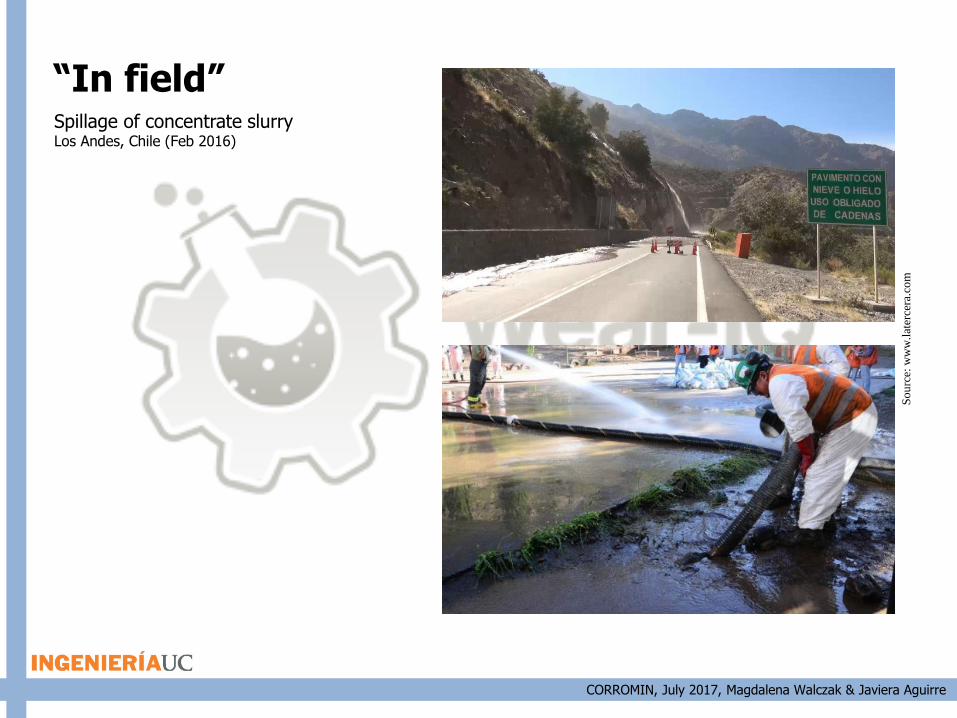
“In field” Spillage of concentrate slurry Los Andes, Chile (Feb 2016)
So
urc
e: w
ww
.lat
erce
ra.c
om
CORROMIN, July 2017, Magdalena Walczak & Javiera Aguirre
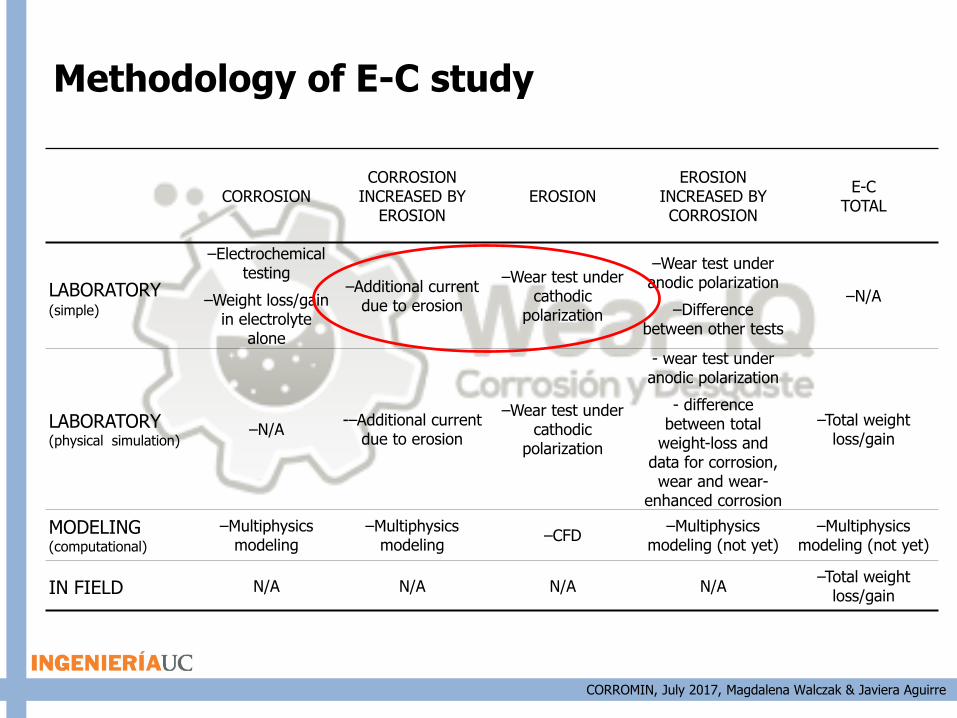
CORROSIONCORROSION
INCREASED BY EROSION
EROSIONEROSION
INCREASED BY CORROSION
E-C TOTAL
LABORATORY(simple)
–Electrochemical testing
–Weight loss/gainin electrolyte
alone
–Additional current due to erosion
–Wear test under cathodic
polarization
–Wear test under anodic polarization
–Difference between other tests
–N/A
LABORATORY (physical simulation)
–N/A-–Additional current
due to erosion
–Wear test under cathodic
polarization
- wear test under anodic polarization
- difference between total
weight-loss and data for corrosion, wear and wear-
enhanced corrosion
–Total weight loss/gain
MODELING(computational)
–Multiphysics modeling
–Multiphysics modeling
–CFD–Multiphysics
modeling (not yet)–Multiphysics
modeling (not yet)
IN FIELD N/A N/A N/A N/A–Total weight
loss/gain
Methodology of E-C study
CORROMIN, July 2017, Magdalena Walczak & Javiera Aguirre
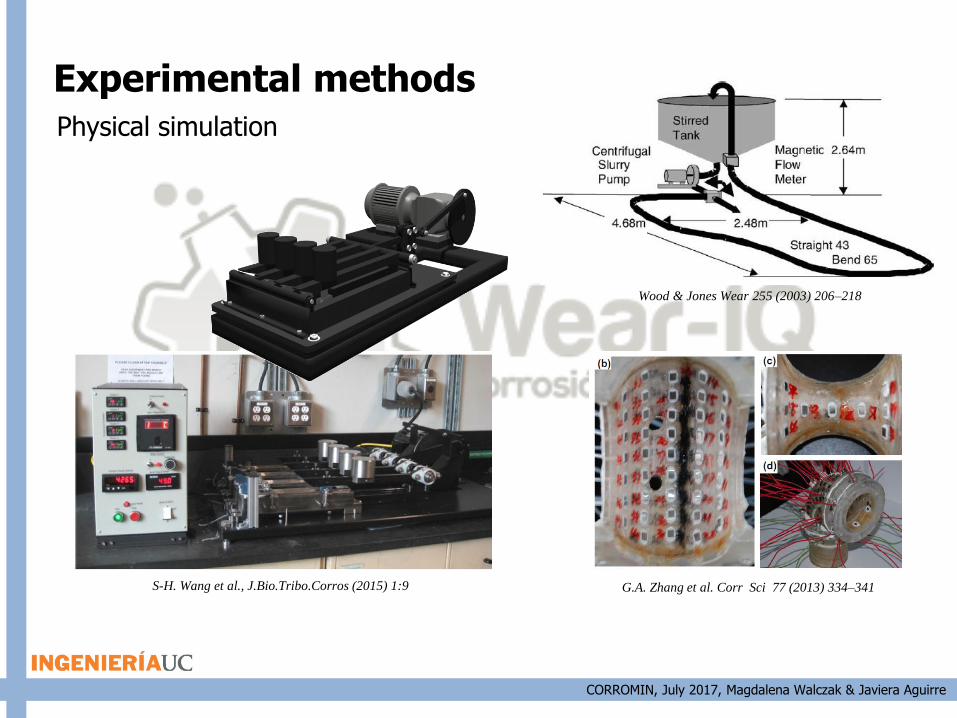
Experimental methods
Wood & Jones Wear 255 (2003) 206–218
Physical simulation
G.A. Zhang et al. Corr Sci 77 (2013) 334–341S-H. Wang et al., J.Bio.Tribo.Corros (2015) 1:9
CORROMIN, July 2017, Magdalena Walczak & Javiera Aguirre
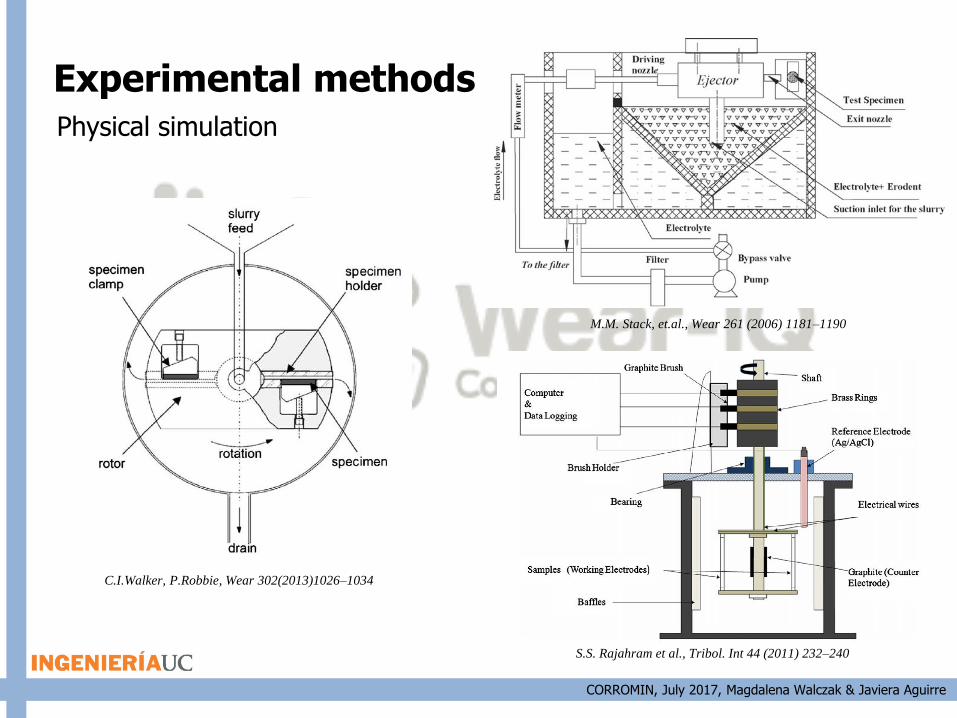
Experimental methodsPhysical simulation
S.S. Rajahram et al., Tribol. Int 44 (2011) 232–240
C.I.Walker, P.Robbie, Wear 302(2013)1026–1034
M.M. Stack, et.al., Wear 261 (2006) 1181–1190
CORROMIN, July 2017, Magdalena Walczak & Javiera Aguirre
CORROSIONCORROSION
INCREASED BY EROSION
EROSIONEROSION
INCREASED BY CORROSION
E-C TOTAL
LABORATORY(simple)
–Electrochemical testing
–Weight loss/gainin electrolyte
alone
–Additional current due to erosion
–Wear test under cathodic
polarization
–Wear test under anodic polarization
–Difference between other tests
–N/A
LABORATORY (physical simulation)
–N/A-–Additional current
due to erosion
–Wear test under cathodic
polarization
- wear test under anodic polarization
- difference between total
weight-loss and data for corrosion, wear and wear-
enhanced corrosion
–Total weight loss/gain
MODELING(computational)
–Multiphysics modeling
–Multiphysics modeling
–CFD–Multiphysics
modeling (not yet)–Multiphysics
modeling (not yet)
IN FIELD N/A N/A N/A N/A–Total weight
loss/gain
Methodology of E-C study

CORROMIN, July 2017, Magdalena Walczak & Javiera Aguirre
Modeling the E-C synergy
“Predictive” “modeling”J Fail. Anal. and Preven. (2016) 16:1071–1081
Interaction Power Model (IPM)Interaction Exponential Model (IEM)Interaction Second-Order Polynomial Model (ISM)
CORROMIN, July 2017, Magdalena Walczak & Javiera Aguirre
Modeling the E-C synergy
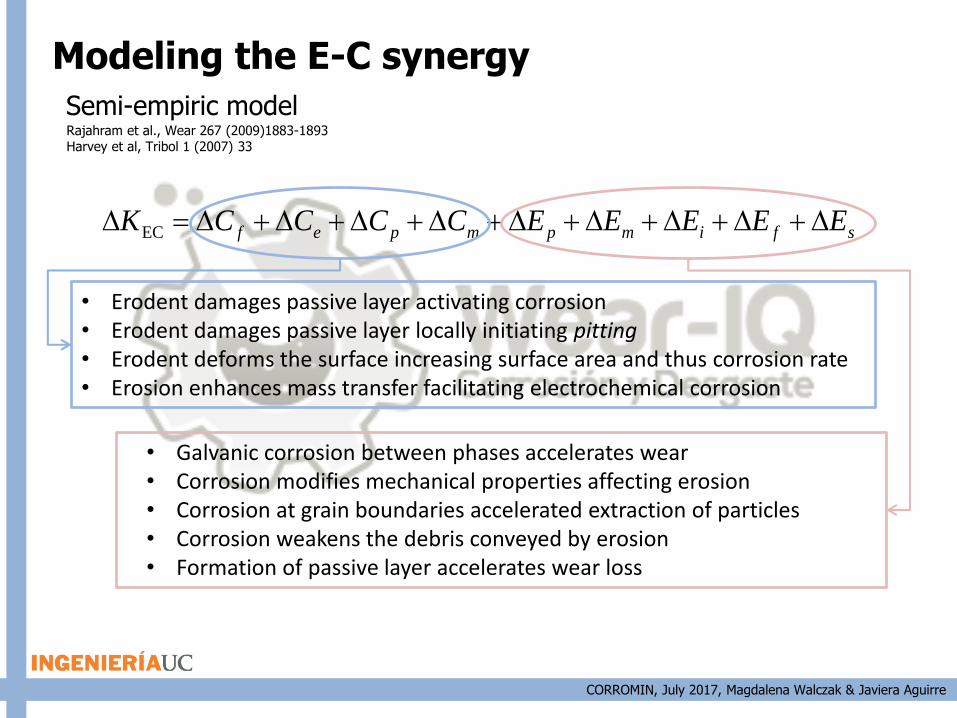
Semi-empiric model
sfimpmpef EEEEECCCCK EC
Rajahram et al., Wear 267 (2009)1883-1893Harvey et al, Tribol 1 (2007) 33
• Erodent damages passive layer activating corrosion• Erodent damages passive layer locally initiating pitting• Erodent deforms the surface increasing surface area and thus corrosion rate• Erosion enhances mass transfer facilitating electrochemical corrosion
• Galvanic corrosion between phases accelerates wear • Corrosion modifies mechanical properties affecting erosion• Corrosion at grain boundaries accelerated extraction of particles• Corrosion weakens the debris conveyed by erosion • Formation of passive layer accelerates wear loss
CORROMIN, July 2017, Magdalena Walczak & Javiera Aguirre
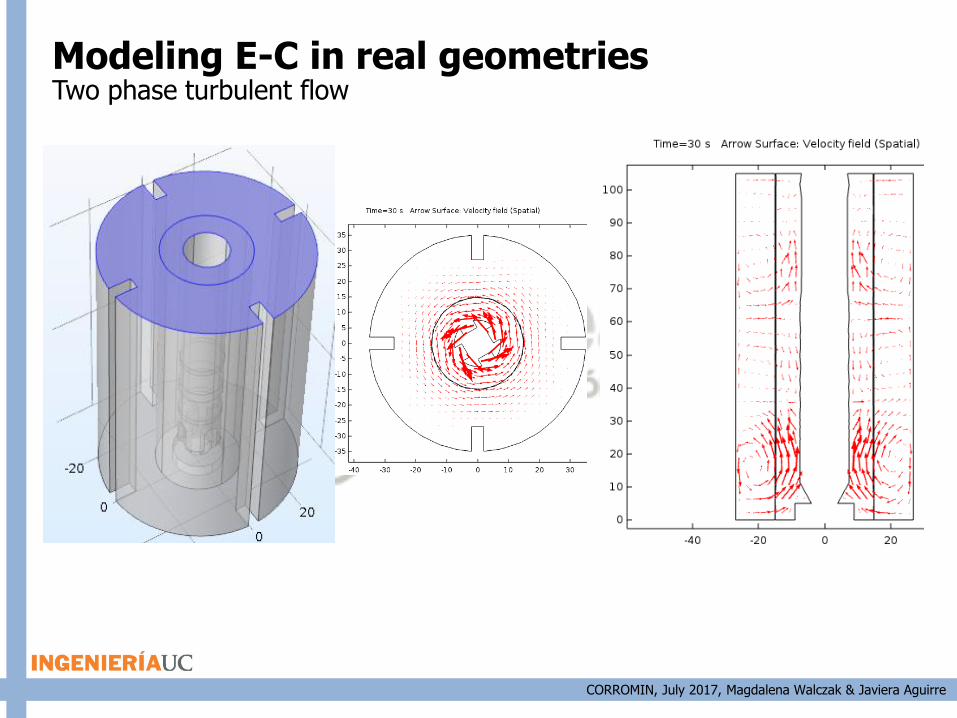
Modeling E-C in real geometriesTwo phase turbulent flow
CORROMIN, July 2017, Magdalena Walczak & Javiera Aguirre
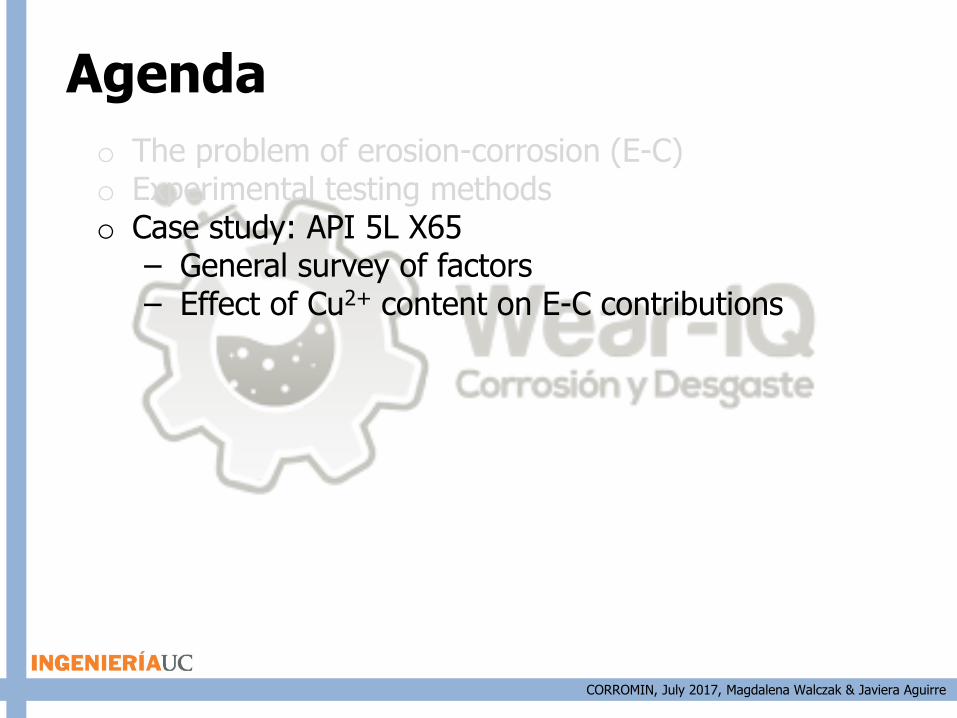
o The problem of erosion-corrosion (E-C)o Experimental testing methodso Case study: API 5L X65
– General survey of factors– Effect of Cu2+ content on E-C contributions
Agenda
CORROMIN, July 2017, Magdalena Walczak & Javiera Aguirre
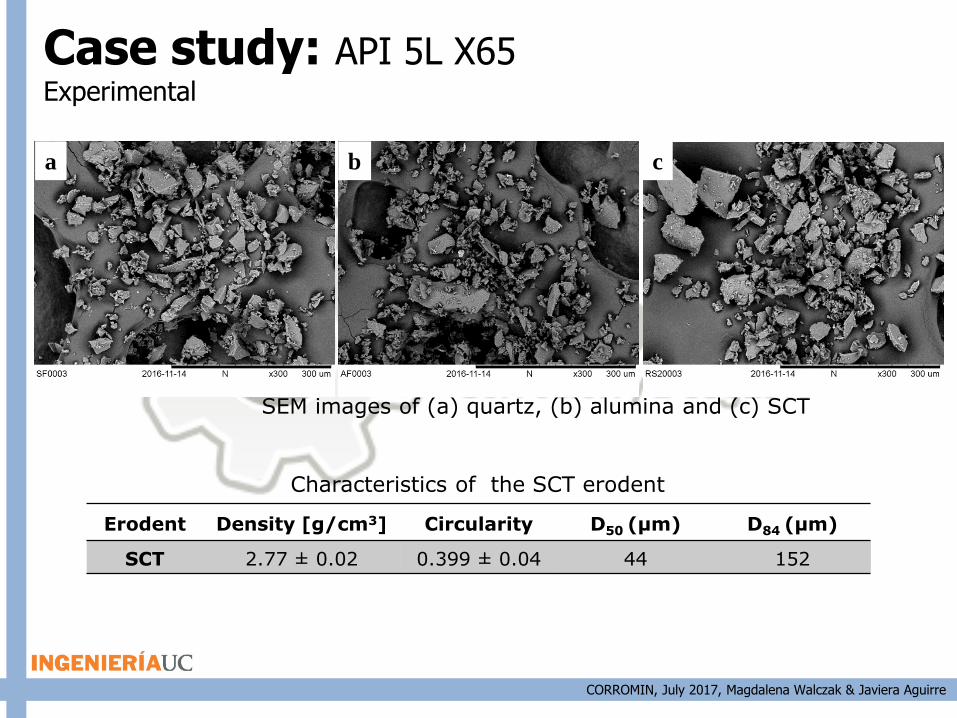
Case study: API 5L X65Experimental
SEM images of (a) quartz, (b) alumina and (c) SCT
a b c
Erodent Density [g/cm3] Circularity D50 (µm) D84 (µm)
SCT 2.77 ± 0.02 0.399 ± 0.04 44 152
Characteristics of the SCT erodent
CORROMIN, July 2017, Magdalena Walczak & Javiera Aguirre
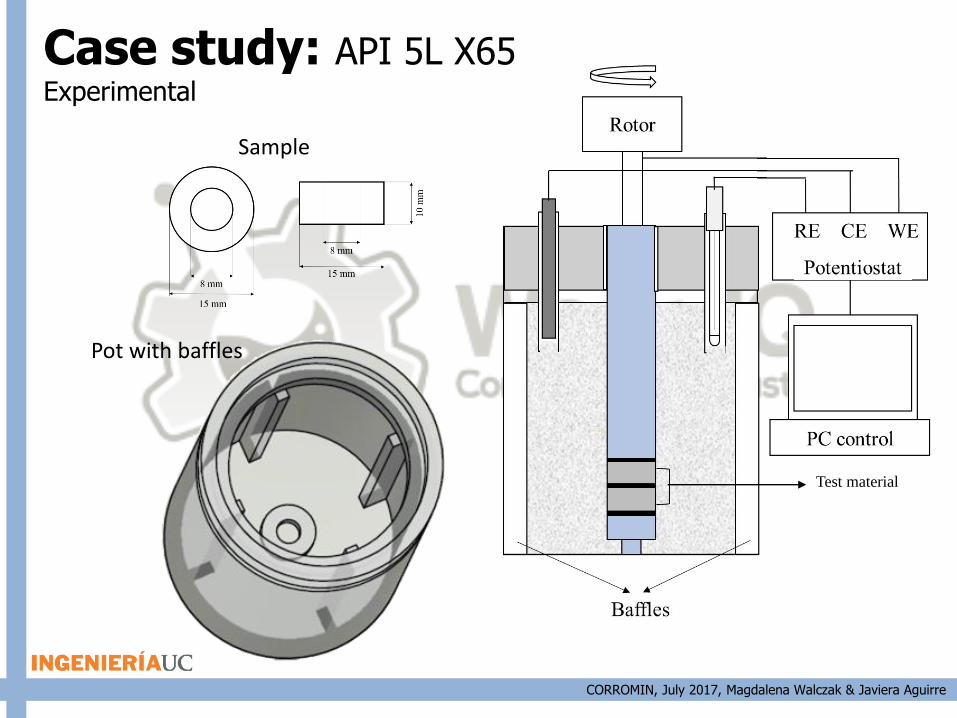
Case study: API 5L X65Experimental
Test material
Sample
Pot with baffles

CORROMIN, July 2017, Magdalena Walczak & Javiera Aguirre
Rotating cylinder electrode(basic enssembly)
Motor0-24,000 rpm
Frecuencyinverter
Acrylic pot(300 mL max.)
Shaft coverwith Teflon
Rotating cylinder electrode(with control of parameters)
pH-meter
Hot plate
Copper coil
O2 and N2
hoses
O2 probe
Metallicsamples
Temperatureprobes
Case study: API 5L X65Experimental
CORROMIN, July 2017, Magdalena Walczak & Javiera Aguirre
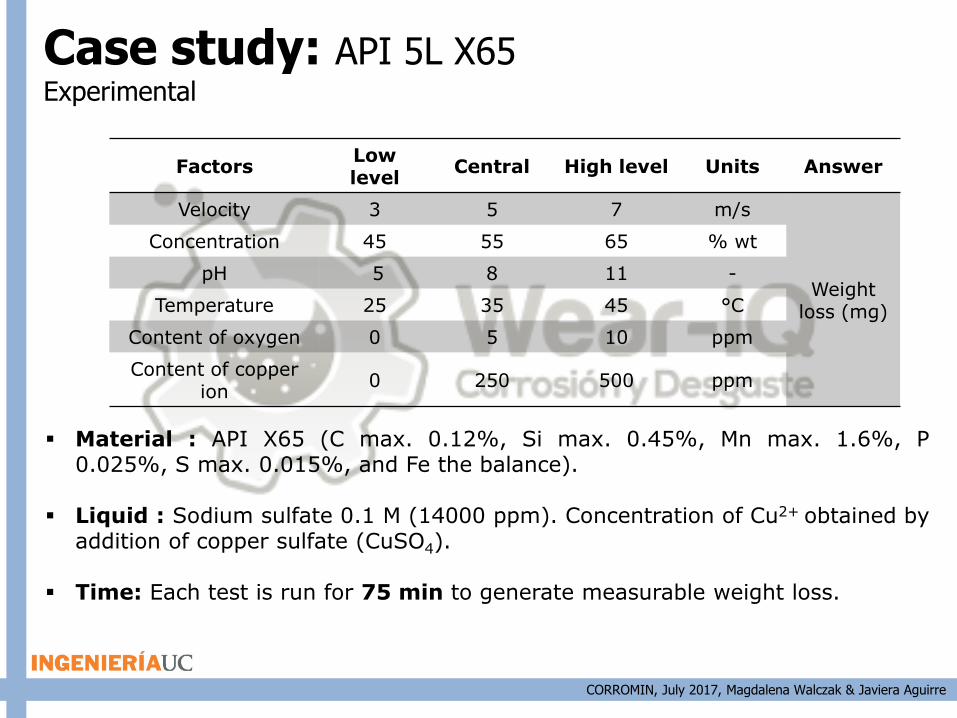
Case study: API 5L X65Experimental
FactorsLow level
Central High level Units Answer
Velocity 3 5 7 m/s
Weight loss (mg)
Concentration 45 55 65 % wt
pH 5 8 11 -
Temperature 25 35 45 °C
Content of oxygen 0 5 10 ppm
Content of copper ion
0 250 500 ppm
Material : API X65 (C max. 0.12%, Si max. 0.45%, Mn max. 1.6%, P0.025%, S max. 0.015%, and Fe the balance).
Liquid : Sodium sulfate 0.1 M (14000 ppm). Concentration of Cu2+ obtained byaddition of copper sulfate (CuSO4).
Time: Each test is run for 75 min to generate measurable weight loss.
CORROMIN, July 2017, Magdalena Walczak & Javiera Aguirre
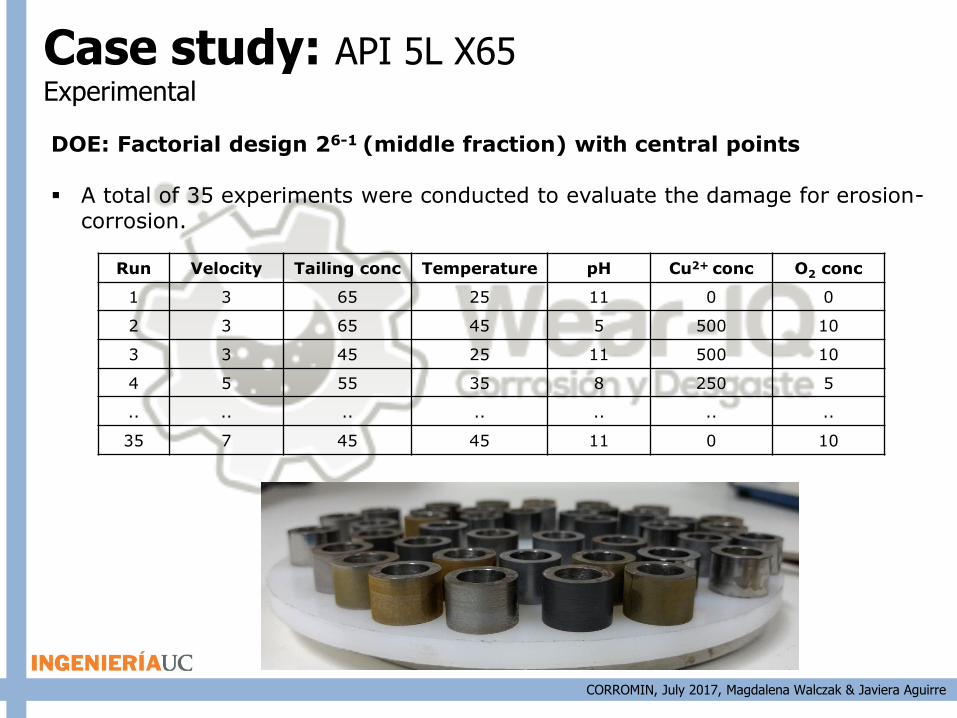
DOE: Factorial design 26-1 (middle fraction) with central points
A total of 35 experiments were conducted to evaluate the damage for erosion-corrosion.
Run Velocity Tailing conc Temperature pH Cu2+ conc O2 conc
1 3 65 25 11 0 0
2 3 65 45 5 500 10
3 3 45 25 11 500 10
4 5 55 35 8 250 5
.. .. .. .. .. .. ..
35 7 45 45 11 0 10
Case study: API 5L X65Experimental
CORROMIN, July 2017, Magdalena Walczak & Javiera Aguirre
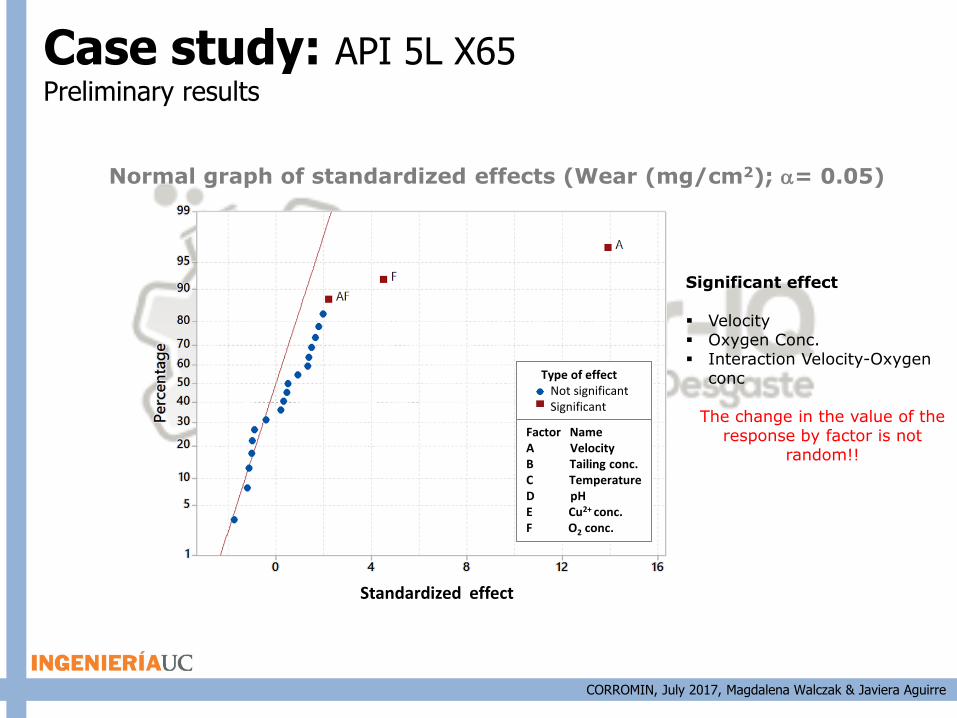
Factor NameA VelocityB Tailing conc.C TemperatureD pHE Cu2+ conc.F O2 conc.
Type of effectNot significantSignificant
Normal graph of standardized effects (Wear (mg/cm2); = 0.05)
Significant effect
Velocity Oxygen Conc. Interaction Velocity-Oxygen
conc
The change in the value of the response by factor is not
random!!
Case study: API 5L X65Preliminary results
Standardized effect

CORROMIN, July 2017, Magdalena Walczak & Javiera Aguirre
O2
co
nc
en
tra
tio
n(p
pm
)
Velocity (m/s)
Contour graph of interaction between velocity and oxygen concentration
Case study: API 5L X65Preliminary results
CORROMIN, July 2017, Magdalena Walczak & Javiera Aguirre
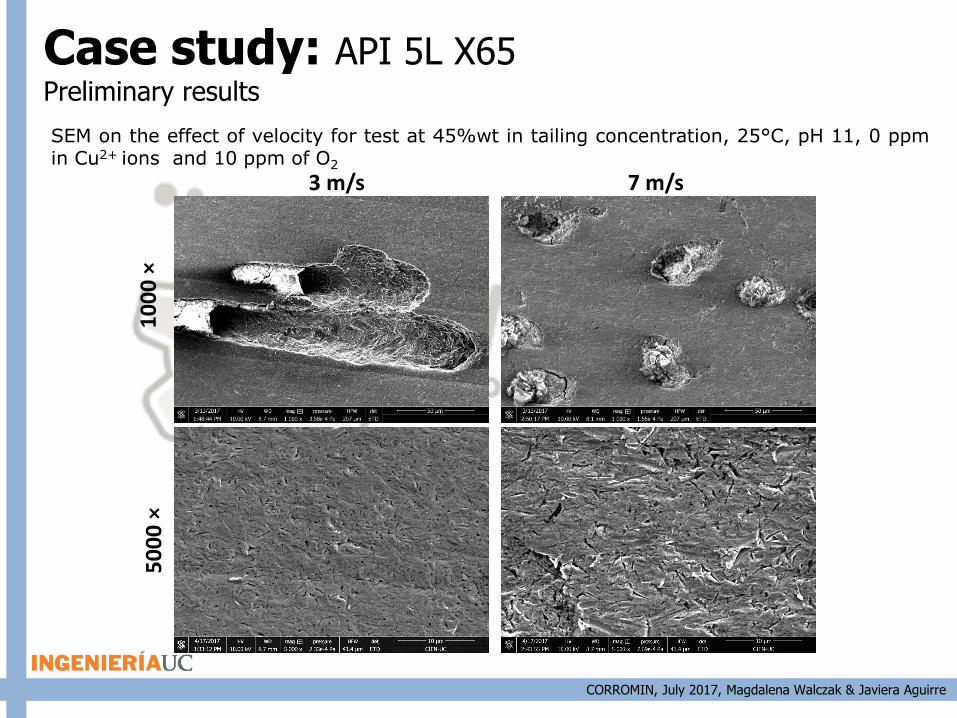
SEM on the effect of velocity for test at 45%wt in tailing concentration, 25°C, pH 11, 0 ppmin Cu2+ ions and 10 ppm of O2
3 m/s 7 m/s
10
00
×5
00
0 ×
•
•
Case study: API 5L X65Preliminary results
CORROMIN, July 2017, Magdalena Walczak & Javiera Aguirre
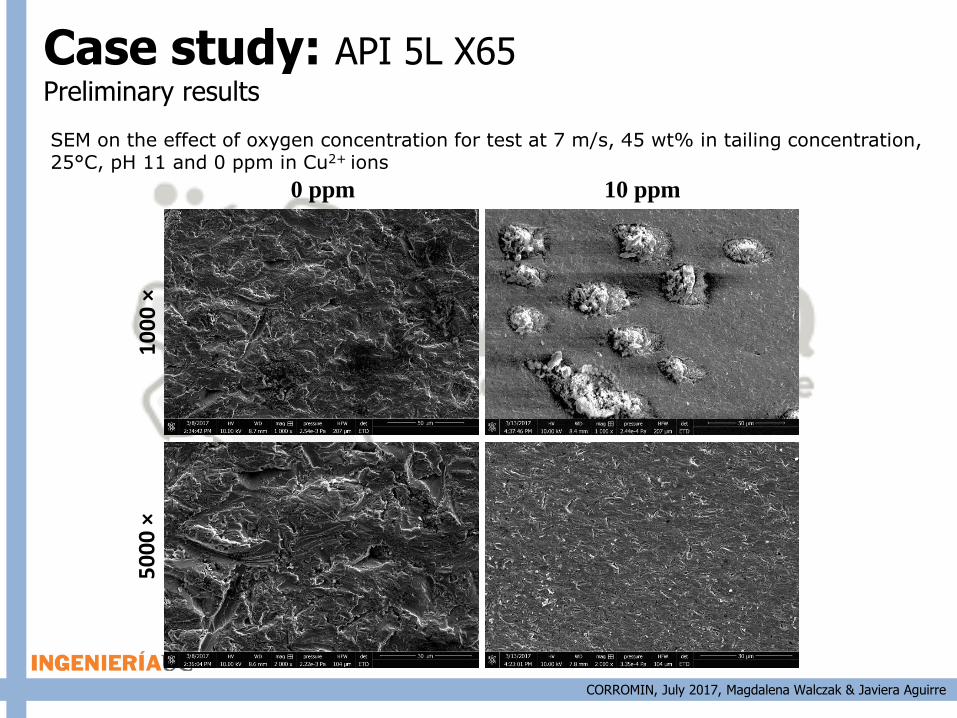
Case study: API 5L X65Preliminary results
SEM on the effect of oxygen concentration for test at 7 m/s, 45 wt% in tailing concentration, 25°C, pH 11 and 0 ppm in Cu2+ ions
0 ppm 10 ppm
BSE
50
00
×1
00
0 ×
CORROMIN, July 2017, Magdalena Walczak & Javiera Aguirre
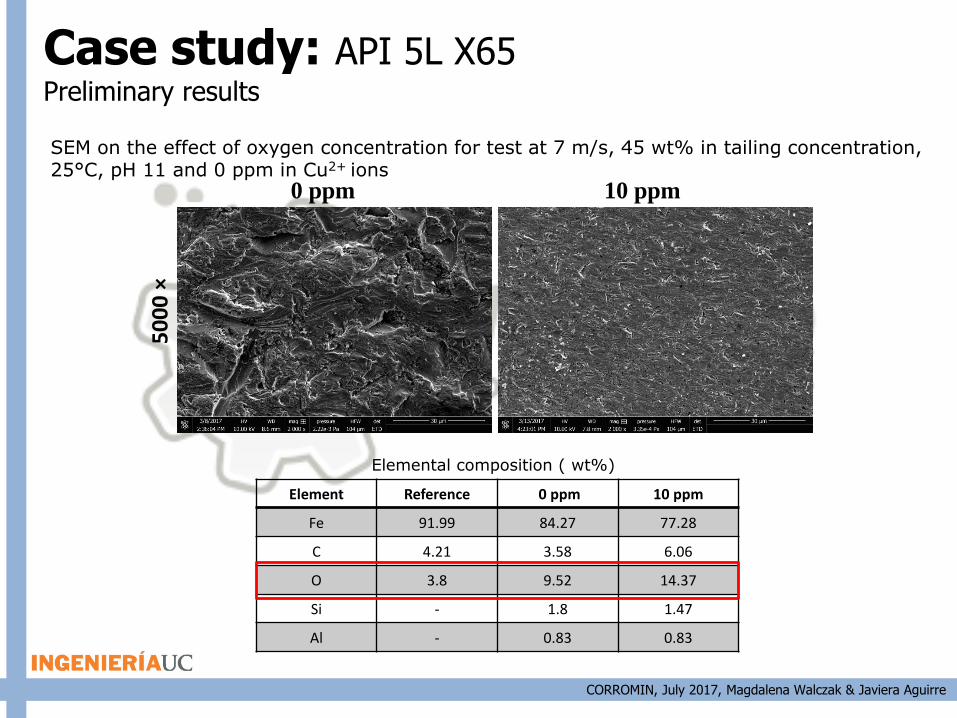
Case study: API 5L X65Preliminary results
SEM on the effect of oxygen concentration for test at 7 m/s, 45 wt% in tailing concentration, 25°C, pH 11 and 0 ppm in Cu2+ ions
0 ppm 10 ppm
Element Reference 0 ppm 10 ppm
Fe 91.99 84.27 77.28
C 4.21 3.58 6.06
O 3.8 9.52 14.37
Si - 1.8 1.47
Al - 0.83 0.83
Elemental composition ( wt%)
BSE
50
00
×
CORROMIN, July 2017, Magdalena Walczak & Javiera Aguirre
o The problem of erosion-corrosion (E-C)o Experimental testing methodso Case study: API 5L X65
– General survey of factors– Effect of Cu2+ content on E-C contributions
Agenda
CORROMIN, July 2017, Magdalena Walczak & Javiera Aguirre
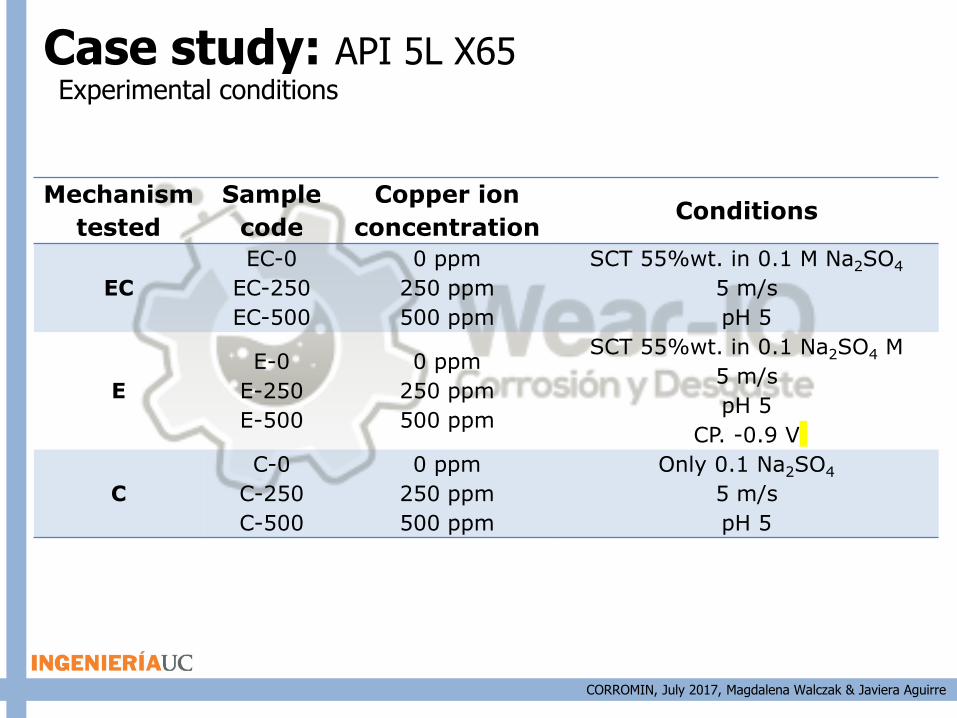
Case study: API 5L X65
Mechanism
tested
Sample
code
Copper ion
concentrationConditions
EC
EC-0
EC-250
EC-500
0 ppm
250 ppm
500 ppm
SCT 55%wt. in 0.1 M Na2SO4
5 m/s
pH 5
E
E-0
E-250
E-500
0 ppm
250 ppm
500 ppm
SCT 55%wt. in 0.1 Na2SO4 M
5 m/s
pH 5
CP. -0.9 V
C
C-0
C-250
C-500
0 ppm
250 ppm
500 ppm
Only 0.1 Na2SO4
5 m/s
pH 5
Experimental conditions
CORROMIN, July 2017, Magdalena Walczak & Javiera Aguirre
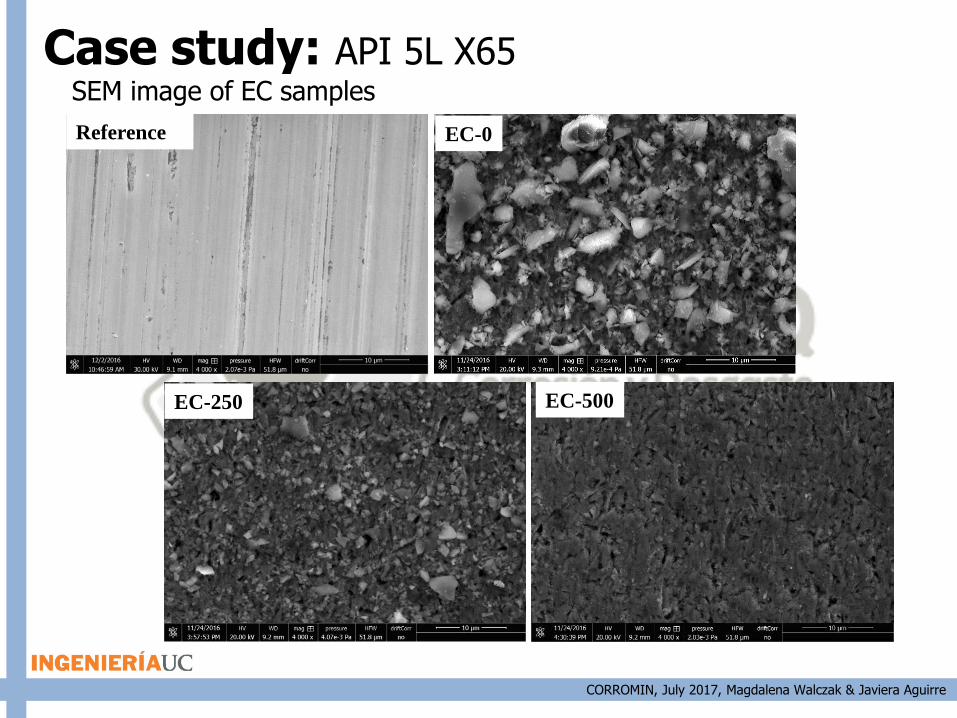
Case study: API 5L X65
Reference EC-0
EC-250 EC-500
SEM image of EC samples
CORROMIN, July 2017, Magdalena Walczak & Javiera Aguirre
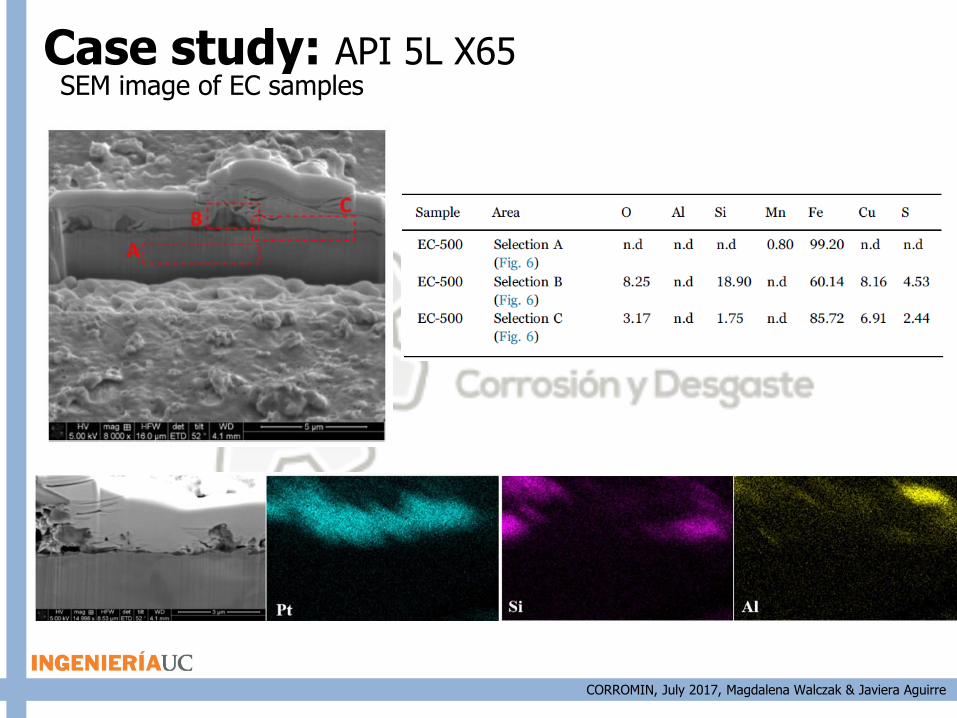
Case study: API 5L X65 SEM image of EC samples
CORROMIN, July 2017, Magdalena Walczak & Javiera Aguirre
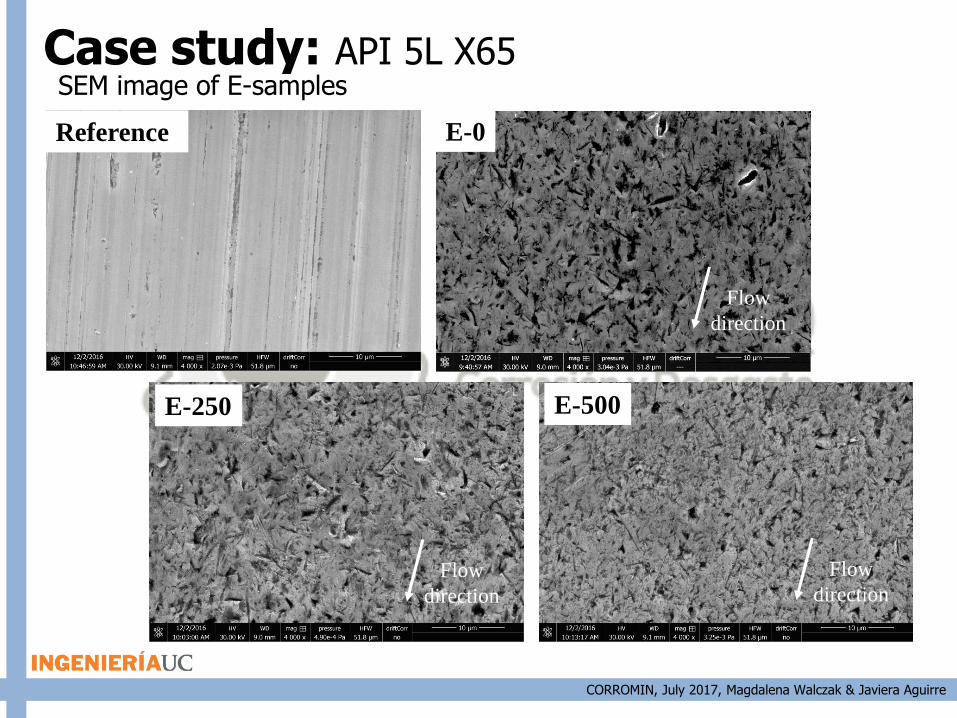
Case study: API 5L X65 SEM image of E-samples
E-0
Flow
direction
E-250
Flow
direction
E-500
Flow
direction
Reference
CORROMIN, July 2017, Magdalena Walczak & Javiera Aguirre
Case study: API 5L X65
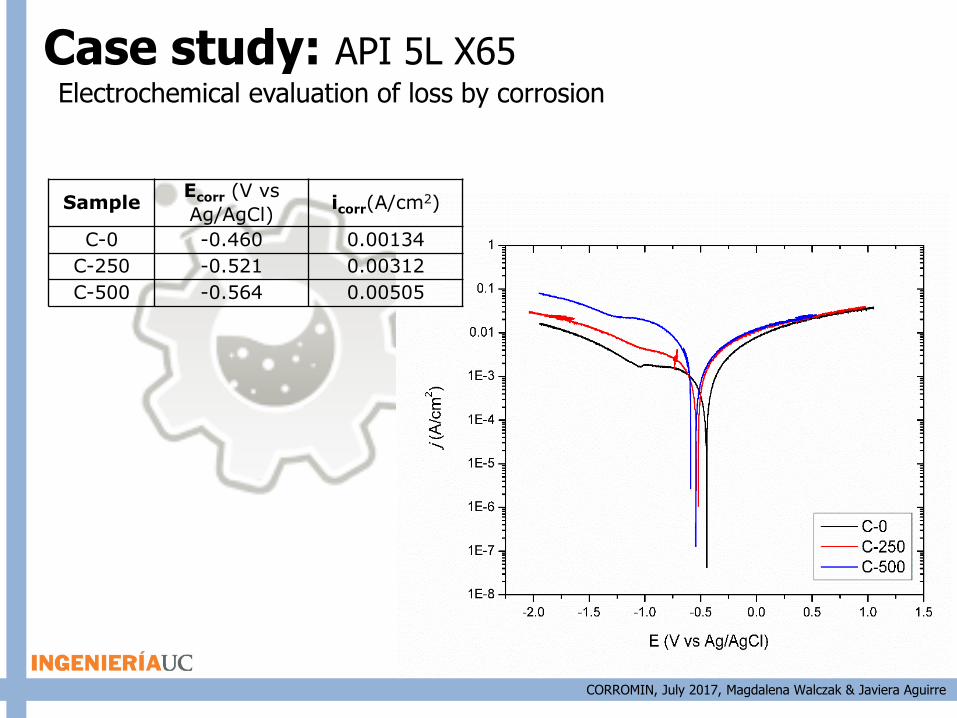
SampleEcorr (V vs
Ag/AgCl)icorr(A/cm2)
C-0 -0.460 0.00134
C-250 -0.521 0.00312
C-500 -0.564 0.00505
Electrochemical evaluation of loss by corrosion
CORROMIN, July 2017, Magdalena Walczak & Javiera Aguirre
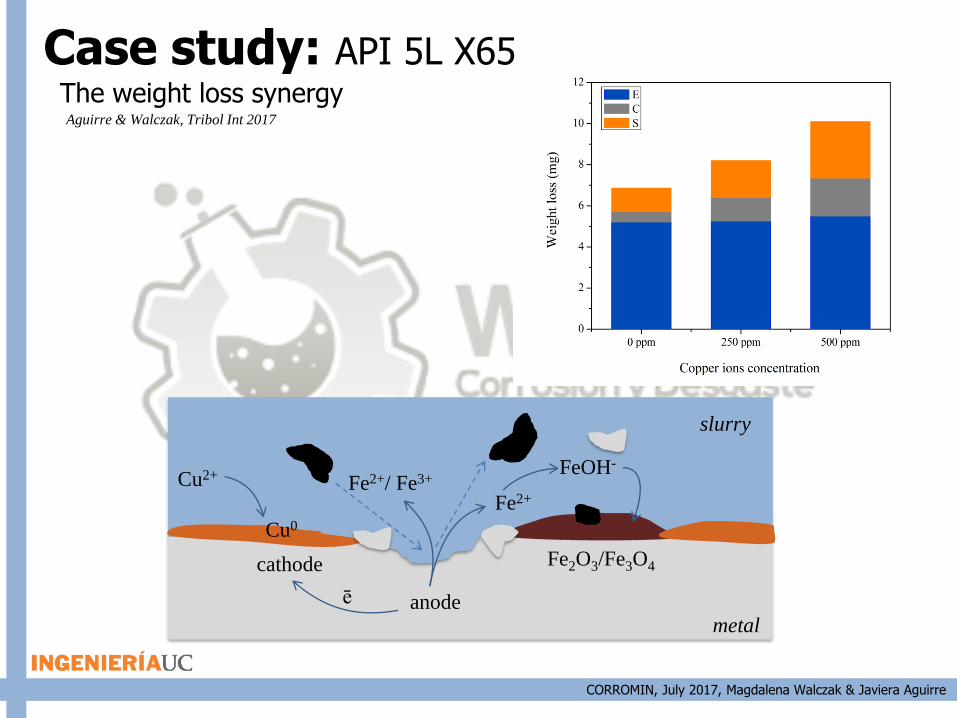
Case study: API 5L X65 The weight loss synergy
Cu2+
metal
cathode
anodeē
Fe2+
FeOH-
Fe2O3/Fe3O4
Fe2+/ Fe3+
Cu0
slurry
Aguirre & Walczak, Tribol Int 2017
CORROMIN, July 2017, Magdalena Walczak & Javiera Aguirre
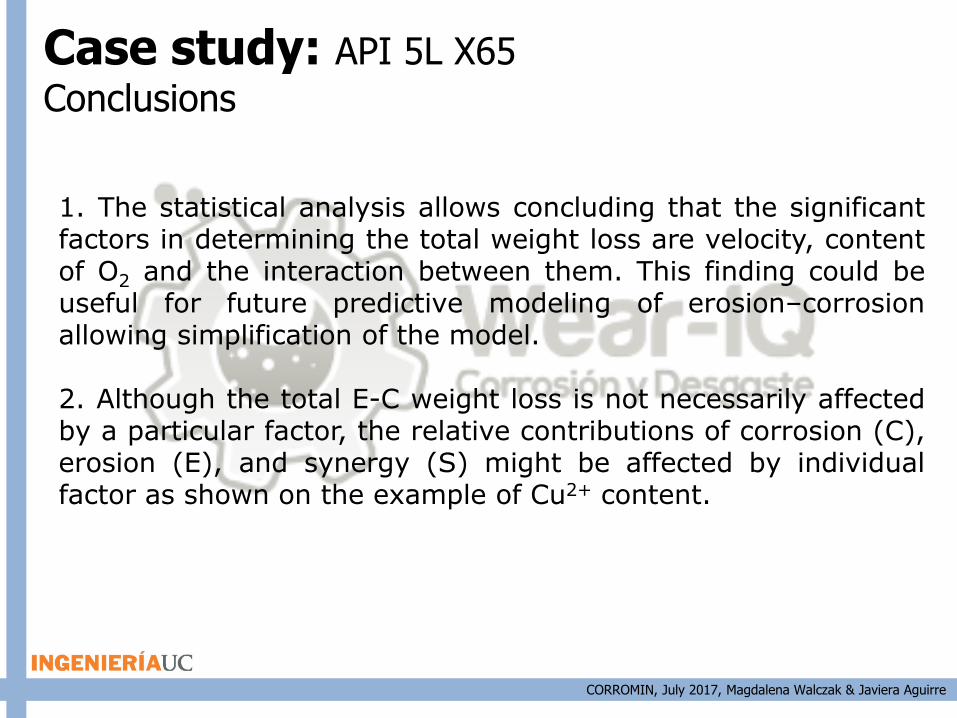
Case study: API 5L X65
Conclusions
1. The statistical analysis allows concluding that the significantfactors in determining the total weight loss are velocity, contentof O2 and the interaction between them. This finding could beuseful for future predictive modeling of erosion–corrosionallowing simplification of the model.
2. Although the total E-C weight loss is not necessarily affectedby a particular factor, the relative contributions of corrosion (C),erosion (E), and synergy (S) might be affected by individualfactor as shown on the example of Cu2+ content.
CORROMIN, July 2017, Magdalena Walczak & Javiera Aguirre
Acknowledgment
FONDECYT No 1141107 (CONICYT) CONICYT Scholarship No 21150171 Undergraduate student: Nicolas Molina
Los Pelambres (Felipe Muñizaga) Migrin (Felipe Larrea) Minera Valle Central S.A. (Gonzalo Reyes)