Use of Membrane Filters for Microscopic Preparations of Sponge Spicules
Upload
independentCategory
view
0download
0
Experimental Hematology 34 (2006) 536–548
The heterogeneity of human mesenchymal stem cell preparationsdEvidencefrom simultaneous analysis of proteomes and transcriptomes
Wolfgang Wagnera,*, Robert E. Feldmann Jr.b,c,*, Anja Seckingera, Martin H. Maurerb, Frederik Weina,Jonathon Blaked, Ulf Krausea, Armin Kalenkab, Heinrich F. Burgersb, Rainer Saffricha,
Patrick Wuchtera, Wolfgang Kuschinskyb, and Anthony D. Hoa
aDepartments of Medicine V; bPhysiology and Pathophysiology, University of Heidelberg, Heidelberg, Germany; cDepartment of Psychiatry,
Division of Neurobiology, Johns Hopkins University Medical Institutions, Baltimore, Md., USA; dBiochemical Instrumentation Program,European Molecular Biology Laboratory (EMBL), Heidelberg, Germany
(Received 20 October 2005; revised 11 December 2005; accepted 3 January 2006)
Objective. Mesenchymal stem cells (MSC) raise high hopes in clinical applications. However,the lack of common standards and a precise definition of MSC preparations remains a majorobstacle in research and application of MSC. Whereas surface antigen markers have failed toprecisely define this population, a combination of proteomic data and microarray data pro-vides a new dimension for the definition of MSC preparations.
Methods. In our continuing effort to characterize MSC, we have analyzed the differentialtranscriptome and proteome expression profiles of MSC preparations isolated from humanbone marrow under two different expansion media (BM-MSC-M1 and BM-MSC-M2).
Results. In proteomics, 136 protein spots were unambiguously identified by MALDI-TOF-MSand corresponding cDNA spots were selected on our ‘‘Human Transcriptome cDNA Microar-ray.’’ Combination of datasets revealed a correlation in differential gene expression and pro-tein expression of BM-MSC-M1 vs BM-MSC-M2. Genes involved in metabolism were morehighly expressed in BM-MSC-M1, whereas genes involved in development, morphogenesis,extracellular matrix, and differentiation were more highly expressed in BM-MSC-M2. Inter-changing culture conditions for 8 days revealed that differential expression was retained inseveral genes whereas it was altered in others.
Conclusion. Our results have provided evidence that homogeneous BM-MSC preparationscan reproducibly be isolated under standardized conditions, whereas culture conditions exerta prominent impact on transcriptome, proteome, and cellular organization of BM-MSC. � 2006 International Society for Experimental Hematology. Published by ElsevierInc.
Mesenchymal stem cells (MSC) resemble a multipotentadult stem cell population capable of differentiating intodifferent mesodermal cell lineages including osteoblasts,chondroblasts, and adipocytes. Albeit controversial, thereis evidence that MSC can also differentiate into myocytesand cardiomyocytes and even into cells of nonmesodermalorigin including hepatocytes and neurons [1–4]. A broadspectrum of ongoing clinical studies have raised high hopes
Offprint requests to: Anthony D. Ho, M.D., Department of Medicine V,
University of Heidelberg, Im Neuenheimer Feld 410, 69120 Heidelberg,
Germany; E-mail: [email protected]
*These authors contributed equally to this study.
0301-472X/06 $–see front matter. Copyright � 2006 International Society for
doi: 10.1016/j.exphem.2006.01.002
for the application of MSC in regenerative medicine [5–15].However, the lack of common standards and of a precisedefinition of cell preparations remains a major obstaclefor research and application of MSC. Preparative protocolsfor the acquisition of MSC, in vitro cultivation, expansion,and differentiation along specific cell lineages are ex-tremely heterogeneous [2,16–22].
Presently, MSC are characterized by their adherence toplastic surface, a panel of cell-surface markers, and theirin vitro and in vivo differentiation capacity [17,22–28].Phenotypic surface antigen markers, used alone or in com-bination, have not been specific for MSC [28,29]. The het-erogeneity of starting populations renders comparison ofresults between different groups difficult and may also in
Experimental Hematology. Published by Elsevier Inc.
537W. Wagner et al./ Experimental Hematology 34 (2006) 536–548
part account for the lack of reproducibility in some of theinitial reports using adult stem cells. The impact of differentculture conditions on the ultimate cell products needs to bedefined. Standardized procedures for preparations of MSCintended for human use therefore represent a conditio sinequa non for future development of MSC research aimingat clinical application.
To define MSC on the genetic level, various methods in-cluding reverse transcriptase polymerase chain reaction(RT-PCR), serial analysis of gene expression (SAGE), andmicroarray technology have rendered it feasible to establishglobal quantitative mRNA expression profiles [30]. Severalstudies have focused on in vitro differentiation [31–35], di-rect comparison of different MSC preparations [36–38],or estimation of the absolute mRNA expression in MSC[39–43]. We have determined gene expressions of MSCisolated form bone marrow, adipose tissue, and umbilicalcord blood [29]. We have been able to identify 25 genesthat were more than twofold upregulated in all MSC prep-arations as compared to terminal differentiated fibroblasts(HS68). Whereas the unique biological properties of MSCare inherently encoded in their transcriptome, the cell phe-notype and function are determined by proteins and en-zymes translated, i.e., the proteome. Recent developmentsin proteomics with respect to protein separation, quantifica-tion, and identification have permitted reliable comparisonof proteomes. Consequently, proteomic analysis has beensuccessfully applied to adult stem cells and has facilitatedtheir molecular characterization and the identification of es-sential molecular steps [44–47]. In our previous work wehave described the proteome of MSC isolated from humanumbilical cord blood [48].
Gene expression as reflected by messenger RNA produc-tion does not necessarily correlate with protein synthesisand hence functional upregulation [49]. Protein expressionin the cell is subject to regulations in transcription andtranslation, protein half-life, and also the time and locationof its expression in the microcosm of the cell. The methodsused in proteome analysis are limited by the fact that thistype of analysis favors the most abundant proteins overthe less plentiful. In addition, hydrophobic protein lysatesfrom cellular compartments have remained an unsolvedproblem for two-dimensional gel electrophoresis. Sincethe combination of proteomic and transcriptomic analysisof the same stem cell populations offers significant advan-tages over each of these methods taken for themselves, thismight provide a new dimension in the search for the geneticsignatures of MSC preparations.
Material and methods
Human mesenchymal stem cells from human bone marrowHuman MSC from the bone marrow (BM) were isolated from thesame donors under two different culture conditions (M1 and M2).
In brief, bone marrow aspirates were obtained from the iliac crestof four healthy donors with an age range between 25 and 35 yearsafter informed consent. The mononuclear cell (MNC) fraction wasisolated by Biocoll density-gradient centrifugation (d 5 1.077 g/cm3; Biochrom, Berlin, Germany). MNC were plated in expansionmedium (M1 or M2) at a density of 105 cells/cm2 in tissue cultureflasks (Nunc, Wiesbaden, Germany).
Culture medium M1 has been described by Reyes and col-leagues [1]: The medium consists of 58% Dulbecco’s ModifiedEagles Medium–Low Glucose (DMEM-LG, Cambrex, Apen, Ger-many) and 40% MCDB201 (Sigma, Deisenhofen, Germany), 2%fetal calf serum (FCS; HyClone, Bonn, Germany), supplementedwith 2 mM L-glutamine, 100 U/mL Pen/Strep (Cambrex), 1% in-sulin transferrin selenium, 1% linoleic acid bovine serum albumin,10 nM dexamethasone, 0.1 mM L-ascorbic-acid-2-phosphate (allfrom Sigma), PDGF-bb, and EGF (10 ng/mL each, R&D Systems,Wiesbaden, Germany). Tissue culture flasks were coated with10 ng/mL fibronectin (Sigma) before use.
Culture medium M2 is the commercially available PoieticsHuman Mesenchymal Stem Cell Medium (PT-3001, Cambrex).BM-MSC-M2 were expanded following the manufacturer’sinstructions.
On reaching 80% confluency, cells were trypsinized with0.25% trypsin/1 mM EDTA (Invitrogen, Karlsruhe, Germany)and replated at about 8000 cells/cm2. Cells were expanded for 3to 6 passages. Both types of MSC were negative for hematopoieticlineage markers while they were positive for CD13, CD29, CD44,CD73, CD90, CD105, and CD166 as previously described byother authors [1,20,22,50]. Further on, no subpopulations couldbe distinguished by flow cytometry. However, a similar patternof surface markers was also observed on HS68 fibroblasts sothat this configuration appears to be insufficient for a reliable mo-lecular characterization [29].
In vitro differentiationTo demonstrate the ability of MSC preparations for in vitro differ-entiation we have applied the following methods. To induce oste-ogenic differentiation, cells were replated at 2 3 104 cells/cm2 andcultured for 3 weeks in DMEM with 10% FCS (Invitrogen),10 mM b-glycerophosphate, 1027 M dexamethasone, and 0.2mM ascorbic acid with media changes every 3 to 4 days as previ-ously described [1,23]. After 21 days, cells were analyzed by vonKossa and alkaline phosphatase staining. For adipocytic differenti-ation, cells were plated at 2 3 104 cells/cm2 and cultured in 10%FCS, 0.5 mM isobutyl-methylxanthine (IBMX), 1 mM dexametha-sone, 10 mM insulin, and 200 mM indomethacin, and Oil Red-Ostaining was performed after 21 days [17]. Chondrogenic differen-tiation was achieved through culturing a pellet of 2.2 3 105 cells indifferentiation medium for 3 weeks with subsequent assessment ofcollagen II formation [51].
Cell lysis and two-dimensional gel electrophoresisBone marrow BM-MSC-M1 and BM-MSC-M2 of two donorswere analyzed by our previously developed protocol [48,52]:About 2 3 106 cells of the third to fourth passage were removedfrom the incubation medium, washed, and dissolved in a detergentlysis buffer containing 7 M urea, 2 M thiourea, 4% (w/v) CHAPS,0.5% (v/v) Triton X-100, 0.5% (v/v) IPG buffer pH 3–10 (Amer-sham Biosciences, Uppsala, Sweden), 100 mM DTT, and 1.5 mg/mLcomplete protease inhibitor (Roche, Mannheim, Germany) for
538 W. Wagner et al./ Experimental Hematology 34 (2006) 536–548
1 hour at 18�C in an orbital shaker. The lysate was then centri-fuged at 21,000g for 30 minutes and protein content of its su-pernatant measured by the Bradford assay [53].
Protein extracts were separated by two-dimensional gel elec-trophoresis [54]. For isoelectric focusing (first dimension), 500 mgof the protein lysate were run in 6 M urea, 2 M thiourea, 1 MDTT, 2% (w/v) CHAPS, and 0.5% (v/v) IPG buffer on 18-cm immo-bilized nonlinear pH 3–10 gradient IPG strips (Immobiline DryStrippH 3–10 NL, Amersham Biosciences, Uppsala, Sweden), in theIPGphor apparatus (Amersham Biosciences, Uppsala, Sweden) us-ing the following protocol: After 12 hours of reswelling time at 30 V,voltages of 200 V, 500 V, and 1000 V were applied for 1 hour each.Then voltage was increased to 8000 V within 30 minutes and keptconstant at 8000 V for another 12 hours, resulting in a total of100,300 Vh. For the subsequent sodium dodecyl sulfate–polyacryl-amide gel electrophoresis (SDS-PAGE; second dimension), the pro-teins were transferred to 20 3 18 3 0.4 cm3 polyacrylamide gelsand separated by their mass in a 12.5% acrylamide matrix. The pro-tein spots in four different experiments (replicate gels) were visual-ized by ultra-sensitive silver staining and detected via the PhoretixExpression software v.2005 (Nonlinear Dynamics, Newcastle-upon-Tyne, UK).
Protein identification by peptide mass fingerprintingProtein identification was achieved with peptide mass fingerprint-ing (PMF) using matrix-assisted laser desorption ionization timeof flight mass spectrometry (MALDI-TOF MS) and gel matchingvia polynomial image warping. For MALDI-TOF MS, proteinspots were automatically located, excised, and destained [55] (Ge-nomic Solutions, Ann Arbor, MI, USA) and in-gel digestion withtrypsin (Promega, Madison, WI, USA) was employed [56]. Sam-ples were prepared using a-cyano-4-hydroxy-cinnamic acid(HCCA) as matrix, loaded onto prespotted AnchorChip targets[48], and allowed to air-dry at room temperature. Peptide massspectra were obtained using an Ultraflex TOF/TOF (Bruker-Dal-tonics, Bremen, Germany) in the fully automated reflectron TOFoperation mode controlled by the flexControl software [48]. TheMascot-delivered probability-based score at the 5% significancelevel was regarded as a quality parameter for the correct identifi-cation (http:/www.matrixscience.com) [57]. Spots were identifiedin replica gels by gel matching through polynomial image warpingwith the Phoretix expression software (nonlinear dynamics, New-castle upon-Tyne, UK) [46,48].
Microarray analysisGene expression profiles of BM-MSC-M1 and BM-MSC-M2 werecompared to nonmultipotent HS68 fibroblasts [29]. About 2 3 106
cells of the fourth passage were lysed upon reaching 80% conflu-ency. Total RNA was isolated using the Rneasy Mini Kit (Qiagen,Hilden, Germany). DNase treatment was performed (Qiagen).RNA quality was controlled with the RNA 6000 Pico LabChipkit (Agilent, Waldbronn, Germany). Linear amplification of10 mg total RNA was performed by a one-round in vitro transcrip-tion using the Arcturus RiboAmp Kit (Acturus, Mountain View,CA, USA). About 10 mg of amplified RNA samples were labeledby amino-allyl-coupling using the Atlas Glass fluorescent labelingkit (Clontech, Palo Alto, CA, USA) and Cy3-/Cy5-monofunc-tional reactive dye (Amersham Biosciences, Little Chalfont, En-gland). Probes were cohybridized with reference RNA of HS68fibroblasts on our Human Genome Microarray. This cDNA micro-
array represents the UnigeneSet-RZPD3 composed of 51,145cDNA clones, a very well characterized subset of the IMAGEcDNA clone collection (http://www.rzpd.de; http://image.llnl.gov/image). Further details about this microarray are provided un-der http://embl-h3r.embl.de and the techniques for hybridizationand washing of the slides have been described in detail in our pre-vious studies [58,59].
Analysis of microarray dataGene expression profiles were determined in BM-MSC-M1 andBM-MSC-M2 of four individual donors. Color-flip hybridizationswere performed for every hybridization, resulting in a dataset of16 hybridizations. Each hybridization was performed with thesame reference RNA of HS68 cells and thus differential expres-sion of MSC cultures could be determined by the difference ofthe two mean log2 ratios vs HS68. Slides were scanned and ana-lyzed by the ChipSkipper Microarray data evaluation software(http://chipskipper.embl.de) as described before in [58]. A two-sided Student’s t-test was utilized to rank genes according to dif-ferential expression (p ! 0.01) [60]. Differentially expressed geneswere further categorized by gene ontology terms using GoMinersoftware (Genomics and Bioinformatics Group, NIH, Bethesda,MD, USA). Functional categories that were overrepresented ineither BM-MSC-M1 or BM-MSC-M2 were determined by hyper-geometric distribution (p ! 0.01). The complete microarray dataincluding the description of all spotted expressed sequence tags(ESTs) (according to Minimal Information About MicroarrayExperiments [MIAME] requirements [61]) was submitted to thepublic microarray database ArrayExpress (http://www.ebi.ac.uk/arrayexpress/; E-EMBL-4).
Comparison of proteome and transcriptomeGenbank IDs assigned to the ESTs presented on the microarraywere then used to match the clones against a Unigene ID. Onehundred thirty-four different spot-cut proteins have been analyzedand could unambiguously be matched with 81 individual proteinscorresponding to different LocusLink IDs. These LocusLink IDswere matched to Unigene and the resulting Unigene IDs comparedto those from the microarray data. To estimate mRNA abundancein those ESTs that were highly expressed in the proteome, wecompared signal intensity in this set of ESTs to signal intensityof all ESTs on the microarray. Mean normalized spot volumeswere determined in the fluorescence channel (Cy3/Cy5) corre-sponding to BM-MSC-M1 and calculated as log10 values. To com-pare differential expression in proteomics and genomics, thecorresponding log2 ratios were then plotted against each otherand correlation assessed by a Pearson correlation coefficient.
Fluorescence microscopyBM-MSC-M1 and BM-MSC-M2 were seeded in chamber slides(Lab-Tek II, Nunc, Wiesbaden, Germany). After 24 hours cellswere fixed with 3% paraformaldehyde for 5 minutes and permea-bilized with 0.2% Triton X-100 for 5 minutes. Cells were then in-cubated with antibodies against vimentin (rabbit anti-human),myosin (rabbit anti-human; Bio Trend, Koln, Germany), tropomy-osin (rabbit anti-human; Sigma, St. Louis, MO, USA), fibronectin(rabbit anti-human; Santa Cruz Biotechnology, Santa Cruz, CA,USA), or ezrin (mouse anti-human; hybridome 3C12, Sigma). An-tibodies were detected by a secondary anti-rabbit-Cy3 antibody oranti-mouse-FITC (Santa Cruz Biotechnology). Nuclei were

539W. Wagner et al./ Experimental Hematology 34 (2006) 536–548
counterstained by Hoechst dye (5 minutes). Cells were thenembedded using Fluoromount-G. A laser-scanning microscope310 (Zeiss, Jena, Germany) (1003 objective) and PhotometricsSensys camera system (Photometrics, Ottobrunn, Germany)were used for the acquisition of images.
RT-PCR analysisEffect of culture conditions was further analyzed by real-time RT-PCR with LightCycler technology (Roche, Mannheim, Germany).Eleven genes differentially expressed in BM-MSC-M1 and BM-MSC-M2 were analyzed upon either cultivation in isolation me-dium or mutually interchanging culture conditions for 8 days. TotalRNA was isolated as described under microarray analysis and re-verse transcribed by Superscript II (Gibco). Semiquantitative PCRwas performed with the LightCycler Master SYBR Green kit(Roche) with 3 mM MgCl at 30 seconds preincubation at 95�C fol-lowed by 45 cycles of 5 seconds at 55�C, 15 seconds at 72�C, 2 sec-onds at 95�C. UBI forward primer (FP): 50-ATCACCCTTGGAGGTGGAG-30; UBI reverse primer (RP): 50-GAAAGAGTACGGCCATCTTC C-30; ELN-FP: 50-AAAAAGGTGTGTTTCATCCA GAG-30; ELN-RP: 50-GTCCCACTGA AC-CTTCCAGA-30; CXCL1-FP: 50-AGCACGCTGC GTATAG-GAAT-30; CXCL12-RP: 50-CAAATCCCCT AAGCAGACCA-30;TAGLN-FP: 50-TCCAGGTCTG GCTGAAGAAT-30; TAGLN-RP: 50-TGCCTTCAAA GAGGTCAACA-30; CTGF-FP: 50-TCCCAAAATC TCCAAGCCTA-30; CTGF-RP: 50-GTAATGG-CAG GCACAGGTCT-30; TPM1-FP: 50-ATTGAGAGTC GAGCC-CAAA-30; TPM1-RP: 50-TTCTTCCAGC TGTCGGACTT-30;EDG3-FP: 50-AGTACTGGA TTAAGAAAAC AACAACA-30;EDG3-RP: 50-TGGCTCTCTG ATGCATTTTG-30; CD36-FP: 50-TTTGTTCTTC CATCCAAGGC-30; CD36-RP: 50-TCCAATATCCCAAGTATGTCC C-30; MMD-FP: 50-CAGTGCTGCT TTGGGA-CATA-30; MMD-RP: 50-TTCAGGAGTT TCCAGCAGAT G-30;AKR1B1-FP: 50-TGCCCATGTG TACCAGAATG-30; AKR1B1-RP: 50-CCAGGTAGTC CAGCTTCAGG-30; CD26-FP: 50-GAAT-TATCCG GTCGGGTTTT-30; CD26-RP: 50-GTCCCTGCCCTAGTGACATC-30; CXCL2-FP: 50-GCAGGGAATT CACCT-CAAGA-30; CXCL2-RP: 50-TGGATTTGCC ATTTTTCAGC-30;Primers were synthesized by Biospring (Frankfurt, Germany).The amplification efficiency of PCR products was determined bycalculating the slope after semi-logarithmic plotting of the valuesagainst cycle number [58,62]. Differential expression was calcu-lated in relation to ubiquitin B.
Results
MSC from human bone marrowMSC were isolated from human bone marrow of the samedonor in either culture medium with low serum content (2%FCS) as described by C. Verfaillie’s group for the isolationof MAPC [1,2] (BM-MSC-M1) or in a commercially avail-able medium with 10% FCS (BM-MSC-M2). Plastic-adher-ent polyclonal cell populations could successfully beisolated from all bone marrow samples under both cultureconditions [29]. Also, differentiation towards osteogenic,chondrogenic, and adipogenic lineages could be inducedin all MSC preparations [1,22,50,63].
Inventory of the MSC proteomeIn protein extract of BM-MSC-M1, 134 protein spots couldbe unambiguously identified by MALDI-TOF MS and sub-sequent bioinformatic data mining. The corresponding pro-tein map is shown in Figure 1. The spots corresponded to 81different proteins whose identified genes are summarizedand functionally categorized in Table 1. The largest func-tional category comprises proteins that belong to the cyto-skeleton. Candidates of other groups are known to play keyroles in protein folding, cellular stress response, metabo-lism, calcium homeostasis, protein synthesis, degradation,and detoxification. Protein representations by multiplespot occurrences result from existing isoforms, posttransla-tional modifications, alternatively spliced or otherwise trun-cated forms of the protein.
Differential protein expressionof BM-MSC-M1 vs BM-MSC-M2Technical replicate gels cultivated under the same condi-tions demonstrated a similar pattern while there were sig-nificant differences in the proteome of BM-MSC isolatedunder different culture conditions (BM-MSC-M1 vs BM-MSC-M2). Representative gels are presented in Figure 2.An average of 1947 6 240 (n 5 4 gels) protein spotswas detected in the cells treated with medium M1, rangingfrom 1695 to 2270, compared to 1300 6 119 (n 5 4 gels)spots in the cells treated with medium M2, ranging from1131 to 1407. A total of 1873 individual protein spotswere assigned to a virtual reference gel to which we could
Figure 1. Two-dimensional protein map of whole-cell lysate from BM-
MSC-M1. Protein separation was performed with immobilized nonlinear
pH 3–10 gradient IPG strips and subsequent SDS-PAGE in a 12.5% matrix
followed by silver staining. Gene symbols are provided for all spot-cut pro-
teins identified by MALDI-TOF MS (proteins are listed in Table 1).

540 W. Wagner et al./ Experimental Hematology 34 (2006) 536–548
Table 1. Identified spots in the proteome of MSC
Locus
Name/Shortcut Link ID# MW pl
Cytoskeleton
actin, g 1/ACTG1 71 2 42108 5.31
actinin, a 1/ ACTN1 87 1 103563 5.22
F-actin capping protein b/CAPZB 832 1 30952 5.36
gelsolin isoform b/GSN 2934 1 80876 -
profilin 1/PFN1 5216 3 15216 8.47
transgelin/TAGLN2 6876 3 22653 8.88
a tropomyosin/TPM1 7168 1 32850 4.77
b tropomyosin/TPM2 7169 2 29980 4.66
Tropomyosin 4/TPM4 7171 1 28619 4.67
vinculin isoform/VCL 7414 1 117220 5.51
vimentin/VIM 7431 10 53710 5.06
WD repeat-containing 1/WDR1 9948 1 66836 6.17
actin-related protein/ACTR1B 10120 1 42659 5.98
tubulin a/Ka1 10376 1 50804 4.94
a-tubulin/H2a 22142 1 50810 4.94
tubulin, b 5/TUBB-5 22154 2 50095 4.78
coactosin-like 1/COTL1 23406 1 16049 5.54
Tubulin b-1 chain /TUBB1 81027 1 50240 4.75
b 5-tubulin/TUBB 203068 2 50096 4.78
Folding, stress response
calreticulin precursor/CALR 811 1 48283 4.29
chaperonin-containing TCP1/CCT6A 908 1 58444 -
protein disulfide-isomerase/GRP58 2923 1 57160 5.98
heat shock 70 kDa 1/HSPA1A 3303 2 70294 5.48
heat shock 70 kDa 4a/HSP70-4 3308 1 95127 5.18
heat shock 70 kDa 5/HSPA5 3309 6 72402 5.07
heat shock 70 kDa 8/HSPA8 3312 3 71082 5.37
heat shock 60 kDa 1/HSPD1 3329 1 61187 5.7
prolyl 4-hydroxylase/P4HB 5034 1 57480 4.76
prohibitin/PHB 5245 1 29843 5.57
t-complex protein 1/TCP1 6950 1 60814 5.72
disulfide isomerase-related/PDA6 10130 2 46512 -
chaperonin-cont. TCP12b/CCT2 10576 1 57794 -
ruvB-like 2/RUVBL2 10856 1 51296 5.49
stress-induced protein 1/STIP1 10963 1 63227 6.40
chaperonin-cont. TCP15e/CCT5 22948 1 60089 -
Metabolism
aldo-keto red. family 1/AKR1B1 231 1 36200 -
IMP cyclohydrolase/ATIC 471 1 65089 6.27
glucose-6P dehydrogenase/G6PD 2539 3 55189 6.66
glutathione synthetase/GSS 2937 1 52523 5.67
isocitrate dehydrogenase 1/IDH1 3417 1 46915 6.53
aldolase A/ALDOA 226 2 39851 8.39
ATP synthase, F1 complex/ATP5B 506 1 56525 5.26
HD exporting ATPase/ATP6V1B2 526 1 56823 -
enolase 1/ENO1 2023 5 47481 5.78
glyceraldehyde-3P dehydr./GAPD 2597 8 36201 8.58
lactate dehydrogenase B/LDHB 3945 2 36900 5.72
phosphoglycerate mutase 1/PGAM1 5223 1 28900 6.75
pyruvate kinase, muscle/PKM2 5315 4 58512 7.95
triosephosphate isomerase 1/TPI1 7167 3 26938 6.45
ubiquinol-cytochr. c red. I/UQCRC1 7384 1 53270 5.94
Ca2D homeostasis
annexin I/ANXA1 301 1 38918 6.64
annexin aA2/ANXA2 302 3 38780 7.57
annexin 5/ANXA5 308 3 35971 4.94
annexin A6/ANXA6 309 2 76168 5.42
histamine-releasing factor/TPT1 7178 1 19697 4.84
(continued)
match an average of 1265 6 419 spots from the M1 groupand 744 6 50 spots from the M2 group. Of these, 241 pro-tein spots showed differential expression as detected by thePhoretix Expression software and t-test with p ! 0.05.Log2 ratios of differential expression (BM-MSC-M1/BM-MSC-M2) ranged from 26.21 to 5.40.
Differential gene expressionof BM-MSC-M1 vs BM-MSC-M2RNA samples of BM-MSC-M1 or BM-MSC-M2 were co-hybridized with reference RNA of human HS68 fibroblastsas described before [29,58]. Unsupervised cluster analysisof samples isolated from four different donors revealedconsistent differences in the gene expression profile ofBM-MSC-M1 as compared to BM-MSC-M2, indicatinga reproducible difference in their transcriptome [29]. UsingStudent’s t-test as filter criteria, 892 ESTs including 460
Table 1 (continued)
Locus
Name/Shortcut Link ID# MW pl
Protein synthesis
initiation factor 4A-I/EIF4A1 1973 1 45490 5.32
laminin-binding protein/LAMR1 3921 1 31888 4.79
ribosomal protein, large, P0/RPLP0 6175 1 34424 5.72
elongation factor EF-Tu/TUFM 7284 1 49851 7.26
Protein degradation
26S proteasome s11/PSMD13 5717 1 43188 6.08
ubiquitin C-term. esterase L/UCHL1 7345 1 25151
valosin-containing protein/VCP 7415 1 89950
proteasome subunit B3/PSMB3 29676 1 23235 6.14
Detoxification
glutathione S-transferase/GSTP1 2950 1 23595 5.44
peroxiredoxin 2/PRDX2 7001 1 22014 5.66
peroxiredoxin 6/PRDX6 9588 1 25133 6.02
thioredoxin peroxidase/PRDX1 10549 1 30749 5.86
Protein modification
peptidylprolyl isomerase A/PPIA 5478 1 18229 7.82
serine proteinase inhib./SERPINB6 5269 1 42901 5.18
glucosidase II/GANAB 23193 1 107289 5.71
Receptor/Channel
cholinergic, nicotinic R/CHRNA7 1139 1 54879 6.02
nuclear Cl-channel protein/CLIC1 1192 2 27249 5.09
Cl intracellular channel 4/CLIC4 25932 1 28982 5.45
Extracellular matrix
collagen, type Via1/COL6A1 1291 1 109602 5.26
procollagen-lysine/PLOD2 5352 2 85351 6.15
Vesicel trafficking
GDP dissociation inhibitor 2/GDI2 2665 1 51087 6.11
Cell cycle
uracil DMA glycosylase/UNG 7374 1 35698 9.37
Other
ribonuclease inhibitor/RNH 6050 1 51635 4.71
major vault protein/MVP 9961 1 99551 5.34
cargo selection protein/TIP47 10226 1 47189 5.3
RNA-binding protein/PARK7 11315 1 20050 6.33
Proteins (81 in total) as identified in 134 protein spots. # 5 number of cor-
responding protein spots for this individual protein. Theoretical molecular
mass (MW) in kDa and theoretical pl are provided.

541W. Wagner et al./ Experimental Hematology 34 (2006) 536–548
Figure 2. Comparison of two-dimensional protein maps of BM-MSC-M1 vs BM-MSC-M2. Representative gels are demonstrated for BM-MSC preparations
isolated from the same donor sample under different culture conditions (M1 and M2). Differential protein expression was determined by differential den-
sitometry (n 5 4 gels for each culture condition) and differentially expressed proteins that have been identified are indicated by gene symbols. The protein
map of BM-MSC-M1 reveals a higher similarity to BM-MSC-M1 isolated from a different donor sample (e.g., Fig. 1) as compared to BM-MSC-M2 prep-
arations from the same donor sample.
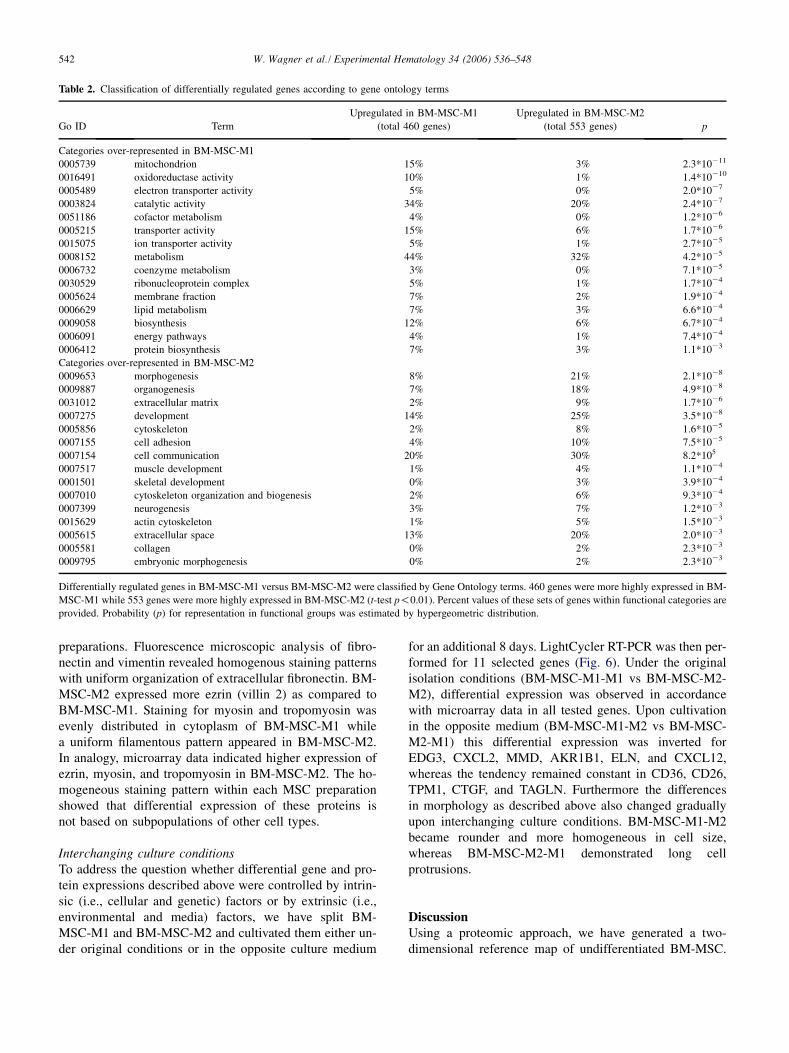
nonredundant characterized genes were significantly morehighly expressed in BM-MSC-M1 while 1153 ESTs includ-ing 553 nonredundant characterized genes were morehighly expressed in BM-MSC-M2 (p ! 0.01). These differ-entially expressed genes were subjected to gene ontologyanalysis as demonstrated in Table 2. Mitochondrial genesas well as genes involved in metabolism, translation, or ox-idoreductase activity were more highly expressed in BM-MSC-M1. In contrast, genes involved in development anddifferentiation including muscle and skeletal development,morphogenesis, neurogenesis, and organogenesis were sig-nificantly overrepresented in BM-MSC-M2.
Comparative analysis of proteomic and genomic dataProteins of the above-described proteome inventory werematched to technical replica gels of BM-MSC-M1 andBM-MSC-M2 and corresponding cDNA clones were se-lected on the Human Transcriptome Microarray. Sixty-threedifferent proteins represented by 73 different protein spotswere identified that were represented by 105 differentcDNA clones on the microarray. In this subset of 105ESTs median signal intensity in microarray data was98,650 (arbitrary units). In contrast, median signal intensityof all ESTs of the UnigeneSet RZPD3 (51,144 differentESTs) was 7949. Thus, signal intensity of microarraydata was much higher in the subset of genes that were abun-dant on protein level (t-test: p 5 1.1 3 10211). Log10 valuesof signal intensities of the two sets of genes are presented inFigure 3. Subsequently, differential protein expression ofBM-MSC-M1 vs BM-MSC-M2 as determined by differen-tial densitometry was compared with differential RNA ex-pression as determined by microarray analysis. Pairwise
comparative analysis revealed 124 different combinationsof protein spots and cDNA clones (63 different proteinsrepresented by 73 different protein spots and 105 differentcDNA clones). Log2 ratios of differential protein expressionas determined by proteomics were plotted against log2 ra-tios of microarray data. Pearson correlation coefficient oflog2 rations in all spots was moderate (R 5 0.41). However,there was a clear correlation of differential protein and geneexpression in those genes that were differentially expressedby microarray analysis (p ! 0.05; Pearson correlation co-efficient: R 5 0.83). Figure 4 depicts this selection of spotsand Table 3 the corresponding list of genes. A similar cor-relation was observed if only microarray hybridizations ofthe same MSC donor were considered, that had also beenused for proteomic analysis (R 5 0.74). Differential expres-sion as observed in microarray analysis is thus reflected bythe proteome.
Morphology of MSC is influenced by culture mediumMorphological differences between both MSC preparationscould be observed by phase-contrast microscopy (Fig. 5).BM-MSC-M1 were more heterogeneous in cell size andcell divisions occurred preferentially in smaller cells with-out intimate contact to surrounding cells. Long cell protru-sions were extended from the elongated larger cells. Incontrast, BM-MSC-M2 displayed a more round and ratherhomogenous morphology. These differences in morphologywere consistent between different donor samples and couldbe observed in all MSC preparations.
Next, we have addressed the question if differential ex-pression in BM-MSC-M1 vs BM-MSC-M2 results froma different composition of subpopulations within cell
542 W. Wagner et al./ Experimental Hematology 34 (2006) 536–548
Table 2. Classification of differentially regulated genes according to gene ontology terms
Go ID Term
Upregulated in BM-MSC-M1
(total 460 genes)
Upregulated in BM-MSC-M2
(total 553 genes) p
Categories over-represented in BM-MSC-M1
0005739 mitochondrion 15% 3% 2.3*10211
0016491 oxidoreductase activity 10% 1% 1.4*10210
0005489 electron transporter activity 5% 0% 2.0*1027
0003824 catalytic activity 34% 20% 2.4*1027
0051186 cofactor metabolism 4% 0% 1.2*1026
0005215 transporter activity 15% 6% 1.7*1026
0015075 ion transporter activity 5% 1% 2.7*1025
0008152 metabolism 44% 32% 4.2*1025
0006732 coenzyme metabolism 3% 0% 7.1*1025
0030529 ribonucleoprotein complex 5% 1% 1.7*1024
0005624 membrane fraction 7% 2% 1.9*1024
0006629 lipid metabolism 7% 3% 6.6*1024
0009058 biosynthesis 12% 6% 6.7*1024
0006091 energy pathways 4% 1% 7.4*1024
0006412 protein biosynthesis 7% 3% 1.1*1023
Categories over-represented in BM-MSC-M2
0009653 morphogenesis 8% 21% 2.1*1028
0009887 organogenesis 7% 18% 4.9*1028
0031012 extracellular matrix 2% 9% 1.7*1026
0007275 development 14% 25% 3.5*1028
0005856 cytoskeleton 2% 8% 1.6*1025
0007155 cell adhesion 4% 10% 7.5*1025
0007154 cell communication 20% 30% 8.2*105
0007517 muscle development 1% 4% 1.1*1024
0001501 skeletal development 0% 3% 3.9*1024
0007010 cytoskeleton organization and biogenesis 2% 6% 9.3*1024
0007399 neurogenesis 3% 7% 1.2*1023
0015629 actin cytoskeleton 1% 5% 1.5*1023
0005615 extracellular space 13% 20% 2.0*1023
0005581 collagen 0% 2% 2.3*1023
0009795 embryonic morphogenesis 0% 2% 2.3*1023
Differentially regulated genes in BM-MSC-M1 versus BM-MSC-M2 were classified by Gene Ontology terms. 460 genes were more highly expressed in BM-
MSC-M1 while 553 genes were more highly expressed in BM-MSC-M2 (t-test p!0.01). Percent values of these sets of genes within functional categories are
provided. Probability (p) for representation in functional groups was estimated by hypergeometric distribution.
preparations. Fluorescence microscopic analysis of fibro-nectin and vimentin revealed homogenous staining patternswith uniform organization of extracellular fibronectin. BM-MSC-M2 expressed more ezrin (villin 2) as compared toBM-MSC-M1. Staining for myosin and tropomyosin wasevenly distributed in cytoplasm of BM-MSC-M1 whilea uniform filamentous pattern appeared in BM-MSC-M2.In analogy, microarray data indicated higher expression ofezrin, myosin, and tropomyosin in BM-MSC-M2. The ho-mogeneous staining pattern within each MSC preparationshowed that differential expression of these proteins isnot based on subpopulations of other cell types.
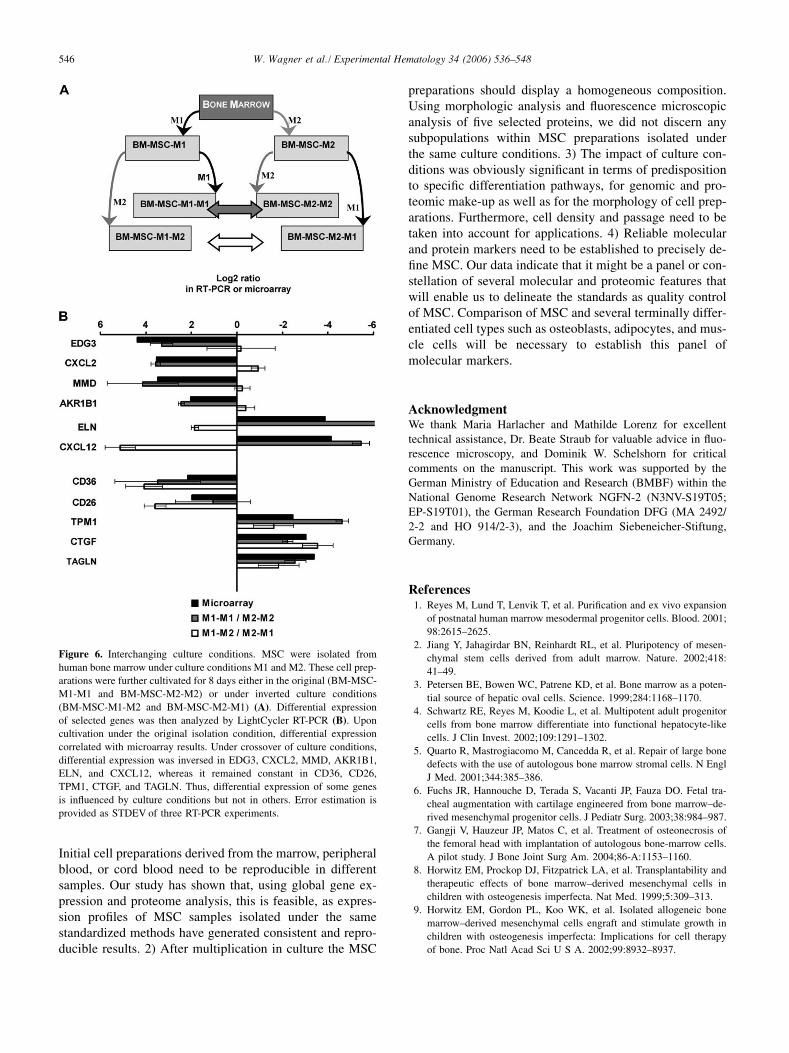
Interchanging culture conditionsTo address the question whether differential gene and pro-tein expressions described above were controlled by intrin-sic (i.e., cellular and genetic) factors or by extrinsic (i.e.,environmental and media) factors, we have split BM-MSC-M1 and BM-MSC-M2 and cultivated them either un-der original conditions or in the opposite culture medium
for an additional 8 days. LightCycler RT-PCR was then per-formed for 11 selected genes (Fig. 6). Under the originalisolation conditions (BM-MSC-M1-M1 vs BM-MSC-M2-M2), differential expression was observed in accordancewith microarray data in all tested genes. Upon cultivationin the opposite medium (BM-MSC-M1-M2 vs BM-MSC-M2-M1) this differential expression was inverted forEDG3, CXCL2, MMD, AKR1B1, ELN, and CXCL12,whereas the tendency remained constant in CD36, CD26,TPM1, CTGF, and TAGLN. Furthermore the differencesin morphology as described above also changed graduallyupon interchanging culture conditions. BM-MSC-M1-M2became rounder and more homogeneous in cell size,whereas BM-MSC-M2-M1 demonstrated long cellprotrusions.
DiscussionUsing a proteomic approach, we have generated a two-dimensional reference map of undifferentiated BM-MSC.

543W. Wagner et al./ Experimental Hematology 34 (2006) 536–548
The protein isolation methods applied here focused on sol-uble cytoplasmic proteins and the profile might be ex-panded by the inclusion of additional specifically isolatedsubcellular fractions. Most of the identified proteins upre-gulated in MSC play a role in cytoskeleton, protein folding,and metabolism [44]. Proteins of signal cascades and tran-scription factors multiply their information on variousdownstream targets, and hence it is not surprising that pu-tative regulators of differentiation are not among the mostabundant proteins. Vimentin was among the most highlyexpressed proteins in MSC and this has been reported be-fore [42,48,64]. This intermediate filament is highly ex-pressed in mesenchymal tissues and has been suggestedto serve as a key protein to identify progenitor cells of me-sodermal origin. Ten different vimentin spots were detectedwhich may be the result of different phosphorylation statesof the protein. Vimentin is phosphorylated by protein ki-nase C (PKC) during activation of mitosis [65]. Gelsolin,a protein originally identified as an actin-severing protein,plays a major role in cell motility and apoptosis [66,67].Wang et al. have previously described expression of gelso-lin in BM-MSC and they demonstrated that it is decreasedupon stimulation with TGF-b, thereby promoting assemblyof actin filaments [44]. Uracil-DNA glycosylases (UNG)might play an important role in protecting MSC frommutagenesis by eliminating uracil from DNA moleculesby cleaving the N-glycosylic bond and initiating the base-excision repair pathway. However, none of the identifiedproteins seems to be specific for MSC. Our microarraydata showed that only procollagen-lysine 2-oxoglutarate
Figure 3. Use of signal intensity in cDNA microarrays to estimate quan-
titative expression. Average signal intensity in cDNA spots on the micro-
array was determined in 8 cohybridization datasets with BM-MSC-M1.
Distribution of signal intensity (Log10) of all ESTs of the UnigenSet
RZPD3 is demonstrated in the histogram (n 5 51.144 ESTs). In analogy,
distribution of signal intensity is presented for the subset of genes that have
been identified by proteomics analysis (n 5 105 ESTs). Mean signal inten-
sity was significantly higher in the set of genes corresponding to expressed
proteins, indicating that signal intensity provides a measure to estimate ab-
solute gene expression.
5-dioxygenase (PLOD2) was more highly expressed inboth BM-MSC-M1 and BM-MSC-M2 as compared to ter-minally differentiated fibroblasts (HS68) (5.2-fold and6.1-fold respectively). We have previously demonstratedthat under the established in vitro differentiation conditionsthis HS68 cell line does not show osteogenic or adipogenicdifferentiation. On the other hand, these cells may havea unique and specific expression pattern and a comprehen-sive and comparative analysis with other differentiated celltypes will be necessary to elucidate molecular characteris-tics of MSC. However, the correlation with expressiondata of HS68 indicates that none of the highly expressedproteins seems to be suitable as a unique marker forMSC. It is rather the composition of the global proteomeof MSC as determined by two-dimensional gel electropho-resis that might serve as a reliable quality control of BM-MSC in vitro.
Previous studies have focused on correlation of proteinexpression and mRNA expression in other cell types suchas yeast [49,68,69], liver [70], MPRO murine cell line[71,72], and dendritic cells [73]. These studies demon-strated that for a substantial number of genes the absoluteamount of protein in the cell is not strictly correlated tothe amount of mRNA. Depending on experimental designand selection of genes included in the comparative analysis,
Figure 4. Correlation of differential expression in proteomics and geno-
mics. Differential expression of genes in BM-MSC-M1 vs BM-MSC-M2
was compared on the protein and mRNA level. Log2 ratios of differential
expression are plotted against each other. Each spot represents a gene that
was differentially expressed in microarray analysis (t-test ! 0.05). Data of
these spots are provided in Table 3. These results indicate that differential
expression as observed by microarray analysis is similar on the protein
level.

544 W. Wagner et al./ Experimental Hematology 34 (2006) 536–548
Table 3. Differential expression on transcriptome and proteome level
Microarray Proteomics
Reporter identifier Shortcut Acc. No.
MSC-M1/MSC-M2
(log2ratio) t-test
Locus
Link ID
MSC-M1/MSC-M2
(log2ratio) t-test
Smooth muscle protein 22-a TAGLN aa398868 23.38 0.00 6876 22.55 0.22
tropomyosin 1 (a) TPM1 ai091228 22.52 0.00 7168 24.34 0.11
tropomvosin 1 (a) TPM1 ai075350 22.45 0.00 7168 24.34 0.11
actin, b ACTB ai926059 21.11 0.00 71 20.06 0.96
WD repeat domain 1 WDR1 172630 20.72 0.00 9948 20.88 0.15
chloride intracellular channel 4 CLIC4 r82605 20.71 0.02 25932 20.10 0.91
actin, g1 ACTG1 aa284287 20.48 0.01 71 20.06 0.96
t-complex protein 1a TCP1 aa131797 0.45 0.05 6950 1.27 0.02
IMP cyclohydrolase ATIC r52997 0.46 0.03 471 0.69 0.29
protein disulfide isomerase P5 PDA6_HUMAN ai086231 0.46 0.00 10130 0.44 0.65
Prohibitin PHB ai475803 0.51 0.04 5245 1.45 0.09
elongation factor TU TUFM aa731386 0.52 0.02 7284 1.16 0.13
t-complex protein z 1 CCT6A n20496 0.54 0.02 908 20.13 0.77
Tu elongation factor, mitochondrial TUFM h23087 0.59 0.00 7284 1.16 0.13
isocitrate dehydrogenase 1 IDH1 h99895 0.61 0.05 3417 -0.04 0.94
Prohibitin PHB h47858 0.61 0.01 5245 1.45 0.09
peroxiredoxin 6 PRDX6 ai150359 0.68 0.02 9588 0.66 0.07
peroxiredoxin 6 PRDX6 aa846538 0.75 0.02 9588 0.66 0.07
peroxiredoxin 1 PRDX1 r93376 0.79 0.00 10549 1.61 0.01
coactosin-like 1 COTL1 n67507 0.82 0.05 23406 3.88 0.03
Tu elongation factor, mitochondrial TUFM ai143752 0.87 0.01 7284 1.16 0.13
60-kda heat shock protein HSPD1 aa033827 0.96 0.01 3329 20.72 0.61
peroxiredoxin 6 PRDX6 ai375702 0.98 0.00 9588 0.66 0.07
ATP synthase b chain ATP5B h68636 1.01 0.00 506 0.69 0.62
coactosin-like protein COTL1 ai434261 1.31 0.02 23406 3.88 0.03
aldo-keto reductase 1B1 AKR1B1 r51647 2.05 0.00 231 2.07 0.00
Table summarizes spots with a differential expression in 8 co-hybridizations with BM-MSC-M1 in comparison to 8 co-hybridizations with BM-MSC-M2
t-test ! 0.05) and in analogy corresponding differential expression in proteomics is demonstrated as log2ratio.
the correlation in these studies ranged from moderate tohigh. Discrepancies between RNA and protein levels sug-gest the important role of modifications in posttranscrip-tional and posttranslational processes of the cell, althoughsome differences undoubtedly arise from technical limita-tions of current methods of measurements. Gene expressioncan only be roughly quantified by signal intensity in cDNAmicroarrays due to variations in spot size, cDNA quantity,and different hybridization capability of different sequences[74]. Despite these limitations, our results have demon-strated a significantly higher signal intensity in the set ofcDNA clones corresponding to highly abundant proteinsas identified by proteomics. Differential expression inBM-MSC-M1 vs BM-MSC-M2 was then compared atmRNA level and protein level. Genes differentially ex-pressed in microarray analysis revealed differential expres-sion on the proteomic level as well, indicating valid resultsof both applied methods. However, correlation was less ob-vious if all corresponding genes of microarray and proteo-mic analysis were considered or if only those spots wereselected that were differentially regulated on the proteinlevel. These results suggest that gene expression analysismight be a better indicator for differential protein expres-sion than vice versa. This might be due to additional post-transcriptional and posttranslational modifications.
A large number of genes were significantly differentiallyregulated in BM-MSC-M1 vs BM-MSC-M2 [29]. Genes inthe functional categories of metabolism and mitochondriawere more highly expressed in BM-MSC-M1. In contrast,genes involved in muscle development, actin binding,neurogenesis, cell differentiation, morphogenesis, skeletaldevelopment, and development were significantly overrep-resented in BM-MSC-M2. A similar tendency was ob-served on the protein level: Among the proteins morehighly expressed in BM-MSC-M1 were proteins of the per-oxiredoxin family of antioxidant enzymes and glutathione-S-transferase, which play a protective role in cells [75].Prdx1-deficient fibroblasts, for example, show decreasedproliferation and increased sensitivity to oxidative DNAdamage [76]. Prohibin (PHB), which is higher expressedin BM-MSC-M1, is thought to be a negative regulator ofcell proliferation and may represent a tumor suppressorgene. In contrast, proteins such as actin, tropomyosin, andtransgelin, which are known to be highly expressed insmooth-muscle cells, were more highly expressed in BM-MSC-M2. Thus, although MSC are considered to be multi-potent and undifferentiated, some MSC lines already ex-hibit molecular signs of lineage commitment ata genomic and proteomic level. BM-MSC-M2 possesscharacteristics that are associated with more commitment

545W. Wagner et al./ Experimental Hematology 34 (2006) 536–548
Figure 5. Fluorescence microscopic analysis. Representative images of BM-MSC-M1 and BM-MSC-M2 in phase contrast (A,B) and fluorescence micros-
copy using antibodies against fibronectin (C,D), vimentin (E,F), ezrin (G,H), myosin (I,J), and tropomyosin (K,L). BM-MSC-M1 were heterogeneous in cell
size and larger cells revealed an elongated cell shape with long cell protrusions (black arrows). In contrast, BM-MSC-M2 were homogenous in cell size with
a rounder morphology. Staining pattern of extracellular fibronectin or intracellular cytoskeleton proteins was homogeneous and no subpopulations could be
differentiated within cell preparations. The specific membrane-bound signal of ezrin as well as the fibrillar organization of myosin and tropomyosin was
stronger in BM-MSC-M2, which is in accordance with microarray and proteomics data (white arrows).
towards myogenic differentiation. As MSC preparationsrepresent a mixture of plastic-adherent cell clones, this dif-ferential expression might be a result of the composition ofsubpopulations within the original preparation. For exam-ple, higher expression of actin, tropomyosin, and transgelinin BM-MSC-M2 might be a result of comprised vascularsmooth-muscle cells. We have looked for distinct subpopu-lations by fluorescent microscopic analysis but were notable to discern any differences in morphologic distributionof five selected proteins. In addition, using a panel of 22 an-tigen markers we have not been able to observe any differ-ences among these populations [29].
The question remained whether different cell types wereselected under the different isolation conditions or whetherthe impact on transcriptome and proteome was solely deter-mined by extrinsic factors such as differences in culture me-dium. Following cross-over of BM-MSC-M1 and BM-MSC-M2 to opposite culture conditions we demonstrated that at
least some of the observed differences were induced by ex-trinsic factors. Differences in morphology between thesepreparations were affected by interchanging culture condi-tions, too. However, in five genes the tendency of differentialexpression was conserved even after cultivation in the oppo-site medium for 8 days. Thus, culture conditions have a per-sistent influence on the gene and protein expression.Preparative protocols have impact on cellular organizationof MSC preparations and on their differentiation potential.This implies not only the culture medium but also the pas-sage and density of cultures as demonstrated in various stud-ies before [1,77,78]. Differences in the outcome oftransplantation experiments might be thereby explainedand these results underline that a more precise definition ofthe starting populations using molecular parameters andmore stringent isolation protocols is highly essential.
Several essential steps are required for establishment ofreliable standards for quality control of human MSC. 1)
546 W. Wagner et al./ Experimental Hematology 34 (2006) 536–548
Initial cell preparations derived from the marrow, peripheralblood, or cord blood need to be reproducible in differentsamples. Our study has shown that, using global gene ex-pression and proteome analysis, this is feasible, as expres-sion profiles of MSC samples isolated under the samestandardized methods have generated consistent and repro-ducible results. 2) After multiplication in culture the MSC
Figure 6. Interchanging culture conditions. MSC were isolated from
human bone marrow under culture conditions M1 and M2. These cell prep-
arations were further cultivated for 8 days either in the original (BM-MSC-
M1-M1 and BM-MSC-M2-M2) or under inverted culture conditions
(BM-MSC-M1-M2 and BM-MSC-M2-M1) (A). Differential expression
of selected genes was then analyzed by LightCycler RT-PCR (B). Upon
cultivation under the original isolation condition, differential expression
correlated with microarray results. Under crossover of culture conditions,
differential expression was inversed in EDG3, CXCL2, MMD, AKR1B1,
ELN, and CXCL12, whereas it remained constant in CD36, CD26,
TPM1, CTGF, and TAGLN. Thus, differential expression of some genes
is influenced by culture conditions but not in others. Error estimation is
provided as STDEV of three RT-PCR experiments.
preparations should display a homogeneous composition.Using morphologic analysis and fluorescence microscopicanalysis of five selected proteins, we did not discern anysubpopulations within MSC preparations isolated underthe same culture conditions. 3) The impact of culture con-ditions was obviously significant in terms of predispositionto specific differentiation pathways, for genomic and pro-teomic make-up as well as for the morphology of cell prep-arations. Furthermore, cell density and passage need to betaken into account for applications. 4) Reliable molecularand protein markers need to be established to precisely de-fine MSC. Our data indicate that it might be a panel or con-stellation of several molecular and proteomic features thatwill enable us to delineate the standards as quality controlof MSC. Comparison of MSC and several terminally differ-entiated cell types such as osteoblasts, adipocytes, and mus-cle cells will be necessary to establish this panel ofmolecular markers.
AcknowledgmentWe thank Maria Harlacher and Mathilde Lorenz for excellenttechnical assistance, Dr. Beate Straub for valuable advice in fluo-rescence microscopy, and Dominik W. Schelshorn for criticalcomments on the manuscript. This work was supported by theGerman Ministry of Education and Research (BMBF) within theNational Genome Research Network NGFN-2 (N3NV-S19T05;EP-S19T01), the German Research Foundation DFG (MA 2492/2-2 and HO 914/2-3), and the Joachim Siebeneicher-Stiftung,Germany.
References1. Reyes M, Lund T, Lenvik T, et al. Purification and ex vivo expansion
of postnatal human marrow mesodermal progenitor cells. Blood. 2001;
98:2615–2625.
2. Jiang Y, Jahagirdar BN, Reinhardt RL, et al. Pluripotency of mesen-
chymal stem cells derived from adult marrow. Nature. 2002;418:
41–49.
3. Petersen BE, Bowen WC, Patrene KD, et al. Bone marrow as a poten-
tial source of hepatic oval cells. Science. 1999;284:1168–1170.
4. Schwartz RE, Reyes M, Koodie L, et al. Multipotent adult progenitor
cells from bone marrow differentiate into functional hepatocyte-like
cells. J Clin Invest. 2002;109:1291–1302.
5. Quarto R, Mastrogiacomo M, Cancedda R, et al. Repair of large bone
defects with the use of autologous bone marrow stromal cells. N Engl
J Med. 2001;344:385–386.
6. Fuchs JR, Hannouche D, Terada S, Vacanti JP, Fauza DO. Fetal tra-
cheal augmentation with cartilage engineered from bone marrow–de-
rived mesenchymal progenitor cells. J Pediatr Surg. 2003;38:984–987.
7. Gangji V, Hauzeur JP, Matos C, et al. Treatment of osteonecrosis of
the femoral head with implantation of autologous bone-marrow cells.
A pilot study. J Bone Joint Surg Am. 2004;86-A:1153–1160.
8. Horwitz EM, Prockop DJ, Fitzpatrick LA, et al. Transplantability and
therapeutic effects of bone marrow–derived mesenchymal cells in
children with osteogenesis imperfecta. Nat Med. 1999;5:309–313.
9. Horwitz EM, Gordon PL, Koo WK, et al. Isolated allogeneic bone
marrow–derived mesenchymal cells engraft and stimulate growth in
children with osteogenesis imperfecta: Implications for cell therapy
of bone. Proc Natl Acad Sci U S A. 2002;99:8932–8937.

547W. Wagner et al./ Experimental Hematology 34 (2006) 536–548
10. Koc ON, Day J, Nieder M, et al. Allogeneic mesenchymal stem cell in-
fusion for treatment of metachromatic leukodystrophy (MLD) and Hurler
syndrome (MPS-IH). Bone Marrow Transplant. 2002;30:215–222.
11. Chen SL, Fang WW, Ye F, et al. Effect on left ventricular function of
intracoronary transplantation of autologous bone marrow mesenchy-
mal stem cell in patients with acute myocardial infarction. Am J Car-
diol. 2004;94:92–95.
12. Deb A, Wang S, Skelding KA, et al. Bone marrow–derived cardiomyo-
cytes are present in adult human heart: A study of gender-mismatched
bone marrow transplantation patients. Circulation. 2003;107:1247–1249.
13. Kadereit S, Deeds LS, Haynesworth SE, et al. Expansion of LTC-ICs
and maintenance of p21 and BCL-2 expression in cord blood
CD34D/CD382 early progenitors cultured over human MSCs as
a feeder layer. Stem Cells. 2002;20:573–582.
14. Zhang Y, Li C, Jiang X, et al. Human placenta–derived mesenchymal pro-
genitor cells support culture expansion of long-term culture-initiating
cells from cord blood CD34D cells. Exp Hematol. 2004;32:657–664.
15. Fouillard L, Bensidhoum M, Bories D, et al. Engraftment of alloge-
neic mesenchymal stem cells in the bone marrow of a patient with se-
vere idiopathic aplastic anemia improves stroma. Leukemia. 2003;17:
474–476.
16. Friedenstein AJ, Piatetzky-Shapiro II, Petrakova KV. Osteogenesis in
transplants of bone marrow cells. J Embryol Exp Morphol. 1966;16:
381–390.
17. Pittenger MF, Mackay AM, Beck SC, et al. Multilineage potential of
adult human mesenchymal stem cells. Science. 1999;284:143–147.
18. Zuk PA, Zhu M, Mizuno H, et al. Multilineage cells from human ad-
ipose tissue: implications for cell-based therapies. Tissue Eng. 2001;7:
211–228.
19. Bieback K, Kern S, Kluter H, Eichler H. Critical parameters for the
isolation of mesenchymal stem cells from umbilical cord blood.
Stem Cells. 2004;22:625–634.
20. Erices A, Conget P, Minguell JJ. Mesenchymal progenitor cells in hu-
man umbilical cord blood. Br J Haematol. 2000;109:235–242.
21. Goodwin HS, Bicknese AR, Chien SN, et al. Multilineage differenti-
ation activity by cells isolated from umbilical cord blood: expression
of bone, fat, and neural markers. Biol Blood Marrow Transplant. 2001;
7:581–588.
22. Kogler G, Sensken S, Airey JA, et al. A new human somatic stem cell
from placental cord blood with intrinsic pluripotent differentiation po-
tential. J Exp Med. 2004;200:123–135.
23. Haynesworth SE, Baber MA, Caplan AI. Cell surface antigens on hu-
man marrow–derived mesenchymal cells are detected by monoclonal
antibodies. Bone. 1992;13:69–80.
24. Gronthos S, Franklin DM, Leddy HA, et al. Surface protein character-
ization of human adipose tissue–derived stromal cells. J Cell Physiol.
2001;189:54–63.
25. Aust L, Devlin B, Foster SJ, et al. Yield of human adipose–derived
adult stem cells from liposuction aspirates. Cytotherapy. 2004;6:7–14.
26. Tocci A, Forte L. Mesenchymal stem cell: use and perspectives. Hem-
atol J. 2003;4:92–96.
27. Zuk PA, Zhu M, Ashjian P, et al. Human adipose tissue is a source of
multipotent stem cells. Mol Biol Cell. 2002;13:4279–4295.
28. Javazon EH, Beggs KJ, Flake AW. Mesenchymal stem cells: para-
doxes of passaging. Exp Hematol. 2004;32:414–425.
29. Wagner W, Wein F, Seckinger A, et al. Comparative characteristics of
mesenchymal stem cells from human bone marrow, adipose tissue and
umbilical cord blood. Exp Hematol. 2005;33:1402–1416.
30. Maurer MH. The path to enlightenment: making sense of genomic and
proteomic information. Genomics Proteomics Bioinformatics. 2004;2:
123–131.
31. Sekiya I, Vuoristo JT, Larson BL, Prockop DJ. In vitro cartilage for-
mation by human adult stem cells from bone marrow stroma defines
the sequence of cellular and molecular events during chondrogenesis.
Proc Natl Acad Sci U S A. 2002;99:4397–4402.
32. Qi H, Aguiar DJ, Williams SM, et al. Identification of genes respon-
sible for osteoblast differentiation from human mesodermal progenitor
cells. Proc Natl Acad Sci U S A. 2003;100:3305–3310.
33. Sekiya I, Larson BL, Vuoristo JT, Cui JG, Prockop DJ. Adipogenic
differentiation of human adult stem cells from bone marrow stroma
(MSCs). J Bone Miner Res. 2004;19:256–264.
34. Nakamura T, Shiojima S, Hirai Y, et al. Temporal gene expression
changes during adipogenesis in human mesenchymal stem cells. Bio-
chem Biophys Res Commun. 2003;303:306–312.
35. Doi M, Nagano A, Nakamura Y. Genome-wide screening by cDNA
microarray of genes associated with matrix mineralization by human
mesenchymal stem cells in vitro. Biochem Biophys Res Commun.
2002;290:381–390.
36. Majumdar MK, Thiede MA, Mosca JD, Moorman M, Gerson SL. Phe-
notypic and functional comparison of cultures of marrow-derived mes-
enchymal stem cells (MSCs) and stromal cells. J Cell Physiol. 1998;
176:57–66.
37. Jiang Y, Vaessen B, Lenvik T, et al. Multipotent progenitor cells can be
isolated from postnatal murine bone marrow, muscle, and brain. Exp
Hematol. 2002;30:896–904.
38. Lee RH, Kim B, Choi I, et al. Characterization and expression analysis
of mesenchymal stem cells from human bone marrow and adipose tis-
sue. Cell Physiol Biochem. 2004;14:311–324.
39. Tremain N, Korkko J, Ibberson D, et al. MicroSAGE analysis of 2,353
expressed genes in a single cell-derived colony of undifferentiated hu-
man mesenchymal stem cells reveals mRNAs of multiple cell line-
ages. Stem Cells. 2001;19:408–418.
40. Jia L, Young MF, Powell J, et al. Gene expression profile of human
bone marrow stromal cells: high-throughput expressed sequence tag
sequencing analysis. Genomics. 2002;79:7–17.
41. Wieczorek G, Steinhoff C, Schulz R, et al. Gene expression profile of
mouse bone marrow stromal cells determined by cDNA microarray
analysis. Cell Tissue Res. 2003;311:227–237.
42. Panepucci RA, Siufi JL, Silva WA Jr, et al. Comparison of gene ex-
pression of umbilical cord vein and bone marrow–derived mesenchy-
mal stem cells. Stem Cells. 2004;22:1263–1278.
43. Silva WA Jr, Covas DT, Panepucci RA, et al. The profile of gene ex-
pression of human marrow mesenchymal stem cells. Stem Cells. 2003;
21:661–669.
44. Wang D, Park JS, Chu JS, et al. Proteomic profiling of bone marrow
mesenchymal stem cells upon transforming growth factor b1 stimula-
tion. J Biol Chem. 2004;279:43725–43734.
45. Evans CA, Tonge R, Blinco D, et al. Comparative proteomics of prim-
itive hematopoietic cell populations reveals differences in expression
of proteins regulating motility. Blood. 2004;103:3751–3759.
46. Maurer MH, Feldmann RE Jr, Futterer CD, Butlin J, Kuschinsky W.
Comprehensive proteome expression profiling of undifferentiated ver-
sus differentiated neural stem cells from adult rat hippocampus. Neu-
rochem Res. 2004;29:1129–1144.
47. Wang D, Gao L. Proteomic analysis of neural differentiation of mouse
embryonic stem cells. Proteomics. 2005;5:4414–4426.
48. Feldmann RE, Jr., Bieback K, Maurer MH, et al. Stem cell proteomes:
A profile of human mesenchymal stem cells derived from umbilical
cord blood. Electrophoresis. 2005;Epub ahead of Print:
DOI10.1002/elps.200410406.
49. Gygi SP, Rochon Y, Franza BR, Aebersold R. Correlation between
protein and mRNA abundance in yeast. Mol Cell Biol. 1999;19:
1720–1730.
50. Hauner H, Entenmann G, Wabitsch M, et al. Promoting effect of glu-
cocorticoids on the differentiation of human adipocyte precursor cells
cultured in a chemically defined medium. J Clin Invest. 1989;84:
1663–1670.
51. Mackay AM, Beck SC, Murphy JM, et al. Chondrogenic differentia-
tion of cultured human mesenchymal stem cells from marrow. Tissue
Eng. 1998;4:415–428.

548 W. Wagner et al./ Experimental Hematology 34 (2006) 536–548
52. Maurer MH, Feldmann RE Jr, Futterer CD, Kuschinsky W. The pro-
teome of neural stem cells from adult rat hippocampus. Proteome
Sci. 2003;1:4.
53. Ramagli LS. Quantifying protein in 2-D PAGE solubilization buffers.
Methods Mol Biol. 1999;112:99–103.
54. Gorg A, Obermaier C, Boguth G, et al. The current state of two-
dimensional electrophoresis with immobilized pH gradients. Electro-
phoresis. 2000;21:1037–1053.
55. Gharahdaghi F, Weinberg CR, Meagher DA, Imai BS, Mische SM.
Mass spectrometric identification of proteins from silver-stained poly-
acrylamide gel: a method for the removal of silver ions to enhance
sensitivity. Electrophoresis. 1999;20:601–605.
56. Vogt JA, Schroer K, Holzer K, et al. Protein abundance quantification
in embryonic stem cells using incomplete metabolic labelling with
15N amino acids, matrix-assisted laser desorption/ionisation time-
of-flight mass spectrometry, and analysis of relative isotopologue
abundances of peptides. Rapid Commun Mass Spectrom. 2003;17:
1273–1282.
57. Perkins DN, Pappin DJ, Creasy DM, Cottrell JS. Probability-based
protein identification by searching sequence databases using mass
spectrometry data. Electrophoresis. 1999;20:3551–3567.
58. Wagner W, Ansorge A, Wirkner U, et al. Molecular evidence for stem
cell function of the slow-dividing fraction among human hematopoi-
etic progenitor cells by genome-wide analysis. Blood. 2004;104:
675–686.
59. Richter A, Schwager C, Hentze S, et al. Comparison of fluorescent tag
DNA labeling methods used for expression analysis by DNA microar-
rays. Biotechniques. 2002;33:620–628, 630.
60. Maurer MH, Feldmann RE Jr, Bromme JO, Kalenka A. Comparison of
statistical approaches for the analysis of proteome expression data of
differentiating neural stem cells. J Proteome Res. 2005;4:96–100.
61. Brazma A, Hingamp P, Quackenbush J, et al. Minimum information
about a microarray experiment (MIAME)dtoward standards for mi-
croarray data. Nat Genet. 2001;29:365–371.
62. Rossmann H, Bachmann O, Vieillard-Baron D, Gregor M, Seidler U.
NaD/. Gastroenterology. 1999;116:1389–1398.
63. Niemeyer P, Krause U, Fellenberg J, et al. Evaluation of mineralized
collagen and a-tricalcium phosphate as scaffolds for tissue engineer-
ing of bone using human mesenchymal stem cells. Cells Tissues Or-
gans. 2004;177:68–78.
64. Rosada C, Justesen J, Melsvik D, Ebbesen P, Kassem M. The human
umbilical cord blood: a potential source for osteoblast progenitor cells.
Calcif Tissue Int. 2003;72:135–142.
65. Takai Y, Ogawara M, Tomono Y, et al. Mitosis-specific phosphoryla-
tion of vimentin by protein kinase C coupled with reorganization of
intracellular membranes. J Cell Biol. 1996;133:141–149.
66. Kwiatkowski DJ. Functions of gelsolin: motility, signaling, apoptosis,
cancer. Curr Opin Cell Biol. 1999;11:103–108.
67. Sun HQ, Yamamoto M, Mejillano M, Yin HL. Gelsolin, a multifunc-
tional actin regulatory protein. J Biol Chem. 1999;274:33179–33182.
68. Ideker T, Thorsson V, Ranish JA, et al. Integrated genomic and proteo-
mic analyses of a systematically perturbed metabolic network. Sci-
ence. 2001;292:929–934.
69. Griffin TJ, Gygi SP, Ideker T, et al. Complementary profiling of gene
expression at the transcriptome and proteome levels in Saccharomyces
cerevisiae. Mol Cell Proteomics. 2002;1:323–333.
70. Anderson L, Seilhamer J. A comparison of selected mRNA and pro-
tein abundances in human liver. Electrophoresis. 1997;18:533–537.
71. Lian Z, Wang L, Yamaga S, et al. Genomic and proteomic analysis of
the myeloid differentiation program. Blood. 2001;98:513–524.
72. Lian Z, Kluger Y, Greenbaum DS, et al. Genomic and proteomic anal-
ysis of the myeloid differentiation program: global analysis of gene
expression during induced differentiation in the MPRO cell line.
Blood. 2002;100:3209–3220.
73. Le NF, Hohenkirk L, Grolleau A, et al. Profiling changes in gene ex-
pression during differentiation and maturation of monocyte-derived
dendritic cells using both oligonucleotide microarrays and proteomics.
J Biol Chem. 2001;276:17920–17931.
74. Wagner W, Laufs S, Blake J, et al. Retroviral integration sites correlate
with expressed genes in hematopoietic stem cells. Stem Cells. 2005;
23:1050–1058.
75. Yuan J, Murrell GA, Trickett A, et al. Overexpression of antioxidant
enzyme peroxiredoxin 5 protects human tendon cells against apoptosis
and loss of cellular function during oxidative stress. Biochim Biophys
Acta. 2004;1693:37–45.
76. Neumann CA, Krause DS, Carman CV, et al. Essential role for the per-
oxiredoxin Prdx1 in erythrocyte antioxidant defence and tumour sup-
pression. Nature. 2003;424:561–565.
77. Colter DC, Sekiya I, Prockop DJ. Identification of a subpopulation of
rapidly self-renewing and multipotential adult stem cells in colonies of
human marrow stromal cells. Proc Natl Acad Sci U S A. 2001;98:
7841–7845.
78. Gregory CA, Singh H, Perry AS, Prockop DJ. The Wnt signaling in-
hibitor dickkopf-1 is required for reentry into the cell cycle of human
adult stem cells from bone marrow. J Biol Chem. 2003;278:28067–
28078.
Copyright © 2022 FDOKUMEN