Spectrophotometric determination of metronidazole and tinidazole in pharmaceutical preparations
12
J. Iran. Chem. Soc., Vol. 7, No. 2, June 2010, pp. 359-370. JOURNAL OF THE Iranian Chemical Society Spectrophotometric Determination of Metronidazole and Tinidazole via Charge Transfer Complexation Using Chloranilic Acid O.A. Adegoke a, *, O.E. Umoh a and J.O. Soyinka b a Department of Pharmaceutical Chemistry, Faculty of Pharmacy, University of Ibadan, Ibadan, Nigeria b Department of Pharmaceutical Chemistry, Faculty of Pharmacy, Obafemi Awolowo University, Ile-Ife, Nigeria (Received 27 February 2009, Accepted 11 June 2009) A new spectrophotometric method was developed for the determination of two important nitroimidazoles; metronidazole (MZ) and tinidazole (TZ). The method was based on the charge-transfer (CT) complexation reaction of reduced forms of metronidazole and tinidazole as n-electron donors and chloranilic acid (CAA) as π-electron acceptor to form a purple-colored complex with a new absorption band at 520 nm which was adopted as the analytical wavelength. Molar absorptivities of 2.741 × 10 2 L M -1 cm -1 and 2.681 × 10 2 L M -1 cm -1 were obtained for MZ and TZ, respectively. Optimization of reducing agent and time of reduction revealed the superiority of metal hydrides over reducing metals. Reduction of MZ and TZ was completed at 30 °C within 10 min. Optimizations of temperature and time for the complexation reaction revealed that the reaction was completed at 30 °C within 5 min. A 60:40 mixture of 1,4-dioxane:acetonitrile was found to be the best diluting solvent for optimal detector response. The complexes were stable at room temperatures for weeks. Beer’s law was observed in the concentration of 5-40 μg ml (MZ) and 4.8-79.2 μg ml -1 (TZ) with low limits of detection of 1.88 and 0.74 μg ml -1 , respectively. Overall recoveries of MZ and TZ from quality control samples were 103.19 ± 2.05 (%RSD = 1.99, n = 12) and 101.63 ± 1.41 (%RSD = 1.39) over three days. There was no interference from commonly utilized tablet excipients. No significant difference existed between the results of the new method and the BP titrimetric procedures (p > 0.05). The new CT procedure described in this paper is simple, fast, convenient, accurate and precise and has the novelty of carrying out the reactions at room temperature compared to previously described procedures. The new method could be adopted as an alternative procedure for the quality assessment of MZ and TZ in bulk and dosage forms. Keywords: Nitroimidazoles, Metronidazole, Tinidazole, Chloranilic acid, Charge transfer complexation INTRODUCTION Nitro derivatives of five-membered heterocyles are of considerable interest. Some are biologically active [1] with anti-inflammatory or vasodilator activity [2]. Others are useful synthetic intermediates for many biologically active compounds; for instance, nitroimidazoles form the basis of nitro-heterocycles analogous to megazol, an antiparasitic agent *Corresponding authors. E-mail: [email protected] [3]. The most important derivatives contain the 5- nitroimidazole nucleus with substituents at the N-1 position of the heterocyclic aromatic ring [4]. The discovery of the anti- trichomonal properties of metronidazole revolutionised the treatment of the disease. Although the amoebicidal properties of metronidazole were studied, it was not clinically tested until some years later. In laboratory tests, metronidazole is effective against intestinal amoebiasis in rats and hepatic amoebiasis in hamsters and is also active against Entamoeba histolytica in vitro. Initial clinical tests of metronidazole indicated that it
-
Upload
uni-mysore -
Category
Documents
-
view
1 -
download
0
Transcript of Spectrophotometric determination of metronidazole and tinidazole in pharmaceutical preparations
J. Iran. Chem. Soc., Vol. 7, No. 2, June 2010, pp. 359-370. JOURNAL OF THE Iranian Chemical Society
Spectrophotometric Determination of Metronidazole and Tinidazole via Charge Transfer Complexation Using Chloranilic Acid
O.A. Adegokea,*, O.E. Umoha and J.O. Soyinkab
aDepartment of Pharmaceutical Chemistry, Faculty of Pharmacy, University of Ibadan, Ibadan, Nigeria bDepartment of Pharmaceutical Chemistry, Faculty of Pharmacy, Obafemi Awolowo University, Ile-Ife, Nigeria
(Received 27 February 2009, Accepted 11 June 2009)
A new spectrophotometric method was developed for the determination of two important nitroimidazoles; metronidazole (MZ) and tinidazole (TZ). The method was based on the charge-transfer (CT) complexation reaction of reduced forms of metronidazole and tinidazole as n-electron donors and chloranilic acid (CAA) as π-electron acceptor to form a purple-colored complex with a new absorption band at 520 nm which was adopted as the analytical wavelength. Molar absorptivities of 2.741 × 10² L M-1 cm-1
and 2.681 × 10² L M-1 cm-1 were obtained for MZ and TZ, respectively. Optimization of reducing agent and time of reduction revealed the superiority of metal hydrides over reducing metals. Reduction of MZ and TZ was completed at 30 °C within 10 min. Optimizations of temperature and time for the complexation reaction revealed that the reaction was completed at 30 °C within 5 min. A 60:40 mixture of 1,4-dioxane:acetonitrile was found to be the best diluting solvent for optimal detector response. The complexes were stable at room temperatures for weeks. Beer’s law was observed in the concentration of 5-40 µg ml (MZ) and 4.8-79.2 µg ml-1 (TZ) with low limits of detection of 1.88 and 0.74 µg ml-1, respectively. Overall recoveries of MZ and TZ from quality control samples were 103.19 ± 2.05 (%RSD = 1.99, n = 12) and 101.63 ± 1.41 (%RSD = 1.39) over three days. There was no interference from commonly utilized tablet excipients. No significant difference existed between the results of the new method and the BP titrimetric procedures (p > 0.05). The new CT procedure described in this paper is simple, fast, convenient, accurate and precise and has the novelty of carrying out the reactions at room temperature compared to previously described procedures. The new method could be adopted as an alternative procedure for the quality assessment of MZ and TZ in bulk and dosage forms. Keywords: Nitroimidazoles, Metronidazole, Tinidazole, Chloranilic acid, Charge transfer complexation INTRODUCTION Nitro derivatives of five-membered heterocyles are of considerable interest. Some are biologically active [1] with anti-inflammatory or vasodilator activity [2]. Others are useful synthetic intermediates for many biologically active compounds; for instance, nitroimidazoles form the basis of nitro-heterocycles analogous to megazol, an antiparasitic agent *Corresponding authors. E-mail: [email protected]
[3]. The most important derivatives contain the 5-nitroimidazole nucleus with substituents at the N-1 position of the heterocyclic aromatic ring [4]. The discovery of the anti-trichomonal properties of metronidazole revolutionised the treatment of the disease. Although the amoebicidal properties of metronidazole were studied, it was not clinically tested until some years later. In laboratory tests, metronidazole is effective against intestinal amoebiasis in rats and hepatic amoebiasis in hamsters and is also active against Entamoeba histolytica in vitro. Initial clinical tests of metronidazole indicated that it

Adegoke et al.
360
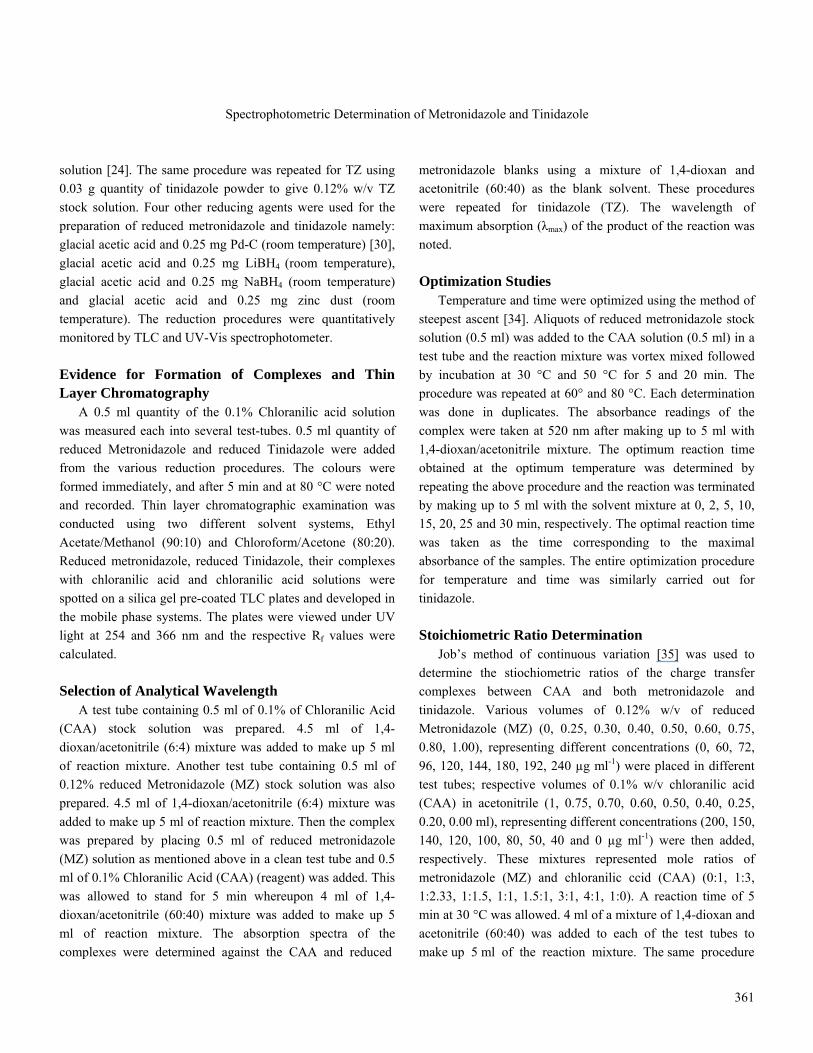
was capable of curing invasive amoebic dysentery and amoebic liver abscess. Subsequent clinical tests have established metronidazole as the drug of choice in the treatment of all forms of amoebiasis in humans [5]. Variation of the structure of metronidazole, principally to improve trichomonacidal activity and metabolic stability, led to the discovery of tinidazole. Tinidazole is active against E. histolytica in vitro, cecal amoebiasis in rats, and hepatic amoebiasis in hamsters. Clinical tests have established the value of tinidazole in the treatment of intestinal and hepatic amoebiasis in humans [5]. Tinidazole has about the same or slightly greater efficacy than metronidazole in the treatment of trichomoniasis and in giardiasis. It has been found to be effective against strains resistant to metronidazole [6]. Chemically, metronidazole is 2-methyl-5-nitroimidazole-1-ethanol and tinidazole is 1-(2-ethyl-sulphonyl ethyl)-2-methyl-5-nitroimidazole. The biological activity of nitroimidazoles is dependent upon the nitro group reduction process due to the formation of active intermediate species [7-11] that interact with DNA to produce biochemical damage. The reduction of nitro group has also been used as a basis for the determination of these drugs. Several methods have been reported for the determination of metronidazole and or tinidazole in bulk and dosage forms or in biological fluids. Such methods include; non-aqueous titration [12], voltammetric methods [13-17], HPLC [18,19,20,21] and flow injection analysis [22]. Some previously described spectrophotometric methods include the use of vanillin and anisaldehyde [23], p-Benzoquinone [24], -Naphthol [25], β-naphthol [26], alkaline hydrolysis [27], derivative spectrophotometry [28], extractive spectrophotometry using bromothymol blue [29], sodium 1,2-naphthaquinone-4-sulfonate after condensation reaction [30], 4-dimethylamino-cinnamaldehyde [31] and methylbenzo-thiazolin-2-onehydrazine (MBTH) [32] among others. A study of the thermodynamic properties of the charge transfer between metronidazole and chloranilic acid has also been carried out [33]. These spectrophotometric methods have their relative merits but majority of them are carried out at elevated temperatures, are time-consuming, use relatively expensive reagents, involve extraction, use buffer systems, only some determine MZ and TZ and many are multi-step procedures. In this report, we present a simple approach to the spectrophotometric determination of reduced nitroimidazoles
using a charge transfer complexation procedure with chloranilic acid. EXPERIMENTAL Chemicals and Reagents Metronidazole brands utilized in this study were Loxagyl (M & B, Nig. Plc.), Metrodol (Pauco Pharm, Nig. Ltd.), Metrotabs (SKG Pharm. Ltd.), Tromet 500 infusion (Microlabs Ltd.) and tinidazole brand was Amtiba 500 (Cadila Pharm. Dholka, India) Methanol, ethyl acetate, ethanol, sulfuric acid, chloroform, acetone, 1,4-dioxan, hydrochloric acid, sodium nitrite, sulfamic acid, LiBH4, NaBH4, Pd-C, zinc dust, acetic anhydride, brilliant green, perchloric acid (all analar reagent grade obtained from BDH Chemical Ltd., Poole, England). Distilled water, glacial acetic acids, acetonitrile, chloranilic acid were obtained from Sigma-Aldrich, USA, precoated thin layer plates GF254 0.2 mm (Merck, Germany). Metronidazole and tinidazole secondary reference standards were prepared in our laboratory whose purity was assessed by TLC, melting point and non-aqueous titration using acetous perchloric acid. Equipment UV-Vis spectrophotometer (Unicam aurora), analytical balance H80 (Mettler, UK), ultrasonic bath (Langford Electronics, UK) Vortex mixer (Griffins and George Ltd.; Great Britain). Preparation of Chloranilic Acid Stock Solution and Reduction of Metronidazole and Tinidazole A 0.025 g quantity of chloranilic acid powder was weighed into a clean 25 ml volumetric flask, a small amount of acetonitrile; about 5 ml was added to it. This was then shaken until it had dissolved appreciably. The solution was then made up to 25 ml mark with acetonitrile to make 0.1% w/v chloranilic acid solution. A 0.025 g quantity of metronidazole powder (extracted) was weighed into 7.5 ml hot ethanol with 2 ml 5 M HCl solution and 0.25 mg zinc dust in a clean beaker. The mixture was heated in a water bath at 90 + 5 °C for 15 min. The residue was cooled, filtered and washed with ethanol into a 25 ml flask. The solution was then made up to 25 ml mark with ethanol to make 0.1% w/v metronidazole stock
Spectrophotometric Determination of Metronidazole and Tinidazole
361
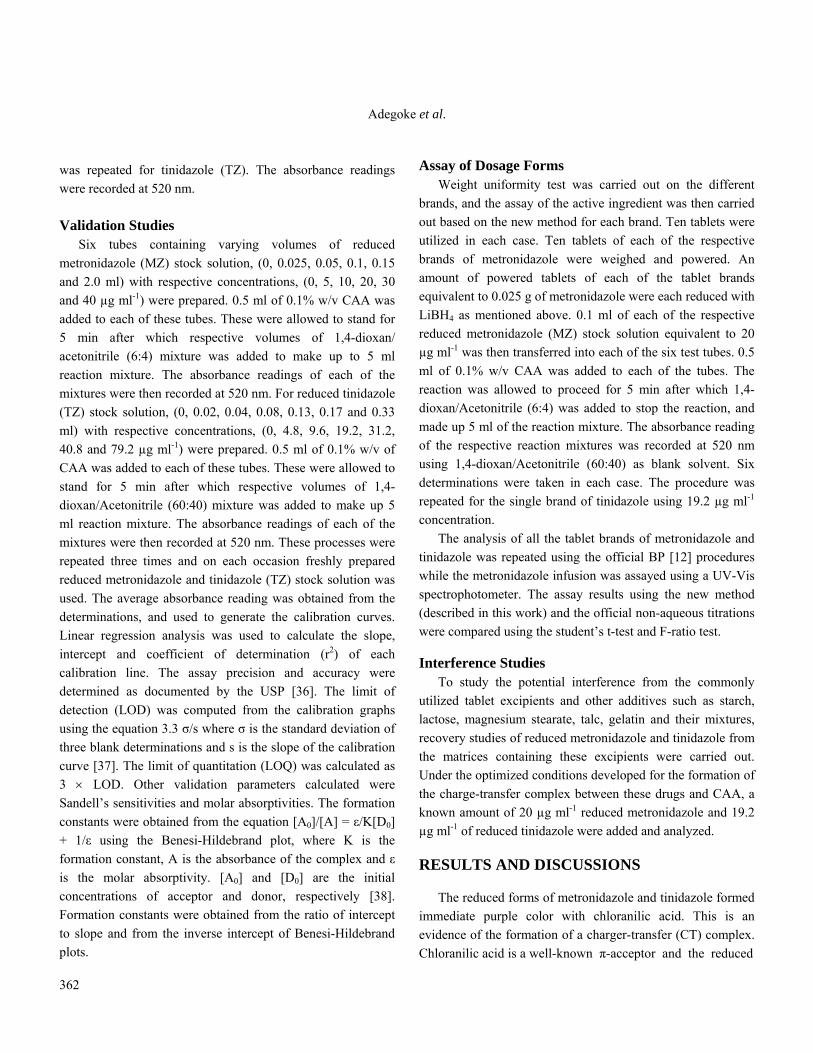
solution [24]. The same procedure was repeated for TZ using 0.03 g quantity of tinidazole powder to give 0.12% w/v TZ stock solution. Four other reducing agents were used for the preparation of reduced metronidazole and tinidazole namely: glacial acetic acid and 0.25 mg Pd-C (room temperature) [30], glacial acetic acid and 0.25 mg LiBH4 (room temperature), glacial acetic acid and 0.25 mg NaBH4 (room temperature) and glacial acetic acid and 0.25 mg zinc dust (room temperature). The reduction procedures were quantitatively monitored by TLC and UV-Vis spectrophotometer. Evidence for Formation of Complexes and Thin Layer Chromatography A 0.5 ml quantity of the 0.1% Chloranilic acid solution was measured each into several test-tubes. 0.5 ml quantity of reduced Metronidazole and reduced Tinidazole were added from the various reduction procedures. The colours were formed immediately, and after 5 min and at 80 °C were noted and recorded. Thin layer chromatographic examination was conducted using two different solvent systems, Ethyl Acetate/Methanol (90:10) and Chloroform/Acetone (80:20). Reduced metronidazole, reduced Tinidazole, their complexes with chloranilic acid and chloranilic acid solutions were spotted on a silica gel pre-coated TLC plates and developed in the mobile phase systems. The plates were viewed under UV light at 254 and 366 nm and the respective Rf values were calculated. Selection of Analytical Wavelength A test tube containing 0.5 ml of 0.1% of Chloranilic Acid (CAA) stock solution was prepared. 4.5 ml of 1,4-dioxan/acetonitrile (6:4) mixture was added to make up 5 ml of reaction mixture. Another test tube containing 0.5 ml of 0.12% reduced Metronidazole (MZ) stock solution was also prepared. 4.5 ml of 1,4-dioxan/acetonitrile (6:4) mixture was added to make up 5 ml of reaction mixture. Then the complex was prepared by placing 0.5 ml of reduced metronidazole (MZ) solution as mentioned above in a clean test tube and 0.5 ml of 0.1% Chloranilic Acid (CAA) (reagent) was added. This was allowed to stand for 5 min whereupon 4 ml of 1,4-dioxan/acetonitrile (60:40) mixture was added to make up 5 ml of reaction mixture. The absorption spectra of the complexes were determined against the CAA and reduced
metronidazole blanks using a mixture of 1,4-dioxan and acetonitrile (60:40) as the blank solvent. These procedures were repeated for tinidazole (TZ). The wavelength of maximum absorption (λmax) of the product of the reaction was noted. Optimization Studies Temperature and time were optimized using the method of steepest ascent [34]. Aliquots of reduced metronidazole stock solution (0.5 ml) was added to the CAA solution (0.5 ml) in a test tube and the reaction mixture was vortex mixed followed by incubation at 30 °C and 50 °C for 5 and 20 min. The procedure was repeated at 60° and 80 °C. Each determination was done in duplicates. The absorbance readings of the complex were taken at 520 nm after making up to 5 ml with 1,4-dioxan/acetonitrile mixture. The optimum reaction time obtained at the optimum temperature was determined by repeating the above procedure and the reaction was terminated by making up to 5 ml with the solvent mixture at 0, 2, 5, 10, 15, 20, 25 and 30 min, respectively. The optimal reaction time was taken as the time corresponding to the maximal absorbance of the samples. The entire optimization procedure for temperature and time was similarly carried out for tinidazole. Stoichiometric Ratio Determination Job’s method of continuous variation [35] was used to determine the stiochiometric ratios of the charge transfer complexes between CAA and both metronidazole and tinidazole. Various volumes of 0.12% w/v of reduced Metronidazole (MZ) (0, 0.25, 0.30, 0.40, 0.50, 0.60, 0.75, 0.80, 1.00), representing different concentrations (0, 60, 72, 96, 120, 144, 180, 192, 240 µg ml-1) were placed in different test tubes; respective volumes of 0.1% w/v chloranilic acid (CAA) in acetonitrile (1, 0.75, 0.70, 0.60, 0.50, 0.40, 0.25, 0.20, 0.00 ml), representing different concentrations (200, 150, 140, 120, 100, 80, 50, 40 and 0 µg ml-1) were then added, respectively. These mixtures represented mole ratios of metronidazole (MZ) and chloranilic ccid (CAA) (0:1, 1:3, 1:2.33, 1:1.5, 1:1, 1.5:1, 3:1, 4:1, 1:0). A reaction time of 5 min at 30 °C was allowed. 4 ml of a mixture of 1,4-dioxan and acetonitrile (60:40) was added to each of the test tubes to make up 5 ml of the reaction mixture. The same procedure
Adegoke et al.
362
was repeated for tinidazole (TZ). The absorbance readings were recorded at 520 nm. Validation Studies Six tubes containing varying volumes of reduced metronidazole (MZ) stock solution, (0, 0.025, 0.05, 0.1, 0.15 and 2.0 ml) with respective concentrations, (0, 5, 10, 20, 30 and 40 µg ml-1) were prepared. 0.5 ml of 0.1% w/v CAA was added to each of these tubes. These were allowed to stand for 5 min after which respective volumes of 1,4-dioxan/ acetonitrile (6:4) mixture was added to make up to 5 ml reaction mixture. The absorbance readings of each of the mixtures were then recorded at 520 nm. For reduced tinidazole (TZ) stock solution, (0, 0.02, 0.04, 0.08, 0.13, 0.17 and 0.33 ml) with respective concentrations, (0, 4.8, 9.6, 19.2, 31.2, 40.8 and 79.2 µg ml-1) were prepared. 0.5 ml of 0.1% w/v of CAA was added to each of these tubes. These were allowed to stand for 5 min after which respective volumes of 1,4-dioxan/Acetonitrile (60:40) mixture was added to make up 5 ml reaction mixture. The absorbance readings of each of the mixtures were then recorded at 520 nm. These processes were repeated three times and on each occasion freshly prepared reduced metronidazole and tinidazole (TZ) stock solution was used. The average absorbance reading was obtained from the determinations, and used to generate the calibration curves. Linear regression analysis was used to calculate the slope, intercept and coefficient of determination (r2) of each calibration line. The assay precision and accuracy were determined as documented by the USP [36]. The limit of detection (LOD) was computed from the calibration graphs using the equation 3.3 σ/s where σ is the standard deviation of three blank determinations and s is the slope of the calibration curve [37]. The limit of quantitation (LOQ) was calculated as 3 × LOD. Other validation parameters calculated were Sandell’s sensitivities and molar absorptivities. The formation constants were obtained from the equation [A0]/[A] = ε/K[D0] + 1/ε using the Benesi-Hildebrand plot, where K is the formation constant, A is the absorbance of the complex and ε is the molar absorptivity. [A0] and [D0] are the initial concentrations of acceptor and donor, respectively [38]. Formation constants were obtained from the ratio of intercept to slope and from the inverse intercept of Benesi-Hildebrand plots.
Assay of Dosage Forms Weight uniformity test was carried out on the different brands, and the assay of the active ingredient was then carried out based on the new method for each brand. Ten tablets were utilized in each case. Ten tablets of each of the respective brands of metronidazole were weighed and powered. An amount of powered tablets of each of the tablet brands equivalent to 0.025 g of metronidazole were each reduced with LiBH4 as mentioned above. 0.1 ml of each of the respective reduced metronidazole (MZ) stock solution equivalent to 20 µg ml-1 was then transferred into each of the six test tubes. 0.5 ml of 0.1% w/v CAA was added to each of the tubes. The reaction was allowed to proceed for 5 min after which 1,4-dioxan/Acetonitrile (6:4) was added to stop the reaction, and made up 5 ml of the reaction mixture. The absorbance reading of the respective reaction mixtures was recorded at 520 nm using 1,4-dioxan/Acetonitrile (60:40) as blank solvent. Six determinations were taken in each case. The procedure was repeated for the single brand of tinidazole using 19.2 µg ml-1 concentration. The analysis of all the tablet brands of metronidazole and tinidazole was repeated using the official BP [12] procedures while the metronidazole infusion was assayed using a UV-Vis spectrophotometer. The assay results using the new method (described in this work) and the official non-aqueous titrations were compared using the student’s t-test and F-ratio test. Interference Studies To study the potential interference from the commonly utilized tablet excipients and other additives such as starch, lactose, magnesium stearate, talc, gelatin and their mixtures, recovery studies of reduced metronidazole and tinidazole from the matrices containing these excipients were carried out. Under the optimized conditions developed for the formation of the charge-transfer complex between these drugs and CAA, a known amount of 20 µg ml-1 reduced metronidazole and 19.2 µg ml-1 of reduced tinidazole were added and analyzed. RESULTS AND DISCUSSIONS The reduced forms of metronidazole and tinidazole formed immediate purple color with chloranilic acid. This is an evidence of the formation of a charger-transfer (CT) complex. Chloranilic acid is a well-known π-acceptor and the reduced
Spectrophotometric Determination of Metronidazole and Tinidazole
363
drugs are n-donors. Chloranilic acid has been used for the spectrophotometric determination of drugs containing n-electron donors such as nitrogen and oxygen. It undergoes two types of reaction at two different conditions; at normal or elevated temperature it behaves as acid and undergoes neutralization reaction forming salt but at low temperature (cold condition) it behaves as charge-transfer acceptor thus forming molecular complex. This molecular complex consists
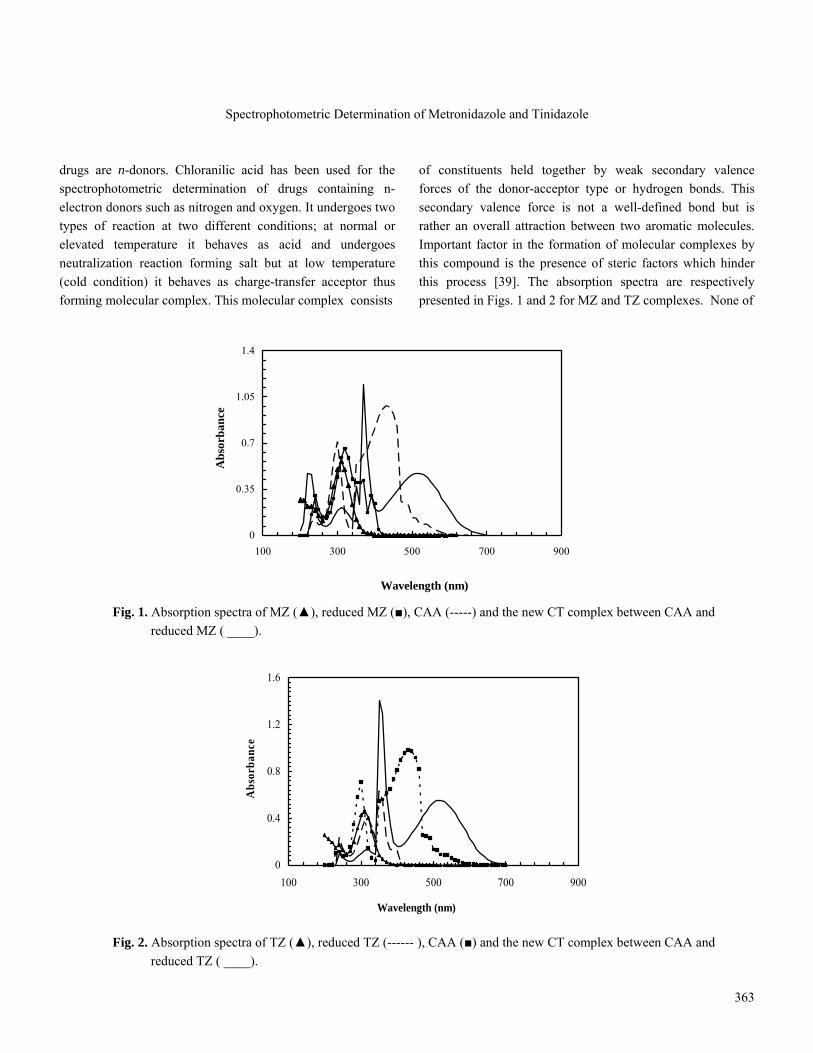
of constituents held together by weak secondary valence forces of the donor-acceptor type or hydrogen bonds. This secondary valence force is not a well-defined bond but is rather an overall attraction between two aromatic molecules. Important factor in the formation of molecular complexes by this compound is the presence of steric factors which hinder this process [39]. The absorption spectra are respectively presented in Figs. 1 and 2 for MZ and TZ complexes. None of
0
0.35
0.7
1.05
1.4
100 300 500 700 900
Wavelength (nm)
Abs
orba
nce
Fig. 1. Absorption spectra of MZ (▲), reduced MZ (■), CAA (-----) and the new CT complex between CAA and
reduced MZ ( ____).
0
0.4
0.8
1.2
1.6
100 300 500 700 900
Wavelength (nm)
Abs
orba
nce
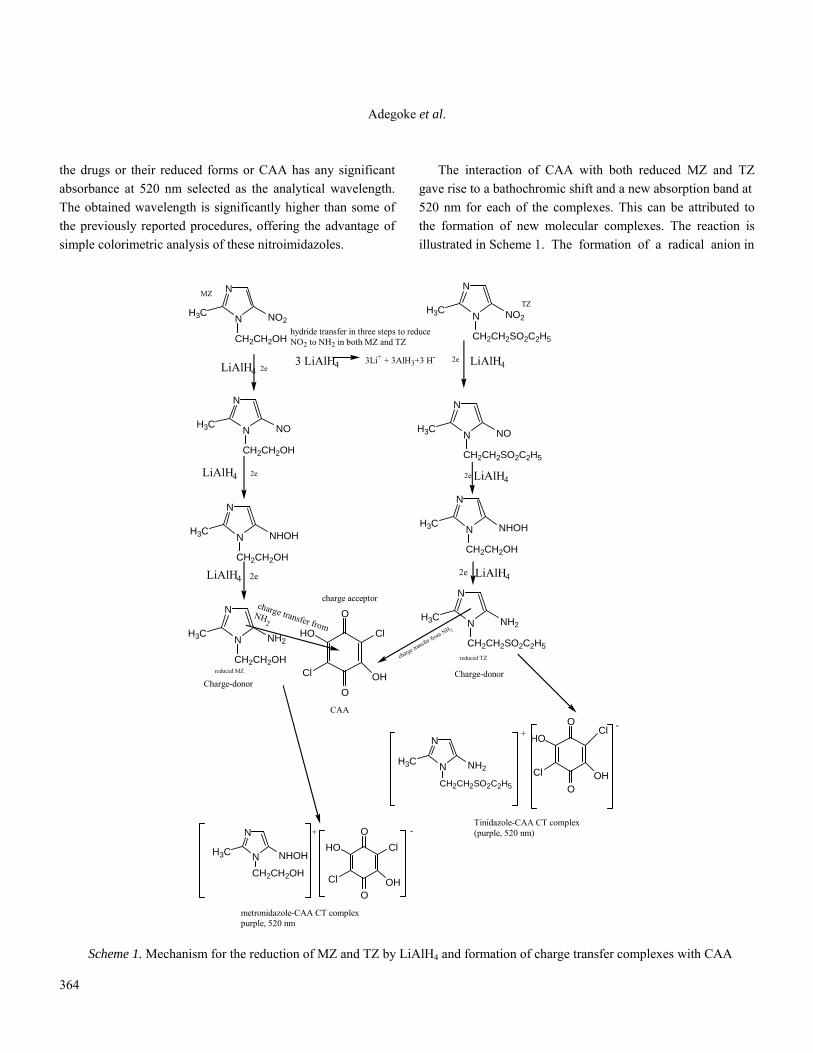
Fig. 2. Absorption spectra of TZ (▲), reduced TZ (------ ), CAA (■) and the new CT complex between CAA and
reduced TZ ( ____).
Adegoke et al.
364
the drugs or their reduced forms or CAA has any significant absorbance at 520 nm selected as the analytical wavelength. The obtained wavelength is significantly higher than some of the previously reported procedures, offering the advantage of simple colorimetric analysis of these nitroimidazoles.
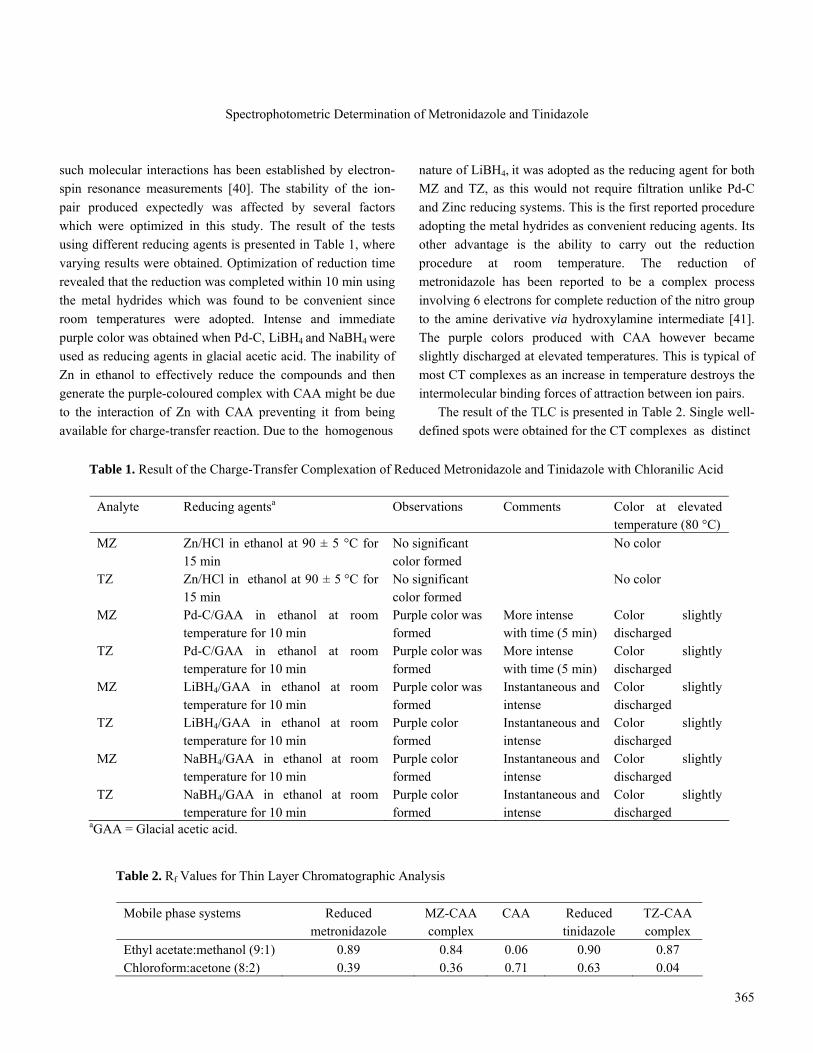
The interaction of CAA with both reduced MZ and TZ gave rise to a bathochromic shift and a new absorption band at 520 nm for each of the complexes. This can be attributed to the formation of new molecular complexes. The reaction is illustrated in Scheme 1. The formation of a radical anion in
N
NH3C NO2
CH2CH2OH
N
NH3C NO2
CH2CH2SO2C2H5
LiAlH4LiAlH4
N
NH3C NO
CH2CH2OH
N
NH3C NHOH
CH2CH2OH
N
NH3C NH2
CH2CH2OH
3 LiAlH4
LiAlH4
LiAlH4
N
NH3C NO
CH2CH2SO2C2H5
N
NH3C NHOH
CH2CH2OH
N
NH3C NH2
CH2CH2SO2C2H5
LiAlH4
LiAlH4
O
O
ClHO
OHCl
CAA
N
NH3C NH2
CH2CH2SO2C2H5
O
O
HO
OHCl
N
NH3C NHOH
CH2CH2OH
O
O
ClHO
OHCl
Cl
MZTZ
3Li+ + 3AlH3+3 H-
hydride transfer in three steps to reduceNO2 to NH2 in both MZ and TZ
2e
2e
2e
2e
2e
2e
reduced MZ
reduced TZ
Charge-donor
charge acceptor
Charge-donor
charge transfer
from NH 2
charge transfer from NH
2
Tinidazole-CAA CT complex(purple, 520 nm)
metronidazole-CAA CT complexpurple, 520 nm
+-
+ -
Scheme 1. Mechanism for the reduction of MZ and TZ by LiAlH4 and formation of charge transfer complexes with CAA
Spectrophotometric Determination of Metronidazole and Tinidazole
365
such molecular interactions has been established by electron-spin resonance measurements [40]. The stability of the ion-pair produced expectedly was affected by several factors which were optimized in this study. The result of the tests using different reducing agents is presented in Table 1, where varying results were obtained. Optimization of reduction time revealed that the reduction was completed within 10 min using the metal hydrides which was found to be convenient since room temperatures were adopted. Intense and immediate purple color was obtained when Pd-C, LiBH4 and NaBH4 were used as reducing agents in glacial acetic acid. The inability of Zn in ethanol to effectively reduce the compounds and then generate the purple-coloured complex with CAA might be due to the interaction of Zn with CAA preventing it from being available for charge-transfer reaction. Due to the homogenous
nature of LiBH4, it was adopted as the reducing agent for both MZ and TZ, as this would not require filtration unlike Pd-C and Zinc reducing systems. This is the first reported procedure adopting the metal hydrides as convenient reducing agents. Its other advantage is the ability to carry out the reduction procedure at room temperature. The reduction of metronidazole has been reported to be a complex process involving 6 electrons for complete reduction of the nitro group to the amine derivative via hydroxylamine intermediate [41]. The purple colors produced with CAA however became slightly discharged at elevated temperatures. This is typical of most CT complexes as an increase in temperature destroys the intermolecular binding forces of attraction between ion pairs. The result of the TLC is presented in Table 2. Single well-defined spots were obtained for the CT complexes as distinct
Table 1. Result of the Charge-Transfer Complexation of Reduced Metronidazole and Tinidazole with Chloranilic Acid
Analyte Reducing agentsa Observations Comments Color at elevated temperature (80 °C)
MZ Zn/HCl in ethanol at 90 ± 5 °C for 15 min
No significant color formed
No color
TZ Zn/HCl in ethanol at 90 ± 5 °C for 15 min
No significant color formed
No color
MZ Pd-C/GAA in ethanol at room temperature for 10 min
Purple color was formed
More intense with time (5 min)
Color slightly discharged
TZ Pd-C/GAA in ethanol at room temperature for 10 min
Purple color was formed
More intense with time (5 min)
Color slightly discharged
MZ LiBH4/GAA in ethanol at room temperature for 10 min
Purple color was formed
Instantaneous and intense
Color slightly discharged
TZ LiBH4/GAA in ethanol at room temperature for 10 min
Purple color formed
Instantaneous and intense
Color slightly discharged
MZ NaBH4/GAA in ethanol at room temperature for 10 min
Purple color formed
Instantaneous and intense
Color slightly discharged
TZ NaBH4/GAA in ethanol at room temperature for 10 min
Purple color formed
Instantaneous and intense
Color slightly discharged
aGAA = Glacial acetic acid.
Table 2. Rf Values for Thin Layer Chromatographic Analysis
Mobile phase systems Reduced metronidazole
MZ-CAA complex
CAA Reduced tinidazole
TZ-CAA complex
Ethyl acetate:methanol (9:1) 0.89 0.84 0.06 0.90 0.87 Chloroform:acetone (8:2) 0.39 0.36 0.71 0.63 0.04

Adegoke et al.
366
0.25
0.3
0.35
30 60 90
Temperature (o C)
Abs
orba
nce
Fig. 3. Optimization of reaction temperature for MZ-CAA
CT complex: (▲) 5 min, (■) 20 min.
0.15
0.2
0.25
0.3
30 60 90
Temperature (oC)
Abs
orba
nce
Fig. 4. Optimization of reaction temperature for TZ-CAA CT complex: (▲) 5 min, (■) 20 min. from CAA and reduced MZ and TZ. The formation of new compounds is therefore corroborated by the TLC study. The effect of solvents on the absorptivity of the CT complexes revealed that optimal detector response was obtained using a 60:40 mixture of 1,4-dioxane:acetonitrile as solvent to stop the reaction after each time interval. CAA solution in acetonitrile gives an absorption spectrum with an absorption maximum at 430 nm. Other common solvents such as water, methanol and ethanol have significant interaction with CAA (purple color) since they all possess n-electrons on their oxygen atoms. Optimizations of temperature and time required for the complex formation were carried out at four temperature levels. The results are respectively presented in Figs. 3 and 4 and the optimization of time is presented in Fig. 5 for MZ and TZ. The optimum reaction temperature and time for the complexation
0.2680.27
0.2720.2740.2760.278
0.280.282
0 10 20 30
Time (min)
Abs
orba
nce
Fig. 5. Optimization of time required for the formation of MZ (▲) and TZ (■) intermolecular complexes with
CAA.
0
0.1
0.2
0.3
0 0.5 1Mole ratio of CAA
Abs
orba
nce
Fig. 6. Stoichiometric ratio determination for the new method
for MZ (▲) and TZ (■).
reaction between CAA and both compounds were found to be at 30 °C and 5 min, respectively. Adopting Job’s method of continuous variation, equimolar concentrations of the charge-transfer acceptor (CAA) and the reduced n-electron donors (MZ, TZ) gave optimal absorbance values at mole ratio 1:1. This implies that the reduced drug substances combine with the reagent on one mole basis. This further corroborates the single spot observed on TLC. The stiochiometric ratio determination is presented in Fig. 6 for the two CT complexes. For metronidazole analysis, Beer’s law was observed in the concentration range of 0-40 µg ml-1 with linear regression equation of y = 0.0041x + 0.0569 (r2 = 0.9973), where y is the absorbance and x is the concentration in µg ml-1. The limit of detection is 1.439 µg ml-1. This limit of detection compares favourably with the previously reported methods for the
Spectrophotometric Determination of Metronidazole and Tinidazole
367
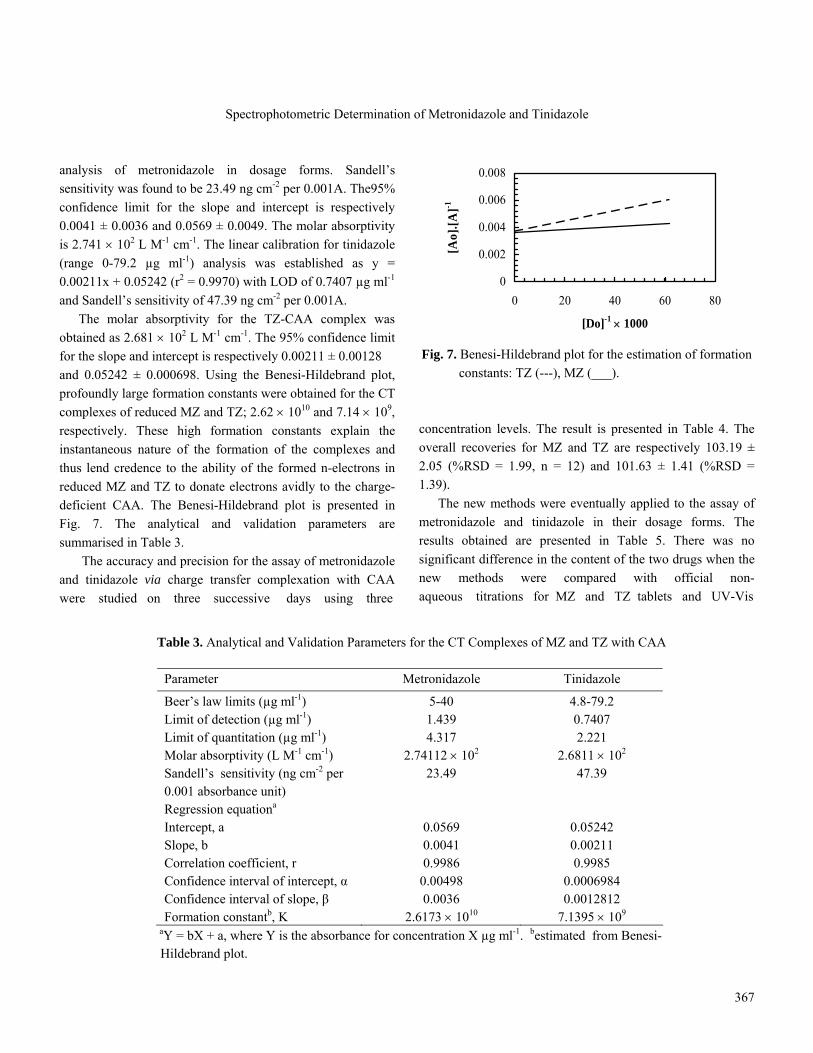
analysis of metronidazole in dosage forms. Sandell’s sensitivity was found to be 23.49 ng cm-2 per 0.001A. The95% confidence limit for the slope and intercept is respectively 0.0041 ± 0.0036 and 0.0569 ± 0.0049. The molar absorptivity is 2.741 × 10² L M-1 cm-1. The linear calibration for tinidazole (range 0-79.2 µg ml-1) analysis was established as y = 0.00211x + 0.05242 (r2 = 0.9970) with LOD of 0.7407 µg ml-1 and Sandell’s sensitivity of 47.39 ng cm-2 per 0.001A. The molar absorptivity for the TZ-CAA complex was obtained as 2.681 × 10² L M-1 cm-1. The 95% confidence limit for the slope and intercept is respectively 0.00211 ± 0.00128 and 0.05242 ± 0.000698. Using the Benesi-Hildebrand plot, profoundly large formation constants were obtained for the CT complexes of reduced MZ and TZ; 2.62 × 10¹⁰ and 7.14 × 10⁹, respectively. These high formation constants explain the instantaneous nature of the formation of the complexes and thus lend credence to the ability of the formed n-electrons in reduced MZ and TZ to donate electrons avidly to the charge-deficient CAA. The Benesi-Hildebrand plot is presented in Fig. 7. The analytical and validation parameters are summarised in Table 3. The accuracy and precision for the assay of metronidazole and tinidazole via charge transfer complexation with CAA were studied on three successive days using three
0
0.002
0.004
0.006
0.008
0 20 40 60 80
[Do]-1 × 1000
[Ao]
.[A]-1
Fig. 7. Benesi-Hildebrand plot for the estimation of formation constants: TZ (---), MZ (___).
concentration levels. The result is presented in Table 4. The overall recoveries for MZ and TZ are respectively 103.19 ± 2.05 (%RSD = 1.99, n = 12) and 101.63 ± 1.41 (%RSD = 1.39). The new methods were eventually applied to the assay of metronidazole and tinidazole in their dosage forms. The results obtained are presented in Table 5. There was no significant difference in the content of the two drugs when the new methods were compared with official non- aqueous titrations for MZ and TZ tablets and UV-Vis
Table 3. Analytical and Validation Parameters for the CT Complexes of MZ and TZ with CAA
Parameter Metronidazole Tinidazole
Beer’s law limits (µg ml-1) 5-40 4.8-79.2 Limit of detection (µg ml-1) 1.439 0.7407 Limit of quantitation (µg ml-1) 4.317 2.221 Molar absorptivity (L M-1 cm-1) 2.74112 × 10² 2.6811 × 10² Sandell’s sensitivity (ng cm-2 per 0.001 absorbance unit)
23.49 47.39
Regression equationa Intercept, a 0.0569 0.05242 Slope, b 0.0041 0.00211 Correlation coefficient, r 0.9986 0.9985 Confidence interval of intercept, 0.00498 0.0006984 Confidence interval of slope, β 0.0036 0.0012812 Formation constantb, K 2.6173 × 10¹⁰ 7.1395 × 10⁹
aY = bX + a, where Y is the absorbance for concentration X µg ml-1. bestimated from Benesi- Hildebrand plot.

Adegoke et al.
368
spectrophotometric method for MZ infusion (p > 0.05). This therefore establishes the equivalence of the two methods. The chemical equivalence of the brands of MZ tablets was also established as there was found to be no significant difference in the contents of all brands using ANOVA (p > 0.05). In the presence of the commonly adopted tablet excipients, the recoveries of MZ and TZ were respectively: lactose (101.95 ± 0.86 and 101.32 ± 1.14), gelatin (103.05 ± 0.69 and 102.80 ± 0.18), starch (101.95 ± 0.86 and 101.32 ± 1.14), talc (101.95 ± 0.86 and 101.32 ± 1.14), magnesium stearate (101.95 ± 0.86
and 101.32 ± 1.14) and for the combination of all the excipients (103.05 ± 0.69 and 102.80 ± 0.18). This implies that there was no interference from the commonly used excipients, thereby confirming some measure of selectivity in the new method in question. This new spectrophotometric method enjoys some well-defined advantages compared with the previously reported methods: the reactions can be carried out at room temperature, colouration of formed charge-transfer complexes is instant and stable, reaction time is short and the reducing agent chosen
Table 4. Accuracy and Repeatability for the New Spectrophotometric Method
Concentration Day 1* Day 2* Day 3* Inter-day statistics
(µg ml-1) %Mean recovery
%RSD %Mean recovery
%RSD %Mean recovery
%RSD %Mean recovery
%RSD
Metronidazolea 5 104.1 2.3 104.1 2.3 103.1 0.4 103.8 1.7 15 100.6 2.4 100.6 2.4 100.2 1.6 100.4 2.1 30 105.2 1.9 105.4 1.3 105.0 1.5 105.2 1.6
Tinidazoleb 4.8 101.2 2.2 102.2 1.9 102.5 0.8 102.0 1.6 19.2 99.5 0.9 99.8 1.0 99.8 0.5 99.7 0.8 40.8 103.2 1.1 102.6 1.1 102.9 1.6 102.9 1.3
n = 12, aoverall recovery for MZ is 103.2 (%RSD = 2.0); boverall recovery for TZ is and 101.6 (%RSD = 1.4). Table 5. Analysis of Metronidazole and Tinidazole Dosage Forms*
Drug formulation New method (%±S.D.)
95% C.I.b Official method p-Valuea F-test t-test
Metronidazole Metrodol tablet 102.07 ± 1.14 20.44 ± 0.21 103.23 ± 1.10 0.916 0.231 Loxagyl tablet 102.44 ± 1.20 20.49 ± 0.21 103.80 ± 1.25 0.970 0.135 Metrotab tablet 102.81 ± 1.79 20.56 ± 0.29 104.44 ± 0.36 0.036 0.077 Tromet-500 infusion
102.07 ± 1.14 20.53 ± 0.21 104.04 ± 1.22 0.934 0.063
Tinidazole Amtiba-500 tablet 101.41 ± 1.24 19.50 ± 0.19 102.73 ± 0.79 0.498 0.107
*Content of metronidazole tablet and that of infusion stipulated by BP = 95-105%. astatistical analyses done between the results obtained from the proposed method and the official non-aqueous titration. bconfidence interval calculated for 20 µg ml-1 and 19.2 µg ml-1 for MZ and TZ, respectively.
Spectrophotometric Determination of Metronidazole and Tinidazole
369
reduces both analytes considered for this study. CONCLUSIONS The spectrophotometric determination of metronidazole and tinidazole through charge transfer complexation with chloranilic acid as described in this report is simple, fast, accurate and precise. It is as accurate as official non-aqueous titrimetric procedures with the advantage of using a small sample size. Similar advantage of sensitivity over the previously reported analytical methods for nitroimidazoles is also observed. The possibility of adopting metal hydrides for the prior reduction of nitroimidazoles is also shown. It could adopt as an alternative method in the assay of MZ and TZ in tablets and infusion as well as in in-process quality control of MZ and TZ tablets and infusion. REFERENCES [1] S.C. Cherkofsky, (1980). US Pat. 4 199 592. [2] T. Kusumi, K. Nakanishi, (1981). US Pat. 4 288 445. [3] A.R. Katritzky, E.F.V. Scriven, S. Majumder, R.G.
Akhmedova, N.G. Akhmedova, A.V. Vakuienko, (2005). 179 ARKAT USA, Inc.
[4] P. Zuman Z. Fijalek, J. Electroanal. Chem. 296 (1990) 538.
[5] R.B. Khambatta, Ann. Trop. Med. Parasitol. 62 (1968) 139.
[6] A. Gennaro, Remington’s Pharmaceutical Sciences, 18th ed., Mack Publishing Co., Easton, 1993, pp. 1228-1230.
[7] R.J. Knox, R.C. Knight, D.I. Edwards. Br. J. Cancer 44 (1981) 741.
[8] D.I. Edwards, R.C. Knight, A. Zahoor, Int. J. Rad. Oncol. Biol. Phys. 12 (1986) 1207.
[9] P.J. Declerck, C.J. De Ranter, Biochem. Pharmacol. 35 (1986) 59.
[10] P.J. Declerck, C.J. De Ranter, J. Chem. Soc., Faraday Trans. I 83 (1987) 257.
[11] J.H. Tocher, D.I. Edwards, Biochem. Pharmacol. 48 (1994) 1089.
[12] British Pharmacopoeia, Her Majesty Stationery Office, London, 1998, pp. 98, 1814 and 1815.
[13] A.N. Papas, M.F. Delaney, Anal. Lett. 15 (1982) 739. [14] A.Z.A. Zuhri, S.I. Al-Khalil, M.S. Suleiman, Anal.
Lett. 19 (1986) 453. [15] G.J. Patriarche, J.C. Vire, Anal. Chim. Acta 196
(1987) 193. [16] C. Yarnitzky, W.F. Smith, Int., J. Pharmac. 75 (1991)
161. [17] G.O. El-Sayed, Microchem. J. 55 (1997) 110. [18] P.D. Panzade, K.R. Mahadlik, East. Pharm. 43 (2000)
115. [19] K.B. Mustapha, M.T. Odunola, M. Garba, O. Obodozie,
African J. Biotechnology 5 (2006) 1188. [20] K. Lanbeck, B. Lindström, J. Chromatogr. B 162
(1979) 117. [21] L.P. Hackett, L.J. Dusci, J. Chromatogr. A 175 (1979)
347. [22] S.S Simoes, P.M. Everado, N.G. Everado, S.L
Wellington, N.T. M Pablo, C.U.A. Mario, C.S Edvan, B.N. Valberes, J. Braz. Chem. Soc. 17 (2006) 609.
[23] B.H. Ahmed, J.O. Onah, Glob. J. Pure Appl. Sci. 9 (2003) 359.
[24] A. Rehman, A.S. Ijaz, A. Raz, J. Iran. Chem. Soc. 2 (2005) 197.
[25] N. Saffaj, T. Saffaj, M. Charrouf, B. Ihssane, A. Abourrche, Y. Abboud, A. Benanamara, Indian J. Anal. Chem. 4 (2007).
[26] T. Saffaj, M. Charrouf, A. Abourriche, Y. Aboud, A. Bennamara, M. Berrada, Dyes & Pigments 70 (2006) 259.
[27] L. Lopez Martine, F.J. Luna Hernandez, P.L. Lopez Alba, Anal. Chim. Acta 340 (1997) 241.
[28] C.V. Prasad, V. Sripriya, R.N. Saha, P. Parimoo, J. Pharm. Biomed. Anal. 5 (1999) 961
[29] R.G. Bhatkar, S.K. Chodankar, Indian J. Pharm. Sci. 42 (1980) 127.
[30] N.D. Dinesh, P. Nagaraja, K.S. Rangappa, Turk. J. Chem. 28 (2004) 335.
[31] O.S. Kamalapurkar, J.J. Chudasama, East Pharm. 26 (1983) 207.
[32] P. Nagaraja, K.R. Sunitha, R.A. Vasantha, H.S. Yathirajan, J. Pharm. Biomed. Anal. 28 (2002) 527.
[33] J.O. Onah, Global J. Pure & Appl. Sci. 10 (2004) 125. [34] H.T. Karnes, C. March, Pharm. Res. 10 (1993) 1420.

Adegoke et al.
370
[35] J. Rose, Advanced Physico-Chemical Experiments,
Pitman, London, 1964, p. 54. [36] United States Pharmacopoeia (USP 24/NF 19), US
Pharmacopoeial Convention, USA, p. 819. [37] K. Basavaiah, V.S. Charan, Sci. Asia 30 (2004) 163. [38] H.A. Benesi, J.H. Hildebrand, J. Am. Chem. Soc. 71
(1949) 2703.
[39] M. Alfred, S. James, C. Arthur, A.H.C. Chun, 3rd ed.,
Lea and Febiger Philadelphia, USA, 1993, pp. 319-320. [40] M. Abdel-Salam, A.S. Issa, M. Mahrous, M.E. Abdel-
Hamid, Anal. Lett. 18 (1985) 1391. [41] M.A. La-Scalea, S.H.P. Serrano, I.G.R. Gutz, J. Braz.
Chem. Soc. 10 (1999) 127.