India's Export of Cereal and Cereal Preparations - a Constant Market Share Analysis
10
VOLUME NO.1, ISSUE NO.6 ISSN 2277-1166 61 INDIA’S EXPORT OF CEREALS AND CEREAL PREPARATIONS – A CONSTANT MARKET SHARE ANALYSIS Dr. Sunny Thomas 1 and Waheeda Sheikh 2 1 Principal, Institute of Language Studies and Applied Social Sciences, Anand, Gujarat Email: principal.ilsass.gmail.com 2 Sr. Lecturer, SEMCOM, Anand, Gujarat Email: [email protected] ABSTRACT From food grains importing country in 1950s and 60s there is a turn around and now India has become the exporter of food grains to the world. India, the third largest economy of Asia, is the leading producer for several agricultural products. Nearly 60 per cent of Indian population is dependent on the agriculture for their livelihood. In relation to the size of the Indian agriculture the presence of this sector in the international market is modest in size. After liberalisation policy was adopted in 1991 there is a shift in government of India’s policy from import substitution of the agro products to the export promotion. Present paper explores the growth and performance of the export of one of the most important agricultural good i.e., cereals. Cereals are exported in raw, semi processed and fully processed form. The commodity group is one of the largest foreign exchange earners in the last two decades. The study explores at length the causes of lack of growth using the decomposition model of Constant Market Share Analysis. Keywords: Cereals Export, Competitiveness, Constant Market Share Analysis INTRODUCTION Economic reforms and qualitative improvement in agriculture operation have enhanced the supply capacity of Indian agriculture. India has a unique opportunity to substantially increase its exports of agricultural products – particularly in the free trade regime under World Trade Organization. From a phase of gradual export orientation, the agricultural sector in India has entered into a new phase of globalisation with the implementation of the various provisions of WTO (as and when they are made applicable to India). India being a major negotiator on world agriculture trade, it can be expected that Indian agriculture trade will expand in the years to come. This process started with the India signing the Agreement on Agriculture (AOA) during the Uruguay Round.
Transcript of India's Export of Cereal and Cereal Preparations - a Constant Market Share Analysis

VOLUME NO.1, ISSUE NO.6 ISSN 2277-1166
61
INDIA’S EXPORT OF CEREALS AND CEREAL PREPARATIONS – A CONSTANT MARKET SHARE
ANALYSIS
Dr. Sunny Thomas1 and Waheeda Sheikh2
1Principal, Institute of Language Studies and Applied Social Sciences, Anand, Gujarat
Email: principal.ilsass.gmail.com 2Sr. Lecturer, SEMCOM, Anand, Gujarat
Email: [email protected]
ABSTRACT
From food grains importing country in 1950s and 60s there is a turn around
and now India has become the exporter of food grains to the world. India,
the third largest economy of Asia, is the leading producer for several
agricultural products. Nearly 60 per cent of Indian population is dependent
on the agriculture for their livelihood. In relation to the size of the Indian
agriculture the presence of this sector in the international market is modest
in size. After liberalisation policy was adopted in 1991 there is a shift in
government of India’s policy from import substitution of the agro products
to the export promotion. Present paper explores the growth and
performance of the export of one of the most important agricultural good
i.e., cereals. Cereals are exported in raw, semi processed and fully
processed form. The commodity group is one of the largest foreign exchange
earners in the last two decades. The study explores at length the causes of
lack of growth using the decomposition model of Constant Market Share
Analysis.
Keywords: Cereals Export, Competitiveness, Constant Market Share
Analysis
INTRODUCTION
Economic reforms and qualitative improvement in agriculture operation have enhanced the
supply capacity of Indian agriculture. India has a unique opportunity to substantially increase
its exports of agricultural products – particularly in the free trade regime under World Trade
Organization. From a phase of gradual export orientation, the agricultural sector in India has
entered into a new phase of globalisation with the implementation of the various provisions
of WTO (as and when they are made applicable to India). India being a major negotiator on
world agriculture trade, it can be expected that Indian agriculture trade will expand in the
years to come. This process started with the India signing the Agreement on Agriculture
(AOA) during the Uruguay Round.

ABHINAV NATIONAL MONTHLY REFEREED JOURNAL OF REASEARCH IN COMMERCE & MANAGEMENT
www.abhinavjournal.com
VOLUME NO.1, ISSUE NO.6 ISSN 2277-1166
62
Cereals and cereals preparations are one of the major foreign exchange earners for the
country. Basmati and non-basmati rice are the major items of agricultural exports of India.
India’s cereals exports can be divided into two broad categories, i.e. export of a) unprocessed
products, and b) processed products. Unprocessed products are essentially of low value high
volume nature, while processed products are of high value but low volume nature. Among
various agricultural commodities exported by India cereals and cereals preparations ranked
fourth in 1991 in terms of its value of export earnings, whereas in the year 2009 it ranks first
behind none. Export earnings from cereals and their preparations increased from 367.9
million USD in 1991 to 3116.3 million USD in 2009. The earnings form cereals and cereals
preparations increased gradually till 1994, thereafter the rise is three fold from 408 million
USD in 1994 it increased to 1213.4 million USD in 1995, then with a decline for next two
years in 1998 the performance was good with export value at 1349.12 million USD.
Nearly 95 per cent of the total earnings were from the export of unprocessed cereals.
Amongst the unprocessed cereals basmati rice and non-basmati rice form a larger percent of
the total cereal exports from India. Unprocessed cereals have greater demand in the Asian
countries. Asia is the largest stable and growing market. Asian countries such as Saudi
Arabia, UAE, Kuwait, Malaysia, Bangladesh, Singapore, Oman and Sri Lanka are traditional
markets and Pakistan, Iran, Vietnam, Nepal, Taiwan, Indonesia, Sudan, Kenya and Jordan
have emerged as new market for cereals and cereal preparations.
With improved technology and world class quality standards in agro processing units India
has the potential to penetrate in European and American markets. The value added export of
processed cereals offer tremendous potential to India. Indian cereals and cereal preparations
have experienced faster growth and higher instability as compared to that of world export
during the period under observation.
LITERATURE REVIEW
Hosamane et al (2006) examine the export behavior of principal commodities during pre
and post reform period using the Constant Market Share Analysis. Hugar L B (2002) uses
the Markov Chain Approach to analyze Onion Export Markets and its Stability for increasing
India’s exports. Rajagopal (2000) the liberalised economic policies are helping the economy
in a positive direction in global perspective. From export potential point of view he finds that
rice has greater competitiveness. Sananse et al (2004) study basmati rice export. The existing
research concentrates only on cash crops or the particular segment of cereals and cereals
preparations. Further many studies like Nageshwara et al (2009), Shinoj P et al (2008), Sathe
D and R S Deshpande (2006) Singh and Goyal (2004), Goyal S K et al (2000) Kaushik K K
et al (2000) are either using revealed comparative advantage method or the instability indices
for analyzing the advantage of agricultural products in the international market. Kehar Singh
et al (2003) study the prospects of agricultural exports of India using composite index
approach. Anjani Kumar (2004) has used Ordinary Least Square and Hugar L B (2002) uses
the Markov Chain Approach to analyze Onion Export Markets and their Stability for
increasing India’s exports.
In light of the reviewed literature the present study uses Constant Market Share analyzing the
competitiveness and decomposing the growth of cereals and cereals and cereals preparations
export from India.

ABHINAV NATIONAL MONTHLY REFEREED JOURNAL OF REASEARCH IN COMMERCE & MANAGEMENT
www.abhinavjournal.com
VOLUME NO.1, ISSUE NO.6 ISSN 2277-1166
63
OBJECTIVE OF THE STUDY
To study growth and competitiveness of cereals and cereals export from India
METHODOLOGY
The study is based on the time series data from 1991 to 2009 of value of export (US $) as per
2 digit Harmonised System (HS) classification related to Indian export of cereals and cereals
preparations. The time series data was collected from electronic data base of Ministry of
Commerce, Government of India, Commodity Trade Statistics (COMTRADE) of United
Nations, Food and Agricultural Organization’s TRADESTAT and Foreign Trade and
Balance of payment published by Centre for Monitoring Indian Economy.
Constant Market Share Analysis
The method chosen in this study is based on Fredrik et al (2006) and Juswanto and Mulyanti
(2003). This version of the CMS is also used by Lerner and Stern (1970) and Merkies and
Van der Meer (1988) when they supported the theoretical foundation of CMS. The CMS
analysis is always based on the assumption that a country’s share of exports in world imports
should be constant. If the share in world imports changes, there is a difference between the
constant market share norm and the actual export performance. The actual export
performance could then be decomposed into four components: (i) a market share effect, (ii) a
commodity composition effect, (iii) a market distribution effect and (iv) a competitiveness
effect.
In order to describe India’s agricultural export decomposition, we need following variables:
Vi. = Value of India’s exports of cereals and cereal preparations in period 1.
V’i. = Value of India’s exports of cereals and cereal preparations in period 2.
V.j = Value of India’s agricultural exports to continent j in period 1.
V’j= Value of India’s agricultural exports to continent j in period 2.
Vij = Value of India’s exports of cereals and cereal preparations to continent j in period 1.
V’ij = Value of India’s exports of cereals and cereal preparations to continent j in period 2.
r = Percentage increase in world exports of agriculture from period 1 to period 2.
ri = Percentage increase in world exports of cereals and cereal preparations from period 1 to
period 2.
rij = Percentage increase in world exports of cereals and cereal preparations to continent j
from period 1 to period 2.
ΔXc = Absolute change in India’s agricultural exports between period 1 and period 2.
It follows from the above definitions that for period 1 the value of India’s agricultural
exports is
(1)
(2)

ABHINAV NATIONAL MONTHLY REFEREED JOURNAL OF REASEARCH IN COMMERCE & MANAGEMENT
www.abhinavjournal.com
VOLUME NO.1, ISSUE NO.6 ISSN 2277-1166
64
Equations (1) and (2) respectively are the total export of cereals and cereal preparations and
total export to continent j in period 1,
Where
is the value of India’s export of cereals and cereal preparations to continent j in period 1
is summation of value of India’s export of cereals and cereal preparations to continent j
in period 1 which can also be written as
is the value of India’s agricultural exports to continent j in period 1
Similarly we can find the value of India’s agricultural export to continent j for period 2.
(3)
(4)
Equations (3) and (4) respectively are the total export of cereals and cereal preparations and
total export to continent j in period 2
Where
is the value of India’s exports of cereals and cereal preparations to continent j in period
2
is summation of value of India’s exports of cereals and cereal preparations to continent
j in period 2 which can also be written as
is the value of India’s agricultural exports to continent j in period 2 In addition, the
value of India’s agricultural exports in period 1 is given by –
(5)
Where V.. is total value of agricultural export of India which is arrived at by summation of
value of India’s exports of cereals and cereal preparations in period 1 or it is equal to the
summation of value of India’s agricultural exports to continent j in period 1. This can also be
written as . Similarly, it can also be written for period 2.
(6)
Where V’.. is total value of agricultural export of India which is arrived at by summation of
value of India’s exports of cereals and cereal preparations in period 2 or it is equal to the
summation of value of India’s agricultural exports to continent j in period 2. This can also be
written as . Assuming that exports are completely undifferentiated with respect
to commodity and region of destination, when applying the constant share norm, we get
equation (7)
V'.. – V.. ≡ ΔXc ≡ rV.. + (V'.. – V.. – rV..) (7)

ABHINAV NATIONAL MONTHLY REFEREED JOURNAL OF REASEARCH IN COMMERCE & MANAGEMENT
www.abhinavjournal.com
VOLUME NO.1, ISSUE NO.6 ISSN 2277-1166
65
Where,
(V'.. – V.. – rV..) is unexplained residual.
V'.. – V.. is the difference in the total value of agricultural export of India between period 2
and period 1. This difference is approximately equal to ΔXc which in turn is equal to rV.. + (V'.. – V.. – rV..). That is, if India maintained its market share, then exports would increase
by rV.. and the growth in exports could be divided into one part associated with general
increase (shown by rV..) in world exports and an unexplained residual, which is called the
competitiveness effect. A positive competitiveness could be attributed to a decrease in
India’s relative export price while a negative competitiveness likewise could be attributed to
an increase in the India’s relative export price.
With the definitions and identities given in equation 1 to 7, we can now proceed to the
complete decomposition of identity as shown in equation (8), wherein we consider exports to
differ not only with respect to commodities, but also with respect to destinations. The
argument for the latter division is to take into account that India might have easy access to
fast growing countries through historical patterns, geographic proximity or trade agreements
while it may not have similar access to other countries. The identity presented in equation (5)
can be presented in the following form -
V’ij – Vij ≡ rij Vij + (V’ij – Vij – rijVij) (8)
Where, (V’ij – Vij – rijVij) is unexplained residual.
In equation (8) above the difference between the value of India’s exports of cereals and
cereal preparations to continent j in period 2 and the value of India’s export of cereals and
cereal preparations to continent j in period one is approximately equal to percentage increase
in world exports of cereals and cereal preparations to continent j from period 1 to period 2
multiplied by value of India’s export of cereals and cereal preparations to continent j in
period 1.The growth of India’s export divided into a part associated with the general increase
in world export and an unexplained residual, at an aggregated level, is equal to:
ΔXc ≡ (9)
The total change in India’s exports, ΔXc in Equation (9) can be decomposed into four
components:
≡
≡
≡
≡
≡ (10)
(1) (2) (3) (4)
In equation (10), the four components are -
1. is the general rise in world export or Market share effect (MS)

ABHINAV NATIONAL MONTHLY REFEREED JOURNAL OF REASEARCH IN COMMERCE & MANAGEMENT
www.abhinavjournal.com
VOLUME NO.1, ISSUE NO.6 ISSN 2277-1166
66
2. Σi(ri – r)V i is the commodity composition of India’s exports in period 1 (CC)
3. Σi Σj(rij−ri )Vij is market distribution of India’s export (MD) , and
4. ΣiΣj(V’ij−Vij − rij Vij) is the residual reflecting the difference between actual export
growth and growth that would have occured if India would have maintained its share of
export of each commodity to each continent (CE).
a) Market Share effect or World Trade Effect (MS): The change in exports attributable
to the general change in world exports. It is the hypothetical growth that would have
occurred if India had increased its exports at the same pace as world imports have increased.
b) Commodity Composition effect (CC): Measures whether India in period 1 has focused
on commodities that grew relatively fast, or slowly, between period 1 and period 2. The
value is positive if India has concentrated its exports on commodities with growth rates that
are higher than the world average. Similarly, the value is negative if India has focused on
slowly growing commodity markets.
c) Market Distribution effect (MD): Measures whether India in period 1 concentrated on
destination markets that experienced relatively rapid, or slow, growth between period 1 and
period 2. The value is positive if India has concentrated its exports to markets that are
growing relatively fast and negative if they are growing relatively slowly.
d) Competitiveness Effect (CE): The residual reflects the difference between the actual
export growth and the export that would have occurred had India maintained her share in all
markets for all commodities. A negative value implies that India has failed to maintain
market shares in all markets for all commodities, i.e. its competitiveness has decreased. A
positive value means it has increased her market shares in all markets for all commodities,
i.e. competitiveness has increased.
The first three effects i.e., MS, CC and MD represent the growth of exports which would
result if the country maintains constant market share in each market. These three effects are
jointly referred to as structural term. The fourth effect, the competitiveness effect, may be
considered as an unexplained residual. It captures the effect of changing market shares. If the
value of CC is negative, then the country grows slower than it should have given the constant
market share norm. If the value of CC is positive, the country grows faster than it would
have given the constant market share norm. This implies that although the market share
effect might imply that the country grows faster than the world and that it is increasing its
market shares, it might still grow slower than it should have had it maintained its market
shares in all markets for all commodities. Thus, a country might display a negative
competitiveness despite having increased its world market shares.
Beside the absolute values that are calculated by using the variables shown in equation 10,
relative values could facilitate interpretation as well as comparison between the
commodities. The relative values are calculated by dividing the absolute effects by the actual
changes in exports of commodities. This kind of relative values clarify to what extent the
different effects contribute to the total change in exports. The relative values create some
complications, when the actual export change is negative. In such situations, in order to get
the correct sign (negative or positive) on the relative value and interpret the relative value
correctly, absolute values of the changes may have to be used in the calculations.

ABHINAV NATIONAL MONTHLY REFEREED JOURNAL OF REASEARCH IN COMMERCE & MANAGEMENT
www.abhinavjournal.com
VOLUME NO.1, ISSUE NO.6 ISSN 2277-1166
67
Taking the relative market share effect MS% as an example, the absolute value is always
positive if the country’s export to the world exports has increased over the period. If ΔXc >
0, and MS% > 100 implies that the change in country exports is smaller than the increase
would have been had it followed the increase of world exports. Likewise, if ΔXc is > 0, and
MS% < 100 it implies that the change in country exports is larger than the increase would
have been had it followed the increase of world exports. Essentially, the smaller the value of
MS%, the more the country increases its exports relative to the world. If, on the other hand,
ΔXc is < 0, then the absolute value is used in order to get the correct sign (positive or
negative) on the relative effect. As the change in exports is negative, it is obvious that the
country is loosing share in world markets but further information cannot be revealed.
FINDINGS AND RESULTS
Cereals and cereals preparation are one of the most important foreign exchange earning
groups amongst the agricultural commodities. The absolute values of change in export in
Figure 1 shows that Indian cereals and cereals preparations have increased for most of the
years except the poor performance in four periods i.e., 1996-1997, 1999-2000, 2005-2006
and 2008-09. For these four years there was a decline in the export value. The negative
values of change in export indicate the decline in the export value. During these four years
India lost its share in the world market.
Fig. 1. Change in India's export of Cereals and Cereals Preperations (Value in Million USD)
Competitiveness effect reveals that only for the 1992-1993, 1997-1998, 1998-1999 and
2000-2001 it was positive and the corresponding data related to CE% for the same years is
greater than 0 depicting that during these years Indian cereals group have greater increase in
its competitiveness. Rest of the years when CE% is less than 0 indicate that there has been a
reduction in the competitiveness of Indian cereals. Thus we may conclude that despite
having the highest share in agricultural export of India, cereals and cereals preparations have
not kept pace with the growth rate experienced by the world export of cereals and cereals
preparations.

ABHINAV NATIONAL MONTHLY REFEREED JOURNAL OF REASEARCH IN COMMERCE & MANAGEMENT
www.abhinavjournal.com
VOLUME NO.1, ISSUE NO.6 ISSN 2277-1166
68
The lack of growth between 2005 and 2006 is serious since total world exports as well as the
cereal import of the world have increased. Hence during the study period 14 years have
positive export growth of this group. In 1991-1992, 1994-1995 and 2003-04 the values of
market share, commodity composition and market distribution for cereals and cereals
preparations export from India are positive. This means the growth in these years is due to
increasing market share with focus on faster growing commodities as well as markets.
Table 1. Constant Market Share Analysis result for Cereals and Cereal Preparations
Year Absolute Effect (Values in Mn USD) Relative Effect (Percentage)
From
- To
Δ Xc MS CC MD CE Δ
Xc
MS CC MD CE
1991-
1992
6.6 2865.5 3368.0 943.6 -7170.5 100 43538.6 51174.4 14337.5 -108950.4
1992 -
1993
24.7 -3060.3 -1660.2 788.5 3956.7 100 -12373.6 -6712.6 3188.3 15998.0
1993 -
1994
13.1 4543.9 -3266.6 1041.3 -2305.6 100 34791.9 -25011.8 7973.4 -17653.5
1994 -
1995
263.3 4837.7 1872.7 2088.7 -8535.8 100 1837.4 711.3 793.3 -3242.0
1995 -
1996
712.6 3070.0 5962.8 -247.1 -8073.1 100 430.8 836.8 -34.7 -1132.9
1996 -
1997
-331.5 -3944.2 -15495.2 -3898.5 23006.3 100 1189.7 4674.0 1175.9 -6939.7
1997 -
1998
0.8 -3389.7 -3237.8 -3258.9 9887.2 100 -418483.3 -399727.3 -402331.9 1220642.5
1998 -
1999
244.9 -2219.9 701.7 813.6 949.4 100 -906.5 286.6 332.2 387.7
1999 -
2000
-573.3 -1260.7 -598.6 1019.4 266.6 100 219.9 104.4 -177.8 -46.5
2000 -
2001
70.7 1529.9 -1514.2 -3308.5 3363.5 100 2163.6 -2141.4 -4679.0 4756.8
2001 -
2002
326.7 2505.4 2560.0 -2327.6 -2411.1 100 767.0 783.7 -712.6 -738.1
2002 -
2003
445.2 16187.0 -3104.6 -5027.4 -7609.7 100 3635.5 -697.3 -1129.1 -1709.1
2003 -
2004
66.4 20015.7 4232.3 5938.4 -30119.9 100 30136.1 6372.2 8941.0 -45349.4
2004 -
2005
275.8 10006.6 -8926.2 -374.7 -430.0 100 3628.9 -3237.0 -135.9 -155.9
2005 -
2006
-265.6 16500.4 2310.7 -2776.7 -16300.0 100 -6211.7 -869.9 1045.3 6136.3
2006 -
2007
538.0 27886.8 14373.5 -1258.5 -40463.7 100 5183.2 2671.5 -233.9 -7520.9
2007 -
2008
1658.0 73633.9 -16424.1 7241.6 -62793.4 100 4441.1 -990.6 436.8 -3787.3
2008 -
2009
-970.5 -50669.6 -47689.3 -6656.5 104044.9 100 5221.0 4913.9 685.9 -10720.8
Note: MS - Market share Effect, CC - Commodity Composition Effect, MD - Market
Distribution Effect, CE – Competitiveness Effect.
Source: Researcher’s calculation based on the data collected from various issues of CMIE’s
publication on Foreign Trade and Balance of Payments and FAO’s TRADESTAT.
ABHINAV NATIONAL MONTHLY REFEREED JOURNAL OF REASEARCH IN COMMERCE & MANAGEMENT
www.abhinavjournal.com
VOLUME NO.1, ISSUE NO.6 ISSN 2277-1166
69
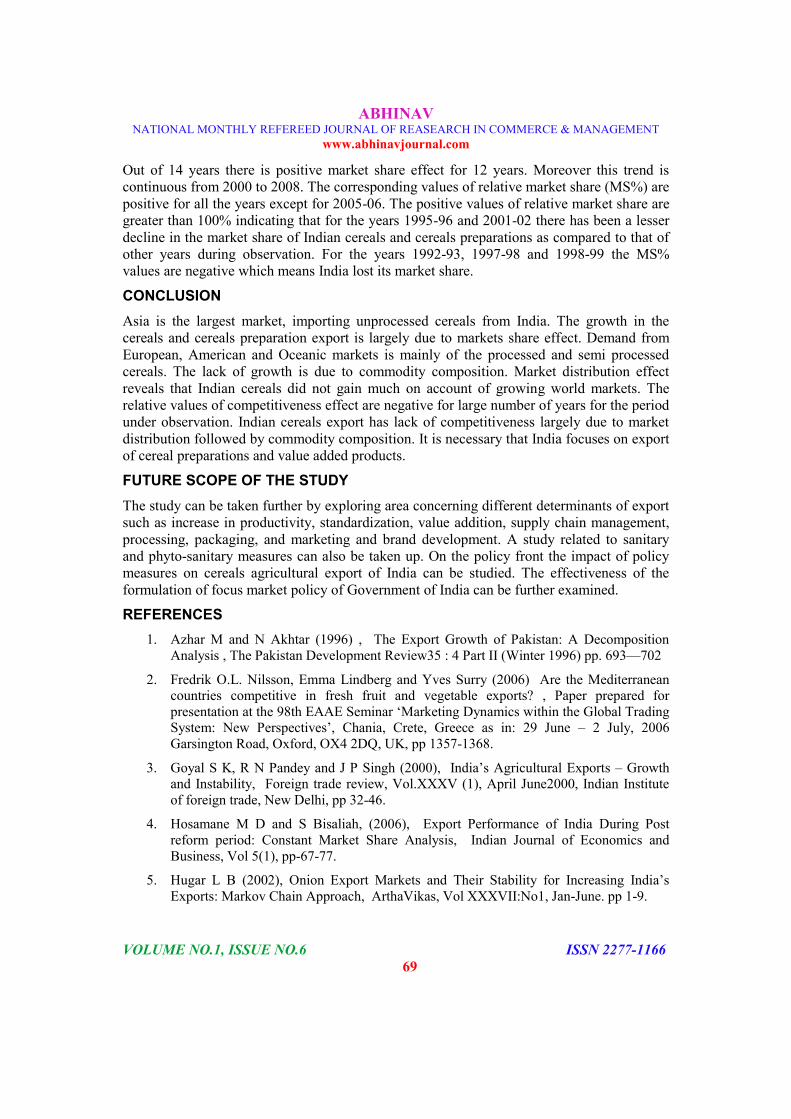
Out of 14 years there is positive market share effect for 12 years. Moreover this trend is
continuous from 2000 to 2008. The corresponding values of relative market share (MS%) are
positive for all the years except for 2005-06. The positive values of relative market share are
greater than 100% indicating that for the years 1995-96 and 2001-02 there has been a lesser
decline in the market share of Indian cereals and cereals preparations as compared to that of
other years during observation. For the years 1992-93, 1997-98 and 1998-99 the MS%
values are negative which means India lost its market share.
CONCLUSION
Asia is the largest market, importing unprocessed cereals from India. The growth in the
cereals and cereals preparation export is largely due to markets share effect. Demand from
European, American and Oceanic markets is mainly of the processed and semi processed
cereals. The lack of growth is due to commodity composition. Market distribution effect
reveals that Indian cereals did not gain much on account of growing world markets. The
relative values of competitiveness effect are negative for large number of years for the period
under observation. Indian cereals export has lack of competitiveness largely due to market
distribution followed by commodity composition. It is necessary that India focuses on export
of cereal preparations and value added products.
FUTURE SCOPE OF THE STUDY
The study can be taken further by exploring area concerning different determinants of export
such as increase in productivity, standardization, value addition, supply chain management,
processing, packaging, and marketing and brand development. A study related to sanitary
and phyto-sanitary measures can also be taken up. On the policy front the impact of policy
measures on cereals agricultural export of India can be studied. The effectiveness of the
formulation of focus market policy of Government of India can be further examined.
REFERENCES
1. Azhar M and N Akhtar (1996) , The Export Growth of Pakistan: A Decomposition
Analysis , The Pakistan Development Review35 : 4 Part II (Winter 1996) pp. 693—702
2. Fredrik O.L. Nilsson, Emma Lindberg and Yves Surry (2006) Are the Mediterranean
countries competitive in fresh fruit and vegetable exports? , Paper prepared for
presentation at the 98th EAAE Seminar ‘Marketing Dynamics within the Global Trading
System: New Perspectives’, Chania, Crete, Greece as in: 29 June – 2 July, 2006
Garsington Road, Oxford, OX4 2DQ, UK, pp 1357-1368.
3. Goyal S K, R N Pandey and J P Singh (2000), India’s Agricultural Exports – Growth
and Instability, Foreign trade review, Vol.XXXV (1), April June2000, Indian Institute
of foreign trade, New Delhi, pp 32-46.
4. Hosamane M D and S Bisaliah, (2006), Export Performance of India During Post
reform period: Constant Market Share Analysis, Indian Journal of Economics and
Business, Vol 5(1), pp-67-77.
5. Hugar L B (2002), Onion Export Markets and Their Stability for Increasing India’s
Exports: Markov Chain Approach, ArthaVikas, Vol XXXVII:No1, Jan-June. pp 1-9.

ABHINAV NATIONAL MONTHLY REFEREED JOURNAL OF REASEARCH IN COMMERCE & MANAGEMENT
www.abhinavjournal.com
VOLUME NO.1, ISSUE NO.6 ISSN 2277-1166
70
6. Jha D (2000), Export Potential of Agricultural commodities – the Bihar Context, in
Jagdish Prasad edited Export Potential of Indian Agriculture Bihar – Perspective and
Issues, Mittal Publications, New Delhi, pp 35-46.
7. Kainth G S, (1996), India’s Agricultural Exports: Status and Strategies, in Kainth G S
(Ed.) (1996) Export Potential of Indian Agriculture, Regency Publications, N Delhi,
India, p-10.
8. Merkies, A.H.Q.M., and van der Meer, T.: A Theoretical Foundation for Constant
Market Share Analysis, Empec, Vol. 13, 1988, p 66.
9. Mitchell K T R and Yochanan Shachmurove, (2000), South Africa’s International
Competitiveness A Product Level Analysis, Penn Institute for Economic Research,
Working Paper 03-020, Philadelphia.
10. Nageshwar R and R Srinivas (2009), Direction of Trade in Indian Agricultural
commodity Export, Southern Economist, Vol 47 (19), February, pp 21-23.
11. Qamar A (2000), From Subsistence to Market Economy – Possibilities of agricultural
Transformation Through Agro Export, in Jagdish Prasad edited Export Potential of
Indian Agriculture Bihar – Perspective and Issues, Mittal Publications, New Delhi, pp
73-82.
12. Rajagopal (2000), Promoting Export of Agricultural Commodities – Some Conceptual
Issues, in Jagdish Prasad edited Export Potential of Indian Agriculture Bihar –
Perspective and Issues, Mittal Publications, New Delhi, pp- 59-72.
13. Tiwari, R. S.: Constant- Market- Share of Export Growth: The Indian Case, The Indian
Economic Journal, Vol. 33, No. 3, 1983, pp 70-71.
14. Veermani, C (2007), Sources of India’s Export Growth in pre- and post-reform Periods,
Economic and Political Weekly, June 23, pp. 2419-2427.