Simultaneous spectrophotometric flow-through measurements of pH, carbon dioxide fugacity, and total...
14
Analytica Chimica Acta 596 (2007) 23–36 Simultaneous spectrophotometric flow-through measurements of pH, carbon dioxide fugacity, and total inorganic carbon in seawater Zhaohui Aleck Wang a , Xuewu Liu a , Robert H. Byrne a,∗ , Rik Wanninkhof b , Renate E. Bernstein a , Eric A. Kaltenbacher a , James Patten a a College of Marine Science, University of South Florida, 140 7th Ave. South, Saint Petersburg, FL 33701, United States b NOAA Atlantic Oceanographic and Meteorological Laboratory, Ocean Chemistry Division, 4301 Rickenbacker Causeway, Miami, FL 33149, United States Received 14 February 2007; received in revised form 1 May 2007; accepted 21 May 2007 Available online 31 May 2007 Abstract An autonomous multi-parameter flow-through CO 2 system has been developed to simultaneously measure surface seawater pH, carbon dioxide fugacity (fCO 2 ), and total dissolved inorganic carbon (DIC). All three measurements are based on spectrophotometric determinations of solution pH at multiple wavelengths using sulfonephthalein indicators. The pH optical cell is machined from a PEEK polymer rod bearing a bore-hole with an optical pathlength of ∼15 cm. The fCO 2 optical cell consists of Teflon AF 2400 (DuPont) capillary tubing sealed within the bore-hole of a PEEK rod. This Teflon AF tubing is filled with a standard indicator solution with a fixed total alkalinity, and forms a liquid core waveguide (LCW). The LCW functions as both a long pathlength (∼15 cm) optical cell and a membrane that equilibrates the internal standard solution with external seawater. fCO 2 is then determined by measuring the pH of the internal solution. DIC is measured by determining the pH of standard internal solutions in equilibrium with seawater that has been acidified to convert all forms of DIC to CO 2 . The system runs repetitive measurement cycles with a sampling frequency of ∼7 samples (21 measurements) per hour. The system was used for underway measurements of sea surface pH, fCO 2 , and DIC during the CLIVAR/CO 2 A16S cruise in the South Atlantic Ocean in 2005. The field precisions were evaluated to be 0.0008 units for pH, 0.9 atm for fCO 2 , and 2.4 mol kg −1 for DIC. These field precisions are close to those obtained in the laboratory. Direct comparison of our measurements and measurements obtained using established standard methods revealed that the system achieved field agreements of 0.0012 ± 0.0042 units for pH, 1.0 ± 2.5 atm for fCO 2 , and 2.2 ± 6.0 mol kg −1 for DIC. This system integrates spectrophotometric measurements of multiple CO 2 parameters into a single package suitable for observations of both seawater and freshwater. © 2007 Elsevier B.V. All rights reserved. Keywords: Autonomous carbon measurements; Spectrophotometric; Carbon dioxide; pH; fugacity; Dissolved inorganic carbon 1. Introduction Measurements of four seawater inorganic carbon system parameters – pH, carbon dioxide fugacity (fCO 2 ) or partial pres- sure of CO 2 (pCO 2 ), total dissolved inorganic carbon (DIC), and total alkalinity (TA) – are essential for carbon cycle inves- tigations on both global and local scales. Both observational and modeling efforts rely on high quality inorganic carbon data from field measurements. Extensive efforts have been devoted ∗ Corresponding author. Tel.: +1 727 553 1508; fax: +1 727 553 1189. E-mail address: [email protected] (R.H. Byrne). to improving methodologies and instruments for determination of carbon parameters in seawater. In standard conventional methodologies [1], the four core parameters of the seawater inorganic carbon system are measured using diverse instrumentation (e.g. potentiome- try, spectrophotometry, gas chromatography, non-dispersive infrared analysis, and coulometry). Recent advances in tech- nology and materials have prompted many researchers to adapt these diverse methodologies for use in unattended in-situ devices and autonomous underway systems without compro- mising precision and accuracy relative to standard methods (e.g. DeGrandpre et al. [2] for in-situ pCO 2 ; Feely et al. [3] for under- way pCO 2 ; Tapp et al. [4] for underway pH; Martz et al. [5] for 0003-2670/$ – see front matter © 2007 Elsevier B.V. All rights reserved. doi:10.1016/j.aca.2007.05.048
-
Upload
independent -
Category
Documents
-
view
4 -
download
0
Transcript of Simultaneous spectrophotometric flow-through measurements of pH, carbon dioxide fugacity, and total...
A
faoTffeftfm1i©
K
1
psataf
0d
Analytica Chimica Acta 596 (2007) 23–36
Simultaneous spectrophotometric flow-throughmeasurements of pH, carbon dioxide fugacity,
and total inorganic carbon in seawater
Zhaohui Aleck Wang a, Xuewu Liu a, Robert H. Byrne a,∗, Rik Wanninkhof b,Renate E. Bernstein a, Eric A. Kaltenbacher a, James Patten a
a College of Marine Science, University of South Florida, 140 7th Ave. South, Saint Petersburg, FL 33701, United Statesb NOAA Atlantic Oceanographic and Meteorological Laboratory, Ocean Chemistry Division,
4301 Rickenbacker Causeway, Miami, FL 33149, United States
Received 14 February 2007; received in revised form 1 May 2007; accepted 21 May 2007Available online 31 May 2007
bstract
An autonomous multi-parameter flow-through CO2 system has been developed to simultaneously measure surface seawater pH, carbon dioxideugacity (fCO2), and total dissolved inorganic carbon (DIC). All three measurements are based on spectrophotometric determinations of solution pHt multiple wavelengths using sulfonephthalein indicators. The pH optical cell is machined from a PEEK polymer rod bearing a bore-hole with anptical pathlength of∼15 cm. The fCO2 optical cell consists of Teflon AF 2400 (DuPont) capillary tubing sealed within the bore-hole of a PEEK rod.his Teflon AF tubing is filled with a standard indicator solution with a fixed total alkalinity, and forms a liquid core waveguide (LCW). The LCW
unctions as both a long pathlength (∼15 cm) optical cell and a membrane that equilibrates the internal standard solution with external seawater.CO2 is then determined by measuring the pH of the internal solution. DIC is measured by determining the pH of standard internal solutions inquilibrium with seawater that has been acidified to convert all forms of DIC to CO2. The system runs repetitive measurement cycles with a samplingrequency of∼7 samples (21 measurements) per hour. The system was used for underway measurements of sea surface pH, fCO2, and DIC duringhe CLIVAR/CO2 A16S cruise in the South Atlantic Ocean in 2005. The field precisions were evaluated to be 0.0008 units for pH, 0.9 �atm forCO , and 2.4 �mol kg−1 for DIC. These field precisions are close to those obtained in the laboratory. Direct comparison of our measurements and
2easurements obtained using established standard methods revealed that the system achieved field agreements of 0.0012± 0.0042 units for pH,.0± 2.5 �atm for fCO2, and 2.2± 6.0 �mol kg−1 for DIC. This system integrates spectrophotometric measurements of multiple CO2 parametersnto a single package suitable for observations of both seawater and freshwater.
2007 Elsevier B.V. All rights reserved.
oxide
to
pmt
eywords: Autonomous carbon measurements; Spectrophotometric; Carbon di
. Introduction
Measurements of four seawater inorganic carbon systemarameters – pH, carbon dioxide fugacity (fCO2) or partial pres-ure of CO2 (pCO2), total dissolved inorganic carbon (DIC),nd total alkalinity (TA) – are essential for carbon cycle inves-
igations on both global and local scales. Both observationalnd modeling efforts rely on high quality inorganic carbon datarom field measurements. Extensive efforts have been devoted∗ Corresponding author. Tel.: +1 727 553 1508; fax: +1 727 553 1189.E-mail address: [email protected] (R.H. Byrne).
inadmDw
003-2670/$ – see front matter © 2007 Elsevier B.V. All rights reserved.oi:10.1016/j.aca.2007.05.048
; pH; fugacity; Dissolved inorganic carbon
o improving methodologies and instruments for determinationf carbon parameters in seawater.
In standard conventional methodologies [1], the four corearameters of the seawater inorganic carbon system areeasured using diverse instrumentation (e.g. potentiome-
ry, spectrophotometry, gas chromatography, non-dispersivenfrared analysis, and coulometry). Recent advances in tech-ology and materials have prompted many researchers todapt these diverse methodologies for use in unattended in-situ
evices and autonomous underway systems without compro-ising precision and accuracy relative to standard methods (e.g.eGrandpre et al. [2] for in-situ pCO2; Feely et al. [3] for under-ay pCO2; Tapp et al. [4] for underway pH; Martz et al. [5] for
2 Chim
i[
tccstttp
iommoahl
rppatrmtpitassrdf
thwsdmtAcCdtimorC2
daTmcLC
satatDTmalotp
flftoDotirloatmcdfi
2
or[lmsstmt
4 Z.A. Wang et al. / Analytica
n-situ pH; Johnson et al. [6] for underway DIC; Watanabe et al.7] for underway TA).
It is highly desirable that all four parameters of the seawa-er inorganic carbon system are measured simultaneously andontinuously with high temporal resolution, and with high pre-ision and accuracy. Although any two of the four parameters areufficient to fully characterize the inorganic carbon system viahermodynamic calculations, additional parameters are requiredo ensure internal consistency of measurements and evaluate thehermodynamic characterizations that relate various CO2 systemarameters [8,9].
Among all available methodologies for measurements ofnorganic carbon species in seawater, spectrophotometric meth-ds are especially promising because they can be used to unifyeasurements of different parameters and achieve simultaneousulti-parameter measurements at relatively low cost [10]. More-
ver, spectrophotometric methods have many advantageousttributes for measuring inorganic carbon species in seawater:igh sensitivity, good stability and selectivity, simplicity, andow rates of sample and reagent consumption.
Spectrophotometric pH measurements using absorbanceatios at multiple wavelengths have long been utilized to obtainrecise (±0.0004) discrete shipboard measurements of seawaterH [11,12]. As such, spectrophotometric pH measurements arepproximately an order of magnitude more precise than poten-iometric pH measurements [1]. As an additional advantageelative to potentiometric measurements, at-sea spectrophoto-etric pH measurements do not require calibration subsequent
o laboratory characterizations of each indicator’s molecularroperties as a function of temperature, salinity, pressure andonic strength. Since pH measurements require very low indica-or concentrations (<2 �M), pH perturbations due to indicatorddition are quite small. Underway spectrophotometric pH mea-urements can achieve precisions close to those of discretehipboard spectrophotometric measurements [13]. Liu et al. [14]ecently reported the characteristics of an in-situ pH profilingevice with a field pH precision of± 0.0014 and a samplingrequency of 0.5 Hz.
For many years researchers have also developed spectropho-ometric sensors for oceanic pCO2 measurements. These sensorsave been deployed for measurements on moorings [2,15,16]ith reported precisions (1–2 �atm) close to those obtained in
hipboard measurements using a CO2 gas equilibrator with non-ispersive infrared analysis [3,17]. Spectrophotometric pCO2easurements are generally based on the same principle as
hose utilized in spectrophotometric pH measurements [2,10].membrane-optical cell containing a sulfonephthalein indi-
ator functions as a traditional spectrophotometric cell and aO2 equilibrator. Water samples surround the optical cell buto not have direct contact with the internal indicator solu-ion. CO2 in water samples equilibrates with the cell’s internalndicator solution. The resulting pH of the internal solution is
easured by a spectrophotometer connected to the cell with
ptical fibers. The optical cell can be made of polytetrafluo-oethylene (PTFE) or silicone, both of which are permeable toO2 molecules. Wang et al. [18] reported use of Teflon AF400 (a DuPontTM copolymer of 2,2-bistrifluoromethyl-4,5-oDsp
ica Acta 596 (2007) 23–36
ifluoro-1,3-dioxole with tetrafluoroethylene) capillary tubings an optical sensor-cell for underway pCO2 measurements.eflon AF 2400 is ideal for spectrophotometric pCO2 measure-ents because it is highly permeable to CO2 gas molecules, and
an be used as a long pathlength liquid core waveguide (LCW).ong pathlengths can improve detection sensitivity, and highO2 permeability can reduce equilibration times.
Byrne et al. [10] described spectrophotometric DIC mea-urements using Teflon AF 2400 tubing as both an optical cellnd a gas permeable membrane. The method is similar to spec-rophotometric pCO2 measurement except that water samplesre acidified, converting all carbonate species to CO2. Spec-rophotometric pH measurements are then used to determineIC as total CO2 after equilibration across the wall of the LCW.he procedure is quite simple compared to the coulometricethod [19], and has a comparable precision (1–2 �mol kg−1)
nd accuracy (5 �mol kg−1). The reported response time wasess than 15 min, which can be further improved by selectionf thinner-wall and smaller-diameter Teflon AF 2400 capillaryubing. Spectrophotometric DIC measurements are also fieldortable and easily adapted to in-situ analysis.
We describe herein the first autonomous multi-parameterow-through CO2 system for simultaneous measurement of sur-ace seawater pH, fCO2, and DIC. Measurements are based onhe same spectrophotometric principles that were used previ-usly for spectrophotometric measurements of pH, fCO2 andIC. Available spectrophotometric methodologies developedver years for measurements of inorganic carbon parame-ers were engineered into a single system that is primarilyntended for high-resolution underway monitoring onboardesearch vessels. The system was tested during the month-ong CLIVAR/CO2 A16S cruise in the South Atlantic Oceannboard the ship Ronald H. Brown of the National Oceanicnd Atmospheric Administration (NOAA). In addition to aheoretical and technical description of the system, shipboard
easurements obtained with the autonomous system are directlyompared with measurements obtained using established stan-ard methods. The discussion will focus on assessment of theeld performance of the system.
. Theoretical principles
Direct spectrophotometric measurements of seawater pH arebtained with a small bore-hole PEEK (Polyetheretherketone)od. By continuously mixing water sample and indicator solution14], pH can be measured in real-time. Teflon AF 2400 capil-ary tubing was used as both an LCW and a gas-equilibrium
embrane cell for fCO2 and DIC measurements [10,18]. Aulfonephthalein indicator with constant total alkalinity (dis-olved Na2CO3) serves as the liquid core of the Teflon LCWubing, and water samples (acidified water samples for DIC
easurements) are directed to flow externally. After equilibra-ion across the CO2 permeable Teflon AF membrane, the fCO2
f the internal solution and the external sample are identical.IC and fCO2 are determined through spectrophotometric mea-urements of internal solution pH. Depending on the desiredH range of the internal solutions, different indicators and total
Chim
amt
2
lmss
H
wt
p
ws
al
p
Tr
e
wwatiedi
h
p
wtc
p
tλ
wb
t
−
wt
2
ssfs
(
wn
aa
K
K
a
[
wo
T
e
(
SS
(
Z.A. Wang et al. / Analytica
lkalinities are chosen for fCO2 and DIC. For current underwayeasurements, all parameters are measured at a thermostated
emperature (25 ◦C).
.1. pH
Spectrophotometric pH measurements have been well estab-ished as a standard method for seawater CO2 system
easurements [1,11,12,20]. Within the normal pH range ofeawater, dissociation of sulfonephthalein indicators (H2I) inolution is dominated by the following equilibrium:
I− KI←→H+ + I2−, (1)
here KI is an indicator dissociation constant. Solution pH canhen be written as:
H = pKI + log[I2−]
[HI−], (2)
here brackets ([ ]) denote the concentrations of indicatorpecies, KI = [H+][I2−][HI−]−1, and pKI =−log KI.
Eq. (2) can be written in terms of pKI and an indicatorbsorbance ratio, R = λ2A/λ1A, where λ1 and λ2 are the wave-engths for the absorbance maxima of HI− and I2− [11]:
H = pKI + logR− e1
e2 − Re3. (3)
he coefficients e1, e2, and e3 are indicator molar absorbanceatios at wavelengths λ1 and λ2:
1 = λ2 ∈ HI
λ1 ∈ HI, e2 = λ2 ∈ I
λ1 ∈ HI, e3 = λ1 ∈ I
λ1 ∈ HI, (4)
here λ1 ∈ I and λ2 ∈ I denote the molar absorbances of I2− atavelengths λ1 and λ2, and λ1 ∈ HI and λ2 ∈ HI refer to the molar
bsorbances of HI− at wavelengths λ1 and λ2. Eq. (3) showshat spectrophotometric pH measurements require calibration ofndicator molecular properties in the laboratory (pKI, e1, e2, and3 and their variation with temperature, salinity, pressure), buto not require subsequent calibration in the field. Measurementsn the field can then be termed as “calibration free” [11,21].
In the present study, seawater pH was determined on the totalydrogen ion concentration scale (pHT):
HT = − log [H+]T = − log[H+] − log
(1+ ST
KHSO4
), (5)
here [H+] refers to the free hydrogen ion concentration, ST ishe total sulfate concentration, and KHSO4 is the HSO4
− disso-iation constant. Eq. (3) is then written as:
HT = − log TKI + logR− e1
e2 − Re3, (6)
For surface seawater pHT determinations in the present study,
hymol blue was used for direct pH measurements, whereby1 = 435 nm and λ2 = 596 nm. A third wavelength, λref = 700 nm,as used to compensate for potential baseline shifts betweenlank and sample measurements. The molecular properties of wica Acta 596 (2007) 23–36 25
hymol blue have been reported previously [20]:
log TKI = 4.706S
T+ 26.3300− 7.17218 log T
− 0.017316S, (7)
e1 = −0.00132+ 1.6× 10⁻⁵T,
e2 = 7.2326− 0.0299717T + 4.6× 10⁻⁵T 2, and
e3 = 0.0223+ 0.0003917T,
(8)
here S denotes salinity of the sample and T denotes the absoluteemperature in degrees Kelvin.
.2. fCO2
For spectrophotometric fCO2 measurements, the internaltandard solution of the LCW consists of a Na2CO3-indicatorolution with a constant total alkalinity. Upon equilibration, theCO2 in sample waters is equal to the fCO2 of the internalolution:
fCO2)ex= (fCO2)i, (9)
here subscripts ‘ex’ and ‘i’ refer to external samples and inter-al standard solution.
At equilibrium, species concentrations in the internal solutionre expressed in terms of the dissociation constants of carboniccid as follows:
′1 =
[H+][HCO3−]
[CO2∗]
, (10)
′2 =
[H+][CO32−]
[HCO3−]
(11)
nd
CO2∗] = [CO2] + [H2CO3] = K0(fCO2)i, (12)
here K0 is the Henry’s Law constant. The titration alkalinityf the internal Na2CO3-indicator solution can be written as:
A = 2[CO32−] + [HCO3
−] + [I2−] + [OH−]− [H+].
(13)
Combining Eqs. (10)–(12), Eq. (13) can be rearranged andxpressed in terms of (fCO2)i:
fCO2)i =TA− ([I2−]+ [OH−]− [H+])
2K0K′1K′2[H+]−2 +K0K
′1[H+]−1 . (14)
ince TA [I2−] + [OH−]− [H+] in the present study (see laterections 2.3 and 3.2), Eq. (14) can be written as:
fCO2)i = (fCO2)ex =TA
2K0K′1K′2[H+]−2 +K0K
′1[H+]−1
= TA
L, (15)
here L = 2K0K′1K′2[H+]−2 +K0K
′1[H+]−1.
2 Chim
tt
wanBCttnkt
(
Ti2
2
wsuAeCs
(
w“tb
D
ptefbλ
viE
C
l
(Hst
l
wl
l
tim3Ed
l
w
3
3
(cac
6 Z.A. Wang et al. / Analytica
Using Eq. (15), (fCO2)i can be calculated from the pH ofhe internal solution, as all other terms are constants at constantemperature.
Phenol red (λ1 = 434 nm, λ2 = 558 nm, and λref = 700 nm)as used as the indicator for measurements of fCO2. The
bsorbance characteristics and dissociation behavior of phe-ol red were determined at low ionic strength by Yao andyrne [22]. The fCO2 measurement system is calibrated usingO2 gases at known concentrations. The pH of the indica-
or solution is determined spectrophotometrically, and the Lerm in Eq. (15) is then calculated. Since the TA of the inter-al solution is constant (but not necessarily and accuratelynown), sample fCO2 has a linear dependence on 1/L at constantemperature:
fCO2)ex =a
L+ b, (16)
he calibration constants, a and b, account for all uncertaintiesn Eq. (15) including the absolute value of TA (see later Sections.3 and 3.2).
.3. DIC
Spectrophotometric measurements of DIC using liquid coreaveguides have been described by Byrne et al. [10]. Water
amples are acidified before measurements (pH≈ 2.7), where-pon the total CO2
* concentration equals the DIC concentration.fter the internal Na2CO3 -indicator solution attains CO2
quilibrium with the acidified water samples across the LCWO2-permeable walls, the CO2 fugacity of the acidified outer
olution can be written as:
fCO2)a = (fCO2)i =DIC
(K0)a(17)
here the subscript “a” refers to the acidified outer solution, andi” indicates the internal solution. Sample DIC concentrationhen can be derived from observations of the internal solutiony combining Eq. (17) with Eqs. (10) and (12):
IC =(
(K0)a
(K0)i
)[H+]i
[HCO3−]i
K′1(18)
Using Eq. (18), the DIC concentration is directly linked to theH of the internal solution, which can be measured spectropho-ometrically with an appropriate sulfonephthalein indicator. Atquilibrium, with internal solution pH between 5.6 and 6.4or DIC concentrations between 1000 and 3000 �mol kg−1,romocresol purple (BCP, λ1 = 432 nm, λ2 = 589 nm, andref = 700 nm) with a pKI near 6.5 [22] is ideal for obser-ations of pH. Within the 5.6–6.4 pH range, the TA of thenternal Na2CO3-indicator solution can be simplified relative to
q. (13):TA = [HCO3−]+ [I2−]− [H+]i, and
[HCO3−] = TA+ [H+]i − [I2−].
(19)
scps
ica Acta 596 (2007) 23–36
ombining Eqs. (3), (18) and (19), DIC can be expressed as:
og DIC = log
((K0)a
(K0)i
)+ log(TA+ [H+]i − [I2−])
+ log
(KIe2
K′1
)− log
(R− e1
1− Re3/e2
)(20)
K0)a/(K0)i can be calculated from the known dependence ofenry’s Law (gas solubility) constants on temperature and ionic
trength [23]. CO2 solubility constants in freshwater and seawa-er [23,24] can be expressed as:
n K0 = 93.4517
(100
T
)− 60.2409+ 23.3585 ln
(T
100
)
+ 50.20 μ
(0.023517− 0.023655
(T
100
)
+ 0.0047036
(T
100
)2)
, (21)
here μ is the ionic strength of the solution. Consequently,og ((K0)a/(K0)i))is given as:
og
((K0)a
(K0)i
)=
(50.20(μa − μi)
2.303
)
×(
0.023517− 0.023655
(T
100
)
+ 0.0047036
(T
100
)2)
. (22)
The term log (KIe2/K1′)in Eq. (20) is constant for a solu-
ion at constant temperature. If TA≥ 1000 �mol kg−1 for thenternal solution, the term (TA + [H+]− [I2−]) varies by noore than 0.06% for DIC concentrations between 1000 and
000 �mol kg−1 [10]. As such, the second and third terms inq. (20) can be combined and treated as a single temperatureependent constant. DIC is finally expressed as:
og DIC = log
((K0)a
(K0)i
)+ B − log
(R− e1
1− Re3/e2
). (23)
here B is an experimentally derived calibration constant.
. Instrumentation and experiments
.1. Multi-parameter flow-through CO2 system
The automated multi-parameter flow-through CO2 systemFig. 1) was developed by the College of Marine Science inonjunction with engineers of the Center for Ocean Technologyt the University of South Florida (USF). The underway systemonsists of three seawater channels that simultaneously measure
urface seawater pH, fCO2, and DIC. The system can operateontinuously and measure three parameters at a constant tem-erature (25 ◦C) every∼8 min (∼7 samples per hour). The mainub-units of the system (Fig. 1) include the optical components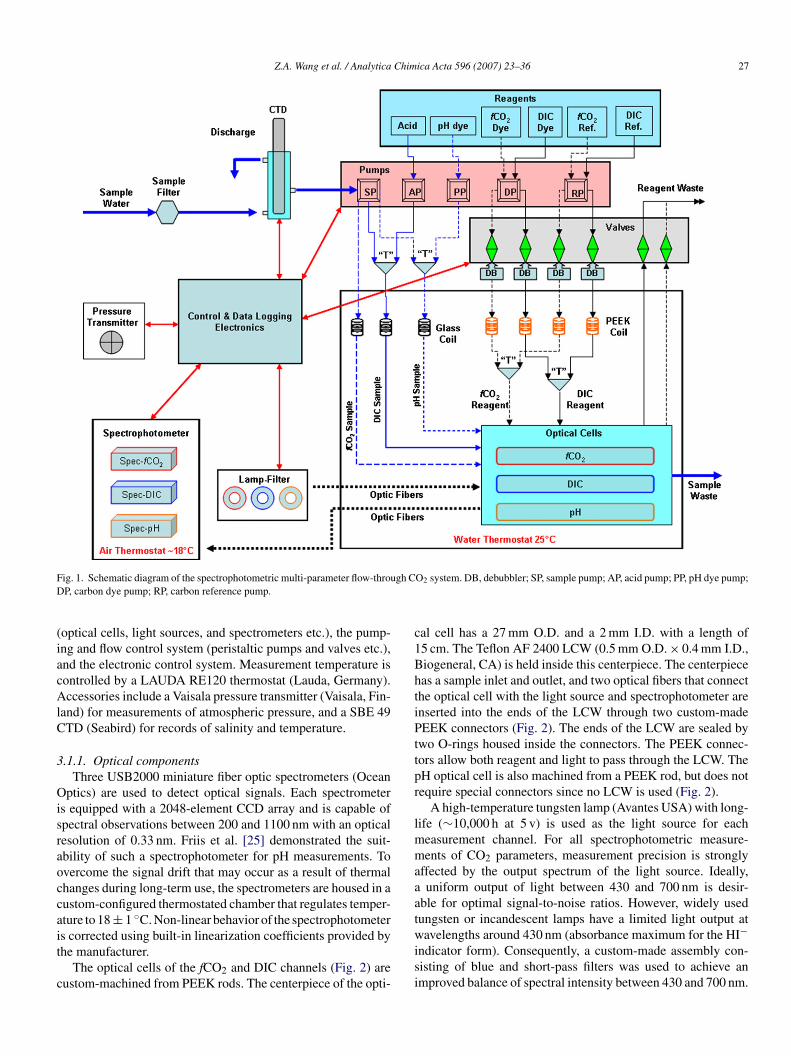
Z.A. Wang et al. / Analytica Chimica Acta 596 (2007) 23–36 27
F gh CD
(iacAlC
3
Oisraoccait
c
c1BhtiPttpr
lmmaaat
ig. 1. Schematic diagram of the spectrophotometric multi-parameter flow-throuP, carbon dye pump; RP, carbon reference pump.
optical cells, light sources, and spectrometers etc.), the pump-ng and flow control system (peristaltic pumps and valves etc.),nd the electronic control system. Measurement temperature isontrolled by a LAUDA RE120 thermostat (Lauda, Germany).ccessories include a Vaisala pressure transmitter (Vaisala, Fin-
and) for measurements of atmospheric pressure, and a SBE 49TD (Seabird) for records of salinity and temperature.
.1.1. Optical componentsThree USB2000 miniature fiber optic spectrometers (Ocean
ptics) are used to detect optical signals. Each spectrometers equipped with a 2048-element CCD array and is capable ofpectral observations between 200 and 1100 nm with an opticalesolution of 0.33 nm. Friis et al. [25] demonstrated the suit-bility of such a spectrophotometer for pH measurements. Tovercome the signal drift that may occur as a result of thermalhanges during long-term use, the spectrometers are housed in austom-configured thermostated chamber that regulates temper-ture to 18± 1 ◦C. Non-linear behavior of the spectrophotometer
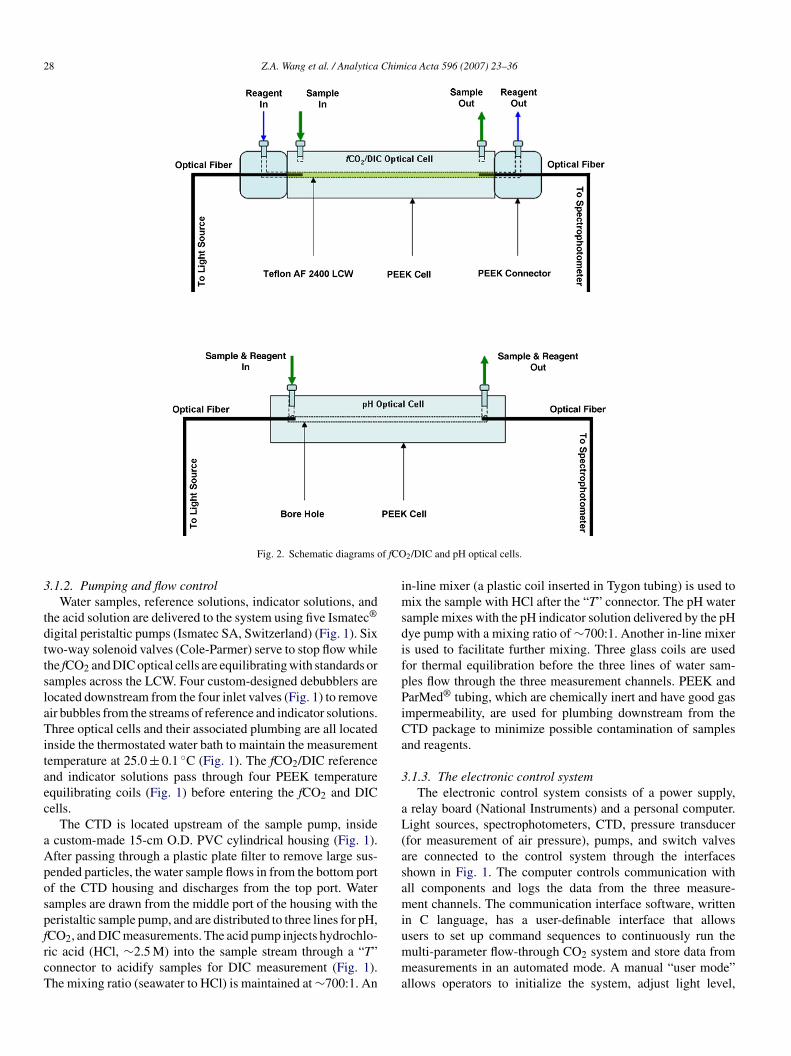
s corrected using built-in linearization coefficients provided byhe manufacturer.The optical cells of the fCO2 and DIC channels (Fig. 2) areustom-machined from PEEK rods. The centerpiece of the opti-
wisi
O2 system. DB, debubbler; SP, sample pump; AP, acid pump; PP, pH dye pump;
al cell has a 27 mm O.D. and a 2 mm I.D. with a length of5 cm. The Teflon AF 2400 LCW (0.5 mm O.D.× 0.4 mm I.D.,iogeneral, CA) is held inside this centerpiece. The centerpieceas a sample inlet and outlet, and two optical fibers that connecthe optical cell with the light source and spectrophotometer arenserted into the ends of the LCW through two custom-madeEEK connectors (Fig. 2). The ends of the LCW are sealed by
wo O-rings housed inside the connectors. The PEEK connec-ors allow both reagent and light to pass through the LCW. TheH optical cell is also machined from a PEEK rod, but does notequire special connectors since no LCW is used (Fig. 2).
A high-temperature tungsten lamp (Avantes USA) with long-ife (∼10,000 h at 5 v) is used as the light source for each
easurement channel. For all spectrophotometric measure-ents of CO2 parameters, measurement precision is strongly
ffected by the output spectrum of the light source. Ideally,uniform output of light between 430 and 700 nm is desir-
ble for optimal signal-to-noise ratios. However, widely usedungsten or incandescent lamps have a limited light output at
avelengths around 430 nm (absorbance maximum for the HI−ndicator form). Consequently, a custom-made assembly con-isting of blue and short-pass filters was used to achieve anmproved balance of spectral intensity between 430 and 700 nm.
28 Z.A. Wang et al. / Analytica Chimica Acta 596 (2007) 23–36
f fCO
3
tdttslaTitaec
aApospfrcT
imsdifpPiCa
3
aL(asami
Fig. 2. Schematic diagrams o
.1.2. Pumping and flow controlWater samples, reference solutions, indicator solutions, and
he acid solution are delivered to the system using five Ismatec®
igital peristaltic pumps (Ismatec SA, Switzerland) (Fig. 1). Sixwo-way solenoid valves (Cole-Parmer) serve to stop flow whilehe fCO2 and DIC optical cells are equilibrating with standards oramples across the LCW. Four custom-designed debubblers areocated downstream from the four inlet valves (Fig. 1) to removeir bubbles from the streams of reference and indicator solutions.hree optical cells and their associated plumbing are all located
nside the thermostated water bath to maintain the measurementemperature at 25.0± 0.1 ◦C (Fig. 1). The fCO2/DIC referencend indicator solutions pass through four PEEK temperaturequilibrating coils (Fig. 1) before entering the fCO2 and DICells.
The CTD is located upstream of the sample pump, insidecustom-made 15-cm O.D. PVC cylindrical housing (Fig. 1).fter passing through a plastic plate filter to remove large sus-ended particles, the water sample flows in from the bottom portf the CTD housing and discharges from the top port. Wateramples are drawn from the middle port of the housing with theeristaltic sample pump, and are distributed to three lines for pH,
CO2, and DIC measurements. The acid pump injects hydrochlo-ic acid (HCl, ∼2.5 M) into the sample stream through a “T”onnector to acidify samples for DIC measurement (Fig. 1).he mixing ratio (seawater to HCl) is maintained at∼700:1. Anumma
2/DIC and pH optical cells.
n-line mixer (a plastic coil inserted in Tygon tubing) is used toix the sample with HCl after the “T” connector. The pH water
ample mixes with the pH indicator solution delivered by the pHye pump with a mixing ratio of∼700:1. Another in-line mixers used to facilitate further mixing. Three glass coils are usedor thermal equilibration before the three lines of water sam-les flow through the three measurement channels. PEEK andarMed® tubing, which are chemically inert and have good gas
mpermeability, are used for plumbing downstream from theTD package to minimize possible contamination of samplesnd reagents.
.1.3. The electronic control systemThe electronic control system consists of a power supply,
relay board (National Instruments) and a personal computer.ight sources, spectrophotometers, CTD, pressure transducer
for measurement of air pressure), pumps, and switch valvesre connected to the control system through the interfaceshown in Fig. 1. The computer controls communication withll components and logs the data from the three measure-ent channels. The communication interface software, written
n C language, has a user-definable interface that allows
sers to set up command sequences to continuously run theulti-parameter flow-through CO2 system and store data fromeasurements in an automated mode. A manual “user mode”llows operators to initialize the system, adjust light level,
Chim
st
3
bCcoiH
mwibtBtmbaFatsisRp
DgpFnbitofHs
(cRmpiaWbtwp
3
g8atocc3
gaTgaw
eI(sTch
cfniubmc
abjTffpfNfh2hbf
3
Z.A. Wang et al. / Analytica
et operation parameters, and check the stability of the sys-em.
.2. Reagents and storage
Sodium salts of phenol red (fCO2 measurement) andromocresol purple (DIC measurement) (Sigma–Aldrich, ACSertified) are dissolved in Milli-Q water to make 4–8 mM indi-ator stock solutions. The indicator stock solutions are stored inpaque glass bottles at room temperature. The R ratios of thendicator stock solutions are adjusted to∼1.0 with 1 N NaOH orCl solution to minimize indicator-induced pH perturbations.The working indicator solutions for fCO2 and DIC measure-
ents are prepared from indicator stock solutions in Milli-Qater within 20 L glass bottles. Final indicator concentrations
n the working solutions are ∼2 �M for both phenol red andromocresol purple. The total alkalinity of the indicator solu-ions is established by addition of ultra-purified Na2CO3 (J.T.aker, Ultrex Ultrapure). The final total alkalinity of the indica-
or solutions is near 225 and 1000 �mol kg−1 for fCO2 and DICeasurements, respectively. Total alkalinity values are chosen
ased on calculations to insure that indicator solutions are suit-ble for measurements with a wide range of fCO2 and DIC.inally, 10 mL of 10% lauryl sulfate sodium salt solution isdded to each bottle of indicator solution. Lauryl sulfate func-ions as a surfactant to overcome the hydrophobic properties ofulfonephthalein indicators, which may create non-ideal behav-or in conjunction with use of Teflon AF to measure pH [14]. Theurfactant also serves to clean Teflon AF 2400 LCW surfaces.eference solutions for fCO2 and DIC measurements are pre-ared using identical procedures but without added indicators.
The working indicator and reference solutions for fCO2 andIC measurements are enclosed in 4 L (maximum capacity)as-impermeable laminated bags (Pollution Measurement Cor-oration) before use. The bag consists of an inner layer of TeflonEP film and an outer layer of aluminum. The bags also elimi-ate light intrusion. Bagged solutions are refrigerated at 4–7 ◦Cefore use and all measurements and calibrations are performedn an air-conditioned room. Under such conditions, laboratoryests show that bagged solutions can last at least a month with-ut appreciable changes of composition. The 2.5 M HCl usedor acidifying DIC samples is prepared by diluting concentratedCl (Baker, ACS Certified) with Milli-Q water. This acid is
tored in 500 mL glass bottles.For pH measurements, the sodium salt of thymol blue
Sigma–Aldrich, ACS Certified) is used to make working indi-ator solutions with concentrations between 1.5–2.0 mM. Theratio of each indicator solution is adjusted (R∼ 0.77) to mini-ize the magnitude of indicator-induced pH perturbations. Each
H indicator solution is stored in 500 mL gas-impermeable lam-nated bags. No surfactant is added to these indicator solutionss it is not required in conjunction with use of PEEK tubing [14].ith the current sample/indicator mixing ratio, the final thymol
lue concentration in the pH measurement cell is∼2–3 �M. Forhe pH range encountered in this work, indicator perturbationsere generally smaller than ±0.001 [20], which is within therecision of the instrument.
tC
ica Acta 596 (2007) 23–36 29
.3. Calibration
The fCO2 channel is calibrated with several air-balanced CO2as standards (Airgas) providing fCO2 values between 257 and09 �atm. These are initially calibrated against a high-accuracyir-balanced CO2 standard (454.77± 0.04 �atm) obtained fromhe Climate Monitoring Division of Earth System Research Lab-ratory (ESRL) of NOAA at Boulder, CO. These calibrations areonducted using a Li-COR 7000 CO2/H2O analyzer with a pre-ision better than ±1.0 �atm. The gas flow rate is controlled at0 mL min−1 using a mass flow controller (Aalborg).
The fCO2 channel is connected directly to each standard CO2as cylinder during calibration. Each standard gas flows throughlarge copper coil placed inside the thermostated water bath.he sample chamber of the fCO2 channel is flushed with dryas before calibration to remove any water vapor. The slope, a,nd the intercept, b, in Eq. (16) are derived from calibrationsith each batch of phenol red solution.The DIC channel is calibrated against the Certified Refer-
nce Material (CRM) from Dr. A.G. Dickson at the Scrippsnstitution of Oceanography, La Jolla, CA to obtain the constantB) in Eq. (23) for a particular batch of bromocresol purpleolution. All other constants are obtained from literature.he thymol blue used for pH measurements does not requirealibration since all inherent characteristics of thymol blueave been established previously [20].
As long as the compositions (total alkalinity) of the indi-ator solutions (phenol red and bromocresol purple) used forCO2 and DIC measurements do not change, re-calibration isot required during field measurements. However, since changesn the total alkalinity of indicator solutions can be encounterednexpectedly (e.g. due to mechanically compromised reagentags), indicator solutions are periodically monitored during fieldeasurements for consistency with laboratory calibrations. Re-
alibration is implemented as necessary.For the NOAA A16S cruise, the indicator solutions for fCO2
nd DIC measurements were checked for calibration consistencyy measuring a NOAA CO2 standard and a DIC standard (CRM)ust prior to embarkation and every 3–4 days during the cruise.he initial onboard check revealed that fCO2 readings were dif-
erent from calibrations in the laboratory. This may have resultedrom fCO2 indicator solution composition changes during trans-ortation. The fCO2 channel was therefore re-calibrated usingour CO2 gas standards (NOAA) during transit to the first station.o statistically significant changes in calibration were detected
or any indicator reagent bag during the cruise. Between bags,owever, calibration consistency checks sometimes revealed–3% differences. It is suspected that minor contamination mayave occurred when solutions were dispatched from large glassottles to the reagent bags. In such cases, the fCO2 channel wasully recalibrated using four CO2 gas standards (NOAA).
.4. Operational procedures
During measurements the interface software runs a repeti-ive sequence of commands to the multi-parameter flow-throughO2 system as summarized below:
3 Chimica Acta 596 (2007) 23–36
(((
rmnfWm
srtmDTSm
3
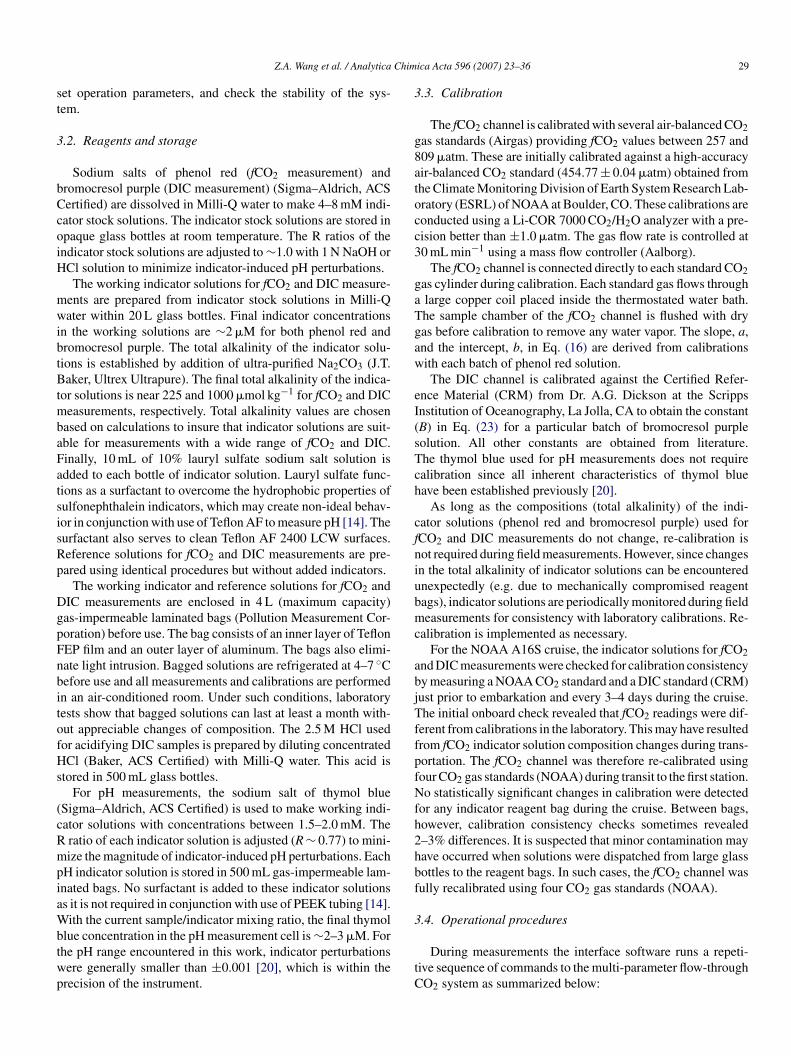
tassurfo
Fig. 3. The cruise track and sampling stations for CLIVAR A16S 2005. Thecto
ft1tm
3
oAaTHi(Cdcdtcfmstfl
0 Z.A. Wang et al. / Analytica
(1) All solenoid valves are initialized. Lights are turned on forstabilization (∼10 min).
(2) The sample and acid pumps are activated (<1 s).(3) Seawater is continuously flushed through all measurement
channels. For the pH channel, seawater without thymolblue serves as an absorbance reference (∼2 min).
(4) Solenoid valves associated with the fCO2 and DIC refer-ence solutions (reagent solutions with no added indicators)are opened. The carbon reference pump is turned on to flushreference solutions through the fCO2 and DIC channels(∼3 min).
(5) Solenoid valves are closed. References for all three chan-nels are recorded and logged (∼0.5 min).
(6) The pH dye pump is turned on and thymol blue solution isinjected into the seawater sample stream (<1 s).
(7) Solenoid valves associated with the fCO2 and DIC indi-cator solutions are opened. The carbon dye pump injectsindicator solutions into the fCO2 and DIC channels. Sea-water samples for pH measurements mix with thymol blue(1.5–3 min).
(8) Solenoid valves are closed. fCO2 and DIC samples equi-librate with the indicator solutions across the LCW(∼7 min).
(9) All measurements are recorded (∼10 s).10) Steps 7–9 are repeated five times.11) The pH dye pump is stopped (<1 s).12) One measurement cycle ends. The sequence repeats from
Step 3.
A single measurement cycle requires about 1 h before neweferences are taken for the next cycle. The current measure-ent frequency is 7–8 samples per hour for each parameter. It is
oted that pH measurements can have much higher measurementrequency because pH indicator equilibration is instantaneous.
e chose lower measurement frequency for the pH channel toatch fCO2 and DIC measurement frequencies.During calibration of the phenol red solution for fCO2 mea-
urements, the fCO2 seawater sample line is disconnected andinsed with Milli-Q water. CO2 standard gas is then passedhrough the sample-passage external to the fCO2 LCW. For DIC
easurements, CRM, instead of seawater, is directed through theIC channel for calibration of the bromocresol purple solution.he above running sequence does not change during calibration.witches between samples and calibration materials were madeanually.
.5. Sample and reagent consumption
One advantage of the multi-parameter flow-through CO2 sys-em is that it generally consumes small quantities of samplesnd reagents during measurements. With current sample pumpettings, each measurement channel only consumes ∼10 mL ofeawater per minute. For the indicator and reference solutions
sed during fCO2 and DIC measurements, the consumptionate with the current running sequence is ∼12 mL h−1. EachCO2/DIC indicator or reference bag then provides 10–14 daysf uninterrupted measurements. With mixing ratios of ∼700svd(
ircles indicate the hydrographic sampling stations, and the solid line showshe track where the USF underway measurements of fCO2, DIC, and pH werebtained.
or both pH measurements and acidification of DIC samples,he consumption rate for HCl and pH indicator solution is0 �L min−1. The 500 mL bottles of HCl or pH indicator solu-ion typically used with the system thus permits continuous
easurements for a period of 1 month.
.6. Underway measurements
The multi-parameter flow-through CO2 system was testedn board the NOAA R/V Ronald H. Brown during the CLIVAR16S 2005 hydrographic survey (11 January 2005–24 Febru-
ry 2005) between Punta Arenas, Chile and Fortaleza, Brazil.he survey was a component of the U.S. CLIVAR/CO2 Repeatydrography Program [26]. The cruise transect was merid-
onal from 60◦S to 2◦S in the western South Atlantic OceanFig. 3). A total of 121 CTD/Rosette stations were occupied.O2 system parameters for surface water were measured byifferent research groups using established methods [1] eitherontinuously (underway fCO2) or discretely (pH, DIC, and TA)uring the cruise. Table 1 summarizes the methods used andhe institutions that were involved in measurements during theruise. The cruise provided an ideal platform to test the per-ormance of our instrument and to compare our automatedeasurements with conventional measurements obtained using
tandard methods. The AOML underway pCO2 system sharedhe same underway seawater stream with our multi-parameterow-through CO2 system, while surface pH and DIC discrete
amples were obtained from the CTD/Rosette casts at indi-idual stations. All sampling and measurement protocols areescribed in detail in the cruise report of the CLIVAR A16S 2005http://www.aoml.noaa.gov/ocd/gcc/a16s/). The final AOML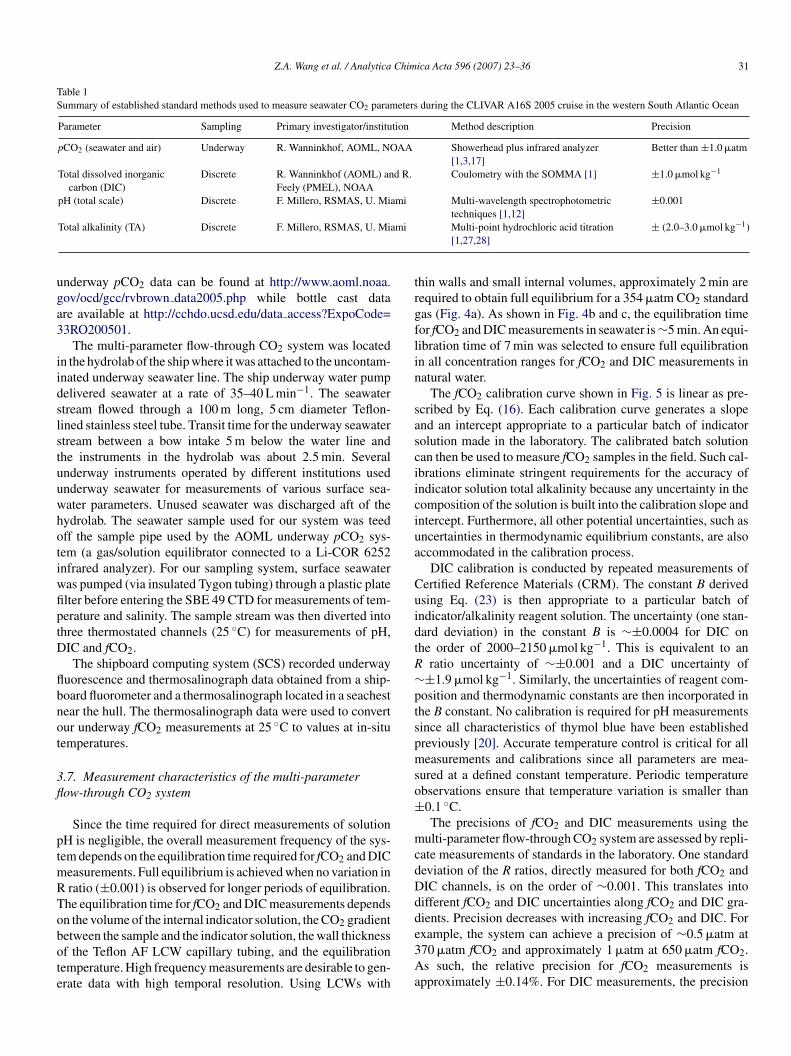
Z.A. Wang et al. / Analytica Chimica Acta 596 (2007) 23–36 31
Table 1Summary of established standard methods used to measure seawater CO2 parameters during the CLIVAR A16S 2005 cruise in the western South Atlantic Ocean
Parameter Sampling Primary investigator/institution Method description Precision
pCO2 (seawater and air) Underway R. Wanninkhof, AOML, NOAA Showerhead plus infrared analyzer[1,3,17]
Better than ±1.0 �atm
Total dissolved inorganiccarbon (DIC)
Discrete R. Wanninkhof (AOML) and R.Feely (PMEL), NOAA
Coulometry with the SOMMA [1] ±1.0 �mol kg−1
pH (total scale) Discrete F. Millero, RSMAS, U. Miami Multi-wavelength spectrophotometric ±0.001
mi
uga3
iidslstuuwhotiwfiptD
flbnot
3fl
ptmRTobote
trgflin
sasciiciua
CuidtR∼ptspmso±
mcdDdd
Total alkalinity (TA) Discrete F. Millero, RSMAS, U. Mia
nderway pCO2 data can be found at http://www.aoml.noaa.ov/ocd/gcc/rvbrown data2005.php while bottle cast datare available at http://cchdo.ucsd.edu/data access?ExpoCode=3RO200501.
The multi-parameter flow-through CO2 system was locatedn the hydrolab of the ship where it was attached to the uncontam-nated underway seawater line. The ship underway water pumpelivered seawater at a rate of 35–40 L min−1. The seawatertream flowed through a 100 m long, 5 cm diameter Teflon-ined stainless steel tube. Transit time for the underway seawatertream between a bow intake 5 m below the water line andhe instruments in the hydrolab was about 2.5 min. Severalnderway instruments operated by different institutions usednderway seawater for measurements of various surface sea-ater parameters. Unused seawater was discharged aft of theydrolab. The seawater sample used for our system was teedff the sample pipe used by the AOML underway pCO2 sys-em (a gas/solution equilibrator connected to a Li-COR 6252nfrared analyzer). For our sampling system, surface seawateras pumped (via insulated Tygon tubing) through a plastic platelter before entering the SBE 49 CTD for measurements of tem-erature and salinity. The sample stream was then diverted intohree thermostated channels (25 ◦C) for measurements of pH,IC and fCO2.The shipboard computing system (SCS) recorded underway
uorescence and thermosalinograph data obtained from a ship-oard fluorometer and a thermosalinograph located in a seachestear the hull. The thermosalinograph data were used to convertur underway fCO2 measurements at 25 ◦C to values at in-situemperatures.
.7. Measurement characteristics of the multi-parameterow-through CO2 system
Since the time required for direct measurements of solutionH is negligible, the overall measurement frequency of the sys-em depends on the equilibration time required for fCO2 and DIC
easurements. Full equilibrium is achieved when no variation inratio (±0.001) is observed for longer periods of equilibration.
he equilibration time for fCO2 and DIC measurements dependsn the volume of the internal indicator solution, the CO2 gradient
etween the sample and the indicator solution, the wall thicknessf the Teflon AF LCW capillary tubing, and the equilibrationemperature. High frequency measurements are desirable to gen-rate data with high temporal resolution. Using LCWs withe3Aa
techniques [1,12]Multi-point hydrochloric acid titration[1,27,28]
± (2.0–3.0 �mol kg−1)
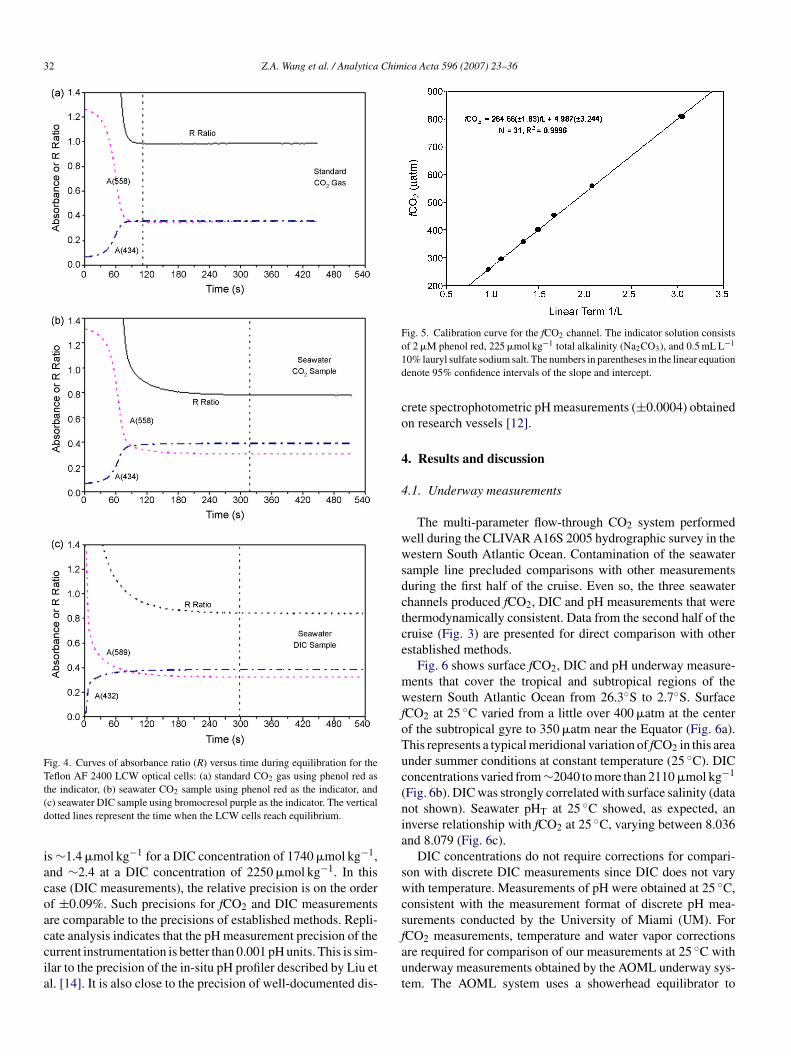
hin walls and small internal volumes, approximately 2 min areequired to obtain full equilibrium for a 354 �atm CO2 standardas (Fig. 4a). As shown in Fig. 4b and c, the equilibration timeor fCO2 and DIC measurements in seawater is∼5 min. An equi-ibration time of 7 min was selected to ensure full equilibrationn all concentration ranges for fCO2 and DIC measurements inatural water.
The fCO2 calibration curve shown in Fig. 5 is linear as pre-cribed by Eq. (16). Each calibration curve generates a slopend an intercept appropriate to a particular batch of indicatorolution made in the laboratory. The calibrated batch solutionan then be used to measure fCO2 samples in the field. Such cal-brations eliminate stringent requirements for the accuracy ofndicator solution total alkalinity because any uncertainty in theomposition of the solution is built into the calibration slope andntercept. Furthermore, all other potential uncertainties, such asncertainties in thermodynamic equilibrium constants, are alsoccommodated in the calibration process.
DIC calibration is conducted by repeated measurements ofertified Reference Materials (CRM). The constant B derivedsing Eq. (23) is then appropriate to a particular batch ofndicator/alkalinity reagent solution. The uncertainty (one stan-ard deviation) in the constant B is ∼±0.0004 for DIC onhe order of 2000–2150 �mol kg−1. This is equivalent to an
ratio uncertainty of ∼±0.001 and a DIC uncertainty of±1.9 �mol kg−1. Similarly, the uncertainties of reagent com-
osition and thermodynamic constants are then incorporated inhe B constant. No calibration is required for pH measurementsince all characteristics of thymol blue have been establishedreviously [20]. Accurate temperature control is critical for alleasurements and calibrations since all parameters are mea-
ured at a defined constant temperature. Periodic temperaturebservations ensure that temperature variation is smaller than0.1 ◦C.The precisions of fCO2 and DIC measurements using the
ulti-parameter flow-through CO2 system are assessed by repli-ate measurements of standards in the laboratory. One standardeviation of the R ratios, directly measured for both fCO2 andIC channels, is on the order of ∼0.001. This translates intoifferent fCO2 and DIC uncertainties along fCO2 and DIC gra-ients. Precision decreases with increasing fCO2 and DIC. For
xample, the system can achieve a precision of ∼0.5 �atm at70 �atm fCO2 and approximately 1 �atm at 650 �atm fCO2.s such, the relative precision for fCO2 measurements ispproximately ±0.14%. For DIC measurements, the precision
32 Z.A. Wang et al. / Analytica Chimica Acta 596 (2007) 23–36
Fig. 4. Curves of absorbance ratio (R) versus time during equilibration for theTeflon AF 2400 LCW optical cells: (a) standard CO2 gas using phenol red ast(d
iacoaccia
Fig. 5. Calibration curve for the fCO2 channel. The indicator solution consistso1d
co
4
4
wwsdctce
mwfoTuc(nia
swcs
he indicator, (b) seawater CO2 sample using phenol red as the indicator, andc) seawater DIC sample using bromocresol purple as the indicator. The verticalotted lines represent the time when the LCW cells reach equilibrium.
s∼1.4 �mol kg−1 for a DIC concentration of 1740 �mol kg−1,nd ∼2.4 at a DIC concentration of 2250 �mol kg−1. In thisase (DIC measurements), the relative precision is on the orderf ±0.09%. Such precisions for fCO2 and DIC measurementsre comparable to the precisions of established methods. Repli-
ate analysis indicates that the pH measurement precision of theurrent instrumentation is better than 0.001 pH units. This is sim-lar to the precision of the in-situ pH profiler described by Liu etl. [14]. It is also close to the precision of well-documented dis-faut
f 2 �M phenol red, 225 �mol kg−1 total alkalinity (Na2CO3), and 0.5 mL L−1
0% lauryl sulfate sodium salt. The numbers in parentheses in the linear equationenote 95% confidence intervals of the slope and intercept.
rete spectrophotometric pH measurements (±0.0004) obtainedn research vessels [12].
. Results and discussion
.1. Underway measurements
The multi-parameter flow-through CO2 system performedell during the CLIVAR A16S 2005 hydrographic survey in theestern South Atlantic Ocean. Contamination of the seawater
ample line precluded comparisons with other measurementsuring the first half of the cruise. Even so, the three seawaterhannels produced fCO2, DIC and pH measurements that werehermodynamically consistent. Data from the second half of theruise (Fig. 3) are presented for direct comparison with otherstablished methods.
Fig. 6 shows surface fCO2, DIC and pH underway measure-ents that cover the tropical and subtropical regions of theestern South Atlantic Ocean from 26.3◦S to 2.7◦S. Surface
CO2 at 25 ◦C varied from a little over 400 �atm at the centerf the subtropical gyre to 350 �atm near the Equator (Fig. 6a).his represents a typical meridional variation of fCO2 in this areander summer conditions at constant temperature (25 ◦C). DIConcentrations varied from∼2040 to more than 2110 �mol kg−1
Fig. 6b). DIC was strongly correlated with surface salinity (dataot shown). Seawater pHT at 25 ◦C showed, as expected, annverse relationship with fCO2 at 25 ◦C, varying between 8.036nd 8.079 (Fig. 6c).
DIC concentrations do not require corrections for compari-on with discrete DIC measurements since DIC does not varyith temperature. Measurements of pH were obtained at 25 ◦C,
onsistent with the measurement format of discrete pH mea-urements conducted by the University of Miami (UM). For
CO2 measurements, temperature and water vapor correctionsre required for comparison of our measurements at 25 ◦C withnderway measurements obtained by the AOML underway sys-em. The AOML system uses a showerhead equilibrator to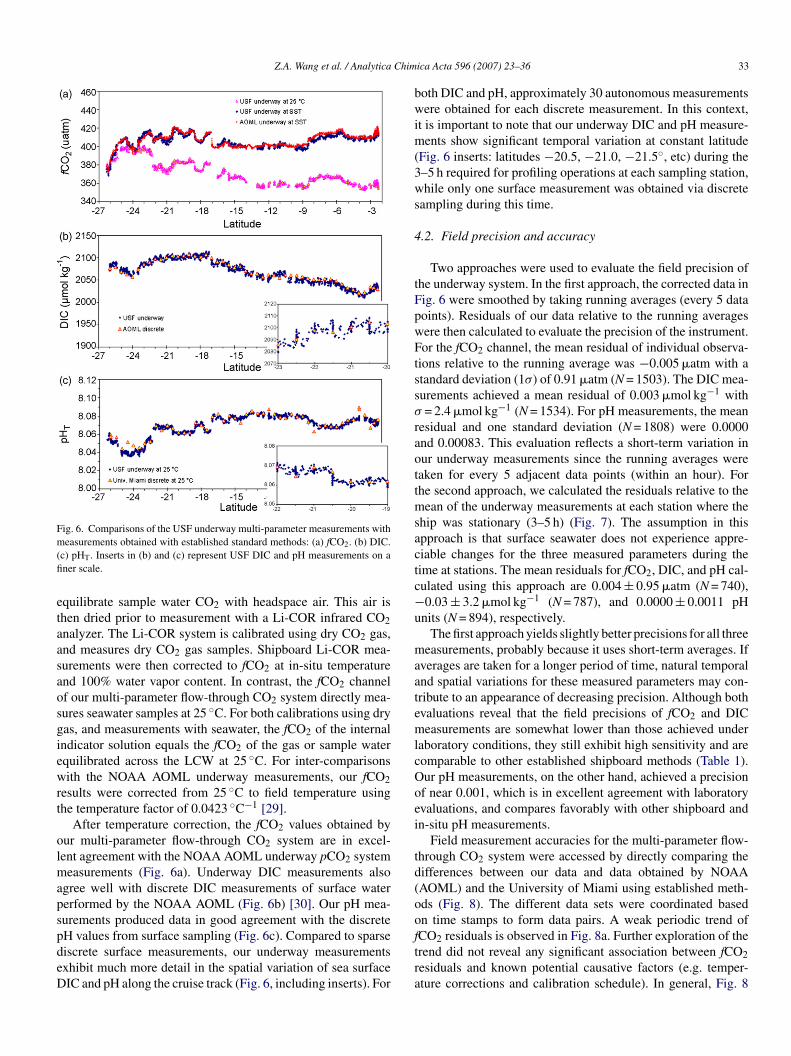
Z.A. Wang et al. / Analytica Chim
Fig. 6. Comparisons of the USF underway multi-parameter measurements withm(fi
etaasaosgiewrt
olmapspdeD
bwim(3ws
4
tFpwFtssσ
raottmsactc−u
maatemlcOoei
td(oo
easurements obtained with established standard methods: (a) fCO2. (b) DIC.c) pHT. Inserts in (b) and (c) represent USF DIC and pH measurements on aner scale.
quilibrate sample water CO2 with headspace air. This air ishen dried prior to measurement with a Li-COR infrared CO2nalyzer. The Li-COR system is calibrated using dry CO2 gas,nd measures dry CO2 gas samples. Shipboard Li-COR mea-urements were then corrected to fCO2 at in-situ temperaturend 100% water vapor content. In contrast, the fCO2 channelf our multi-parameter flow-through CO2 system directly mea-ures seawater samples at 25 ◦C. For both calibrations using dryas, and measurements with seawater, the fCO2 of the internalndicator solution equals the fCO2 of the gas or sample waterquilibrated across the LCW at 25 ◦C. For inter-comparisonsith the NOAA AOML underway measurements, our fCO2
esults were corrected from 25 ◦C to field temperature usinghe temperature factor of 0.0423 ◦C−1 [29].
After temperature correction, the fCO2 values obtained byur multi-parameter flow-through CO2 system are in excel-ent agreement with the NOAA AOML underway pCO2 system
easurements (Fig. 6a). Underway DIC measurements alsogree well with discrete DIC measurements of surface watererformed by the NOAA AOML (Fig. 6b) [30]. Our pH mea-urements produced data in good agreement with the discrete
H values from surface sampling (Fig. 6c). Compared to sparseiscrete surface measurements, our underway measurementsxhibit much more detail in the spatial variation of sea surfaceIC and pH along the cruise track (Fig. 6, including inserts). Forftra
ica Acta 596 (2007) 23–36 33
oth DIC and pH, approximately 30 autonomous measurementsere obtained for each discrete measurement. In this context,
t is important to note that our underway DIC and pH measure-ents show significant temporal variation at constant latitude
Fig. 6 inserts: latitudes −20.5, −21.0, −21.5◦, etc) during the–5 h required for profiling operations at each sampling station,hile only one surface measurement was obtained via discrete
ampling during this time.
.2. Field precision and accuracy
Two approaches were used to evaluate the field precision ofhe underway system. In the first approach, the corrected data inig. 6 were smoothed by taking running averages (every 5 dataoints). Residuals of our data relative to the running averagesere then calculated to evaluate the precision of the instrument.or the fCO2 channel, the mean residual of individual observa-
ions relative to the running average was −0.005 �atm with atandard deviation (1σ) of 0.91 �atm (N = 1503). The DIC mea-urements achieved a mean residual of 0.003 �mol kg−1 with= 2.4 �mol kg−1 (N = 1534). For pH measurements, the mean
esidual and one standard deviation (N = 1808) were 0.0000nd 0.00083. This evaluation reflects a short-term variation inur underway measurements since the running averages wereaken for every 5 adjacent data points (within an hour). Forhe second approach, we calculated the residuals relative to the
ean of the underway measurements at each station where thehip was stationary (3–5 h) (Fig. 7). The assumption in thispproach is that surface seawater does not experience appre-iable changes for the three measured parameters during theime at stations. The mean residuals for fCO2, DIC, and pH cal-ulated using this approach are 0.004± 0.95 �atm (N = 740),0.03± 3.2 �mol kg−1 (N = 787), and 0.0000± 0.0011 pH
nits (N = 894), respectively.The first approach yields slightly better precisions for all three
easurements, probably because it uses short-term averages. Ifverages are taken for a longer period of time, natural temporalnd spatial variations for these measured parameters may con-ribute to an appearance of decreasing precision. Although bothvaluations reveal that the field precisions of fCO2 and DICeasurements are somewhat lower than those achieved under
aboratory conditions, they still exhibit high sensitivity and areomparable to other established shipboard methods (Table 1).ur pH measurements, on the other hand, achieved a precisionf near 0.001, which is in excellent agreement with laboratoryvaluations, and compares favorably with other shipboard andn-situ pH measurements.
Field measurement accuracies for the multi-parameter flow-hrough CO2 system were accessed by directly comparing theifferences between our data and data obtained by NOAAAOML) and the University of Miami using established meth-ds (Fig. 8). The different data sets were coordinated basedn time stamps to form data pairs. A weak periodic trend of
CO2 residuals is observed in Fig. 8a. Further exploration of therend did not reveal any significant association between fCO2esiduals and known potential causative factors (e.g. temper-ture corrections and calibration schedule). In general, Fig. 8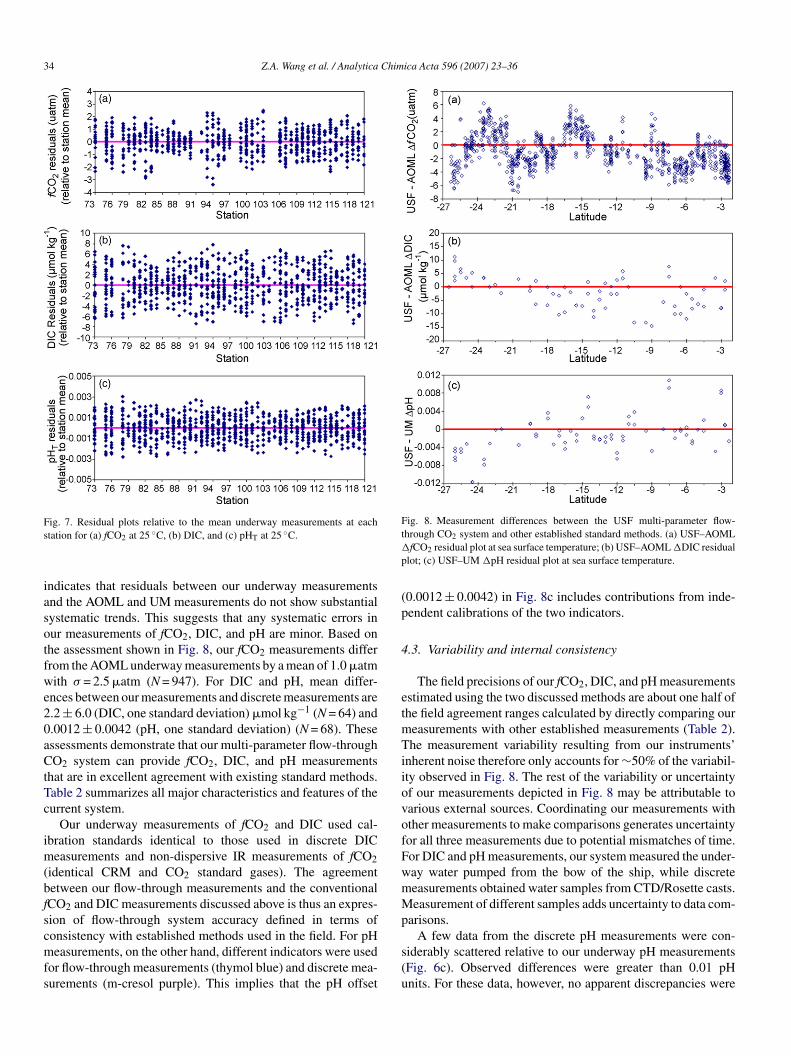
34 Z.A. Wang et al. / Analytica Chimica Acta 596 (2007) 23–36
Fs
iasotfwe20aCtTc
im(bfscmfs
Fig. 8. Measurement differences between the USF multi-parameter flow-t�
p
(p
4
etmTiiovofFwmMp
A few data from the discrete pH measurements were con-
ig. 7. Residual plots relative to the mean underway measurements at eachtation for (a) fCO2 at 25 ◦C, (b) DIC, and (c) pHT at 25 ◦C.
ndicates that residuals between our underway measurementsnd the AOML and UM measurements do not show substantialystematic trends. This suggests that any systematic errors inur measurements of fCO2, DIC, and pH are minor. Based onhe assessment shown in Fig. 8, our fCO2 measurements differrom the AOML underway measurements by a mean of 1.0 �atmith σ = 2.5 �atm (N = 947). For DIC and pH, mean differ-
nces between our measurements and discrete measurements are.2± 6.0 (DIC, one standard deviation) �mol kg−1 (N = 64) and.0012± 0.0042 (pH, one standard deviation) (N = 68). Thesessessments demonstrate that our multi-parameter flow-throughO2 system can provide fCO2, DIC, and pH measurements
hat are in excellent agreement with existing standard methods.able 2 summarizes all major characteristics and features of theurrent system.
Our underway measurements of fCO2 and DIC used cal-bration standards identical to those used in discrete DIC
easurements and non-dispersive IR measurements of fCO2identical CRM and CO2 standard gases). The agreementetween our flow-through measurements and the conventionalCO2 and DIC measurements discussed above is thus an expres-ion of flow-through system accuracy defined in terms ofonsistency with established methods used in the field. For pH
easurements, on the other hand, different indicators were usedor flow-through measurements (thymol blue) and discrete mea-urements (m-cresol purple). This implies that the pH offset
s(u
hrough CO2 system and other established standard methods. (a) USF–AOMLfCO2 residual plot at sea surface temperature; (b) USF–AOML �DIC residual
lot; (c) USF–UM �pH residual plot at sea surface temperature.
0.0012± 0.0042) in Fig. 8c includes contributions from inde-endent calibrations of the two indicators.
.3. Variability and internal consistency
The field precisions of our fCO2, DIC, and pH measurementsstimated using the two discussed methods are about one half ofhe field agreement ranges calculated by directly comparing our
easurements with other established measurements (Table 2).he measurement variability resulting from our instruments’
nherent noise therefore only accounts for∼50% of the variabil-ty observed in Fig. 8. The rest of the variability or uncertaintyf our measurements depicted in Fig. 8 may be attributable toarious external sources. Coordinating our measurements withther measurements to make comparisons generates uncertaintyor all three measurements due to potential mismatches of time.or DIC and pH measurements, our system measured the under-ay water pumped from the bow of the ship, while discreteeasurements obtained water samples from CTD/Rosette casts.easurement of different samples adds uncertainty to data com-
arisons.
iderably scattered relative to our underway pH measurementsFig. 6c). Observed differences were greater than 0.01 pHnits. For these data, however, no apparent discrepancies were
Z.A. Wang et al. / Analytica Chimica Acta 596 (2007) 23–36 35
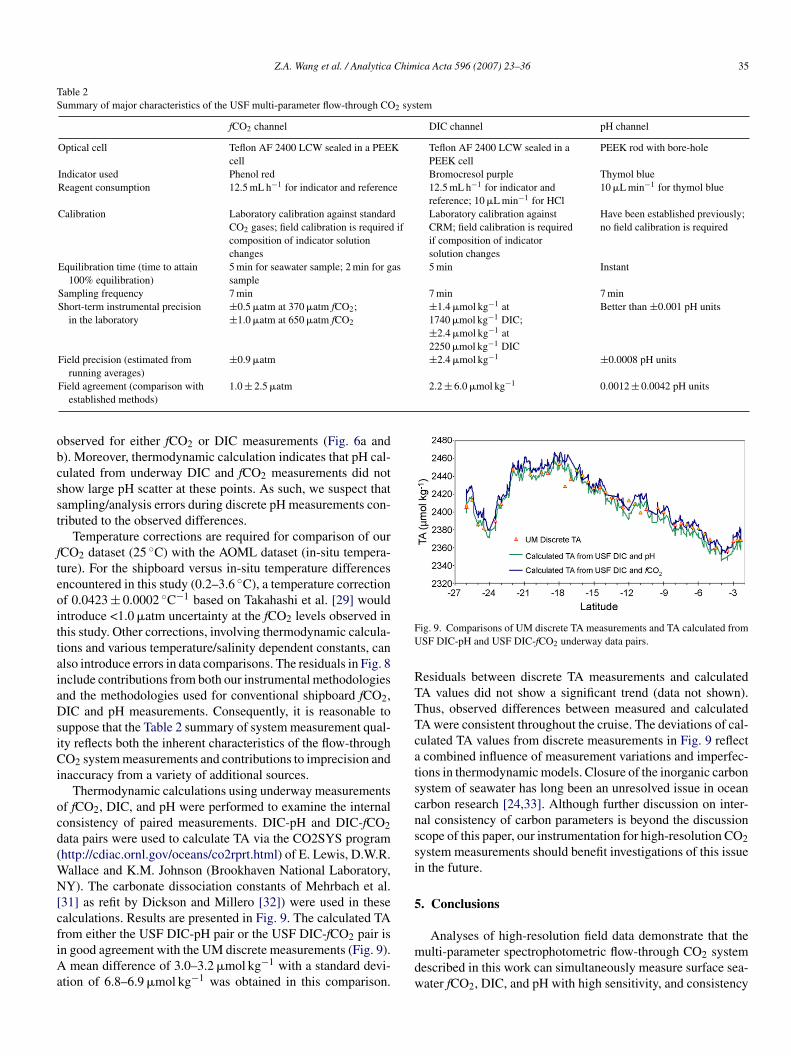
Table 2Summary of major characteristics of the USF multi-parameter flow-through CO2 system
fCO2 channel DIC channel pH channel
Optical cell Teflon AF 2400 LCW sealed in a PEEKcell
Teflon AF 2400 LCW sealed in aPEEK cell
PEEK rod with bore-hole
Indicator used Phenol red Bromocresol purple Thymol blueReagent consumption 12.5 mL h−1 for indicator and reference 12.5 mL h−1 for indicator and
reference; 10 �L min−1 for HCl10 �L min−1 for thymol blue
Calibration Laboratory calibration against standardCO2 gases; field calibration is required ifcomposition of indicator solutionchanges
Laboratory calibration againstCRM; field calibration is requiredif composition of indicatorsolution changes
Have been established previously;no field calibration is required
Equilibration time (time to attain100% equilibration)
5 min for seawater sample; 2 min for gassample
5 min Instant
Sampling frequency 7 min 7 min 7 minShort-term instrumental precision
in the laboratory±0.5 �atm at 370 �atm fCO2;±1.0 �atm at 650 �atm fCO2
±1.4 �mol kg−1 at1740 �mol kg−1 DIC;±2.4 �mol kg−1 at2250 �mol kg−1 DIC
Better than ±0.001 pH units
Field precision (estimated fromrunning averages)
±0.9 �atm ±2.4 �mol kg−1 ±0.0008 pH units
2.2± 6.0 �mol kg−1 0.0012± 0.0042 pH units
obcsst
fteoittaiaDsiCi
ocd(WN[cfiAa
FU
RTTTcatscnssi
5
Field agreement (comparison withestablished methods)
1.0± 2.5 �atm
bserved for either fCO2 or DIC measurements (Fig. 6a and). Moreover, thermodynamic calculation indicates that pH cal-ulated from underway DIC and fCO2 measurements did nothow large pH scatter at these points. As such, we suspect thatampling/analysis errors during discrete pH measurements con-ributed to the observed differences.
Temperature corrections are required for comparison of ourCO2 dataset (25 ◦C) with the AOML dataset (in-situ tempera-ure). For the shipboard versus in-situ temperature differencesncountered in this study (0.2–3.6 ◦C), a temperature correctionf 0.0423± 0.0002 ◦C−1 based on Takahashi et al. [29] wouldntroduce <1.0 �atm uncertainty at the fCO2 levels observed inhis study. Other corrections, involving thermodynamic calcula-ions and various temperature/salinity dependent constants, canlso introduce errors in data comparisons. The residuals in Fig. 8nclude contributions from both our instrumental methodologiesnd the methodologies used for conventional shipboard fCO2,IC and pH measurements. Consequently, it is reasonable to
uppose that the Table 2 summary of system measurement qual-ty reflects both the inherent characteristics of the flow-throughO2 system measurements and contributions to imprecision and
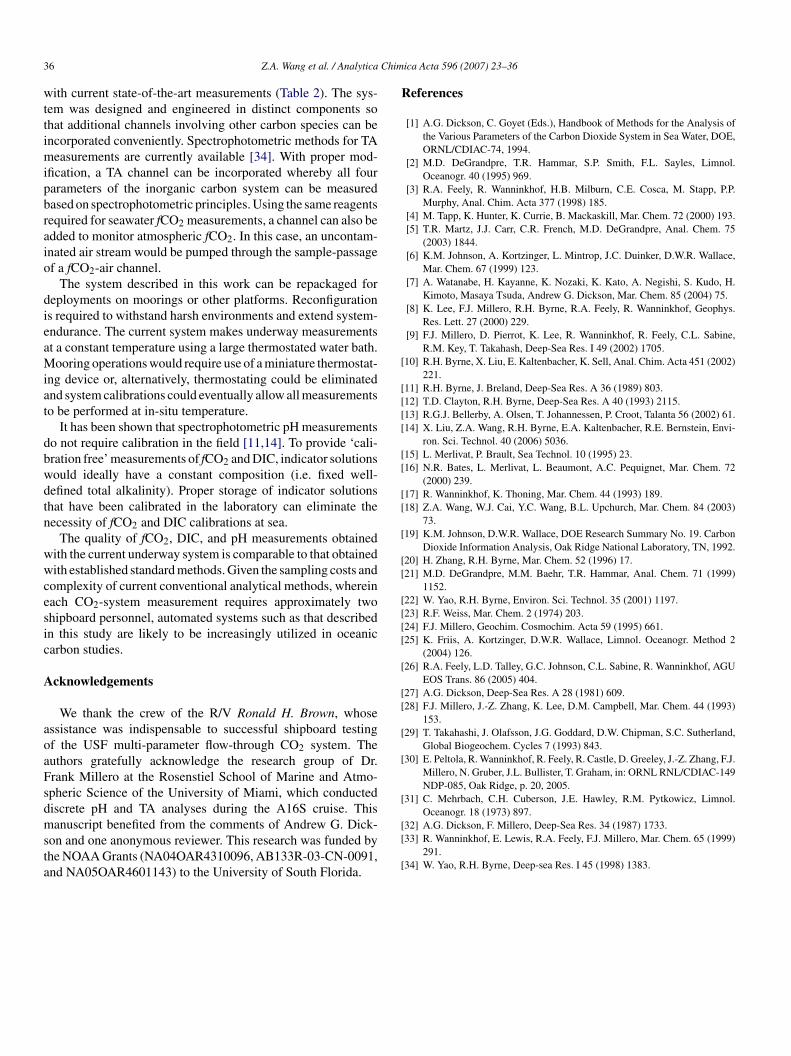
naccuracy from a variety of additional sources.Thermodynamic calculations using underway measurements
f fCO2, DIC, and pH were performed to examine the internalonsistency of paired measurements. DIC-pH and DIC-fCO2ata pairs were used to calculate TA via the CO2SYS programhttp://cdiac.ornl.gov/oceans/co2rprt.html) of E. Lewis, D.W.R.
allace and K.M. Johnson (Brookhaven National Laboratory,Y). The carbonate dissociation constants of Mehrbach et al.
31] as refit by Dickson and Millero [32]) were used in thesealculations. Results are presented in Fig. 9. The calculated TA
rom either the USF DIC-pH pair or the USF DIC-fCO2 pair isn good agreement with the UM discrete measurements (Fig. 9).mean difference of 3.0–3.2 �mol kg−1 with a standard devi-tion of 6.8–6.9 �mol kg−1 was obtained in this comparison.
mdw
ig. 9. Comparisons of UM discrete TA measurements and TA calculated fromSF DIC-pH and USF DIC-fCO2 underway data pairs.
esiduals between discrete TA measurements and calculatedA values did not show a significant trend (data not shown).hus, observed differences between measured and calculatedA were consistent throughout the cruise. The deviations of cal-ulated TA values from discrete measurements in Fig. 9 reflectcombined influence of measurement variations and imperfec-
ions in thermodynamic models. Closure of the inorganic carbonystem of seawater has long been an unresolved issue in oceanarbon research [24,33]. Although further discussion on inter-al consistency of carbon parameters is beyond the discussioncope of this paper, our instrumentation for high-resolution CO2ystem measurements should benefit investigations of this issuen the future.
. Conclusions
Analyses of high-resolution field data demonstrate that theulti-parameter spectrophotometric flow-through CO2 system
escribed in this work can simultaneously measure surface sea-ater fCO2, DIC, and pH with high sensitivity, and consistency
3 Chim
wttimipbraio
dieaMiat
dbwdtn
wwcesic
A
aoaFsdmsta
R
[
[[[[
[[
[[
[
[[
[[[[
[
[[
[
[
[Oceanogr. 18 (1973) 897.
6 Z.A. Wang et al. / Analytica
ith current state-of-the-art measurements (Table 2). The sys-em was designed and engineered in distinct components sohat additional channels involving other carbon species can bencorporated conveniently. Spectrophotometric methods for TA
easurements are currently available [34]. With proper mod-fication, a TA channel can be incorporated whereby all fourarameters of the inorganic carbon system can be measuredased on spectrophotometric principles. Using the same reagentsequired for seawater fCO2 measurements, a channel can also bedded to monitor atmospheric fCO2. In this case, an uncontam-nated air stream would be pumped through the sample-passagef a fCO2-air channel.
The system described in this work can be repackaged foreployments on moorings or other platforms. Reconfigurations required to withstand harsh environments and extend system-ndurance. The current system makes underway measurementst a constant temperature using a large thermostated water bath.ooring operations would require use of a miniature thermostat-
ng device or, alternatively, thermostating could be eliminatednd system calibrations could eventually allow all measurementso be performed at in-situ temperature.
It has been shown that spectrophotometric pH measurementso not require calibration in the field [11,14]. To provide ‘cali-ration free’ measurements of fCO2 and DIC, indicator solutionsould ideally have a constant composition (i.e. fixed well-efined total alkalinity). Proper storage of indicator solutionshat have been calibrated in the laboratory can eliminate theecessity of fCO2 and DIC calibrations at sea.
The quality of fCO2, DIC, and pH measurements obtainedith the current underway system is comparable to that obtainedith established standard methods. Given the sampling costs and
omplexity of current conventional analytical methods, whereinach CO2-system measurement requires approximately twohipboard personnel, automated systems such as that describedn this study are likely to be increasingly utilized in oceanicarbon studies.
cknowledgements
We thank the crew of the R/V Ronald H. Brown, whosessistance was indispensable to successful shipboard testingf the USF multi-parameter flow-through CO2 system. Theuthors gratefully acknowledge the research group of Dr.rank Millero at the Rosenstiel School of Marine and Atmo-pheric Science of the University of Miami, which conductediscrete pH and TA analyses during the A16S cruise. This
anuscript benefited from the comments of Andrew G. Dick-on and one anonymous reviewer. This research was funded byhe NOAA Grants (NA04OAR4310096, AB133R-03-CN-0091,nd NA05OAR4601143) to the University of South Florida.
[[
[
ica Acta 596 (2007) 23–36
eferences
[1] A.G. Dickson, C. Goyet (Eds.), Handbook of Methods for the Analysis ofthe Various Parameters of the Carbon Dioxide System in Sea Water, DOE,ORNL/CDIAC-74, 1994.
[2] M.D. DeGrandpre, T.R. Hammar, S.P. Smith, F.L. Sayles, Limnol.Oceanogr. 40 (1995) 969.
[3] R.A. Feely, R. Wanninkhof, H.B. Milburn, C.E. Cosca, M. Stapp, P.P.Murphy, Anal. Chim. Acta 377 (1998) 185.
[4] M. Tapp, K. Hunter, K. Currie, B. Mackaskill, Mar. Chem. 72 (2000) 193.[5] T.R. Martz, J.J. Carr, C.R. French, M.D. DeGrandpre, Anal. Chem. 75
(2003) 1844.[6] K.M. Johnson, A. Kortzinger, L. Mintrop, J.C. Duinker, D.W.R. Wallace,
Mar. Chem. 67 (1999) 123.[7] A. Watanabe, H. Kayanne, K. Nozaki, K. Kato, A. Negishi, S. Kudo, H.
Kimoto, Masaya Tsuda, Andrew G. Dickson, Mar. Chem. 85 (2004) 75.[8] K. Lee, F.J. Millero, R.H. Byrne, R.A. Feely, R. Wanninkhof, Geophys.
Res. Lett. 27 (2000) 229.[9] F.J. Millero, D. Pierrot, K. Lee, R. Wanninkhof, R. Feely, C.L. Sabine,
R.M. Key, T. Takahash, Deep-Sea Res. I 49 (2002) 1705.10] R.H. Byrne, X. Liu, E. Kaltenbacher, K. Sell, Anal. Chim. Acta 451 (2002)
221.11] R.H. Byrne, J. Breland, Deep-Sea Res. A 36 (1989) 803.12] T.D. Clayton, R.H. Byrne, Deep-Sea Res. A 40 (1993) 2115.13] R.G.J. Bellerby, A. Olsen, T. Johannessen, P. Croot, Talanta 56 (2002) 61.14] X. Liu, Z.A. Wang, R.H. Byrne, E.A. Kaltenbacher, R.E. Bernstein, Envi-
ron. Sci. Technol. 40 (2006) 5036.15] L. Merlivat, P. Brault, Sea Technol. 10 (1995) 23.16] N.R. Bates, L. Merlivat, L. Beaumont, A.C. Pequignet, Mar. Chem. 72
(2000) 239.17] R. Wanninkhof, K. Thoning, Mar. Chem. 44 (1993) 189.18] Z.A. Wang, W.J. Cai, Y.C. Wang, B.L. Upchurch, Mar. Chem. 84 (2003)
73.19] K.M. Johnson, D.W.R. Wallace, DOE Research Summary No. 19. Carbon
Dioxide Information Analysis, Oak Ridge National Laboratory, TN, 1992.20] H. Zhang, R.H. Byrne, Mar. Chem. 52 (1996) 17.21] M.D. DeGrandpre, M.M. Baehr, T.R. Hammar, Anal. Chem. 71 (1999)
1152.22] W. Yao, R.H. Byrne, Environ. Sci. Technol. 35 (2001) 1197.23] R.F. Weiss, Mar. Chem. 2 (1974) 203.24] F.J. Millero, Geochim. Cosmochim. Acta 59 (1995) 661.25] K. Friis, A. Kortzinger, D.W.R. Wallace, Limnol. Oceanogr. Method 2
(2004) 126.26] R.A. Feely, L.D. Talley, G.C. Johnson, C.L. Sabine, R. Wanninkhof, AGU
EOS Trans. 86 (2005) 404.27] A.G. Dickson, Deep-Sea Res. A 28 (1981) 609.28] F.J. Millero, J.-Z. Zhang, K. Lee, D.M. Campbell, Mar. Chem. 44 (1993)
153.29] T. Takahashi, J. Olafsson, J.G. Goddard, D.W. Chipman, S.C. Sutherland,
Global Biogeochem. Cycles 7 (1993) 843.30] E. Peltola, R. Wanninkhof, R. Feely, R. Castle, D. Greeley, J.-Z. Zhang, F.J.
Millero, N. Gruber, J.L. Bullister, T. Graham, in: ORNL RNL/CDIAC-149NDP-085, Oak Ridge, p. 20, 2005.
31] C. Mehrbach, C.H. Cuberson, J.E. Hawley, R.M. Pytkowicz, Limnol.
32] A.G. Dickson, F. Millero, Deep-Sea Res. 34 (1987) 1733.33] R. Wanninkhof, E. Lewis, R.A. Feely, F.J. Millero, Mar. Chem. 65 (1999)
291.34] W. Yao, R.H. Byrne, Deep-sea Res. I 45 (1998) 1383.