Dynamics of negative hydraulic barriers to prevent seawater intrusion
11
Dynamics of negative hydraulic barriers to prevent seawater intrusion María Pool & Jesús Carrera Abstract Negative hydraulic barriers that intercept inflowing saltwater by pumping near the coast have been proposed as a corrective measure for seawater intrusion in cases where low heads must be maintained. The main disadvantage of these barriers is that they pump a significant proportion of freshwater, leading to contami- nation with saltwater at the well. To minimize such mixing, a double pumping barrier system with two extraction wells is proposed: an inland well to pump freshwater and a seawards well to pump saltwater. A three-dimensional variable density flow model is used to study the dynamics of the system. The system performs very efficiently as a remediation option in the early stages. Long-term performance requires a well-balanced design. If the pumping rate is high, drawdowns cause saltwater to flow along the aquifer bottom around the seawater well, contaminating the freshwater well. A low pumping rate at the seawards well leads to insufficient desalinization at the freshwater well. A critical pumping rate at the seawater well is defined as that which produces optimal desalin- ization at the freshwater well. Empirical expressions for the critical pumping rate and salt mass fraction are proposed. Although pumping with partially penetrating wells improves efficiency, the critical pumping rates remain unchanged. Keywords Seawater intrusion . Double pumping barrier . Critical pumping rate . Groundwater management . Salt-water/fresh-water relations Introduction Seawater intrusion is a common problem in coastal aquifers. Density differences between freshwater and seawater together with intense pumping cause seawater to intrude inland along the aquifer bottom. The problem is especially severe in arid and semi-arid zones where alternative water resources are scarce. In such cases, corrective measures are needed to restore groundwater quality and optimally manage the aquifer. However, it is not easy to select the optimal corrective measures to control seawater intrusion because their feasibility and impact depend on the hydraulic and geometric character- istics of the aquifer and on the management structure (Post 2005). Consequently, mitigating seawater intrusion continues to be a challenge. The most simple and cost-effective measures for seawater intrusion are designed to improve the ground- water balance in an effort to keep heads high. This may be achieved by reducing pumping rates or relocating pump- ing fields to zones that are less susceptible to intrusion (Sherif 1999). This can also be achieved by artificial recharge, adding water to an aquifer through man-made systems including infiltration basins, canals and recharge ponds (Li et al. 1987; Reichard 1995). One special case is the aquifer storage and recovery (ASR) approach, which consists of injecting freshwater into the aquifer to recover essentially the same water without the need for additional treatment. This approach could be used to set up a hydraulic saltwater intrusion barrier (Misut and Voss 2007). Limiting pumping to the shallowest portions of the aquifer is a good method to redress the hydraulic balance and minimize drawdowns. Although these measures are the most simple, they are not always easy to implement because (1) wells are already drilled and drilling new (shallower) ones is expensive, (2) other water sources or space are not available and (3) implementation of these measures requires a strong management infrastructure. One attractive solution is to design seawater barriers that prevent seawater from flowing inland, thereby protecting groundwater pumping zones. Different types of barrier designs can be considered. Generally speaking, “positive” indicates a source of fluid to the aquifer. This is true conceptually (heads rise and water resources are increased) and in models and equations (a negative flow often represents an outflow). This terminology is therefore Received: 6 February 2009 / Accepted: 1 August 2009 * Springer-Verlag 2009 M. Pool ()) Department of Geotechnical Engineering and Geosciences, School of Civil Engineering, Technical University of Catalonia, 08034, Barcelona, Spain e-mail: [email protected] Tel.: +34-93-4017244 Fax: +34-93-4017251 J. Carrera Institute of Environmental Assessment and Water Research (IDAEA-CSIC), 08028, Barcelona, Spain Hydrogeology Journal DOI 10.1007/s10040-009-0516-1
-
Upload
independent -
Category
Documents
-
view
0 -
download
0
Transcript of Dynamics of negative hydraulic barriers to prevent seawater intrusion

Dynamics of negative hydraulic barriers to prevent seawater intrusion
María Pool & Jesús Carrera
Abstract Negative hydraulic barriers that interceptinflowing saltwater by pumping near the coast have beenproposed as a corrective measure for seawater intrusion incases where low heads must be maintained. The maindisadvantage of these barriers is that they pump asignificant proportion of freshwater, leading to contami-nation with saltwater at the well. To minimize suchmixing, a double pumping barrier system with twoextraction wells is proposed: an inland well to pumpfreshwater and a seawards well to pump saltwater. Athree-dimensional variable density flow model is used tostudy the dynamics of the system. The system performsvery efficiently as a remediation option in the early stages.Long-term performance requires a well-balanced design.If the pumping rate is high, drawdowns cause saltwater toflow along the aquifer bottom around the seawater well,contaminating the freshwater well. A low pumping rate atthe seawards well leads to insufficient desalinization at thefreshwater well. A critical pumping rate at the seawaterwell is defined as that which produces optimal desalin-ization at the freshwater well. Empirical expressions forthe critical pumping rate and salt mass fraction areproposed. Although pumping with partially penetratingwells improves efficiency, the critical pumping ratesremain unchanged.
Keywords Seawater intrusion . Double pumping barrier .Critical pumping rate . Groundwater management .Salt-water/fresh-water relations
Introduction
Seawater intrusion is a common problem in coastalaquifers. Density differences between freshwater andseawater together with intense pumping cause seawaterto intrude inland along the aquifer bottom. The problem isespecially severe in arid and semi-arid zones wherealternative water resources are scarce. In such cases,corrective measures are needed to restore groundwaterquality and optimally manage the aquifer. However, it isnot easy to select the optimal corrective measures tocontrol seawater intrusion because their feasibility andimpact depend on the hydraulic and geometric character-istics of the aquifer and on the management structure (Post2005). Consequently, mitigating seawater intrusion continuesto be a challenge.
The most simple and cost-effective measures forseawater intrusion are designed to improve the ground-water balance in an effort to keep heads high. This may beachieved by reducing pumping rates or relocating pump-ing fields to zones that are less susceptible to intrusion(Sherif 1999). This can also be achieved by artificialrecharge, adding water to an aquifer through man-madesystems including infiltration basins, canals and rechargeponds (Li et al. 1987; Reichard 1995). One special case isthe aquifer storage and recovery (ASR) approach, whichconsists of injecting freshwater into the aquifer to recoveressentially the same water without the need for additionaltreatment. This approach could be used to set up ahydraulic saltwater intrusion barrier (Misut and Voss2007). Limiting pumping to the shallowest portions of theaquifer is a good method to redress the hydraulic balanceand minimize drawdowns. Although these measures are themost simple, they are not always easy to implementbecause (1) wells are already drilled and drilling new(shallower) ones is expensive, (2) other water sources orspace are not available and (3) implementation of thesemeasures requires a strong management infrastructure.
One attractive solution is to design seawater barriersthat prevent seawater from flowing inland, therebyprotecting groundwater pumping zones. Different typesof barrier designs can be considered. Generally speaking,“positive” indicates a source of fluid to the aquifer. This istrue conceptually (heads rise and water resources areincreased) and in models and equations (a negative flowoften represents an outflow). This terminology is therefore
Received: 6 February 2009 /Accepted: 1 August 2009
* Springer-Verlag 2009
M. Pool ())Department of Geotechnical Engineering and Geosciences,School of Civil Engineering,Technical University of Catalonia,08034, Barcelona, Spaine-mail: [email protected].: +34-93-4017244Fax: +34-93-4017251
J. CarreraInstitute of Environmental Assessment andWater Research (IDAEA-CSIC),08028, Barcelona, Spain
Hydrogeology Journal DOI 10.1007/s10040-009-0516-1

proposed to classify the barriers into four types: lowpermeability subsurface, positive, negative and mixed.
– Low permeability subsurface barriers (Fig. 1a) consist ofvertical walls (slurry walls, steel or concrete sheet piles)placed inland to block seawater intrusion, (Sugio et al.1987). This system requires considerable engineeringand investment. Moreover, it may be counterproductiveif pumping stops or sources of contamination exist(Bolster et al. 2007).
– Positive hydraulic barriers (Fig. 1b) inject water intothe aquifer, which raises the piezometric head, thuspreventing saltwater from flowing inland (Bray andYeh 2008). It is often argued that positive barriers areinefficient because they inject freshwater into theocean. This is not necessarily the case. Abarca et al.(2006) demonstrated that their efficiency is greaterthan that belief (i.e., the allowable increase in inlandpumping exceeds the recharged flow rate) becausethey not only increase available resources but alsoprotect inland wells. The main disadvantages of thiscorrective measure are the need for high-quality waterwhenever injection is undertaken through wells andthe need for space if recharge through basins isnecessary. These corrective barriers also require consid-erable maintenance to control clogging.
– Negative hydraulic barriers (Fig. 1c) pump near theshore, thus intercepting inflowing saltwater (Todd1980). Seawater intrusion is impeded as long as thebarrier pumps. In practice, this system is often appliedwith minimum or no planning. It is common knowledgethat inland wells are protected by coastal wells. Inlandwell owners are prepared to go to great lengths to keepcoastal wells pumping. However, these barriers oftenend up pumping much more freshwater than saltwater,leading to a mixing of freshwater with seawater at the
wells and to a reduction in freshwater resources. Never-theless, negative barriers may be the only possiblecorrective measures to prevent seawater intrusion inaquifers where the water level cannot be raised. Theymay also be used to feed desalinization plants.
– Mixed barriers (Fig. 1d) are injection-pumping systems.Such a system may be used to inject freshwater atshallow depths while pumping saltwater at depth, whichmakes sense only in thick aquifers and/or in verticallyanisotropic systems. Corrective measures may also beused to pump at locations of the aquifer that are wellconnected to the sea while injecting at locations that arewell connected to the land. Therefore, a well-designedmixed barrier is much more sensitive to a good hydrauliccharacterization than other barrier systems.
Specific methods have been developed for a range ofspecific problems. In this regard, Van Dam (1999)proposed scavenger wells as a technique to control theposition of the interface and prevent upconing whensimultaneously pumping freshwater and seawater. Scav-enger wells consist of wells near freshwater pumpingwells with screens open in the saline groundwater at somedepth below the freshwater and seawater interface. Thisauthor evaluated the depth of the interface in terms of thepumping rates. Scavenger wells require careful monitoringand are only effective in very thick aquifers.
The study reported here was prompted by seawaterintrusion in the Mar del Plata aquifer, Argentina (Bocanegraet al. 2001), where deep pumping is necessary for ground-water supplies because of contaminated sources. Moreover,water levels cannot be raised given the susceptibility ofunderground urban infrastructures to flooding. This problemoccurs in many cities (Vázquez-Suñé et al. 2005). Negativebarriers are therefore the only solution to prevent seawaterintrusion.
a) Low permeability subsurface barrier
FreshwaterSeawater
b) Positive hydraulic barrierFreshwater
injection well
Seawater Freshwater
c) Negative hydraulic barrier
Seawaterpumping well
Seawater Freshwater
d) Mixed barrierSeawater Freshwater
injection well
FreshwaterSeawater
pumping well
Fig. 1 Types of barriers to control seawater intrusion: a low permeability subsurface barrier, b positive hydraulic barrier, c negativehydraulic barrier, d mixed barrier (injection-pumping system)
Hydrogeology Journal DOI 10.1007/s10040-009-0516-1

There are few papers on negative barriers. Sherif andHamza (2001) demonstrated qualitatively that seawaterintrusion may be controlled by pumping brackish waterfrom the dispersion zone. These authors used an idealtwo-dimensional (2D) leaky aquifer to evaluate the effectof pumping brackish water on the width of the mixingzone. However, the loss of freshwater in the well wasconsiderable.
The present paper addresses the loss of freshwaterthrough mixing at the negative barrier. To minimize thisloss, a double pumping barrier system with two extractionwells (Fig. 2) is proposed. One of the wells, the “freshwaterwell”, is designed to pump freshwater while the other, the“seawater well”, pumps mostly seawater. A vertical crosssection (see Fig. 2) suggests little flow between the twowells. In fact, Kacimov et al. (2008) used vertical two-dimensional cross-section simulations to study the possi-bility of restoring groundwater quality in coastal aquifers bypumping freshwater and seawater from the vicinity of theshoreline. These authors demonstrated that a zone ofreduced velocity was created between the pumping stripsand that the intrusion was mainly restricted to the areabetween the sea boundary and the saline groundwaterpumping field protecting the freshwater pumping. Unfortu-nately, the vertical cross section approach is only valid whenpumping wells are closely spaced with respect to theirdistance from the coast. Otherwise, the flow system iscomplex and fully three dimensional.
The aim of the present work is to elucidate the dynamicsof double pumping barriers and to assess to what extent thethree dimensionality of the flux compromises the efficiencyof the system. Efficiency is assessed here by the pumpingrate at the seawater well needed to reach a minimumsalinity at the freshwater well. The evolution of seawaterintrusion in an ideal system is analyzed in order to identifythe optimal location and pumping rates in the systemapplied, protect freshwater wells and control seawaterintrusion. Using this approach the problem is formulatedin a dimensionless form and empirical expressions for thecontrolling variables are obtained.
Dynamics of double pumping barriers
A methodology based on numerical three-dimensionalsimulations is employed to evaluate the dynamics ofdouble pumping barriers.
Problem descriptionA homogeneous confined coastal aquifer with constantthickness b is considered. The system consists of lines offully penetrating freshwater-seawater wells along the coastseparated by a distance of 2Lc (Fig. 3). Because of thesymmetry, only a coastal portion of length Lc is simulated(Fig. 3). A constant flow rate (Qp=648m
3/d) of freshwater(with salt mass fraction equal to ω=0 kg/kg) is imposedalong the inland boundary. Pressure p is prescribed alongthe seaside boundary (p=ρs gz, where ρs is density of theseawater, g is the magnitude of the gravitational accel-eration vector and z is the elevation).
A non-dispersion boundary condition is adopted for trans-port along the coastal boundary. This implies that salt massfraction equals either that of seawater (ωs=0.0386 kg/kg) forinflowing portions of the boundary or that of the resident massfraction for outflowing portions of the boundary (Voss andSouza 1987; Frind 1982). The remaining boundaries areclosed to flow and solute transport.
Flow and transport parameters used for the selectedmodel are as follows: freshwater hydraulic conductivityk=10.6m/d, porosity f=0.25, dimensionless density dif-ference ε=0.027 (ε is given by " ¼ �s � �f
� �= �f� �
with ρfbeing density of the freshwater), longitudinal dispersivityαL=10 m, transverse dispersivity αT=1 m, moleculardiffusion coefficient Dm=10
−9 m2/s, freshwater viscosityμ=0.001 kg/ms, aquifer thickness b=50 m, the width ofmodel domain Lc=500 m and the freshwater well, locatedat a distance of Lf=300 m from the sea , pumps Qf=
Seawater well
Seawater Freshwater
Freshwater well
∆
h = 0
Fig. 2 Schematic description of a double pumping barrier. Ideally,groundwater flux is low between the two wells
y xz
L f
Seawater Well
Qf
Qs
b
(kg/kg)0.0386
0.015
0.00
A′
Freshwater Well
L sL c
B′
A′
B′
A
BL c
A B
B′A′
Seawater WellFreshwater Well
Sea
Inland
Fig. 3 Plan view of the double negative barrier system, verticalcross-sections and model domain. Note that only the AB–A’B’region needs to be modeled because of symmetry
Hydrogeology Journal DOI 10.1007/s10040-009-0516-1
400 m3/d (here and below pumping rates refer to what ispumped from the model domain, which is effectively halfof the total pumping rate). Modeling seawater intrusionrequires the flow and transport equations to be coupledthrough water density, giving a set of two coupled non-linear equations. Computer simulations were performedwith SUTRA (Voss and Provost 2002).
Modeling methodology and resultsThe simulations are carried out following a two-stepsequence. The first step simulates a typical coastal wellsalinization. A well pumps freshwater (Qf) at a distance Lffrom the sea. Salinity of pumped water rises gradually tosteady state I. The second step constitutes a double pumpingbarrier solution to the problem. Using the end of step 1 asthe initial condition, a seawater well starts pumping (Qs) at adistance Ls from the sea, until steady state II is reached.
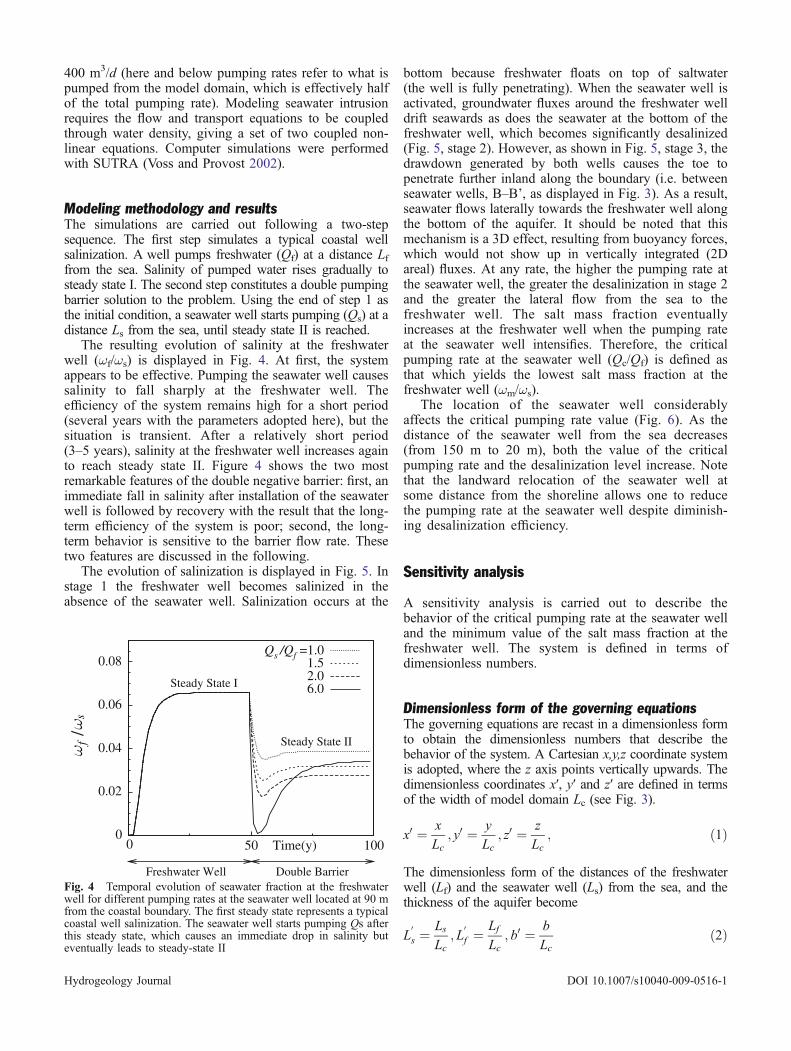
The resulting evolution of salinity at the freshwaterwell (ωf/ωs) is displayed in Fig. 4. At first, the systemappears to be effective. Pumping the seawater well causessalinity to fall sharply at the freshwater well. Theefficiency of the system remains high for a short period(several years with the parameters adopted here), but thesituation is transient. After a relatively short period(3–5 years), salinity at the freshwater well increases againto reach steady state II. Figure 4 shows the two mostremarkable features of the double negative barrier: first, animmediate fall in salinity after installation of the seawaterwell is followed by recovery with the result that the long-term efficiency of the system is poor; second, the long-term behavior is sensitive to the barrier flow rate. Thesetwo features are discussed in the following.
The evolution of salinization is displayed in Fig. 5. Instage 1 the freshwater well becomes salinized in theabsence of the seawater well. Salinization occurs at the
bottom because freshwater floats on top of saltwater(the well is fully penetrating). When the seawater well isactivated, groundwater fluxes around the freshwater welldrift seawards as does the seawater at the bottom of thefreshwater well, which becomes significantly desalinized(Fig. 5, stage 2). However, as shown in Fig. 5, stage 3, thedrawdown generated by both wells causes the toe topenetrate further inland along the boundary (i.e. betweenseawater wells, B–B’, as displayed in Fig. 3). As a result,seawater flows laterally towards the freshwater well alongthe bottom of the aquifer. It should be noted that thismechanism is a 3D effect, resulting from buoyancy forces,which would not show up in vertically integrated (2Dareal) fluxes. At any rate, the higher the pumping rate atthe seawater well, the greater the desalinization in stage 2and the greater the lateral flow from the sea to thefreshwater well. The salt mass fraction eventuallyincreases at the freshwater well when the pumping rateat the seawater well intensifies. Therefore, the criticalpumping rate at the seawater well (Qc/Qf) is defined asthat which yields the lowest salt mass fraction at thefreshwater well (ωm/ωs).
The location of the seawater well considerablyaffects the critical pumping rate value (Fig. 6). As thedistance of the seawater well from the sea decreases(from 150 m to 20 m), both the value of the criticalpumping rate and the desalinization level increase. Notethat the landward relocation of the seawater well atsome distance from the shoreline allows one to reducethe pumping rate at the seawater well despite diminish-ing desalinization efficiency.
Sensitivity analysis
A sensitivity analysis is carried out to describe thebehavior of the critical pumping rate at the seawater welland the minimum value of the salt mass fraction at thefreshwater well. The system is defined in terms ofdimensionless numbers.
Dimensionless form of the governing equationsThe governing equations are recast in a dimensionless formto obtain the dimensionless numbers that describe thebehavior of the system. A Cartesian x,y,z coordinate systemis adopted, where the z axis points vertically upwards. Thedimensionless coordinates x′, y′ and z′ are defined in termsof the width of model domain Lc (see Fig. 3).
x0 ¼ x
Lc; y0 ¼ y
Lc; z0 ¼ z
Lc; ð1Þ
The dimensionless form of the distances of the freshwaterwell (Lf) and the seawater well (Ls) from the sea, and thethickness of the aquifer become
L0s ¼
LsLc
; L0f ¼
LfLc
; b0 ¼ b
Lcð2Þ
0
0.02
0.04
0.06
0.08
500 100
f
/ s
Time(y)
Steady State I
Steady State II
Freshwater Well Double Barrier
Qs /Qf =1.01.52.06.0
Fig. 4 Temporal evolution of seawater fraction at the freshwaterwell for different pumping rates at the seawater well located at 90 mfrom the coastal boundary. The first steady state represents a typicalcoastal well salinization. The seawater well starts pumping Qs afterthis steady state, which causes an immediate drop in salinity buteventually leads to steady-state II
Hydrogeology Journal DOI 10.1007/s10040-009-0516-1

Darcy’s velocity, density, salt mass fraction and freshwaterhead are written in a dimensionless form with respect to theconstant freshwater flux from inland (qp), the seawaterdensity (ρs), the seawater salt mass fraction (ωs) and acharacteristic equivalent freshwater head, respectively
q0 ¼ qqp
; �0 ¼ �
�s;w0 ¼ w
ws; h0 ¼ hky
Lcqpð3Þ
Note that ω′, the dimensionless salt mass fraction, can beviewed as the proportion of seawater. The flow dimension-less numbers are defined as follows
a ¼ qd"Kz
; rk1 ¼ Kx
Ky; rk2 ¼ Kz
Kyð4Þ
where ε is given by " ¼ �s � �f� �
=�f with ρf and ρs thefreshwater and seawater densities, respectively.
Here, a is the ratio of the freshwater flux to thecharacteristic buoyancy flux, and rk1 and rk2 are thehydraulic conductivity anisotropy ratios.
According to these definitions, the dimensionless formof the fluid mass balance equation in steady state (e.g.,
0
0.02
0.04
0.06
0.08
0 50 100
f/
s
Time(y)
(1)
(2)
(3)
Freshwater Well Double Barrier
Qs /Qf =2.06.0
SALINIZATION (Steady State I)
Top Bottom
(1)(1)
DOUBLE PUMPING BARRIER
Bottom Top Bottom
Qs/Q
f=
6Q
s/Q
f=
2
(2) (3) (3)
(2) (3) (3)
INITIAL FINAL (Steady State II)
Fig. 5 Three-dimensional dynamics of the double negative barrier. Concentration maps (same color scale as Fig. 3) and velocity vectors atthe top and bottom of the aquifer for two different pumping rates at the seawater well. A fully penetrating well is salinized from the aquiferbottom (stage 1, above). When the seawater well is activated, salinity falls sharply at the freshwater well, especially when the barrierpumping rate is high (stage 2). However, drawdown generated by both wells causes seawater to flow towards the freshwater well at depth(stage 3). Note that the seawater well still draws some freshwater from the top portion of the aquifer at this stage
0.02
0.04
0.06
0 10 15
f/
s
Qs /Qf
Ls / Lc = 0.30
0.18
0.14
0.08
0.04
(Qc /Q f , m / s)
5
Fig. 6 Salt mass fraction at the freshwater well during steady stateII versus pumping rate at the seawater well for five distances of theseawater well from the coastal boundary (Ls/Lc=0.3, 0.18, 0.14,0.08 and 0.04 m). The critical pumping rate at the seawater well(Qc/Qf) is the one that causes minimum salinity at the freshwaterwell (ωm/ωs)
Hydrogeology Journal DOI 10.1007/s10040-009-0516-1

Bear 1972) including the pumping rates of freshwater andseawater wells reads as
� �0 rk1@2h0
@x02þ @2h0
@y02þ rk2
@2h0
@z02þ 1
a
@w0
@z0
� �� q0r0�0
¼ �0*Q0f d
0 x� xf ; 0� �
f0f ðzÞ þ �0*Q
0sd
0 x� xs; 0ð Þf 0s ðzÞ
ð5Þwhere ρ′* is the dimensionless density of the incoming waterthrough the source term, ∇′ expresses the dimensionless formof the del operator, the Dirac’s delta δ′ represents thedimensionless location of the wells and the dimensionlessfunctions f
0f ðzÞ and f
0sðzÞ express the vertical distribution of
extraction, assumed to be uniform here. They are zero,except in the portion of the aquifer thickness where the wellsare pumping. The dimensionless form of the pumping ratesQ
0s andQ
0s are defined as the ratio of the pumping rates of the
wells to the discharge flowing into the sea
Q0f ¼
Qf
qpLcb;Q
0s ¼
Qs
qpLcbð6Þ
The dimensionless form of the boundary conditions alonginland and coastal boundaries becomes
@h0
@y0
����y0¼Ly
Lc
¼ �1 h0jx0¼0 ¼1
a rk2z0 ð7Þ
As regards the transport equation, Peclet numbers were chosenas dimensionless parameters. They describe the relativeimportance of advective and diffusive transport mechanisms.
bm ¼ DmfqdLc
; bT ¼ aT
Lcð8Þ
where f is porosity,Dm the molecular diffusion coefficient andαT is the transverse dispersivity [L].
The dispersivity anisotropy ratio is also proposed as adimensionless parameter.
This leads to the dimensionless form of the salt massconservation in steady state as
r0 �0w0q0ð Þ � r0 �0 bTD0 þ bmIð Þr0w0f g¼ þ�0*w0*Q0
f d0 x� xf ; 0� �
f0f ðzÞ
þ �0*w0*Q0s d
0 x� xs; 0ð Þf 0s ðzÞ ð9Þ
where 5′* is the dimensionless salt mass fraction of theincoming water through source term, I is the identity matrixand D′ is the dimensionless dispersion tensor, defined by
D0 ¼ Dij
aT qd¼ dij q
0j j þ ra � 1ð Þ q0i q
0j
q0j j
" #; i; j ¼ x; y; z
ð10Þ
where rα denotes the ratio between longitudinal andtransverse dispersivities (ra ¼ aL=aT ) and qi and qj are thecomponents of the flux.
The transport equation is subject to a zero dimension-less solute flux along all the boundaries except for thecoastal boundary where the dimensionless salt mass flux isdefined as follows
� �0q0w0 � �0D0r0w0ð Þ y0¼0
�� � n ¼p0q0 � n if q0n < 0
�0q0w0y0¼0
�� � n if q0n > 0
(
ð11Þ
where n is the unit vector normal to the boundary andpointing outwards.
Critical pumping rateDifferent sets of simulations were carried out by varyingindependently the distances of the two wells from the sea(Lf=200–400 m and Ls=20–150 m), the pumping rate atthe freshwater well (Qf=100–600 m3/d), the aquiferthickness (b=9–50 m), the hydraulic conductivity (kx=10–100 m/d and kz=1–10 m/d), the longitudinal andtransverse dispersivities (αL=10–50 m and αT=1–10 m)and the width of the model domain (2Lc=500–1,000 m).For each problem, the pumping rate at the seawater wellwas modified (382 cases) until the critical pumping ratewas found. Table (1) shows the values of the dimension-less numbers used for simulations.
The algorithm of Furnival and Wilson (1974) was usedto seek a simple empirical expression for the criticalpumping rate from the dimensionless numbers. Thealgorithm finds the best subset regressions for a regressionmodel with candidate independent variables. The routineeliminates some subsets of candidate variables by obtain-ing lower bounds on the error sum of squares from fittinglarger models.
Table 1 Description of the simulations considered in the sensitivity analysis
Dimensionlessvariables
Range Description
rk1=kx/ky 1.0–10 Hydraulic conductivityanisotropy ratiosrk2=kz/ky 0.1–1.0
rL=Ls/Lf 0.06–0.75 Geometric shape factorb′=b/Lc 0.018–0.2 Aquifer thicknessa=qd/εkz 0.09–0.9 Characteristic
buoyancy fluxQ
0f ¼ Qf =Lc qd b 0.6–0.9 Pumping rates
Q0s ¼ Qs=Lc qd b 0.3–13
bm ¼ Dmfð Þ=qdLc 1.6∙10−6–3.3∙10−6
Diffusive Pecletnumber
bT=αT/Ls 0.013–0.1 Dispersive Pecletnumber
ra ¼ aL=aT 1.0–25 Dispersivityanisotropy ratio
L0Ab ¼ 1
Lf� 1
Lc
� �LGH
� FLDS
Lf
−0.25–0.73 Toe penetration fordispersive Henryproblem
Hydrogeology Journal DOI 10.1007/s10040-009-0516-1

Basically, the dimensionless parameters defined in theprevious section were proposed as independent variables.Some derived dimensionless numbers were also employed.In addition to these, the dimensionless toe penetration for thedispersive Henry problem (Abarca et al. 2007) was alsoused. Abarca’s correction to the Ghyben-Herzberg toepenetration was modified to read
L0Ab ¼
1
Lf� 1
Lc
� �LGH � FLDS
Lfð12Þ
where
FLDS ¼ 0:136ffiffiffiffiffiffiffiffiffiffiffiaT aL
pa2
ffiffiffiffiffiffirk2
p� �0:724
þ 0:69ffiffiffiffiffiffiffiffiffiffiffiaT aL
pa2
ffiffiffiffiffiffirk2
p� �0:362
ð13Þand LGH is the toe penetration without pumping under theGhyben-Herzberg approximation
LGH ¼ b "Ky
2qdð14Þ
An empirical expression for the critical pumping rate Fc wasobtained from the regression model. The equation that bestrepresents the numerical results is (see Fig. 7)
Qc
Qf� Fc � 1:6
1
rL rk1ð Þ2 3=
!effiffip
pL0Ab�Q
0fð Þ½ � ð15Þ
where rL is defined as the geometric shape factor of the twowells (rL=Ls/Lf).
Note that the exponent in Eq. (15) depends on thedispersive case correction to the Ghyben-Herzberg toeapproximation (Eq. 12) and on the ratio of the freshwaterpumping to the freshwater inflow from inland, i.e. theexponent expresses the seawater invasion distance asevidenced by the reduction in freshwater discharge to thesea because of pumping.
The empirical expression approximates the 3D dynam-ics of the system satisfactorily. However, it is only aimedat preliminary assessments. The empirical approximationfor the critical pumping rate is valid for the range ofvalues of the variables tested here. An exhaustive study isrequired to fine tune this kind of corrective measure to theindividual aquifer.
Equation (15) facilitates the sensitivity analysis(Fig. 8). Perhaps, the most surprising feature is thereduction in critical pumping rate for increasing Q
0f . The
reason for this is that the toe along the boundary BB’(Fig. 3) proceeds inland when Q
0f increases. Thus an
increase in freshwater pumping causes the critical pump-ing rate to decrease, leading to a reduction in the long termlateral flux of seawater. The effect is more marked whenthe seawater well is close to the sea (Fig. 8a).
When transverse dispersivity is increased withrespect to the longitudinal one, the interface retreatsseawards and the salt mass fraction at the freshwaterwell is reduced. However, the efficiency of mixingincreases and the mixing zone is broadened. Thispromotes salinization of the freshwater well when thepumping rate in the seawater well intensifies. Conse-quently, increasing transverse dispersivity decreases thecritical pumping rate.
Buoyancy effects increase in importance with aquiferthickness. Thus, an increase in aquifer thickness wouldtend to favor lateral fluxes around the seawater well.Intercepting these fluxes requires increasing the pump-ing rate at the seawater well. Therefore, the thicker theaquifer, the higher the critical pumping rate. This effectis more significant when the seawater well is near thesea (Fig. 8b).
An increase in kx reduces lateral gradients. In fact,it is similar to a reduction in the width of the modeldomain, which implies a reduction in lateral fluxes. Asa result, the critical pumping rate decreases (Fig. 8c).The distance of the two wells from the sea (Lf and Ls)and the width of the model domain (Lc) also affect thecritical pumping rate. When the distance of theseawater well from the sea is increased, drawdowncaused by the seawater well also increases (pressurealong the coastal boundary is prescribed). This wouldtend to favor the lateral flux towards the pumping well.Thus, the critical pumping rate needs to be reduced tominimize this lateral flux (Fig. 8a). When the distanceof the two wells from the sea exceeds that of Lc(width of the model domain, see Fig. 3), the flow fieldbecomes increasingly 2D, which reduces the criticalpumping rate (Fig. 8d). Figure 8 also illustrates the fitbetween the numerical and empirical results (Eq. 15),which is fairly good.
0
5
10
15
0 5 10 15
Qc /Q
f
Fc
R2 = 0.997
y = x
Fig. 7 Critical pumping rate in the seawater well obtainedfrom the numerical simulations (Qc/Qf) versus the results fromempirical expression, Fc (Eq. 15), obtained from the regressionmodel
Hydrogeology Journal DOI 10.1007/s10040-009-0516-1

Minimum salt mass fraction in the freshwater wellThe dimensionless salt mass fraction (ωf/ωs) is thefraction of seawater at the freshwater well. If theseawater well pumped only seawater and if dispersionmechanisms and buoyancy forces were neglected, theseawater fraction at the freshwater well would becomethe seawater inflow not captured by the seawater welldivided by Qf, i.e.,
wf
ws¼ QTs �Qs
Qfð16Þ
where QTs is the total saltwater flow rate entering fromthe seaside boundary. Using the method of images foran infinite line of freshwater and seawater wells, thetotal saltwater flow rate can be approximated as
QTs ¼ZLb0
ðqpb� Qf Lfp
Xni¼1
1
x� 2nLcð Þ2 þ L2f
� QsLsp
Xni¼1
1
x� 2nLcð Þ2 þ L2BÞdx
ð17Þ
where Lb is the fraction of the coastal boundary whereseawater flows inland (0≤Lb≤Lc).
Unfortunately, this approach neglects the most notablefeatures of seawater intrusion, namely buoyancy andinterface mixing. In reality, the seawater well pumps some
freshwater. Nevertheless, Eq. (16) was used as anindependent variable in the regression model to obtainthe empirical expression (Gc) for the minimum seawatermass fraction at the freshwater well (ωm/ωs), i.e. the saltmass fraction at the freshwater well when the seawaterwell is pumping the critical rate. The best regressionobtained was (see Fig. 9).
wm
ws� Gc ¼ 0:2
QTs � Qs
Qf
� �
þ 0:8 0:175bTL0s
ffiffiffiffiffira
p� �þ b0
L0f
þ 0:04rLQ
0f
!
ð18Þ
The fit between numerical and empirical results is not asgood as the one for the critical pumping rate but may beused to obtain an idea of the efficiency of desalinization.
Desalinization efficiency (reduction in salinity at thefreshwater well between steady state I and steady state II)is displayed versus distance of the seawater well from thesea, and versus aquifer thickness in Figs. 10 and 11,respectively. Decreasing the distance of the seawater wellfrom the sea leads to a reduction in the salt mass fractionat the freshwater well. However, the critical pumping rateat the seawater well shows a marked increase (Fig. 6). Forexample, the desalinization efficiency increases from 19 to28% when the seawater well is brought closer to the sea(Ls=40 m), but the critical pumping rate at the seawater
0
2
4
6
8
0 0.1 0.2 0.3
Qc /Q
f
L s
b′ = 0.1, L ′f = 0.6
Q f =0 .9
Q ′f =0 .6
(a)Empirical
0 0.05 0.1 0.15b′
Q ′f = 0.9, L ′f = 0.6
L′s = 0.30
L′s = 0.14
L′s = 0.08
(b)Empirical
0
2
4
6
8
0 2 4 6 8 10
Qc /Q
f
rk1
L′s = 0.18
L′s = 0.08
(c)Empirical
0.5 0.75 1 1.25L′ f
Q′f = 0.6, b′ = 0.1Q′f = 0.6, b′ = 0.1
rL = 0.50
rL = 0.30
rL = 0.23
(d)Empirical
′
′
Fig. 8 Sensitivity analysis. The critical pumping rate decreases when a distance from the coast increases, b aquifer thickness decreases, canisotropy increases, or d distance of the freshwater well from the coast increases. Note that the proposed empirical expression, Fc Eq. (15),is fairly accurate for the range of values analyzed here
Hydrogeology Journal DOI 10.1007/s10040-009-0516-1

well is four times higher when the seawater well is nearthe freshwater well (Ls=150 m). Desalinization efficiencyis significantly better in the case of a low freshwaterpumping rate.
One critical factor in the efficiency of the doublenegative barrier is aquifer thickness. A decrease in aquiferthickness leads to a high desalinization efficiency with thedouble pumping system (Fig. 11). Note that drinkingwater is pumped from the freshwater well with the doublenegative barrier when the dimensionless aquifer thicknessis 0.018.
A reduction in the aquifer thickness from 50 to 9 m,while increasing the pumping rate at the freshwater well(Q
0f ¼ 0:9), gives rise to a seawater fraction of 7% (i.e.,
some 1,400 mg/L of chloride for a 1,900 mg/L seawater)at the freshwater well in steady state I. Pumping theseawater well causes chloride to fall below 200 mg/L atthe freshwater well (<1 % of seawater), i.e. drinking water
is obtained from the freshwater well, and the pumping rateat the seawater well is low (Qc/Qf≈1), see Fig. 11.
Partially penetrating wellsAs discussed in the preceding, the wells were assumed tobe fully penetrating. However, salinity is stratified incoastal aquifers, with freshwater floating on top ofseawater. Therefore, one would expect the location andlength of the well screen to be a critical factor in a doublepumping barrier system. The effect of partially penetratingwells on the efficiency of double pumping barriers isconsidered.
The simulations with partially penetrating wells werecarried out with the same flow and transport parameters asthose of aforementioned models, where hydraulic con-ductivity was assumed to be isotropic. First, the base casewas simulated with a fully penetrating freshwater welland a partially penetrating seawater well. The numerical
0
0.03
0.06
0.09
0.12
0.15
0 0.03 0.06 0.09 0.12 0.15Gc
R2 = 0.982
y = x
m/
s
Fig. 9 Fraction of seawater at the freshwater well from thenumerical results versus the empirical expression, Gc, Eq. (18),obtained from the regression model
0
0.03
0.06
0.09
0.12
0.15
0 0.1 0.2 0.3 0.4
L′s
19%28% Q′f = 0.9
50%67%
Q′f = 0.6
Empirical initial
m/
s
Fig. 10 Comparison between numerical and empirical results ofseawater fraction at the freshwater well versus the distance of theseawater well from the sea. Reduction in the distance of the seawaterwell from the sea improves the desalinization efficiency of the barrier,as measured by the percentage (%) reduction in freshwater well salinitywith respect to steady-state I. Note, however, the marked increase inthe critical pumping rate (see Fig. 8c)
0
0.03
0.06
0.09
0.12
0.15
0 0.02 0.04 0.06 0.08 0.1 0.12
b′
85%
58%
25%
drinking water standard
Empirical initialL′s = 0.3L′s = 0.18L′s = 0.14
m/
s
Fig. 11 Fraction of seawater and desalinization percentage (%) atthe freshwater well versus aquifer thickness for . The results fromthe empirical expression provide a satisfactory representation of thenumerical results. Note that the double pumping barrier is moreefficient for thin aquifers, and that drinking water is obtained fromthe freshwater well with the double pumping system
0.02
0.04
0.06
0 5 10Qs / Qf
L′s = 0.30 L′s = 0.18
FPw
PPw
FPw
PPw
(Qc Qf,
f/
s
m s)
Fig. 12 Fraction of seawater in the freshwater well versuspumping rates at the seawater well at distances from the coast of150 and 90 m ( and 0.18 respectively ). The dashed lines denote theresults with fully penetrating wells (FPw) and the solid linesrepresent the results with partially penetrating wells (PPw). Notethat partial penetration significantly improves desalinization effi-ciency but does not change the critical flow rate
Hydrogeology Journal DOI 10.1007/s10040-009-0516-1

results confirm a decrease in salinity at the freshwaterwell. This effect would be more evident if both wells werepartially penetrating wells. Different sets of simulationswere carried out to study the effect of partially penetratingwells. The freshwater well pumps in the top 15 m of theaquifer whereas the seawater well pumps in the bottom15 m. The numerical results provide evidence that buoy-ancy allows the freshwater well to pump freshwater, whilethe seawater well pumps seawater. Hence desalinizationefficiency is significantly enhanced with respect to thefully penetrating wells, Fig. 12.
It should be noted that the critical pumping rate does notdepend on the location of well screen, i.e. whether the wellsare fully or partially penetrating. In an anisotropic system,where the vertical hydraulic conductivity is lower than thehorizontal hydraulic conductivity, the salinity at the fresh-water well must be lower than that in the isotropic system.However, it is very probable that the critical pumping rateoccurred at exactly the same discharge given that the criticalpumping rate depends on lateral fluxes, i.e. it depends on thehorizontal components of the hydraulic conductivity.
Conclusions
A double pumping barrier is proposed as a correctivemeasure to control seawater intrusion in coastal aquiferswhere the water level cannot be raised or where artificialrecharge or restrictions on pumping are not feasible. Thesystem appears to be effective in the early stages (3–5 years). Pumping the seawater well causes salinity to fallsharply at the freshwater well. However, after a relativelyshort period, the drawdown generated by both wellscauses saltwater to flow around the seawater well alongthe bottom of the aquifer, contaminating the freshwaterwell. When the seawater well pumping rate is high, thislateral flow is dominant. However, a low pumping rate atthe seawater well would fail to intercept all seawaterintrusion. Therefore, there is a critical pumping rate at theseawater well which produces the minimum salt massfraction at the freshwater well. Paradoxically, a tooenergetic pumping at the seawater well would consid-erably increase salinity at the freshwater well.
The location of the seawater well and aquifer thicknesssignificantly affect the efficiency of the system. Efficiencyincreases as the seawater well is brought closer to the sea butat the expense of a higher pumping rate at the seawater well.A decrease in aquifer thickness leads to a high desalinizationat the freshwater well. Therefore, the highest efficiency of adouble pumping barrier is reached in thin aquifers.
Empirical expressions were derived for the criticalpumping rate and for the corresponding (maximumachievable) desalinization at the freshwater well. Theseexpressions capture the 3D dynamics of the systemsatisfactorily. However, they should only be used forpreliminary assessments. An exhaustive study is requiredto tailor this type of corrective measure to the individualaquifer. Finally, the efficiency of double-negative barriersis enhanced if the freshwater well is screened only at the
top of the aquifer and the seawater well pumps at thebottom of the aquifer. Moreover, the numerical resultssuggest that the critical pumping rate does not depend onthe location of the screen well.
In summary, the double pumping barrier system is notas efficient as it looks from a vertical cross section of theaquifer. Nevertheless, in cases where other options are notviable because of the lack of space or the need to keepwater levels low (which is the case of urban aquifers), thiscorrective measure is a viable alternative. In the case ofthin aquifers and/or closely spaced wells, the doublepumping barrier is fairly efficient. The system proposed ismuch more efficient than a simple negative barrier.
Acknowledgements The authors acknowledge the financial supportprovided by the European Commission (ATRAPO project, contractMEC CTM2007-66724-C02-01/TECNO) and the Spanish CICYT(HEROS project). The first author gratefully acknowledges thereceipt of an FI award from the Autonomous Government ofCatalonia for the period during which this work was carried out.The authors wish to thank Mark Bakker and Eric Reichard for theirconstructive comments on the manuscript.
References
Abarca E, Vázquez-Suñé E, Carrera J, Capino B, Gámez D, Batlle F(2006) Optimal design of measures to correct seawaterintrusion. Water Resour Res 42(9), W09415
Abarca E, Carrera J, Sánchez-Vila X, Dentz M (2007) Anisotropicdispersive Henry problem. Adv Water Resour 30(4):913–926
Bear J (1972) Dynamics of fluids in porous media. Elsevier,Amsterdam, 764 pp
Bocanegra E, Massone H, Martinez D, Civit E, Farenga M (2001)Groundwater contamination: risk management and assessment forlandfills in Mar del Plata, Argentina. Environ Geol 40:732–741
Bolster D, Tartakovsky D, Dentz M (2007) Analitycal models ofcontaminant transport in coastal aquifers. Adv Water Resour 30(9):1962–1972
Bray B, Yeh W (2008) Improving seawater barrier operation withsimulation optimization in southern California. J Water ResourPlann Manage 134:171–180
Dam JC (1999) Seawater intrusion in coastal aquifers: concepts,methods and practices. Chap. Exploitation, restoration andmanagement. Kluwer, Norwell, MA, pp 73–125
Frind E (1982) Simulation of long-term transient density-dependenttransport in groundwater. Adv Water Resour 5:73–88
Furnival G, Wilson R Jr (1974) Regression by leaps and bounds.Technometrics 16:499–512
Kacimov A, Sherif M, Perret JS, Al-Mushikhi A (2008) Control ofsea-water intrusion by salt-water pumping: Coast of Oman.Hydrogeol J 17(3):541–558
Li C, Bahr J, Reichard E, Butler J, Remson I (1987) Optimal sitingof artificial recharge: an analysis of objective functions. GroundWater 25:141–150
Misut PE, Voss CI (2007) Freshwater-saltwater transition zone move-ment during aquifer storage and recovery cycles in Brooklyn andQueens, New York City, USA. J Hydrol 337(1–2):87–103
Post V (2005) Fresh and saline groundwater interaction in coastalaquifers: is our technology ready for the problems ahead?Hydrogeol J 13(1):120–123
Reichard EG (1995) Groundwater-surface water management withstochastic surface water supplies: a simulation-optimizationapproach. Water Resour Res 31(11):2845–2865
Sherif M (1999) Seawater Intrusion in Coastal aquifers: concepts,methods and practices, vol. 14. Kluwer, Norwell, MA, pp 559–590
Sherif MM, Hamza KI (2001) Mitigation of seawater intrusion bypumping brackish water. Transp Porous Media 43:29–44
Hydrogeology Journal DOI 10.1007/s10040-009-0516-1
Sugio S, Nakada K, Urish DW (1987) Subsurface seawater intrusionbarriers analysis. J Hydraul Eng 113:767–779
ToddD (1980) Groundwater hydrology, chap. 14.Wiley, Chichester, UKVázquez-Suñé E et al (2005) Groundwater modelling as a tool for
the European Water Framework Directive (WFD) application:the Llobregat Case. Phys Chem Earth 31:1015–1029
Voss CI, Provost A (2002) SUTRA, a model for saturated-unsaturated variable-density ground-water flow with solute orenergy transport. US Geol Surv Sci Invest Rep 02-4231
Voss CI, Souza WR (1987) Variable density flow and transportsimulation of regional aquifers containing a narrow freshwater-saltwater transition zone, Water Resour Res 26:2097–2106
Hydrogeology Journal DOI 10.1007/s10040-009-0516-1