Extractive Spectrophotometric Determination of ... - Hindawi.com
Upload
khangminh22Category
view
1download
0
Brigham Young University Brigham Young University
BYU ScholarsArchive BYU ScholarsArchive
Theses and Dissertations
2020-12-09
A Rapid Spectrophotometric Assay for Quantifying Seed Coat A Rapid Spectrophotometric Assay for Quantifying Seed Coat
Saponins in Quinoa Saponins in Quinoa
Sydney Diver Szabo Brigham Young University
Follow this and additional works at: https://scholarsarchive.byu.edu/etd
Part of the Life Sciences Commons
BYU ScholarsArchive Citation BYU ScholarsArchive Citation Szabo, Sydney Diver, "A Rapid Spectrophotometric Assay for Quantifying Seed Coat Saponins in Quinoa" (2020). Theses and Dissertations. 9321. https://scholarsarchive.byu.edu/etd/9321
This Thesis is brought to you for free and open access by BYU ScholarsArchive. It has been accepted for inclusion in Theses and Dissertations by an authorized administrator of BYU ScholarsArchive. For more information, please contact [email protected].
A Rapid Spectrophotometric Assay for Quantifying Seed Coat Saponins in Quinoa
Sydney Diver Szabo
A thesis submitted to the faculty of Brigham Young University
in partial fulfillment of the requirement for the degree of
Master of Science
Laura K. Jefferies, Chair Michael L. Dunn
Oscar A. Pike Jason D. Kenealey
Department of Nutrition, Dietetics, and Food Science
Brigham Young University
Copyright © 2020 Sydney Diver Szabo
All Rights Reserved
ii
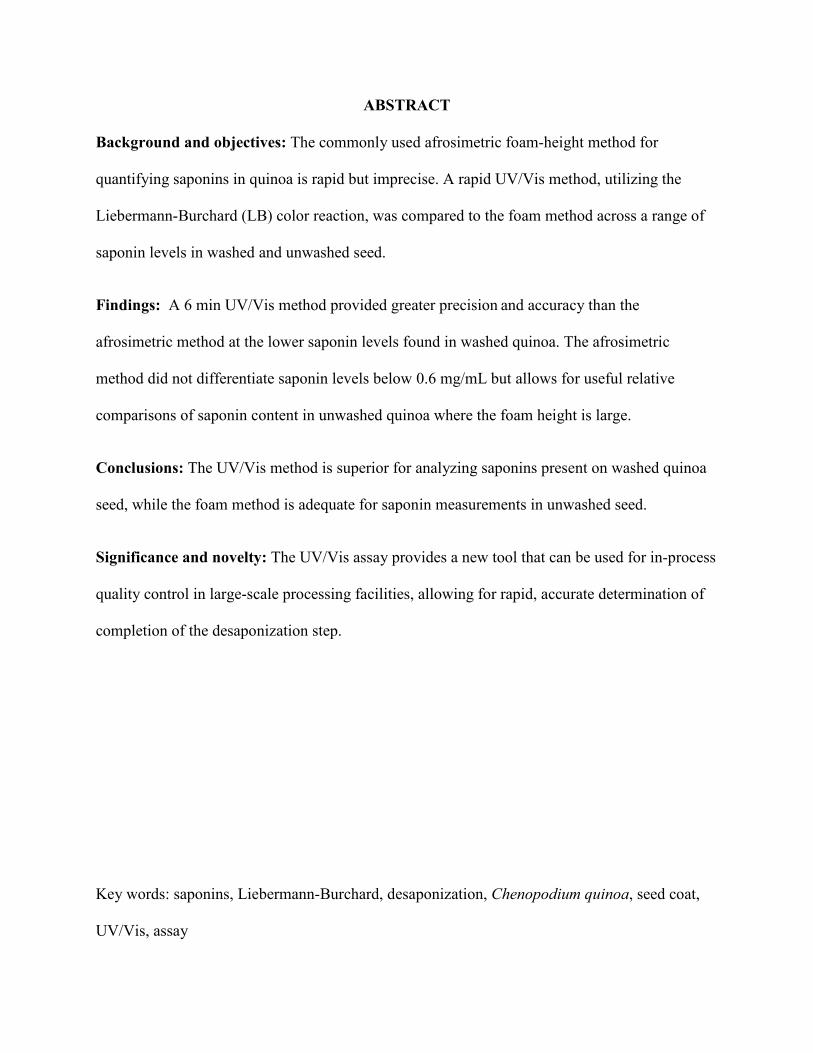
ABSTRACT
Background and objectives: The commonly used afrosimetric foam-height method for
quantifying saponins in quinoa is rapid but imprecise. A rapid UV/Vis method, utilizing the
Liebermann-Burchard (LB) color reaction, was compared to the foam method across a range of
saponin levels in washed and unwashed seed.
Findings: A 6 min UV/Vis method provided greater precision and accuracy than the
afrosimetric method at the lower saponin levels found in washed quinoa. The afrosimetric
method did not differentiate saponin levels below 0.6 mg/mL but allows for useful relative
comparisons of saponin content in unwashed quinoa where the foam height is large.
Conclusions: The UV/Vis method is superior for analyzing saponins present on washed quinoa
seed, while the foam method is adequate for saponin measurements in unwashed seed.
Significance and novelty: The UV/Vis assay provides a new tool that can be used for in-process
quality control in large-scale processing facilities, allowing for rapid, accurate determination of
completion of the desaponization step.
Key words: saponins, Liebermann-Burchard, desaponization, Chenopodium quinoa, seed coat,
UV/Vis, assay
iii
ACKNOWLEDGMENTS
It is with enormous gratitude that I recognize my graduate committee, including Dr.
Michael Dunn, Dr. Laura Jefferies, Dr. Oscar Pike, and Dr. Jason Kenealey. Their steadfast
professional guidance, patient support, and numerous contributions all led to the completion of
this thesis. Through the entire process, each unselfishly shared their infinite knowledge,
constructive critique, and unique insight as I navigated my way through this challenging and
exciting process.
My co-author and research assistant, Brian Merrill, who worked alongside me through
this endeavor is owed a debt of thanks. I have the utmost respect for him; he brought to this
project his wisdom, humor, and finesse which made it a joy to collaborate with him; I am
extremely grateful. In addition, research assistant Savannah Clark brought a positive attitude and
a generous spirit of contribution that proved quite helpful. Sam Clarke, another valuable member
of the team should be recognized for his willingness to offer his assistance for which I am most
appreciative.
Special recognition goes to Dr. Michael Dunn who is an amazing resource, astute
sounding board, and experienced mentor. His enthusiasm for this project, his determination to
see it through successfully, and his belief in me allowed the project to come to fruition the way
we hoped.
I am forever thankful for the opportunity to attend Brigham Young University, a highly
esteemed educational institution. The available resources, along with the caliber of fellow
students and generous professors, ensured that my learning would be nothing short of excellent.

iv
The lifelong friends I made over my many years of schooling are a superb gift that I will never
take for granted.
Thank you to Ardent Mills for believing the BYU Food Science department could
complete this thought-provoking project and for providing us with the means to do so. With
exuberant anticipation, I look forward to the future, when the method will be used in industry;
this will be the best reward for everyone who worked on this project.
Lastly, thank you to my parents Wayne and Susan Szabo. Throughout my life they
always champion my efforts, let me know how much I am loved, how proud they are of me, and
that with faith and grit anything is possible.

v
TABLE OF CONTENTS
Title Page ........................................................................................................................................ i
ABSTRACT ................................................................................................................................... ii
ACKNOWLEDGMENTS ........................................................................................................... iii
TABLE OF CONTENTS ............................................................................................................. v
LIST OF FIGURES .................................................................................................................... vii
LIST OF TABLES ..................................................................................................................... viii
1 INTRODUCTION...................................................................................................................... 1
2 MATERIALS AND METHODS .............................................................................................. 3
2.1 Materials and chemicals ................................................................................................ 3
2.2 UV/Vis assay ................................................................................................................ 4
2.3 Saponin quantitation by Foam method ......................................................................... 5
2.4 Aqueous saponin extraction for UV/Vis quantitation method ...................................... 5
2.5 Saponin standard ........................................................................................................... 6
2.6 Standard curves ............................................................................................................. 6
2.7 Experimental design and statistical analysis ................................................................. 7
3 RESULTS AND DISCUSSION ................................................................................................ 8
3.1 Development of a rapid UV/Vis assay.......................................................................... 8
3.2 Extraction method – Foam vs. UV/Vis ......................................................................... 9
3.3 Spectrophotometric assay ........................................................................................... 11
3.4 Commercial Sample Analysis with Foam and UV/Vis Methods ............................... 13
3.5 UV/Vis standard curve & Foam method standard curve ............................................ 16
3.6 Quantitation................................................................................................................. 17
4 CONCLUSIONS ...................................................................................................................... 19
References .................................................................................................................................... 21
APPENDIX 1: EXTENDED REVIEW OF THE LITERATURE ......................................... 24
1 QUIONA ................................................................................................................................... 24
2 TRADITIONAL USE .............................................................................................................. 25
2.1 A Brief History of Quinoa Cultivation ....................................................................... 25
3 POPULARITY & COMMERICAL USE .............................................................................. 26
vi
4 PHYTOCHEMISTRY & NUTRITIONAL VALUE ............................................................ 27
4.1 Protein ......................................................................................................................... 27
4.2 Carbohydrate & Fiber ................................................................................................. 28
4.3 Lipid ............................................................................................................................ 29
4.4 Vitamins ...................................................................................................................... 30
4.5 Minerals ...................................................................................................................... 31
5 NUTRITIONAL VALUE OF QUINOA SEED .................................................................... 31
6 SAPONINS ............................................................................................................................... 33
7 COMMERICAL PROCESSING ........................................................................................... 34
7.1 Harvest ........................................................................................................................ 34
7.2 Processing ................................................................................................................... 35
APPENDIX 2: METHODOLOGY ........................................................................................... 36
1 SPECTROPHOTOMETRIC METHODS ............................................................................ 36
2 UV/VIS LIEBERMANN BURCHARD (LB) ASSAY .......................................................... 37
3 AFROSIMETRIC (FOAM) METHOD ................................................................................. 40
4 EXTRACATION OF SAPONIN STANDAED METHOD .................................................. 41
5 CHROMATOGRAPHY .......................................................................................................... 44
5.1 GC Method.................................................................................................................. 44
5. 2 LC-MS ....................................................................................................................... 50
6 VANILLIN................................................................................................................................ 50
7 HEMOLYTIC .......................................................................................................................... 51
8 MACRO LENS-COUPLES SMARTHPHONE ANALYTICAL ASSAY ......................... 52
APPENDIX 3 ............................................................................................................................... 52
APPENDIX 4 ............................................................................................................................... 53

vii
LIST OF FIGURES
Figure 1. Color change and absorbance (A528) of extracts from samples of commercially washed quinoa containing three different levels (0, 10, and 20%) of added unwashed seed. Measurements were taken 30 sec after mixing with LB reagent. Pictured (b) from left to right are the 0, 10, and 20% extracts shortly after mixing with LB reagent ........................................................................ 9 Figure 2. Absorbance at 528 nm of aqueous extracts from washed quinoa seed mixed for specified times using a rotary mixer. ............................................................................................ 11 Figure 3a and 3b. Linear correlation between saponin content (expressed in terms of % unwashed seed in the sample) and foam height (3a) or A528 (3b) for the foam and UV/Vis methods respectively, utilizing four different levels of unwashed quinoa ................................... 13 Figure 4. Comparison of statistical resolution of foam vs UV/Vis assays at low saponin concentrations .............................................................................................................................. 17

viii
LIST OF TABLES
Table 1. Variance analysis for foam height and A528 values of extracts from 10 bags of washed and unwashed quinoa seed within each of 3 lots .......................................................................... 14 Table 2. Saponin contents of 3 different lots of washed and unwashed quinoa seed as measured by the foam and rapid UV/Vis methods of analysis ..................................................................... 18

1
1 INTRODUCTION
Quinoa (Chenopodium quinoa Willd.) is a pseudo-cereal from the Amaranth family that is
steadily increasing in market share in the U.S. and other countries, due to growing consumer
interest in the health benefits associated with ancient grains and plant foods. In 2018, Peru
produced 86,011 tons of quinoa seed, Bolivia produced 70,763, and Ecuador produced 2,416
metric tons (FAO, 2020). The seed contains a unique lipid, carbohydrate, amino acid, and
micronutrient profile with nutrient levels that often surpass other cereal products (Graf et al.,
2015). While highly nutritious, quinoa has historically met with limited consumer acceptance
due to its strong flavor and bitterness, which results primarily from a high saponin content in the
outermost layer called the seed coat. Saponin is derived from the Latin word sapo, which means
“soap,” indicating the tendency for these compounds to create stable, soap-like foams in an
aqueous solution (Troisi et al., 2015). The level of bitterness arising from saponins varies
depending on specific molecular structures, but many saponins are very unpleasant in flavor
(Oleszek & Oleszek, 2019). Additionally, due to their hemolytic properties, saponins may have
some degree of cytotoxicity if consumed at high levels (Oleszek & Oleszek, 2019).
Consequently, quinoa seeds must be either physically abraded or water-washed to reduce the
saponin content in the seed coat to acceptable bitterness levels for consumers (El Hazzam et al.,
2020). Saponin levels are highly variable across quinoa varieties (0.03% - 2.05%) and are
categorized as bitter (> 0.11%) or sweet (< 0.11%); thus, wash times across varieties are
inconsistent (Mastebroek, Limburg, Gilles, & Marvin, 2000; Koziol, 1991). Due to this
variability and their adverse sensory properties, manufacturers measure saponin levels
throughout processing. This testing requires interruption of the cleaning process and slows down
throughputs.
2
The most commonly used method for determining saponin levels is the afrosimetric foam
height method, which relies on measuring the amount of foam generated during shaking a
sample of seed in water (Koziol, 1991). This method, hereafter referred to as the foam method, is
simple and rapid - generally taking less than 5 min to perform (Koziol, 1991), and for this
reason, it is commonly used in industry and agricultural testing (Medina-Meza, et al., 2016). One
requirement of a method to be feasible for quality control applications in industry is that it must
return results rapidly as possible. Despite its simplicity, the foam method is somewhat subjective
and unreliable, especially as saponin levels decrease near the end of the washing process, making
the foam height harder to measure (personal communication, Scott Baker/Ardent Mills; León-
Roque, et al., 2019; Medina-Meza, Aluwi, Saunders, & Ganjyal, 2016). The foam head is
measured with a ruler or calipers and a formula is used to calculate the relative saponin
concentration for the sample. If concentration levels are too high, the washing step is repeated.
Once the saponin concentration falls within derived specifications, the quinoa can continue down
the production line to be dried, packaged, and shipped. Despite its lack of accuracy and
reliability, the foam method is still commonly used because more reliable methods can take
anywhere from 30 min to many hours to perform (Hiai, Oura, & Hakajima, 1976; León-Roque et
al., 2019; Limsuwanchote, et al., 2014; Soltani, Parivar, Bharara, Kreachian, & Asili, 2014;
Ridout, Price, DuPont, Parker, & Fenwick, 1990; Ruiz, et al., 2017). Consequently, large
quantities of quinoa seed are being processed in facilities throughout the world, with no
satisfactory analytical method that can be used to accurately and rapidly quantify residual
saponins.
A satisfactory method would quickly, accurately, and reliably determine the amount of
residual saponins remaining on the seed following washing. Such a method would improve the

3
consistency, quality, and safety of quinoa, while at the same time potentially saving wash water.
One technique which might have potential as a rapid, quantitative saponin assay is a UV/Vis
spectrophotometric method described by Guzmán, Cruz, Alvarado, & Mollinedo (2013). The
method relies on spectrophotometric analysis of color development in an aqueous saponin
extract, following reaction with a mixture of sulfuric acid and acetic anhydride, known as
Liebermann-Burchard (LB) reagent. As reported in the literature, it takes approximately 40 min
for the LB reagent to fully react with the saponin in the quinoa filtrate. However, since color
development begins almost immediately, and the color intensity is dose-dependent from the
outset, there is potential for this method to be developed into a rapid assay to be used in
commercial processing. Therefore, the aim of this study was to develop a rapid and accurate
assay for quantification of saponins on quinoa seed during commercial processing by shortening
the reaction time between the saponin extract and the LB reagent, and to compare the new assay
to the standard foam method.
2 MATERIALS AND METHODS
2.1 Materials and chemicals
Quinoa seed (cultivar Medano, grown in San Luis Valley, CO, USA) was obtained from a
commercial processor. Ten 50g samples each of unwashed and washed seed were collected from
each of three different production lots. During processing, most of the quinoa seed coat was
removed by physical abrasion before washing, according to the processor’s typical protocol.
(The quinoa seed lots were batch cleaned). Saponin-rich powder, removed from the seed coat
during the abrasion step, was also obtained from the same facility for use in preparation of

4
saponin standard. Samples were shipped in plastic bags labeled with lot code, sample number,
and as either unwashed or washed. The bags were stored in a – 20 ℃ freezer until analysis.
Analytical reagent grade (ACS) acetic anhydride was purchased from Mallinckrodt Baker Inc.
Phillipsburg, NJ, USA. Sulfuric acid, methanol, and petroleum ether (all ACS analytical reagent
grade) were purchased from J.T. Baker, Center Valley, PA, USA. Ethanol (190 proof) was
purchased from Decan Laboratories, Inc., King of Prussia, PA. Qualitative filter paper (P4,
medium to fine porosity, slow flow rate) was obtained from Fisher Science, Waltham, MA. LB
reagent was prepared by combining sulfuric acid and acetic anhydride in a 5:1 ratio. The LB
reagent is kept on ice in the hood when being used and stored in the refrigerator between testing.
Water used in assays, reagents, and extractions was distilled and deionized.
2.2 UV/Vis assay
In an effort to keep the total time for analysis as short as possible for industrial quality control,
we also sought to reduce the time needed for analysis of the saponin solutions. One method of
analysis is GC-MS, but this requires lengthy hydrolysis and derivatization steps that take up to
24 hours to complete (Ridout, 1991). Similarly, HPLC is also a time-consuming method to
complete (Endale, Kammerer, Gebre-Mariam & Schmidt, 2005). For this reason, sample extracts
were prepared and analyzed with some modifications from the method of Guzmán et al., (2013)
and Gianna (2013). To a 16 mm x 130 mm glass test tube, 1.75 mL of chilled LB reagent was
added. To eliminate or minimize color development before vortexing (Scientific Vortex - Genie
2, VWR Radnor, PA) a 0.5 mL aliquot of saponin filtrate was added slowly down the side of the
tube, to layer it on the top. The contents were immediately vortexed for 30 s before pouring into
a cuvette and reading the absorbance at 528 nm. The LB color reaction begins immediately upon
mixing, so the time between vortexing and reading on the spectrophotometer must be

5
standardized, and ideally should be complete within 10 sec of removal from the vortex. Each
sample extract of filtrate was analyzed in duplicate. The spectrophotometer (UV 3100PC, VWR
Scientific, Radnor, PA, USA) was calibrated upon each use at 528 nm using a 0.5 mL water
blank.
2.3 Saponin quantitation by Foam method
The foam method was performed according to Koziol (1991). Quinoa seed (0.5 g) and 5 mL of
water were added to a test tube that was then capped and vigorously shaken (~ 4 shakes/s, up and
down movement) for 30 s. The tube contents were allowed to rest for 20 s. A ruler was used to
measure the foam height (above the water) to the nearest 0.1 cm. Saponins were quantified
utilizing the equation calculated by Koziol (1991).
2.4 Aqueous saponin extraction for UV/Vis quantitation method
One significant limitation to precision and accuracy of the standard foam method is that it
specifies a sample size of 0.5 g seed in 5 mL water. In order to increase sample homogeneity and
saponin concentration in the washed seed extracts, a greater amount of seed was used in the
UV/Vis method. In early work, saponins were extracted for UV/Vis analysis using manual
shaking, similar to the foam method, by placing 2 g seed and 5 mL water in a test tube before
shaking for 30 s. The liquid was vacuum filtered and further analyzed using the UV/Vis assay
described earlier.
Later, to minimize human variation during shaking, saponins were instead extracted
using a rotary mixer (Caframo BDC1850, Georgian Bluffs, Ontario, Canada) with a 10MTP-D13
flat, u-shaped rotor head (5 x 5 cm). Twenty g quinoa were combined with 50 mL water in a 500
mL plastic graduated cylinder (35 cm ht. x 5.4 cm i.d.) and mixed with the rotor speed set at 900
6
rpm for 3 min. The resulting mixture was vacuum filtered using a Buchner funnel and P4 filter
paper. The filtrate was held at room temperature and a sub-sample was analyzed using the
UV/Vis assay within 5 mins. Using this 3-min rotary mixer extraction, the linear correlation and
variance of color development after 30 sec LB reaction time was tested at four different saponin
levels by adding 3, 6, or 9% unwashed seed to the extraction sample.
2.5 Saponin standard
A saponin standard was prepared following the method of Koziol (1991) with modification.
Approximately 10 g quinoa seed coat powder was defatted on the Soxhlet apparatus using
approximately 150 mL petroleum ether for 5 hr, with a drip rate of 5 –7 drips per sec; the
resulting ether-lipid extract was discarded. The sample was then extracted using about 150 mL
methanol for 8 hr, at a rate of 3 – 5 drips per second. The extract was evaporated to dryness using
a vacuum-assisted rotary evaporator (Buchi R-215, New Castle, DE, USA) at 50 oC and 120
RPM. The extracted saponin standard was then stored in a desiccator at room temperature until
use. Purity of the saponin standard was assessed at 77% by subtracting the percentages of ash,
protein, and water as per the method of Koziol (1991). Protein was completed by an external
laboratory using the Kjeldahl method of McGeehan & Naylor (1988). Ash was obtained by
incineration at 550 ºC for 4 hours. Water content was assessed by oven drying at 102 ºC for 4
hours.
2.6 Standard curves
For the standard curves, an initial saponin stock solution was created by weighing 112 mg
saponin standard into a 10 mL volumetric flask and bringing to volume with 50% ethanol. This
stock solution was diluted according to the following methods to create the following standard
curves: foam and UV/Vis.

7
For the foam standard curve, the stock solution was diluted with water to obtain 5 mL
samples of each desired concentration (0.2 – 0.6 mg/mL in 0.1 mg/mL increments), which were
then shaken and analyzed according to the foam method of Koziol (1991).
For the UV/Vis standard curve, the stock solution was diluted with water to create a
similar concentration series. A sample from each concentration was measured on the
spectrophotometer at 528 nm as detailed above. A single sample was measured twice at the given
concentration for the standard curve. Utilizing the line equation from the curve, and accounting
for amounts of water (50 ml) and seed (20 g) used in our UV/Vis extraction procedure, the A528
of a sample was converted to its concentration of saponin in terms of grams per 100 g quinoa.
The standard curve was prepared to encompass the expected saponin levels of in-process seed
samples nearing the end of the commercial washing step. Consequently, our commercially
washed quinoa filtrates tested fell within the A528 range of the curve, whereas the filtrate from
the unwashed quinoa were diluted ten-fold in order to fall within this range without
extrapolation. The calculated saponin concentration values from the diluted unwashed filtrates
were multiplied by the appropriate 10x dilution factor to obtain an estimate of actual saponin
concentration. The foam method was used to prepare a similar standard curve with the purified
saponin standard at the same concentrations used in the UV/Vis standard curve.
2.7 Experimental design and statistical analysis
Seed coat saponin levels of the commercial washed and unwashed quinoa samples (whole seed)
were analyzed using both the UV/Vis and foam methods to compare the relative accuracy and
reliability of the two methods at high and low saponin levels. For the UV/Vis method, two
replicate subsamples from each of the 10 sample bags collected from the washed and unwashed

8
seed within each of the three lots were analyzed. Two replicate A readings were taken on each
subsample extract.
For the foam method, 3 replicate subsamples from each of the 10 sample bags were
analyzed, but only a single foam-height reading could be taken for each subsample, since the
foam height measurement is the culmination of the extraction step.
Statistical analysis was generated using SAS software version 9.4 (SAS Institute Inc.,
Cary, NC, USA). The VarComp analysis was utilized to determine estimates of variance by
source, controlling for lot, bag, and replicate analyses. VarComp was performed on the entire set
of commercial seed analytical data comparing the three lots and their subsamples of washed and
unwashed quinoa using the two treatment methods, foam and UV/Vis. The variances were
compared based on magnitude of the coefficients of variation (CV). Analysis of variance
(ANOVA) was performed on the standard curves to determine significance with 95% confidence
and generate a connecting letters report, using JMP software version 15.
3 RESULTS AND DISCUSSION
3.1 Development of a rapid UV/Vis assay
As previously stated, color development in the UV/Vis assay begins immediately after mixing
the LB reagent with the seed-coat extract. The mixture continues to darken as the reaction
proceeds to completion over about a 40 min period (Guzmán et al., 2013). However, if color
development over time is linear and correlates well with saponin content of the extract, the
reaction time required prior to reading on the spectrophotometer could be significantly reduced.

9
In preliminary work, we compared color development, after 30 s reaction time in a series
of seed coat extracts prepared from commercially washed quinoa samples containing increasing
amounts (0, 10, and 20%) unwashed seed. Results (Figure 1) showed a direct correlation (R2 =
0.9967) between the percentage of unwashed seed in the extracted sample (equated with saponin
content) and A528, suggesting that a more rapid UV/Vis method could be developed using a 30 s
reaction time, instead of the 15 – 40 min reaction time cited in other papers.
Figure 1. Color change and absorbance (A528) of extracts from samples of commercially washed quinoa containing three different levels (0, 10, and 20%) of added unwashed seed. Measurements were taken 30 sec after mixing with LB reagent. Pictured (b) from left to right are the 0, 10, and 20% extracts shortly after mixing with LB reagent (N = 2) (p < 0.05).
3.2 Extraction method – Foam vs. UV/Vis
All saponin assay methods are composed of a two-step process: extraction followed by analysis.
Reported extraction methods and times include Soxhlet extraction, ranging from 16 hours
y = 0.0351x + 0.0568R² = 0.9967
0
0.1
0.2
0.3
0.4
0.5
0.6
0.7
0.8
0.9
1
0 10 20 30
A528
% unwashed quinoa present (w/w)
10%0% 20%
a
b
b

10
(Ridout et al., 1991) to 72 hr (Woldemichael & Wink, 2001); microwave extraction as performed
by Gianna (2013) for 20 min; extraction via sonication for 15 min (Navarro del Hierro et al.,
2018; Herrera, Navarro del Heirro, Fornari, Reglero, & Martin, 2019) and — most commonly —
magnetic stirring, ranging from 1 hr (Verza et al., 2012) to 24 hrs (Brady, Ho, Rosen, Sang, &
Karwe, 2007). All of these extraction methods are much longer than desired for a rapid, in-
process test for commercial quality control. The 30 s of manual shaking used for saponin
extraction in the foam-height method is extremely fast but produces variable results due to
human variation in shaking intensity. The variability of manual shaking is evident in the
relatively wide error bars for the sample readings in Figure 1, which utilized this procedure for
extraction.
In order to obtain more consistent extractions than can be achieved by manual shaking or
vortexing, an extraction method using a rotary mixer was utilized. Mixing inside a narrow
graduated cylinder, with only 2 mm clearance between the rotor head and cylinder walls,
produced significant shear forces at high rpm. Since our focus was on process specification
targets for the endpoint of a commercial wash process, commercially washed quinoa seed was
used to identify a mixing time to adequately extract residual saponins from the seed coat.
Increases in extract absorbance with increased mixing time, as indicated in Figure 2, reflect
incomplete extraction at lower mixing times. The A528 curve began to level off at about 1.5 min,
indicating that most of the residual saponins were extracted by that time. However, a 3 min mix
time reflected the slight increase in absorbance to that time point and provided a more complete
extraction. Continuing to mix for longer than 4 min resulted in the seed softening and breaking
open, which could allow saponins and other materials from inside the seed to be extracted. The 3

11
min mix time allows the method to fit within the time constraints for commercial application,
with predictable results.
Figure 2. Absorbance at 528 nm of aqueous extracts from washed quinoa seed mixed for specified times using a rotary mixer. Error bars represent 95% confidence intervals (N = 6) (p < 0.05).
3.3 Spectrophotometric assay
As stated previously, the traditional UV/Vis method specifies a 30 – 40 min incubation time after
mixing LB reagent and saponin extract (Gianna, 2013; Guzmán et al., 2013; Medina-Meza et al.,
2016), but we observed in preliminary results that immediate color development may be
sufficient to assess the saponin concentration (Figure 1).
Figures 3a & 3b compare the linear correlation between saponin content (expressed in
terms of % unwashed seed in the extracted sample) and foam height or A528, for the foam and
0
0.01
0.02
0.03
0.04
0.05
0.06
0.07
0.08
0.09
0 0.5 1 1.5 2 2.5 3 3.5 4 4.5
Abso
rban
ce @
528
nm
Extraction Time (min)
aa
b
a
bc
c
d
a

12
UV/Vis methods respectively. The UV/Vis correlation produced an R2 value of 0.9932, which
exceeded that for the foam method (R2 = 0.8697). The foam method’s use of manual shaking for
extraction, coupled with the variability in reading the scant foam levels generated in washed
seed, are likely the chief contributors to the greater variation and lower correlation for that
method observed in Figure 3a. The narrow error bars produced by the rapid UV/Vis assay, as
seen in Figure 3b, likely result from the combination of the objective, mechanized extraction
technique, and a spectrophotometric absorbance endpoint. Figure 3b also confirms that
immediate color development is sufficient to differentiate saponin content.
y = 0.1794x + 0.0133R² = 0.869
-0.5
0
0.5
1
1.5
2
2.5
3
3.5
0 2 4 6 8 10
Foam
Ht (
cm)
Percent unwashed quinoa present (w/w)
b
a
b b
a

13
Figure 3a and 3b. Linear correlation between saponin content (expressed in terms of % unwashed seed in the sample) and foam height (3a) or A528 (3b) for the foam and UV/Vis methods respectively, utilizing four different levels of unwashed quinoa (p < 0.05).
3.4 Commercial Sample Analysis with Foam and UV/Vis Methods
Table 1 compares the distribution of variance around foam height and A528 means due to each of
the independent variables for the foam and UV/Vis analyses. Results for all samples of both
wash treatments were included in one statistical VarComp analysis, in order to assess variation
across the full range of saponin contents. The sources of variance (excluding “residual”) describe
the natural variability present between lots, bags, samples within bags, and replicate analyses
within samples. “Residual” error reveals the non-explainable variation inherent to each method.
The percent total variance was obtained by summing the variance values for both
treatments, then dividing by the total variance. The percent values allow us to observe how much
variance each component contributes relative to the total variance for that treatment.
y = 0.0546x + 0.0399R² = 0.9932
0
0.1
0.2
0.3
0.4
0.5
0.6
0 2 4 6 8 10
A528
Percent unwashed quinoa present in mix (w/w)
a
b
b
d
c

14
As expected, the largest source of variability in the raw data for unwashed seed is
explained by lot-to-lot variation of each treatment, which accounted for approximately 90% of
the total variance. The unwashed CVs are particularly extreme because the seed has undergone
minimal processing and came from different lots of quinoa.
Table 1. Variance analysis for foam height and A528 values of extracts from 10 bags of washed and unwashed quinoa seed within each of 3 lots (Foam: Mean = 0.898 cm, n =180; Spec: Mean = 0.063, n = 240)
Unwashed Seed Washed Seed Source of Variance Treatment SD CV Variance
% Total Variance
SD CV Variance
% Total Variance
Lot Foam 0.748 83.2% 0.559 90.3% 0.000 0.0% 0 0.00% Bag Foam 0.059 6.6% 0.004 0.65% 0.000 0.0% 0 0.00% Rep1 Foam 0.000 0.0% 0 0.00% 0.019 2.1% 0.0004 16.67%
Residual Foam 0.236 26.3% 0.056 9.05% 0.044 4.9% 0.002 83.33% 100% 100%
Lot Spec 0.034 53.4% 0.001 89.45% 0.016 24.7% 0.0002 60.86% Bag Spec 0.004 6.0% 1.45x10⁻⁵ 1.29% 0.008 12.5% 6.2x10⁻⁵ 18.84%
Sample2 Spec 0.012 18.5% 0.0001 8.94% 0.008 12.4% 6.1x10⁻⁵ 18.55% Rep Spec 0.000 0.5% 8.95x10⁻⁸ 0.01% 0.001 0.8% 2.77x10⁻⁷ 0.08%
Residual Spec 0.002 3.0% 3.45x10⁻⁶ 0.31% 0.002 3.7% 5.44x10⁻⁶ 1.66% 100% 100%
1Rep = Variance assignable to analytical replication. 2Extraction and measurement steps occur at the same time for the foam method, so sample-to-sample and analytical variation are the same.
Sample to sample variation accounted for the next largest amount of variance (8.94%),
when using the UV/Vis method. Due to the foam extraction and measurement steps occurring at
the same time, each extracted seed sample could be measured only once. Therefore, sample-to-
sample variation and analytical replication are the same and have negligible contribution to total
variance. With the UV/Vis method, on the other hand, a single sample extract was measured in
duplicate, adding an extra source of variation. Still, the contribution to variance from analytical
replication was very low (0.01%).

15
The UV/Vis method is more precise at determining the saponin content in unwashed
seeds, as evidenced by the residual data of Table 1, showing a residual CV nearly nine times
smaller than the foam method CV. Foam residual variance accounted for 9% of the total
variance, compared to only 0.3% for UV/Vis. The difference in precision between the two
methods is more pronounced in the unwashed quinoa, possibly because a large amount of foam
is generated using the foam method and differences are more readily detected.
For the washed seed, the residual error CVs for the two methods were quite similar, at
4.9% for foam and 3.7% for UV/Vis. However, these values do not give a complete picture of
the variation between the methods for analyses of washed seed. The foam method foam heights
could only be distinguished to the nearest 0.1 cm. This limitation in measurement resolution
makes it difficult to accurately distinguish between distinct concentrations, using the foam
method at low saponin levels, such as those in washed quinoa. Furthermore, the extremely low
level of foam generated from seed that is near the end of the washing stage of the process
dramatically increases the subjective error. The foam is a network of small air bubbles that vary
in their stability depending on the quantity and type of saponins present, their chemical structure,
surfactant activity, presence of other compounds in the extract, and agitation intensity (German,
O’Neill, & Kinsella, 1985; Rossi, Pagliarini, & Peri, 1985; Koziol 1991). In extracts from
washed quinoa seed, the foam height is very small, and the bubbles disappear very quickly; often
there are only 1, 2, or even no bubbles after the standard wait time of 20 s following shaking and
before measuring with a ruler.
In washed quinoa, the foam method foam height appears to reach the lower limit of
detection at some point before the commercial washing stage is complete, so that all
commercially washed quinoa samples return essentially the same foam height, regardless of

16
saponin content. This effect masks any variability inherent to the method. Consequently, the
variance analysis produced similar CV values for both foam and UV/Vis. However, the residual
error for the foam method accounted for 83% of the total variance, compared to only 1.7% for
the UV/Vis. The lower limit of detection for the foam method, compared to the UV/Vis method,
is more clearly elucidated by studying the standard curves depicted in Figure 4 below, which also
better illustrate the precision of each method in saponin ranges typical of washed quinoa.
3.5 UV/Vis standard curve & Foam method standard curve
The A528 values for the UV/Vis standard curve were plotted and produced excellent linearity
(Figure 4). The equation for the line was y = 0.1445x – 0.0128 with an R2 value of 0.965,
indicating excellent correlation between LB color development/absorbance and saponin
concentration. Furthermore, the UV/Vis A528 values for all dilutions were significantly different
(p-value < 0.05) from each other, except for the 0.2 and 0.3 mg/mL values. This suggests that the
UV/Vis method is sensitive at least down to the 0.3 mg/mL saponin level.
In Figure 4, the resulting standard curve created using the foam method is compared with
the UV/Vis curve. The foam method standard curve, by contrast, provides an R2 value of 0.727,
with none of the points statistically distinct from one another. At the low saponin concentrations
achieved near the end of the wash process, foam heights are too small to achieve accurate or
reliable results. Based on our results (Figure 4), it appears that the foam method is not sensitive
enough to accurately distinguish different saponin levels in the expected concentration range for
commercially washed seed. This detection threshold appears to be somewhere above the 0.6
mg/mL saponin level.

17
Figure 4. Comparison of statistical resolution of foam vs UV/Vis assays at low saponin concentrations (p < 0.05).
3.6 Quantitation
The composition of the in-house saponin standard was determined to be 3.3% moisture, 11.5%
protein, and 8.1% ash, yielding an estimated saponin concentration of 77.1% w/w. The
conversion equation, which incorporates the purity of the in-house standard and the linear
equation from the standard curve is therefore:
((absorbance + 0.0128)/0.1445)*50/20*100*0.771/1000
0
0.02
0.04
0.06
0.08
0.1
0.12
0.14
0
0.05
0.1
0.15
0.2
0.25
0.3
0.35
0.4
0.45
0 0.1 0.2 0.3 0.4 0.5 0.6 0.7
LB A
bsor
banc
e
Kozi
ol F
oam
hei
ght (
cm)
Concentration (mg/ml)
a
a
a a
a
d
d
a
c
b

18
Table 2. Saponin contents of 3 different lots of washed and unwashed quinoa seed as measured by the foam and rapid UV/Vis methods of analysis. (N = 80 for UV/Vis/60 for foam) (+ 1 SD)
Treatment Saponin g/100g Seed
Washed Seed Lot 1 Lot 2 Lot 3
UV/Vis 0.12 + 0.02a 0.09 + 0.02a 0.12 + 0.01a
Foam 0.1 + 0.1a 0.1 + 0.1a 0.1 + 0.1a
Unwashed Seed
UV/Vis 1.4 + 0.2a 0.8 + 0.1b 0.53 + 0.07c
Foam 2.0 + 0.2a 0.7 + 0.1b 1.7 + 0.3a
Saponin values reported by Mahda, Metougui, Hazzam, Kacimi, & Yasri (2020) and
Medina-Meza et al. (2016) range from 0.6 - 3.1 g saponin/100 g seed, who noted that values do
vary depending on the specific variety. Using the standard curve prepared from the quinoa
powder extract (Figure 4), the calculated saponin values for washed seed are comparable to
values from other quantitative studies reported in the literature. The UV/Vis method returned
values of 0.09 – 0.12 g/100g seed for washed seed and 0.53 – 1.41 g/100g seed for unwashed,
compared to values of 0.1 g/100g and 0.7 – 2 g/100g respectively, using the foam method (Table
2). Note that the standard deviation for the foam method in the washed samples is 100% of the
mean, and the means are identical due to lack of resolution. Significant differences exist between
treatment results for the unwashed seed samples, with the foam method results being
significantly higher for lots 1 and 3. The reason for this discrepancy, and the accuracy of the
results is unclear. The potential exists that the extraction method used for the UV/Vis is
incomplete at the higher level, or the foam method leads to overestimates at the higher level, as
has been stated in the literature (Medina-Meza et al., 2016). The linearity of the curve in Fig. 3b,
where progressively greater amounts of unwashed quinoa were directly correlated with A528
19
values, further confirms the potential for the rapid UV/Vis method as a useful approach to
quantifying saponins in quinoa. Additional insights into quantification could also include
analyzing the in-house standard and/or quinoa samples with a higher sensitivity analytical
method, such as HPLC (Endale et al., 2005) to confirm its purity, or using a GC or HPLC
method to more accurately quantify the saponin content of the analyzed samples. Our attempts to
utilize such methods failed to yield usable results, but this would be a logical next step.
Another approach to developing a specification target for confirming adequate removal
of saponins during commercial processing would be to correlate A528 values from the UV/Vis
method with consumer sensory acceptance values for quinoa seed. Different batches of seed
from a single lot could be washed to differing degrees to achieve a continuum of saponin levels
for sensory testing. The samples could then be tested against each other for bitterness strength,
flavor acceptance, and overall acceptance in a sensory panel. Such testing would allow direct
correlation of UV/Vis A528 values with consumer acceptance scores, to set specification upper
limits for commercial washing operations.
4 CONCLUSIONS
The UV/Vis method is adequate to measure saponins in both washed and unwashed quinoa seed
and is sufficient for use in industry as it is precise, simple, and rapid to complete. For many
applications, however, the foam method may be adequate for unwashed quinoa as it is faster than
the UV/Vis method, takes fewer materials to perform, does not use noxious chemicals, and the
foam height is large enough to measure relatively accurately. In an industry application, the
UV/Vis method is a more effective way to measure saponins in washed quinoa; the foam method
can be used to estimate the saponin content in unwashed quinoa seed lots upon arrival to the

20
manufacturing facility, as long as precision is not as important as speed. However, it is not a
useful method for evaluating saponin content in the final stages of processing, where saponin
levels are low. While the precision of the developed rapid spectrophotometric method is proven,
full assessment of its accuracy requires further study with advanced quantification methods.

21
References
Brady, K., Ho, C., Rosen, R. T., Sang, S., & Karwe, M. V. (2007). Effects of processing on the nutraceutical profile of quinoa. Food Chemistry, 100, 1209-1216.
El Hazzam, K., Hafsa, J., Sobeh, M., Mhada, M., Taourirte, M., El Kacimi, K., & Yasri, A. (2020a). An insight into saponins from quinoa (chenopodium quinoa willd): A review. Molecules, 25, 1059.
Endale, A., Kammerer, B., Gebre-Mariam, T., & Schmidt, P. C. (2005). Quantitative determination of the group of flavonoids and saponins from the extracts of the seeds of glinus lotoides and tablet formulation thereof by high-performance liquid chromatography. Journal of Chromatography A, 1083, 32-41.
FAO. Food and Agriculture Organization of the United Nations. (2020). FAOSTAT Statistical Database. [Rome].
German, J. B., O'Neill, T. E., & Kinsella, J. E. (1985). Film forming and foaming behavior of food proteins. Journal of the American Oil Chemist’s Society, 62, 1358.
Gianna, V. 2013. Extracción, cuantificación y purificación de saponinas de semilla de chenopodium quinoa willd provenientes del noroeste argentino. Doctoral Thesis. Universidad Nacional de Córdoba. Córdoba, Argentina. https://rdu.unc.edu.ar/handle/11086/1413
Graf, B. L., Rojas‐Silva, P., Rojo, L. E., Delatorre‐Herrera, J., Baldeón, M. E., & Raskin, I. (2015). Innovations in health value and functional food development of quinoa (chenopodium quinoa willd.). Comprehensive Reviews in Food Science and Food Safety, 14, 431-445.
Guzmán, B., L Cruz, D., Alvarado, J. A., & Mollinedo, P. (2013). Cuantificación de saponinas en muestras de cañihua chenopodium pallidicaule aellen. Revista Boliviana De Química, 30, 131-136.
Herrera, T., Navarro del Hierro, J., Fornari, T., Reglero, G., & Martin, D. (2019). Acid hydrolysis of saponin‐rich extracts of quinoa, lentil, fenugreek and soybean to yield sapogenin‐rich extracts and other bioactive compounds. Journal of the Science of Food and Agriculture, 99, 3157-3167.
Hiai, S., Oura, H., & Nakajima, T. (1976). Color reaction of some sapogenins and saponins with vanillin and sulfuric acid. Planta Medica, 29, 116-122.
Koziol, M. J. (1991). Afrosimetric estimation of threshold saponin concentration for bitterness in quinoa (chenopodium quinoa willd). Journal of the Science of Food and Agriculture, 154, 211-219.
León-Roque, N., Aguilar-Tuesta, S., Quispe-Neyra, J., Mamani-Navarro, W., Alfaro-Cruz, S., & Condezo-Hoyos, L. (2019). A green analytical assay for the quantitation of the total saponins in quinoa (chenopodium quinoa willd.) based on macro lens-coupled smartphone. Talanta, 204, 576-585.
22
Limsuwanchote, S., Wungsintaweekul, J., Yusakul, G., Han, J., Sasaki-Tabata, K., Tanaka, H., Shoyama, Y., & Morimoto, S. (2014). Preparation of a monoclonal antibody against notoginsenoside R1, a distinctive saponin from panax notoginseng, and its application to indirect competitive ELISA. Planta Medica, 80, 337-342.
Mastebroek, H. D., Limburg, H., Gilles, T., & Marvin, H. J. P. (2000). Occurrence of sapogenins in leaves and seeds of quinoa (chenopodium quinoa willd). Journal of the Science of Food and Agriculture, 80, 152-156.
McGeehan, S. L. and Naylor, D. V. (1988). Automated instrumental analysis of carbon and nitrogen in plant and soil samples. Communications in Soil Science and Plant Analysis, 19, 493-505.
Medina-Meza, I. G., Aluwi, N. A., Saunders, S. R., & Ganjyal, G. M. (2016). GC–MS profiling of triterpenoid saponins from 28 quinoa varieties (chenopodium quinoa willd.) grown in washington state. Journal of Agricultural and Food Chemistry, 64, 8583-8591.
Mhada, M., Metougui, M. L., El Hazzam, K., El Kacimi, K., & Yasri, A. (2020). Variations of saponins, minerals and total phenolic compounds due to processing and cooking of quinoa (chenopodium quinoa willd.) seeds. Foods, 9, 660.
Navarro del Hierro, J. N., Herrera, T., García-Risco, M. R., Fornari, T., Reglero, G., & Martin, D. (2018). Ultrasound-assisted extraction and bioaccessibility of saponins from edible seeds: Quinoa, lentil, fenugreek, soybean and lupin. Food Research International, 109, 440-447.
Oleszek, M. and Oleszek, W. (2019). Saponins in food. In J. Xiao, S. D. Sarker & Y. Asakawa (Eds.), Handbook of Dietary Phytochemicals Journal (pp. 1-40). Singapore: Springer.
Personal Communication, Scott Baker. Ardent Mills. 2020.
Ridout, C. L., Price, K. R., Dupont, M. S., Parker, M. L., and Fenwick, G. R. (1991). Quinoa saponins—analysis and preliminary investigations into the effects of reduction by processing. Journal of the Science of Food and Agriculture, 54, 165-176.
Rossi, M., Pagliarini, E., & Peri, C. (1985). Emulsifying and foaming properties of sunflower protein derivatives. Lebensmittel-Wissenschaft & Technologie, 18, 293-299.
Ruiz, K. B., Khakimov, B., Engelsen, S. B., Bak, S., Biondi, S., & Jacobsen, S. (2017). Quinoa seed coats as an expanding and sustainable source of bioactive compounds: An investigation of genotypic diversity in saponin profiles. Industrial Crops and Products, 104, 156-163.
Soltani, M., Parivar, K., Bharara, J., Kerachian, M. A., & Asili, J. (2014). Hemolytic and cytotoxic properties of saponin purified from holothuria leucospilota sea cucumber. Reports of Biochemistry & Molecular Biology, 3, 43.
Troisi J., Di Fiore R., Pulvento C., D’Andria R., Vega-Gálvez A., Miranda M., Martínez, E.A. & Lavini A. (2015). Saponins. In D. Bazile, D. Bertero & C. Nieto (Eds.), State of

23
the art report on quinoa around the world in 2013 (pp. 267-277). Rome: FAO & CIRAD.
Woldemichael, G. M. and Wink, M. (2001). Identification and biological activities of triterpenoid saponins from chenopodium quinoa. Journal of Agricultural and Food Chemistry, 49, 2327-2332.
Verza, S. G., Silveira, F., Cibulski, S., Kaiser, S., Ferreira, F., Gosmann, G., Roehe, P. M., and Ortega, G. G. (2012). Immunoadjuvant activity, toxicity assays, and determination by UPLC/Q-TOF-MS of triterpenic saponins from chenopodium quinoa seeds. Journal of Agricultural and Food Chemistry, 60, 3113-3118.

24
APPENDIX 1: EXTENDED REVIEW OF THE LITERATURE
1 QUIONA
Currently, between 30% and 70% of individuals receive their daily calories primarily from
cereal-based foods. Consequently, a crop that can be grown in many locations, has a good micro
and macronutrient profile, and is simple to grow is important for population expansion. Quinoa is
the ideal choice for this grain. In the past, quinoa has played a key role in political and social
systems, as well as the livelihood of the Andean societies. Quinoa, known as the “Rice of the
Incas” (Chenopodium quinoa Willd.) is indigenous to the Andean region and is a grain-like
product which provides great nutritional benefit to one’s diet (Quiroga et al., 2015). Quinoa has
stress-tolerant properties and is known as a “superfood” due to its nutritional aspects (Graf et al.,
2015). The global demand for quinoa has resulted in an increase in production at the locations it
originates from (Quiroga et al., 2015) and has resulted in cultivation in other countries. Over the
years, the number of countries growing the crop has increased from 6 to 13, and an additional 23
are actively experimenting with potentially growing quinoa in the future. The Chenopodium
genus is cosmopolitan which means it can adapt to all environments throughout the world,
although it is specifically concentrated in subtropical and temperate regions (Bazile & Baudron
2015).
Quinoa is a part of the genus Chenopodium (Chenopodiaceae) and encompasses 150 species that
are mainly herbaceous plants that occupy large regions of Europe, Asia, and America. As a dicot
crop, quinoa is a part of the Amaranthaceae family, and is not a cereal grain like corn, wheat, or
rice and is actually considered a “pseudocereal” (Planella, López, & Bruno, 2015). The fruits of
quinoa are achenes which are made up of one seed that is protected by an outer pericarp
(Planella, et al., 2015). Each quinoa seed contains the main perisperm where reserves of

25
carbohydrates are localized, surrounded by a spherical protein-rich and oil-rich embryo,
endosperm, and seed coat (Prego, Maldonado, & Otegui, 1998). The quinoa’s pericarp contains
bitter saponins which must be removed either by mechanical washing, or abrasion prior to
consumption (Prego et al., 1998; Vega‐Gálvez, et al., 2010). This process is termed
desaponificaiton (removal of saponins). The abrasion process can be referred to as pearling
(Gómez-Caravaca, Iafelie, Verardo, Marconi, & Caboni, 2014), husking, (Miranda et al., 2012),
scarification (Aluwi, et al., 2016), or milling (Kumpun, et al., 2011).
2 TRADITIONAL USE
2.1 A Brief History of Quinoa Cultivation
Quinoa seed was a staple crop in pre-Columbian times for the Incas which lead to them terming
the grain “mother grain,” as they regarded it as a gift from “Inti,” the sun god (González, Eisa,
Hussin, & Prado, 2015). Throughout South America many indigenous people, for instance, the
Aymara, Mapuche, Quechua, Chibcha, and Tiahuancota have consumed quinoa (Vega‐Gálvez, et
al., 2010; Bhargava & Srivastava, 2013). Quinoa seed is consumed similar to rice, and can be
puffed, used in baked goods and soups, ground into a flour, and toasted (Popenoe, King, León, &
Kalinowski, 1989; Bhargava, Shukla, & Ohri, 2006).
Quinoa has a large genetic diversity. There are an estimated 5,000 various accessions of
the crop located in seed banks all over the world. Quinoa is efficient at using water, has
halophytic characteristics, can survive in a wide range of temperatures (- 4 ℃ to 38 ℃), requires
little rainfall, grows in nutrient-depleted soils with pH from 6.0 to 8.5, high salinity, and tolerates
frost (Graf et al., 2015). The largest global region for the production of quinoa is the Salar de

26
Uyuni which are salt flats located in the provinces of Potosí and Oruro in Bolivia, indicating that
the crop can withstand extreme conditions (Graf et al., 2015).
3 POPULARITY & COMMERICAL USE
Between 2005 and 2013, the worldwide demand for quinoa, specifically Bolivian quinoa,
increased in Germany by 361%, in France by 207%, and in the United States by 1120% (Quiroga
et al., 2015). Overall, 25,660 tons of seed were exported at a total value of 78.9 million US
dollars. As the years' progress, organic and conventional quinoa demand continues to increase.
The production of quinoa in 2012 increased from 23,240 tons to 44,260 tons (Quiroga et al.,
2015). Quinoa is a versatile seed-crop with multiple seed colors (white, yellow, red, etc.), and is
incorporated into many products such as pasta, burgers, chips, quinoa milk, soups and side dishes
with quinoa (quinoa cups). In addition, one of the reasons quinoa is so popular is because it is a
highly nutritious product.
Global warming has affected not only the planet and its animals but also crop physiology.
The impact of global warming on crop physiology is not fully comprehended currently, but there
is evidence suggesting a decrease in crop yield as a potential response. With the increase in
climate change, crops throughout the world may have lower yields with the possibility that their
growing regions may shift in location or disappear. Thus, it is of immediate importance to
identify plant species that can grow in various temperature and altitudinal levels. Quinoa
(Chenopodium quinoa Willd.) is native to the Andean highlands, and potentially a great
alternative crop among many regions throughout the world and it can also grow at lower
elevations (González, et al., 2015).

27
Quinoa’s cultivation began around 7,000 years ago in South America, specifically the Andes
(Chevarria-Lazo, Bazileb, Dessauw, Trommettere, & Hocde, 2015). Due to the crops’
adaptability, introductions into higher latitudes took place with reports implying adaptations of
the species in Canada, Europe, and the United States (Jacobsen, 1997). Recent adaptations have
been in Morocco (Jellen et al., 2005), India (Bhargava, Shukla, & Ohri, 2006, 2007), and Italy
(Pulvento et al., 2010).
4 PHYTOCHEMISTRY & NUTRITIONAL VALUE
Quinoa contains a unique lipid, carbohydrate, amino acid, and micronutrient profile with nutrient
levels that often surpass other cereal products. A great deal of focus on the health benefits of
quinoa focuses on its macro and micro profiles, although the secondary metabolites of the grain
also can aid in the well-being and health of an individual. The secondary metabolites reported in
quinoa are phenolics, glycine betaine, triterpenoids (saponins, phytoecdysteroids, and
phytosterols), and betalains (Graf et al., 2015).
4.1 Protein
The quantity and quality of protein in quinoa is often superior to other cereal grains, and also
provides gluten-free and high digestibility properties. Relating to other grains, quinoa yields a
greater overall protein content (12.9% to 16.5%), than maize (10.2% to 13.4%), rice (7.5% to
9.1%), oat (11.6%), or barley (10.8% to 11.0%), and a protein content that is equal to wheat
(14.3% to 15.4%), (Wright, Pike, Fairbanks, & Huber, 2002; Repo-Carrasco, Espinoza,
Jacobsen, 2003; Comai et al., 2007; James 2009; Jancurová, Minarovicová, & Dandar, 2009;
Peiretti, Gai, & Tassone, 2013). The storage proteins of the seed contain mainly albumin and
globulin with very little to no prolamins which are the main storage protein found in many cereal

28
grains (Graf et al., 2015). Furthermore, according to the World Health Organization
(WHO)/Food and Agriculture Organization (FAO), recommendations for adult nutrition: the
protein in quinoa can supply one with 180% of their daily suggested consumption of essential
amino acids (Wright et al., 2002; James 2009; Vega‐Gálvez et al., 2010). The seed has proper
proportions of all ten essential amino acids (lysine, phenylalanine, tryptophan, valine, histidine,
threonine, leucine, isoleucine, methionine, and tyrosine) (Vega‐Gálvez et al., 2010; Miranda, et
al., 2012). The essential amino acid profile of quinoa is reported as being equivalent to that of
dried whole milk and casein by the FAO 2011. Moreover, lysine which is often a limiting amino
acid in cereal grains is twice as high in quinoa than in that of maize or wheat (Valcárcel-Yamani
& Lannes, 2012).
4.2 Carbohydrate & Fiber
Quinoa starch in dry seed weight comprises 58.1% to 64.2% of the total; although, it has a low
glycemic index (Vega‐Gálvezet al., 2010). The starch is comprised mostly of D-xylose (120
mg/100 g), and maltose (101 mg/100 g) with low fructose (19.6 mg/100 g), and glucose (19
mg/100 g) content (Bhargava et al., 2006). The starch molecules are highly branched, and
contain very small granules, as their particles are smaller than 2 μm in diameter, smaller than that
of other well-known cereal grains (Vega‐Gálvezet al., 2010). In reference to Lamothe,
Srichuwong, Reuhs, & Hamaker (2015), the seed contains 10% of one’s total dietary fiber. Fiber
is a carbohydrate fraction that is resistant to both enzymatic digestion, and also absorption on
one’s small intestine, and therefore, often undergoes partial or full fermentation in one’s large
intestine (Brownawell et al., 2012). Fiber is essential for ideal digestive health, and also yields

29
many functional benefits such as lipid adsorption, decrease in cholesterol, increase in satiety,
decrease in the risk and severity of gastrointestinal inflammation and infection, modulate
postprandial response of insulin, commence endogenous cholesterol conversion into bile acids,
and improve and aid intestinal microbiota (Brownawell et al., 2012; De Carvalho, Ovídio
Padovan, Jordão Junior, Marchini, & Navarro, 2014).
In addition, although the total fiber content of the seed is comparable to that of other cereals, the
composition of the monosaccharide subunit of quinoa fiber resembles more closely that of
legumes, vegetables, and fruits. The insoluble fiber of quinoa consists mostly of galacturonic
acid, xylose, glucose, galactose, and arabinose subunits which represent 78% of the total fiber
content found in quinoa. Soluble quinoa fiber consists mainly of arabinose, glucose, and
galacturonic acid subunits, constituting 22% of the total fiber found in the seed. Quinoas soluble
fiber content is greater than maize or wheat (~15% each) and may aid in the role of the seed’s
health-promoting potential due to the fermentability of the fiber by colonic microbiota which has
been recognized for the functional properties it contains (Lamothe, et al., 2015). Also, quinoa
contains no fructans, and therefore, has a small content of fructose. Thus, the seed can be
consumed on a “low fodmap diet,” and has shown to provide beneficial results to individuals
with irritable bowel symptoms (IBS) (Biesiekierski, Muir, & Gibson, 2013).
4.3 Lipid
The content of oil in quinoa seed ranges between 2% to 10% while the average being 5% to 7%,
greater than the content of oil found in maize (3-4%) (Vega‐Gálvez et al., 2010). In a recently
published study, it was found that the oil of quinoa seed contains 54.2% to 58.3% of

30
polyunsaturated fatty acids (PUFAs) and 89.4% of unsaturated fatty acids (UFAs). PUFAs are
mainly either 18:2n-6 or 18:3n-3, with ⍵-6 to ⍵-3 ratios of 6 to 1 (Tang et al., 2015). In quinoa,
the main essential fatty acids are linolenic acid (18:3); and linoleic acid (18:2) which are
metabolized to docosahexaenoic acid (DHA) and eicosapentaenoic acid (EPA), and arachidonic
acid, respectively. Each of these fatty acids is protected from vitamin E oxidation and additional
antioxidant constituents of the seeds. The essential fatty acids are significant in insulin
sensitivity, prostaglandin metabolism, brain development, cardiovascular health, membrane
function, inflammation, and immunity (Kim et al., 2006; McCusker & Grant-Kels, 2010; Vega‐
Gálvez et al., 2010).
4.4 Vitamins
Quinoa seed contains many vitamins that are essential to human health which protect against
damages from oxidation, act as enzymatic cofactors in one’s metabolism, modulate cell
development and growth, improve one’s vision, and aid in many additional physiological
processes (Fitzpatrick et al., 2012). The documented vitamins found in quinoa include
thiamin/vitamin B1, vitamin A precursor ꞵ-carotene, pantothenic acid/vitamin B5, ascorbic
acid/vitamin C, niacin/vitamin B3, folic acid/vitamin B9, tocopherols/vitamin E, and ascorbic
acid/vitamin C (Ruales & Nair, 1993; Bhargava et al., 2006; Vega‐Gálvez et al., 2010; Tang et
al., 2015). In addition, the seed contains a slew of carotenoids, mainly zeaxanthin and lutein,
with concentrations ranging from 1.2 to 1.8 mg/100 g. The concentrations of these provitamins
and vitamins found in quinoa are higher than in other common cereal grains (Bhargava et al.,
2006; Vega‐Gálvez et al., 2010; Tang et al., 2015).

31
4.5 Minerals
Overall, quinoa has a greater total mineral content (ash) at 3.4% than that of wheat (1.8%) and
rice (0.5%), and additional cereals (Bhargava, et al., 2006). The macronutrients copper, iron,
phosphorus, zinc, potassium, magnesium, and calcium are available in sufficient amounts in
quinoa seed allowing for a balanced diet (Repo-Carrasco et al., 2003; Bhargava et al., 2006;
Vega‐Gálvez et al., 2010). Although quinoa seed does contain less phytic acid when compared to
other cereal crops (Valencia-Chamorro, 2003); the seed has roughly twice the amount of soluble
iron concentration. To further increase the iron solubility and decrease the phytic acid content,
the seed can be cooked, fermented, or soaked (Valencia, Svanberg, Sandberg, & Ruales, 1999).
5 NUTRITIONAL VALUE OF QUINOA SEED
Quinoa contains a greater lipid content relative to other common cereals (Repo-Carrasco-
Valencia, 2011), and it is mostly located within the embryo. The oil of the seed is high in
polyunsaturated fatty acids (PUFAs) specifically linoleic and linolenic, and oleic acid.
The linolenic acid (ALA) and linoleic acid (LA) ratio found in quinoa oil is 6.2 (Alvarez-Jubete,
Arendt, & Gallagher, 2009) and is within the FAO/WHO (2010) recommended values. These
values are that of which an infant food should compose of, 3-4.5% energy from LA and 0.4-0.6%
from ALA which is in accordance with the LA/ALA ratio (n-6/n-3 ratio). Moreover, diets high
n-6/n-3 ratios lead to an increased risk of a multitude of degenerative diseases such as cancer,
cardiovascular disease, and autoimmune diseases (Simopoulos, 2006).
Starch, the main carbohydrate in the seed, is mainly concentrated in the perisperm and is present
as both large and small compound granules that contain individual granules (Prado, Gallardo, &

32
González, 1996; González, Roldan, Gallardo, Esudero, & Prado, 1989). Quinoa starch has high
amounts of amylopectin and can gelatinize at low temperatures (57 - 71 °C). Also, it has great
freeze-thaw stability which is due to the high levels of amylopectin in the seed (Ahamed,
Singhal, Kulkarni, & Pal, 1996). When comparing the seed to other cereals, it contains
significant quantities of thiamine, vitamin C, and riboflavin (Koziol, 1992; Ruales & Nair, 1993:
Repo-Carrasco et al., 2003). Folate is also present in high amounts in the seed (Schoelechner,
Wendner, Siebenhandl-Ehn, & Berghofer, 2010). In addition, quinoa has no allergenic
compounds, for instance, prolamine or gluten which are present in many cereals (Zuidmeer, et
al., 2008).
Moreover, there are many genotypes of quinoa seed ranging from 0.2 and 0.4g/kg DM (sweet
genotypes) to 4.7, and 11.3g/kg DM (bitter genotypes). The saponins are required to be removed
prior to consumption and can be easily removed through either abrasive dehulling or water
washing. The two methods are relatively similar in regard to the ability to remove saponins;
however, abrasive dehulling does not create wastewater although this method can lead to some
nutrients being lost (Repo-Carrasco-Valencia, 2011).
Additionally, the seed contains a high-quality protein having an excellent amino acid profile. The
seed contains essential amino acids such as threonine, tryptophan, methionine, and lysine which
are limiting amino acids in many other cereals (Gorinstein, et al., 2002). The protein quality is
indicated by a food product’s biological value (BV) which is an indicator of the protein intake
through relating nitrogen uptake to nitrogen excretion. Quinoa seed protein has a BV of 83%,
greater than that of fish (76%), beef (74.3%), soybean (72.8%), wheat (64%), rice (64%), and
corn (60%) protein (James, 2009).

33
6 SAPONINS
Saponin is derived from the Latin word sapo which means “soap,” indicating their tendency to
create stable, and soap-like foams in an aqueous solution. Roughly 50% of the overall weight of
a saponin molecule consists of sugar and aglycones. Saponins in quinoa are a mixture of various
triterpene glycosides which derive from seven different aglycones: phytolaccagenic acid,
3ꞵ,23𝛼𝛼,30ꞵ-trihydroxy-olean-12-en-28-oic acid, 3ꞵ-hydroxy-23-oxo-olean-12-en-28-oic acid,
3ꞵ-hydroxy-27-oxo-olean-12-en-28-oic acid, hederagenin, oleanolic acid, and serjanic acid. Most
of the sugars in saponins are either arabinose, galactose, or glucose (Troisi, et al., 2015).
Saponins are also glycosides that have a polycyclic aglycone (a glycoside-free area)
which can occur either in a triterpenoid choline or a steroid that is bound by the C3 carbon via an
ether bond to a single sugar chain. In addition, the steroidal saponins are regarded as sapogenins,
and the aglycone is referred to as sapogenin. Due to their water-soluble saccharide chain and fat-
soluble aglycone, saponins are amphiphilic; this attribute gives saponins the ability to create a
foam. The outer seed coat, known as the pericarp of quinoa, contains ample amounts of bitter
saponins which are a natural detergent molecule that is located throughout the kingdom of plants.
The saponins are primarily located on the outer seed coat but are mostly removed during
processing (abrasion or water washing) (Troisi et al. 2015). Saponins consist of a triterpenoid or
steroidal aglycone (often serjanic acid, oleanolic acid, phytolaccagenic acid, and hederagenin)
with at least one or more sugar moieties (Yendo, De Costa, Gosmann, & Fett-Neto, 2010). The
sugars can link to the aglycone at either the C-28 or C-3 position. Main sugar moieties
encompass xylose, arabinose, galactose, glucuronic acid, and glucose. Madl, Sterk, Mittlebach,

34
& Rechberger, (2006) identified nineteen prior reported saponins and 68 new saponin
compounds located in quinoa by means of nano-HPLC electrospray ionization multistage tandem
mass spectrometry (nLC-ESI-MS/MS) from a triterpene saponin complex of crude extract of
seed coats from quinoa (Graf et al., 2015).
Due to saponins affecting palatability they need to be removed prior to consumption.
There are varieties of quinoa that are bred to contain lower amounts of saponins (< 0.11%) and
are termed “sweet.” However, the “sweet” varieties are less resistant to pests and have increased
herbivory from birds. Saponins, while being unpalatable, do have desirable biological activities
that are applicable to human health which include antiviral, hypocholesterolemic, antithrombotic,
anti-inflammatory, antifungal, hypoglycemic, and diuretic activities (Madl et al., 2006; Vega‐
Gálvez et al., 2010).
Other properties of saponins include hemolytic activity when they come in direct contact with
blood cells, the formation of complexes with steroidal components such as cholesterol of cell
membranes and high foaming abilities within aqueous solutions (Stuardo, & San Martín, 2008).
As a result, saponins aid in crop protection from bird/insect herbivory, and microbial infection,
which allow for organic production of quinoa.
7 COMMERICAL PROCESSING
7.1 Harvest
The quinoa plant is ready to be harvested when it hits physiological maturity indicated by a color
alteration specific to the quinoa variety (colors include purple, reddish, black, pink, or a yellow

35
hue). The maturity is authenticated by the resistance (hardness) of the seed when one presses it
under their fingernail. The plant needs to be harvested within a certain time period in the
reproduction cycle to prevent losses due to threshing or bird attacks and to prevent grain
deterioration due to unexpected rainfall, snow, or hail.
The moisture content of quinoa at the desired maturity is between 10-13%, and within the plant,
it is 16-20%. These attributes can aid in the identification of the ideal time to harvest. Delaying
harvest by two or three weeks can result in major grain losses due to wind-induced threshing
(chafing of tassels and plants) (Quiroga et al., 2015).
7.2 Processing
Quinoa seed is not all uniform in size and shape; the average grain diameter is between 1.4 and 2
mm. To meet quality standards the seed is processed in terms of extraneous material, impurities,
size, microbiological, and bromatological requirements. As a result, all seed must go through
preliminary sorting, removal of unwanted items, mainly saponins, which can either be completed
by washing (wet method), or hulling/abrasion/pearling (dry method), drying, size sorting, color
separation, and removal of any additional impurities (Quiroga et al., 2015). In the washing
method, a sample of quinoa will be pulled for analytical testing, including saponin content. The
sample will be mixed with water and shook with the result being a foam head (Repo-Carrasco, et
al., 2003). The allowable level of foam is determined by individual companies; however, current
work is being done to develop an acceptable range for saponin content on quinoa lots to be used
as an industry standard.

36
APPENDIX 2: METHODOLOGY
1 SPECTROPHOTOMETRIC METHODS
In addition to the chromatographic and foam methods, there are three additional
spectrophotometric methods used: the vanillin-sulfuric assay, the Liebermann-Burchard assay,
and the hemolytic assay. The spectrophotometric method is commonly used as it is simple,
relatively fast, and uncomplicated to perform.
The vanillin-sulfuric assay method from Hiai, Oura, & Nakajima (1967), takes roughly 30
minutes to complete; however, there are many steps and thus leads to a tedious process of
saponin evaluation. A less complicated method similar to that of the vanillin-sulfuric assay is the
Liebermann-Burchard assay method. This method takes roughly the same amount of time as the
vanillin-sulfuric method; however, it is less complicated and yields similar results. This method
involves creating a reagent of acetic anhydride: sulfuric acid in a 1:4 ratio and adding a specified
quantity of the reagent into a test tube containing saponin filtrate. When the reagent is added into
the saponin filtrate, a color reaction will occur. Vortexing aids in the color development, and
allows for faster quantification of the abs of the solution. The color development is then analyzed
using a UV-VIS spectrophotometer at 528 nm. The hemolytic assay method takes roughly 5 hr to
complete and requires the use of human blood. Introducing blood into a food analysis setting is
not ideal and can lead to contamination. The article by Soltani, Parivar, Baharara, Kerachian, &
Asili (2014) was reviewed for the method of saponin extraction.

37
2 UV/VIS LIEBERMANN BURCHARD (LB) ASSAY
An additional spectrophotometric method is that of the Liebermann-Burchard (LB) reagent assay
Fiallos-Jurado et al., (2016), analyzed saponin content in quinoa leaves treated with methyl
jasmonate (MeJA) utilizing a spectrophotometric method. For saponin extraction, quinoa leaves
were obtained from MeJA non-treated and treated leaves of both bitter and sweet quinoa plants
at various time points upon the elicitation of MeJA. The levels of saponins were measured using
a spectrophotometric method described by Gianna with slight modifications. In this method,
Liebermann-Burchard reagent was used for the quantification of saponins due to it having the
capability to produce a light brown stain if specific compounds are present in a given sample.
The LB reagent is a mixture of 1:5 acetic acid to sulfuric acid. One mL of solution is mixed with
3.50 mL of LB reagent, and the absorbance at 528 nm in all samples is read after 10 mins. A
calibration curve from pure quinoa saponins was used to indicate the concentration of saponins
(mg/ml) in all solutions according to the absorbance measurements (Abs = 4.5725 x
concentration of saponins + 0.0164). The percent of saponin content was calculated on the fresh
weight of the sample. Furthermore, the Liebermann-Burchard assay was used by Gianna (2013),
Woldemichael & Wink (2001), and Guzmán, Cruz, Alvarado, & Mollinedo (2013). The two
methods using the LB reagent that are being studied and tested are Guzmán et al., (2013) and
Gianna (2013).
Materials
● Acetic Anhydride – Mallinckrodt Baker Inc. (500 mL, Lot: H43J09, ACS grade made in
the USA, Phillipsburg, NJ 08865, (CH3CO)2 97% (assay))

38
● Plastic graduated cylinder (35 x 5 cm)
● Sulfuric acid – J.T. Baker, Avantor Performance materials (2.5 L, Batch: 0000202724,
ACS reagent, Center Valley, PA 18034 USA, 95 – 98% H2SO4 (assay).
● Petroleum ether (4L, batch: 0000182961, ACS grade, Avantor Performance Materials
LLC, Center Valley, PA 18034, USA)
● Methyl alcohol, anhydrous (4L batch: 0000227958, ACS grade, Avantor Performance
Materials LLC, Radnor, PA 19087 USA)
● Distilled water
● Ethanol (190 proof) Decan Laboratories, Inc. (King of Prussia, PA)
● Soxhlet thimble; Extraction Whatman 33 x 94 mm
● P4 filter paper – Fisher brand filter paper, Fisher Scientific (qualitative 4, porosity:
medium to fine, flow rate: slow, diameter – 9.0 cm, pk of 100 circles, cat. No. 09-803-60)
● Caframo stirrer BDC1850 (Ontario, Canada) – 10MTP-D13 (2’ x 2’)
● Buchner funnel
● Buchner flask
● Vacuum tubing
● VWR UV 3100PC Spectrophotometer
● 13 x 100 glass test tubes
● VWR Ergonomic high performance pipettor 200-1000 µL
● VWR Ergonomic high performance pipettor – 5 mL
● VWR Scientific Vortex - Genie 2
Method

39
1. Measure 20.00 g quinoa seed with a top-loading balance and 50 mL distilled H2O into a
500 mL graduated cylinder.
2. Place the cylinder under the mixer at a height where the paddle just reached the bottom of
it (ensuring the solution is evenly mixed).
3. Extract saponins from seed with the rotary mixer at 900 rpm. Wait until the mixer reaches
900 rpm to start the timer. Mix the sample for 3 mins.
4. Decant the liquid out of the cylinder into a conical tube (try not to pour seeds if possible).
5. Filter the mixture under vacuum using P4 filter paper and Buchner funnel, then transfer
filtrate to labeled conical tube.
a. Place filter paper into the filter and turn on the vacuum.
b. Wet the filter paper with dd water, only until it is just barely wet (use the
least amount of water possible).
c. Pour quinoa mixture from conical tube onto filter paper and wait until all the
liquid has gone into the flask.
d. Wash out the conical tube and let it dry during the filtering process.
e. Lift up an edge of the filter paper to allow air into it.
f. Turn off the vacuum.
g. Remove the filter paper and filter.
h. Pour liquid from the flask back into the conical tube.
6. Using cool LB reagent (5:1 sulfuric acid, acetic anhydride) that is stored on ice in the
hood, add 1.75 mL to a clean test tube.
7. Carefully add 0.5 mL aliquot of filtrate to the wall of the test tube, letting the filtrate layer
rest on top of the LB layer.

40
8. Vortex on speed 3 for 30 s to mix.
9. Immediately transfer to cuvette and read on the spectrophotometer at 528 nm.
a. Spectrophotometer should have been previously blanked using 1.75 mL LB
reagent and 0.5 mL distilled H2O, vortex 30 seconds and blank at 528 nm
10. Record absorbance and repeat steps 6-9 with 2 more aliquots to verify readings.
3 AFROSIMETRIC (FOAM) METHOD
The foam method of Koziol (1991), also known as the afrosimetric method, is simple and easy to
perform. However, this method is highly variable especially at low levels of saponins. This
method is used in the industry currently to test th1e saponin content of washed quinoa. If the
saponin levels using the foam method are below a specified quantity, the lot can be moved along
the process of production (drying, packaging, etc.).
Ncube, Ngunge, Finnie, & Van Staden (2011) used the foam method from Koziol for saponin
extraction and quantification, with some adaptations in which 10 mL of water was added to a test
tube containing 0.1 g of sample. The test tubes were capped and shaken for 2 minutes. A
persistent and stable foam present after 15 mins of shaking indicated saponins (Tadhani &
Subhash, 2006). This article also uses the spectrophotometric method described in Hiai et al.
(1976) with modifications made to determine total saponins in their sample. To determine the
total steroidal saponins, the methods of Baccou, Lambert, & Sauvaire (1977) were used.
Materials

41
● Distilled water
● Quinoa seed
● 13 x 100 glass test tubes
● Test tube caps
● Ruler
Method
1. Add 5 mL water to test tube
2. Add 0.5 g quinoa seed
3. Shake tube vigorously for 30 s
4. Let test tube rest for 20 s
5. Measure foam height in cm with a ruler
4 EXTRACATION OF SAPONIN STANDAED METHOD
Materials
● Petroleum ether – Macron Fine Chemicals (35 – 60 oC)
● Methanol – Macron Fine Chemicals
● Isobutanol – Fisher ScientificEthanol – Decon Laboratories, Inc. 190 Proof
● Distilled water
● Soxhlet thimble (Extraction Whatman 33 x 94 mm)

42
● Soxhlet apparatus with condenser
● Rotovap – Buchi R-215, Switzerland
● Desiccator
Methods
A saponin standard was prepared following the method of Koziol (1991).
1. Measure approximately 10 g quinoa seed coat powder into a Soxhlet thimble and cover
the powder with glass wool
2. Defat on the Soxhlet apparatus using about 150 mL petroleum ether for 5 hr, drip rate >
3/sec, discarding liquid
3. Extract on Soxhlet using about 150 mL MeOH for 8 hr, drip rate > 3/sec.
4. Evaporate the methanol-saponin mixture to dryness in the rotovap. (syrupy solid will
remain)
5. Store in a desiccator at room temperature.
Purity was assessed by subtracting the percentages of contaminant, which were quantified in the
following ways:
Ash: A sample was portioned into a crucible and incinerated at 550 oC for 4 hr. Mass of the ash
was compared against the sample to obtain percent minerals
1. Preheat oven to 550oC

43
2. Take mass of a size crucible with the lid, taking care that everything is at room
temperature (only touch with gloved hands).
3. Measure out 300-700 mg desiccated saponin extract directly into crucible, then cap
the crucible and record the new mass.
4. Place in oven with tongs and let incinerate for 4 hr.
5. Remove crucible with tongs and carefully place in dessicator to let cool overnight
6. Take mass, then calculate the amount of ash present and percent ash of original
sample
Water: A sample was dehydrated in an oven at 102oC for 4 hrs
1. Preheat oven to 102oC
2. Take mass of room temperature flask with desiccated extract.
3. Place in oven in a beaker to prevent the flask from falling
4. Let dehydrate for 4 hrs
5. Remove with gloves and let cool overnight in desiccator.
6. Take new mass of just the room temperature flask and calculate percent water lost
Protein: Using the Dumas method on dried sample, protein content was estimated
1. Take desiccated and dried flask of saponin extract to the place.
2. Give sample to BYU environmental analysis lab (in the LSB).
44
5 CHROMATOGRAPHY
Chromatography can be used to quantify saponins in plant material. The main methods for
quantification of saponins are GC, and LC-MS.
5.1 GC Method
Materials
● Rotary evaporator - Rotovap R -215, Buchi
● Antifoam A concentrate - Sigma Aldrich
● Fisherbrand filter paper - P4
● Distilled water
● Test tubes
● Volumetric flasks (25 mL)
● Round bottom flasks (100 mL)
● GC vials - Agilent, Hi Rec, Crimp, 1.5 mL, Cir
● Fluke 52 II thermometer
● Magnetic stir bar
● Pipette (1000 uL, 100 uL, 5 mL)
● Quinoa seed (washed, unwashed, mixed ratio of unwashed to washed)
● Glass stopper
● Reflux
● Water
● Ring stand
● Trap flask

45
● Porcelain funnel
● Oleanolic acid (Sigma-Aldrich)
● Phytolaccagenic acid (Phytolab & Indofine Chemical Co.)
● Hederagenin (Sigma-Aldrich & TCI)
● Ethanol - 200 proof, anhydrous, meets USP specs, Decon labs Inc.
● Acetone - A18-4 Fisher Chemical
● ·HCl - Macron Fine Chemicals/A144-500 Fisher Chemical
● MeOH - A452-4, HPLC GRADE, Fisher Chemical
● NH4OH - Sigma-Aldrich 239313-500G
● Hydrion - pH - 1.0 - 14.0
● 10 mL separatory funnel
● Ethyl acetate - Fisher Chemical - E145-4
● Pipette tips (1000 ul, 100 uL 5 mL)
● Corning stirrer/hot plate
● VWR - sterile syringe filter 0.45 um PES
● Agilent green crimp cap IIMM, FEP/R TF2 SEPTA
● GC - Agilent technologies 7890A GC system
● 5890A Gas Chromatograph - Hewlett Packard Series II
● Na2SO4 - Mallinckrodt analytical grade
● 100 μl BSTFA (Pierce)
● 100 μl pyridine (Pierce)
● Reacti-Val Pierce model 18780, evaporating unit (Nitrogen)
● Crimper

46
● Hood
Methods
1. Weigh out 5 g of seed (Do not grind).
a. 100% unwashed seed (Ardent mills)
b. 100% washed seed (Ardent mills)
c. 50:50% unwashed to washed quinoa
2. Extract with 50 mL=l of 40% ethanol in distilled water (v/v), using magnetic stirrer (moderate
speed) at 50 °C for 1 hr. Speed of the stirrer is 3 and the heat setting is 2.5. A thermometer is
used to track the temperature of the solution during the extraction process.
3. Let the flask cool off for 10 mins, or place into an ice bath for 3 mins.
4. Filter the solution through Fisher filter paper P4 using a porcelain filter funnel and into a
round bottom flask. (The porcelain funnel and hooked it up to a clamp on a ring stand. The
solution was poured through the filter. Also, a trap flask was set up to prevent any possible water
from the vacuum from coming in contact with the solution).
a. Performed a quantitative transfer – meaning that the flask was rinsed out three
times and each time poured it into the filter (a total of three rinse and pours).
b. The solution is filtered into a round bottom flask as the flask is brought directly
over to the rotovap.
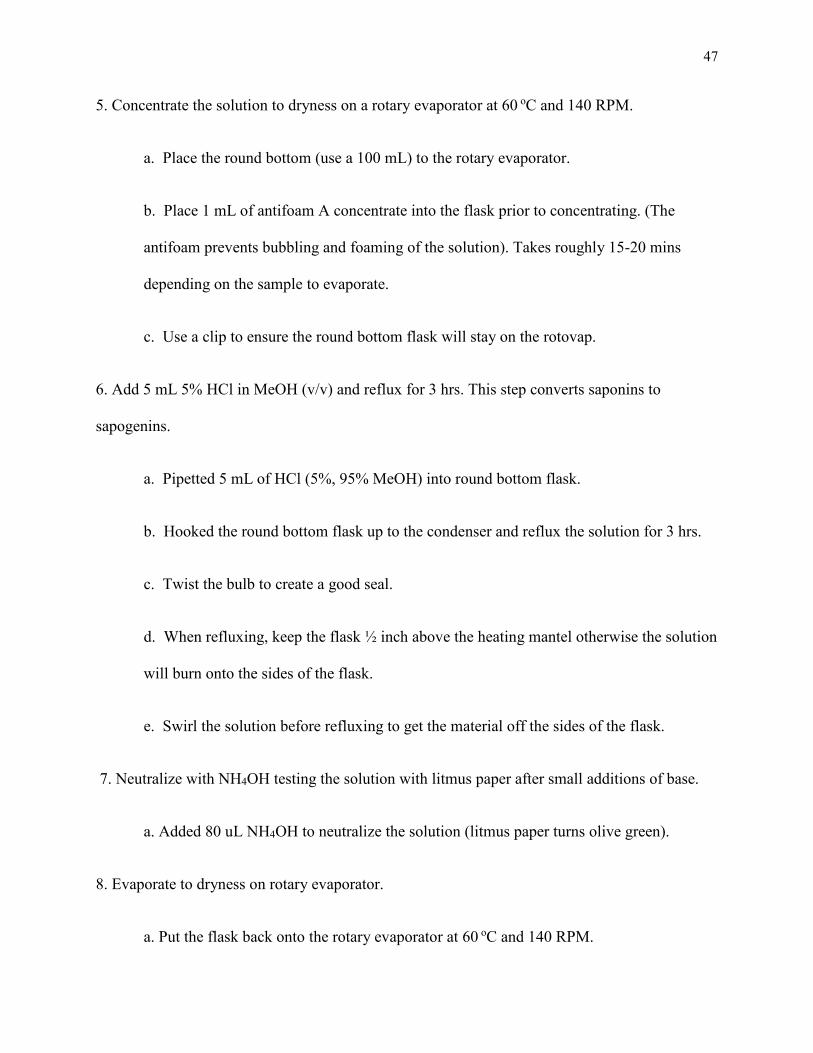
47
5. Concentrate the solution to dryness on a rotary evaporator at 60 oC and 140 RPM.
a. Place the round bottom (use a 100 mL) to the rotary evaporator.
b. Place 1 mL of antifoam A concentrate into the flask prior to concentrating. (The
antifoam prevents bubbling and foaming of the solution). Takes roughly 15-20 mins
depending on the sample to evaporate.
c. Use a clip to ensure the round bottom flask will stay on the rotovap.
6. Add 5 mL 5% HCl in MeOH (v/v) and reflux for 3 hrs. This step converts saponins to
sapogenins.
a. Pipetted 5 mL of HCl (5%, 95% MeOH) into round bottom flask.
b. Hooked the round bottom flask up to the condenser and reflux the solution for 3 hrs.
c. Twist the bulb to create a good seal.
d. When refluxing, keep the flask ½ inch above the heating mantel otherwise the solution
will burn onto the sides of the flask.
e. Swirl the solution before refluxing to get the material off the sides of the flask.
7. Neutralize with NH4OH testing the solution with litmus paper after small additions of base.
a. Added 80 uL NH4OH to neutralize the solution (litmus paper turns olive green).
8. Evaporate to dryness on rotary evaporator.
a. Put the flask back onto the rotary evaporator at 60 oC and 140 RPM.

48
b. The evaporation step only takes 4-5 mins.
c. Swirled the flask around prior to hooking it up to the rotary evaporator.
d. Use a clip to ensure the round bottom flask will stay on the rotovap.
9. Redissolve in 5 mL water and transfer to a separatory funnel.
a. Pour ethyl acetate and distilled water into two separate 25 mL beakers.
b. To the round bottom flask, add in 5 mL of water and swirl for 2 mins or longer
if necessary to remove most of the contents from the side of the flask.
c. Add the liquid to a 10 mL separatory funnel, and then add 5 mL ethyl acetate to
the funnel.
d. Shake the funnel for 15 s.
e. Allow for two distinct layers to form.
- Note: Ethyl acetate = lighter (top layer), water = heavier (bottom layer).
10. Extract 3x with 5 mL ethyl acetate. (Drain lower aqueous layer, then drain the upper organic
layer; return aqueous layer to funnel and repeat twice).
a. Drain the lower layer (dark layer) then dump the top layer into the ethyl acetate
beaker. Then add extracted water portion back into the funnel, and add 5 mL ethyl acetate
(fresh), and shake the funnel for 30 s. Then filter out the bottom layer (water layer) and
pipette out the ethyl acetate layer.
- Note: Want to collect the top layer for GC analysis. The bottom (darker) layer is being
filtered 3x to extract all saponins from solution).
49
11. Combine ethyl acetate extracts into one beaker and add Na2SO4 to dry (to absorb H2O, for 10
min).
a. Take roughly 1 g and add to a beaker containing ethyl acetate and let it sit for 10-15
mins.
12. Filter the ethyl acetate extract using 0.45 μm filter 1 mL into derivatization (small GC) vial.
a. Use a pipette and set to 1 mL. Obtain a syringe filter and add a 0.45 um filter. Then
use the pipette and take up 1 mL of extract and add to the syringe filter (the push portion
of the syringe is removed when adding the extract and then pushed back onto the
syringe). The extract is then pushed through the syringe and filter and collected into the
vial.
b. Do not cap the vial. Bring immediately to the GC lab.
13. Evaporate to dryness under a nitrogen stream.
a. Evaporation takes roughly 30 mins.
b. Remove from N2 station and bring over to the hood.
14. Add 100 μl BSTFA and 100 μl pyridine, then cap.
a. Use a crimper and cap the vial.
b. Vortex for 30 s.
15. Heat the vials in the oven for 20 min at 50°C to derivatize.

50
a. Turn on the oven using the button on the right side and then set the temperature and hit
start. To stop the oven, hit end and then turn off the button
16. Run on GC.
5. 2 LC-MS
Ruiz, et al, 2017 1. Measure approximately 10 g quinoa seed coat powder into a soxhlet thimble and cover
the powder with glass wool
2. Defat on the soxhlet apparatus using about 150 mL petroleum ether for 5 hr, drip rate >
3/sec, discarding liquid
3. Extract on soxhlet using a pre-weighed flask about 150 mL MeOH for 8 hr, drip rate >
3/sec.
4. Evaporate the extract to dryness using the rotovap at 50 oC and 120 RPM
5. Take mass of flask and calculate the mass of extract
6. Bring up in distilled water to a concentration of 5µg/mL
7. Run on LC-MS
6 VANILLIN
The vanillin-sulfuric acid assay is the main spectrophotometric method used to quantify total
saponins in the plant extract. However, the wavelength and selection of standards must be
referred to prior to utilizing this method. The oxidant in the reaction is sulfuric acid as it creates a
purple color (Hiai et al., 1976). As different reagent, wavelengths, and time to allow for full-
color development vary, this method is not ideal as comparing results is difficult, and it is hard to
know which standard would be the best to use. In addition, using the spectrophotometric with
vanillin, Baccou, et al. (1977) measured both total saponins and total steroidal sapogenin to

51
quantify steroidal saponins in plant material. This method is based on the development of color
with ethyl acetate, sulfuric acid, and anisaldehyde (or vanillin). The solution was measured at an
absorbance of 430 nm using a spectrophotometer. The only variation in the measurement of total
saponins and total steroidal sapogenins is the use of different solvents used to create the reagents.
Uematsu, Hirata, & Saito (2000) used a similar spectrophotometric method described in Baccou
et al. (1977) for saponin extraction in Yucca.
7 HEMOLYTIC
The hemolytic method is an additional spectrophotometric method that can quantify saponins.
Barve, Laddha, & Jayakumar (2010) used this method where a blood reagent and saponins are
reacted together to allow for the release of oxyhemoglobin creating a color that can be measured
on a spectrophotometer. Habicht et al. (2011) used the hemolytic method of quantification in
bitter gourd varieties. The extract of saponins was dissolved into distilled water, and 100 uL of
the solution was incubated for 30 min at 30 C with 1 mL of fresh EDTA blood
(Ethylenediaminetetraacetic acid). The solution was centrifuged for 10 mins at 3000 rpm and the
hemoglobin was measured in the supernatant photometrically using a spectrophotometer at 545
nm. The results indicated the expression of hemolytic saponins. Khalil & El-Adawy (1994)
extracted saponins according to Livingston, Whitehand, & Kohler (1977) from legume samples.
Woldemichael et al. (2001) used hemolysis assays to analyze saponins, also the Liebermann-
Burchard reaction was used to test the reaction for proper saponin extraction. Furthermore,
Soltani, Parivar, Bharara, Kerachian, & Asili (2014) used the hemolytic method to analyze
saponins and their presence in Persian Gulf Holothuria leucospilota sea cucumbers. Habicht et

52
al. (2010) quantified lipid, hydrophilic, and saponin extracts in various bitter gourd varieties
using an adapted extraction method. Using gas chromatography-mass spectrometry (GC-MS),
fatty acids were determined and using hemolytic properties found in saponins was determined
photometrically (Ridout, Price, Dupont, Parker Fenwick, 1991).
8 MACRO LENS-COUPLES SMARTHPHONE ANALYTICAL ASSAY
The researchers developed a method that involved making stable foam in a microplate well, then
measuring the foam with a smartphone camera and software. They found their results to be 50-
fold more precise than the foam method, and reproducibility standard deviation of less than 10%,
validated using multiple quinoa varieties (León-Roque et al., 2019).
APPENDIX 3
Table 5: Washed Quinoa Seed Samples Averages using the UV/Vis and Foam Methods
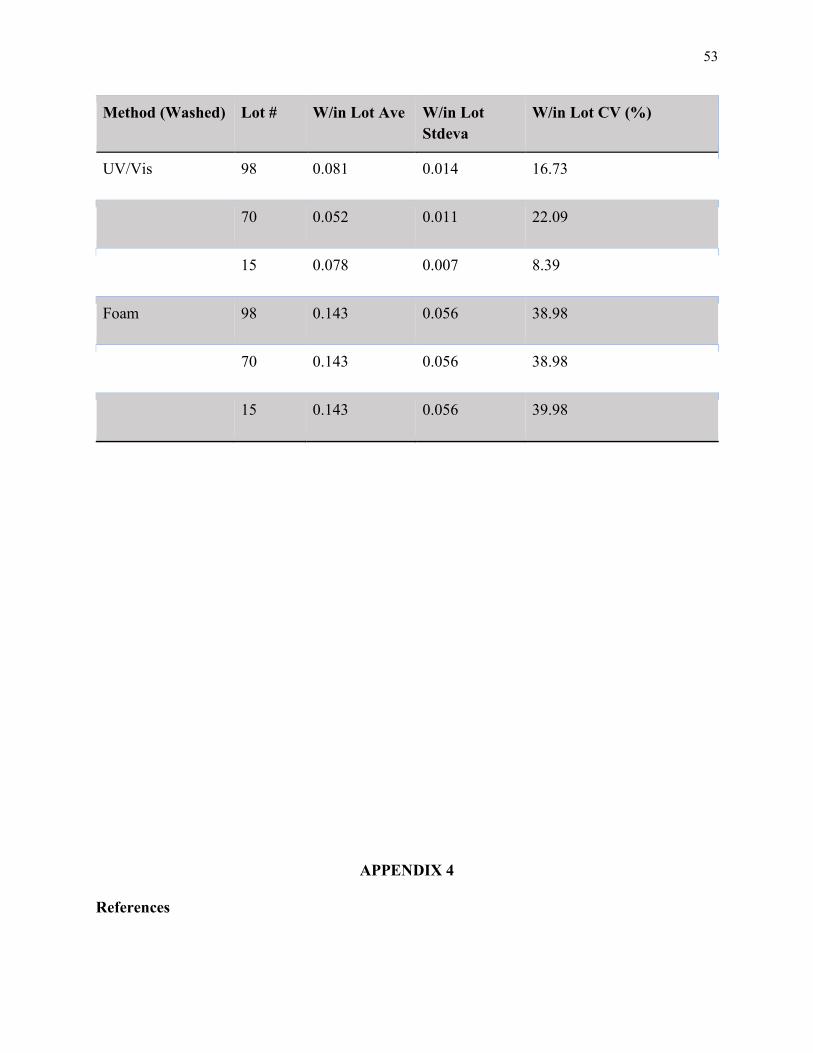
53
Method (Washed) Lot # W/in Lot Ave W/in Lot Stdeva
W/in Lot CV (%)
UV/Vis 98 0.081 0.014 16.73
70 0.052 0.011 22.09
15 0.078 0.007 8.39
Foam 98 0.143 0.056 38.98
70 0.143 0.056 38.98
15 0.143 0.056 39.98
APPENDIX 4
References
54
Ahamed, N. T., Singhal, R. S., Kulkarni, P. R., & Pal, M. (1996). Physicochemical and functional properties of chenopodium quinoa starch. Carbohydrate Polymer, 31, 99-103.
Aluwi, N. A., Gu, B., Dhumal, G. S., Medina‐Meza, I. G., Murphy, K. M., & Ganjyal, G. M. (2016). Impacts of scarification and degermination on the expansion characteristics of select quinoa varieties during extrusion processing. Journal of Food Science, 81, E2939-E2949.
Alvarez-Jubete, L., Arendt, E. K., & Gallagher, E. (2009). Nutritive value and chemical composition of pseudocereals as gluten-free ingredients. International Journal of Food Science and Nutrition, 60, 240-257.
Baccou, J. C., Lambert, F., & Sauvaire, Y. (1977). Spectrophotometric method for the determination of total steroidal sapogenin. Analyst, 102, 458-465.
Barve, K. H., Laddha, K. S., & Jayakumar, B. (2010). Extraction of saponins from safed musli. Pharmacognosy Journal, 2, 561-564.
Bazile, D. and Baudron, F. 2015. The dynamics of the global expansion of quinoa growing in view of its high biodiversity. In D. Bazile, D. Bertero & C. Nieto (Eds.), State of the art report on quinoa around the world in 2013 (pp. 43-54). Rome: FAO & CIRAD.
Bhargava, A., Shukla, S., & Ohri, D. (2006). Chenopodium quinoa—an indian perspective. Industrial Crops and Products, 23, 73-87.
Bhargava, A., Shukla, S., & Ohri, D. (2007). Genetic variability and interrelationship among various morphological and quality traits in quinoa (chenopodium quinoa willd.). Field Crops Research, 101, 104-116.
Bhargava, A. and Srivastava, S. (2013). Quinoa: Botany, production and uses. Oxfordshire, UK: CABI.
Biesiekierski, J. R., Muir, J. G., & Gibson, P. R. (2013). Is gluten a cause of gastrointestinal symptoms in people without celiac disease? Current Allergy and Asthma Reports, 13, 631-638.
Brownawell, A. M., Caers, W., Gibson, G. R., Kendall, C. W., Lewis, K. D., Ringel, Y., & Slavin, J. L. (2012). Prebiotics and the health benefits of fiber: Current regulatory status, future research, and goals. Journal of Nutrition, 142, 962-974.
Chevarria-Lazo, M., Bazileb, D., Dessauw, D., Trommettere, M., & Hocde, H. (2015). Quinoa and the exchange of genetic resources: Improving the regulation systems. In D. Bazile, D. Bertero & C. Nieto (Eds.), State of the art report on quinoa around the world in 2013 (pp. 83-105). Rome: FAO & CIRAD.
Comai, S., Bertazzo, A., Bailoni, L., Zancato, M., Costa, C. V., & Allegri, G. (2007). The content of proteic and nonproteic (free and protein-bound) tryptophan in quinoa and cereal flours. Food Chemistry, 100, 1350-1355.

55
De Carvalho, F. G., Ovídio, P. P., Padovan, G. J., Jordao Junior, A. A., Marchini, J. S., & Navarro, A. M. (2014). Metabolic parameters of postmenopausal women after quinoa or corn flakes intake–a prospective and double-blind study. International Journal of Food Science and Nutrition, 65, 380-385.
Fiallos-Jurado, J., Pollier, J., Moses, T., Arendt, P., Barriga-Medina, N., Morillo, E., Arahana, V., de Lourdes Torres, M., Goossens, A., & Leon-Reyes, A. (2016). Saponin determination, expression analysis and functional characterization of saponin biosynthetic genes in chenopodium quinoa leaves. Plant Science, 250, 188-197.
FAO. (2011). Quinoa: An ancient crop to contribute to world food security. 15.
FAO/WHO. 2010. FAO/WHO framework for developing national food safety emergency response plans. Rome: FAO & WHO
Fitzpatrick, T. B., Basset, G. J., Borel, P., Carrari, F., DellaPenna, D., Fraser, P. D., Hellmann, H., Osorio, S., Rothan, C., & Valpuesta, V. (2012). Vitamin deficiencies in humans: Can plant science help? Plant Cell. 24, 395-414.
Gianna, V. 2013. Extracción, cuantificación y purificación de saponinas de semilla de chenopodium quinoa willd provenientes del noroeste argentino. Doctoral Thesis. Universidad Nacional de Córdoba. Córdoba, Argentina. https://rdu.unc.edu.ar/handle/11086/1413
Gómez-Caravaca, A. M., Iafelice, G., Verardo, V., Marconi, E., & Caboni, M. F. (2014). Influence of pearling process on phenolic and saponin content in quinoa (chenopodium quinoa willd). Food Chemistry, 157, 174-178.
González, J. A., Eisa, S., Hussin, S., & Prado, F. E. (2015). Quinoa: An incan crop to face global changes in agriculture. In Murphy, K. & Matanguihan, J. (Eds.), Quinoa: Improvement and Sustainable Production (pp. 1-18). Hoboken, NJ: Wiley-Blackwell.
González, J. A., Roldan, A., Gallardo, M., Escudero, T., & Prado, F. E. (1989). Quantitative determinations of chemical compounds with nutritional value from inca crops: Chenopodium quinoa (‘quinoa’). Plant Foods for Human Nutrition, 39, 331-337.
Gorinstein, S., Pawelzik, E., Delgado‐Licon, E., Haruenkit, R., Weisz, M., & Trakhtenberg, S. (2002). Characterisation of pseudocereal and cereal proteins by protein and amino acid analyses. Journal of the Science of Food and Agriculture, 82, 886-891.
Graf, B. L., Rojas‐Silva, P., Rojo, L. E., Delatorre‐Herrera, J., Baldeón, M. E., & Raskin, I. (2015). Innovations in health value and functional food development of quinoa (chenopodium quinoa willd.). Comprehensive Reviews in Food Science and Food Safety, 14:431-445.
Guzmán, B., L Cruz, D., Alvarado, J. A., & Mollinedo, P. (2013). Cuantificación de saponinas en muestras de cañihua chenopodium pallidicaule aellen. Revista Boliviana De Química, 30, 131-136.

56
Habicht, S. D., Kind, V., Rudloff, S., Borsch, C., Mueller, A. S., Pallauf, J., Yang, R., & Krawinkel, M. B. (2011). Quantification of antidiabetic extracts and compounds in bitter gourd varieties. Food Chemistry, 126, 172-176.
Hiai, S., Oura, H., & Nakajima, T. (1976). Color reaction of some sapogenins and saponins with vanillin and sulfuric acid. Planta Medica, 29, 116-122.
Jacobsen, S. (1997). Adaptation of quinoa (chenopodium quinoa) to northern european agriculture: Studies on developmental pattern. Euphytica, 96, 41-48.
James, L. E. A. (2009). Quinoa (chenopodium quinoa willd.): Composition, chemistry, nutritional, and functional properties. Advances in Food and Nutrition Research, 58, 1-31.
Jancurová, M., Minarovičová, L., & Dandar, A. (2009). Quinoa–a review. Czech Journal of Food Sciences, 27, 71-79.
Jellen, E. N., Benlhabib, O., Maughan, P. J., Stevens, M. R., Dilg, M., Sederberg, M., Bonifacio, A., Coleman, C. E., Fairbanks, D. J., & Jacobsen, S. (2005). Introduction of the andean crop quinoa in morocco. American Society of Agronomy Proceed, 6-9.
Khalil, A. H. and El-Adawy, T. A. 1994. Isolation, identification and toxicity of saponin from different legumes. Food Chemistry, 50, 197-201.
Kim, H. H., Cho, S., Lee, S., Kim, K. H., Cho, K. H., Eun, H. C., & Chung, J. H. (2006). Photoprotective and anti-skin-aging effects of eicosapentaenoic acid in human skin in vivo. Journal of Lipid Research, 47, 921-930.
Koziol, M. J. (1991). Afrosimetric estimation of threshold saponin concentration for bitterness in quinoa (chenopodium quinoa willd). Journal of the Science of Food and Agriculture, 54, 211-219.
Kozioł, M. J. (1992). Chemical composition and nutritional evaluation of quinoa (chenopodium quinoa willd.). Journal of Food Composition and Analysis, 5, 35-68.
Kumpun, S., Maria, A., Crouzet, S., Evrard-Todeschi, N., Girault, J., & Lafont, R. (2011). Ecdysteroids from chenopodium quinoa willd., an ancient andean crop of high nutritional value. Food Chemistry, 125, 1226-1234.
Lamothe, L. M., Srichuwong, S., Reuhs, B. L., and Hamaker, B. R. (2015). Quinoa (chenopodium quinoa W.) and amaranth (amaranthus caudatus L.) provide dietary fibres high in pectic substances and xyloglucans. Food Chemistry, 167, 490-496.
León-Roque, N., Aguilar-Tuesta, S., Quispe-Neyra, J., Mamani-Navarro, W., Alfaro-Cruz, S., and Condezo-Hoyos, L. (2019). A green analytical assay for the quantitation of the total saponins in quinoa (chenopodium quinoa willd.) based on macro lens-coupled smartphone. Talanta, 204, 576-585.
Livingston, A.L., Whitehand, L. C., & Kohler G. O. (1997). Microbiological assay for saponins in alfalfa products. Journal of AOAC International, 60, 957 - 960.

57
Madl, T., Sterk, H., Mittelbach, M., & Rechberger, G. N. (2006). Tandem mass spectrometric analysis of a complex triterpene saponin mixture of chenopodium quinoa. Journal of the American Society for Mass Spectrometry, 17, 795-806.
McCusker, M. M. and Grant-Kels, J. M. (2010). Healing fats of the skin: The structural and immunologic roles of the ω-6 and ω-3 fatty acids. Clinics in Dermatology, 28, 440-451.
Miranda, M., Vega-Gálvez, A., Martínez, E., López, J., Rodríguez, M. J., Henríquez, K., Fuentes, F. (2012). Genetic diversity and comparison of physicochemical and nutritional characteristics of six quinoa (chenopodium quinoa willd.) genotypes cultivated in chile. Food Science and Technology, 32, 835-843.
Miranda, M., Vega-Gálvez, A., Quispe-Fuentes, I., Rodríguez, M. J., Maureira, H., & Martínez, E. A. (2012). Nutritional aspects of six quinoa (chenopodium quinoa willd.) ecotypes from three geographical areas of chile. Chilean Journal of Agricultural Research, 72, 175.
Ncube, B., Ngunge, V., Finnie, J. F., & Van Staden, J. (2011). A comparative study of the antimicrobial and phytochemical properties between outdoor grown and micropropagated tulbaghia violacea harv. plants. Journal of Ethnopharmacology, 134, 775-780.
Peiretti, P. G., Gai, F., & Tassone, S. (2013). Fatty acid profile and nutritive value of quinoa (chenopodium quinoa willd.) seeds and plants at different growth stages. Animal Feed Science and Technology, 183, 56-61.
Planella, M. T., López, M. L., & Bruno, M. C. (2015). Domestication and prehistoric distribution. In D. Bazile, D. Bertero & C. Nieto (Eds.), State of the art report on quinoa around the world in 2013 (pp. 29-41). Rome: FAO & CIRAD.
Popenoe, H., King, S. R., León, J., & Kalinowski, L. S. (1989). Lost crops of the incas. Little-Known Plants of the Andes with Promise for Worldwide Cultivation, (pp. 139-161). Washington, DC: National Academy Press.
Prado, F. E., Gallardo, M., & González, J. A. (1996). Presence of saponin-bodies in pericarp cells of chenopodium quinoa willd.(quinoa). Biocell, 20, 259-264.
Prego, I., Maldonado, S., & Otegui, M. (1998). Seed structure and localization of reserves in chenopodium quinoa. Annals of Botany, 82, 481-488.
Pulvento, C., Riccardi, M., Lavini, A., d’Andria, R., Iafelice, G., & Marconi, E. (2010). Field trial evaluation of two chenopodium quinoa genotypes grown under rain‐fed conditions in a typical mediterranean environment in south italy. Journal of Agronomy and Crop Science, 196, 407-411.
Quiroga, C., Escalera, R., Aroni, G., Bonifacio, A., Gonzalez, J. A., Villca, M., Saravia, R., & Ruiz, A. (2015). Traditional process and technological innovations in quinoa harvesting, processing, and industrialization. In D. Bazile, D. Bertero & C. Nieto (Eds.), State of the art report on quinoa around the world in 2013 (pp. 218-249). Rome: FAO & CIRAD.
58
Repo-Carrasco, R., Espinoza, C., & Jacobsen, S. (2003). Nutritional value and use of the andean crops quinoa (chenopodium quinoa) and kañiwa (chenopodium pallidicaule). Food Reviews International, 19, 179-189.
Repo-Carrasco-Valencia, R. (2011). Andean indigenous food crops: Nutritional value and bioactive compounds. Turku: University of Turku
Ridout, C. L., Price, K. R., Dupont, M. S., Parker, M. L., & Fenwick, G. R. (1991). Quinoa saponins—analysis and preliminary investigations into the effects of reduction by processing. Journal of the Science of Food and Agriculture, 54, 165-176.
Ruales, J. and Nair, B. M. (1993). Content of fat, vitamins and minerals in quinoa (chenopodium quinoa, willd) seeds. Food Chemistry, 48, 131-136.
Ruiz, K. B., Khakimov, B., Engelsen, S. B., Bak, S., Biondi, S., & Jacobsen, S. (2017). Quinoa seed coats as an expanding and sustainable source of bioactive compounds: An investigation of genotypic diversity in saponin profiles. Industrial Crops and Products, 104, 156-163.
Schoenlechner, R., Wendner, M., Siebenhandl-Ehn, S., & Berghofer, E. (2010). Pseudocereals as alternative sources for high folate content in staple foods. Journal of Cereal Science, 52, 475-479.
Simopoulos, A. P. (2006). Evolutionary aspects of diet, the omega-6/omega-3 ratio and genetic variation: Nutritional implications for chronic diseases. Biomedicine & Pharmacotherapy, 60, 502-507.
Soltani, M., Parivar, K., Bharara, J., Kerachian, M. A., & Asili, J. (2014). Hemolytic and cytotoxic properties of saponin purified from holothuria leucospilota sea cucumber. Reports of Biochemistry & Molecular Biology, 3, 43.
Stuardo, M. and San Martín, R. (2008). Antifungal properties of quinoa (chenopodium quinoa willd) alkali treated saponins against botrytis cinerea. Industrial Crops and Products, 27, 296-302.
Tadhani, M., and Subhash, R. (2006). Preliminary studies on Stevia rebaudiana leaves: proximal composition, mineral analysis and phytochemical screening. Journal of Medical Science, 6, 321–326.
Tang, Y., Li, X., Chen, P. X., Zhang, B., Hernandez, M., Zhang, H., Marcone, M. F., Liu, R., & Tsao, R. (2015). Characterisation of fatty acid, carotenoid, tocopherol/tocotrienol compositions and antioxidant activities in seeds of three chenopodium quinoa willd. genotypes. Food Chemistry, 174, 502-508.
Troisi J., Di Fiore R., Pulvento C., D’Andria R., Vega-Gálvez A., Miranda M., Martínez, E.A. & Lavini A. (2015). Saponins. In D. Bazile, D. Bertero & C. Nieto (Eds.), State of the art report on quinoa around the world in 2013 (pp. 267-277). Rome: FAO & CIRAD.

59
Uematsu, Y., Hirata, K., Saito, K., & Kudo, I. (2000). Spectrophotometric determination of saponin in yucca extract used as food additive. Journal of AOAC International, 83, 1451-1454.
Valcárcel-Yamani, B. and Lannes, S. S. (2012). Applications of quinoa (chenopodium quinoa willd.) and amaranth (amaranthus spp.) and their influence in the nutritional value of cereal based foods. Food and Public Health, 2, 265-275.
Valencia, S., Svanberg, U., Sandberg, A., & Ruales, J.(1999). Processing of quinoa (chenopodium quinoa, willd): Effects on in vitro iron availability and phytate hydrolysis. International Journal of Food Sciences and Nutrition, 50, 203-211.
Valencia-Chamorro, S. A. (2003). Quinoa. In Cabellero, B. (Ed.), Encyclopedia of food science and nutrition (Vol. 8), (pp. 4895–4902). New York, NY: Academic Press.
Vega‐Gálvez, A., Miranda, M., Vergara, J., Uribe, E., Puente, L., & Martínez, E. A. (2010). Nutrition facts and functional potential of quinoa (chenopodium quinoa willd.), an ancient andean grain: A review. Journal of the Science of Food and Agriculture, 90, 2541-2547.
Woldemichael, G. M. and Wink, M. (2001). Identification and biological activities of triterpenoid saponins from chenopodium quinoa. Journal of Agricultural and Food Chemistry, 49, 2327-2332.
Wright, K. H., Pike, O. A., Fairbanks, D. J., & Huber, C. S. (2002). Composition of atriplex hortensis, sweet and bitter chenopodium quinoa seeds. Journal of Food Science, 67, 1383-1385.
Yendo, A. C., De Costa, F., Gosmann, G., & Fett-Neto, A. G. (2010). Production of plant bioactive triterpenoid saponins: Elicitation strategies and target genes to improve yields. Molecular Biotechnology, 46, 94-104.
Zuidmeer, L., Goldhahn, K., Rona, R. J., Gislason, D., Madsen, C., Summers, C., Sodergren, E., Dahlstrom, J., Lindner, T., & Sigurdardottir, S. T. (2008). The prevalence of plant food allergies: A systematic review. The Journal of Allergy and Clinical Immunology, 121, 1210-1218. E4.
Copyright © 2022 FDOKUMEN