ELECTROANALYTICAL DETERMINATION OF CODEINE IN PHARMACEUTICAL PREPARATIONS
Upload
independentCategory
view
1download
0
SALUM MKATAB.Pharm 3 1
DATE: June 12, 2014
PRACT. REPORT ON ANALYSIS OF QUININE PREPARATION BY TLC:
AIM: To analyses the Quinine preparations by TLC-based MINLAB.
INTRODUCTION AND THEORY:
Thin-layer chromatography (TLC) is a chromatography technique used to separate non-volatile mixtures. Thin-layer chromatography is performed on a sheet of glass, plastic, or aluminium foil, which is coated with a thinlayer of adsorbent material, usually silica gel, aluminium oxide, or cellulose. This layer of adsorbent is known as the stationary phase.
Figure.1.Separation of black ink on a TLC plate.
Thin layer chromatography is the main screening method being used today in order to determine if a drug product meets label specifications and is legal. TLC
SALUM MKATAB.Pharm 3 2
can be employed for the identification of drug substances, to estimate drug substance content and to detect related substances that may be regarded as impurities. This technique allows the active ingredientto be recognized by comparison with a known drug standard. The approach using TLC chromatography is cheap, specific and sensitive. The TLC procedures are therefore preferred, as they are capable of giving semi-quantitative information on the active ingredient and also on any related substances in the dosage forms.
Principle: The TLC technique consists of placing a spotof drug sample on a thin layer of silica attached to a plate of glass, aluminum or plastic. The plate is then inserted into a vessel containing a solvent mixture. Bycapillary action, the solvent creeps up the adsorbent material, silica, alumina, or cellulose, and dissolves the sample. The drug sample consists of a mixture of drug and inactive ingredients. These compounds will have various affinities to the adsorbent matrix and will migrate with the solvent at various speeds. This characteristic effectively separates out a mixture of compounds.
After migration of the solvent is complete, individual components can be visualized by chemical treatment or ultraviolet (UV) absorbance. The distance that the components migrate is characteristic for each compound;therefore the active ingredient can be recognized by
SALUM MKATAB.Pharm 3 3
comparison with a known drug standard. The solvent can be modified to increase resolution between various components.
This method is relatively inexpensive, specific and sensitive. It is commonly used to assess drug quality. For example in our experiment we analyses the Quinine preparations.
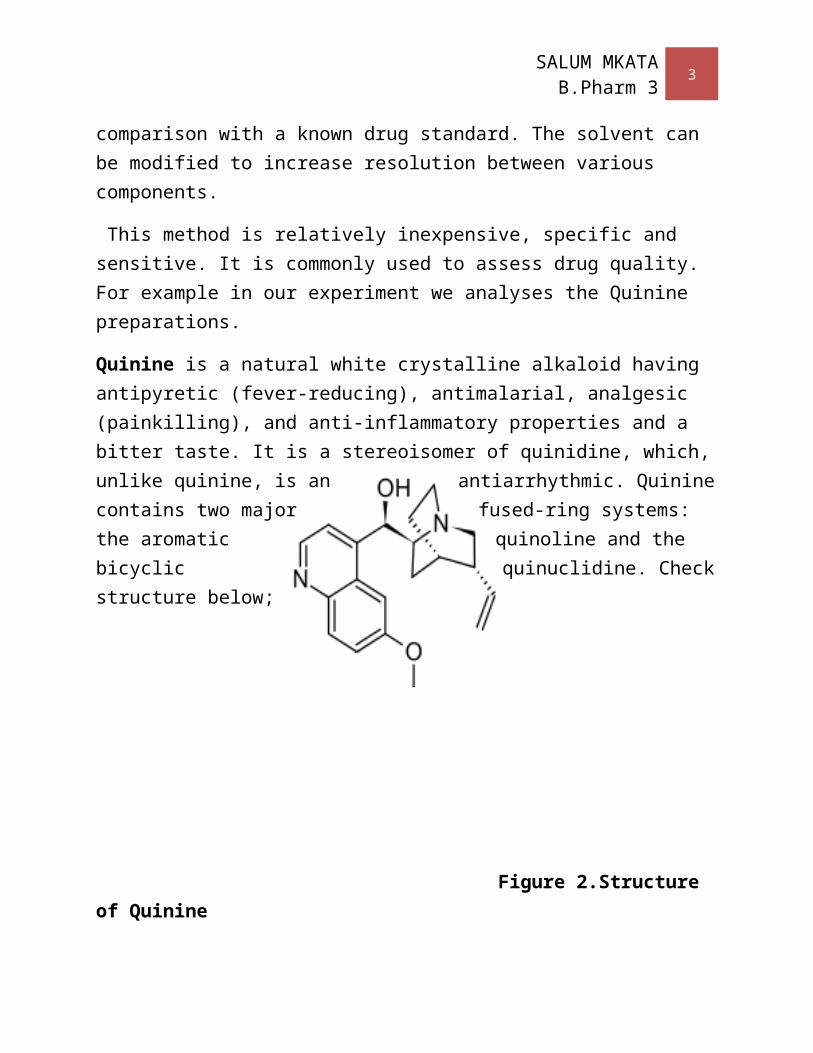
Quinine is a natural white crystalline alkaloid having antipyretic (fever-reducing), antimalarial, analgesic (painkilling), and anti-inflammatory properties and a bitter taste. It is a stereoisomer of quinidine, which,unlike quinine, is an antiarrhythmic. Quininecontains two major fused-ring systems: the aromatic quinoline and the bicyclic quinuclidine. Checkstructure below;
Figure 2.Structure of Quinine

SALUM MKATAB.Pharm 3 4
APPARATUS AND MATERIAL USED:
1) APPARATUS USED: Two heavy-duty suitcases-Minilab kits contain the essential components which are:
a)Aluminium chromatographic plates,b)50 ml glass bottlec)10ml vialsd)Stop watche)Developing and detection chambersf)25ml , 5ml and Micro Pipette g)25ml Measuring cylindersh)UV lamps of 254nm wavelength.i)Pens and pencils and rulerj)Safety pipette fillerk) Beakers l)Mortar and pestle.m)Filter paper.n)Round bottom flasks
SALUM MKATAB.Pharm 3 5
Figure 3. Two heavy-duty suitcases contain the essential components.
2) MATERIAL USED:The materials we used in our experiment were;
a)300mg reference Quinine tablet.b)300mg sample Quinine tablet.c)Aqueous methanold)Distilled water.e)Conc. Ammonia solution.
PROCEDURES:
A. Preparation of stock standard solution:
We grinded 300mg reference tablet by using mortar and pestle and wash down the powder completely with3ml of water into a 50ml glass bottle.
Then we close the bottle and shake it for 1minute. After that we added 27ml of methanol and close
again the bottle. Then we shake it again for 3minutes and we leave the bottle to stand for 5minutes until all insoluble material settles down.
After above time we label the glass bottle as Quinine stock standard solution.
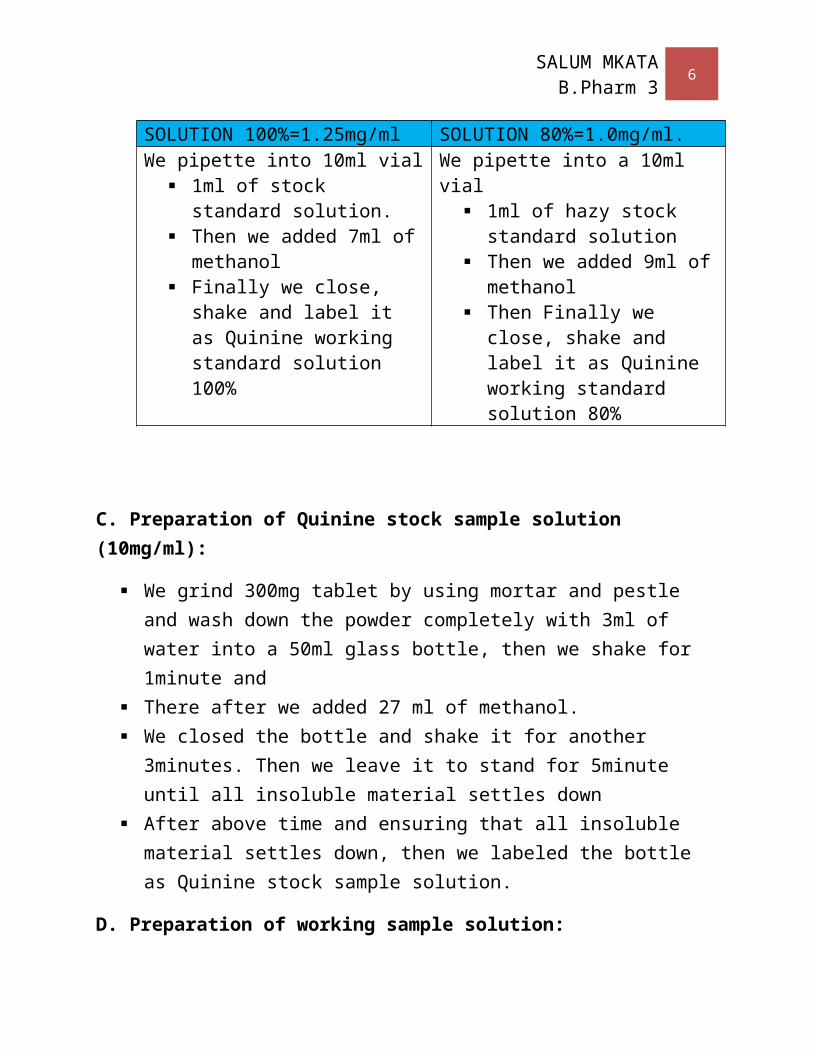
B. Preparation of working standard solution:
QUININE WORKING STANDARD QUININE WORKING STANDARD
SALUM MKATAB.Pharm 3 6
SOLUTION 100%=1.25mg/ml SOLUTION 80%=1.0mg/ml.We pipette into 10ml vial
1ml of stock standard solution.
Then we added 7ml ofmethanol
Finally we close, shake and label it as Quinine working standard solution 100%
We pipette into a 10ml vial
1ml of hazy stock standard solution
Then we added 9ml ofmethanol
Then Finally we close, shake and label it as Quinine working standard solution 80%
C. Preparation of Quinine stock sample solution (10mg/ml):
We grind 300mg tablet by using mortar and pestle and wash down the powder completely with 3ml of water into a 50ml glass bottle, then we shake for 1minute and
There after we added 27 ml of methanol. We closed the bottle and shake it for another
3minutes. Then we leave it to stand for 5minute until all insoluble material settles down
After above time and ensuring that all insoluble material settles down, then we labeled the bottle as Quinine stock sample solution.
D. Preparation of working sample solution:
SALUM MKATAB.Pharm 3 7
We pipette 1ml of hazy stock sample solution into 10ml vial
Then we added 7ml of methanol, we close shake and labeled it as Quinine working sample solution.
E. Preparation of developing chamber:
We pipette 20ml of methanol into the developing chamber jar then we added 0.5ml of conc. Ammonia solution.
Then we closed the jar and mix thoroughly. Then we line the chamber’s wall with filter paper.
We wait for about 15minutes for chamber to saturating. Normally we used this time for spottingas mention below.
F. Spotting (To Loading the TLC plate with sample solution):
Firstly we mark an origin line about 1.5cm from thebottom edge with pencil.
Then we apply 2micro litre of each working standardsolution (both 100% as no. 1 and 80% as no. 4) by using micro pipette.
Then we apply 2micro litre of each working sample solution (both as no. 2 and no. 3 for sample solution) also as above step by using micro pipette.
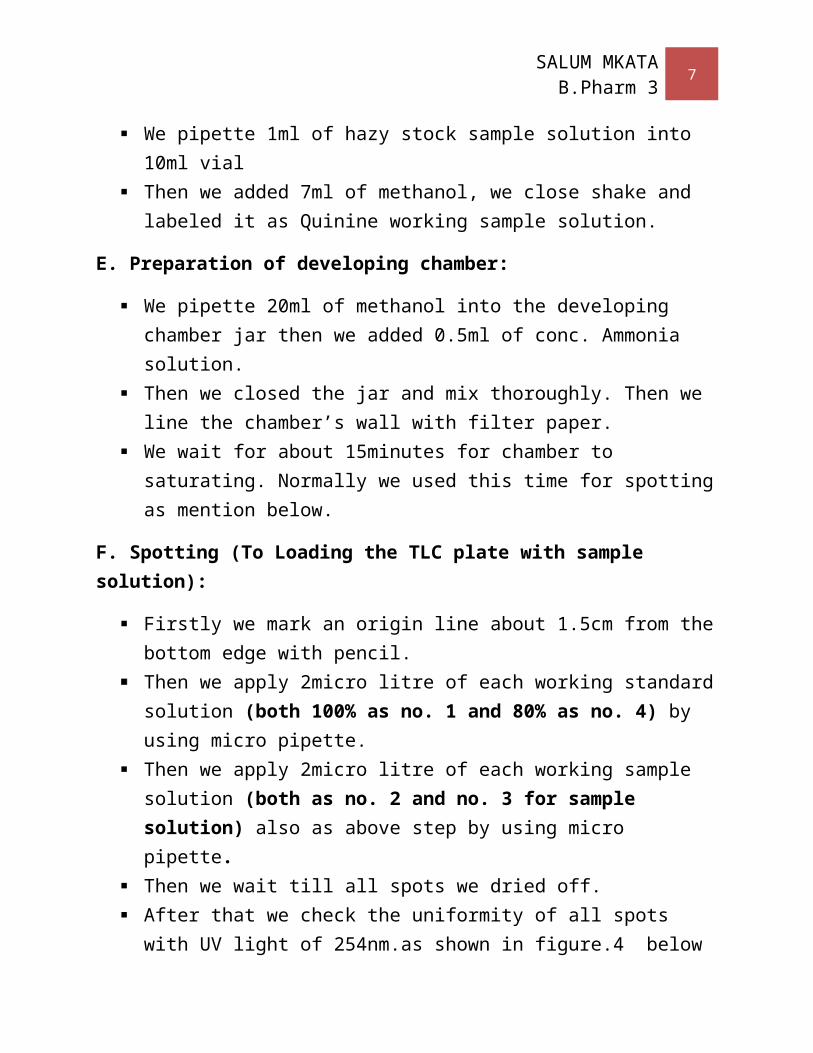
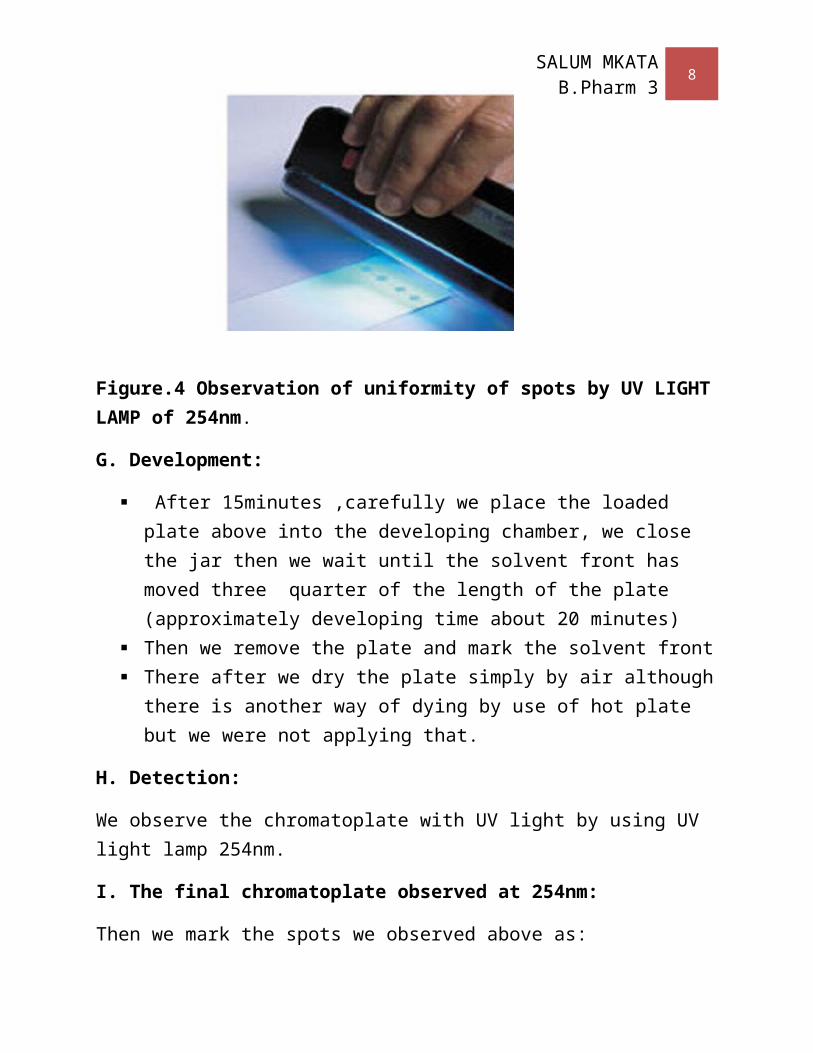
Then we wait till all spots we dried off. After that we check the uniformity of all spots
with UV light of 254nm.as shown in figure.4 below
SALUM MKATAB.Pharm 3 8
Figure.4 Observation of uniformity of spots by UV LIGHTLAMP of 254nm.
G. Development:
After 15minutes ,carefully we place the loaded plate above into the developing chamber, we close the jar then we wait until the solvent front has moved three quarter of the length of the plate (approximately developing time about 20 minutes)
Then we remove the plate and mark the solvent front There after we dry the plate simply by air although
there is another way of dying by use of hot plate but we were not applying that.
H. Detection:
We observe the chromatoplate with UV light by using UV light lamp 254nm.
I. The final chromatoplate observed at 254nm:
Then we mark the spots we observed above as:
SALUM MKATAB.Pharm 3 9
Run no.1=2.0µl of Quinine 100% standard solution Run no.2=2.0µl of sample solution Run no.3=2.0µl of sample solution Run no.4=2.0µl of Quinine 80% standard solution
RESULTS AND CALCULATIONS:
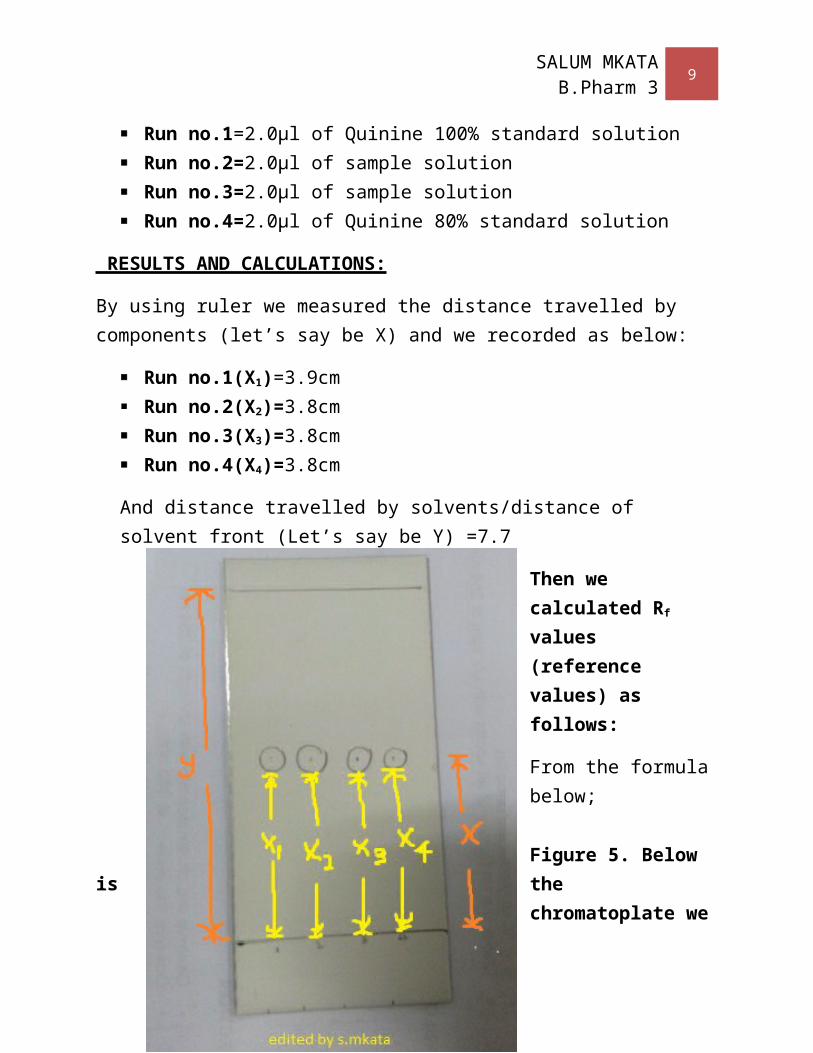
By using ruler we measured the distance travelled by components (let’s say be X) and we recorded as below:
Run no.1(X1)=3.9cm Run no.2(X2)=3.8cm Run no.3(X3)=3.8cm Run no.4(X4)=3.8cm
And distance travelled by solvents/distance of solvent front (Let’s say be Y) =7.7
Then we calculated Rf values (reference values) as follows:
From the formulabelow;
Figure 5. Below is the
chromatoplate we
SALUM MKATAB.Pharm 3 10
obtained after developing and marks the spots under UV light
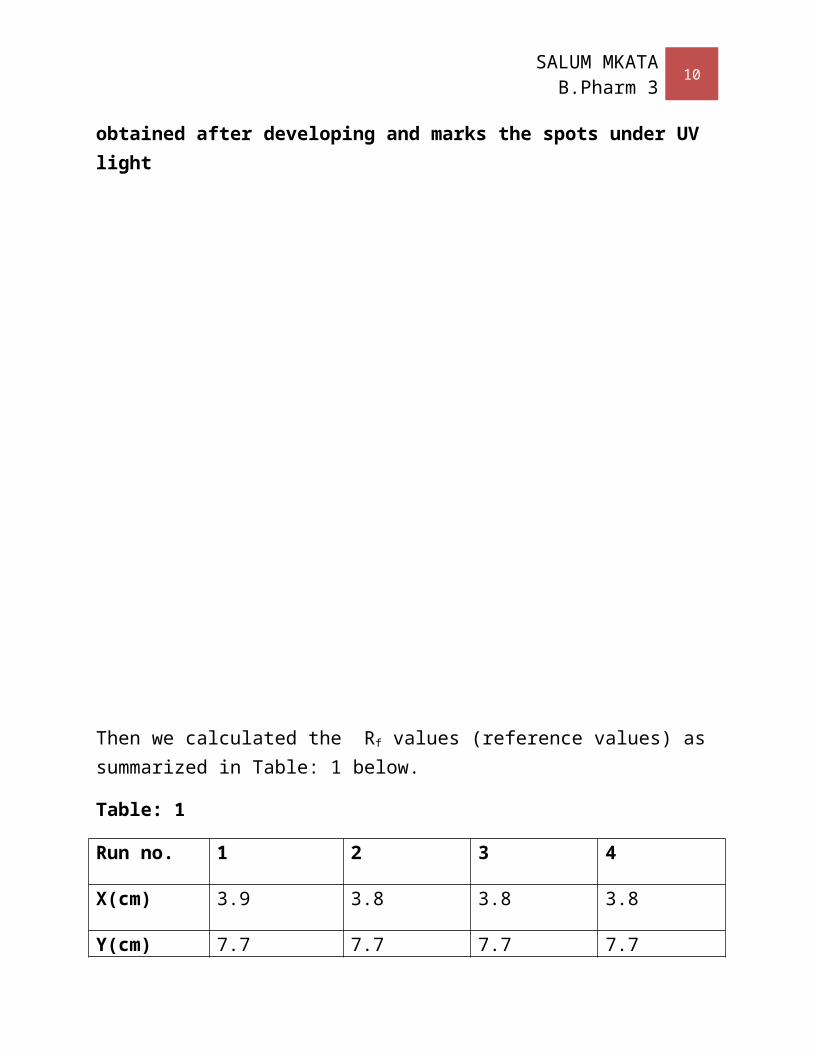
Then we calculated the Rf values (reference values) as summarized in Table: 1 below.
Table: 1
Run no. 1 2 3 4
X(cm) 3.9 3.8 3.8 3.8
Y(cm) 7.7 7.7 7.7 7.7
SALUM MKATAB.Pharm 3 11
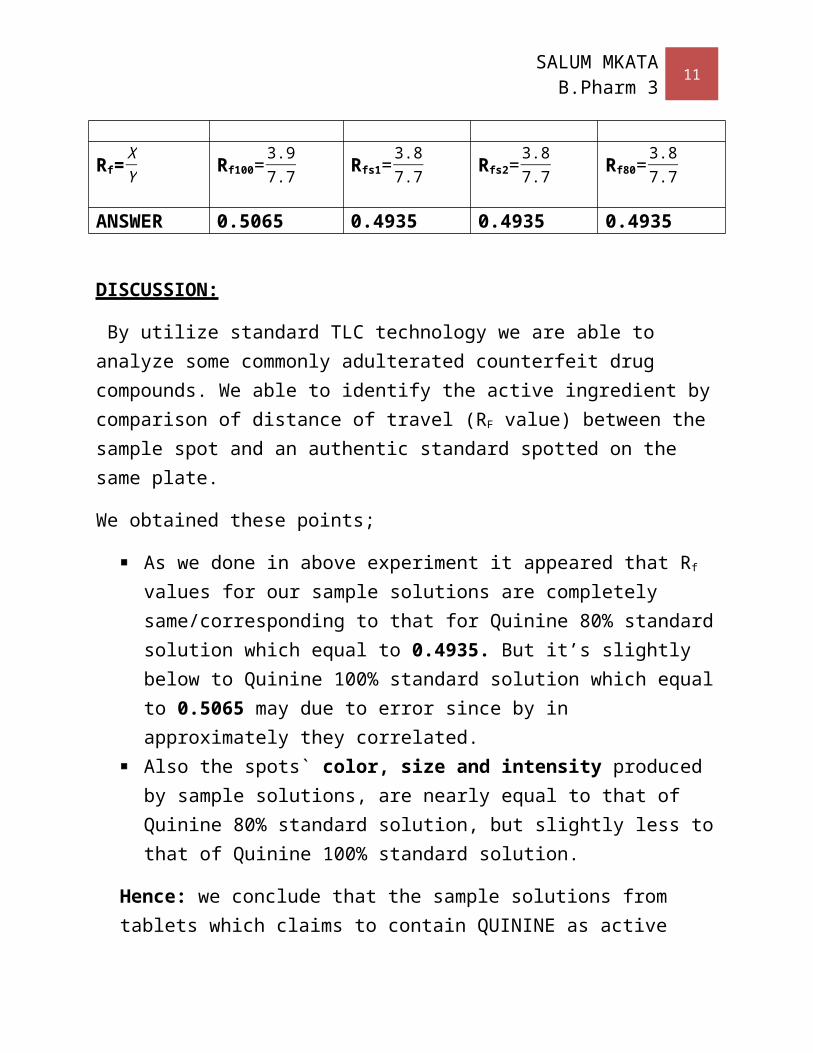
Rf=XY Rf100=
3.97.7 Rfs1=
3.87.7 Rfs2=
3.87.7 Rf80=
3.87.7
ANSWER 0.5065 0.4935 0.4935 0.4935
DISCUSSION:
By utilize standard TLC technology we are able to analyze some commonly adulterated counterfeit drug compounds. We able to identify the active ingredient bycomparison of distance of travel (RF value) between the sample spot and an authentic standard spotted on the same plate.
We obtained these points;
As we done in above experiment it appeared that Rf values for our sample solutions are completely same/corresponding to that for Quinine 80% standardsolution which equal to 0.4935. But it’s slightly below to Quinine 100% standard solution which equalto 0.5065 may due to error since by in approximately they correlated.
Also the spots` color, size and intensity produced by sample solutions, are nearly equal to that of Quinine 80% standard solution, but slightly less tothat of Quinine 100% standard solution.
Hence: we conclude that the sample solutions from tablets which claims to contain QUININE as active
SALUM MKATAB.Pharm 3 12
ingredients they REAL contain quinine since the reference value correspond to those of standard exactly same to Quinine 80% standard solution but near same to Quinine 100% standard solution and colorunder UV-light, size and intensity of spots are within range of Quinine 80% and 100% standard solution. Therefore the drug is of good and required quality.
SOURCES OF ERROR:
1)Human error which are the parallax errors and the calculation errors.
2)Environmental contamination.3)Human error due to contamination.4)Error in spotting and loading sample.5)Error in indicating solvent front and distance
travelled by components.6)Lack of visual equity.
CONCLUSSION:
Global Pharma Health Fund e.V. Mini-labs (GPHF-Minilab)is being used in 70 countries to help identify counterfeit and substandard drugs. These minilabs, which contain simple materials (as described above) andthat utilize standard TLC technology are able to analyze some 40 commonly adulterated counterfeit drug compounds. The Minilab supplies a collection of
SALUM MKATAB.Pharm 3 13
authentic secondary standard tablets and capsules in sealed plastic tubes. The Minilab analysis identifies the active ingredient by comparison of distance of travel (RF value) reference value between the sample spot and an authentic standard spotted on the same plate, and semi-quantitative proof of content is made visually comparing the color, size, and intensity between the sample spot and reference spots for each method of detection.
As above we analyzed Quinine preparations by comparing the Rf values of sample solution and that of standard weobtained it’s corresponding to Quinine 80% standard solution and approximately to Quinine100% standard solution. Also color under UV-light, size and intensityof spots are within range of Quinine 80% and 100% standard solution. Hence of good or required quality.
ACKNOWNLEDGEMENT:
1)TO MR. EDSON2)TO. Dr. KAALE3)TO. MY FELLOW STUDENTS.4)TO MY MOTHER.
REFERENCES:
1)Experiment protocol prepared by MEDCHEM. Department-MUHAS
2)USP-NF 2007
SALUM MKATAB.Pharm 3 14
3)Harry W. Lewis and Christopher J. Moody (13 Jun 1989). Experimental Organic Chemistry: Principles and Practice (Illustrated ed.). Wiley Blackwell. pp. 159–173. ISBN 978-0-632-02017-1.
4)Thin Layer Chromatography: http://www.reachdevices.com/TLC.html
5)TLC plates as a convenient platform for solvent-free reactions Jonathan M. Stoddard, Lien Nguyen, Hector Mata-Chavez and Kelly Nguyen Chem. Commun., 2007, 1240 -1241, doi:10.1039/b616311d
6)Joseph Sherma, Bernard Fried (1991): Handbook of Thin-Layer Chromatography (= Chromatographic Science. Bd. 55). Marcel Dekker, New York NY, ISBN 0-8247-8335-2.
Copyright © 2022 FDOKUMEN