Flavour aspects of pea and its protein preparations in relation ...
176
Flavour Aspects of Pea and its Protein Preparations in Relation to Novel Protein Foods Lynn Heng
-
Upload
khangminh22 -
Category
Documents
-
view
1 -
download
0
Transcript of Flavour aspects of pea and its protein preparations in relation ...
Flavour Aspects of Pea and its
Protein Preparations in Relation to
Novel Protein Foods
Lynn Heng

Promotoren
Prof. dr. ir. A. G. J. Voragen
Hoogleraar Levensmiddelenchemie, Wageningen Universiteit
Prof. dr. ir. M. A. J. S. van Boekel
Hoogleraar Productontwerpen en Kwaliteitskunde, Wageningen Universiteit
Co-promotor
Dr. Ir. J. -P. Vincken
Universitair docent, leerstoelgroep Levensmiddelenchemie, Wageningen Universiteit
Promotiecommissie
Prof. dr. L. Kenne Swedish University of Agricultural Sciences
Prof. dr. E. J. R. Sudhölter Wageningen Universiteit
Prof. dr. W. M. F. Jongen Wageningen Universiteit
Dr. ir. C. de Graaf Wageningen Universiteit
Dit onderzoek is uitgevoerd binnen de onderzoekschool VLAG (Voeding,
Levensmiddelentechnologie, Agrobiotechnologie en Gezondheid)
Flavour Aspects of pea and its
Protein Preparations in Relation to
Novel Protein Foods
Lynn Heng
Proefschrift
ter verkrijging van de graad van doctor op gezag van de rector magnificus
van Wageningen Universiteit, Prof. Dr. Ir. L. Speelman,
in het openbaar te verdedigen op donderdag 2 juni 2005
des namiddags te vier uur in de Aula

L. Heng – Flavour aspects of pea and its protein preparations in relation to novel protein foods
Ph.D. thesis Wageningen University, Wageningen, The Netherlands, 2005
Keywords: Peas / vicilin / legumin / saponin / flavour / volatile / interaction / stability /
ISBN 90-8504-198-8

To my beloved parents
and grandma
2000-2004


ABSTRACT
Flavour involves aroma and taste, which are important characteristics for the acceptability of novel
protein foods (NPFs). NPFs can be produced from pea protein isolates containing vicilin and
legumin. Peas contain both non-volatile and volatile flavour compounds that influence taste and
aroma. The non-volatile compounds consist of 2 saponins, whereas the volatile organic compounds
(VOCs) in peas belong to 3 main groups, the aldehydes, ketones and alcohols. Peas contain DDMP
saponin and saponin B, which are oleanane type saponins that are most common in nature. DDMP
saponin is labile and can be converted to saponin B. DDMP saponin was stable at around pH 7 and
at ethanol concentrations > 30% (v/v), but lost its stability at acidic and alkaline pHs, and at
temperature > 30 oC. Both DDMP saponin and saponin B have a bitter taste, but the former is
significantly more bitter than the latter. The contents of DDMP saponin and saponin B are variety
dependent and differed among 16 pea varieties (0.7-1.5 g/kg and 0-0.4 g/kg, respectively). DDMP
saponin predominates over saponin B in all varieties; in 2 varieties, DDMP saponin was the only
saponin present. Pea flour contains the highest amount of VOCs compared to its protein
preparations, and the type and amount of VOCs released are influenced by protein purification and
pH. Pea vicilin showed affinity for exogenous aldehydes and ketones, whereas legumin showed
affinity only for the aldehydes. Vicilin preparations contained non-protein components, lipids and
carbohydrates, which exhibit greater affinity for VOC than vicilin itself. Overall, the results
obtained in this thesis have provided essential knowledge on flavour aspects, especially with respect
to off-flavours, in the development of NPFs.

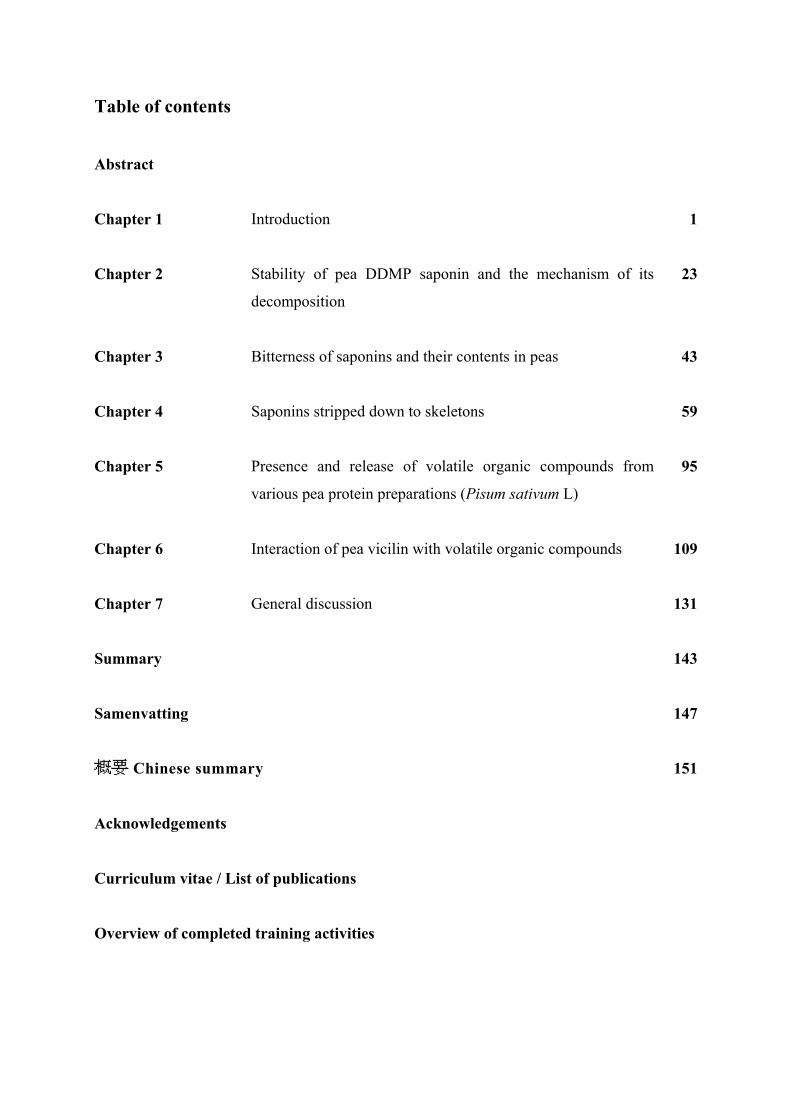
Table of contents
Abstract
Chapter 1 Introduction 1
Chapter 2 Stability of pea DDMP saponin and the mechanism of its
decomposition
23
Chapter 3 Bitterness of saponins and their contents in peas 43
Chapter 4 Saponins stripped down to skeletons 59
Chapter 5 Presence and release of volatile organic compounds from
various pea protein preparations (Pisum sativum L)
95
Chapter 6 Interaction of pea vicilin with volatile organic compounds 109
Chapter 7 General discussion 131
Summary 143
Samenvatting 147
Chinese summary
151
Acknowledgements
Curriculum vitae / List of publications
Overview of completed training activities


Chapter 1
General Introduction
Chapter 1
Novel Protein Foods and PROFETAS
The idea to develop novel protein foods (NPFs) based on plant proteins, as an alternative to meat,
arises with the aim to reduce environmental burdens brought about by existing meat production
systems, which inefficiently use large amount of energy, land and raw materials. For NPFs to be
successful, they have to be nutritionally (i.e. in terms of protein quality) similar to meat and should
have a flavour and texture appealing to consumers. Existing NPFs produced from non-animal
protein sources, such as soy, are still considered to have an inferior flavour and texture, and hence,
unappealing to most consumers. Based on these principles, the interdisciplinary program,
PROFETAS (PROtein Foods Environment Technology And Society) was initiated and established.
PROFETAS aims to provide knowledge through the assessment of technological feasibility,
environmental sustainability and societal acceptability of producing NPFs based on pea proteins.
Peas were the protein source of choice within the PROTETAS framework because of their high
protein content and their suitability for cultivation in Europe.
Peas (Pisum sativum L.) and NPFs
Peas belong to the family of Leguminosea, which also include a number of edible beans such as
soybeans and groundnuts, which are used as staple food. Over the years, peas have become
increasingly important in Europe as a source of protein for both animal feed as well as for human
food (Guillaume, 1977). Pea based ingredients have been used in vegetarian products such as
burgers and sausages (Anonymous, 1998), and in pea snacks such as fried peas coated with wheat
and/or rice flour mixed with sugar and other seasonings, or extruded fried green pea flour products
flavoured with seasonings (Jambunathan et al., 1994).
The steadily growing vegetarian market has been facing the constant challenge of substituting meat
with proteinaceous food products that not only have eating characteristics, such as texture and
flavour, similar to those of meat, but also its nutritional adequacy (Lightowler et al., 1998; Davies
& Lightowler, 1998). In recent years, ingredients from leguminous protein sources with brand
names, such as Arrum (made from yellow peas and wheat gluten), have been used to formulate new
products, e.g. NPFs (Davies & Lightowler, 1998; Zhu et al., 2004).
Composition of pea flour and derived fractions
The protein content of pea seeds is influenced by both genetic and environmental factors (Reichert
& MacKenzie, 1982; Owusu-Ansah & McCurdy, 1991). Peas have a protein content that ranges
2
General Introduction
from 20-25% (Casey, 2003), a high starch content from 33-50% (Gatel & Grosjean, 1990), but are
low in fat. Pea protein is a good source of essential amino acids, having a high lysine content, but is
limiting in tryptophan and in the sulphur-containing amino acids, methionine and cysteine (Leterme
et al., 1990). Pea flour is the main ingredient from peas and is obtained by milling pea seeds. This
pea flour may be further processed into pea concentrate by e.g. air-classification, a dry processing
method that removes the lighter starch granules from the heavier protein particles (Owusu-Ansah &
McCurdy, 1991). Pea isolate, on the other hand, is obtained through aqueous extraction of pea flour
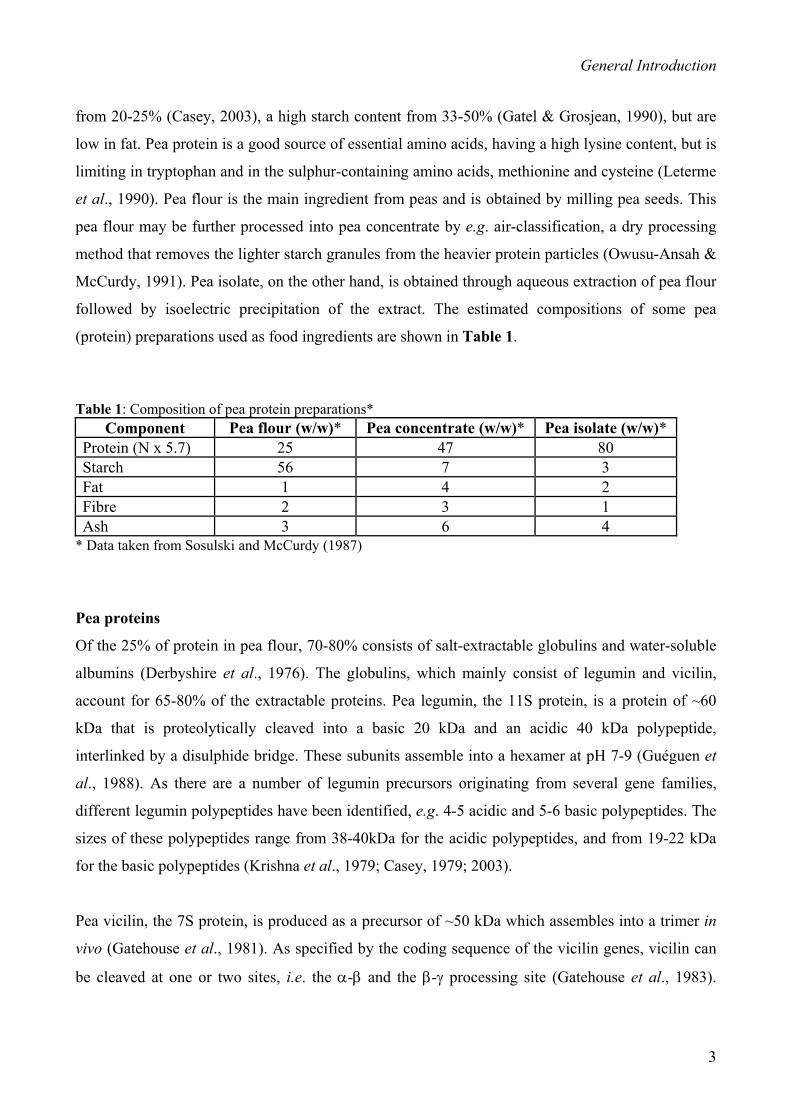
followed by isoelectric precipitation of the extract. The estimated compositions of some pea
(protein) preparations used as food ingredients are shown in Table 1.
Table 1: Composition of pea protein preparations*
Component Pea flour (w/w)* Pea concentrate (w/w)* Pea isolate (w/w)* Protein (N x 5.7) 25 47 80 Starch 56 7 3 Fat 1 4 2 Fibre 2 3 1 Ash 3 6 4
* Data taken from Sosulski and McCurdy (1987)
Pea proteins
Of the 25% of protein in pea flour, 70-80% consists of salt-extractable globulins and water-soluble
albumins (Derbyshire et al., 1976). The globulins, which mainly consist of legumin and vicilin,
account for 65-80% of the extractable proteins. Pea legumin, the 11S protein, is a protein of ~60
kDa that is proteolytically cleaved into a basic 20 kDa and an acidic 40 kDa polypeptide,
interlinked by a disulphide bridge. These subunits assemble into a hexamer at pH 7-9 (Guéguen et
al., 1988). As there are a number of legumin precursors originating from several gene families,
different legumin polypeptides have been identified, e.g. 4-5 acidic and 5-6 basic polypeptides. The
sizes of these polypeptides range from 38-40kDa for the acidic polypeptides, and from 19-22 kDa
for the basic polypeptides (Krishna et al., 1979; Casey, 1979; 2003).
Pea vicilin, the 7S protein, is produced as a precursor of ~50 kDa which assembles into a trimer in
vivo (Gatehouse et al., 1981). As specified by the coding sequence of the vicilin genes, vicilin can
be cleaved at one or two sites, i.e. the α-β and the β-γ processing site (Gatehouse et al., 1983).
3

Chapter 1
Cleavage at the α-β site produces fragments of 19 and 30 kDa, whereas that at the β-γ site produces
fragments of 12.5 or 16 and 33 kDa. Cleavage at both sites produces fragments of 12.5, 13.5 and 16
or 19 kDa. These small fragments are only apparent under dissociating conditions, such as in the
presence of sodium dodecyl sulphate (Gatehouse et al., 1981), and lead to the extensive
heterogeneity observed for vicilin.
The ratio of vicilin to legumin varies from one pea genotype to another (Casey, 2003) and may
range from 0.5 to 1.7, with a mean of 1.1 (Schroeder, 1982). Pea legumin and vicilin exhibit
similarities in amino acid composition, molecular mass as well as subunit structure, to the soy
proteins, glycinin and β-conglycinin (Derbyshire et al., 1976). A comparison of the rheological
properties of pea legumin and soy glycinin has shown that both proteins have the same physical and
chemical driving forces during gelation (O’Kane, 2004). The ability of proteins to form gels is
important for the texture of food products and gelling properties have been investigated in another
PROFETAS study by O’Kane (2004).
Flavour properties and perception
In addition to texture, flavour is another important parameter for the success of NPFs development.
Flavour is a combination of taste, aroma, texture and trigeminal responses. Taste involves the
sensation of sweet, sour, bitter, salty and umami, and is associated with the receptors on the tongue.
Aroma sensation arises from a small area in the nasal cavity and covers a broad spectrum of
approximately 10,000 different odours, which are the volatile components (Laing & Jinks, 1996;
Reineccius, 1994). Texture or mouthfeel is the perception of the structure of food, such as
smoothness, coarseness and regularity. The trigeminal responses result from the cranial nerves
(which relate to the brain) in response to tactile (sense of touch) or temperature stimuli, such as the
heat of spices or the cooling effect of menthol. Compounds responsible for taste are generally non-
volatile at room temperature and they only interact with the taste receptors on the tongue. Aroma
substances, on the other hand, are volatile compounds perceived by the odour receptor sites of the
smell organ. They reach the receptor sites when drawn in through the nose (orthonasal) or via the
throat after e.g. being released by chewing (retronasal) (Belitz & Grosch, 1999). Both volatiles (e.g.
aldehydes and ketones) and non-volatiles (e.g. saponins) are major components contributing to the
flavour of pea ingredients and therefore, to NPFs, and are the subject of study in this thesis.
4
General Introduction
Flavour components of pea
(A) Volatile organic compounds (VOCs) in green peas
The VOCs belonging to the class of aldehydes, ketones and alcohols, in common beans (e.g. lima
beans and mung beans), lentils and split peas (Lovegren et al., 1979) were found to be similar to
those VOCs found in Southern peas (e.g. black-eyed peas and cream peas) (Fischer et al., 1979).
Green peas are known to have a ‘green taste’, which is due to a combination of several classes of
VOCs such as aldehydes, ketones and alcohols within a matrix of protein and carbohydrate. These
VOCs are, to a large extent, generated by oxidation of unsaturated fatty acids (Sessa & Rackis,
1976) and can also be synthesised via enzymatic reactions (Makower & Ward, 1950) by pea
enzymes, such as catalases and peroxidases (Lee & Wagenknecht, 1958). The VOCs are either
odour active themselves or can interact with other food components to release odour active VOCs.
Peas after harvesting, processing (e.g. de-hulling) or storage usually contain alcohols (methanol,
ethanol & hexanol) as the dominating volatile components (Murray et al., 1976). Aldehydes and
ketones, which are present in smaller amounts, are usually of greater significance because they
possess stronger aromas (Murray et al., 1976). Hexanal, for example, is a significant odorous
compound present in considerable amounts in frozen peas, and it is responsible for the “hay-like”
off-flavour in these peas (Murray et al., 1976). Sulphur containing compounds (Ralls et al., 1965),
and aliphatic and aromatic hydrocarbons (Murray et al., 1976) also contribute to off-flavour of peas.
Three different 3-alkyl-2-methoxypyrazines have also been identified as natural aroma constituents
in green peas, namely, 3-isopropyl-2-methoxypyrazine, 3-sec-butyl-2-methoxypyrazine and 3-
isobutyl-2-methoxypyrazine (Murray & Whitfield, 1975; Murray et al., 1970, 1976; Jakobsen et al.,
1998). These compounds are present in extremely low concentrations, but are the main compounds
that contribute to the perceived ‘green pea’ aroma in peas (Murray & Whitfield, 1975; Murray et
al., 1970, 1976). Although the type and quantity of VOCs present in peas are known (Makower &
Ward, 1950; Lee & Wagenknecht, 1958; Ralls et al., 1965; Murray & Whitfield, 1975; Murray et
al., 1970, 1976; Sessa & Rackis, 1976; Jakobsen et al., 1998), such knowledge, however, is not
available for pea protein preparations, such as pea protein isolates. As pea protein isolate is the pea
ingredient mostly used in food applications, it is desirable to have an inventory of its volatile
composition.
5
Chapter 1
(B) Non-volatiles
(i) Saponin structure and properties
Saponins are surface-active triterpene glycosides that occur in a wide variety of plants such as
peanuts, lentils, lupins, alfalfa, oats and spinach (Oakenfull, 1981; Fenwick & Oakenfull, 1983;
Price at al., 1987; Ayet et al., 1996; Lasztity et al., 1998; Woldemichael et al., 2003; Oleszek et al.,
1990a/b; Huhman & Sumner, 2002). They are non-volatile compounds that are known to have
either a bitter (Price & Fenwick, 1984; Curl et al., 1985; Price et al., 1985; Reichert et al., 1986;
Bishnoi & Khetarpaul, 1994) or a sweet taste (Grenby, 1991; Mizutani et al., 1994; Kennelly et al.,
1995). Soybeans (Glycine max) and peas (Pisum) are the most significant sources of saponins in the
human diet (Oakefull, 1981).
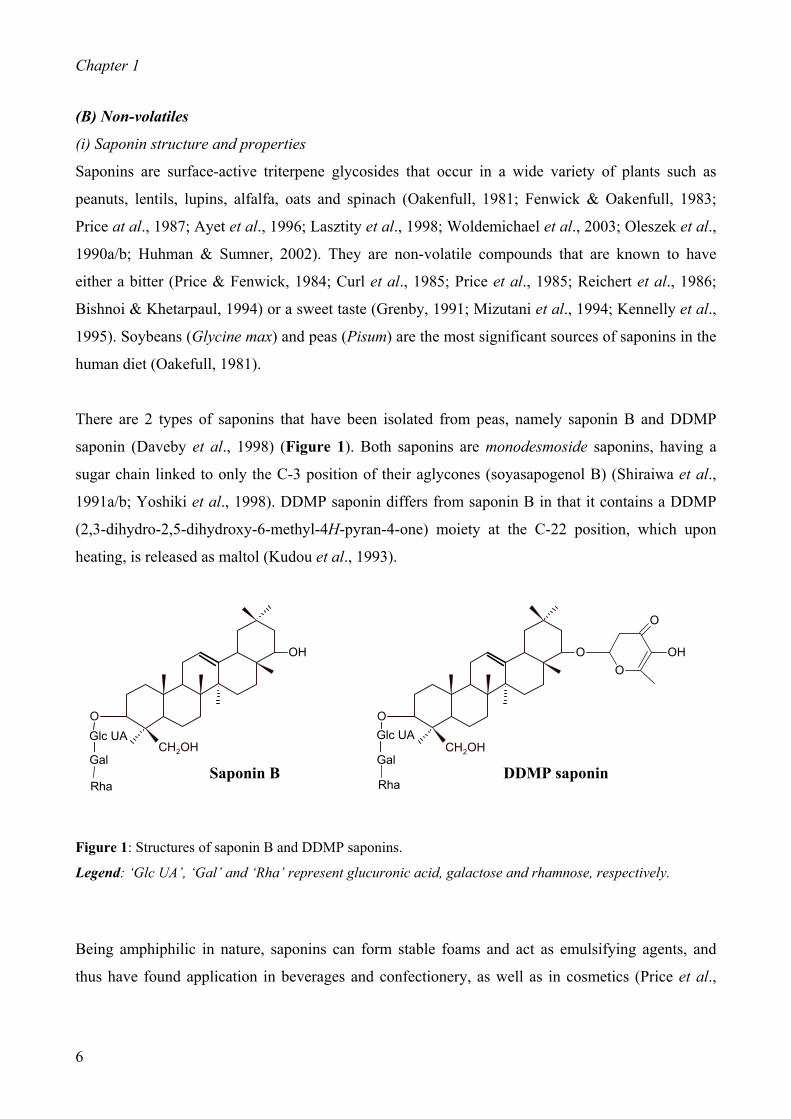
There are 2 types of saponins that have been isolated from peas, namely saponin B and DDMP
saponin (Daveby et al., 1998) (Figure 1). Both saponins are monodesmoside saponins, having a
sugar chain linked to only the C-3 position of their aglycones (soyasapogenol B) (Shiraiwa et al.,
1991a/b; Yoshiki et al., 1998). DDMP saponin differs from saponin B in that it contains a DDMP
(2,3-dihydro-2,5-dihydroxy-6-methyl-4H-pyran-4-one) moiety at the C-22 position, which upon
heating, is released as maltol (Kudou et al., 1993).
CH2OH
O
CH2OH
OGlc UA
OH
Gal
Rha
Gal
Rha
Glc UA
OO
OH
O
DDMP saponin Saponin B
Figure 1: Structures of saponin B and DDMP saponins.
Legend: ‘Glc UA’, ‘Gal’ and ‘Rha’ represent glucuronic acid, galactose and rhamnose, respectively.
Being amphiphilic in nature, saponins can form stable foams and act as emulsifying agents, and
thus have found application in beverages and confectionery, as well as in cosmetics (Price et al.,
6

General Introduction
1987). Studies have shown that dietary saponins may reduce plasma cholesterol in animals
(Oakenfull et al., 1979; Topping et al., 1980) and bind bile acids (Topping et al., 1980). Other
biological activities of saponins include antifungal (Oleszek et al., 1990b), anti-cancer (Konoshima
et al., 1992), anti-AIDS (Sakurai et al., 2004) and oxygen scavenging activities (Yoshiki & Okubo,
1995).
Saponin B has been reported as the main saponin component in peas (Price & Fenwick, 1984; Curl
et al., 1985; Price et al., 1985; 1988; Daveby et al., 1997; Kinjo et al., 1998), with a higher
concentration in the hulls (Reichert et al., 1986; Bishnoi & Khetarpaul, 1994) and the protein
fractions than in the pea flour (Curl et al., 1985). Processing steps such as sprouting, de-hulling,
soaking and cooking, have shown to decrease the saponin contents in peas by 3-84% (Bishnoi &
Khetarpaul, 1994). Recently, in addition to saponin B, DDMP saponin was identified in peas
(Daveby et al., 1998), which was obtained using a mild extraction procedure. DDMP saponin has
been found to be easily converted to saponin B under the influence of temperature and pH (Massiot
et al., 1996; Okubo et al., 1996). However, the exact influence of these parameters on DDMP
saponin stability is largely unknown and should thus be established, in order to be able to study the
pea saponins in their native form.
(ii) Sensory properties of saponins
Saponins in pea flour and protein-rich pea fractions have been reported to be perceived as having a
bitter and metallic taste (Price & Fenwick, 1984; Curl et al., 1985; Price et al., 1985; Reichert et al.,
1986; Bishnoi & Khetarpaul, 1994). The intensity of this bitterness was also shown to be related to
the saponin contents of these pea products (Price et al., 1985); pea flour had a higher bitterness
rating than pea flour that contained half the amount of saponin. The undesirable bitter taste of
saponins poses a major problem in the use of saponin containing plants and their products, such as
peas, in food production (Davies & Lightowler, 1998). Although the sensory properties of saponin
B are known, those of DDMP saponin are unknown. In addition, the intensity of bitterness of
saponin B in comparison to common bitter compounds, e.g. caffeine, is also not known. Therefore,
detailed knowledge about the sensory characteristics of the different pea saponins would provide
essential information when using pea ingredients in food.
Many saponins that have been identified up to date were isolated because of their special
characteristics such as bitterness or extreme sweetness. The structures of saponins from various
7
Chapter 1
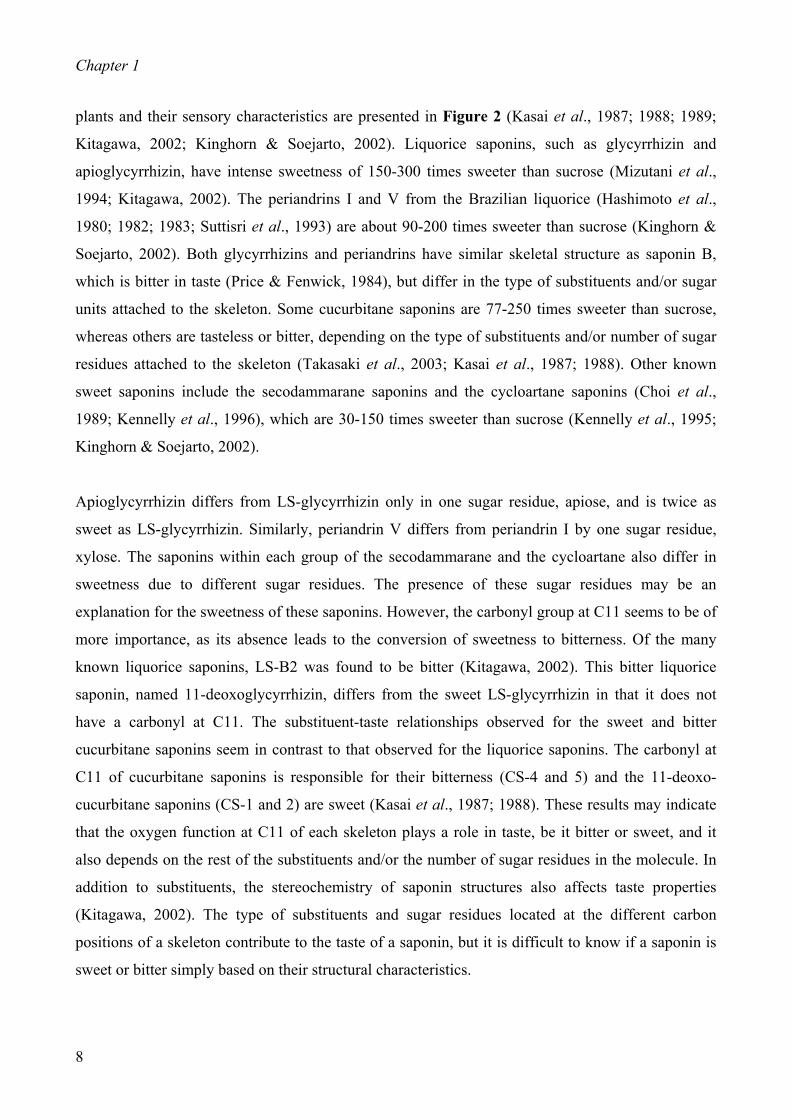
plants and their sensory characteristics are presented in Figure 2 (Kasai et al., 1987; 1988; 1989;
Kitagawa, 2002; Kinghorn & Soejarto, 2002). Liquorice saponins, such as glycyrrhizin and
apioglycyrrhizin, have intense sweetness of 150-300 times sweeter than sucrose (Mizutani et al.,
1994; Kitagawa, 2002). The periandrins I and V from the Brazilian liquorice (Hashimoto et al.,
1980; 1982; 1983; Suttisri et al., 1993) are about 90-200 times sweeter than sucrose (Kinghorn &
Soejarto, 2002). Both glycyrrhizins and periandrins have similar skeletal structure as saponin B,
which is bitter in taste (Price & Fenwick, 1984), but differ in the type of substituents and/or sugar
units attached to the skeleton. Some cucurbitane saponins are 77-250 times sweeter than sucrose,
whereas others are tasteless or bitter, depending on the type of substituents and/or number of sugar
residues attached to the skeleton (Takasaki et al., 2003; Kasai et al., 1987; 1988). Other known
sweet saponins include the secodammarane saponins and the cycloartane saponins (Choi et al.,
1989; Kennelly et al., 1996), which are 30-150 times sweeter than sucrose (Kennelly et al., 1995;
Kinghorn & Soejarto, 2002).
Apioglycyrrhizin differs from LS-glycyrrhizin only in one sugar residue, apiose, and is twice as
sweet as LS-glycyrrhizin. Similarly, periandrin V differs from periandrin I by one sugar residue,
xylose. The saponins within each group of the secodammarane and the cycloartane also differ in
sweetness due to different sugar residues. The presence of these sugar residues may be an
explanation for the sweetness of these saponins. However, the carbonyl group at C11 seems to be of
more importance, as its absence leads to the conversion of sweetness to bitterness. Of the many
known liquorice saponins, LS-B2 was found to be bitter (Kitagawa, 2002). This bitter liquorice
saponin, named 11-deoxoglycyrrhizin, differs from the sweet LS-glycyrrhizin in that it does not
have a carbonyl at C11. The substituent-taste relationships observed for the sweet and bitter
cucurbitane saponins seem in contrast to that observed for the liquorice saponins. The carbonyl at
C11 of cucurbitane saponins is responsible for their bitterness (CS-4 and 5) and the 11-deoxo-
cucurbitane saponins (CS-1 and 2) are sweet (Kasai et al., 1987; 1988). These results may indicate
that the oxygen function at C11 of each skeleton plays a role in taste, be it bitter or sweet, and it
also depends on the rest of the substituents and/or the number of sugar residues in the molecule. In
addition to substituents, the stereochemistry of saponin structures also affects taste properties
(Kitagawa, 2002). The type of substituents and sugar residues located at the different carbon
positions of a skeleton contribute to the taste of a saponin, but it is difficult to know if a saponin is
sweet or bitter simply based on their structural characteristics.
8

General Introduction
9
Liqourice saponins
Api
O
OHC
O O
OHC
O O
CH2OH
O
O
Glc.A
COOH
Glc.A
COOH
Xyl
O
Glc.A
Glc.A
COOH
Glc.A
Glc.A
COOH
Glc.A
Glc.A
COOH
Glc.A
OH
Gal
RhaSaponin B
Bitter LS-B2 Bitter
Periandrin I 90X Sweeter
LS-Glycyrrhizin 150X Sweeter
Periandrin V 200X Sweeter
LS-Apioglycyrrhizin 300X Sweeter
Cucurbitane saponins
OHOH
O
O
Glu
Glu
Glu Glu
Glu
6
62
OH CH3
CH2O
O
Glu
Glu Glu6
OH CH3
CH2O
OH
Glu
O CH3
CH2O
O
Glu
Glu Glu2
O
O
Glu
OH2C Glu Glu
CH3
6
CS-5 Bitter
CS-4 Bitter
CS-3 Tasteless
CS-2 77X sweeter
CS-1 250X sweeter
Secodammarane saponins Cycloartane saponins O
OH
OHOAra
HOOC
OH
OHOQui
HOOC
O
COOH
O
Glu
O
COOH
O
O
Glc.A*
Glu
O
COOH
O
O
Glc.A
Glu Abrusoside D 75X sweeter
Abrusoside B 100X sweeter
Glc.A* Abrusoside E methyl ester 150X sweeter
Pterocaryoside A50X sweeter
Pterocaryoside B250X sweeter
Figure 2: Structures of four classes of sweet and bitter saponins. LS: Liquorice saponin; CS: Cucurbitane saponin; Api: Apiose; Ara: Arabinose; Gal: Galactose; Glc.A: Glucoronic acid; Glc.A*: Glucoronic acid methyl ester; Glu: Glucose; Qui: Quinovose; Rha: Rhamnose; Xyl: Xylose. Number(s) in sugar chains indicate the linkage between 2 sugar residues. Sweetness is in comparison with sucrose.
Chapter 1
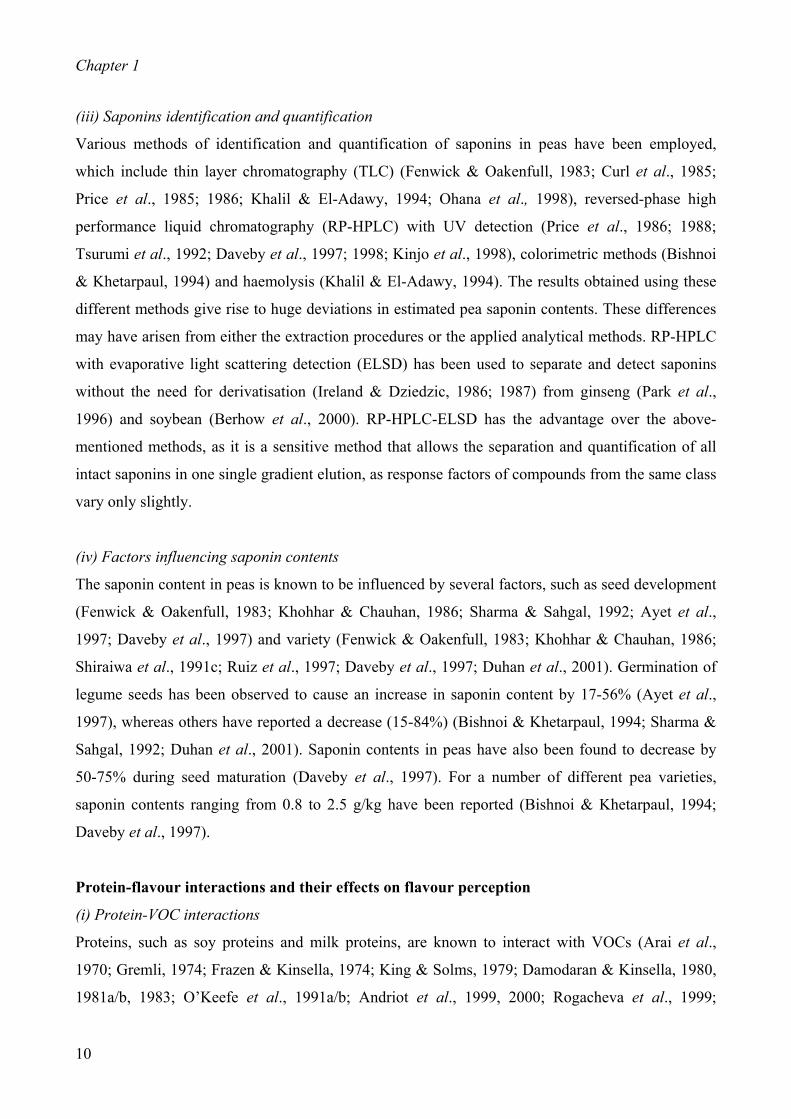
(iii) Saponins identification and quantification
Various methods of identification and quantification of saponins in peas have been employed,
which include thin layer chromatography (TLC) (Fenwick & Oakenfull, 1983; Curl et al., 1985;
Price et al., 1985; 1986; Khalil & El-Adawy, 1994; Ohana et al., 1998), reversed-phase high
performance liquid chromatography (RP-HPLC) with UV detection (Price et al., 1986; 1988;
Tsurumi et al., 1992; Daveby et al., 1997; 1998; Kinjo et al., 1998), colorimetric methods (Bishnoi
& Khetarpaul, 1994) and haemolysis (Khalil & El-Adawy, 1994). The results obtained using these
different methods give rise to huge deviations in estimated pea saponin contents. These differences
may have arisen from either the extraction procedures or the applied analytical methods. RP-HPLC
with evaporative light scattering detection (ELSD) has been used to separate and detect saponins
without the need for derivatisation (Ireland & Dziedzic, 1986; 1987) from ginseng (Park et al.,
1996) and soybean (Berhow et al., 2000). RP-HPLC-ELSD has the advantage over the above-
mentioned methods, as it is a sensitive method that allows the separation and quantification of all
intact saponins in one single gradient elution, as response factors of compounds from the same class
vary only slightly.
(iv) Factors influencing saponin contents
The saponin content in peas is known to be influenced by several factors, such as seed development
(Fenwick & Oakenfull, 1983; Khohhar & Chauhan, 1986; Sharma & Sahgal, 1992; Ayet et al.,
1997; Daveby et al., 1997) and variety (Fenwick & Oakenfull, 1983; Khohhar & Chauhan, 1986;
Shiraiwa et al., 1991c; Ruiz et al., 1997; Daveby et al., 1997; Duhan et al., 2001). Germination of
legume seeds has been observed to cause an increase in saponin content by 17-56% (Ayet et al.,
1997), whereas others have reported a decrease (15-84%) (Bishnoi & Khetarpaul, 1994; Sharma &
Sahgal, 1992; Duhan et al., 2001). Saponin contents in peas have also been found to decrease by
50-75% during seed maturation (Daveby et al., 1997). For a number of different pea varieties,
saponin contents ranging from 0.8 to 2.5 g/kg have been reported (Bishnoi & Khetarpaul, 1994;
Daveby et al., 1997).
Protein-flavour interactions and their effects on flavour perception
(i) Protein-VOC interactions
Proteins, such as soy proteins and milk proteins, are known to interact with VOCs (Arai et al.,
1970; Gremli, 1974; Frazen & Kinsella, 1974; King & Solms, 1979; Damodaran & Kinsella, 1980,
1981a/b, 1983; O’Keefe et al., 1991a/b; Andriot et al., 1999, 2000; Rogacheva et al., 1999;
10
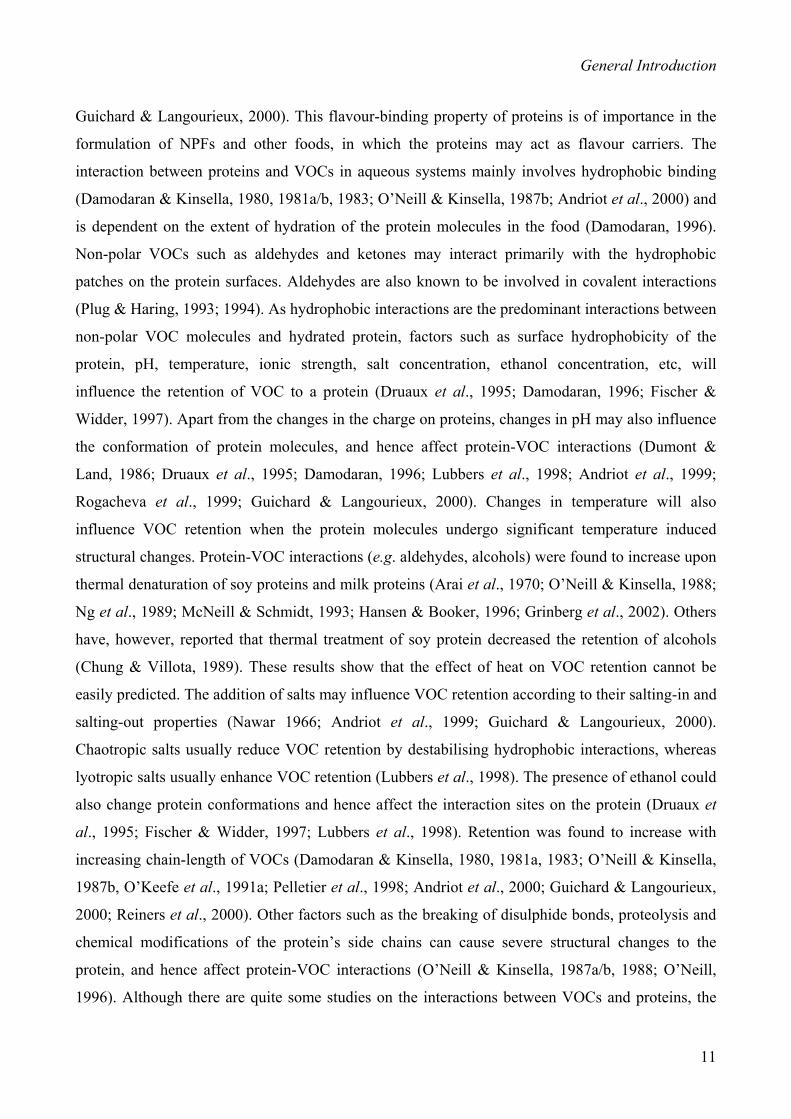
General Introduction
Guichard & Langourieux, 2000). This flavour-binding property of proteins is of importance in the
formulation of NPFs and other foods, in which the proteins may act as flavour carriers. The
interaction between proteins and VOCs in aqueous systems mainly involves hydrophobic binding
(Damodaran & Kinsella, 1980, 1981a/b, 1983; O’Neill & Kinsella, 1987b; Andriot et al., 2000) and
is dependent on the extent of hydration of the protein molecules in the food (Damodaran, 1996).
Non-polar VOCs such as aldehydes and ketones may interact primarily with the hydrophobic
patches on the protein surfaces. Aldehydes are also known to be involved in covalent interactions
(Plug & Haring, 1993; 1994). As hydrophobic interactions are the predominant interactions between
non-polar VOC molecules and hydrated protein, factors such as surface hydrophobicity of the
protein, pH, temperature, ionic strength, salt concentration, ethanol concentration, etc, will
influence the retention of VOC to a protein (Druaux et al., 1995; Damodaran, 1996; Fischer &
Widder, 1997). Apart from the changes in the charge on proteins, changes in pH may also influence
the conformation of protein molecules, and hence affect protein-VOC interactions (Dumont &
Land, 1986; Druaux et al., 1995; Damodaran, 1996; Lubbers et al., 1998; Andriot et al., 1999;
Rogacheva et al., 1999; Guichard & Langourieux, 2000). Changes in temperature will also
influence VOC retention when the protein molecules undergo significant temperature induced
structural changes. Protein-VOC interactions (e.g. aldehydes, alcohols) were found to increase upon
thermal denaturation of soy proteins and milk proteins (Arai et al., 1970; O’Neill & Kinsella, 1988;
Ng et al., 1989; McNeill & Schmidt, 1993; Hansen & Booker, 1996; Grinberg et al., 2002). Others
have, however, reported that thermal treatment of soy protein decreased the retention of alcohols
(Chung & Villota, 1989). These results show that the effect of heat on VOC retention cannot be
easily predicted. The addition of salts may influence VOC retention according to their salting-in and
salting-out properties (Nawar 1966; Andriot et al., 1999; Guichard & Langourieux, 2000).
Chaotropic salts usually reduce VOC retention by destabilising hydrophobic interactions, whereas
lyotropic salts usually enhance VOC retention (Lubbers et al., 1998). The presence of ethanol could
also change protein conformations and hence affect the interaction sites on the protein (Druaux et
al., 1995; Fischer & Widder, 1997; Lubbers et al., 1998). Retention was found to increase with
increasing chain-length of VOCs (Damodaran & Kinsella, 1980, 1981a, 1983; O’Neill & Kinsella,
1987b, O’Keefe et al., 1991a; Pelletier et al., 1998; Andriot et al., 2000; Guichard & Langourieux,
2000; Reiners et al., 2000). Other factors such as the breaking of disulphide bonds, proteolysis and
chemical modifications of the protein’s side chains can cause severe structural changes to the
protein, and hence affect protein-VOC interactions (O’Neill & Kinsella, 1987a/b, 1988; O’Neill,
1996). Although there are quite some studies on the interactions between VOCs and proteins, the
11
Chapter 1
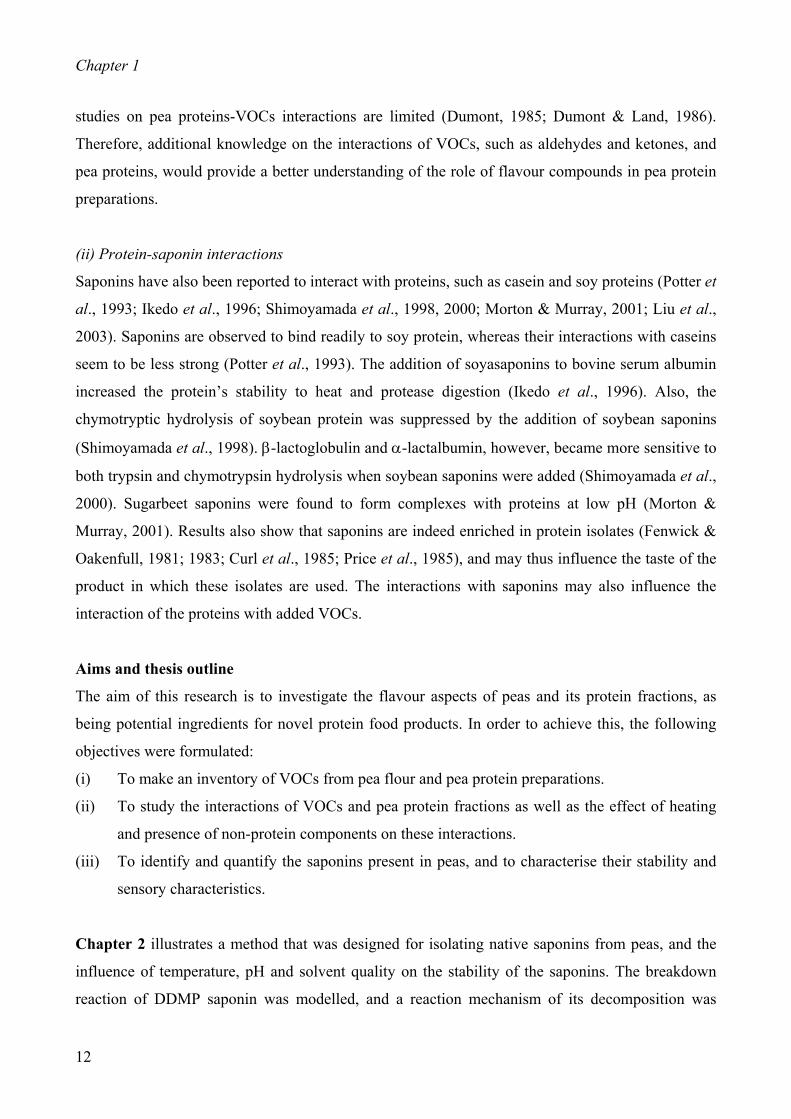
studies on pea proteins-VOCs interactions are limited (Dumont, 1985; Dumont & Land, 1986).
Therefore, additional knowledge on the interactions of VOCs, such as aldehydes and ketones, and
pea proteins, would provide a better understanding of the role of flavour compounds in pea protein
preparations.
(ii) Protein-saponin interactions
Saponins have also been reported to interact with proteins, such as casein and soy proteins (Potter et
al., 1993; Ikedo et al., 1996; Shimoyamada et al., 1998, 2000; Morton & Murray, 2001; Liu et al.,
2003). Saponins are observed to bind readily to soy protein, whereas their interactions with caseins
seem to be less strong (Potter et al., 1993). The addition of soyasaponins to bovine serum albumin
increased the protein’s stability to heat and protease digestion (Ikedo et al., 1996). Also, the
chymotryptic hydrolysis of soybean protein was suppressed by the addition of soybean saponins
(Shimoyamada et al., 1998). β-lactoglobulin and α-lactalbumin, however, became more sensitive to
both trypsin and chymotrypsin hydrolysis when soybean saponins were added (Shimoyamada et al.,
2000). Sugarbeet saponins were found to form complexes with proteins at low pH (Morton &
Murray, 2001). Results also show that saponins are indeed enriched in protein isolates (Fenwick &
Oakenfull, 1981; 1983; Curl et al., 1985; Price et al., 1985), and may thus influence the taste of the
product in which these isolates are used. The interactions with saponins may also influence the
interaction of the proteins with added VOCs.
Aims and thesis outline
The aim of this research is to investigate the flavour aspects of peas and its protein fractions, as
being potential ingredients for novel protein food products. In order to achieve this, the following
objectives were formulated:
(i) To make an inventory of VOCs from pea flour and pea protein preparations.
(ii) To study the interactions of VOCs and pea protein fractions as well as the effect of heating
and presence of non-protein components on these interactions.
(iii) To identify and quantify the saponins present in peas, and to characterise their stability and
sensory characteristics.
Chapter 2 illustrates a method that was designed for isolating native saponins from peas, and the
influence of temperature, pH and solvent quality on the stability of the saponins. The breakdown
reaction of DDMP saponin was modelled, and a reaction mechanism of its decomposition was
12

General Introduction
proposed. Using the method designed for native saponins isolation in chapter 2, the types and
amounts of saponin in 16 pea varieties and the difference in bitterness of saponin B and DDMP
saponin in relation to their concentrations was investigated in Chapter 3. Chapter 4 gives an
overview of the structures of plant saponins that have been isolated and characterised so far,
classifies these structures, and investigates the distribution of the main classes of saponins in the
plant kingdom. Chapter 5 gives an overview of the types and amounts of volatile organic
compounds released from pea flour, pea protein isolate, and legumin and vicilin preparations. The
effect of pH on the release of the volatiles from the pea flour and the effect of protein purification
steps were investigated. Chapter 6 describes the interaction of model volatile organic compounds
(aldehydes and ketones of various chain-length) with pea vicilin at various concentrations.
Additionally, the effect of heat treatment, as well as the effect of non-protein components (e.g.
lipids and carbohydrates), on the interactions was investigated. Chapter 7 gives a general
discussion on the results obtained, and relates the importance of flavour compounds of pea
ingredients to their use in novel protein food development.
13

Chapter 1
LITERATURE CITED
Anonymous. The pea alternative. Food Ingredients and Analysis International, 1998, September, pp 46.
Ayet, G.; Muzquiz, M.; Burbano, C.; Robredo, L. M.; Cuadrado, C.; Price, K. R. Determination of saponins
in the main legumes cultivated in Spain. Food Sci. Tech. Int., 1996, 2, 95-100.
Ayet, G.; Burbano, G. A.; Cuadrado, C.; Pedrosa, M. M.; Robredo, L. M.; Muzquiz, M.; de la Cuadra, C.;
Castano, A.; Osagie, A. Effect of germination, under different environmental conditions, on saponins
phytic acid and tannins in lentils (Lens culinaris). J. Sci. Food Agric., 1997, 74, 273-279.
Andriot, I.; Marin, I.; Feron, G.; Relkin, P; Guichard, E. Binding of benzaldehyde by β-lactoglobulin, by
static-headspace and high performance liquid chromatography in different physico-chemical
conditions. Le Lait, 1999, 79, 577-586.
Andriot, I.; Harrison, M.; Fournier, N.; Guichard, E. Interactions between methyl ketones and β-
lactoglobulin: Sensory analysis, headspace analysis, and mathematical modelling. J. Agric. Food
Chem., 2000, 48, 4246-4251.
Arai, S.; Masatochi, N.; Yamashita, M.; Kato, H.; Fujimaki, M. Studies on Flavour components in soybean.
Part VI. Some evidence for occurrence of protein-flavour binding. Agric. Biol. Chem., 1970, 34, 1569-
1573.
Belitz, H. D.; Grosch, W. Food Chemistry, Berlin Springer; 2, 1999, 319-377.
Berhow, M. A.; Wagner, E. D.; Vaughn, S. F.; Plewa, M. J. Characterization and antimutagenic activity of
soybean saponins. Mutat. Res. 2000, 448, 11-22.
Bishnoi, S.; Khetarpaul, N. Saponin content and trypsin inhibitor of pea cultivars: Effect of domestic
processing and cooking methods. J. Food Sci. Techn., 1994, 31, 73-76.
Casey, R. Immunoaffinity chromatography as a means of purifying legumin from Pisum (pea) seeds.
Biochem. J., 1979, 177, 509-520.
Casey, R. Pea legumins and vicilins. In Industrial Proteins in Perspective; W. Y. Aalbersberg, R. J. Hamer,
P. Jasperse, H. J. J. de Jongh, C. G. de Kruif, P. Walstra, F. A. de Wolf Eds; Elvesier Science B. V.,
The Netherlands, 2003, Progress in Biotechnology Volumn 23, pp. 49-55.
Choi, Y-H.; Hussain, R. A.; Pezzuto, J. M.; Kinghorn, A. D.; Morton, J. F. Abrusosides A-D, four novel
sweet-tasting triterpene glycosides from the leaves of Abrus precatorius. J. Nat. Prod., 1989, 52(5),
1118-1127.
Chung, S.; Villota, R. Binding of alcohols by soy protein in aqueous solutions. J. Food Sci., 1989, 54, 6,
1604-1606.
Curl, C. L.; Price, K. R.; Fenwick, G. R. The quantitative estimation of saponin in pea (Pisum sativum L.)
and soya (Glycine max). Food Chem., 1985, 18, 241-250.
14
General Introduction
Damodaran, S.; Kinsella, J. E. Flavour protein interactions. Binding of carbonyls to bovine serum albumin:
Thermodynamic and conformational effects. J. Agric. Food Chem., 1980, 28, 567-571.
Damodaran, S.; Kinsella, J. E. Interaction of carbonyls with soy protein: Thermodynamic effects. J. Agric.
Food Chem., 1981a, 29, 1249-1253.
Damodaran, S.; Kinsella, J. E. Interaction of carbonyls with soy protein: Conformational effects. J. Agric.
Food Chem., 1981b, 29, 1253-1257.
Damodaran, S.; Kinsella, J. E. Binding of carbonyls to fish actomyosin. J. Agric. Food Chem., 1983, 31,
856-859.
Damodaran, S. Amino acids, peptides, and proteins. In: Food Chemistry, third edition. Owen R. Fennema
Eds. Marcel Dekker, Inc, 1996, New York, US, pp 321-429.
Daveby, Y. D.; Aman, P.; Betz, J. M.; Musser, S. M.; Obermeyer, W. R. The variation in content and
changes during development of soyasaponin I in dehulled Swedish peas (Pisum sativum L). J. Sci.
Food Agric., 1997, 73, 391-395.
Daveby, Y. D.; Aman, P.; Betz, J. M.; Musser, S. M. Effect of storage and extraction on ratio of soyasaponin
I to 2,3-Dihydro-2,5-dihydroxy-6-methyl-4-pyrone-conjugated soyasaponin I in dehulled peas (Pisum
sativum L). J. Sci. Food Agric., 1998, 78, 141-146.
Davies, J.; Lightowler, H. Plant-based alternatives to meat. Nutr. Food Sci., 1998, 2, 90-94.
Derbyshire, E.; Wright, D. J.; Boulter, D. Review. Legumin and vicilin, storage proteins of legume seed.
Phytochemistry, 1976, 15, 3-24.
Druaux, C.; Lubbers, S.; Charpentier, C.; Voilley, A. Effects of physico-chemical parameters of a model
wine on the binding of γ-decalactone on bovine serum albumin. Food Chem., 1995, 53, 203-207.
Duhan, A.; Khetarpaul, N.; Bishnoi, S. Saponin content and trypsin inhibitor activity in processed and
cooked pigeon pea cultivars. Int. J. Food Sci. Nutr., 2001, 52 53-59.
Dumont, J. P. Diacetyl retention by pea protein used as an emulsifier. In: Progress in Flavour Research;
Developments Food Sci., 1985, 10, pp. 501-504.
Dumont, J. P.; Land, D. G. Binding of diacetyl by pea proteins. J. Agric. Food Chem., 1986, 34, 1041-1045.
Fenwick, D. E.; Oakenfull, D. Saponin content of food plants and some prepared foods. J. Sci. Food Agric.,
1983, 34, 186-191.
Fischer, G. S.; Legendre, M. G.; Lovgren, N. V.; Schuller, W. H.; Wells, J. A. Volatile constituents of
Southern pea seed (Vigna unguiculata L. Walp.). J. Agric. Food Chem., 1979, 27(1), 7-11.
Fischer, N.; Widder, S. How proteins influence food flavour. Food Technol., 1997, 51, 1, 68-70.
Frazen, K.; Kinsella, J. Parameters affecting the binding of flavour compounds in model food systems. I.
Proteins. J. Agric. Food Chem., 1974, 22, 675-678.
Gatehouse, J. A.; Croy, R. R. D.; Morton, H., Tyler, M., Boulter, D. Characterisation and subunit structures
of the vicilin storage proteins of pea (Pisum sativum L.). Eur. J. Biochem., 1981, 118, 627-633.
15

Chapter 1
Gatehouse, J. A.; Lycett, G.W.; Delauney, J.; Croy, R. R. D.; Boulter, D. Sequence specificity of the post-
translational proteolytic cleavage of vicilin, a seed storage protein of pea (Pisum sativum L.).
Biochem. J., 1983, 212, 427-432.
Gatel, F.; Grosjean, F. Composition and nutritive value of peas for pigs: a review of European results.
Livestock Prod. Sci., 1990, 26, 155-175.
Gremli, H. A. Interaction of flavour compounds with soy protein. J. Am. Oil Chemists’ Soc., 1974, 51, 95A-
97A.
Grenby, T. H. Intense sweeteners for the food industry: an overview. Trends Food Sci. Technol., 1991, Jan,
1-5.
Grinberg, V. Ya.; Grinberg, N. V.; Mashkevich, A. Ya.; Burova, T. V.; Tolstoguzov, V. B. Calorimetric
study of interaction of ovalbumin with vanillin. Food Hydrocolloids, 2002, 16, 333-343.
Guichard, E.; Langourieux, S. Interactions between β-lactoglobulin and flavour compounds. Food Chem.,
2000, 71, 301-308.
Guillaume, J. Use of field beans (Vicia faba) and peas (Pisum sativum) in laying hens and growing chicken
diets. In: Protein Quality from Leguminous Crops, Eur., 1977, 5686 EN, pp 217-235.
Guéguen, J.; Chevalier, M.; Barbot, J.; Schaeffer, F. Dissociation and aggregation of pea legumin induced by
pH and ionic strength. J. Sci. Food Agric., 1988, 44, 167-182.
Hansen, A. P.; Booker, D. C. Flavour interaction with casein and whey protein. In: Flavour Food
Interactions, R. J. McGorrin and J. V. Leland Eds.; ACS symposium series 633; American Chemical
Society: Washington, DC, 1996, pp 75-89.
Hashimoto, Y.; Ishizone, H.; Ogura, M. Periandrin II and IV, triterpene glycosides from Periandra dulcis.
Phytochemistry, 1980, 19, 2411-2415.
Hashimoto, Y.; Ohta, Y.; Ishizone, H.; Kuriyama, M.; Ogura, M. Periandrin III, a novel sweet triterpene
glycosides from Periandra dulcis. Phytochemistry, 1982, 21(9), 2335-2337.
Hashimoto, Y.; Ishizone, H.; Suganuma, M.; Ogura, M.; Nakatsu, K.; Yoshioka, H. Periandrin I, a sweet
triterpene glycoside from Periandra dulcis. Phytochemistry, 1983, 22(1), 259-264.
Huhman, D. V.; Sumner, L. W. Metabolic profiling of saponins in Medicago sativa and Medicago truncatula
using HPLC coupled to an electrospray ion-trap mass spectrometer. Phytochemistry, 2002, 59, 347-
360.
Ireland, P. A.; Dziedzic, S. Z. High performance liquid chromatography of soyasaponins on silica phase with
evaporative light-scattering detection. J. Chromatogr., 1986, 361, 410-416.
Ireland, P. A.; Dziedzic, S. Z. Saponins and sapogenins of chickpea, haricot bean and red kidney bean. Food
Chem., 1987, 23, 105-116.
Ikedo, S.; Shimoyamada, M.; Watanabe, K. Interaction between bovine serum albumin and saponin as
studied by heat stability and protease digestion. J. Agric. Food Chem., 1996, 44, 792-795.
16

General Introduction
Jakobsen, H. B.; Hansen, M.; Christensen, M. R.; Brockhoff, P. B.; Olsen, C. E. Aroma volatiles of blanched
green peas (Pisum sativum L.) J. Agric. Food Chem., 1998, 46, 3727-3734.
Jambunathan, R.; Blain, H. L.; Dhindsa, K. H.; Hussein, L. A.; Kogure, K.; Li-Juan, L.; Youssef, M. M.
Diversifying use of cool season food legumes through processing. In: Expanding the production and
use of cool season food legumes; F. J. Muehlbauer and W. J. Kaiser, Eds.; Kluwer Academic
Publishers. Dordrecht, The Netherlands, 1994; pp 98-112.
Kasai, R.; Matsumoto, K.; Nie, R-L.; Morita, T.; Awazu, A.; Zhou, J.; Tanaka, O. Sweet and bitter
cucurbitane glycosides from Hemsleya carnosiflora. Phytochemistry, 1987, 26(5), 1371-1376.
Kasai, R.; Matsumoto, K.; Nie, R-L.; Zhou, J.; Tanaka, O. Glycosides from Chinese medical plant, Hemsleya
panacis-scandens, and structure-taste relationship of cucurbitane glycosides. Phytochemistry, 1988,
36(1), 234-243.
Kasai, R.; Nie, R-L.; Nashi, K.; Ohtani, K.; Zhou, J.; Tao, G-D.; Tanaka, O. Sweet cucurbitane glycosides
from fruits of Siraitia siamensis (chi-zi luo-han-guo), a Chinese Folk Medicine. Agric. Biol. Chem.,
1989, 53(12), 3347-3349.
Kennelly ,E. J.; Cai, L.; Long, L.; Shamon, L.; Zaw, K.; Zhou, B-N.; Pezzuto, J. M.; Kinghorn, A. D. Novel
highly sweet secodammarane glycosides from Pterocarya paliurus. J. Agric. Food Chem., 1995, 43,
2602-2607.
Kennelly ,E. J.; Cai, L.; Kim, N-C.; Kinghorn, A. D. Abrusoside E, a further sweet-tasting cycloartane
glycosides from the leaves of Abrus precatorius. Phytochemistry, 1996, 41(5), 1381-1383.
Kinghorn, A. D.; Soejarto, D. D. Discovery of terpenoid and phenolic sweeteners from plants. Pure Appl.
Chem., 2002, 74(7), 1169-1179.
Kitagawa, I. Licorice root. A natural sweetener and an important ingredient in Chinese medicine. Pure Appl.
Chem., 2002, 74(7), 1189-1198.
Khalil, A. H.; El-Adawy, T. A. Isolation, identification and toxicity of saponin from different legumes. Food
Chem., 1994, 50, 197-201.
Khokhar, S.; Chauhan, B. M. Antinutritional factors in moth bean (Vigna aconitifolia). Varietal differences
and effects of methods of domestic processing and cooking. J. Food Sci., 1986, 51, 591.
Krishna, T. G.; Croy, R. R. D.; Boulter, D. Heterogenity in subunit composition of the legumin of Pisum
sativum. Phytochemistry, 1979, 18, 1879-1880.
Kudou, S.; Tonomura, M.; Tsukamoto, C.; Uchida, T.; Sakabe, T.; Tamura, N.; Okubo K. Isolation and
structural elucidation of DDMP-conjugated soyasaponins as genuine saponins from soybean seeds.
Biosci. Biotechnol. Biochem., 1993, 57, 546-550.
King, B. M.; Solms, J. Interactions of flavour compounds in model food systems using benzyl alcohol as an
example. J. Agric. Food Chem., 1979, 27, 6, 1331-1334.
17

Chapter 1
Kinjo, J.; Hatakeyama, M.; Udayama, M.; Tsutanaga, Y.; Yamashita, M.; Hohara, T.; Yoshika, Y. HPLC
profile analysis of oleanene-glucuronides in several edible beans. Biosci. Biotechnol. Biochem., 1998,
62(3), 429-433.
Konoshima, T.; Kokumai, M.; Kozuka, M. Anti-tumor promoting activities of afromosin and soyasaponin I
iolated from Wistaria brachybotrys. J. Nat. Prod., 1992, 55, 1776-1778.
Laing, D. G.; Jinks, A. Flavour perception mechanisms. Trends Food Sci. Technol., 1996, 7, 387-389.
Lasztity, R.; Hidvegi, M.; Bata, A. Saponins in Food. Food Rev. Int., 1998, 14(4), 371-390.
Lee, F. A.; Wagenknecht, A. C. Enzyme action and off-flavour in frozen peas. II. The use of enzymes
prepared from garden peas. Food Research, 1958, 23, 584-590.
Leterme, P.; Monmart, T.; Baudart, E. Amino acid composition of pea (Pisum sativum) proteins and protein
profile of pea flour. J. Sci. Food Agric., 1990, 53, 107-110.
Lightowler, H.; Davies, J.; Long, A. A vegan food guide for vegans: a possible approach. Nutri. Food Sci.,
1998, 1, 38-40.
Liu, Y.; Xie, M-X.; Kang, J.; Zheng, D. Studies on the interaction of total saponins of panaz notoginseng and
human serum albumin by Fourier transform infrared spectroscopy. Spectrochim. Acta, Part A:
Molecular and Biomolecular Spectroscopy, 2003, 59(12), 2747-2758.
Lovegren, N. V., Fischer, G. S.; Legendre, M. G.; Schuller, W. H. Volatile constituents of dried legumes. J.
Agric. Food Chem., 1979, 27(4), 851-853.
Lubbers, S.; Landy, P.; Voilley, A. Retention and release of aroma compounds in food containing proteins.
Food Technol., 1998, 52, 5, 68-74 & 208-214.
Makaower, R. U.; Ward, A. C. Role of bruising and delay in the development of off-odours in peas. Food
Technol., 1950, 4, 46-49.
Massiot, G.; Dijoux, G. M.; Lavaud, C. Saponins and artifacts. In Saponins Used in Food and Agriculture,
Waller G. R., Yamasaki, K., Eds,; Plenum Press: New York, 1996; pp 183-192.
McNeill, V. L.; Schmidt, K. A. Vanillin interaction with milk protein isolates in sweetened drinks. J. Food
Sci., 1993, 58, 5, 1142-1147.
Mizutani, K.; Kuramoto, T.; Tamura, Y.; Ohtake, N.; Doi, S.; Nakaura, M.; Tanaka, O. Sweetness of
glycyrrhetic acid of 3-O-β-D-Monoglucuronide and related glycosides. Biosci. Biotechnol. Biochem.,
1994, 58(3), 554-555.
Morton, P. A. J.; Murray, B. S. Acid beverage floc: protein-saponin interactions and an unstable emulsion
model. Colloids Surf., B, 2001, 21, 101-106.
Murray, K. E.; Shipton, J.; Whitfield, F. B. 2-methoxypyrazines and the flavour of green peas (Pisum
sativum). Chem. Ind., 1970, 897-898.
Murray, K. E.; Whitfield, F. B. The occurrence of 3-alkyl-2-methoxypyrazines in raw vegetables. J. Sci.
Food Agric., 1975, 26, 973-986.
18
General Introduction
Murray, K. E.; Shipton, J.; Whitfield, F. B.; Last, J. H. The volatiles of off-flavoured unblanched green peas
(Pisum sativum). J. Sci. Food Agric., 1976, 27, 1039-1107.
Nawar, W. W. Some considerations in interpretation of direct headspace gas chromatography analyses of
food volatiles. Food Technol., 1966, 214, 115-117.
Ng, P. K. W.; Hoehn, E.; Bushuk, W. Binding of vanillin by fababean proteins. J. Food Sci., 1989, 54, 1,
105-107.
Oakenfull, D. G.; Fenwick, D. E.; Hood, R. L.; Topping, D. L.; Illman, R. J.; Storer, G. B. Effects of
saponins on bile acids and plasma lipids in the rat. Br. J. Nutr., 1979, 42, 209-216.
Oakenfull, D. G. Saponins in food - A Review. Food Chem., 1981, 6, 19-40.
Ohana, P.; Delmer, D. P.; Carlson, R. W.; Glushka, J.; Azadi, P.; Bacic, T.; Benziman, M. Identification of a
novel triterpenoid saponin from Pisum sativum as a specific inhibitor of the diguanylate cyclase of
Acetobacter xylinum. Plant Cell Physiol., 1998, 39(2), 144-152.
O’Kane, F. E. Molecular characterisation and heat-induced gelation of pea vicilin and legumin. In Heat-
induced gelation of pea legumin: A comparison with soybean glycinin, PhD thesis, Wageningen
University, The Netherlands, 2004, Chapter 4, pp. 62-86.
O’Keefe, S. F.; Resurreccion, A. P.; Wilson, L. A.; Murphy, P. A. Temperature effect on binding of volatile
flavour compounds to soy protein in aqueous model systems. J. Food Sci., 1991a, 56, 3, 802-806.
O’Keefe, S. F.; Wilson, L. A.; Resurreccion, A. P.; Murphy, P. A. Determination of the binding of hexanal to
soy glycinin and β-conglycinin in an aqueous model system using headspace technique. J. Agric.
Food Chem., 1991b, 39, 1022-1028.
Okubo, K.; Yoshiki, Y. Oxygen-radical-scavenging activity of DDMP-conjugated saponins and
physiological role in leguminous plant. In Saponins Used in Food and Agriculture, Waller G. R.,
Yamasaki, K., Eds,; Plenum Press: New York, 1996; pp 141-154.
Oleszek, W., Jurzysta, M., Price, K.R., Fenwick, G.R. High performance liquid chromatography of alfalfa
root saponins. J. Chromatogr., 1990a, 519, 109-116.
Oleszek, W.; Price, K. R., Colquhoun, I. J.; Jurzysta, M.; Ploszynski, M.; Fenwick, G. R. Isolation and
identification of alfalfa (Medicago sativa L.) root saponins: Their activity in relation to a fungal
bioassay. J. Agric. Food Chem., 1990b, 38, 1810-1817.
O’Neill, T. E.; Kinsella, J. E. Flavour protein interactions: Characteristics of 2-nonanone binding to isolated
soy protein fractions. J. Food Sci., 1987a, 52, 1, 98-101.
O’Neill, T. E.; Kinsella, J. E. Binding of alkanone flavours to β-lactoglobulin: Effects of conformational and
chemical modification. J. Agric. Food Chem., 1987b, 35, 5, 770-774.
O’Neill, T. E.; Kinsella, J. E. Effect of heat treatment and modification on conformation and flavour binding
by β-lactoglobulin. J. Food Sci., 1988, 53, 3, 906-909.
19
Chapter 1
O’Neill, T. E. Flavour binding by food proteins: An overview. In: Flavour Food Interactions, R. J. McGorrin
and J. V. Leland Eds.; ACS symposium series 633; American Chemical Society: Washington, DC,
1996, pp 59-74.
Owusu-Ansah ,Y. J.; McCurdy, S. M. Pea proteins: a review of chemistry, technology of production, and
utilization. Food Rev. Int., 1991, 7, 1, 103-134.
Park, M. K.; Park, H. J.; Han, S. B.; Shin, Y. G.; Park, I. H. High performance liquid chromatographic
analysis of ginseng saponins using evaporative light scattering detection. J. Chromatogr. A., 1996,
736, 77-81.
Pelletier, E.; Sostmann, K.; Guichard, E. Measurement of interactions between β-lactoglobulin and flavour
compounds (esters, acids, and pyrazines) by affinity and exclusion size chromatography. J. Agric.
Food Chem., 1998, 46, 1506-1509.
Plug, H.; Haring, P. The role of ingredient-flavour interactions in the development of fat-free foods. Trends
Food Sci. Technol., 1993, 4, 150-152.
Plug, H.; Haring, P. The influence of flavour-ingredient interactions on flavour perception. Food Quality &
Preference, 1994, 5, 95-102.
Potter, S. M.; Flores, J. R.; Pollack, J.; Lone, T. A.; Jimenez, M. D. B. Protein-saponin interaction and its
influence on blood lipids. J. Agric. Food Chem., 1993, 41, 1287-1291.
Price, K. R.; Fenwick, G. R. Soyasaponin I, a compound possessing undesirable taste characteristics isolated
from the dried pea (Pisum sativum L.). J. Sci. Food Agric., 1984, 35, 887-892.
Price, K. R.; Griffiths, N. M.; Curl, C. L.; Fenwick, G. R. Undesirable sensory properties of the dried pea
(Pisum sativum). The role of saponins. Food Chem., 1985, 17, 105-115.
Price, K. R.; Curl, C. L.; Fenwick, G. R. The saponin content and sapogenol composition of the seed of 13
varieties of legume. J. Sci. Food Agric., 1986, 37, 1185-1191.
Price, K. R.; Johnson, I. T.; Fenwick, G. R. The chemistry and biological significance of saponins in foods
and feedstuffs. Crit. Rev. Food Sci. Nutr., 1987, 26(1), 27-135.
Price, K. R.; Eagles, J; Fenwick, G. R. Saponin composition of 13 varieties of legume seed using fast atom
bombardment mass spectrometry. J. Sci. Food Agric., 1988, 42, 183-193.
Ralls, J. W.; McFadden, W. H.; Seifert, R. M.; Black, D. R.; Kilpatrick, P. W. Volatiles from a commercial
pea blancher. Mass spectral identifications. J. Food Sci., 1965, 30, 228-232.
Reichert, R. D.; MacKenzie, S. L. Composition of peas (Pisum sativum) varying widely in protein content. J.
Agric. Food Chem, 1982, 30, 312-317.
Reichert, R. D.; Tatarynovich, J. T.; Tyler, R. T. Abrasive dehulling of quinoa (Chemopodium quinoa):
Effect on saponin content was determined by an adapted haemolytic assay. Cereal Chem., 1986, 63,
471-475.
20
General Introduction
Reiners, J.; Nicklaus, S.; Guichard, E. Interactions between β-lactoglobulin and flavour compounds of
different chemical classes. Impact of the protein on the odour perception of vanillin and eugenol. Le
Lait, 2000, 80, 347-360.
Reineccius, G. A. Source book of flavours. Chapman and Hall, New York, 1994
Rogacheva, S.; Espinosa-Diaz, M. A.; Voilley, A. Transfer of aroma compounds in water-lipid systems:
Binding tendency of β-lactoglobulin. J. Agric. Food Chem., 1999, 47, 259-263.
Ruiz, R. G.; Price, K. R.; Rose, M. E.; Fenwick, G. R. Effect of seed size and testa colour on saponin content
of Spanish lentil seed. Food Chem., 1997, 58(3), 223-226.
Sakurai, N.; Wu, J. H.; Sashida, Y.; Mimaki, Y.; Nikaido, T.; Koike, K.; Itokawa, H.; Lee, K, H. Anti-AIDs
agents. Part 57: Acetin, an anti-HIV principle from the rhizome of Cimicifuga racemosa (black
cohosh), and the anti-HIV activity of related saponins. Bioorg. Med. Chem. Lett., 2004, 14, 1329-
1332.
Schroeder, H. E. Quantitative studies on the cotyledonary proteins in the genus Pisum. J. Sci. Food Agric.,
1982, 33, 623-633.
Sessa, D. J.; Rackis, J. J. Lipid-derived flavours of legumes. J. Am. Chem. Soc., 1976, 53, 145A.
Sharma, A.; Sehgal, S. Effect of processing and cooking on the antinutritional factors of faba bean (Vicia
faba). Food Chem., 1992, 43, 383-385.
Shimoyamada, M.; Ikedo, S.; Ootsubo, R.; Watanabe, K. Effects of soybean saponins on chymotryptic
hydrolyses of soybean proteins. J. Agric. Food Chem., 1998, 46, 2, 4793-4794.
Shimoyamada, M.; Ootsubo, R.; Naruse, T.; Watanabe, K. Effects of soybean saponin on protease
hydrolyses of β-lactoglobulin and α-lactalbumin. Biosci. Biotechnol. Biochem., 2000, 64, 4, 891-893.
Shiraiwa, M.; Kudo, S.; Shimoyamada, M.; Harada, K.; Okubo, K. Composition and structure of “group A
saponin” in soybean seed. Agric. Biol. Chem., 1991a, 55, 315-322.
Shiraiwa, M.; Harada, K.; Okubo, K. Composition and structure of “group B saponin” in soybean seed.
Agric. Biol. Chem., 1991b, 55, 911-917.
Shiraiwa, M.; Harada, K.; Okubo, K. Composition and content of saponins in soybean seed according to
variety, cultivation year and maturity. Agric. Biol. Chem., 1991c, 55, 323-331.
Sosulski, F. W.; McCurdy, A. R. Functionality of flours, protein fractions and isolates from field peas and
faba bean. J. Food Sci., 1987, 52(4), 1010-1014.
Suttisri, R.; Chung, M-S.; Kinghorn, A. D.; Sticher, O.; Hashimoto, Y. Periandrin V, a further sweet
triterpene glycoside from Periandra dulcis. Phytochemistry, 1993, 34(2), 405-408. Takasaki, M.; Konoshima, T.; Murata, Y.; Sugiura, M.; Nishino, H.; Tokuda, H.; Matsumoto, K.; Kasai, R.;
Yamasaki, K. Anticarcinogenic activity of natural sweeteners, cucurbitane glycosides, from
Momordica grosvenori. Cancer Letters, 2003, 198, 37-42.
21
Chapter 1
22
Topping, D. L.; Storer, G. B.; Calvert, G. D.; Illman, R. J.; Oakenfull, D. G.; Weller, R. A. Effects of dietary
saponins on fecal bile acids and neutral sterols, plasma lipids and lipoprotein turnover in the pig. Am.
J. Clin. Nutr., 1980, 33, 783-786.
Tsurumi, S.; Takagi, T.; Hashimoto, T. A γ-pyronyl-tri-terpenoid saponin from Pisum sativum.
Phytochemistry, 1992, 31, 2435-2438.
Woldemichael, G. M.; Montenegro, G.; Timmermann, B. N. Triterpenoidal lupin saponins from the Chilean
legume Lupinus oreophilus. Phytochemistry, 2003, 63, 853-857.
Yoshiki, Y.; Okubo, K. Active oxygen scavenging activity of DDMP (2,3-Dihydro-2,5-dihydroxy-6-methyl-
4H-pyran-4-one) saponin in soybean seed. Biosci. Biotechnol. Biochem., 1995, 59, 8, 1556-1557.
Yoshiki, Y.; Kudou, S.; Okubo, K. Relationship between chemical structures and biological activities of
triterpenoid saponins from soybean. Biosci. Biotechnol. Biochem., 1998 62(12), 2291-2299.
Zhu, X.; van Ierland, E.; Wesseler, J. Introducing Novel Protein Foods in the European Union: Economic
and environmental impacts. In Consumer Acceptance of genetically modified food, Evenson, R. E. and
Santaniello, V. eds. CAB International, Oxfordshire, 2004, pp 189-208.

Chapter 2
Stability of pea DDMP saponin and the
mechanism of its decomposition
This Chapter has been submitted to Food Chemistry as L. Heng, J.-P. Vincken, K. Hoppe, G.A. van Koningsveld, K.
Decroos, H. Gruppen, M.A.J.S. van Boekel, A.G.J. Voragen. Stability of pea DDMP saponin and the mechanism of its
decomposition.
Chapter 2
ABSTRACT
DDMP saponin can be converted to saponin B by the loss of its DDMP group (2,3-dihydro-2,5-
dihydroxy-6-methyl-4H-pyran-4-one). The stability of DDMP saponin from pea was investigated
under various conditions (temperature, ethanol concentration, pH). DDMP saponin in water was
observed to be unstable at acidic and alkaline pHs, and to have an optimal stability around pH 7. In
water, DDMP saponin became unstable at temperatures > 30 oC. The presence of ethanol, however,
had a stabilizing effect on the DDMP group. The loss of the DDMP group at 65 °C could be
completely prevented at > 30% (v/v) ethanol. The breakdown reaction of DDMP saponin and the
subsequent formation of saponin B was modeled using a multi-response modeling approach and
was found to be best described by a first-order reaction. The activation energy was estimated to be
49 kJ/mol, indicating a chemical reaction with moderate temperature dependence. A mechanism of
DDMP saponin decomposition is proposed, consisting of a fast protonation or deprotonation
followed by a rate-determining step in which maltol is the leaving group.
KEYWORDS: Green pea(s), DDMP saponin, saponin B, kinetics, ethanol, HPLC, ELSD,
modeling
24

Stability of DDMP saponin
INTRODUCTION
Saponins are non-volatile, amphiphilic, surface-active triterpene glycosides that occur in a wide
variety of legume seeds such as peas, soybeans, lentils and lupins (Lasztity et al., 1998). They are
known to have a bitter taste (Price et al., 1985; Koziol, 1991; Heng et al., submitted) and possess
health beneficial effects such as lowering cholesterol levels (Milgate & Roberts, 1995). Saponins
are generally categorized into 3 main groups, on the basis of their aglycone (soyasapogenol)
structures: group A, B and E (Figure 1). The aglycones of group A saponins have a hydroxyl group
at the C-21 position, whereas those of group B saponins have a hydrogen atom. Group E saponins
differ from group B saponins in that their aglycones have a carbonyl group at C-22. Group A
saponins are bisdesmoside saponins having sugar chains at the C-3 and the C-22 positions of their
aglycones (soyasapogenol A), whereas Group B and E saponins are monodesmoside saponins
having a sugar chain linked to only the C-3 position of their aglycones (soyasapogenol B and
soyasapogenol E, respectively) (Shiraiwa et al., 1991a/b; Yoshiki et al., 1998). Group A saponins
may contain acetyl groups attached to the terminal sugar residue of the C22 oligosaccharyl chain
(Shiraiwa et al., 1991a). Group B saponins may contain a DDMP (2,3-dihydro-2,5-dihydroxy-6-
methyl-4H-pyran-4-one) moiety at C-22, which upon heating is released as maltol (Kudou et al.,
1993). These B saponins are denoted as DDMP saponins.
Figure 1: Structures of group A, B, E and DDMP saponins.
Saponin B (soyasaponin I) has been reported as the main saponin component in green peas (Price &
Fenwick, 1984; Curl et al., 1985; Price et al., 1985; 1988; Daveby et al., 1997; Kinjo et al., 1998).
25
Chapter 2
However, it was only until recently that DDMP saponin (soyasaponin βg) was also identified in
peas (Daveby et al., 1998). DDMP saponin is widely distributed in legumes (Yoshiki et al., 1994)
and is the predominating saponin in 16 different pea varieties (Heng et al., submitted) and in
soybean (Kudou et al., 1992; 1993; Hu et al., 2002; Lin & Wang, 2004). Saponin B is the major
saponin in processed soy products and heated pea products, presumably due to the conversion of
DDMP saponin to saponin B during extraction and processing (Berhow et al., 2002; Hu et al.,
2002; Heng et al., submitted). In addition, reports have shown that DDMP saponin is converted to
saponin B in acidic or basic solutions (Massiot et al., 1996; Okubo & Yoshiki, 1996). These results
indicate that DDMP saponin is unstable under conditions commonly applied during food
processing, but detailed studies mapping these conditions are lacking. A systematic study of DDMP
saponin stability will provide information, not only on the effect of extraction and processing, but
may also provide tools on the possible removal or masking of the undesirable bitterness of saponins
in pea product (Heng et al., submitted). The aim of our research was to study the stability of DDMP
saponin at various conditions of temperature, ethanol concentration and pH.
26

Stability of DDMP saponin
MATERIALS AND METHODS
Saponin extraction
Saponins were extracted from peas (Pisum sativum, Solara spp.) obtained from Cebeco (Vlijmen,
The Netherlands). The extraction procedure is illustrated in Figure 2. The peas were milled in a
commercial blender (Waring, New Hartford, Connecticut, U.S.A.) in the ratio 1:1 (w/w) with dry
ice. Pea flour was defatted by hexane (Super gradient, Lab-scan, Dublin, Ireland) refluxing for 6 h
and subsequently the pea flour was air-dried in a fume hood overnight. Defatted pea flour (1 g) was
extracted with 70% (v/v) ethanol (100 mL) for 1 hour at 25 oC with constant shaking at 200 rpm in
an incubator shaker (Innova 4000, New Brunswick Scientific, Nijmegen, The Netherlands). The
crude extract was filtered through an ashless filter paper (White band 5892, 110 mm, Schleicher &
Schuell, Dassel, Germany). The ethanol from the clear filtrate was evaporated under vacuum at 27 oC. This evaporation step was performed in less than 15 min using a 1 L round-bottom flask. The
removal of ethanol made the extract turbid, and hence the resulting extract (~30 mL) was made up
to 40 mL with distilled water and was centrifuged (36,000 x g; 10 min; 10 oC). The supernatant
obtained was passed through a Sep-Pak C18 solid phase extraction column (400 mg, Waters Plus
tC18 cartridge, 37-55 µm, Waters Etten-Leur, The Netherlands), which was subsequently rinsed
with 15 mL water to remove unbound material. The bound compounds were eluted with 10 mL of
100% (v/v) methanol (HPLC grade; Lab-Scan, Dublin, Ireland) and air-dried. The air-dried saponin
sample was solubilized in 1 mL of 50% (v/v) ethanol and centrifuged (36,000 x g; 10 min) before
HPLC analysis. For stability tests, the extraction was upscaled to 5 g of pea flour in 500 mL of 70%
(v/v) ethanol, and a 5 g Waters Plus tC18 column, 37-55 µm (Waters Etten-Leur, The Netherlands)
was used.
27

Chapter 2
Figure 2: Optimized extraction protocol for obtaining native saponins from pea flour. Critical steps
in the procedure are in bold.
extraction (ratio of pea flour to 70% ethanol 1:100, 25 oC, 1 h), followed by filtration
vacuum evaporation (< 15 min, < 30 oC)
centrifugation (10 min, 10 oC)
Sep-Pak RP-C18 (elution 100% methanol)
air-drying (room temperature)
solubilisation (50% ethanol)
HPLC analysis
Crude saponins extract
Supernatant
Saponins extract
Dried saponins
Aqueous saponins extract
Defatted pea flour
Residue flour
Pellet
High performance liquid chromatography – Mass Spectrometry (HPLC-MS) analysis
Reversed-phase high performance liquid chromatography (RP-HPLC) was used for the analysis of
pea saponins. Evaporative light scattering detection (ELSD) was used for detection and ion trap
electrospray mass spectrometry (MS) was used for component identification. A SpectraSYSTEM
HPLC (Thermo Separation Products, Fremont, CA) coupled to a Sedex 55 ELS detector
(S.E.D.E.R.E., Alfortville, France) was used. Separation was performed using an Aquasil reversed-
phase C18 column (4.6 x 150 mm, 3 µm) (Thermo Hypersil, Bellefonte, P.A., U.S.A.). The solvents
used were water:acetic acid (100:0.001, v/v) (A) and acetonitrile:acetic acid (100:0.001, v/v) (B).
The gradient used was as follows: 0→8 min, 40→50% B; 8→10 min, 50→100% B; 10→15 min,
100% B (isocratic); 15→20 min, 40% B (isocratic). Samples of 20 µL were injected and a flow rate
28

Stability of DDMP saponin
of 1 mL/min was used. The eluate from the column was split into 3 directions: 100 µL/min to the
ELSD, 50 µL/min to the LCQ Ion-trap MS (Thermo Finnigan, San Jose, CA) and 850 µL/min to the
waste. The ELSD was set at 40 oC at an air pressure of 2.3 bars and a sensitivity of 12.
Quantification of DDMP and B saponins was done by means of the response factors determined by
Decroos et al. (2005). The decrease in DDMP saponin concentration was obtained by integrating
the area of its peak (after heat treatment) in the HPLC-chromatogram, whereas the increase in
saponin B concentration was obtained by subtracting the initial saponin B area from the area of the
saponin B peak obtained after heat treatment. MS analysis was performed in the positive ion mode
using a spray voltage of 5.5 kV, a capillary voltage of 15 V and a capillary temperature of 200 oC.
A full scan mass spectrum over a m/z (mass to charge ratio) range of 150-1500 was obtained. The
mass spectra were recorded and analyzed with the use of Xcalibur software. The m/z ratio of the
molecular ions [M+H]+ in the mass spectra of the peaks of DDMP saponin and saponin B were
1069 and 943, respectively.
Stability tests
(i) Effect of temperature
Saponin samples of 1 mg/mL were prepared in water (pH 6.7). Temperatures of 40, 50, 60, 65, 75
and 90 oC were chosen. At each temperature, the samples were heated for 15, 30, 45, 60 and 75 min
with constant shaking at 400 rpm in an incubator shaker (Eppendorf AG, Thermomixer comfort,
Hamburg, Germany). The samples were cooled to room temperature before an equal volume of
absolute ethanol was added. The samples were centrifuged at 24,700 x g at 10 oC for 5 min, and 20
µL of the supernatant was injected onto the HPLC column for analysis as described above. All
experiments were performed in triplicate.
(ii) Effect of ethanol
Saponin samples of 1 mg/mL were prepared in aqueous ethanol containing: 0, 5, 10, 15, 20, 30, 50
and 60% (v/v) ethanol. The samples were heated at 65 oC for 15, 30, 45, 60, 75 and 90 min with
constant shaking at 400 rpm in an incubator shaker (Eppendorf AG, Thermomixer comfort,
Hamburg, Germany). The samples were cooled to room temperature, centrifuged at 24,700 x g at 10 oC for 5 min, and 20 µL of the supernatant was injected onto the HPLC column for analysis. All
experiments were performed in triplicate.
29
Chapter 2
(iii) Effect of pH
Saponin samples of 1 mg/mL were prepared in solutions of various pHs (2 to 10). Solutions at pH 2
to 6 were prepared in water containing HCl in molarities of 0.00125 to 12.5 mM. Solutions at pH 8
to 10 were prepared in water containing NaOH in molarities of 0.00125 to 1.25 mM. All solutions
were stored under nitrogen. 20 µL of a saponin stock solution of 5 mg/mL was added to 80 µL of
the solutions of various pH. The pH of the samples was measured and the samples were flushed
with nitrogen, followed by incubation at 35 oC for 20 h. After incubation, the pH of the samples was
measured again, followed by adjustment of the pH of the samples to pH 7 with HCl or NaOH, with
only negligible change in sample volume. The samples were centrifuged at 24,700 x g at 10 oC for 5
min and 20 µL of the supernatant was injected onto the HPLC column for analysis. All experiments
were performed in triplicate.
Modelling of the thermal stability of DDMP saponin
A first-order kinetic model was applied for characterizing DDMP saponin stability according to the
following reaction:
BDDMP → k
The concentrations of both DDMP saponin and saponin B (as a function of time) were taken into
account in the modeling, using the so-called multi-response modeling approach (van Boekel, 1996).
The initial concentrations of DDMP saponin and saponin B were measured, and the rate constant k,
was estimated. Upon starting the experiments, both DDMP and saponin B were present, and
subsequent heating caused a breakdown of DDMP. Because of the relatively large differences in the
initial concentrations, it was decided to model the initial concentrations rather than fixing them. The
parameters were estimated by nonlinear regression in order to avoid undesirable effects of
logarithmic transformations (van Boekel, 1996). The software used was Athena Visual Workbench,
a program designed for multi-response modeling (www.athenavisual.com). The activation energy
was derived from the temperature dependence of the rate constants using Arrhenius law.
30

Stability of DDMP saponin
RESULTS
Optimization of extraction conditions
The DDMP saponin that is present in peas is heat labile (Daveby et al., 1998) and can be converted
to its corresponding saponin B (Daveby et al., 1998; Berhow et al., 2002; Heng et al., submitted).
As the extraction conditions (temperature, time) seem to determine the DDMP saponin content
(Daveby et al., 1998), the extraction temperature and time were the primary parameters to be taken
into consideration when designing an extraction method. The extraction procedure described in the
Materials and Methods section and as shown in Figure 2 was obtained after careful optimization.
Temperatures during extraction and drying of 20 oC, 30 oC and 40 oC, extraction times of 1 h, 2 h, 3
h, 4 h and 24 h, and extraction volumes of 100 mL and 300 mL per gram of defatted pea flour were
investigated. DDMP saponin was extracted as the major saponin in green peas at all extraction
conditions with a small amount of saponin B (results not shown). DDMP saponin was observed to
remain stable at temperatures up to 30 oC, whereas a small decrease in stability was observed at 40 oC. Lin & Wang (2004) also observed that DDMP saponin remained relatively stable at
temperatures ≤ 30 oC. Extraction times longer than 1 h or extraction volumes larger than 100 ml per
gram of pea flour did not affect the amount of saponins extracted. Also, the ratio of saponin B to
DDMP saponin (1:4) in the extract remained constant even after 24 h of extraction, provided that
the temperature was kept below 30 oC, and the evaporation step before solid phase extraction was
performed in less than 15 min. The removal of ethanol resulted in a turbid extract, but the pellet
obtained after centrifugation showed no traces of saponins.
Through systematic investigation of these parameters, the optimal conditions for the extraction of
saponins from peas were found: the saponins from one gram of pea flour were extracted using 100
mL of 70% (v/v) aqueous ethanol during 1 h at 25 oC (Materials and Methods). With the use of this
isolation method, DDMP saponin was obtained as the major saponin present in green peas and it
was used for the systematic stability study concerning the effects of temperature, pH and ethanol
concentration on the concentration of DDMP saponin.
Effect of temperature on DDMP saponin
The concentration of DDMP saponin as a function of time at various temperatures is shown in
Figure 3. The concentration of DDMP saponin remained stable in water at temperatures ≤ 30 oC for
a period of at least 75 min. Upon increasing the temperature, a small decrease in DDMP saponin
31

Chapter 2
concentration with time was observed at 40 oC. Above 40 oC, the decrease in concentration of
DDMP saponin became more pronounced, with a 50% and a 75% decrease in DDMP saponin
concentration after 75 min at 60 oC and 75 oC, respectively. At 90 oC, the decrease of DDMP
saponin concentration was even faster than at 75 oC, and a decrease to 5% was reached within 75
min. At 50 oC and 65 oC, similar trends were observed (results not shown).
0
20
40
60
80
100
120
0 10 20 30 40 50 60 70 80 9Time (min)
DD
MP
sapo
nin
(%)
60oC
40oC
75oC
30oC
90oC
0
Figure 3: Effect of temperature on the DDMP saponin concentration as a function of time.
Modeling of the (thermal) stability of DDMP saponin
With the results obtained from the thermal stability studies, a model was applied for analyzing the
DDMP saponin degradation kinetics and to obtain the activation energy (Ea) of the reaction. Figure
4 shows the course of DDMP saponin and saponin B concentrations as a function of time, and the
fit of the applied model, when a temperature of 65 oC is applied. The breakdown of DDMP saponin
was, at all temperatures, observed to result in the parallel formation of saponin B. Although some
individual results showed a relatively high degree of variation, the molar sum of DDMP saponin
and saponin B was more or less constant. The results modeled indicate that the breakdown reaction
32

Stability of DDMP saponin
of DDMP saponin ( DDMP ) follows a first-order reaction, and that there are no other
parallel or consecutive reactions of quantitative importance.
B→k
0
0.1
0.2
0.3
0.4
0.5
0 20 40 60 80
Time (min)
Con
cent
ratio
n (m
mol
/L)
100
Figure 4: Degradation of DDMP saponin (♦) and formation of saponin B (■) after heating at 65 ºC. The
molar sum of DDMP saponin and saponin B is also indicated (o). The solid lines represent the model fit of
the proposed first order reaction.
Table 1 shows the resulting estimates of the observed rate constant k (± 95% confidence intervals)
for the degradation of DDMP saponin and the formation of saponin B at various temperatures.
The Ea of the reaction was derived from the temperature dependence of the rate constant using
Arrhenius law:
)exp(0 RTE
kk a−=
In this equation, k0 represents the pre-exponential factor, Ea the activation energy, R the gas
constant, and T the absolute temperature. In order to avoid statistical problems with nonlinear
regression, due to a strong correlation between the parameters k0 and Ea, this equation was
reparameterized, as described by van Boekel (1996), to:
33

Chapter 2
))11(exp(ref
aref TTR
Ekk −−=
In this equation, Tref and kref are the reference temperature and the rate constant at the reference
temperature, respectively. The reference temperature was chosen as the average of all the
temperatures investigated; in this case 63.3 °C. Ea and kref were estimated using weighted nonlinear
regression. The weights were derived from the confidence intervals of the rate constants shown in
Table 1. The estimated Ea was 49 ± 12 kJ/mol and the reference rate constant, kref was 0.0053 ±
0.0005 min-1 (± 95% confidence interval).
Table 1: The resulting estimates of the rate constant k ± 95% confidence intervals for the
degradation of DDMP saponin and the formation of saponin B at various temperatures
Temperature (°C) Experiment no. k (min-1)
40 1 0.0012 ± 0.0006
2 0.0009 ± 0.0004
3 0.0015 ± 0.0007
50 1 0.0028 ± 0.0007
2 0.0014 ± 0.0006
60 1 0.0047 ± 0.0003
2 0.0029 ± 0.0006
3 0.0063 ± 0.0013
65 1 0.0067 ± 0.0009
2 0.0056 ± 0.0003
3 0.0094 ± 0.0008
4 0.0067 ± 0.0009
5 0.0056 ± 0.0003
75 1 0.0100 ± 0.0009
2 0.0076 ± 0.0015
3 0.0130 ± 0.0043
90 1 0.0168 ± 0.0049
2 0.0157 ± 0.0027
34
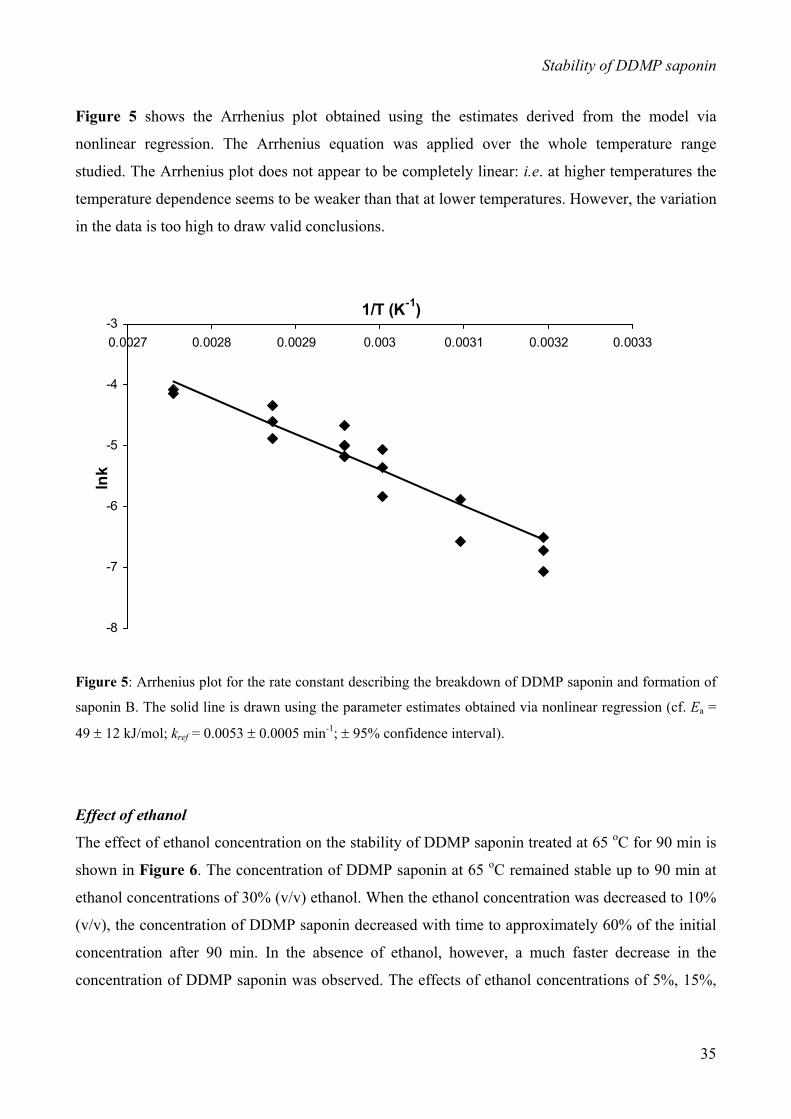
Stability of DDMP saponin
Figure 5 shows the Arrhenius plot obtained using the estimates derived from the model via
nonlinear regression. The Arrhenius equation was applied over the whole temperature range
studied. The Arrhenius plot does not appear to be completely linear: i.e. at higher temperatures the
temperature dependence seems to be weaker than that at lower temperatures. However, the variation
in the data is too high to draw valid conclusions.
-8
-7
-6
-5
-4
-30.0027 0.0028 0.0029 0.003 0.0031 0.0032 0.0033
1/T (K-1)
lnk
Figure 5: Arrhenius plot for the rate constant describing the breakdown of DDMP saponin and formation of
saponin B. The solid line is drawn using the parameter estimates obtained via nonlinear regression (cf. Ea =
49 ± 12 kJ/mol; kref = 0.0053 ± 0.0005 min-1; ± 95% confidence interval).
Effect of ethanol
The effect of ethanol concentration on the stability of DDMP saponin treated at 65 oC for 90 min is
shown in Figure 6. The concentration of DDMP saponin at 65 oC remained stable up to 90 min at
ethanol concentrations of 30% (v/v) ethanol. When the ethanol concentration was decreased to 10%
(v/v), the concentration of DDMP saponin decreased with time to approximately 60% of the initial
concentration after 90 min. In the absence of ethanol, however, a much faster decrease in the
concentration of DDMP saponin was observed. The effects of ethanol concentrations of 5%, 15%,
35
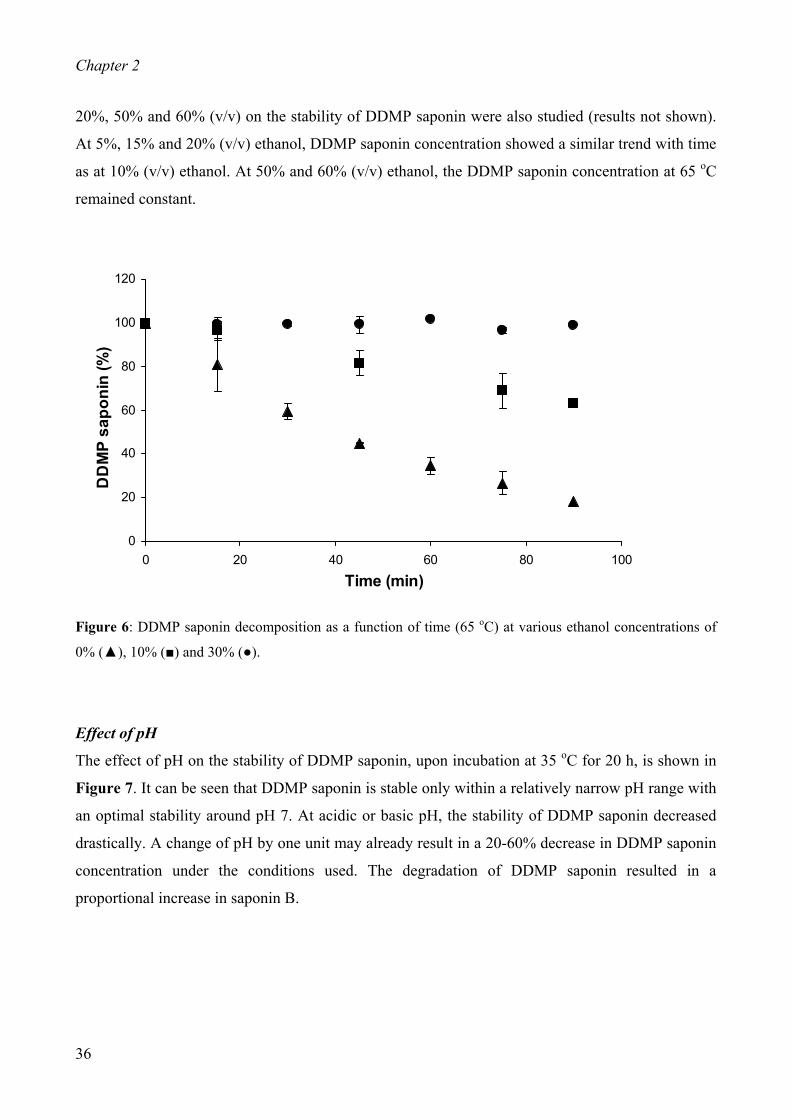
Chapter 2
20%, 50% and 60% (v/v) on the stability of DDMP saponin were also studied (results not shown).
At 5%, 15% and 20% (v/v) ethanol, DDMP saponin concentration showed a similar trend with time
as at 10% (v/v) ethanol. At 50% and 60% (v/v) ethanol, the DDMP saponin concentration at 65 oC
remained constant.
0
20
40
60
80
100
120
0 20 40 60 80 1
Time (min)
DD
MP
sapo
nin
(%)
00
Figure 6: DDMP saponin decomposition as a function of time (65 oC) at various ethanol concentrations of
0% (▲), 10% (■) and 30% (●).
Effect of pH
The effect of pH on the stability of DDMP saponin, upon incubation at 35 oC for 20 h, is shown in
Figure 7. It can be seen that DDMP saponin is stable only within a relatively narrow pH range with
an optimal stability around pH 7. At acidic or basic pH, the stability of DDMP saponin decreased
drastically. A change of pH by one unit may already result in a 20-60% decrease in DDMP saponin
concentration under the conditions used. The degradation of DDMP saponin resulted in a
proportional increase in saponin B.
36
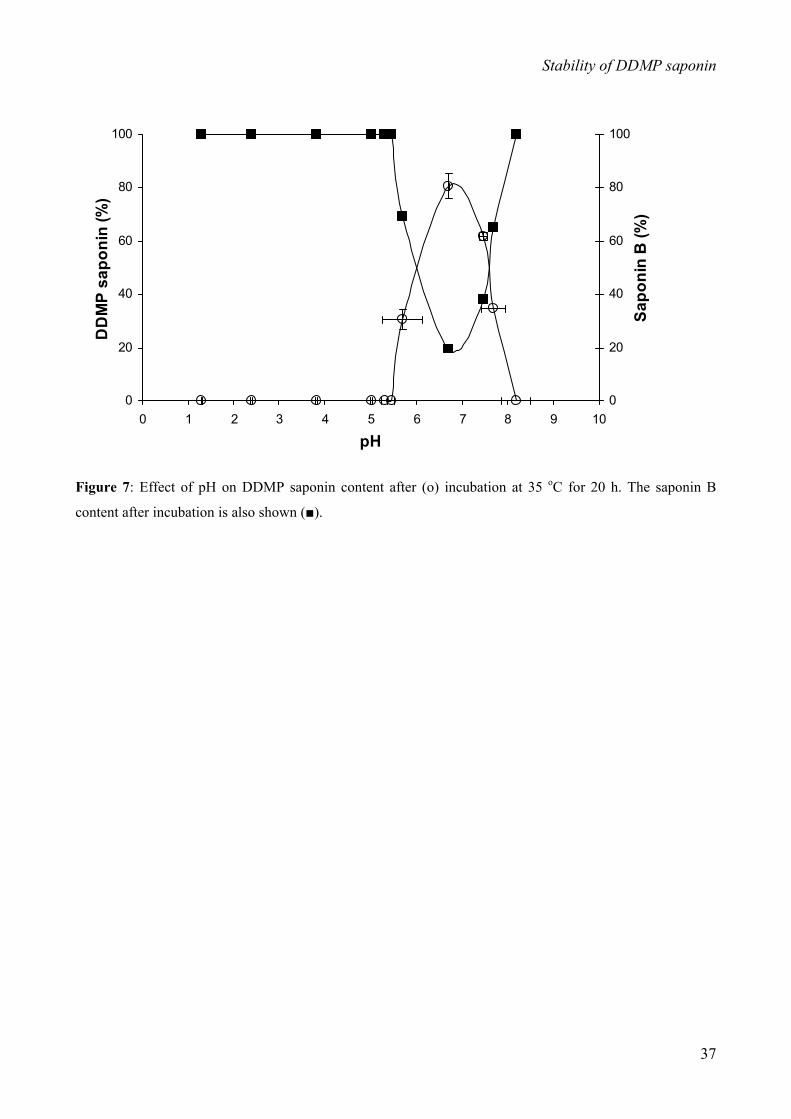
Stability of DDMP saponin
0
20
40
60
80
100
0 1 2 3 4 5 6 7 8 9 10
pH
DD
MP
sapo
nin
(%)
0
20
40
60
80
100
Sapo
nin
B (%
)
Figure 7: Effect of pH on DDMP saponin content after (o) incubation at 35 oC for 20 h. The saponin B
content after incubation is also shown (■).
37
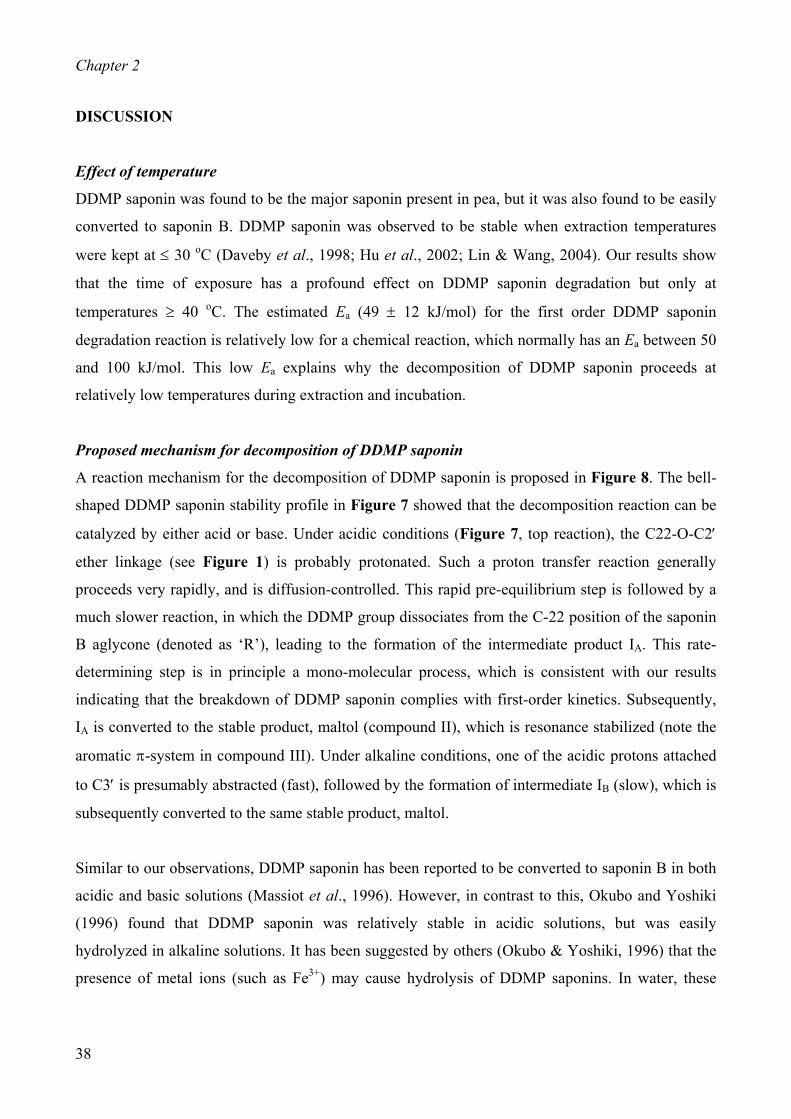
Chapter 2
DISCUSSION
Effect of temperature
DDMP saponin was found to be the major saponin present in pea, but it was also found to be easily
converted to saponin B. DDMP saponin was observed to be stable when extraction temperatures
were kept at ≤ 30 oC (Daveby et al., 1998; Hu et al., 2002; Lin & Wang, 2004). Our results show
that the time of exposure has a profound effect on DDMP saponin degradation but only at
temperatures ≥ 40 oC. The estimated Ea (49 ± 12 kJ/mol) for the first order DDMP saponin
degradation reaction is relatively low for a chemical reaction, which normally has an Ea between 50
and 100 kJ/mol. This low Ea explains why the decomposition of DDMP saponin proceeds at
relatively low temperatures during extraction and incubation.
Proposed mechanism for decomposition of DDMP saponin
A reaction mechanism for the decomposition of DDMP saponin is proposed in Figure 8. The bell-
shaped DDMP saponin stability profile in Figure 7 showed that the decomposition reaction can be
catalyzed by either acid or base. Under acidic conditions (Figure 7, top reaction), the C22-O-C2′
ether linkage (see Figure 1) is probably protonated. Such a proton transfer reaction generally
proceeds very rapidly, and is diffusion-controlled. This rapid pre-equilibrium step is followed by a
much slower reaction, in which the DDMP group dissociates from the C-22 position of the saponin
B aglycone (denoted as ‘R’), leading to the formation of the intermediate product IA. This rate-
determining step is in principle a mono-molecular process, which is consistent with our results
indicating that the breakdown of DDMP saponin complies with first-order kinetics. Subsequently,
IA is converted to the stable product, maltol (compound II), which is resonance stabilized (note the
aromatic π-system in compound III). Under alkaline conditions, one of the acidic protons attached
to C3′ is presumably abstracted (fast), followed by the formation of intermediate IB (slow), which is
subsequently converted to the same stable product, maltol.
Similar to our observations, DDMP saponin has been reported to be converted to saponin B in both
acidic and basic solutions (Massiot et al., 1996). However, in contrast to this, Okubo and Yoshiki
(1996) found that DDMP saponin was relatively stable in acidic solutions, but was easily
hydrolyzed in alkaline solutions. It has been suggested by others (Okubo & Yoshiki, 1996) that the
presence of metal ions (such as Fe3+) may cause hydrolysis of DDMP saponins. In water, these
38

Stability of DDMP saponin
metal ions may form relatively strong acids, e.g. the pKa of Fe(H2O)63+ is 2.2 (Li et al., 1996). The
bell-shaped pH - [DDMP saponin] plot (Figure 7) shows that a slight decrease of pH already causes
a considerable decrease in DDMP saponin stability, and hence, the presence of small amounts of
Fe3+ may already result in considerable losses of DDMP saponin. However, it cannot be excluded
that Fe3+ directly binds to the DDMP saponin, and in this way catalyses the hydrolysis of the
compound.
Ethanol as a stabilizer
The effect of ethanol became apparent in the sample clean-up step during purification of the
saponins. The use of reversed-phase solid phase extraction columns, such as Sep-Pak, necessitated
the removal of ethanol from the extract. It was observed that during the evaporation of ethanol, a
decrease in the concentration of DDMP saponin occurred. This effect became more pronounced at
longer evaporation times. Together with the results in Figure 6, this indicates that the presence of
ethanol was essential at elevated temperatures to prevent decomposition of DDMP saponin.
The proposed mechanism (Figure 8) also provides an explanation for the observed protective effect
of ethanol in the decomposition reaction. Water has a much higher relative dielectric constant (82)
than ethanol (24) (Shriver et al., 1990), which means that water is a much more favorable
environment for the formation of charged intermediates (IA, IB and III) (Figure 8) than ethanol or
ethanol/water mixtures. By lowering the dielectric constant, addition of ethanol may thus shift the
equilibria in such a way that DDMP saponin is stabilized. It seems that the decomposition reaction
does not proceed further at ethanol concentrations of > 30% (Figure 6), i.e. below a relative
dielectric constant of 60 (20 oC) (Hong et al., 1999). Therefore, the evaporation time and
temperature during DDMP saponin purification should be limited, so as to reduce the time of
exposure of DDMP saponin to a too aqueous environment at elevated temperatures. Oleszek et al.
(1990) and Hu et al. (2002) also found that saponin samples remained relatively stable in methanol
at temperatures < 0 oC. However, contradictory to these reports and our findings, Massiot et al.
(1996) and Daveby et al. (1998) reported that DDMP saponin could decompose to saponin B in
alcoholic solutions.
39
Chapter 2
Figure 8: Mechanism for DDMP saponin decomposition at acidic and alkaline pH. R is the saponin B
aglycone as in Figure 1. IA and IB are intermediate products catalyzed by acid and base, respectively.
This study has shown that the decomposition of DDMP saponin is an acid/base-catalyzed, pseudo
first-order reaction with a relatively low activation energy. The reaction can be inhibited by
lowering the temperature and the dielectric constant of the solvent, and maintaining a neutral pH.
These factors should be considered when performing quantitative studies on native saponins in
plant extracts.
40

Stability of DDMP saponin
LITERATURE CITED
Berhow, M. A.; Cantrell, C. L.; Duval, S. M.; Dobbins, T. A.; Maynes, J.; Vaughn, S. F. Analysis and
quantitative determination of group B saponins in processed soybean products. Phytochem. Anal.,
2002, 13, 343-348.
Curl, C. L.; Price, K. R.; Fenwick, G. R. The quantitative estimation of saponin in pea (Pisum sativum L.)
and soya (Glycine max). Food Chem., 1985, 18, 241-250.
Daveby, Y. D.; Aman, P.; Betz, J. M.; Musser, S. M.; Obermeyer, W. R. The variation in content and
changes during development of soyasaponin I in dehulled Swedish peas (Pisum sativum L). J. Sci.
Food Agric., 1997, 73, 391-395.
Daveby, Y. D.; Aman, P.; Betz, J. M.; Musser, S. M. Effect of storage and extraction on the ratio of
soyasaponin I to 2,3-Dihydro-2,5-dihydroxy-6-methyl-4-pyrone-conjugated soyasaponin I in dehulled
peas (Pisum sativum L). J. Sci. Food Agric., 1998, 78, 141-146.
Decroos, K.; Vincken, J.-P.; Heng, L.; Bakker, R.; Gruppen, H.; Verstraete, W. Simultaneous quantification
of differently glycosylated, acetylated, and 2,3-dihydro-2,5-dihydroxy-6-methyl-4H-pyran-4-one-
conjugated soyasaponins using reversed-phase high-performance liquid chromatography with
evaporative light scattering detection. J. Chromatogr. A, 2005, 1072, 185-193.
Heng, L.; Vincken, J-P.; van Koningsveld, G. A.; Legger, L.; Roozen, J. P; Gruppen, H.; van Boekel, M. A.
J. S.; Voragen, A. G. J. Bitterness of saponins and their contents in peas. J. Agric. Food Chem., 2005,
(Submitted).
Hong, D. P.; Hoshino, M.; Kuboi, R.; Goto, Y. Clustering of fluorine-substituted alcohols as a factor
responsible for the marked effects on proteins and peptides. J. Am. Chem. Soc., 1999, 121, 8427-8433.
Hu, J.; Lee, S. O.; Hendrich, S.; Murphy, P. A. Quantification of the group B soyasaponins by high
performance liquid chromatography. J. Agric. Food Chem., 2002, 50, 2587-2594.
Kinjo, J.; Hatakeyama, M.; Udayama, M.; Tsutanaga, Y.; Yamashita, M.; Hohara, T.; Yoshika, Y. HPLC
profile analysis of oleanene-glucuronides in several edible beans. Biosci. Biotechnol. Biochem., 1998,
62(3), 429-433.
Koziol, M. J. Afrosimetric estimation of threshold saponin concentration for bitterness in quinoa
(Chenopodium quinoa Willd). J. Sci. Food Agric., 1991, 54, 211-219.
Kudou, S.; Tonomura, M.; Tsukamoto, C.; Shimoyamada, M.; Uchida, T.; Okubo, K. Isolation and structural
elucidation of the major genuine soybean saponin. Biosci. Biotechnol. Biochem., 1992, 56, 142-143.
Kudou, S.; Tonomura, M.; Tsukamoto, C.; Uchida, T.; Sakabe, T.; Tamura, N.; Okubo, K. Isolation and
structural elucidation of DDMP-conjugated soyasaponins as genuine saponins from soybean seeds.
Biosci. Biotechnol. Biochem., 1993, 57, 546-550.
Lasztity, R.; Hidvegi, M.; Bata, A. Saponins in Food. Food Rev. Int., 1998, 14(4), 371-390.
41
Chapter 2
42
Li, J.; Fisher, C. L.; Chen, J. L.; Bashford, D.; Noodleman, L. Calculation of redox potential and pKa values
of hydrated transition metal cations by a combined density functional and continuum dielectric theory.
Inorg. Chem., 1996, 4694-4702.
Lin, J; Wang, C. An analytical method for soy saponins by HPLC/ELSD. J. Food Sci., 2004, 69(6), 456-462.
Massiot, G.; Dijoux, G. M.; Lavaud, C. Saponins and artifacts. In Saponins Used in Food and Agriculture,
Waller G. R., Yamasaki, K., Eds,; Plenum Press: New York, 1996; pp 183-192.
Milgate, J.; Roberts, D. C. K. The nutritional and biological significance of saponins. Nutr. Res., 1995, 15(8),
1223-1249.
Okubo, K.; Yoshiki, Y. Oxygen-radical-scavenging activity of DDMP-conjugated saponins and
physiological role in leguminous plant. In Saponins Used in Food and Agriculture, Waller G. R.,
Yamasaki, K., Eds,; Plenum Press: New York, 1996; pp 141-154.
Oleszek, W.; Jurzysta, M.; Price, K. R.; Fenwick, G. R. High performance liquid chromatography of alfalfa
root saponins. J. Chromatogr., 1990, 519, 109-116.
Price, K. R.; Fenwick, G. R. Soyasaponin I, a compound possessing undesirable taste characteristics isolated
from dried pea (Pisum sativum L.). J. Sci. Food Agric., 1984, 35, 887-892.
Price, K. R.; Griffiths, N. M.; Curl, C. L.; Fenwick, G. R. Undesirable sensory properties of the dried pea
(Pisum sativum). The role of saponins. Food Chem., 1985, 17, 105-115.
Price, K. R.; Eagles, J.; Fenwick, G. R. Saponin composition of 13 varieties of legume seed using fast atom
bombardment mass spectrometry. J. Sci. Food Agric., 1988, 42, 183-193.
Shiraiwa, M.; Kudo, S.; Shimoyamada, M.; Harada, K.; Okubo, K. Composition and structure of “group A
saponin” in soybean seed. Agric. Biol. Chem., 1991a, 55, 315-322.
Shiraiwa, M.; Harada, K.; Okubo, K. Composition and structure of “group B saponin” in soybean seed.
Agric. Biol. Chem., 1991b, 55, 911-917.
Shriver, D. F.; Atkins, P. W.; Langford, C. H. Inorganic Chemistry, Oxford University Press: Oxford, 1990;
pp 169-179.
van Boekel, M. A. J. S. Statistical aspects of kinetic modeling for food science problems. J. Food Sci., 1996,
61:477-485, 489.
Yoshiki, Y.; Kim, J. H.; Okubo, K. Saponins conjugated with 2,3-dihydro-2,5-dihydroxy-6-methyl-4H-
pyran-4-one from Phaseolus coccineus. Phytochemistry, 1994, 36, 1009-1012.
Yoshiki, Y.; Kudou, S.; Okubo, K. Relationship between chemical structures and biological activities of
triterpenoid saponins from soybean. Biosci. Biotechnol. Biochem., 1998, 62(12), 2291-2299.
Chapter 3
Bitterness of saponins and their contents in peas
This Chapter has been submitted to J. Sci. Food Agric. as L. Heng, J.-P. Vincken, G.A. van Koningsveld, A. Legger, H.
Gruppen, M.A.J.S. van Boekel, J.P. Roozen, A.G.J. Voragen. Bitterness of saponin and their contents in peas.

Chapter 3
ABTRACT
The bitterness of a saponin mixture (containing saponin B and DDMP (2,3-dihydro-2,5-dihydroxy-
6-methyl-4H-pyran-4-one) saponin in a ratio of 1:4) and saponin B obtained from peas, were
established by a trained panel using line scaling. Both saponins were found to be bitter. However,
the saponin mixture, and hence DDMP saponin, was found to be significantly more bitter than
saponin B. The bitterness perceived correlates with the saponin concentration. In addition to
saponin bitterness, the saponin content and composition of 16 pea varieties was also investigated. In
2 varieties, DDMP saponin was the only saponin present, whereas in the rest of the varieties DDMP
saponin was more abundant than saponin B. The pea varieties investigated differed significantly in
saponin content. The amounts of DDMP saponin ranged from 0.7-1.5 g/kg (dry matter), whereas
those of saponin B ranged from 0-0.4 g/kg. As saponins are bitter, pea varieties with lower saponin
contents would be preferred for use in food production.
KEYWORDS: Peas, DDMP saponin, saponin B, bitterness, sensory, varieties
44
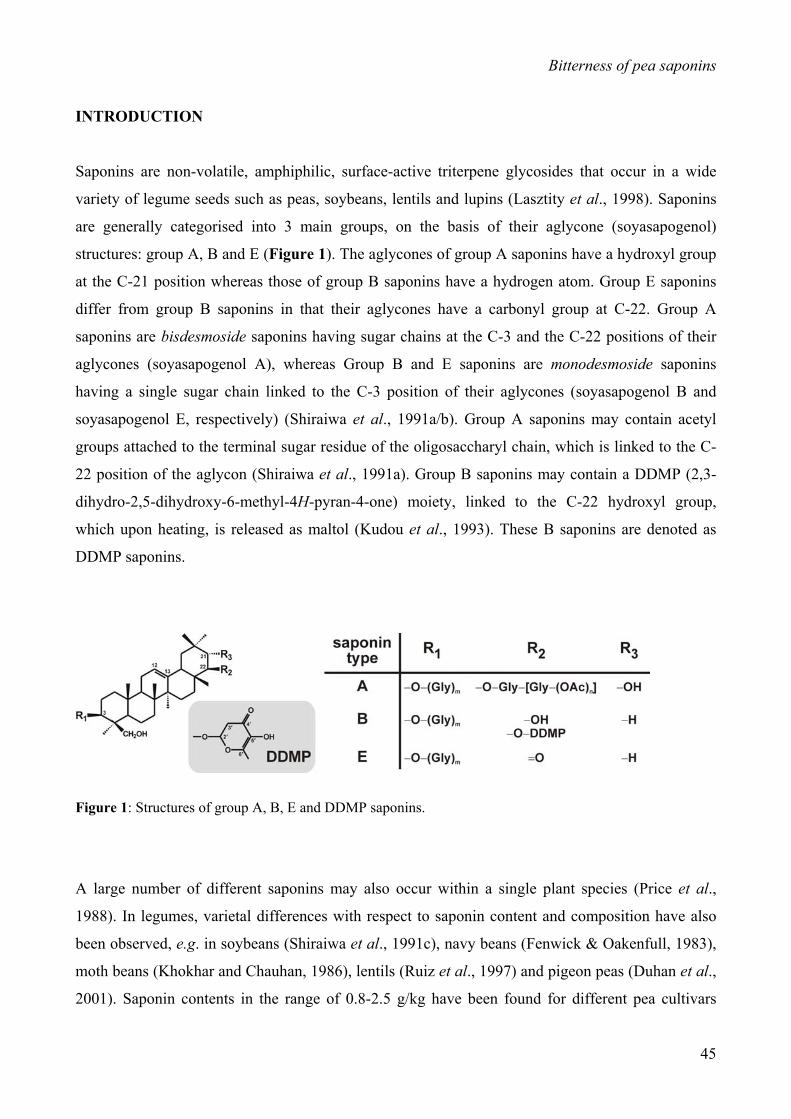
Bitterness of pea saponins
INTRODUCTION
Saponins are non-volatile, amphiphilic, surface-active triterpene glycosides that occur in a wide
variety of legume seeds such as peas, soybeans, lentils and lupins (Lasztity et al., 1998). Saponins
are generally categorised into 3 main groups, on the basis of their aglycone (soyasapogenol)
structures: group A, B and E (Figure 1). The aglycones of group A saponins have a hydroxyl group
at the C-21 position whereas those of group B saponins have a hydrogen atom. Group E saponins
differ from group B saponins in that their aglycones have a carbonyl group at C-22. Group A
saponins are bisdesmoside saponins having sugar chains at the C-3 and the C-22 positions of their
aglycones (soyasapogenol A), whereas Group B and E saponins are monodesmoside saponins
having a single sugar chain linked to the C-3 position of their aglycones (soyasapogenol B and
soyasapogenol E, respectively) (Shiraiwa et al., 1991a/b). Group A saponins may contain acetyl
groups attached to the terminal sugar residue of the oligosaccharyl chain, which is linked to the C-
22 position of the aglycon (Shiraiwa et al., 1991a). Group B saponins may contain a DDMP (2,3-
dihydro-2,5-dihydroxy-6-methyl-4H-pyran-4-one) moiety, linked to the C-22 hydroxyl group,
which upon heating, is released as maltol (Kudou et al., 1993). These B saponins are denoted as
DDMP saponins.
Figure 1: Structures of group A, B, E and DDMP saponins.
A large number of different saponins may also occur within a single plant species (Price et al.,
1988). In legumes, varietal differences with respect to saponin content and composition have also
been observed, e.g. in soybeans (Shiraiwa et al., 1991c), navy beans (Fenwick & Oakenfull, 1983),
moth beans (Khokhar and Chauhan, 1986), lentils (Ruiz et al., 1997) and pigeon peas (Duhan et al.,
2001). Saponin contents in the range of 0.8-2.5 g/kg have been found for different pea cultivars
45
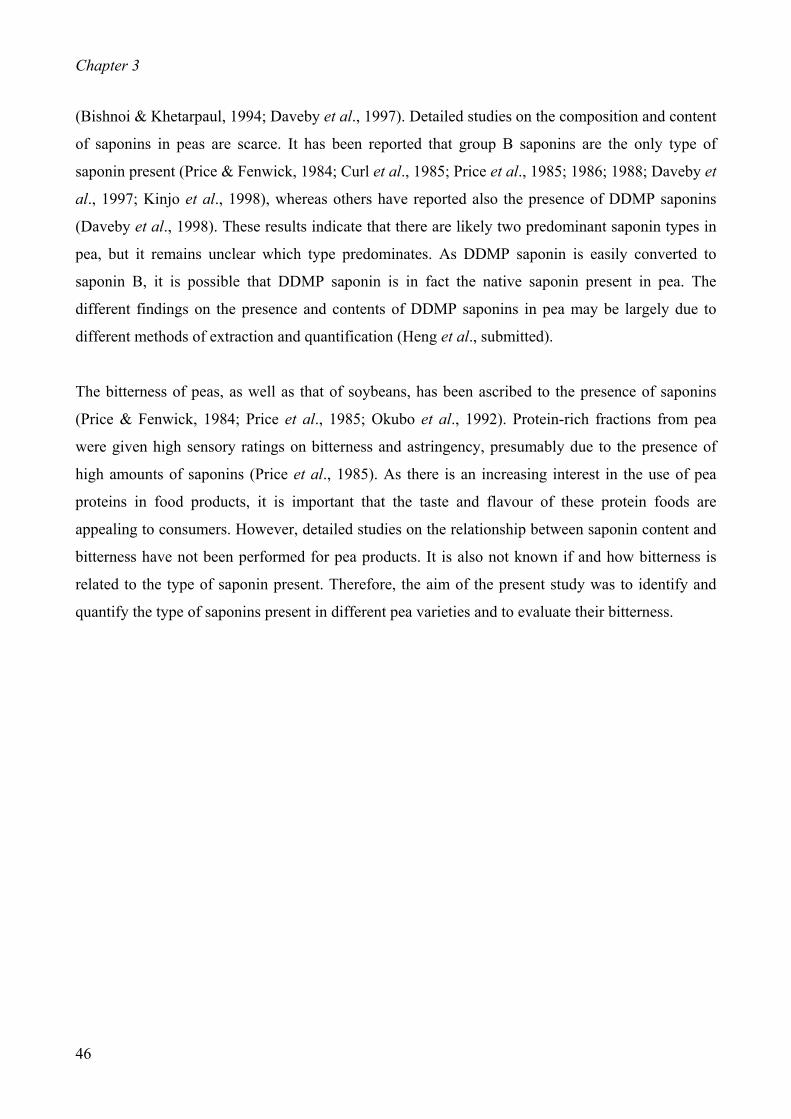
Chapter 3
(Bishnoi & Khetarpaul, 1994; Daveby et al., 1997). Detailed studies on the composition and content
of saponins in peas are scarce. It has been reported that group B saponins are the only type of
saponin present (Price & Fenwick, 1984; Curl et al., 1985; Price et al., 1985; 1986; 1988; Daveby et
al., 1997; Kinjo et al., 1998), whereas others have reported also the presence of DDMP saponins
(Daveby et al., 1998). These results indicate that there are likely two predominant saponin types in
pea, but it remains unclear which type predominates. As DDMP saponin is easily converted to
saponin B, it is possible that DDMP saponin is in fact the native saponin present in pea. The
different findings on the presence and contents of DDMP saponins in pea may be largely due to
different methods of extraction and quantification (Heng et al., submitted).
The bitterness of peas, as well as that of soybeans, has been ascribed to the presence of saponins
(Price & Fenwick, 1984; Price et al., 1985; Okubo et al., 1992). Protein-rich fractions from pea
were given high sensory ratings on bitterness and astringency, presumably due to the presence of
high amounts of saponins (Price et al., 1985). As there is an increasing interest in the use of pea
proteins in food products, it is important that the taste and flavour of these protein foods are
appealing to consumers. However, detailed studies on the relationship between saponin content and
bitterness have not been performed for pea products. It is also not known if and how bitterness is
related to the type of saponin present. Therefore, the aim of the present study was to identify and
quantify the type of saponins present in different pea varieties and to evaluate their bitterness.
46

Bitterness of pea saponins
MATERIALS AND METHODS
Materials
All pea seeds were obtained from Cebeco Zaden B.V. (Lelystad, The Netherlands) except 3 pea
lines (Pisum arvense, Pisum elatius Marbre, Pisum elatius 1140175), which were obtained from the
Center for Genetic Resources (CGN, Wageningen, The Netherlands). The pea varieties tested and
their characteristics are summarized in Table 1. Caffeine (99% purity), equilenin and maltol were
obtained from Sigma-Aldrich Chemie GmbH, Steinheim, Germany. Quinine sulphate dihydrate
(99% purity) was obtained from Janssen Chimica, Geel, Belgium.
Table 1: Seed characteristics of 16 pea varieties
Line Name Color 1 Shape 2 1 KPMR 146 India Yel F 2 Pisum elatius, 1140175 (CGN Br-Grey-sp R
3 Cisca Gr W
4 FAL 49110 Mongolie Yel R
5 CEB 1475.1 Yel R
6 Baccara Yel R-D
7 CEB 1466 Yel R
8 Pisum arvense (CGN 10193) Br-Gr-sp F
9 Pisum elatius, Marbre (CGN 03351) Br-Gr-sp F
10 Courier Br-sp F
11 6 S 41.4 Gr F
12 Solara Gr R
13 NGB 102149 Iran Br-Gr-sp F
14 Solido Br W
15 Supra Gr W
16 NGB 101293 Jordaan Gr-sp F 1 Seed colour abbreviations: Yel = yellow, Gr = green, Br = brown, sp = spotted 2 Seed shape abbreviations: W = wrinkled, R = round, R-D= round with dimples, F = flat
47

Chapter 3
Saponin extraction
The peas were milled in a commercial blender (Waring, New Hartford, Connecticut, U.S.A.) in a
ratio 1:1 (w/w) with dry ice. Pea flour was defatted by hexane (Super gradient, Lab-scan, Dublin,
Ireland) refluxing for 6 h and subsequently the pea flour was air-dried in a fume hood overnight.
Defatted pea flour (1 g) was extracted with 70% (v/v) ethanol (100 mL) for 1 h at 25 oC with
constant shaking at 200 rpm in an incubator shaker (Innova 4000, New Brunswick Scientific,
Nijmegen, The Netherlands). Prior to extraction, 100 ppm of an internal standard, equilenin (an
estrogen-like steroid, 3-hydroxyestra-1,3,5,7,9-pentaen-17-one) was added. The crude extract was
filtered through an ashless filter paper (White band 5892, 110 mm, Schleicher & Schuell, Dassel,
Germany). The ethanol from the clear filtrate was removed by evaporation under vacuum at 27 oC.
This evaporation step was performed in less than 15 min using a 1 L round-bottom flask. The
removal of ethanol made the extract turbid, and hence the resulting extract (~30 mL) was made up
to 40 mL with distilled water and was centrifuged (36,000 x g; 10 min; 10 oC). Analysis of the
resulting pellet showed no traces of saponin. The supernatant obtained was passed through a Sep-
Pak C18 solid phase extraction column (Waters Plus tC18 cartridge, 37-55 µm, Waters Etten-Leur,
The Netherlands), which was subsequently rinsed with 15 mL water to remove unbound materials.
The bound compounds were eluted with 10 mL of 100% (v/v) methanol (HPLC grade; Lab-Scan,
Dublin, Ireland) and air-dried. The air-dried saponin sample was dissolved in 1 mL of 50% (v/v)
ethanol and centrifuged at 36,000 x g for 10 min, before HPLC analysis.
Determination of saponin content and composition
Reversed-phase high performance liquid chromatography (RP-HPLC) in combination with
evaporative light scattering detection (ELSD) was used for analysing pea saponins. A
SpectraSYSTEM HPLC (Thermo Separation Products, Fremont, CA) coupled to an Alltech ELSD
2000 detector (Deerfield, U.S.A.) was used. Separation was performed using an Aquasil reversed-
phase C18 column (4.6 x 150 mm, 3 µm) (Thermo Hypersil, Bellefonte, P.A., U.S.A.). The solvents
used were water:acetic acid (100:0.001, v/v) (A) and acetonitrile:acetic acid (100:0.001, v/v) (B).
The linear gradient used was as follows: 0→8 min, 40→50% B; 8→10 min, 50→100% B; 10→15
min, 100% B (isocratic); 15→20 min, 40% B (isocratic). Samples of 20 µL were injected and a
flow rate of 1 mL/min was used. The eluate from the column was split into 3 directions: 100
µL/min to the ELSD, 50 µL/min to the LCQ Ion-trap MS (Thermo Finnigan, San Jose, CA) and 850
µL/min to the waste. The ELSD was set at 40 oC at a gas flow of 1.5 mL/min and a sensitivity of
48

Bitterness of pea saponins
16. Components were identified by mass spectrometry according to Heng et al. (submitted). The
m/z ratio of the molecular ions [M+H]+ in the mass spectra of the peaks of DDMP saponin and
saponin B were 1069 and 943, respectively. Quantification of DDMP and B saponins was done
using response factors obtained from calibration of ELSD according to Decroos et al. (2005).
Sensory evaluation of the bitterness of saponin extracts from peas
(i) Selection of panellists
Representative standard bitter compounds, caffeine and quinine sulphate dihydrate were used for
the selection procedure. From both compounds, 7 concentrations were prepared by successive
dilution with tap water. The concentrations were based on the threshold values reported in literature
(Mojet et al., 2001; Mojet et al., 2003), and ranged from 20 to 1500 mg/L for caffeine and from 0.1
to 5 mg/L for quinine sulphate dihydrate. Samples were presented in random order. Assessors were
asked to determine which samples were bitter compared to water. Those who were able to identify
the bitterness of samples down to a minimum concentration of 200 mg/L for caffeine and 2 mg/L
for quinine sulphate dihydrate were selected. In this way, 14 assessors were selected from 24
participants, based on their sensitivity to the 2 bitter compounds. The selected panel consisted of 8
female and 6 male assessors, of age 19 to 36, who were all students of Wageningen University.
(ii) Training and actual procedure
The 14 selected assessors went through one training session and 2 actual sessions. For these 3
sessions, water and a quinine sulphate dihydrate solution (5 mg/L) were used as standards. Two sets
of samples, saponin B and a saponin mixture containing both saponin B and DDMP saponin in the
ratio of 1:4 (based on the areas of saponin B and DDMP saponin peaks), were used. Both saponin
solutions were tested at 5 different concentrations (2-12 mg/L). All samples were prepared by
successive dilution with tap water and were presented in random order. The saponin mixture was
extracted from the pea variety Solara spp using the above mentioned extraction method and the
dried sample was stored at –20 oC. Saponin B was obtained by boiling the extracted saponin
mixture for 8 h, during which DDMP saponin was fully converted to saponin B. In order to verify if
the presence of maltol (3-hydroxy-2-methyl-4-pyrone), which remained in the saponin B sample
after boiling, would affect the taste of saponins, the selected assessors evaluated maltol (12 mg/L)
and saponin B without maltol (2-12 mg/L) for bitterness. Saponin B without maltol was prepared by
passing boiled saponin B sample through a Sep-Pak C18 solid phase extraction column (Waters
Plus tC18 cartridge, 37-55 µm, Etten-Leur, The Netherlands). All sample solutions were prepared
just before the start of the sessions. Assessors were presented with samples of 5 mL, which were
49

Chapter 3
swirled in the mouth for 10 sec and then expectorated. The assessors had to score the degree of
bitterness for all saponin samples on a 15 cm line scale using water and quinine sulphate dihydrate
(5 mg/L) as standards (Line scaling or scoring; Meilgaard et al., 1991). The left end anchor of the
scale corresponded to no bitterness (water), whereas the right end anchor corresponded to very
bitter (5 mg/L quinine sulphate dihydrate solution). Assessors were asked to consume an
unflavoured cracker between every single sample in order to remove any persisting bitterness, and
to eliminate misleading perception, which might lead to artificial and invalid results. Statistical
analysis was performed using SPSS 10.0. The concentrations at which bitterness was perceived
were tested by analysis of variance (ANOVA; α ≤ 0.05).
50
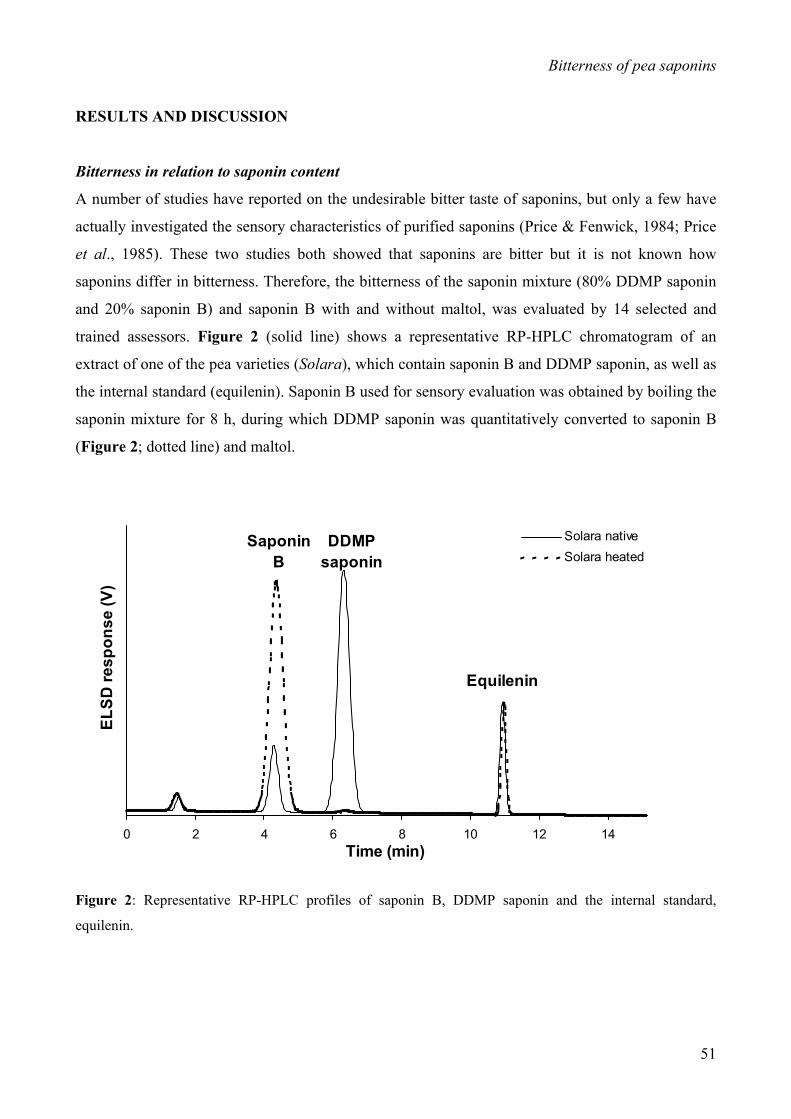
Bitterness of pea saponins
RESULTS AND DISCUSSION
Bitterness in relation to saponin content
A number of studies have reported on the undesirable bitter taste of saponins, but only a few have
actually investigated the sensory characteristics of purified saponins (Price & Fenwick, 1984; Price
et al., 1985). These two studies both showed that saponins are bitter but it is not known how
saponins differ in bitterness. Therefore, the bitterness of the saponin mixture (80% DDMP saponin
and 20% saponin B) and saponin B with and without maltol, was evaluated by 14 selected and
trained assessors. Figure 2 (solid line) shows a representative RP-HPLC chromatogram of an
extract of one of the pea varieties (Solara), which contain saponin B and DDMP saponin, as well as
the internal standard (equilenin). Saponin B used for sensory evaluation was obtained by boiling the
saponin mixture for 8 h, during which DDMP saponin was quantitatively converted to saponin B
(Figure 2; dotted line) and maltol.
0 2 4 6 8 10 12 14Time (min)
ELSD
resp
onse
(V)
Solara nativeSolara heated
SaponinB
DDMPsaponin
Equilenin
Figure 2: Representative RP-HPLC profiles of saponin B, DDMP saponin and the internal standard,
equilenin.
51

Chapter 3
From the evaluation, it was observed that one of the assessors was insensitive to the bitterness of all
saponin samples tested and the values from this assessor were, therefore, omitted. Table 2 and
Figure 3 show the results obtained from the remaining 13 assessors. These results reveal that
saponins are indeed bitter to most people in the panel. Samples of saponin B without maltol showed
the same bitterness intensity as that of saponin B with maltol, indicating that the released maltol
does not affect bitterness. Also, maltol was observed not to taste bitter at a concentration of 12
mg/L (results not shown). The bitterness scores given by the assessors increased with increasing
concentration for all saponin samples. This shows that the perceived bitterness is related to saponin
concentration within the concentration range studied. Furthermore, most of the assessors (11 out of
13) tasted the bitterness in the extracted saponin mixture solutions at concentrations as low as 2
mg/L, whereas less than half of the assessors (5 out of 13) detected the bitterness of saponin B, with
and without maltol, at the same concentration (Table 2). Statistical analysis showed that the saponin
mixture, and hence, DDMP saponin, was significantly more bitter than saponin B (α ≤ 0.05) at all
concentrations.
Table 2: No of assessors detecting bitterness in saponin solutions (2-12 mg/L)
Concentration (mg/L) Saponin Mixture Saponin B + maltol Saponin B without maltol2 11 5 54 12 8 NP8 13 9 810 13 10 1112 13 11 12
No of assessors out of 13 detecting bitterness
NP: not performed
Aqueous solutions of saponin B, extracted from pea flour at concentrations above 250 mg/L, were
found to have both a bitter and an astringent taste (Price & Fenwick, 1984). This concentration is a
factor 100 higher than the concentrations used in our study, in which bitterness was already
perceived at a concentration of 2 mg/L. Price et al. (1985) found that untreated pea flour had a
stronger bitterness rating than “debittered” pea flour, which contained half the amount of saponin.
These reports demonstrate that bitterness is indeed related to saponin content, as is confirmed by
our own sensory tests. In addition, the degree of bitterness was also shown to depend on the
quantity and types of saponin present.
52

Bitterness of pea saponins
0
20
40
60
80
100
120
140
0 2 4 6 8 10
Concentration (mg/L)
Inte
nsity
of b
itter
ness
Saponin mixture
Saponin B + maltol
Saponin B without maltol
12
Figure 3: Bitterness intensity of saponins. Intensity of bitterness was obtained by calculating the average of
the scores given on a 150 mm line scale for each concentration by the 13 assessors. The error bars represent
standard errors.
Threshold levels of DDMP saponin and saponin B
The two bitter compounds used in this study, caffeine and quinine sulphate, are often used as
standards in sensory evaluation of bitterness (Mojet et al., 2001; Mojet et al., 2003). The threshold
value (the minimum detectable concentration) of both compounds is remarkably different. There is
a factor of 100 difference between the normal practical range of 198-498 mg/L for caffeine and the
range of 2-4 mg/L for quinine sulphate (Mojet et al., 2003). The range of concentrations used for
both saponins in our sensory evaluation was 2-12 mg/L, and was chosen based on the results of
preliminary sensory sessions. Bitterness of saponins was already perceived by the sensory assessors
at very low concentrations (e.g. 2 mg/L), which is similar to the threshold level of quinine sulphate.
With the results obtained in Table 2, the estimated threshold values for the saponin mixture and for
saponin B are < 2mg/L and ~ 8 mg/L, respectively. Knowing the difference in bitterness of saponin
B and DDMP saponin, it was of interest to investigate the saponin content and composition of
53
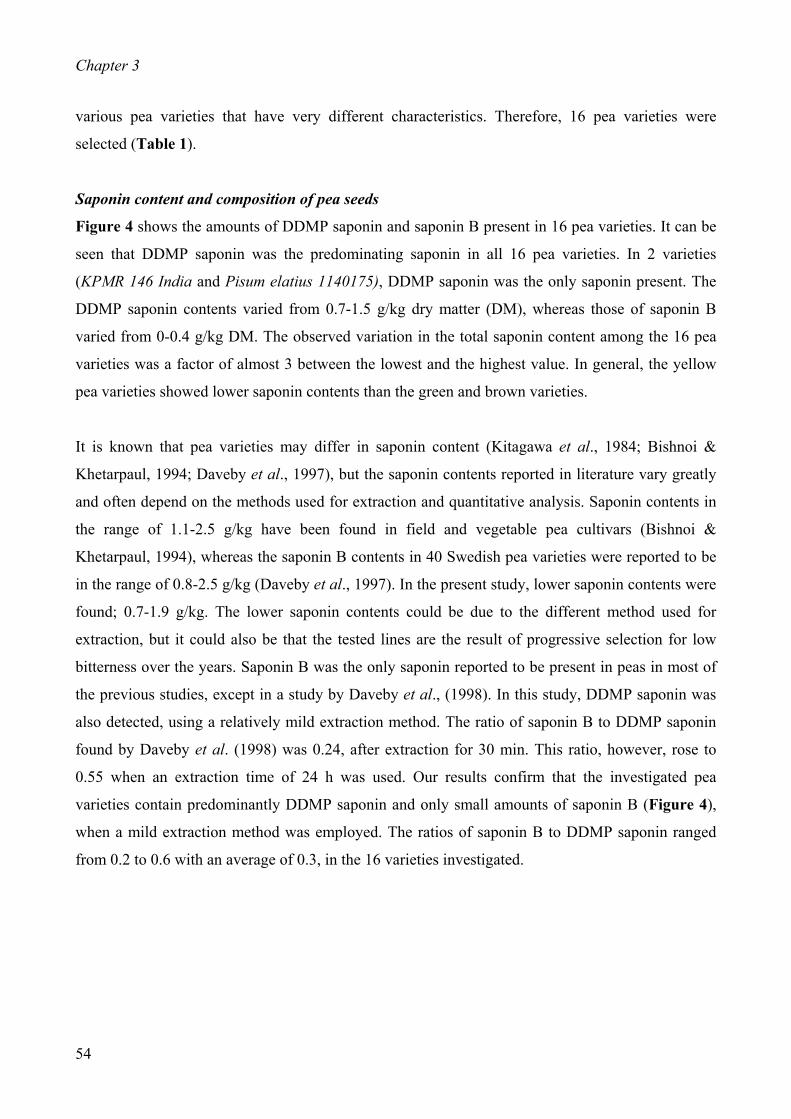
Chapter 3
various pea varieties that have very different characteristics. Therefore, 16 pea varieties were
selected (Table 1).
Saponin content and composition of pea seeds
Figure 4 shows the amounts of DDMP saponin and saponin B present in 16 pea varieties. It can be
seen that DDMP saponin was the predominating saponin in all 16 pea varieties. In 2 varieties
(KPMR 146 India and Pisum elatius 1140175), DDMP saponin was the only saponin present. The
DDMP saponin contents varied from 0.7-1.5 g/kg dry matter (DM), whereas those of saponin B
varied from 0-0.4 g/kg DM. The observed variation in the total saponin content among the 16 pea
varieties was a factor of almost 3 between the lowest and the highest value. In general, the yellow
pea varieties showed lower saponin contents than the green and brown varieties.
It is known that pea varieties may differ in saponin content (Kitagawa et al., 1984; Bishnoi &
Khetarpaul, 1994; Daveby et al., 1997), but the saponin contents reported in literature vary greatly
and often depend on the methods used for extraction and quantitative analysis. Saponin contents in
the range of 1.1-2.5 g/kg have been found in field and vegetable pea cultivars (Bishnoi &
Khetarpaul, 1994), whereas the saponin B contents in 40 Swedish pea varieties were reported to be
in the range of 0.8-2.5 g/kg (Daveby et al., 1997). In the present study, lower saponin contents were
found; 0.7-1.9 g/kg. The lower saponin contents could be due to the different method used for
extraction, but it could also be that the tested lines are the result of progressive selection for low
bitterness over the years. Saponin B was the only saponin reported to be present in peas in most of
the previous studies, except in a study by Daveby et al., (1998). In this study, DDMP saponin was
also detected, using a relatively mild extraction method. The ratio of saponin B to DDMP saponin
found by Daveby et al. (1998) was 0.24, after extraction for 30 min. This ratio, however, rose to
0.55 when an extraction time of 24 h was used. Our results confirm that the investigated pea
varieties contain predominantly DDMP saponin and only small amounts of saponin B (Figure 4),
when a mild extraction method was employed. The ratios of saponin B to DDMP saponin ranged
from 0.2 to 0.6 with an average of 0.3, in the 16 varieties investigated.
54
Bitterness of pea saponins
0
0.5
1
1.5
2
2.5
KPMR 146 In
dia
Pisum el
atius 1
14017
5 (CGN 10
205)
Cisca
FAL 491
10 M
ongolie
CEB 1475
.1
Bacca
ra
CEB 1466
Pisum ar
vense (
CGN 1019
3)
Pisum el
atius,
Marbr
e (CGN 03
351)
Courier
6 S 41
.4
Solara
NGB 1021
49 Ir
an
Solido
Supra
NGB 1012
93 Jo
rdaa
n
Am
ount
of s
apon
ins
(g/k
g)
B saponinDDMP saponin
Figure 4: Saponin content and composition of 16 pea varieties.
It can be concluded that peas contain mainly DDMP saponin and only a small amount of saponin B.
Both saponins have a bitter taste, of which the intensity increases with concentration, but the
DDMP saponin is significantly more bitter than the saponin B. Therefore, pea varieties that have a
high DDMP saponin content or a high total saponin content will likely taste more bitter than those
low in saponins. Processing of peas and/or its products (e.g. boiling) may lead to a decrease in
bitterness as DDMP saponin is converted to the less bitter saponin B. As saponins are known to
bind to proteins (Potter et al., 1993; Ikedo et al., 1996; Shimoyamada et al., 1998, 2000; Morton &
Murray, 2001; Liu et al., 2003), it can be expected that protein products such as isolates are
enriched in saponins, which may hamper the application of these protein isolates in food products.
55
Chapter 3
LITERATURE CITED
Bishnoi, S.; Khetarpaul, N. Saponin content and trypsin inhibitor of pea cultivars: Effect of domestic
processing and cooking methods. J. Food Sci Tech., 1994, 31, 73-76.
Curl, C. L.; Price, K. R.; Fenwick, G. R. The quantitative estimation of saponin in pea (Pisum sativum L.)
and soya (Glycine max). Food Chem., 1985, 18, 241-250.
Daveby, Y. D.; Aman, P.; Betz, J. M.; Musser, S. M.; Obermeyer, W. R. The variation in content and
changes during development of soyasaponin I in dehulled Swedish peas (Pisum sativum L). J. Sci.
Food Agric., 1997, 73, 391-395.
Daveby, Y. D.; Aman, P.; Betz, J. M.; Musser, S. M. Effect of storage and extraction on the ratio of
soyasaponin I to 2,3-Dihydro-2,5-dihydroxy-6-methyl-4-pyrone-conjugated soyasaponin I in dehulled
peas (Pisum sativum L). J. Sci. Food Agric., 1998, 78, 141-146.
Decroos, K.; Vincken, J.-P.; Heng, L.; Bakker, R.; Gruppen, H.; Verstraete, W. Simultaneous quantification
of differently glycosylated, acetylated, and 2,3-dihydro-2,5-dihydroxy-6-methyl-4H-pyran-4-one-
conjugated soyasaponins using reversed-phase high-performance liquid chromatography with
evaporative light scattering detection. J. Chromatogr. A, 2005, 1072, 185-193.
Duhan, A.; Khetarpaul, N.; Bishnoi, S. Saponin content and trypsin inhibitor activity in processed and
cooked pigeon pea cultivars. Int. J. Food Sci. Nutr., 2001, 52, 53-59.
Fenwick, D. E.; Oakenfull, D. Saponin content of food plants and some prepared foods. J. Sci. Food Agric.,
1983, 34, 186-191.
Heng, L.; Vincken, J-P.; Hoppe, K.; van Koningsveld, G. A.; Decroos, K.; Gruppen, H.; van Boekel, M. A. J.
S.; Voragen, A. G. J. Stability of pea DDMP saponin and the mechanism of its decomposition. J.
Agric. Food Chem., 2005, (Submitted).
Ikedo, S.; Shimoyamada, M.; Watanabe, K. Interaction between bovine serum albumin and saponin as
studied by heat stability and protease digestion. J. Agric. Food Chem., 1996, 44, 792-795.
Khokhar, S.; Chauhan, B. M. Antinutritional factors in moth bean (Vigna aconitifolia). Varietal differences
and effects of methods of domestic processing and cooking. J. Food Sci., 1986, 51, 591.
Kinjo, J.; Hatakeyama, M.; Udayama, M.; Tsutanaga, Y.; Yamashita, M.; Hohara, T.; Yoshika, Y. HPLC
profile analysis of oleanene-glucuronides in several edible beans. Biosci. Biotechnol. Biochem., 1998,
62(3), 429-433.
Kitagawa, I.; Yoshikawa, M.; Hayashi, T.; Tanayama, T. Characterisation of saponin constituents in
soybeans of various origins and quantitative analysis of soyasaponins by gas-liquid chromatography.
Yakagaku Zasshi, 1984, 104 (2), 162-168.
Kudou, S.; Tonomura, M.; Tsukamoto, C.; Uchida, T.; Sakabe, T.; Tamura, N.; Okubo, K. Isolation and
structural elucidation of DDMP-conjugated soyasaponins as genuine saponins from soybean seeds.
Biosci. Biotechnol. Biochem., 1993, 57, 546-550.
56
Bitterness of pea saponins
57
Lasztity, R.; Hidvegi, M.; Bata, A. Saponins in Food. Food Rev. Int., 1998, 14(4), 371-390.
Liu, Y.; Xie, M-X.; Kang, J.; Zheng, D. Studies on the interaction of total saponins of panaz notoginseng and
human serum albumin by Fourier transform infrared spectroscopy. Spectrochim. Acta, Part A:
Molecular and Biomolecular Spectroscopy, 2003, 59(12), 2747-2758.
Meilgaard, M.; Civille, G. V.; Carr, B. T. Chapter 5: Measuring responses. In Sensory Evaluation
Techniques. 2nd Edition; CRC Press Inc., Boca Raton, Florida, 1991, pp 54-55.
Mojet, J.; Christ-Hazelhof, E.; Heidema, J. Taste perception with age: generic or specific losses in threshold
sensitivity to the five basic tastes. Chem. Senses, 2001, 26, 845-860.
Mojet, J.; Heidema, J.; Christ-Hazelhof, E. Taste perception with age: generic or specific losses in supra-
threshold intensities of five taste qualities. Chem. Senses, 2003, 28, 397-413.
Morton, P. A. J.; Murray, B. S. Acid beverage floc: protein-saponin interactions and an unstable emulsion
model. Colloids Surf., B, 2001, 21, 101-106.
Okubo, K.; Iijima, M.; Kobayashi, Y.; Yoshikoshi, M.; Uchida, T.; Kudou, S. Components responsible for
the undesirable taste of soybean seeds. Biosci. Biotechnol. Biochem., 1992, 56(1), 99-103.
Potter, S. M.; Flores, J. R.; Pollack, J.; Lone, T. A.; Jimenez, M. D. B. Protein-saponin interaction and its
influence on blood lipids. J. Agric. Food Chem., 1993, 41, 1287-1291.
Price, K. R.; Fenwick, G. R. Soyasaponin I, a compound possessing undesirable taste characteristics isolated
from dried pea (Pisum sativum L.). J. Sci. Food Agric., 1984, 35, 887-892.
Price, K. R.; Griffiths, N. M.; Curl, C. L.; Fenwick, G. R. Undesirable sensory properties of the dried pea
(Pisum sativum). The role of saponins. Food Chem., 1985, 17, 105-115.
Price, K. R.; Curl, C. L.; Fenwick, G. R. The saponin content and sapogenol composition of the seed of 13
varieties of legume. J. Sci. Food Agric., 1986, 37, 1185-1191.
Price, K. R.; Eagles, J.; Fenwick, G. R. Saponin composition of 13 varieties of legume seed using fast atom
bombardment mass spectrometry. J. Sci. Food Agric., 1988, 42, 183-193.
Ruiz, R. G.; Price, K. R.; Rose, M. E.; Fenwick, G. R. Effect of seed size and testa colour on saponin content
of Spanish lentil seed. Food Chem., 1997, 58 (3), 223-226.
Shimoyamada, M.; Ikedo, S.; Ootsubo, R.; Watanabe, K. Effects of soybean saponins on chymotryptic
hydrolyses of soybean proteins. J. Agric. Food Chem., 1998, 46, 2, 4793-4794.
Shimoyamada, M.; Ootsubo, R.; Naruse, T.; Watanabe, K. Effects of soybean saponin on protease
hydrolyses of β-lactoglobulin and α-lactalbumin. Biosci. Biotechnol. Biochem., 2000, 64, 4, 891-893.
Shiraiwa, M.; Kudo, S.; Shimoyamada, M.; Harada, K.; Okubo, K. Composition and structure of “group A
saponin” in soybean seed. Agric. Biol. Chem., 1991a, 55, 315-322.
Shiraiwa, M.; Harada, K.; Okubo, K. Composition and structure of “group B saponin” in soybean seed.
Agric. Biol. Chem., 1991b, 55, 911-917.
Shiraiwa, M.; Harada, K.; Okubo, K. Composition and content of saponins in soybean seed according to
variety, cultivation year and maturity. Agric. Biol. Chem., 1991c, 55, 323-331.


Chapter 4
Saponins stripped down to skeletons

Chapter 4
ABSTRACT
Saponins are a structurally diverse class of triterpenoid glycosides, occurring in many plant species.
The structures of saponins are reviewed and classified based on four premises: (i) Cyclization
patterns of oxidosqualene form the basis of skeletal classification; (ii) Decoration of the skeletons
(functional groups, unsaturation, bridging, glycosylation) are excluded, unless they affect the
number of rings or ring configuration; (iii) Numbering of carbon atoms in the saponin skeleton is
reminiscent of their biosynthetic origin, the backbone of the 22 contiguous carbon atoms of
oxidosqualene; (iv) Processing of skeletons (e.g. ring expansion, removal of methyl groups
reminiscent of oxidosqualene) and their mutual relationships are accounted for. A total of 21
skeletons were documented, which could be classified into 5 main classes: 66666, 66665A,
66665B, 6665A, and 6665B, where the numbers indicate the number of carbons in the subsequent
rings. The classes of 6665A and 6665B are further divided into groups and subgroups, because
these skeletons are subjected to extensive processing. A relationship between the type of skeleton
and the plant origin was drawn. Oleanane was the most common skeleton and is present in most
orders of the plant kingdom. Up to 4 main classes of skeleton can exist within one plant order, but
the distribution of skeletons in the plant kingdom does not seem to be order-specific. Several
substituents (e.g. –OH, =O, glycosyl residues, etc.) are simultaneously attached to oleanane. Sugar
chains of 1 to 8 glycosyl residues can be attached to oleanane, most commonly at C2 and/or C18 of
the skeleton. The kind of substituents, as well as the carbon atoms of the skeleton to which they are
attached, does not seem to be plant order-specific.
KEYWORDS: Saponin(s), class(es), squalene, oxidosqualene, triterpenoid, structure(s),
skeleton(s), substituent(s), sugar chain(s), unsaturation, phylogenetic tree
60
Saponin skeletons
INTRODUCTION
Saponins are generally known as non-volatile, surface-active compounds that are widely distributed
in nature, occurring primarily in the plant kingdom (Lasztity et al., 1998; Oleszek, 2002). The name
‘saponin’ comes from the Latin word, sapo, which means ‘soap’, because saponin molecules form
soap-like foams when shaken with water. They are structurally diverse molecules that are
chemically referred to as triterpene glycosides, which consist of non-polar aglycones coupled with
one or more sugar chains (Oleszek, 2002). They have a diverse range of properties that include
sweetness and bitterness (Grenby, 1991; Kitagawa, 2002; Heng et al., 2005b), foaming and
emulsifying properties (Price et al., 1987), pharmacological and medicinal properties (Attele et al.,
1999), as well as insecticidal and molluscicidal activities (Sparg et al., 2004). Saponins have found
wide applications in beverages and confectionery, as well as in cosmetics (Price et al., 1987; Petit et
al., 1995; Uematsu et al., 2000) and pharmaceutical products (Sparg et al., 2004).
Several reviews have been published over the last two decades that focused on the biosynthesis,
structural elucidation, isolation of saponins, as well as their biological activities (Mahato et al.,
1988; 1992a; Mahato & Nandy, 1991; Mahato & Sen, 1997; Tan et al., 1999; Connolly & Hill,
2000; Sparg et al., 2004). These reviews give a dense overview of saponins with all their structural
details, yet provide little information on skeletal classification. Saponins are often subdivided into 2
classes, the triterpenoid and the steroidal saponins (Abe et al., 1993; Sparg et al., 2004). This
differentiation is misleading, because steroidal saponins are also derived from the 30-carbon
precursor, oxidosqualene (Haralampidis et al., 2002). The main difference between the two classes
lies in the fact that the steroidal saponins usually have three methyl groups removed (i.e. they are
mostly C27 molecules), whereas the triterpenoid saponins have not, and remain as C30 molecules.
In one recent review (Sparg et al., 2004), saponins were classified into 3 classes, namely, the
triterpenoid saponins, the spirostanol saponins and the furostanol saponins. This classification,
however, does not reflect the diversity of saponins. A class of compounds, which is closely
associated with saponins, are the steroidal glycoalkaloids (Haralampidis et al., 2002). Although
these compounds have the same ancestor as saponins, they will not be considered in this review,
because they contain a nitrogen as an intrinsic part of their skeleton. The aim of this review is to
classify saponins derived from their 30-carbon precursors that have been found in plants so far, and
to give their basic skeletal structures and relationships. Attempts were also made to link the various
skeletons to plant orders.
61
Chapter 4
Cyclization of the saponin skeletons from squalene
Saponin biosynthesis proceeds via the isoprenoid pathway in which 3 isoprene units (C5) are linked
to each other resulting in a C15 structure, which is subsequently dimerised to give a product of 30
carbon atoms, squalene (Abe et al., 1993; Haralampidis et al., 2002). Squalene can be oxidized to
oxidosqualene, which is the most common starting point for cyclization reactions (Figure 1) (Abe
et al., 1993; Haralampidis et al., 2002). Note that the 22 contiguous carbon atoms of oxidosqualene
are numbered, and that the carbons of the methyl groups at C1, C5, C9, C14, C18 and C22 of
oxidosqualene are not. Oxidosqualene is converted to cyclic derivatives via protonation and
epoxide ring opening. The cyclization and subsequent rearrangements can proceed in different
ways, and eventually a carbocation needs to be neutralized. Neutralisation usually requires a series
of hydride shifts and/or methyl migrations (not indicated in the figure), leading to either the
formation of a double bond (elimination reaction), or the formation of a cyclopropanyl ring. The
resulting compounds are called triterpenoids. Figure 1 only shows the cyclization reactions
applying to saponin structures that we have found in our literature search1.
The type of cyclase that is involved in the cyclization reaction primarily determines the skeleton
that is formed (Figure 1). Many different kinds of cylases (e.g. cycloartenol synthase, lanosterol
synthase, β-amyrin synthase) have been described, and their mechanism of action is rather well
documented (Abe et al., 1993; Wendt et al., 2000; Haralampidis et al., 2002). Cyclization of
oxidosqualene can proceed in 2 directions, either via the ‘chair-chair-chair’ or chair-boat-chair’
conformation, which yield different skeletons. An important difference between the two resulting
configurations lies in the stereochemistry of the methyl groups at C9 and C14. In the ‘chair-chair-
chair’ conformation, the methyl group at C9 is an up stereo and that at C14 is a down stereo,
whereas the opposite is true for the ‘chair-boat-chair’ conformation. It should be noted that the
numbering of the carbon atoms in this scheme is done according to the backbone of oxidosqualene
and that the methyl groups are not numbered, which is different from that in the IUPAC2
nomenclature.
1 Aglycone structures of saponins were obtained from year 1987 till present from www.sciencedirect.com, using “saponins” and “structures” as key words. 2 International union of pure and applied chemistry home page; http://www.chem.qmul.ac.uk/iupac/
62

Saponin skeletons
63
5
6
4
1
3
2
109
78
1112
14
13
15
1716
18
OH
1920
2122
+
O OH
+
5
6
4
1
3
2
109
78
1112
14
13
15
1716
1821
2019
22
OH
H
+
OH
+
OH
+
OH
5
6
4
1
3
2
109
78
1112
14
1317
OH
18
1615
20
19
2122
+
6665A
Oxidation
chair-chair-chair
Figure 1: The cyclization of oxidosqualene to various saponin skeletons.
chair-boat-chair
5
6
4
1
3
2
109
78
1112
14
1318
OH
17
1615
2019
2122+
5
6
4
1
3
2
109
78
1112
14
13
15
1716
1821
2019
22
5
6
4
1
3
2
109
78
1112
14
13
15
1716
1821
2019
22
5
6
4
1
3
2
109
78
1112
14
1318
OH
17
1615
2019
2122
+
5
6
4
1
3
2
109
78
1112
14
1317
18
1615
20
19
2122
5
6
4
1
3
2
109
78
1112
14
1317
18
1615
19
2022
21
5
6
4
1
3
2
109
78
1112
14
13
15
1716
1819
2021
22
+
5
6
4
1
3
2
109
78
1112
14
13
1516
1817
21
22
2019
Oxidosqualene Dammarenyl cation Hopenyl cation
Squalene Baccharenyl cation Protosteryl cation
66665B
66665A
Lupenyl cation
6665B 66666
Oleanyl cation

Chapter 4
A proton-initiated cyclization via the ‘chair-chair-chair’ conformation produces the tetracyclic
dammarenyl C18 cation, the 5-membered ring of which can expand by a C16-C17 or a C13-C17
attack of the carbocation. The former yields the tetracyclic baccharenyl C17 cation, in which C18 is
inserted between C16 and C17 to form a 6-carbon ring. This is followed by rearrangement of the
C21-C22 double bond, which produces the pentacyclic lupenyl C22 cation. This lupenyl cation can
rearrange further to yield either a 66666 or a 66665A skeleton. This number representation is
adopted from the description given by Xu et al. (2004), which indicates the number of carbons in
the subsequent rings of the skeleton. For example, 66665 indicates that the skeleton is composed of
four consecutive 6-carbon rings followed by a 5-carbon ring. The C13-C17-based rearrangement of
the dammarenyl cation produces the tetracyclic hopenyl C17 cation, in which C18 is inserted
between C13 and C17 to form a 6-carbon ring. The hopenyl cation can subsequently rearrange into
a 66665B skeleton. Alternatively, the dammarenyl cation can also rearrange to the tetracyclic
6665A skeleton.
With the ‘chair-boat-chair’ conformation, a tetracyclic protosteryl C18 cation is formed by the
proton-initiated cyclization, ultimately leading to the skeletons 6665B. After cyclization, a series of
additional modifications of the triterpenoid follows, eventually yielding saponins. These
modifications include various substitutions (with e.g. –OH, glycosyl residues), elimination, and/or
oxidation reactions. Very little is known about the enzymes and the biological pathways mediating
these modifications (Haralampidis et al., 2002).
The diversity of saponin aglycones can be seen from several reviews (Agarwal & Rastogi, 1974;
Mahato et al., 1988; Mahato & Nandy, 1991). Besides the number of rings, the many aglycones
identified differ in their number and/or type of substituents attached (e.g. –OH, =O, –CH3, –
CH2OH, –CHO, –COOH, and or glycosyl residues), the number and position of double bonds,
bridging and ring opening, as well as in their stereochemistry. This leads to an extensive collection
of aglycones, many of which can have the same basic skeleton. The postulated classification of 3
groups of saponins (Sparg et al., 2004) does not accommodate all the aglycone structures reported
so far, as there are more than 3 different skeletons known. Moreover, the numbering of carbon
atoms of the aglycones according to IUPAC does not reflect their biosynthetic origin, which
obscures that certain skeletons have actually similar ancestors, in particular where ring
expansion/formation through oxygen insertion has occurred. Therefore, this review seeks to
accommodate the existing aglycones in simplified skeletons, according to the following premises:
64
Saponin skeletons
1) The different cyclization patterns of oxidosqualene form the basis of the skeletal classification.
2) Decoration of the skeletons (functional groups, unsaturation, bridging, glycosylation) is
excluded, unless they affect the number of rings or ring configuration.
3) The numbering of carbon atoms in the saponin skeleton is reminiscent of their biosynthetic
origin, the backbone of the 22 contiguous carbon atoms of oxidosqualene.
4) Processing of skeletons (e.g. ring expansion, removal of methyl groups reminiscent of
oxidosqualene) and their mutual relationships are accounted for.
Saponin complexity to skeletal simplicity
In order to illustrate the different carbon numbering employed in this review, two examples are
shown in Figure 2 (Guo & Kenne, 2000; Kennelly et al., 1995). The aglycones 2A(i) and 2B(i)
(both numbered according to the IUPAC nomenclature) were simplified to 2A(ii) and 2B(ii) by
omitting the oxidosqualene-derived hydroxyl group and the substituents added after cyclization
(including double bonds), and re-numbered in 2A(iii) and 2B(iii), respectively, according to their
biosynthetic origin, the carbon numbering of oxidosqualene. More specifically, C3-OH, double
bond C12-C13, C16-R2, C20-R4 and C22-R3 (where R1-R4 are substituents) have been omitted.
R1 always contains a carbon and can be CH3, CH2OH or CHO, which are of different degree of
oxidation. Methyl groups attached to C1, C5, C9, C14, C18, and C22 are shown, because they
occurred in all saponins with this skeleton. Double bonds are not indicated in the skeletal structures,
because they can occur at different positions in the molecules, depending on the plant species they
originate from. Similarly, in structure 2B(i), the C3-COOH, C12-OR (where R is a glycosyl
residue), C20-OH, C25-OH, and double bonds C23-C24 and C4-C28 have been omitted to give
2B(ii). By employing the above procedure, a saponin structure is reduced to a skeleton.
65
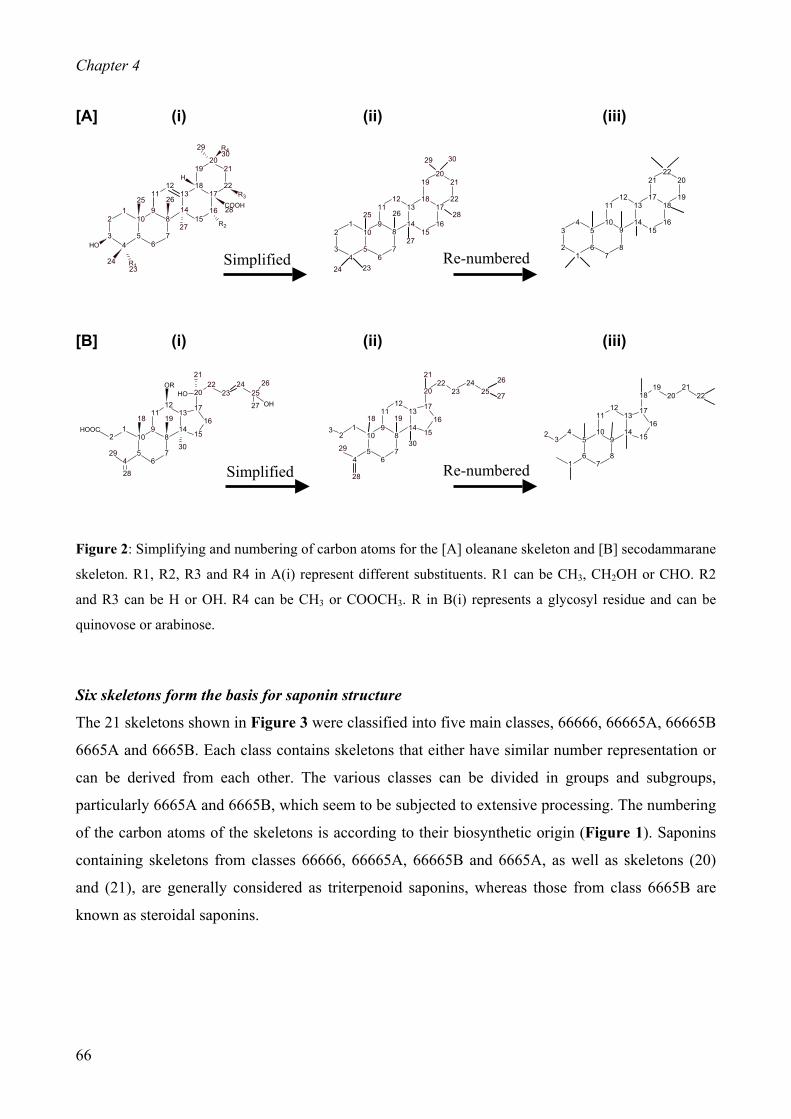
Chapter 4
[A] (i) (ii) (iii)
[B] (i) (ii) (iii)
H
Figure 2: Simplifying and numbering of carbon atoms for the [A] oleanane skeleton and [B] secodammarane
skeleton. R1, R2, R3 and R4 in A(i) represent different substituents. R1 can be CH3, CH2OH or CHO. R2
and R3 can be H or OH. R4 can be CH3 or COOCH3. R in B(i) represents a glycosyl residue and can be
quinovose or arabinose.
Six skeletons form the basis for saponin structure
The 21 skeletons shown in Figure 3 were classified into five main classes, 66666, 66665A, 66665B
6665A and 6665B. Each class contains skeletons that either have similar number representation or
can be derived from each other. The various classes can be divided in groups and subgroups,
particularly 6665A and 6665B, which seem to be subjected to extensive processing. The numbering
of the carbon atoms of the skeletons is according to their biosynthetic origin (Figure 1). Saponins
containing skeletons from classes 66666, 66665A, 66665B and 6665A, as well as skeletons (20)
and (21), are generally considered as triterpenoid saponins, whereas those from class 6665B are
known as steroidal saponins.
Re-numbered Simplified
OROH
OH
OOC10
54
29
98
67
1112
14
13
12 15
16
17
2022
2324
25
18 19
30
3
26
27
21
28
1
3210
54
29
98
67
1112
14
13
12 15
16
17
2022
2324
25
28
18 19
30
21
27
26
R430
25
10
5
1
4
2
3
98
67
1112
14
13 17
16
18
15
22
211920
COOH28
H
26
29
R12324
O
27 R2
R3
10
5
1
4
2
3
8
7
9
6
13
14
1211
1817
1516
21
22
2019
24 23
25 26
27
28
29
5
6
109
78
1112
14
13
415
16
17
1819
2021
22
Re-numbered H
5
6
4
1
3
2
9
8
10
7
13
14
1211
1718
1516
20
19
2221
30
Simplified
66

Saponin skeletons
Figure 3
O
O
O
OO
66666
5
6
4
1
3
2
9
8
10
7
13
14
1211 18
16
17
15
2221 20
19
5
6
4
1
3
2
9
8
10
7
13
14
1211
1718
1516
20
19
2221
5
6
4
1
3
2
9
8
10
7
14
1211 18
16
17
15
1319
2021
225
6
9
8
10
7
14
1211 18
16
17
15
1319
2021
4
1
32
22
5
6
9
8
10
7
14
1211 18
16
17
15
1319
2021
4
2
3
1
22
22
(2)
(1)
(3)
9
8
10
7
5
6
13
14
1211 17
16
18
15
21
22
2019
43
1
2
5
6
4
1
3
2
9
8
10
7
14
1211 17
16
18
15
1321
2019
66665A
(5)
(4)
(6)
66665B
(7)
67

Chapter 4
…continued
O
O
O
O
O
O
O
O
O
C
O
O
O
6665A
5
6
4
1
3
2
9
8
10
7
13
14
1211
17
16
15
1819
2021
22
1
32
2122
18
2021 22
5
6
4
1
3
2
9
8
10
7
13
14
1211
17 16
15
1819 20
21 22
5
6
109
78
1112
14
13
415
16
17
1819
2021
22
5
6
4
1
3
2
9
8
10
7
14
1211 13
17
16
15
18 19
20
5
6
4
1
3
2
9
8
10
7
1312
1117
1514
2021
22
16
5
6
4
1
3
2
9
8
10
7
14
1211 16
17
15
1319
18
(9)
(8) (10) (11)
(12) (13)
68
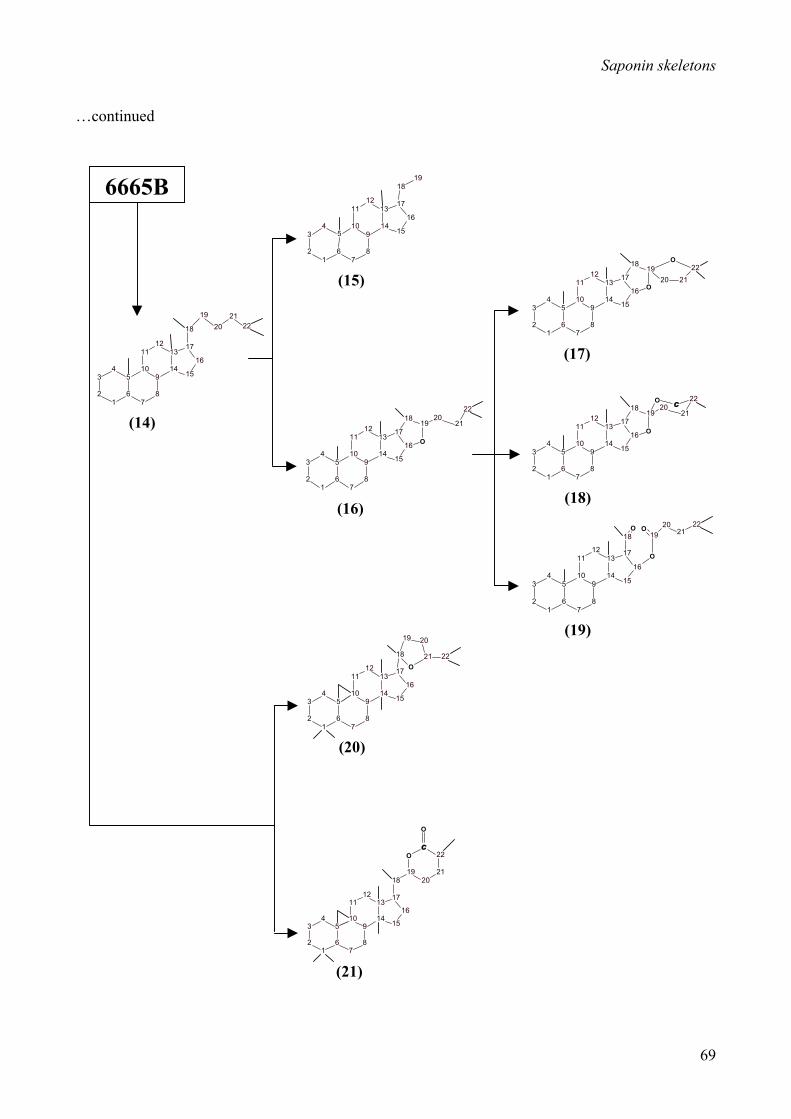
Saponin skeletons
…continued
5
6
4
1
3
2
9
8
10
7
13
14
1211
17
16
15
18
19
21
20
22
5
6
4
1
3
2
9
8
10
7
13
14
1211
17
16
15
1918
22
2120
13
14
17
16
15
18 1920
2122
5
6
4
1
3
2
9
8
10
7
13
14
1211
17
16
15
1819
22
2120
18
1920
2122
5
6
4
1
3
2
9
8
10
7
13
14
1211
17
16
15
5
6
4
1
3
2
9
8
10
7
13
14
1211
17
16
15
1819
5
6
4
1
3
2
9
8
10
7
13
14
1211
17
16
15
1819
22
2120
5
6
4
1
3
2
9
8
10
7
13
14
1211
17
16
15
1819 22
2120
6665B
O
(20)
(21)
CO
O
O
(16)
(14)
(15) O
O
(17)
O
OC
(18)
5
6
4
1
3
2
9
8
10
7
1211
O
O
O
(19)
69

Chapter 4
Figure 3: Structures of 21 skeletons classified into 5 main classes, 66666, 66665A, 66665B, 6665A, and
6665B, and their biosynthetic relationships. Note that the carbon numbering reflects their original position in
the oxidosqualene precursor, which is different from the normally adopted IUPAC numbering. Trivial names
are given to the skeletons: (1) Oleanane; (2) Steganogenin; (3) A-homo-3a-oxa-5β-olean-12-en-3-one-28-oic
acid; (4) Lupane; (5) Isochiisanogenin; (6) Chiisanogenin; (7) Hopane; (8) Ginsenoside; (9)
Secodammarane; (10) & (11) Dammarane; (12) Jujubogenin; (13) Trans ebelin-lactone; (14) Cholestane;
(15) Pregnane; (16) Furostane; (17) Furospirostane; (18) Spirostane; (19) 16-B-hydroxypregnenolone; (20)
& (21) Cycloartane. The C in skeletons (11), (18) and (21) represents a carbon (usually a methyl group
originally present in oxidosqualene), which has become part of a ring during processing of these skeletons.
(i) Class 66666
Skeletons (1), (2) and (3) have the basic 66666 skeleton. Skeleton (1) is the most common skeleton
found in saponins (Xu et al., 2004). Saponins containing this skeleton are generally known as
oleanane type saponins (Sparg et al., 2004) and have been isolated from a wide array of plants
(Daveby et al., 1998; Woldemichael & Wink, 2002; Treyvaud et al., 2000; Voutquenne et al., 2003;
Wandji et al., 2003). Most of the skeleton (1) structures have two methyl groups at C22, i.e. the β-
amyrin skeleton, and occasionally, one of these two methyl groups can be processed (Ikuta et al.,
1991; Miyakoshi et al., 1997; Park et al., 2002); for instance, a hydroxyl group can occupy the
position of the methyl group (Park et al., 2002). In some cases, one of the two methyl groups
migrates to C21 as part of the mechanism neutralizing the carbocation, giving the α-amyrin
skeleton (Amimoto et al., 1993; Zhao et al., 1997; Sahpaz et al., 2000). Therefore, the C21 and one
of the C22 methyl groups are indicated with dotted lines in Figure 3. The α-amyrin and β-amyrin
skeletons are the cyclization products of distinct cyclases, α-amyrin synthase and β-amyrin
synthase, respectively (Haralampidis et al., 2002). Skeletons (2) and (3) are both derived from
skeleton (1). Skeleton (2) has the trivial name, steganogenin, and was thought to be formed by
fragmentation of the C18-C19 bond of skeleton (1) (Lavaud et al., 1992). Skeleton (3) has an
oxygen insertion into its first ring, which was suggested to be a result of enzymatic hydroxylation
and oxidation reactions of C1 and C2, respectively (Debella et al., 2000; Shirane et al., 1996),
followed by the formation of an intramolecular ester.
70
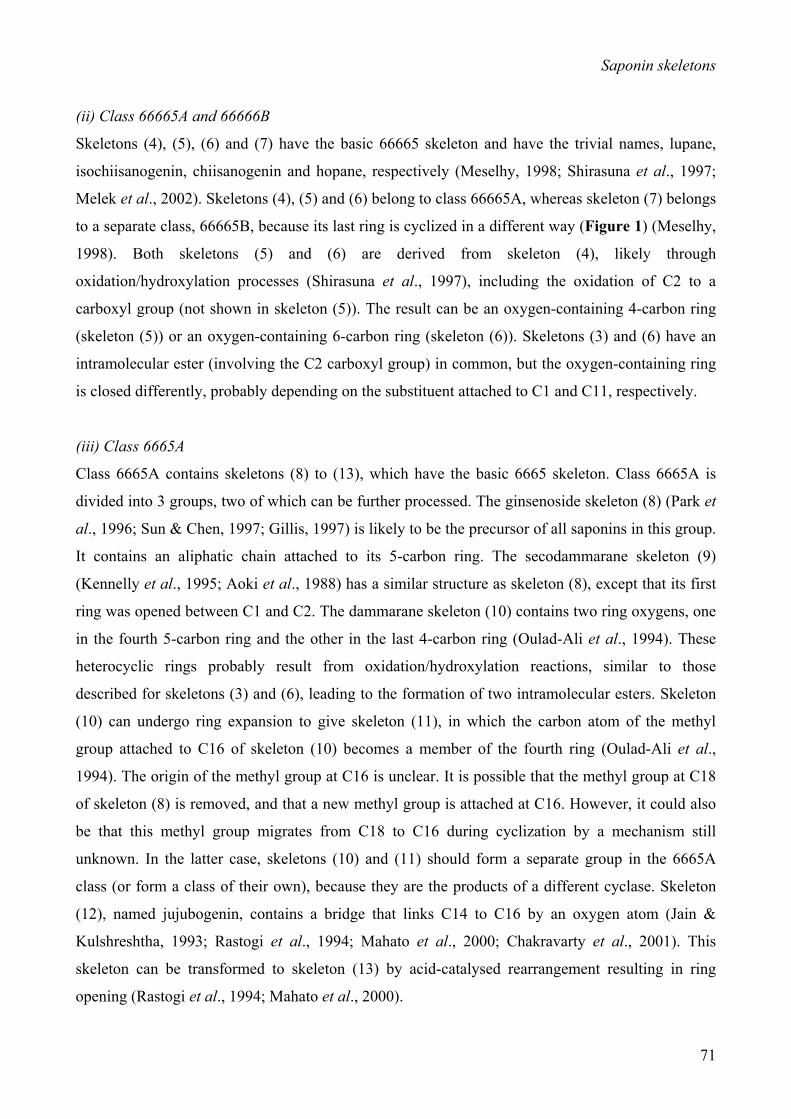
Saponin skeletons
(ii) Class 66665A and 66666B
Skeletons (4), (5), (6) and (7) have the basic 66665 skeleton and have the trivial names, lupane,
isochiisanogenin, chiisanogenin and hopane, respectively (Meselhy, 1998; Shirasuna et al., 1997;
Melek et al., 2002). Skeletons (4), (5) and (6) belong to class 66665A, whereas skeleton (7) belongs
to a separate class, 66665B, because its last ring is cyclized in a different way (Figure 1) (Meselhy,
1998). Both skeletons (5) and (6) are derived from skeleton (4), likely through
oxidation/hydroxylation processes (Shirasuna et al., 1997), including the oxidation of C2 to a
carboxyl group (not shown in skeleton (5)). The result can be an oxygen-containing 4-carbon ring
(skeleton (5)) or an oxygen-containing 6-carbon ring (skeleton (6)). Skeletons (3) and (6) have an
intramolecular ester (involving the C2 carboxyl group) in common, but the oxygen-containing ring
is closed differently, probably depending on the substituent attached to C1 and C11, respectively.
(iii) Class 6665A
Class 6665A contains skeletons (8) to (13), which have the basic 6665 skeleton. Class 6665A is
divided into 3 groups, two of which can be further processed. The ginsenoside skeleton (8) (Park et
al., 1996; Sun & Chen, 1997; Gillis, 1997) is likely to be the precursor of all saponins in this group.
It contains an aliphatic chain attached to its 5-carbon ring. The secodammarane skeleton (9)
(Kennelly et al., 1995; Aoki et al., 1988) has a similar structure as skeleton (8), except that its first
ring was opened between C1 and C2. The dammarane skeleton (10) contains two ring oxygens, one
in the fourth 5-carbon ring and the other in the last 4-carbon ring (Oulad-Ali et al., 1994). These
heterocyclic rings probably result from oxidation/hydroxylation reactions, similar to those
described for skeletons (3) and (6), leading to the formation of two intramolecular esters. Skeleton
(10) can undergo ring expansion to give skeleton (11), in which the carbon atom of the methyl
group attached to C16 of skeleton (10) becomes a member of the fourth ring (Oulad-Ali et al.,
1994). The origin of the methyl group at C16 is unclear. It is possible that the methyl group at C18
of skeleton (8) is removed, and that a new methyl group is attached at C16. However, it could also
be that this methyl group migrates from C18 to C16 during cyclization by a mechanism still
unknown. In the latter case, skeletons (10) and (11) should form a separate group in the 6665A
class (or form a class of their own), because they are the products of a different cyclase. Skeleton
(12), named jujubogenin, contains a bridge that links C14 to C16 by an oxygen atom (Jain &
Kulshreshtha, 1993; Rastogi et al., 1994; Mahato et al., 2000; Chakravarty et al., 2001). This
skeleton can be transformed to skeleton (13) by acid-catalysed rearrangement resulting in ring
opening (Rastogi et al., 1994; Mahato et al., 2000).
71

Chapter 4
(iv) Class 6665B
Class 6665B contains skeletons (14) to (21), which also have the basic 6665 skeleton, but differ
from those of class 6665A in their biosynthetic origin (Figure 1). Class 6665B is divided into 2
main groups, one of which (skeleton (14)) can be subjected to extensive processing. Skeleton (14),
known as cholestane, has a similar structure as skeleton (8) in class 6665A, except for the removal
of the methyl groups at C1 and C9, and the migration of the C13 methyl group from C14 (Huang et
al., 2000; Pires et al., 2002). Skeleton (15) is derived from skeleton (14) by reduction of the length
of the aliphatic chain (Dong et al., 2001). Compounds containing skeleton (15) are usually called
pregnane glycosides (Achenbach et al., 1996; Mimaki et al., 1997; Dong et al., 2001; Zheng et al.,
2004), but they have also been referred to as saponins (Uddin Ahmad et al., 1998). Skeleton (16) is
probably formed from skeleton (14) by hydroxylation or oxidation of C16 and C19, and subsequent
ring closure yielding the oxygen-containing 4-carbon ring. The aliphatic C20-C22 chain of skeleton
(16) can be processed to give an extra 4-carbon or 5-carbon ring, skeletons (17) and (18),
respectively (Mimaki et al., 1995; Dong et al., 2001). The mechanism by which this is effected is
unknown, but probably requires hydroxylation of C19 and C22, or C19 and one of the C22 methyl
groups, for skeletons (17) and (18), respectively. Saponins containing skeletons (16) and (18) are
termed furostanol and spirostanol saponins, respectively (Sparg et al., 2004; Mimaki et al., 1999;
Wang et al., 1997a; Achenbach et al., 1994; Onning et al., 1993a/b; Onning & Asp, 1993). They
have been referred to as different classes by Sparg et al. (2004); however, according to our
nomenclature, they belong to the same class. Skeleton (19) is processed from skeleton (16) by
enzymatic oxidation and ring opening (Dong et al., 2001).
Saponins containing skeletons (20) and (21) are named cycloartane saponins. The presence of the
cyclopropanyl indicates that these saponins, compared to skeleton (14), are cyclized by different
kinds of cyclases (cycloartenol and lanosterol synthase, respectively), which differ in the way that
they neutralize the carbocation (formation of cyclopropanyl and elimination, respectively). In
skeletons (20) and (21), the aliphatic C17-C22 is processed differently after cyclization of the
skeleton. Skeleton (20) has an oxygen-containing 4-carbon ring linked to C17 of the skeleton
(Verotta et al., 1998; 2001), which is probably formed in a similar way as that of skeleton (16).
Skeleton (21) is similar to skeleton (20), except that it has an oxygen-containing 5-carbon ring
linked to C17 through a methylene spacer (Choi et al., 1989; Kennelly et al., 1996). Note that one
of the C22 methyl groups participates in ring formation. Ring closure is achieved through the
72
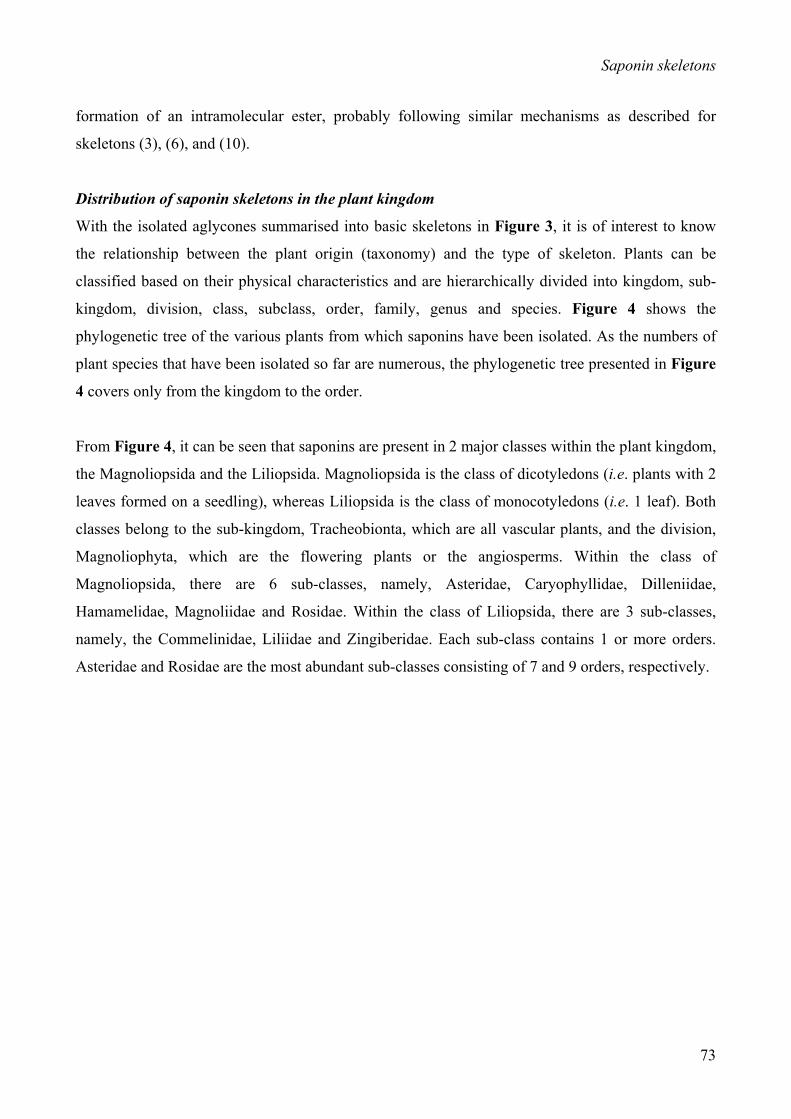
Saponin skeletons
formation of an intramolecular ester, probably following similar mechanisms as described for
skeletons (3), (6), and (10).
Distribution of saponin skeletons in the plant kingdom
With the isolated aglycones summarised into basic skeletons in Figure 3, it is of interest to know
the relationship between the plant origin (taxonomy) and the type of skeleton. Plants can be
classified based on their physical characteristics and are hierarchically divided into kingdom, sub-
kingdom, division, class, subclass, order, family, genus and species. Figure 4 shows the
phylogenetic tree of the various plants from which saponins have been isolated. As the numbers of
plant species that have been isolated so far are numerous, the phylogenetic tree presented in Figure
4 covers only from the kingdom to the order.
From Figure 4, it can be seen that saponins are present in 2 major classes within the plant kingdom,
the Magnoliopsida and the Liliopsida. Magnoliopsida is the class of dicotyledons (i.e. plants with 2
leaves formed on a seedling), whereas Liliopsida is the class of monocotyledons (i.e. 1 leaf). Both
classes belong to the sub-kingdom, Tracheobionta, which are all vascular plants, and the division,
Magnoliophyta, which are the flowering plants or the angiosperms. Within the class of
Magnoliopsida, there are 6 sub-classes, namely, Asteridae, Caryophyllidae, Dilleniidae,
Hamamelidae, Magnoliidae and Rosidae. Within the class of Liliopsida, there are 3 sub-classes,
namely, the Commelinidae, Liliidae and Zingiberidae. Each sub-class contains 1 or more orders.
Asteridae and Rosidae are the most abundant sub-classes consisting of 7 and 9 orders, respectively.
73
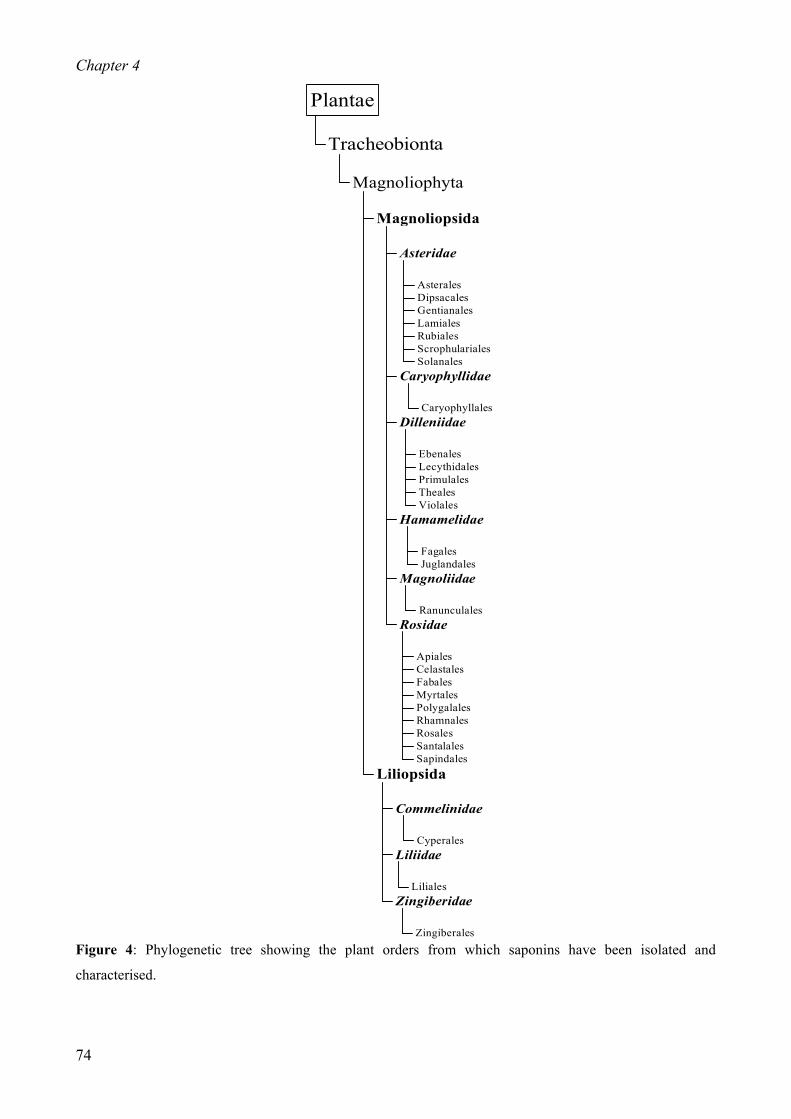
Chapter 4
AsteralesDipsacalesGentianalesLamialesRubialesScrophularialesSolanales
Asteridae
Caryophyllales
Caryophyllidae
EbenalesLecythidalesPrimulalesThealesViolales
Dilleniidae
FagalesJuglandales
Hamamelidae
Ranunculales
Magnoliidae
ApialesCelastalesFabalesMyrtalesPolygalalesRhamnalesRosalesSantalalesSapindales
Rosidae
Magnoliopsida
Cyperales
Commelinidae
Liliales
Liliidae
Zingiberales
Zingiberidae
Liliopsida
Magnoliophyta
Tracheobionta
Plantae
Figure 4: Phylogenetic tree showing the plant orders from which saponins have been isolated and
characterised.
74
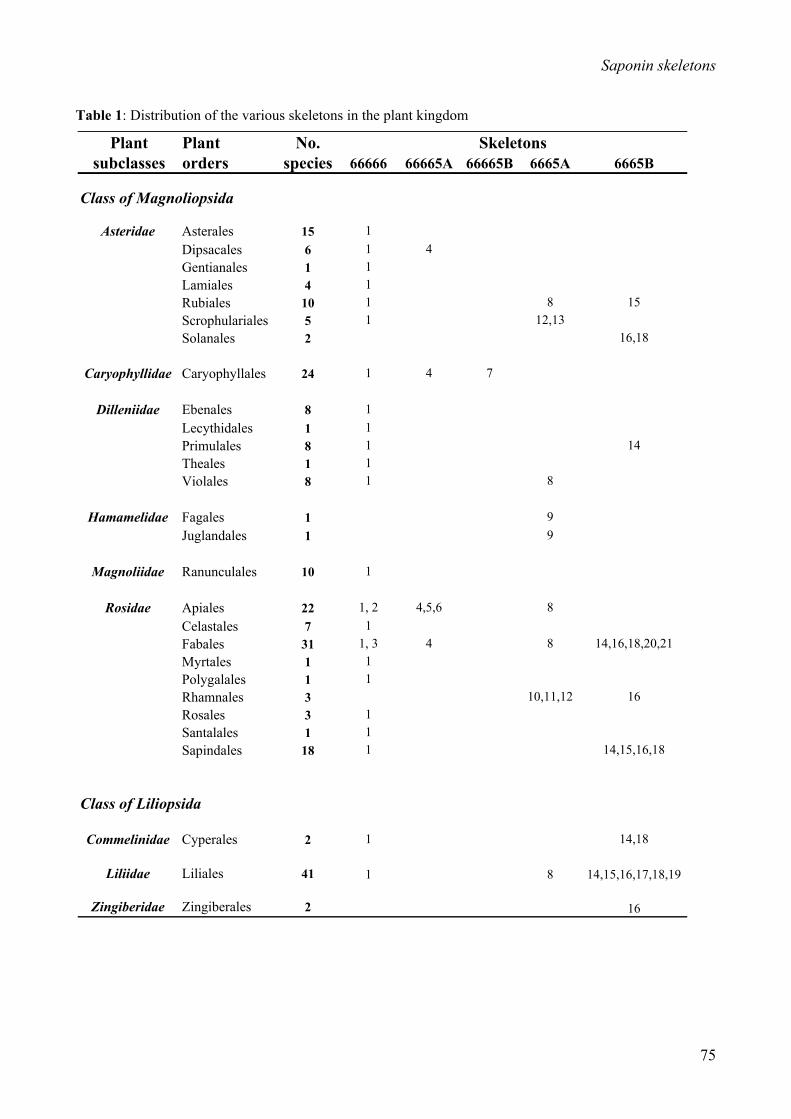
Saponin skeletons
Table 1: Distribution of the various skeletons in the plant kingdom
Plant Plant No.subclasses orders species 66666 66665A 66665B 6665A 6665B
Asteridae Asterales 15 1Dipsacales 6 1 4Gentianales 1 1Lamiales 4 1Rubiales 10 1 8Scrophulariales 5 1 12,13Solanales 2 16,18
Caryophyllidae Caryophyllales 24 1 4 7
Dilleniidae Ebenales 8 1Lecythidales 1 1Primulales 8 1 1Theales 1 1Violales 8 1 8
Hamamelidae Fagales 1 9Juglandales 1 9
Magnoliidae Ranunculales 10 1
Rosidae Apiales 22 1, 2 4,5,6 8Celastales 7 1Fabales 31 1, 3 4 8 14,16,18,20,21Myrtales 1 1Polygalales 1 1Rhamnales 3 10,11,12 16Rosales 3 1Santalales 1 1Sapindales 18 1 14,15,16,18
Commelinidae Cyperales 2 1 14,18
Liliidae Liliales 41 1 8 14,15,16,17,18,19
Zingiberidae Zingiberales 2 16
Class of Magnoliopsida
Class of Liliopsida
Skeletons
15
4
75

Chapter 4
The distribution of the various skeletons in different plant orders is presented in Table 1. The
number of plant species of which saponins have been isolated is indicated for each order. Liliales is
the most abundant one comprising of 41 different species, followed by the Fabales, having 31
species. It can be seen that skeleton (1) is the most common skeleton occurring in almost all orders,
except Solanales, Fagales, Juglandales, Rhamnales and Zingiberales. The absence of skeleton (1) in
these 5 orders may suggest that it has not been analysed for, and does not necessarily mean that it is
not present. In half of the 25 orders in the class of Magnoliopsida, skeleton (1) is the only skeleton
present, namely, Asterales, Gentianales, Lamiales, Ebenales, Lecythidales, Theales, Ranunculales,
Celastales, Myrtales, Polygalales, Rosales and Santalales.
The sub-classes of Rosidae and Liliidae show the largest diversity in saponin skeletons (Table 1),
in which the Fabales have skeletons from classes 66666, 66665A, 6665A and 6665B, and the
Liliales has skeletons from classes 66666, 6665A and 6665B. The order of Fabales is the most
diverse, containing 9 different skeletons, and is followed by Liliales and Apiales, which has 8 and 6
different skeletons, respectively. It can be noticed that processed skeletons always occur with their
precursors in one order. For example, the Fabales contain skeleton (3), which is derived from
skeleton (1) (Debella et al., 2000), and skeleton (18), which is derived from skeleton (16) (Sparg et
al., 2004). It should be noted that skeletons (20) and (21), which are present in the same plant order,
do not coexist at the species level (Pistelli et al., 1998; Choi et al., 1989; Kennelly et al., 1996);
they also do not seem to coexist with skeleton (14) derived saponins.
The distribution of saponin skeletons does not seem to be plant order-specific. It should be noted
that the saponins were isolated from different parts of a plant, which include the roots, stems, bark,
leaves, seeds and fruits. Occasionally, the whole plant was used. We have not observed that specific
saponin skeletons are associated with particular parts of a plant; saponins of the same skeleton can
be obtained from various plant parts.
Decoration of skeleton (1) saponins
(i) Type of functional groups
As the synthesis of saponins involves the attachment of various functional groups at different
carbon positions of the skeletons, a summary of the various substituents and their associated carbon
atoms is presented in Table 2 for the different plant orders. This table only shows the substituents
present in saponins having the skeleton (1), the most common skeleton found in the plant kingdom.
76

Saponin skeletons
Several substituents are attached to the same skeleton. At each carbon atom, more than 1 type of
substituent has been reported, which include –OH, =O, –COOH, etc.
From Table 2, it can be seen that C1, C18, C19, C20 and C22 show the largest diversity in
substituents attached. The OH group is distributed throughout all carbon atoms and plant orders.
The methyl groups originally present in oxidosqualene often serve as a point of attachment of
functional groups. Of these methyl groups, the ones attached at C9 and C21 (only present in the α-
amyrin type) is not processed in any of the plant orders, whereas C5 shows only processing in the
Fabales (Periandra dulcis (Hashimoto et al., 1980; 1982; 1983; Suttisri et al., 1993)); the C14
methyl groups are moderately processed, whereas those at C1, C18, and C22 are heavily processed.
Often these methyl groups are oxidized to different degrees, which are reflected by the presence of
CH2OH, CHO and COOH.
C4 and C12 are found to contain substituents in only 1 plant order. The saponin that contains an OH
at C4 was isolated from Gambeya boukokoensis (Wandij et al., 2003). The other substituent, OH at
C12, has been ascribed to Ilex kudincha (Ouyang et al., 1996). No particular trend between the type
of substituents at different carbon positions and the type of plant can be seen, except for the fact
that the class of Liliopsida has fewer substituents, which seem to have a lower degree of oxidation
than those of the Magnoliopsida.
77
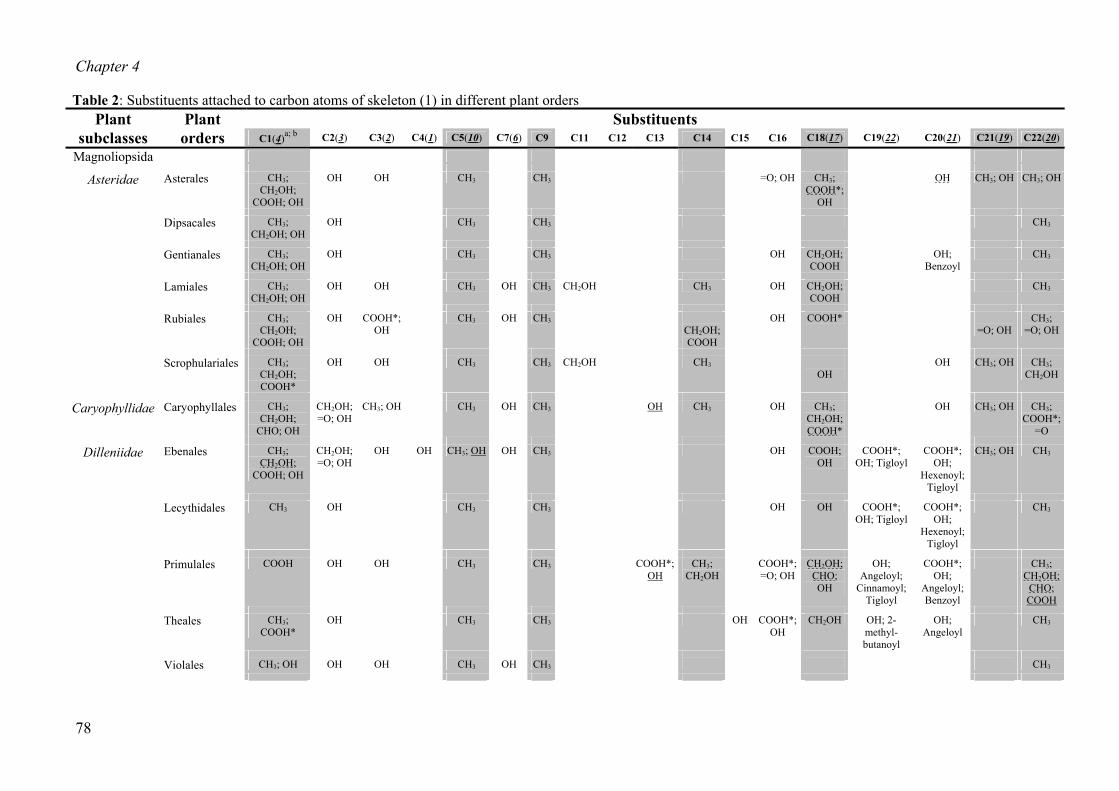
Chapter 4
Plant Plant Substituents subclasses orders C1(4)a; b C2(3) C3(2) C4(1) C5(10) C7(6) C9 C11 C12 C13 C14 C15 C16 C18(17) C19(22) C20(21) C21(19) C22(20)
Magnoliopsida
Asteridae Asterales CH3; CH2OH;
COOH; OH
OH OH CH3 CH3 CH3 =O; OH CH3; COOH*;
OH
OH CH3; OH CH3; OH
Dipsacales CH3; CH2OH; OH
OH CH3 CH3 CH3 COOH* CH3; OH CH3
Gentianales CH3; CH2OH; OH
OH CH3 CH3 CH3 OH CH2OH; COOH
OH;Benzoyl
CH3
Lamiales CH3; CH2OH; OH
OH OH CH3 OH CH3 CH2OH CH3 OH CH2OH; COOH
CH3
Rubiales CH3; CH2OH;
COOH; OH
OH COOH*;OH
CH3 OH CH3 CH3; CH2OH; COOH
OH COOH* CH3; =O; OH
CH3; =O; OH
Scrophulariales CH3; CH2OH; COOH*
OH OH CH3 CH3 CH2OH CH3 COOH*; OH
OH CH3; OH CH3; CH2OH
Caryophyllidae Caryophyllales CH3; CH2OH;
CHO; OH
CH2OH; =O; OH
CH3; OH CH3 OH CH3 OH CH3 OH CH3; CH2OH; COOH*
OH CH3; OH CH3; COOH*;
=O
Dilleniidae Ebenales CH3; CH2OH;
COOH; OH
CH2OH; =O; OH
OH OH CH3; OH OH CH3 CH3 OH COOH; OH
COOH*; OH; Tigloyl
COOH*; OH;
Hexenoyl; Tigloyl
CH3; OH CH3
Lecythidales CH3 OH CH3 CH3 CH3 OH OH COOH*; OH; Tigloyl
COOH*; OH;
Hexenoyl; Tigloyl
CH3
Primulales COOH OH OH CH3 CH3 COOH*; OH
CH3; CH2OH
COOH*;=O; OH
CH2OH; CHO; OH
OH; Angeloyl;
Cinnamoyl; Tigloyl
COOH*; OH;
Angeloyl; Benzoyl
CH3; CH2OH;
CHO; COOH
Theales CH3; COOH*
OH CH3 CH3 CH3 OH COOH*;OH
CH2OH OH; 2-methyl-butanoyl
OH; Angeloyl
CH3
Violales CH3; OH OH OH CH3 OH CH3 CH3 COOH CH3; OH CH3
Table 2: Substituents attached to carbon atoms of skeleton (1) in different plant orders
78

Saponin skeletons
Magnoliidae Ranunculales CH3; CH2OH; OH
OH CH3 CH3 OH CH3 OH COOH* CH3; COOH*; =O; OH
Rosidae Apiales CH3; CH2OH#;
CHO; COOH*; OH
COOH*; OH
CH3; COOH*;
OH
CH3 CH3 CH2OH; =O; OH
OH CH3 OH OH CH2OH; COOH*
OH
OH OH CH3 CH3; CH2OH; COOH*; =O; OH
Celastales CH3; CH2OH;
CHO; COOH*
COCH3; OH
CH3 CH3 OH CH3 COOH OH CH3; OH CH3; OH
Fabales CH3; CH2OH#;
COOH; OH
CH2OH; COOH*;
OH
OH CH2OH; CHO;
COOH*; OH
CH3 =CH2; =O
CH3 OH CH3; COOH*
DDMP; =O; OH
OH; =CH2 CH3; CH2OH; COOH*
Myrtales CH3 OH CH3 CH3 CH3 COOH* CH3
Polygalales CH3; COOH OH OH CH3 CH3 CH3; CH2OH
COOH CH3
Rosales CH3; CHO OH OH CH3 CH3 CH3 OH OH COOH; OH
OH OH CH3; OH CH3; COOH
Santalales CH3; CH2OH OH CH3 CH3 CH3 COOH CH3
Sapindales CH3; CH2OH;
CHO; COOH; OH
OH COOH*;OH
CH3 CH3 CH3; CH2OH; COOH*
OH COOH*;OH
CH2OH; COOH*;
OH
COOH*; OH;
Angeloyl
OH; Angeloyl;
Tigloyl
CH3 CH3; =O; OH
Liliopsida
Commelinidae Cyperales CH3; OH OH CH3 CH3 CH3 OH CH3 OH;Benzoyl; N-methyl anthranilic
acid
CH3; CHO
Liliidae Liliales CH3; CH2OH; OH
OH OH CH3 CH3 CH3 OH COOH CH3
*Indicates that an alcohol can be ester-linked. #Indicates that an acid can be ester-linked. aShaded columns indicate the carbon positions containing the methyl groups that were originally present in oxidosqualene; Note that the C21 methyl group has migrated from C22, as in α-amyrin. bNumber within bracket indicates IUPAC numbering. Substituents underlined with a dotted line can exist either independently or as part of a bridge, whereas those underlined with a solid line are only encountered as part of a bridge.
79

Chapter 4
The C19 and C20 can contain various uncommon groups, which are illustrated in Figure 5.
Substituents at C19 can be liable to chemical reactions e.g. DDMP (2,3-dihydro-2,5-dihydroxy-6-
methyl-4H-pyran-4-one) (Massiot et al., 1996; Okubo et al., 1996; Heng et al., 2005a). DDMP is
most commonly found in saponins isolated from legumes such as peas (Daveby et al., 1998; Heng
et al., 2004; 2005a/b), soybeans (Decroos et al., 2005; Berhow et al., 2002; Hu et al., 2002) and
lentils (Ruiz et al., 1997). Being the native saponin found in soy and peas (Daveby et al., 1998; Hu
et al., 2002; Decroos et al., 2005; Heng et al., 2004; 2005a/b), DDMP saponin has been the focus of
saponin studies as it was found to be unstable at various conditions (Okubo et al., 1996; Hu et al.,
2002; Heng et al., 2005a). The ether bond that links the DDMP group to the saponin aglycone at the
C19 position, is sensitive to acid and base conditions, as well as prolonged exposure to aqueous
environment (Heng et al., 2005a). It might be expected that substituents attached by the same or
similar bonds (ether or ester linkages) are vulnerable during extraction and/or analytical procedures,
which may lead to underestimation of their abundance in plant extracts.
O O
NH
20
O
O20O
O
X O
OX
N-methyl anthranilic acid Benzoyl Angeloyl Tigloyl
O
O
20
OO
OOH
19O
O
19O
O
19
Hexenoyl DDMP 2-methylbutanoyl Cinnamoyl
Figure 5: Structures of substituents at C19 and C20 of oleanane skeleton (1). 19 and 20 indicate the position
of the oleanane skeleton at which substituent is attached. X represents both positions 19 and 20 of the
oleanane skeleton.
80

Saponin skeletons
(ii) Bridging
Certain substituents (Table 2) attached to skeleton (1) may react with each other, leading to the
formation of bridges. The substituents that can be involved in bridge formation are usually those at
C13, C18, C20 and C22. The most common bridging is that of C13-O-CH2-C18, which is formed
between a C13-OH and a C18-CH2OH (Pistelli et al., 1996; Ebata et al., 1996; Huang et al., 2000;
Sánchez-Contreras et al., 2000). Another example of an ether-linked bridge is C13-O-CH(OH)-C18
(Germonprez et al., 2004; Huang et al., 2000), which is formed by C13-OH and C18-CHO. Ester-
linked bridges also occur, such as C13-O-C(=O)-C18, which is formed by C13-OH and C18-COOH
(Ikuta & Morikawa, 1992; Yu et al., 1995; Marx Young et al., 1997; Gromova et al., 1998). It can
be seen from Table 2 that the hydroxyl group at C13 never occurs in a free form, but that it is
always engaged in a bridge with C18, either by an ether or an ester link (indicated by the solid
underlining). Substituents attached to C18 can also form bridges with other carbon atoms of the
oleanane skeleton, such as C18-CH2-O-CH(OH)-C22 (Lavaud et al., 1994), C18-C(=O)-O-C20
(Sakai et al., 1999), C18-C(=O)-O-C22 (Ouyang et al., 1996; Aquino et al., 2001), C18-CH2-O-
C(=O)-C22 (Yayli et al., 1998), and C18-C(=O)-CH2-C20 (Garai & Mahato, 1997). The latter is
probably formed by C18-COOH and C20=CH2. Bridging in the first ring has also been shown to
occur, C1-CH2-O-C5 is formed between C1-CH2OH and C5-OH (Sahu, 1996). Interestingly,
bridging only seems to occur in the class of Magnoliopsida, and not in the class of Liliopsida, which
seems to be consistent with the observation that the substituents of the latter have a lower degree of
oxidation.
(iii) Unsaturation
Unsaturation (double bonds) is usually a feature that results from the neutralization of a carbocation
by an elimination reaction (Figure 1). The fact that two double bonds can occur in skeleton (1)
saponins, indicates that additional desaturation reactions occur downstream the cyclization process.
The single and/or double unsaturation can exist at different positions in the skeleton. Therefore, the
double bonds were not indicated in the structures in Figure 3. Single unsaturation was found at
position C12-C13 (Larhsini et al., 2003; Voutquenne et al., 2003; Wandji et al., 2003;
Woldemichael et al., 2003), C13-C14 (He et al., 1996; Zhang et al., 1998; Cheng et al., 2002), C17-
C21 (Matsuda et al., 1997; Melek et al., 2002; Waffo-Téguo et al., 2004) and C13-C17 (Ouyang et
al., 1996), and probably reflects that the cyclases can differ in their mechanisms of facilitating
hydride shifts. Single unsaturation at position C12-C13 is the most common. Double unsaturations
were found at position C6-C7 and C12-C13 (Sahu, 1996), C5-C10 and C12-C13 (Sahu, 1996), C10-
81
Chapter 4
C11 and C12-C13 (Sahu, 1996; Marx Young et al., 1997), as well as C11-C12 and C13-C17
(Sánchez-Contreras et al., 2000; Melek et al., 2002).
Sugar chains attached to skeleton (1) saponins
Saponins belonging to the same skeletal group can have a huge variation in the number and type of
sugar residues attached. Table 3 summarises some features of the various sugar chains that can be
attached to different carbon atoms of skeleton (1). The number and type of sugar chains can vary
enormously, e.g., there are 17 different 2-residue sugar chains and 26 different 3-residue sugar
chains present in the Fabales alone. Therefore, the table only indicates the number of residues per
chain and the number of different chains of that particular length for the relevant carbon atoms, for
each plant order. Short sugar chains are usually attached at C2 and/or C18 and they have a length of
1-8 residues. There are a few cases in which sugar chains are attached at C1, C14, C19 and C20,
and these are short chains of 1 or 2 residues only. The sugar chain at C14 occurs only in the plant
order of Sapindales (Elgamal et al., 1995b), whereas the glycosylation at C19 (Mohamed et al.,
1995; Mbafor et al., 1997; Gu et al., 2002; Decroos et al., 2005) and C20 (Mahato et al., 1992b;
Woldemichael & Wink, 2002; Woldemichael et al., 2003) occur only in the Fabales. The sugar
attachment at C1 can be present in several plant orders, such as the Caryophyllales (Li et al., 1994a;
Elgamal et al., 1995a), Ebenales (Wandij et al., 2003), Celastales (Amimoto et al., 1993) and
Fabales (Oleszek et al., 1992). The Fabales contain the largest number of possible glycosylation
sites, at C1, C2, C18, C19 and C20.
Most of the saponins are monodesmosides or bidesmosides, which means that they contain either 1
or 2 sugar chains, respectively, at different carbon positions. There are 2 exceptions to this; an
alfalfa (Oleszek et al., 1992) and an Acacia auriculiformis saponin (Mahato et al., 1992b), which
are tridesmoside saponins. The sugar chains of skeleton (1) are often branched and can consist of up
to 8 sugar residues, commonly, glucose, arabinose, rhamnose, xylose and glucuronic acid
(Haralampidis et al., 2002). A few less common sugar residues are also found, such as apiose,
fucose, quinovose, allose and ribose (Table 3). Apiose and fucose are distributed in many plant
orders.
82
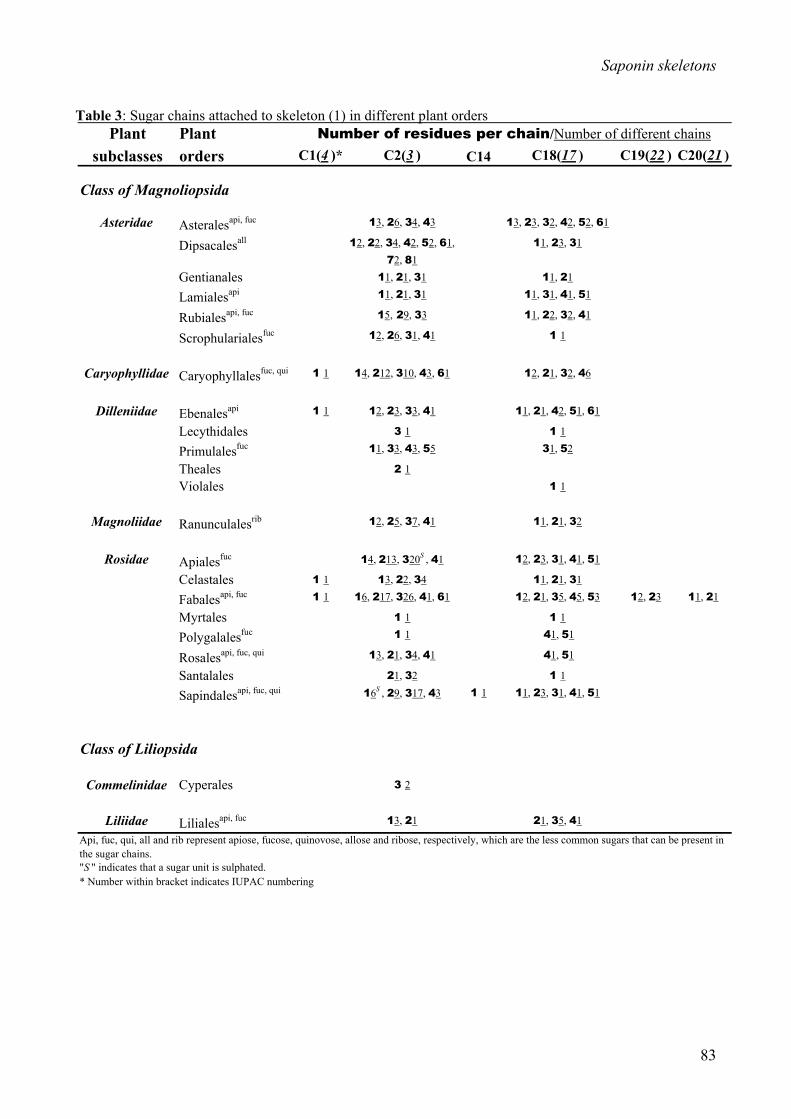
Saponin skeletons
Table 3: Sugar chains attached to skeleton (1) in different plant orders
Class of Magnolio
Class of Liliopsida
A
th"
*
Plant Plantsubclasses orders C1(4 )* C2(3 ) C14 C18(17 ) C19(22 ) C20(21 )
psida
Asteridae Asteralesapi, fuc 13, 26, 34, 43 13, 23, 32, 42, 52, 61
Dipsacalesall 12, 22, 34, 42, 52, 61, 72, 81
11, 23, 31
Gentianales 11, 21, 31 11, 21
Lamialesapi 11, 21, 31 11, 31, 41, 51
Rubialesapi, fuc 15, 29, 33 11, 22, 32, 41
Scrophularialesfuc 12, 26, 31, 41 1 1
Caryophyllidae Caryophyllalesfuc, qui 1 1 14, 212, 310, 43, 61 12, 21, 32, 46
Dilleniidae Ebenalesapi 1 1 12, 23, 33, 41 11, 21, 42, 51, 61
Lecythidales 3 1 1 1
Primulalesfuc 11, 33, 43, 55 31, 52
Theales 2 1Violales 1 1
Magnoliidae Ranunculalesrib 12, 25, 37, 41 11, 21, 32
Rosidae Apialesfuc 14, 213, 320S , 41 12, 23, 31, 41, 51
Celastales 1 1 13, 22, 34 11, 21, 31
Fabalesapi, fuc 1 1 16, 217, 326, 41, 61 12, 21, 35, 45, 53 12, 23 11, 21
Myrtales 1 1 1 1
Polygalalesfuc 1 1 41, 51
Rosalesapi, fuc, qui 13, 21, 34, 41 41, 51
Santalales 21, 32 1 1
Sapindalesapi, fuc, qui 16S , 29, 317, 43 1 1 11, 23, 31, 41, 51
Commelinidae Cyperales 3 2
Liliidae Lilialesapi, fuc 13, 21 21, 35, 41
pi, fuc, qui, all and rib represent apiose, fucose, quinovose, allose and ribose, respectively, which are the less common sugars that can be present ine sugar chains.
S " indicates that a sugar unit is sulphated.Number within bracket indicates IUPAC numbering
Number of residues per chain/Number of different chains
83
Chapter 4
Apiose is present in the Asterales (Su et al., 2001), Lamiales (Burger et al., 1998), Rubiales
(Gariboldi et al., 1990), Ebenales (Li et al., 1994b; Charrouf et al., 1992; Nicolas et al., 1995),
Fabales (Oleszek et al., 1992; Sakai et al., 1999), Rosales (Guo & Kenne, 2000; Guo et al., 2000;
Nyberg et al., 2000), Sapindales (Jayasinghe et al., 1995; Voutquenne et al., 2003) and Liliales
(Asada et al., 1994), whereas fucose is present in Asterales (Shao et al, 1995; Schöpke et al., 1995;
1996; 1997), Rubiales (Lamidi et al., 1995; Fang et al., 1995; He et al., 1996), Scrophulariales
(Klimek et al., 1992), Caryophyllales (Schröder et al., 1993; M’Bark et al., 1996; Sang et al.,
2000), Primulales (Zhang et al.,1998), Apiales (Ebata et al., 1996; Matsuda et al., 1997), Fabales
(Beutler et al., 1997), Polygalales (Kuroda et al., 2001; Yui et al., 2001), Rosales (Guo et al., 2000;
Nyberg et al., 2000), Sapindales (Lavaud et al., 1998) and Liliales (Asada et al., 1994). Quinovose,
on the other hand, is more order specific and is present in the Caryophyllales (Sanoko et al., 1999),
Rosales (De Tommasi et al., 1996) and Sapindales (Elgamal et al., 1995b; Pöllmann et al., 1997).
Allose and ribose are only present in 1 plant order, the Dipsacales (Baykal et al., 1998) and the
Ranunculales (Wang et al., 1997b), respectively.
The 3-residue sugar chains are the most diverse, with more than 100 different chains occurring in
all plant orders except the Theales (Lu et al., 2000), Violales (Dijoux et al., 1993), Myrtales (de
Carvalho et al., 1999) and Polygalales (Kuroda et al., 2001) (Table 3). The plant order of
Dipsacales shows the largest diversity in chain length, from 1 to 8 sugar residues, which are
attached at C2 (Ma et al., 1992). Theales, on the other hand, has only a 2-residue sugar chain at C2
and Violales has only a 1-residue sugar chain at C18. The class of Liliopsida seems to be less
diverse than that of Magnoliopsida with respect to glycosylation patterns. They generally have
shorter sugar chains and there is little variation in the type of sugar residues. It was observed that
most of the saponins that contain a 1-residue sugar chain at one carbon position usually have a
longer sugar chain at another position (Ouyang et al., 1997; Schöpke et al., 1997; Burger et al.,
1998; Shaker et al., 1999; Treyvaud et al., 2000; Kuroda et al., 2001; Woldemicheal & Wink,
2002). This might suggest that a short sugar chain needs to be compensated by a longer one in order
to keep saponin molecules water-soluble. However, this may not always be the case, as can be seen
from e.g., a saponin from Aphloia Madagascariensis, Violales (Dijoux et al., 1993), which has only a
sugar at C18, and a saponin from Margyricarpus setosus, Rosales (De Tommasi et al., 1996), which
has only a sugar at C2. Saponins from Zygophyllum species, Sapindales (Pöllmann et al., 1997) and
Lafoensia glyptocarpa, Myrtales (de Carvalho et al., 1999) have only a sugar at C2 and/or C18. It
was also noticed that sulphated sugar residues are usually present in short chains of 1 or 3 residues
84
Saponin skeletons
(Table 3). Most of the longer chains (4-8 residues) contain no glucuronic acid, whereas many of the
short chains (3 or less residues) contain glucuronic acid. These observations support the hypothesis
that charged sugar residues make saponins more water-soluble, and that their absence might be
compensated by longer sugar chains. Furthermore, it was observed that the longer sugar chains (4 to
8 residues) are plant order specific, with 1 exception, the sugar chain of
rha(1→3)xyl(1→4)rha(1→2)ara(1→18), which is present in 3 plant orders, Lamiales (Burger et al.,
1998), Rubiales (Gariboldi et al., 1990) and Ebenales (Li et al., 1994b; Sahu et al., 1997) (Table 3).
It has been reported that all saponins have a sugar chain attached to the C2 position of their
aglycones as a common feature (Haralampidis et al., 2002). This may be true for most saponins but
not for all, because e.g., the saponins from Acanthopanax spinosus (Miyakoshi et al., 1993),
Mussaenda pubescens (Zhao et al., 1996; 1997), Erythrina sigmoidea (Mbafor et al., 1997),
Vaccaria segetalis (Yun et al., 1998), Acanthopanax japonicus (Park et al., 2002) and Aphloia
Madagascariensis (Dijoux et al., 1993) do not have a sugar chain attached at C2.
Concluding remarks
By considering the biosynthetic origin of the various saponins and simplifying their structures by
omitting (part of the) substituents that were added after cyclization of oxidosqualene, we have been
able to attribute the various saponins that have been described in the literature to five main classes.
It was observed that saponin biosynthesis does not seem to be plant order specific, not only with
respect to the cyclization of oxidosqualene to the various skeletons, but also with respect to post-
cyclization events, such as decoration of the skeletons with various functional groups and (with a
few exceptions) glycosyl residues. However, a much clearer understanding of how the various
saponin structures relate to each other has been obtained, which was strengthened by our
observations that, within one main class, certain skeletons and their precursors consistently
appeared in the various plant orders. The five main classes of saponins established in this review
may serve as a stepping-stone for further classification of new saponins that will be isolated in the
future. It can also possibly assist in defining target genes in saponin biosynthesis studies for the
various cyclases, particularly for the many enzymes acting down-stream in the saponin biosynthesis
pathway.
85
Chapter 4
LITERATURE CITED
Abe, I.; Rohmer, M.; Prestwich, G. C. Enzymatic cyclization of squalene and oxidosqualene to sterols and
triterpenes. Chem. Rev., 1993, 93, 2189-2206.
Achenbach, H.; Hübner, H.; Brandt, W.; Reiter, M. Cardioactive steroid saponins and other constituents
from the aerial parts of Tribulus cistoides. Phytochemistry, 1994, 35(6), 1527-1543.
Achenbach, H.; Hübner, H.; Reiter, M. Cholestane- and pregnane-type glycosides from the roots of Tribulus
cistoides. Phytochemistry, 1996, 41(3), 907-917.
Agarwal, S. K.; Rastogi, R. P. Triterpenoid saponins and their genins. Phytochemistry, 1974, 13, 2623-2645.
Aoki, T.; Ohta, S.; Suga, T. Six novel secodammarane-type triterpenes from male flowers of Alnus japonica.
Phytochemistry, 1988, 27(9), 2915-2920.
Amimoto, K.; Yoshikawa, K.; Arihara, S. Triterpenes and triterpene glycosides from the leaves of Ilex
rotunda. Phytochemistry, 1993, 33(6), 1475-1480.
Aquino, R.; Tortora, S.; Fkih-Tetouani, S.; Capasso, A. Saponins from the roots of Zygophyllum gaetulum
and their effects on electrically-stimulated guinea-pig ileum. Phytochemistry, 2001, 56, 393-398.
Asada, Y.; Ikeno, M.; Furuya, T. Acylated saponins, masonosides A-C, from the corms of Crocosmia
masoniorum. Phytochemistry, 1994, 35(3), 757-764.
Attele, A. S.; Wu, J. A.; Yuan, C.-S. Ginseng Pharmacology. Multiple constituents and multiple actions.
Biochem. Pharmacology., 1999, 58, 1685-1693.
Baykal, T.; Panayir, T.; Tasdemir, D.; Sticher, O.; çalis, I. Triterpene saponins from Scabiosa rotate.
Phytochemistry, 1998, 48(5), 867-873.
Berhow, M.A.; Cantrell, C.L.; Duval, S.M.; Dobbins, T.A.; Maynes, J.; Vaughn, S.F. Analysis and
quantitative determination of group B saponins in processed soybean products. Phytochem. Anal.,
2002, 13, 343-348.
Beutler, J. A.; Kashman, Y.; Panell, L. K.; Cardellina II, J. H.; Alexander, M. R. A.; Balaschak, M. S.;
Prather, T. R.; shoemaker, R. H.; Boyd, M. R. Isolation and characterisation of novel cytotoxic
saponins from Archidendron ellipticum. Bioorg. Med. Chem., 1997, 5(8), 1509-1517.
Burger, I.; Burger, B. V.; Albrecht, C. F.; Spies, H. S. C.; Sándor, P. Triterpenoid saponins from Becium
grandiflorum var. obovatum. Phytochemistry, 1998, 49(7), 2087-2095.
Chakravarty, A. K.; Sarkar, T.; Masuda, K.; Shiojima, K.; Nakane, T.; Kawahara, N. Bacopaside I and II:
Two pseudojujubogenin glycosides from Bacopa monniera. Phytochemistry, 2001, 58, 553-556.
Charrouf, Z.; Wieruszeski, M.; Fkih-Tetouani, S.; Leroy, Y.; Charrouf, M.; Fournet, B. Triterpenoid
saponins from Argania spinosa. Phytochemistry, 1992, 31(6), 2079-2086.
Cheng, Z.; Yu, B.; Yang, X. 27-nor-triterpenoid glycosides from Mitragyna inermis. Phytochemistry, 2002,
61, 379-382.
86

Saponin skeletons
Choi, Y-H.; Hussain, R. A.; Pezzuto, J. M.; Kinghorn, A. D.; Morton, J. F. Abrusosides A-D, four novel
sweet-tasting triterpene glycosides from the leaves of Abrus precatorius. J. Nat. Prod., 1989, 52(5),
1118-1127.
Connolly, J. D.; Hill R. A. Triterpenoids. Nat. Prod. Rep., 2000, 17, 463-482.
Daveby, Y. D.; Aman, P.; Betz, J. M.; Musser, S. M. Effect of storage and extraction on ratio of soyasaponin
I to 2,3-Dihydro-2,5-dihydroxy-6-methyl-4-pyrone-conjugated soyasaponin I in dehulled peas (Pisum
sativum L). J. Sci. Food Agric., 1998, 78, 141-146.
Decroos, K.; Vincken, J.-P.; Heng, L.; Bakker, R.; Gruppen, H.; Verstraete, W. Simultaneous quantification
of differently glycosylated, acetylated, and 2,3-dihydro-2,5-dihydroxy-6-methyl-4H-pyran-4-one-
conjugated soyasaponins using reversed-phase high-performance liquid chromatography with
evaporative light scattering detection. J. Chromatogr. A, 2005, 1072, 185-193.
Debella, A.; Haslinger, E.; Schmid, M. G.; Bucar, F.; Michl, G.; Abebe, D.; Kunert, O. Triterpenoid saponins
and sapogenin lactones from Albizia gummifera. Phytochemistry, 2000, 53, 885-892.
De Carvalho, G. J. A.; De Carvalho, M. G.; Braz-Filho, R. A triterpenoid saponin isolated from Lafoensia
glyptocarpa. Phytochemistry, 1999, 52, 1617-1619.
De Tommasi, N.; Rastrelli, L.; Cumanda, J.; Speranza, G.; Pizza, C. Aryl and triterpenic glycosides from
Margyricarpus setosus. Phytochemistry, 1996, 42(1), 163-167.
Dijoux, M-G.; Lavaud, C.; Massiot, G.; Le Men-Olivier, L.; Sheeley, D. M. A saponin from leaves of
Aphloia Madagascariensis. Phytochemistry, 1993, 34(2), 497-499.
Dong, M.; Feng, X.; Wang, B.; Wu, L.; Ikejima, T. Two novel furostanol saponins from the rhizomes of
Dioscorea panthaica Prain et Burkill and their cytotoxic activity. Tetrahedron, 2001, 57, 501-506.
Ebata, N.; Nakajima, K.; Hayashi, K.; Okada, M.; Maruno, M. Saponins from the root of Bupleurum
falcatum. Phytochemistry, 1996, 41(3), 895-901.
Elgamal, M. H. A.; Soliman, H. S. M.; Karawya, M. S.; Mikhova, B.; Duddeck, H. Isolation of triterpene
saponins from Gypsophila capillaris. Phytochemistry, 1995a, 38(6), 1481-1485.
Elgamal, M. H. A.; Shaker, K. H.; Pöllmann, K.; Seifert, K. Triterpenoid saponins from Zygophyllum
species. Phytochemistry, 1995b, 40(4), 1233-1236.
Fang, S-Y.; He, Z-S.; Gao, J-H.; Wang, P. Triterpenoid glycosides from Adina rubella. Phytochemistry,
1995, 39(5), 1241-1243.
Garai, S.; Mahato, S. B. Isolation and structure elucidation of three triterpenoid saponins from Acacia
auriculiformis. Phytochemistry, 1997, 44(1), 137-140.
Gariboldi, P.; Verotta, L.; Gabetta, B. Saponins from Crossopteryx febrifuga. Phytochemistry, 1990, 29(8),
2629-2635.
Germonprez, N.; van Puyvelde, L.; Maes, L.; van Tri, M.; de Kimpe, N. New pentacyclic triterpene saponins
with strong anti-leishmanial activity from the leaves of Maesa balansae. Tetrahedron, 2004, 60, 219-
228.
87
Chapter 4
Gillis, C. N. Panax ginseng pharmacology: A nitric acid link? Biochem. Pharmacol., 1997, 54, 1-8.
Grenby, T. H. Intense sweeteners for the food industry: an overview. Trends Food Sci. Technol., 1991, Jan,
1-5.
Gromova, A. S.; Lutsky, V. I.; Semenov, A. A.; Li, D.; Owen, N. L. The elucidation of the structure of
thalicoside F, a minor oleanane glycoside from Thalictrum minus L. Phytochemistry, 1998, 47(3),
437-440.
Gu, L.; Tao, G.; Gu, W.; Prior, R. L. Determination of soysaponins in soy with LC-MS following structural
unification by partial alkaline degradation. J. Agri. Food Chem., 2002, 50, 6951-6959.
Guo, S.; Falk, E.; Kenne, L.; Rönnberg, B.; Sundquist, B. G. Triterpenoid saponins containing an acetylated
branched D-fucosyl residue from Quillaja saponaria Molina. Phytochemistry, 2000, 53, 861-868.
Guo, S; Kenne, L. Structural studies of triterpenoid saponins with new acyl components from Quillaja
saponaria Molina. Phytochemistry, 2000, 55, 419-428.
Haralampidis, K.; Trojanowska, M.; Osbourn, A. E. Biosynthesis of triterpenoid saponins in plants. Adv.
Biochem. Eng., 2002, 75, 31-49.
Hashimoto, Y.; Ishizone, H.; Ogura, M. Periandrin II and IV, triterpene glycosides from Periandra dulcis.
Phytochemistry, 1980, 19, 2411-2415.
Hashimoto, Y.; Ohta, Y.; Ishizone, H.; Kuriyama, M.; Ogura, M. Periandrin III, a novel sweet triterpene
glycosides from Periandra dulcis. Phytochemistry, 1982, 21(9), 2335-2337.
Hashimoto, Y.; Ishizone, H.; Suganuma, M.; Ogura, M.; Nakatsu, K.; Yoshioka, H. Periandrin I, a sweet
triterpene glycoside from Periandra dulcis. Phytochemistry, 1983, 22(1), 259-264.
He, Z.; Fang, S.; Wang, P.; Gao, J. 27-nor-triterpenoid glycosides from Adina rubella. Phytochemistry, 1996,
42(5), 1391-1393.
Heng, L.; van Koningsveld, G. A.; Gruppen, H.; van Boekel, M. J. A. S.; Vincken, J-P.; Roozen, J. P.;
Voragen, A. G.J. Protein-flavour interactions in relation to development of novel protein foods.
Trends Food Sci. Technol., 2004, 15, 217-224.
Heng, L.; Vincken, J-P.; Hoppe, K.; van Koningsveld, G. A.; Decroos, K.; Gruppen, H.; van Boekel, M. A. J.
S.; Voragen, A. G. J. Stability of pea DDMP saponin and the mechanism of its decomposition. J.
Agric. Food Chem., 2005a, (Submitted).
Heng, L.; Vincken, J-P.; van Koningsveld, G. A.; Legger, L.; Roozen, J. P; Gruppen, H.; van Boekel, M. A.
J. S.; Voragen, A. G. J. Bitterness of saponins and their contents in peas. J. Agric. Food Chem.,
2005b, (Submitted).
Hu, J.; Lee, S. O.; Hendrich, S.; Murphy, P. A. Quantification of the group B soyasaponins by high
performance liquid chromatography. J. Agric. Food Chem., 2002, 50, 2587-2594.
Huang, J.; Ogihara, Y.; Zhang, H.; Shimizu, N.; Takeda, T. Triterpenoid saponins from Ardisia mamillata.
Phytochemistry, 2000, 54, 817-822.
88

Saponin skeletons
Ikuta, A; Morikawa, A.; Kubota, K. A saponin from callus tissue of Stauntonia hexaphylla. Phytochemistry,
1991, 30(7), 2425-2427.
Ikuta, A; Morikawa, A. Triterpenes from Stauntonia hexaphylla callus tissues. J. Nat. prod., 1992, 55(9),
1230-1233.
Jain, P.; Kulshreshtha, D. K. Bacoside A1, a minor saponin from Bacopa monniera. Phytochemistry, 1993,
33(2), 449-451.
Jayasinghe, L.; Shimada, H.; Hara, N.; Fujimoto, Y. Hederagenin glycosides from Pometia eximia.
Phytochemistry, 1995, 40(3), 891-897.
Kennelly ,E. J.; Cai, L.; Long, L.; Shamon, L.; Zaw, K.; Zhou, B-N.; Pezzuto, J. M.; Kinghorn, A. D. Novel
highly sweet secodammarane glycosides from Pterocarya paliurus. J. Agric. Food Chem., 1995, 43,
2602-2607.
Kennelly ,E. J.; Cai, L.; Kim, N-C.; Kinghorn, A. D. Abrusoside E, a further sweet-tasting cycloartane
glycosides from the leaves of Abrus precatorius. Phytochemistry, 1996, 41(5), 1381-1383.
Kitagawa, I. Licorice root. A natural sweetener and an important ingredient in Chinese medicine. Pure Appl.
Chem., 2002, 74(7), 1189-1198.
Klimek, B.; Lavaud, C.; Massiot, G. Saponins from Verbascum nigrum. Phytochemistry, 1992, 31(12), 4368-
4370.
Kuroda, M.; Mimaki, Y.; Sashida, Y.; Kitahara, M.; Yamazaki, M.; Yui, S. Securiosides A and B, novel
acylated triterpene bisdesmosides with selective cytotoxic activity against M-CSF-stimulated
macrophages. Bioorg. Med. Chem. Lett., 2001, 11, 371-374.
Lamidi, M.; Ollivier, R.; Faure, R.; Debrauwer, L.; Nze-Ekekand, L.; Balansard, G. Quinovic acid
glycosides from Nauclea diderrichii. Phytochemistry, 1995, 38(1), 209-212.
Larhsini, M.; Marston, A.; Hostettmann, K. Triterpenoid saponins from the roots of Silene cucubalus.
Fitoterapia, 2003, 74, 237-241.
Lasztity, R.; Hidvegi, M.; Bata, A. Saponins in Food. Food Rev. Int., 1998, 14(4), 371-390.
Lavaud, C.; Massiot, G.; Men-Olivier, L.; Viari, A.; Vigny, P.; Delaude, C. Saponins from Steganotaenia
araliacea. Phytochemistry, 1992, 31(9), 3177-3181.
Lavaud, C.; Massiot, G.; Barrera, J. B.; Moretti, C.; Le Men-Olivier, L. Triterpenoid saponins from Myrsine
pellucida. Phytochemistry, 1994, 37(6), 1671-1677.
Lavaud, C.; Voutquenne, L.; Massiot, G.; Le Men-Olivier, L.; Das, B. C.; Laprévote, O.; Serani, L.;
Delaude, C.; Becchi, M. Saponins from the stem bark of Filicium decipiens. Phytochemistry, 1998,
47(3), 441-449.
Li, H-Y.; Koike, K.; Ohmoto, T. Triterpenoid saponins from Dianthus chinensis. Phytochemistry, 1994a,
35(3), 751-756.
Li, X-C.; Liu, Y-Q.; Wang, D-Z.; Yang, C-R.; Nigam, S. K.; Misra, G. Triterpenoid saponins from Madhuca
butyracea. Phytochemistry, 1994b, 37(3), 827-829.
89

Chapter 4
Lu, Y.; Umeda, T.; Yagi, A.; Sakata, K.; Chaudhuri, T.; Ganguly, D. K.; Sarma, S. Triterpenoid saponins
from the roots of tea plant (Camellia sinensis var. assamica). Phytochemistry, 2000, 53, 941-946.
Ma, W-G.; Wang, D-Z.; Zeng, Y-L.; Yang, C-R. Triterpenoid saponins from Triplostegia grandiflora.
Phytochemistry, 1992, 31(4), 1343-1347.
Mahato, S. B.; Sarkar, S. K.; Poddar, G. Review article number 38. Triterpenoid saponins. Phytochemistry,
1988, 27(10), 3037-3067.
Mahato, S. B.; Nandy, A. K. Review article number 60. Triterpenoid saponins discovered between 1987 and
1989. Phytochemistry, 1991, 30(5), 1357-1390.
Mahato, S. B.; Nandy, A. K.; Roy, G. Review article number 67. Triterpenoids. Phytochemistry, 1992a,
31(7), 2199-2249.
Mahato, S. B.; Pal, B. C.; Nandy, A. K. Structure elucidation of two acylated triterpenoid bisglycosides from
Acacia auriculiformis cunn. Tetrahedron, 1992b, 48(32), 6717-6728.
Mahato, S. B.; Sen, S. Review article number 118. Advances in triterpenoid research, 1990-1994.
Phytochemistry, 1997, 44(7), 1185-1236.
Mahato, S. B.; Garai, S.; Chakravarty, A. K. Bacopasaponins E and F: Two jujubogenin bisdesmosides from
Bacopa monniera. Phytochemistry, 2000, 53, 711-714.
Marx Young, M. C.; Potomati, A.; Chu, E. P.; Haraguchi, M.; Yamamoto, M.; Kawano, T. 13C NMR
analysis of monodesmosidic saponins from Gomphrena macrocephala. Phytochemistry, 1997, 46(7),
1267-1270.
Massiot, G.; Dijoux, G. M.; Lavaud, C. Saponins and artifacts. In Saponins Used in Food and Agriculture,
Waller G. R., Yamasaki, K., Eds,; Plenum Press: New York, 1996; pp 183-192.
Matsuda, H.; Murakami, T.; Ninomiya, K.; Inadzuki, M.; Yoshikawa, M. New hepatoprotective saponins,
bupleurosides III, VI, IX and XIII, from Chinese Bupleuri radix: Structure-requirements for the
cytoprotective activity in primary cultured rat hepatocytes. Bioorganic & Medicinal Chem. Letters,
1997, 7(17), 2193-2198.
Mbafor, J. T.; Ndom, J-C.; Fomum, Z. T. Triterpenoid saponins from Erythrina sigmoidea. Phytochemistry,
1997, 44(6), 1151-1155.
M’Bark, A. N.; Guillaume, D.; Kol, O.; Charrouf, Z. Triterpenoid saponins from Herniaria fontanesii.
Phytochemistry, 1996, 43(5), 1075-1077.
Melek, F. R.; Miyase, T.; Abdel-Khalik, S. M.; Hetta, M. H.; Mahmoud, I. I. Triterpenoid saponins from
Oreopanax guatemalensis. Phytochemistry, 2002, 60, 185-195.
Meselhy, M. R. Hopane-type saponins from Polycarpon succulentum-II. Phytochemistry, 1998, 48(8), 1415-
1421.
Mimaki, Y.; Nakamura, O.; Sashida, Y.; Nikaido, T; Ohmoto, T. Steroidal saponins from the bulbs of
Triteleia lactea and their inhibitory activity on cyclic AMP phosphodiesterase. Phytochemistry, 1995,
38(5), 1279-1286.
90

Saponin skeletons
Mimaki, Y.; Takaashi, Y.; Kuroda, M.; Sashida, Y. Steroidal glucosides from leaves of Cordyline stricta.
Phytochemistry, 1997, 45(6), 1229-1234.
Mimaki, Y.; Satou, T.; Kuroda, M.; Sashida, Y.; Hatakeyama, Y. Steroidal saponins from the bulbs of Lilium
candidum. Phytochemistry, 1999, 51, 567-573.
Miyakoshi, M.; Ida, Y.; Isoda, S.; Shoji, J. 3α-hydroxy-oleanane-type triterpene glycosyl esters from leaves
of Acanthopanax spinosus. Phytochemistry, 1993, 34(6), 1599-1602.
Miyakoshi, M.; Isoda, S.; Sato, H.; Hirai, Y.; Shoji, J.; Ida, Y. 3α-hydroxy-oleanane-type triterpene glycosyl
esters from leaves of Acanthopanax spinosus. Phytochemistry, 1997, 46(7), 1255-1259.
Mohamed, K. M.; Ohtani, K.; Kasai, R.; Yamasaki, K. Oleanene glycosides from seeds of Trifolium
alexandrinum. Phytochemistry, 1995, 40(4), 1237-1242.
Nicolas, G.; Oulad-Ali, A.; Guillaume, D.; Lobstein, A.; Weniger, B.; Anton, R. Triterpenoid saponins from
the roots of Sideroxylon foetidissimum. Phytochemistry, 1995, 38(1), 225-228.
Nyberg, N. T.; Kenne, L.; Rönnberg, B.; Sundquist, B. G. Separation and structural analysis of some
saponins from Quillaja saponaria Molina. Carbohydr. Res., 2000, 323, 87-97.
Okubo, K.; Yoshiki, Y. Oxygen-radical-scavenging activity of DDMP-conjugated saponins and
physiological role in leguminous plant. In Saponins Used in Food and Agriculture, Waller G. R.,
Yamasaki, K., Eds,; Plenum Press: New York, 1996; pp 141-154.
Oleszek, W.; Jurzysta, M.; Ploszynski, M.; Colquhoun, I. J.; Price, K. R.; Fenwick, G. R. Zahnic acid
tridesmoside and other dominant saponins from alfalfa (Medicago sativa L.) aerial parts. J. Agric.
Food Chem., 1992, 40, 191-196.
Oleszek, W. A. Chromatographic determination of plant saponins. J. Chrom A., 2002, 967, 147-162.
Onning, G.; Asp, N-G.; Sivik, B. Saponin content in different oat varieties and in different fractions of oat
grain. Food Chem., 1993a, 48, 251-254.
Onning, G.; Asp, N-G. Analysis of saponins in oat kernels. Food Chem., 1993b, 48, 301-305.
Oulad-Ali, A.; Guillaume, D.; Weniger, B.; Jiang, Y.; Anton, R. Mabiosides C-E: Triterpenoid saponins
from the bark of Colubrina elliptica. Phytochemistry, 1994, 36(2), 445-448.
Ouyang, M.; Wang, H.; Chen, Z.; Yang, C. Triterpenoid glycosides from Ilex kudincha. Phytochemistry,
1996, 43(2), 443-445.
Ouyang, M.; Wang, H.; Liu, Y.; Yang, C. Triterpenoid saponins from the leaves of Ilex Latifolia.
Phytochemistry, 1997, 45(7), 1501-1505.
Park, M. K.; Park, H. J.; Han, S. B.; Shin, Y. G.; Park, I. H. High performance liquid chromatographic
analysis of ginseng saponins using evaporative light scattering detection. J. Chromatogr. A., 1996,
736, 77-81.
Park, S-Y.; Chang, S-Y.; Oh, O-J.; Yook, C-S.; Nohara, T. nor-oleanene type triterpene glycosides from the
leaves of Acanthopanax japonicus. Phytochemistry, 2002, 59, 379-384.
91
Chapter 4
Pires, V. S.; Taketa, A. T. C.; Gosmann, G.; Schenkel, E. P. Saponins and sapogenins from Brachiaria
decumbens Stapf. J. Braz. Chem. Soc., 2002, 13(2), 135-139.
Pistelli, L.; Bertoli, A.; Bilia, A. R.; Morelli, I. Minor constituents from Bupleurum fruticosum roots.
Phytochemistry, 1996, 41(6), 1579-1582.
Pistelli, L.; Pardossi, S.; Bertoli, A.; Potenza, D. Cicloastragenol glycosides from Astragalus verrucosus.
Phytochemistry, 1998, 49(8), 2467-2471.
Petit, P. R.; Sauvaire, Y. D.; Hillaire-Buys, D. M.; Leconte, O. M.; Baissac, Y. G.; Posin, G.R.; Ribes, G. R.
Steroid saponins from fenugreek seeds: Extraction, purification, and pharmacological investigation on
feeding behaviour and plasma cholesterol. Steroids, 1995, 60, 674-680.
Pöllmann, K.; Gagel, S.; Elgamal, M. H. A.; Shaker, K. H.; Seifert, K. Triterpenoid saponins from the roots
of Zygophyllum species. Phytochemistry, 1997, 44(3), 485-489.
Price, K. R.; Johnson, I. T.; Fenwick, G. R. The chemistry and biological significance of saponins in foods
and feedstuffs. Crit. Rev. Food Sci. Nutr., 1987, 26(1), 27-135.
Rastogi, S; Pal, R; Kulshreshtha, D. K. Bacoside A3-A triterpenoid saponin from Bacopa monniera.
Phytochemistry, 1994, 36(1), 133-137.
Ruiz, R. G.; Price, K. R.; Rose, M. E.; Fenwick, G. R. Effect of seed size and testa colour on saponin content
of Spanish lentil seed. Food Chem., 1997, 58(3), 223-226.
Sahpaz, S.; Gupta, P. M.; Hostettmann, K. Triterpene saponins from Randia Formosa. Phytochemistry, 2000,
54, 77-84.
Sahu, N. P. Triterpenoid saponins of Mimusops elengi. Phytochemistry, 1996, 41(3), 883-886.
Sahu, N. P.; Koike, K.; Jia, Z.; Nikaido, T. Triterpenoid saponins from Mimusops elengi. Phytochemistry,
1997, 44(6), 1145-1149.
Sakai, K.; Nagao, T.; Okabe, H. Triterpenoid saponins from the ground part of Aster ageratoides var. ovatus.
Phytochemistry, 1999, 51, 309-318.
Sánchez-Contreras, S.; Díaz-Lanza, A. M.; Bartolomé, C.; Bernabé, M. Minor sulphated saikosaponins from
the aerial parts of Bupleurum rigidum L. Phytochemistry, 2000, 54, 783-789.
Sang, S.; Lao, A.; Leng, Y.; Gu, Z.; Chen, Z.; Uzawa, J.; Fujimoto, Y. Segetoside F a new triterpenoid
saponin with inhibition of luteal cell from the seeds of Vaccaria segetalis. Tetrahedron lett., 2000, 41,
9205-9207.
Sanoko, R.; Speranza, G.; Pizza, C.; De Tommasi, N. Triterpene saponins from Alternanthera repens.
Phytochemistry, 1999, 51, 1043-1047.
Shao, Y.; Zhou, B.; Wu, H.; Lin, L.; Cordell, G. A. Medicagenic acid saponins from Aster batangensis.
Phytochemistry, 1995, 39(4), 875-881.
Schöpke, T.; Al-Tawaha, C.; Wray, V.; Nimtz, M.; Meyer, A.; Hiller, K. Triterpenoid saponins from aerial
parts of Aster bellidiastrum. Phytochemistry, 1995, 40(5), 1489-1492.
92

Saponin skeletons
Schöpke, T.; Wray, V.; Nimtz, M.; Hiller, K. Triterpenoid saponins from Aster bellidiastrum. Structures of
the minor deacylsaponins. Phytochemistry, 1996, 41(5), 1399-1403.
Schöpke, T.; Al-Tawaha, C.; Wray, V.; Nimtz, M.; Hiller, K. Triterpenoid saponins from Aster
bellidiastrum. Phytochemistry, 1997, 45(1), 125-132.
Schröder, H.; Schubert-Zsilavecz, M.; Reznicek, G.; Cart, J.; Jurenitsch, J.; Hasilinger, E. A triterpene
saponin from Herniaria glabra. Phytochemistry, 1993, 34(6), 1609-1613.
Shaker. K. H.; Bernhardt, M.; Elgamal, M. H. A.; Seifert, K. Triterpenoid saponins from Fagonia indica.
Phytochemistry, 1999, 51, 1049-1053.
Shirane, N.; Hashimoto, Y.; Ueda, K.; Takenaka, H.; Katoh, K. Ring-A cleavage of 3-oxo-olean-12-en-28-
oic acid by the fungus Chaetomium longirostre. Phytochemistry, 1996, 43(1), 99-104.
Shirasuna, K.; Miyakoshi, M.; Mimoto, S.; Isoda, S.; Satoh, Y.; Hirai, Y.; Ida, Y.; Shoji, J. Lupane
triterpenoid glycosyl esters from leaves of Acanthopanax divaricatus. Phytochemistry, 1997, 45(3),
579-584.
Sparg, S. G.; Light, M. E.; van Staden, J. Biological activities and distribution of plant saponins. J.
Ethnopharmacology, 2004, 94, 219-243.
Su, Y.; Koike, K.; Guo, D.; Satou, T.; Liu, J.; Zheng, J.; Nikaido, T. New apiose-containing triterpenoid
saponins from Conya blinii. Tetrahedron, 2001, 57, 6721-6726.
Sun, R.; Chen, J. Saponins from Oxytropis bicolour. Phytochemistry, 1997, 44(3), 505-507.
Suttisri, R.; Chung, M-S.; Kinghorn, A. D.; Sticher, O.; Hashimoto, Y. Periandrin V, a further sweet
triterpene glycoside from Periandra dulcis. Phytochemistry, 1993, 34(2), 405-408.
Tan, N.; Zhou, J.; Zhao, S. Advances in structural elucidation of glucuronide oleanane-type triterpene
carboxylic acid 3, 28-O-bisdesmosides (1962-1997). Phytochemistry, 1999, 52, 153-192.
Treyvaud, V.; Marston, A.; Dyatmiko, W.; Hostettmann, K. Molluscicidal saponins from Phytolacca
icosandra. Phytochemistry, 2000, 55, 603-609.
Uddin Ahmad, V.; Khaliq-uz-Zaman, S. M.; Shameel, S.; Perveen, S.; Ali, Z. Steroidal saponins from
Asparagus dumosus. Phytochemistry, 1998, 50, 481-484.
Uematsu, Y.; Hirata, K.; Saito, K. Spectrophotometric determination of saponin in Yucca extract used as
food additive. J. AOAC int., 2000, 83(6), 1451-1454.
Verotta, L.; Tatò, M.; El-Sebakhy, N. A.; Toaima, S. M. Cycloartane triterpene glycosides from Astragalus
sieberi. Phytochemistry, 1998, 48(8), 1403-1409.
Verotta, L.; Guerrini, M.; El-Sebakhy, N. A.; Asaad A. M.; Toaima, S. M.; Abou-Sheer, M. E.; Luo, Y-D.;
Pezzuto, J. M. Cycloartane saponins from Astragalus peregrinus as modulators of lymphocyte
proliferation. Fitoterapia, 2001, 72, 894-905.
Voutquenne, L.; Guinot, P.; Thoison, O.; Sevenet, T.; Lavaud, C. Oleanolic glycosides from Pometia ridleyi.
Phytochemistry, 2003, 64, 781-789.
93

Chapter 4
94
Waffo-Téguo, P.; Voutquenne, L.; Thoison, O.; Dumontet, V.; Nguyen, V. H.; Lavaud, C. Acetylated
glucuronide triterpene bidesmosidic saponins from Symplocos glomerata. Phytochemistry, 2004, 65,
741-750.
Wandji, J.; Tillequin, F.; Mulholland, D. A.; Chi Shirri, J.; Tsabang, N.; Seguin, E.; Verite, P.; Libot, F.;
Fomum, Z.T. Pentacyclic triterpenoid and saponins from Gambeya boukokoensis. Phytochemistry,
2003, 64, 845-849.
Wang, Y.; Ohtani, K.; Kasia, R.; Yamasaki, K. Steroidal saponins from fruits of Tribulus terrestris.
Phytochemistry, 1997a, 45 (4), 811-817.
Wang, M-K.; Wu, F-E, Chen, Y-Z. Triterpene saponins from Anemone hupehensis. Phytochemistry, 1997b,
44(2), 333-335.
Wendt, K.U.; Schulz, G. E.; Corey, E. J.; Liu, D. R. Enzyme mechanisms for polycyclic triterpene formation.
Angew. Chem.Int. Ed., 2000, 39, 2812-2833.
Woldemichael, G. M.; Wink, M. Triterpene glycosides of Lupinus angustifolius. Phytochemistry, 2002, 60,
323-327.
Woldemichael, G. M.; Montenegro, G.; Timmermann, B. N. Triterpenoidal lupin saponins from the Chilean
legume Lupinus oreophilus Phil. Phytochemistry, 2003, 63, 853-857.
Xu, R.; Fazio, G. C.; Matsuda, P. T. On the origins of triterpenoid skeletal diversity. Phytochemistry, 2004,
65, 261-291.
Yayli, N.; Baltaci, C.; Zengin, A.; Kuçukislamoglu, M.; Genc, H. A triterpenoid saponin from Cyclamen
coum. Phytochemistry, 1998, 48(5), 881-884.
Yu, S, S.; Yu, D. Q.; Liang, X. T. Triterpenoid saponins from the bark of Nothopanax davidii.
Phytochemistry, 1995, 38(3), 695-698.
Yui, S.; Ubukata, K.; Hodono, K.; Kitahara, M.; Mimaki, Y.; Kuroda, M.; Sashida, Y.; Yamazaki, M.
Macrophage-oriented cytotoxic activity of novel triterpene saponins extracted from roots of
Securidaca inappendiculata. Int. Immunol., 2001, 1, 1989-2000.
Yun, Y. S.; Shimizu, K.; Morita, H.; Takeya, K.; Itokawa, H.; Shirota, O. Triterpenoid saponin from
Vaccaria segetalis. Phytochemistry, 1998, 47(1), 143-144.
Zhang, D.; Miyase, T.; Kuroyanagi, M.; Umehara, K.; Noguchi, H. Polygalasaponins XLII-XLVI from roots
of Polygala glomerata. Phytochemistry, 1998, 47(3), 459-466.
Zhao, W.; Xu, R.; Qin, G.; Vaisar, T.; Lee, M. S. Saponins from Mussaenda pubescens. Phytochemistry,
1996, 42(4), 1131-1134.
Zhao, W.; Wolfender, J-L.; Hostettmann, K.; Cheng, K.; Xu, R.; Qin, G. Triterpenes and triterpenoid
saponins from Mussaenda pubescens. Phytochemistry, 1997, 45(5), 1073-1078.
Zheng, Q; Zhang, Y; Li, H; Yang, C. Steroidal saponins from fresh stem of Dracaena cochinchinensis.
Steroids, 2004, 69, 111-119.

Chapter 5
Presence and release of volatile organic
compounds from various pea protein preparations
(Pisum sativum L)

Chapter 5
ABSTRACT
The volatile organic compounds (VOCs) such as aldehydes, ketones and alcohols released from pea
flour, protein isolate, legumin and vicilin at pH 8, were identified and quantified using dynamic
headspace, gas chromatography (GC) and GC-mass spectrometry. This study gives an overview of
the amount and type of VOCs present in pea flour and its protein preparations. The VOCs released
differed in concentration between the various protein preparations. Hexanal was the major VOC
released from pea flour and the protein isolate, whereas 2-ethyl-1-hexanol was the major VOC
released from the legumin and vicilin preparations. In addition to pH, protein purification had a
large effect on the amount and type of VOCs released. The presence of various VOCs in the various
preparations can be largely explained by their log P values; their high extractability with aqueous
solvents at low log P and their enrichment in the purified fractions at high log P.
KEYWORDS: Pea flour, volatile organic compound(s), protein isolate, legumin, vicilin,
purification, pH, log P
96

Volatile organic compounds in pea protein preparations
INTRODUCTION
Proteins from plant sources, such as pea proteins, are well suited to be used as ingredients to
formulate new food products, e.g. Novel Protein Foods (NPFs) (Davies & Lightowler, 1998; Zhu et
al., 2004). The use of plant protein ingredients may cause modifications in the overall flavour
perception, by reducing the aroma compound intensities or via their endogenous flavours (Plug &
Haring, 1993; 1994).
Peas are generally regarded as a good source of protein because of their relatively high protein
content (Reichert & MacKenzie, 1982). Pea protein consists mainly of the salt-extractable globulins
(legumin and vicilin), which account for 65-80% of the extractable proteins (Derbyshire et al.,
1976). Pea legumin is a protein of ~60 kDa that consists of a basic 20 kDa and an acidic 40 kDa
polypeptide linked together by a disulphide bridge. It assembles as a hexamer (360 kDa) at pH 7-9
(Guéguen et al., 1988). Vicilin is a protein of ~50 kDa which assembles into a trimer in vivo
(Gatehouse et al., 1981). Pea proteins, like other legume proteins, may be used as a crude meal, a
protein concentrate or a protein isolate. The fractionation steps to prepare these protein
preparations, e.g. aqueous extraction and precipitation at acidic pH, may cause the removal or
enrichment of certain volatile organic compounds (VOCs). The binding of diacetyl to pea proteins,
for example, was observed to decrease with decreasing pH within the range of 9 to 2 (Dumont &
Land, 1986). Proteins such as caseins, bovine serum albumin and β-lactoglobulin, have also been
shown to adsorb less VOCs at acidic pH than at basic pH (Druaux et al., 1995; Le Thanh et al.,
1992; Andriot et al., 1999; Rogacheva et al., 1999). These studies thus show that treatments such as
pH changes may have a significant influence on the adsorption of VOCs to proteins.
Many VOCs have been identified in peas (Pisum sativum L), which include several groups of
potential flavour compounds such as alcohols, aldehydes, ketones and esters (Murray et al., 1976;
Jakobsen et al., 1998). Identification and quantification of the types of VOCs in pea flour and
protein preparations at various pHs is, therefore, of significant importance for the utilisation of pea-
derived materials as food ingredients. However, up till now, such information is lacking.
The aim of this study was to identify and quantify the release of VOCs from the various protein
preparations and to study the effect of pH and degree of purification on the release of these VOCs.
97
Chapter 5
MATERIALS AND METHODS
Protein purification
Dried de-hulled split green peas (Pisum sativum L, Solara spp.) that were grown commercially in
the Netherlands were supplied by Cebeco (Vlijmen, The Netherlands). Legumin and vicilin were
purified using a procedure designed from the methods of Thomson et al. (1978), Koyoro & Powers
(1987) and Bora et al. (1994). The steps involved in the purification process include extraction,
precipitation and anion exchange chromatography (Figure 1). Green peas were milled in a
commercial blender (Waring, New Hartford, Connecticut, U.S.A.) in a ratio 1:1 with dry ice (w/w),
to avoid possible heat denaturation of the proteins. Legumin and vicilin extract was obtained by
extracting pea flour with 100 mM Tris-HCl buffer (1:10 (w/v)) pH 8 for 2 h at room temperature.
This crude protein extract was centrifuged at 12,300 x g at 10 oC for 30 min. The supernatant
collected was precipitated at pH 4.8 after adjusting the pH with 1 M HCl, to isolate the globulins.
The precipitated protein isolate was collected after centrifugation at 36,000 x g at 4 °C for 25 min.
The protein pellet (protein isolate) was washed with water (pellet to water ratio 1:10 (w/v)) to
remove any of the water-soluble albumins, followed by centrifuging at 36,000 x g at 4 °C for 25
min. The protein isolate collected was then suspended in 100 mM Tris-HCl buffer at pH 8.0 (1:20
(w/v)) with continuous stirring for 2 h followed by centrifugation at 36,000 x g at 4 °C for 25 min.
The supernatant obtained was dialysed at 4 °C against McIlvaine buffer at pH 4.8 (0.2 M Na2HPO4
+ 0.1 M citric acid) containing 0.2 M NaCl (supernatant to buffer ratio of 1:20 (v/v)). The dialysis
buffer was changed three times over a period of 24 h. This yielded a protein-rich precipitate. After
the 24 h period, the dialysed sample was centrifuged at 36,000 x g at 4 °C for 25 min to separate the
precipitated protein from the supernatant. The precipitated protein was freeze-dried and was
referred to as ‘protein enriched fraction’. The protein enriched fraction was re-dissolved by stirring
for 2 h in 35 mM potassium phosphate buffer, pH 7.6, containing 0.075 mM NaCl (buffer A), at a
protein concentration of 25 mg/mL, followed by centrifugation at 36,000 x g, at 4 °C for 25 min.
The supernatant collected after centrifugation was filtered through a membrane filter with a pore
size of 0.2 µm (Schleicher & Schuell, Keene, NH, USA). A DEAE Sepharose Fast Flow column
(10 x 15 cm; Pharmacia Biotech, Uppsala, Sweden) previously rinsed with 6 volumes of millipore
water (~1.8 L), followed by 6 volumes of buffer A, was used for purifying the supernatant.
Approximately 1200 mL of the filtered supernatant was applied onto the DEAE column at a flow
rate of 15 mL/min, followed by rinsing with 1 volume of buffer A. Elution was performed with a
linear salt gradient of 0.075-0.5 M NaCl over 6 column volumes at a flow rate of 30 mL/min.
98

Volatile organic compounds in pea protein preparations
Extraction (pH 8)
Precipitation (pH 4.8)
Resolubilisation
Precipitation (pH 4.8)
Anion-exchange Chromatography (pH 8)
Pea flour
Protein isolate
Legumin Vicilin
Protein enriched fraction
Figure 1: Flowchart of legumin and vicilin purification
Using UV detection at 280 nm, 15 mL fractions were collected and appropriate fractions were
subsequently analysed with SDS-PAGE (Bio-Rad ready gel, 10-20% Tris-HCl, Coomassie blue
staining). Fractions containing only vicilin or legumin were pooled. The 2 pools of fractions
obtained were dialysed against distilled water, freeze-dried and stored at –20 °C. These freeze-dried
materials (legumin and vicilin) were used for the preparation of protein solutions. The protein
concentrations of legumin and vicilin solutions (0.1% w/v) were determined using the Bradford
protein assay (Bradford, 1976) using bovine serum albumin (BSA) (Sigma Aldrich, Steinheim,
Germany) as a standard.
Dynamic headspace sampling (purge and trap)
Dynamic headspace sampling was used for the collection of headspace VOCs from the pea flour,
crude protein isolate, legumin and vicilin dispersions. Dry samples (100 mg) of de-hulled pea flour,
crude protein isolate, legumin or vicilin were dispersed in 10 mL of McIlvaine buffer (0.2 M
Na2HPO4 + 0.1 M citric acid) at pH 4 (only pea flour) or pH 8 followed by the addition of 200 µL
99

Chapter 5
of 3.5% (v/v) of an anti-foaming agent (silicon SAG 30; A. Smit & Zoon b.v., Weesp, The
Netherlands) to prevent foaming of protein solution during purging. These mixtures were
subsequently stirred for 12 h in an airtight glass vessel at 4 oC to ensure complete sample hydration.
Dynamic headspace sampling was performed with the sample in the vessel, at 37 oC in a water bath
for 1 h with constant purging of nitrogen gas at a flow rate of 45 mL/min. VOCs released from the
samples were entrapped on 0.1 g Tenax TA (poly-2,6-diphenyl-p-phenylene oxide), 35/60 mesh
(Alltech Nederland b.v., Zwijndrecht, The Netherlands) in a glass tube (3 x 100 mm).
Analysis of volatiles
VOCs entrapped in the Tenax tube were analysed by thermal desorption (245 oC, 5 min) followed
by cold trap (-120 oC) and subsequent evaporation (240 oC) using a Carlo Erba TDAS 5000 device
(Interscience b.v., Breda, The Netherlands). The components were analysed by gas chromatography
(GC) on a Supelcowax 10 capillary column (Supelco Inc., Bellefonte, PA) (60 m long, 0.25 mm i.d.
and 0.25 µm film thickness) using a Carlo Erba MEGA 5300 gas chromatograph (Interscience b.v.,
Breda, The Netherlands) equipped with a flame ionisation detector (FID) heated at 275 oC. The
oven temperature programme started at 40 oC (4 min hold), followed by heating to 92 oC at a rate of
2 oC/min, and then heating to 272 oC at a rate of 6 oC/min with a final hold of 5 min at 272 oC.
Identification of VOCs was performed by gas chromatography-mass spectrometry (GC-MS) using a
Varian 3400-Finnigan MAT 95 instrument equipped with a thermal desorption/cold trap device
(TCT injector 16200, Chrompack). Mass spectra were recorded at an electron impact ionisation
mode of 70 eV and a scan of m/z = 24 to 300 sec/decade with a cycle time of 0.97 sec. GC
conditions for GC-MS were the same as in GC-FID analysis. Identification of compounds was done
on the basis of an MS database and by comparison of retention times.
100

Volatile organic compounds in pea protein preparations
RESULTS
Table 1 and Table 2 show the volatile organic compounds (VOCs) released from pea flour at pH 4
and pH 8, and from several pea protein preparations at pH 8. The VOCs were classified into 4
groups. The first three groups of compounds, aldehydes, ketones and alcohols, are commonly found
in green peas (Murray et al., 1976; Jakobsen et al., 1998). Compounds that do not belong to any of
these 3 groups were placed in a 4th group, which was referred to as ‘others’. The VOCs within each
group were sorted according to increasing log P values, which is commonly used to describe
hydrophobicity of VOCs.
VOCs released from pea flour at various pH
It can be seen in Table 1 that aldehydes were the major group of VOCs released from pea flour at
both pHs. At pH 8, a total of 21 different VOCs were released, of which 9 were aldehydes, 2 were
ketones, 9 were alcohols and 1 other. A total of 18 different VOCs were released at pH 4, of which
7 were aldehydes, 4 were ketones, 6 were alcohols and 1 other. The total amount of volatiles
released (expressed in arbitrary units; AU), per gram of dry matter, was higher at pH 8 than at pH 4.
From Table 1, it can be seen that the aldehyde, hexanal was the major volatile compound released
from pea flour at both pH 4 and pH 8. It represented >35% of the total amount of volatiles released
(the response factors of all aldehydes are similar). The lower aldehydes (pentanal and 2-hexenal)
and the lower alcohols (2-propanol and 1-penten-3-ol) were only released at pH 8. On the other
hand, decanal, undecanal, 1-penten-3-one and acetophenone were only released at pH 4. The
amounts of aldehydes and alcohols released from pea flour were observed to be higher at pH 8 than
at pH 4.
101

Chapter 5
Table 1: Volatile organic compounds detected in pea flour at pH 4 and pH 8
3-
pe2-
he2- he2- 2-
de
unTo
2-1- ace
To
21-
2-1- 3-1- 1-
2-
1-
To
to 1-To To
"+" re
"++" represe"+++" represents the am
"++++" represen
Pea flour Log P* pH 4 a pH 8 a
Aldehydesmethylbutanal 1.25 + +ntanal 1.44 - +++Hexenal (E) 1.58 - +++xanal 1.97 +++++ +++++heptenal (E) 2.11 - +++ptanal 2.50 + +octenal (E) 2.64 - ++nonenal (E) 3.17 + +
nonanal 3.56 +++ +++canal 4.10 +++ -decanal 4.63 + -tal aldehydes (AU) 199110 355510
Ketonesbutanone 0.37 + +penten-3-one 0.57 + -
tophenone 1.67 +++ -6-methyl-5-hepten-2-one 2.09 ++ +++
tal ketones (AU) 25900 19690
Alcohols-propanol 0.16 - +penten-3-ol 1.05 - +++penten-1-ol (E) 1.22 - +pentanol 1.41 + +++hexen-1-ol (Z) 1.61 - +hexanol 1.94 +++ +++heptanol 2.47 + -
1-octen-3-ol 2.64 - ++methyl-1-propanol 2.64 + +
2-ethyl-1-hexanol 2.82 + ++octanol 3.00 ++ -tal alcohols (AU) 28200 98690
Othersluene 2.68 + -tetradecene 7.68 - +tal others (AU) 2590 3500tal number of volatiles 18 21
Total volatiles (AU) 255800 477390
*Calculated using Advanced Chemistry Development (ACD) software solaris V4,67 (www.acdlabs.com)(1994-2004 ACD)
aCalculated as amount of volatile organic compounds in arbitrary units (AU) per g of dry matterpresents the amount of volatiles between 500-5000 AU
nts the amount of volatiles between 5000-10000 AUount of volatiles between 10000-50000 AU
ts the amount of volatiles between 50000-100000 AU"+++++" represents the amount of volatiles between 100000-500000 AU
102
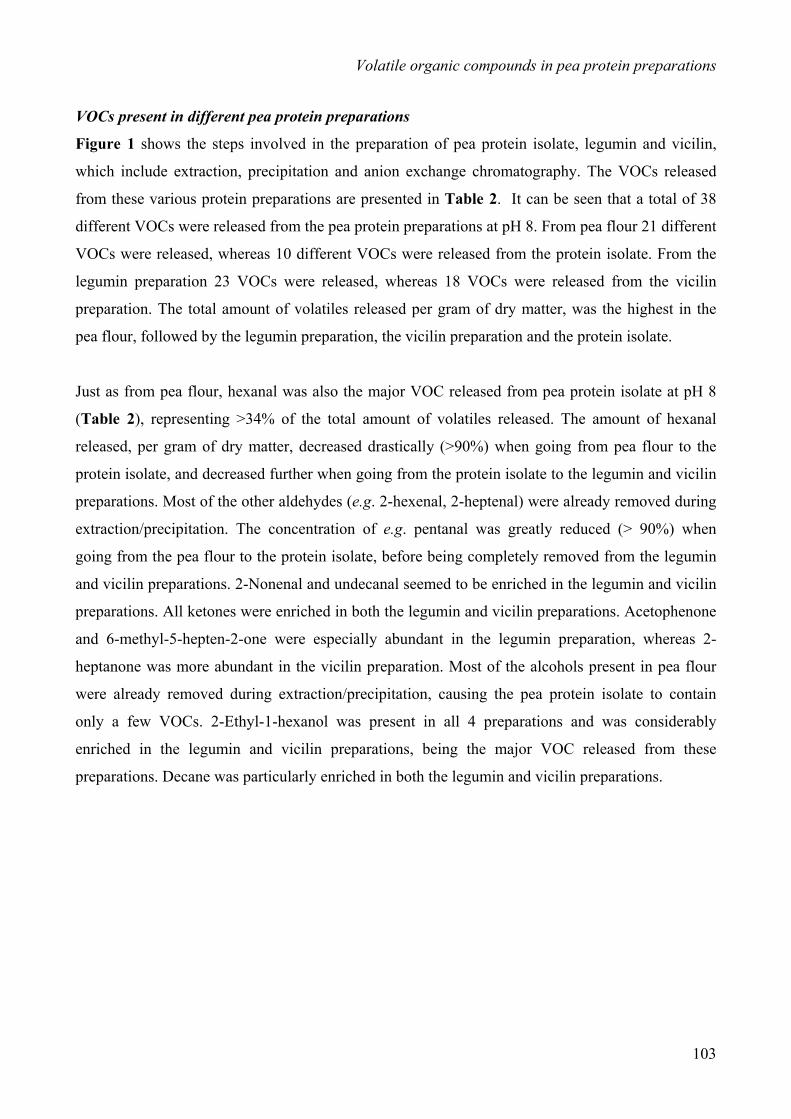
Volatile organic compounds in pea protein preparations
VOCs present in different pea protein preparations
Figure 1 shows the steps involved in the preparation of pea protein isolate, legumin and vicilin,
which include extraction, precipitation and anion exchange chromatography. The VOCs released
from these various protein preparations are presented in Table 2. It can be seen that a total of 38
different VOCs were released from the pea protein preparations at pH 8. From pea flour 21 different
VOCs were released, whereas 10 different VOCs were released from the protein isolate. From the
legumin preparation 23 VOCs were released, whereas 18 VOCs were released from the vicilin
preparation. The total amount of volatiles released per gram of dry matter, was the highest in the
pea flour, followed by the legumin preparation, the vicilin preparation and the protein isolate.
Just as from pea flour, hexanal was also the major VOC released from pea protein isolate at pH 8
(Table 2), representing >34% of the total amount of volatiles released. The amount of hexanal
released, per gram of dry matter, decreased drastically (>90%) when going from pea flour to the
protein isolate, and decreased further when going from the protein isolate to the legumin and vicilin
preparations. Most of the other aldehydes (e.g. 2-hexenal, 2-heptenal) were already removed during
extraction/precipitation. The concentration of e.g. pentanal was greatly reduced (> 90%) when
going from the pea flour to the protein isolate, before being completely removed from the legumin
and vicilin preparations. 2-Nonenal and undecanal seemed to be enriched in the legumin and vicilin
preparations. All ketones were enriched in both the legumin and vicilin preparations. Acetophenone
and 6-methyl-5-hepten-2-one were especially abundant in the legumin preparation, whereas 2-
heptanone was more abundant in the vicilin preparation. Most of the alcohols present in pea flour
were already removed during extraction/precipitation, causing the pea protein isolate to contain
only a few VOCs. 2-Ethyl-1-hexanol was present in all 4 preparations and was considerably
enriched in the legumin and vicilin preparations, being the major VOC released from these
preparations. Decane was particularly enriched in both the legumin and vicilin preparations.
103
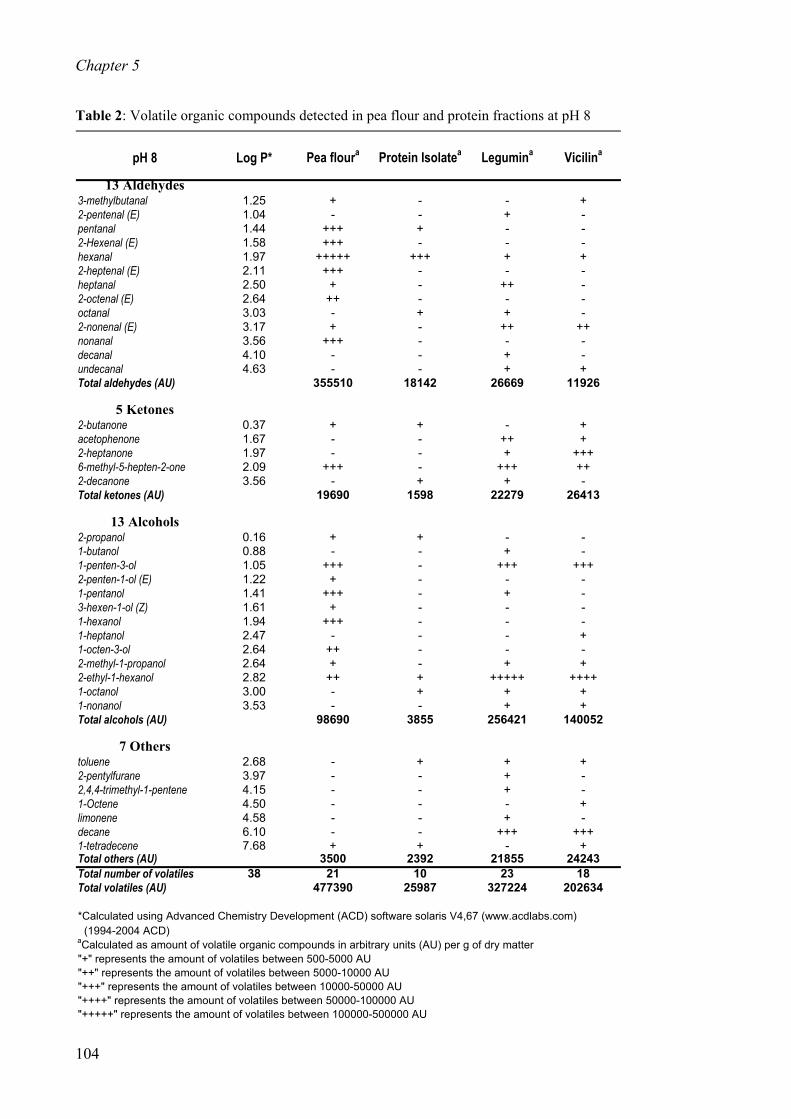
Chapter 5
Table 2: Volatile organic compounds detected in pea flour and protein fractions at pH 8
3-m
2-pentp
2-Hexhexanal
2-hepthept
2-ococt
2-nonenal (E)nonanal
decanalundecanal
Total al
2-but
acet2-hept 6-m2-dec Total ket
2-propanol 1-but
2-pent
3-hex
1-hept
2-m
1-oc
Total al
2-pent
2,1-O
limonenedecane
1-tTotal others (AU)
Total vol
*Calculated
a
"+" rep"++"
"+++" "++++"
pH 8 Log P* Pea floura Protein Isolatea Legumina Vicilina
13 Aldehydesethylbutanal 1.25 + - - +
enal (E) 1.04 - - + -entanal 1.44 +++ + - -
enal (E) 1.58 +++ - - -1.97 +++++ +++ + +
enal (E) 2.11 +++ - - -anal 2.50 + - ++ -tenal (E) 2.64 ++ - - -
anal 3.03 - + + -3.17 + - ++ ++3.56 +++ - - -4.10 - - + -4.63 - - + +
dehydes (AU) 355510 18142 26669 11926
5 Ketonesanone 0.37 + + - +
ophenone 1.67 - - ++ +anone 1.97 - - + +++
ethyl-5-hepten-2-one 2.09 +++ - +++ ++anone 3.56 - + + -
ones (AU) 19690 1598 22279 26413
13 Alcohols0.16 + + - -
anol 0.88 - - + -1-penten-3-ol 1.05 +++ - +++ +++
en-1-ol (E) 1.22 + - - -1-pentanol 1.41 +++ - + -
en-1-ol (Z) 1.61 + - - -1-hexanol 1.94 +++ - - -
anol 2.47 - - - +1-octen-3-ol 2.64 ++ - - -
ethyl-1-propanol 2.64 + - + +2-ethyl-1-hexanol 2.82 ++ + +++++ ++++
tanol 3.00 - + + +1-nonanol 3.53 - - + +
cohols (AU) 98690 3855 256421 140052
7 Otherstoluene 2.68 - + + +
ylfurane 3.97 - - + -4,4-trimethyl-1-pentene 4.15 - - + -
ctene 4.50 - - - +4.58 - - + -6.10 - - +++ +++
etradecene 7.68 + + - +3500 2392 21855 24243
Total number of volatiles 38 21 10 23 18atiles (AU) 477390 25987 327224 202634
using Advanced Chemistry Development (ACD) software solaris V4,67 (www.acdlabs.com) (1994-2004 ACD)Calculated as amount of volatile organic compounds in arbitrary units (AU) per g of dry matter
resents the amount of volatiles between 500-5000 AUrepresents the amount of volatiles between 5000-10000 AU
represents the amount of volatiles between 10000-50000 AUrepresents the amount of volatiles between 50000-100000 AU
"+++++" represents the amount of volatiles between 100000-500000 AU
104
Volatile organic compounds in pea protein preparations
DISCUSSION
The VOCs in this study differ markedly in their log P values. The log P value is often considered as
an important characteristic of VOCs as it represents the hydrophobicity of the compound.
Hydrophobic compounds, i.e. compounds with a relatively high log P value, generally bind more
strongly to proteins and are not easily extracted with aqueous solvents.
Flavour release in relation to pH
From Table 1, it can be seen that the VOCs (both aldehydes and alcohols) that were only released
at pH 4 (e.g. decanal, undecanal, 2-ethyl-1-hexanol, 1-octanol) generally had high log P values
(>3), whereas many of those that were only released at pH 8 (e.g. pentanal, 2-hexenal, 2-propanol,
1-penten-3-ol) were more polar (log P values <2). The solubility of the proteins in pea flour differs
with pH, being higher at pH 8 than at pH 4 (Derbyshire, 1976; Lasztity et al., 1986). The release of
VOCs with a low log P value at pH 8 could therefore be due to the fact that pea flour at that pH
becomes more easily accessible to the aqueous extraction solvent due to the solubilisation of the
proteins, resulting in an increased rate of release of the more polar VOCs.
Effect of purification steps
The steps involved in the pea protein purification process (extraction/precipitation and anion-
exchange chromatography) were shown to have a significant effect on the quantity and type of
VOCs present in the protein preparations.
(i) Extraction and precipitation at pH 4.8
Aqueous extraction led to a major reduction in the release of aldehydes, ketones and alcohols. Of
the major components that are being removed from pea flour by aqueous extraction, hexanal is
reported as a major breakdown product or derivative that is frequently formed during the oxidation
of fatty acids by lipoxygenase (Lumen et al., 1978; Sessa, 1976). It was present in large quantities
in blanched green peas, representing about 55% of the total trapped volatiles (Jakobsen et al.,
1998). Its presence is of importance because it possesses a strong odour and is responsible for the
“hay-like” off-flavour in peas (Murray et al., 1976; Bengston and Bosund, 1964; Williams et al.,
1986).
105

Chapter 5
During the extraction of pea flour and the subsequent precipitation, several VOCs were either
completely removed, or their concentrations were reduced (Table 2). VOCs such as 2-hexenal, 2-
penten-1-ol, 3-hexen-1-ol and 1-hexanol (Table 2), which have relatively low log P values of <2,
seemed not to be present anymore in the protein preparations. These VOCs are relatively polar and
are, therefore, presumably easily extracted with aqueous solvents and are not precipitated with the
proteins. On the other hand, VOCs such as undecanal, 2-decanone, 1-nonanol and decane with log P
values of >3, were found to be enriched in the protein preparations. These apolar VOCs are
probably not extracted as such, but are retained strongly by the proteins, and thus enriched during
protein precipitation.
(ii) Purification: Enrichment in protein fractions
Alcohols were found to be substantially enriched in the legumin and vicilin preparations, compared
to the protein isolate (Table 2), e.g. 2-ethyl-1-hexanol increased by more than 30-fold and 15-fold
when going from pea flour to the legumin and the vicilin preparations, respectively. These alcohols
are known to possess strong odours (Murray et al., 1968) and may thus influence final flavour
perception. The absence of some alcohols (e.g. 2-penten-1-ol, 3-hexen-1-ol, 1-hexanol and 1-octen-
3-ol) in the protein preparations may be due to the removal of these alcohols during
extraction/precipitation. Some of the other VOCs, such as decanal, undecanal, 2-decanone, 1-
nonanol and decane, were not detected as being released from the pea flour, but were apparently
very much enriched during the purification process that could be detected as being released from
either the protein isolate or the legumin or vicilin preparations (Table 2). These VOCs probably
have a relatively high affinity for proteins, resulting in their enrichment during protein purification.
The higher concentrations of total volatiles present in the legumin preparation compared to the
vicilin preparation may also indicate that legumin in general has a higher affinity for VOCs than
vicilin.
106

Volatile organic compounds in pea protein preparations
LITERATURE CITED
Andriot, I.; Marin, I.; Feron, G.; Relkin, P; Guichard, E. Binding of benzaldehyde by β-lactoglobulin, by
static-headspace and high performance liquid chromatography in different physico-chemical
conditions. Le Lait, 1999, 79, 577-586.
Bengtsson, B.; Bosund, I. Gas chromatographic evaluation of the formation of volatile substances in stored
peas. Food Technol., 1964, 773, 179-182.
Bora, P.S.; Brekke, C.J.; Powers, J.R. Heat induced gelation of pea (Pisum sativum) mixed globulins, vicilin
and legumin. J. Food Sci, 1994, 59(3), 594-596.
Bradford, M. M. Anal. Biochem, 1976, 72, pp 248-254.
Davies, J.; Lightowler, H. Plant-based alternatives to meat. Nutr. Food Sci., 1998, 98(2), 90-94.
Derbyshire, E.; Wright, D. J.; Boulter, D. Review. Legumin and vicilin, storage proteins of legume seeds.
Phytochemistry, 1976, 15, 3-24.
Druaux, C.; Lubbers, S.; Charpentier, C.; Voilley, A. Effects of physico-chemical parameters of a model
wine on the binding of γ-decalactone on bovine serum albumin. Food Chem., 1995, 53, 203-207.
Dumont, J. P.; Land, D. G. Binding of diacetyl by pea proteins. J. Agric. Food Chem., 1986, 34, 1041-1045.
Gatehouse, J. A.; Croy, R. R. D.; Morton, H., Tyler, M., Boulter, D. Characterisation and subunit structures
of the vicilin storage proteins of pea (Pisum sativum L.). Eur. J. Biochem., 1981, 118, 627-633.
Guéguen, J.; Chevalier, M.; Barbot, J.; Schaeffer, F. Dissociation and aggregation of pea legumin induced by
pH and ionic strength. J. Sci. Food Agric., 1988, 44, 167-182.
Jakobsen, H. B.; Hansen, M.; Christensen, M. R.; Brockhoff, P. B.; Olsen, C. E. Aroma volatiles of blanched
green peas (Pisum sativum L.) J. Agric. Food Chem., 1998, 46, 3727-3734.
Koyoro, H.; Powers, J.R. Functional properties of pea globulin fractions. Cereal Chem., 1987, 64, 97-101.
Lasztity, R.; El Morsi, E. A.; Abd-El Samei, M. B.; El Sayed, A. E.; Ismaeil, H. A. Fractionation and
characterisation of Pisum sativum globulins. Acta Alimentaria, 1986, 15(3), 165-174.
Le Thanh, M.; Thibeaudeau, P.; Thibaut, M. A.; Voilley, A. Interactions between volatile and non-volatile
compounds in the presence of water. Food Chem., 1992, 43, 129-135.
Lumen, B. O.; Stone, E. J.; Kazeniac, S. J.; Forsythe, R. H. Formation of volatile flavour compounds in
green beans from linoleic and linolenic acids. J. Food Sci., 1978, 43, 698-708.
Murray, K. E.; Shipton, J.; Whitfield, F. B.; Kennett, B. H.; Stanley, G. Volatile flavour components from
green peas (Pisum sativum). 1. Alcohols in unblanched frozen peas. J. Food Sci., 1968, 33, 290-294.
Murray, K. E.; Shipton, J.; Whitfield, F. B.; Last, J. H. The volatiles of off-flavoured unblanched green peas
(Pisum sativum). J. Sci. Food Agric., 1976, 27, 1039-1107.
Plug, H.; Haring, P. The role of ingredient-flavour interactions in the development of fat-free foods. Trends
Food Sci. Technol., 1993, 4, 150-152
107
Chapter 5
108
Plug, H.; Haring, P. The influence of flavour-ingredient interactions on flavour perception. Food Quality &
Preference, 1994, 5, 95-102.
Reichert, R. D.; MacKenzie, S. L. Composition of peas (Pisum sativum) varying widely in protein content. J.
Agric. Food Chem., 1982, 30, 312-317.
Rogacheva, S.; Espinosa-Diaz, M. A.; Voilley, A. Transfer of aroma compounds in water-lipid systems:
Binding tendency of β-lactoglobulin. J. Agric. Food Chem., 1999, 47, 259-263.
Sessa, D. J.; Rackis, J. J. Lipid-derived flavours of legumes. J. Am. Chem. Soc., 1976, 53, 145A.
Williams, D. C.; Lim, M. H.; Chen, A. O.; Pangborn, R. M.; Whitaker, J. R. Blanching of vegetables for
freezing-Which indicator enzyme to choose. Food Technol., 1986, 40, 130-140.
Thomson, J.A., Schroeder, H.E. and Dudman, W.F. Cotyledonary storage proteins in Pisum sativum L. /
Molecular Heterogenity; Aust. J. Plant physiol., 1978, 279(5), 263-279.
Zhu, X.; van Ierland, E.; Wesseler, J. Introducing Novel Protein Foods in the European Union: Economic
and environmental impacts. In Consumer Acceptance of genetically modified food. Evenson, R. E. and
Santaniello, V. eds. CAB International, Oxfordshire, 2004, pp 189-208.
Chapter 6
Interaction of pea vicilin with volatile organic
compounds
This Chapter is based on Lynn Heng, G.A. van Koningsveld, H. Gruppen, M.A.J.S. van Boekel, J-P. Vincken, J.P.
Roozen, A.G.J. Voragen. Protein-flavour interactions in relation to development of novel protein foods. Trends Food
Sci. Technol., 2004, 15, 217-224.
Chapter 6
ABSTRACT
The interactions between volatile organic compounds (VOCs) and pea vicilin (7S) and the effect of
heat treatment on these interactions were studied. At pH 7.6, vicilin was found to interact with both
aldehydes and ketones, as measured with static headspace-gas chromatography. Heating of vicilin at
90 oC resulted in decrease interactions of these VOCs with the protein. Vicilin preparations were
adjusted to pH 4.5, 5.5 and 6.5, which resulted in the formation of a soluble and an insoluble vicilin
fraction. The insoluble fractions showed remarkably high affinities for octanal than the supernatant
fractions, at the same pH. At all pHs, the insoluble fraction contained relatively high amounts of
lipids and carbohydrates. After extraction with various organic solvents, the pellets at pH 4.5 and
6.5 showed a decrease in lipid and carbohydrate contents. These decreases, probably due to
galactolipids, resulted only in a partial removal of the compounds interacting with octanal.
KEYWORDS: Pea(s), vicilin, protein-flavour interaction, heat, lipid(s), carbohydrate(s)
110
Interaction of pea vicilin
INTRODUCTION
Proteins may influence flavour perception of food through the interaction with volatile organic
compounds (VOCs) (Martens et al., 1987). In recent years, protein sources from leguminous plants
such as peas and soybeans, have been used to formulate new products, e.g., Novel Protein Foods
(NPFs) (Davies & Lightowler, 1998). It is important that the taste and aroma of these protein foods
are appealing and acceptable to consumers.
Several studies have shown that VOCs interact with proteins such as soy proteins (Arai et al., 1970;
Damodaran & Kinsella, 1981a/b; Aspelund & Wilson, 1983; O’Neill & Kinsella, 1987a; Chung &
Villota, 1989; O’Keefe et al, 1991a/b) and milk proteins (O’Neill & Kinsella, 1987b; 1988; Andriot
et al., 1999; Rogacheva et al., 1999; Guichard & Langourieux, 2000). These interactions are
influenced by parameters such as pH, temperature and ionic strength (Andriot et al., 1999; O’Neill
& Kinsella, 1988; Guichard & Langourieux, 2000). Protein-flavour interactions were e.g. observed
to be favoured at alkaline pH (Andriot et al., 1999; Rogacheva et al., 1999; Guichard &
Langourieux, 2000). Thermal denaturation of proteins may either increase (Arai et al., 1970;
Damodaran & Kinsella, 1981a; O’Neill & Kinsella, 1988) or decrease (Chung & Villota, 1989)
their interactions with VOCs. Addition of chaotropic salts often reduces VOCs interactions
whereas, lyotropic salts seem to enhance these interactions (Andriot et al., 1999; Guichard &
Langourieux, 2000), indicating that hydrophobic interactions dominate in these interactions. Also,
protein isolates, e.g. those from peas, may contain non-protein components such as lipids and
carbohydrates, which are known to interact with significant amounts of VOCs (Godshall, 1997;
Plug & Haring, 1993; 1994; Guichard, 2002). Therefore, if present, these components may
influence the interactions of proteins with odour active compounds.
Peas contain 2 major protein fractions, legumin and vicilin, which are salt-extractable globular
proteins that account for 65-80% of the total amount of proteins in peas (Owusu-Ansah &
McCurdy, 1991). Pea legumin is a protein of ~60 kDa that consists of a basic 20 kDa and an acidic
40 kDa polypeptide, interlinked by a disulphide bridge, which assemble into a hexamer (360 kDa)
at pH 7-9 (Guéguen et al., 1988). Vicilin is produced as a precursor of ~50 kDa and it assembles
into a trimer in vivo (Gatehouse et al., 1981). Only a few VOC interactions studies have been
performed with pea proteins (Dumont, 1985, Dumont & Land, 1986). The interaction of diacetyl, a
ketone, to pea protein isolates was studied in the pH range of 2-9 (Dumont & Land, 1986). The free
111
Chapter 6
ketone concentration was shown to decrease at higher pHs. No study has yet been performed on the
interactions of the individual pea proteins with VOCs. Therefore, the aim of this study was to
investigate the interactions between pea vicilin and VOCs, and the effect of heat treatment on these
interactions.
112
Interaction of pea vicilin
MATERIALS AND METHODS
Purification of vicilin
Vicilin was purified from green peas (Pisum sativum, Solara spp.) obtained from Cebeco (Vlijmen,
The Netherlands) using a procedure adapted from the methods of Koyoro & Powers (1987) and
Bora et al. (1994). Green peas were mixed 1:1 with dry ice (w/w) and milled in a commercial
blender (Waring, New Hartford, Connecticut, U.S.A.), to avoid heat denaturation of the proteins. A
vicilin extract was prepared by extracting pea flour with 10 mM Tris-HCl buffer (1:10 (w/v)) at pH
8 for 2 h at room temperature. The extract was centrifuged at 12,300 x g at 10 °C for 30 min. The
clear supernatant (~4.5 L) was collected and applied batch-wise to DEAE CL-6B Sepharose Fast
Flow (Amersham Pharmacia Biotech, Uppsala, Sweden). Before use, the ion-exchange material was
placed on a glass filter (Emergo glass filter 26 D2, 120 mm D50), rinsed with 6 volumes of
millipore water (~1.8 L), followed by 6 volumes of 35 mM potassium phosphate buffer (pH 7),
containing 0.075 mM NaCl. The equilibrated DEAE material was then mixed with 1.5 L of the
clear supernatant in a glass beaker and gently stirred for two hours at 4 °C to allow protein binding.
Next, the mixture was transferred to the glass filter again and rinsed with two volumes of the buffer
(~0.6 L) to remove unbound material. The vicilin fraction was eluted with a 35 mM potassium
phosphate buffer (pH 7) containing 0.4 M NaCl. The eluted fraction was diluted with 35 mM
potassium phosphate buffer (pH 7) to reduce the salt concentration for further purification using a
DEAE Sepharose Fast Flow column (5 cm diameter, 343 mL column volume; Pharmacia Biotech,
Uppsala, Sweden). Before using the DEAE, the ion-exchange column was rinsed with 6 volumes of
millipore water (~1.8L), followed by 6 volumes of 35 mM potassium-phosphate buffer (pH 7)
containing 0.075 mM NaCl. Elution was performed with a linear salt gradient of 0.075-0.5 M NaCl
over 6 column volumes at 20 mL/min. The eluate was monitored at 280 nm and fractions (15 mL)
under the peaks were collected. The composition of the protein fractions obtained was determined
using SDS-PAGE gel (Bio-Rad ready gel, 10-20% Tris-HCl, Coomassie blue staining), before
pooling and combining the vicilin containing fractions. The pooled fractions were dialysed against
distilled water before freeze-drying and subsequently stored at –20 °C.
Protein content
Protein contents were measured using the Dumas combustion method, on a Thermo Quest NA 2100
nitrogen and protein analyser (Intersciences, The Netherlands) according to the instructions of the
manufacturer. Samples (400 µL), both supernatants and pellets after re-suspension, were put in
113
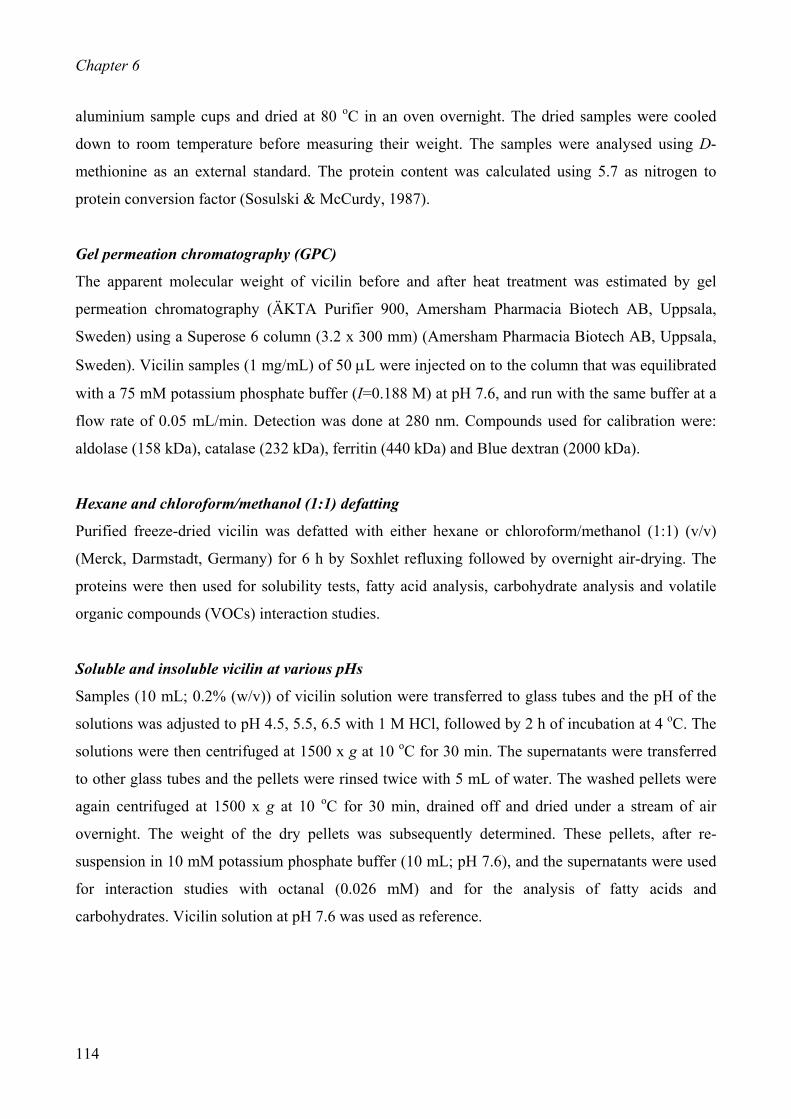
Chapter 6
aluminium sample cups and dried at 80 oC in an oven overnight. The dried samples were cooled
down to room temperature before measuring their weight. The samples were analysed using D-
methionine as an external standard. The protein content was calculated using 5.7 as nitrogen to
protein conversion factor (Sosulski & McCurdy, 1987).
Gel permeation chromatography (GPC)
The apparent molecular weight of vicilin before and after heat treatment was estimated by gel
permeation chromatography (ÄKTA Purifier 900, Amersham Pharmacia Biotech AB, Uppsala,
Sweden) using a Superose 6 column (3.2 x 300 mm) (Amersham Pharmacia Biotech AB, Uppsala,
Sweden). Vicilin samples (1 mg/mL) of 50 µL were injected on to the column that was equilibrated
with a 75 mM potassium phosphate buffer (I=0.188 M) at pH 7.6, and run with the same buffer at a
flow rate of 0.05 mL/min. Detection was done at 280 nm. Compounds used for calibration were:
aldolase (158 kDa), catalase (232 kDa), ferritin (440 kDa) and Blue dextran (2000 kDa).
Hexane and chloroform/methanol (1:1) defatting
Purified freeze-dried vicilin was defatted with either hexane or chloroform/methanol (1:1) (v/v)
(Merck, Darmstadt, Germany) for 6 h by Soxhlet refluxing followed by overnight air-drying. The
proteins were then used for solubility tests, fatty acid analysis, carbohydrate analysis and volatile
organic compounds (VOCs) interaction studies.
Soluble and insoluble vicilin at various pHs
Samples (10 mL; 0.2% (w/v)) of vicilin solution were transferred to glass tubes and the pH of the
solutions was adjusted to pH 4.5, 5.5, 6.5 with 1 M HCl, followed by 2 h of incubation at 4 oC. The
solutions were then centrifuged at 1500 x g at 10 oC for 30 min. The supernatants were transferred
to other glass tubes and the pellets were rinsed twice with 5 mL of water. The washed pellets were
again centrifuged at 1500 x g at 10 oC for 30 min, drained off and dried under a stream of air
overnight. The weight of the dry pellets was subsequently determined. These pellets, after re-
suspension in 10 mM potassium phosphate buffer (10 mL; pH 7.6), and the supernatants were used
for interaction studies with octanal (0.026 mM) and for the analysis of fatty acids and
carbohydrates. Vicilin solution at pH 7.6 was used as reference.
114

Interaction of pea vicilin
Fatty acid analysis
Fatty acid analysis was done according to Bligh & Dyer (1959). To the dried vicilin pellets, 100 µL
of an internal standard solution (0.83 mg/mL margarinic acid methylester in hexane), 1.5 mL
methanol, 0.9 mL 1% (w/v) EDTA in water and 1 mL dichloromethane were added. The mixture
was vortexed for 10 min, followed by centrifuging at 1500 x g at 20 oC for 10 min. The lower
organic layer of the mixture was collected and transferred to a glass tube. Dichloromethane (2 mL)
was added to the top layer and the mixture was vortexed for 2 min before centrifuging at 1500 x g at
20 oC for 10 min, after which the lower organic layer was again removed. This was repeated 3 times
and the organic layers collected were combined and dried under nitrogen at 37 oC for 2 h. Next, 0.5
mL of a 10% (v/v) Boron trifluoride (~1.3 M) in methanol (Fluka, Sigma Aldrich, Steinheim,
Germany) was added to the dried fractions and the mixtures were heated at 100 oC for 1 h in capped
glass tubes. After heating, the samples were cooled in an ice bath. Pentane (2 mL; Merck,
Darmstadt, Germany) and 2.5 M NaOH (1 mL) were added to the heated samples. The mixture was
vortexed for 2 min followed by centrifuging at 1500 x g at 20 oC for 5 min. The organic top layer of
the mixture was collected in a glass tube. The aqueous bottom layer of the mixture was mixed with
2 mL pentane and mixed for 2 min before centrifuging at 1500 x g at 20 oC for 5 min. This was
repeated 3 times and the top layers collected were combined and dried under nitrogen at 37 oC for 2
h. 250 µL hexane (Merck, Darmstadt, Germany) was added to the dried fraction, of which 2 µL was
injected into a DB-WAX capillary column (Supelco Inc., Bellefonte, PA) (30 m long, 0.53 mm i.d.
and 1.0 µm film thickness) with helium as the carrier gas at a flow rate of 10 mL/min. Gas
chromatography (GC) analysis was done using a Carlo Erba HRGC 5300 gas chromatograph
(Interscience b.v., Breda, The Netherlands) equipped with a flame ionisation detector (FID) set at
275 oC. The oven temperature programme started at 80 oC and was increased to 160 oC at a rate of
15 oC/min using a linear gradient, followed by increasing it to 240 oC at a rate of 5 oC/min and
keeping it constant at 240 oC for 8 min. The individual fatty acids identified and quantified were
added to give the total amount of lipids presented in Table 3.
Carbohydrate analysis
Carbohydrate analysis was performed according to De Ruiter et al. (1992). To the dried vicilin
pellets, 1 mL of 2 N HCl in dry methanol was added and the mixtures were heated at 80 oC for 16 h.
The samples were evaporated to dryness before 0.5 mL of 2 N trifluoro acetic acid (TFA) in water
was added and the samples were again heated at 121 oC for 1 h. The sugars released during this
hydrolysis step were analysed using high-performance anion exchange chromatography (HPAEC)
115
Chapter 6
with pulsed amperometric detection (PAD). HPAEC was performed using a ThermoQuest HPLC
system with a Dionex ED40 PAD detector. Separation was performed on a Carbopac PA1 column
(4 x 250 mm) with a flow rate of 1 mL/min. Gradient elution was done by mixing distilled water
(A), 100 mM NaOH (B) and 1000 mM NaOAc (C) in 100 mM NaOH. Samples (20 µL) were
injected and separated using the following elution program: 26 min isocratically at 85%A and
15%B followed by a linear gradient to 100%B in 7 min. Subsequently a linear gradient was started
to 94%B and 6%C within 12 min, followed by a linear gradient to 70%B and 30%C in 33 min. The
column was washed for 5 min with 100%C followed by a 15 min wash step with 100 mM NaOH
and equilibrated for 15 min with a mixture of 85%A and 15%B. The individual sugars identified
and quantified were added to give the total amount of carbohydrates presented in Table 3.
Studies on interactions between protein and volatile flavour compounds
(i) Preparation of solutions
All VOCs used were of analytical grade (Sigma Aldrich, Steinheim, Germany). The aldehydes,
pentanal and octanal, and the ketones, 2-pentanone, 2-hexanone, 2-heptanone and 2-octanone were
used for pea vicilin interaction studies. Potassium phosphate buffer (10 mM, pH 7.6, I=0.024 M)
was used to prepare VOCs and protein solutions. Protein suspensions were stirred for 2 h at room
temperature and filtered through 0.2 µm CA-S filters (Schleicher & Schuell, Dassel, Germany). The
clear filtrate was used for interaction studies. Heating of samples was done by putting the capped
vials into a water bath (GLF, Salm en Kipp b.v., Breukelen, The Netherlands) at 90 oC for 30 min.
The aldehyde solutions were prepared at concentrations of 0.013 to 0.08 mM (1.6 to 6.5 ppm),
whereas those of ketones were prepared at concentrations of 0.06 to 2.3 mM (8 to 205 ppm). These
concentrations chosen are within the solubility ranges of the compounds used. The protein solutions
were prepared at concentrations of 0.2 to 2% (w/v). The pH of solutions was adjusted with 1 M HCl
or 1 M NaOH. Millipore water was used for all solutions.
(ii) Static headspace gas chromatography (SH-GC)
Static headspace sampling was used to study the interaction of VOCs with vicilin. 0.5 mL of the
VOCs solution was added to 0.5 mL of the protein solution in headspace vials (Alltech associates
Inc., 11.5 mL, 46 x 22.5 mm) and capped immediately. The final concentrations of aldehyde
solutions were 0.006 to 0.04 mM (0.8 to 3.3 ppm), whereas those of ketones were 0.03 to 1.2 mM
(4 to 103 ppm). The final concentrations of protein solutions were 0.1 to 1% (w/v). For blank
samples, 0.5 mL of the volatile flavour compounds solution was added to 0.5 mL of potassium
116

Interaction of pea vicilin
phosphate buffer. The vicilin pellets at the various pH (as described above), after re-suspension,
were analysed in the same way. All samples were prepared in triplicates. Samples (heated and non-
heated) were then analysed by gas chromatography (GC) using a Carlo Erba MEGA 5300 gas
chromatograph (Interscience b.v., Breda, The Netherlands) equipped with a flame ionisation
detector (FID) heated at 225 oC and a Combi PAL autosampler (CIC analytics) that incubates the
samples at 37 oC for 10 min with a constant agitation of 500 rpm. A sample volume of 1 mL was
drawn from the headspace of the vial and injected into a Supelco DB-WAX capillary column
(Supelco Inc., Bellefonte, PA) (30 m long, 0.54 mm i.d. and 1 µm film thickness) with helium as
the carrier gas at a flow rate of 0.9 mL/min. The injector temperature was set at 200 oC at an
injection speed of 100 µL/sec, using a pre and post injection delay of 500 msec. The oven
temperature programme started at 80 oC and was increased to 110 oC at a linear rate of 3 oC/min.
117

Chapter 6
RESULTS AND DISCUSSION
Interaction of pea vicilin with aldehydes and ketones
Figure 1 shows the amount of pentanal and octanal bound to vicilin at pH 7.6 for concentrations of
0.006-0.04 mM. It can be seen that at 0.025 mM of octanal, about 23 nmoles of octanal were bound
per mg of vicilin. At the same concentration of pentanal, about 15 nmoles of pentanal were bound
per mg of vicilin. Taking into account the total amounts of aldehyde and protein present, this
amount of octanal bound to vicilin is about 96% of the total amount of octanal added, whereas for
pentanal about 52% of the total amount of pentanal added was bound (Table 1). Pentanal thus has a
lower affinity for vicilin than octanal.
0
5
10
15
20
25
0 0.01 0.02 0.03 0.04
Aldehydes concentrations (mM)
Ald
ehyd
es a
ffini
ty (n
mol
es/m
g)
Figure 1: The interaction of 0.1% (w/v) vicilin with octanal (■) and pentanal (♦) at pH 7.6. Error bars
indicate standard deviations (n=3).
118

Interaction of pea vicilin
Table 1: The amount of aldehydes and ketones bound to vicilin at a concentration of 0.025 mM, heated and
non-heated fractions, at pH 7.6.
V V Oc
2-Octa
2-Hep
2-Pen Vic
#Calculated as a proportion of the total volatiles added to the system
olatile Octanal affinity (nmoles/mg) % bound#
icilin non-heated tanal ~23 96
Pentanal ~15 52none <1.5 33tanone <1 19
2-Hexanone <1 13tanone <0.5 10
ilin heatedOctanal ~9 322-Octanone <0.5 16
The amounts of 2-pentanone, 2-hexanone, 2-heptanone and 2-octanone bound to vicilin at pH 7.6,
at concentrations of 0.02-1.16 mM, are shown in Figure 2. The amount of binding for both
aldehydes and ketones also increased with increasing VOCs concentrations. It can be seen that
compared to the aldehydes, the ketones are bound with a much lower affinity. The amount of
ketones bound to vicilin is on average 10-33% of the total amount added (Table 1). Similar to the
aldehydes, the ketones with a longer chain-length have higher affinities to vicilin than those of
lower chain-length. The results obtained are in agreement with other protein-VOC interaction
studies, which also showed that binding increased with increasing VOCs concentrations (King &
Solms, 1979; Landy et al., 1995; Hansen & Booker, 1996), and with increasing chain length
(Damodaran & Kinsella, 1980; 1981a/b; 1983; O’Neill & Kinsella, 1987b; Andriot et al., 2000). It
should be noticed that the concentrations of VOCs added to the protein in this study are relatively
low (maximum 105 ppm), and most of the added VOCs was bound to the protein. As in actual food
production, even lower concentrations in parts per million (ppm) to parts per trillion (ppt) of VOCs
are added, it can be expected that in those products most of the added flavour is bound to other food
ingredients. Most authors, however, have studied VOCs interactions at relatively high
concentrations (500 to 10,000 ppm) (Landy et al., 1995; Druaux et al., 1995; Li et al., 2000), which
are not realistic for use in food processing, and may thus lead to an overestimation of the amount of
free VOCs. In addition, the solubility of these VOCs used in these studies may not be completely
soluble at such high concentrations.
119

Chapter 6
0
2
4
6
8
10
12
14
16
0.0 0.2 0.4 0.6 0.8 1.0
Ketones concentrations (mM)
Ket
ones
affi
nity
(nm
oles
/mg)
1.2
Figure 2: The interaction of 1% (w/v) vicilin with 2-octanone (■), 2-heptanone (•), 2-hexanone (▲) and 2-
pentanone (♦) at pH 7.6. Error bars indicate standard deviations (n=3).
Effect of heat on protein-flavour interactions
The effect of heating on vicilin-VOC interactions was only studied with 2-octanone and octanal
because the ketones and aldehydes of lower chain length showed no binding to vicilin after heating
(results not shown). From Figures 3 and 4, it can be seen that the amounts of binding of both
octanal and 2-octanone to vicilin decreased upon heat treatment. The amount of octanal bound to
non-heated vicilin was about 96% of the total amount of octanal present, whereas the amount of
octanal bound to heated vicilin was only 32% (Table 1). The amounts of 2-octanone bound to non-
heated and heated vicilin were about 33% and 16% of the total amount of added 2-octanone,
respectively.
Heating is known to cause protein denaturation, which is often followed by aggregation. This
aggregation might lead to a reduction of total exposed surface area of the protein, and may hence
reduce the observed VOCs binding. In order to give an explanation for the flavour binding
properties of heated vicilin using this reduction in exposed surface area, the molecular size of vicilin
120

Interaction of pea vicilin
molecules before and after heating was estimated by using gel filtration chromatography. From the
results obtained (results not shown), it was estimated that aggregates of at least 4200 kDa, i.e. 83
monomers of vicilin (50 kDa), were formed after heating vicilin at 90 oC for 30 min. The exposed
surface area of both the non-heated vicilin and the aggregated protein after heating was estimated
by assuming both particles to be spheres. The radius of a sphere-like protein can be estimated using
the formula: 4/3πr3 = 1.27 * Molecular weight (in Å3) (Creighton, 1993). Using this formula, the
surface area of such a protein can be estimated. The surface area of an aggregate of 83 molecules of
vicilin monomers (50 kDa) would then be approximately 77% smaller than that of 83 vicilin
molecules that are not aggregated. From the results shown in Figures 3 and 4, it can be seen that
the amount of binding of 2-octanone and octanal to vicilin after heating decreased by 17% and 64%,
respectively. These decreases in amount of binding are less than the estimated 77% decrease in
surface area. Heating may thus have led to a decrease in available binding area but it does not
necessarily decrease the affinity of the protein. An increase in the binding affinity for hydrophobic
VOCs is often observed upon heating (Arai et al., 1970; Damodaran & Kinsella, 1981a; O’Neill &
Kinsella, 1988; Chung & Villota, 1989; Druaux et al., 1995; Hansen & Booker, 1996), but our
results do not give specific indications for such behaviour.
0
5
10
15
20
25
0 0.01 0.02 0.03
Octanal concentrations (mM)
Oct
anal
affi
nity
(nm
oles
/mg)
Figure 3: Effect of heat on the interaction of 0.1% (w/v) vicilin with octanal at pH 7.6. Non-heated vicilin
(■) and heated (90 oC, 30 min) vicilin (▲) are presented.
121
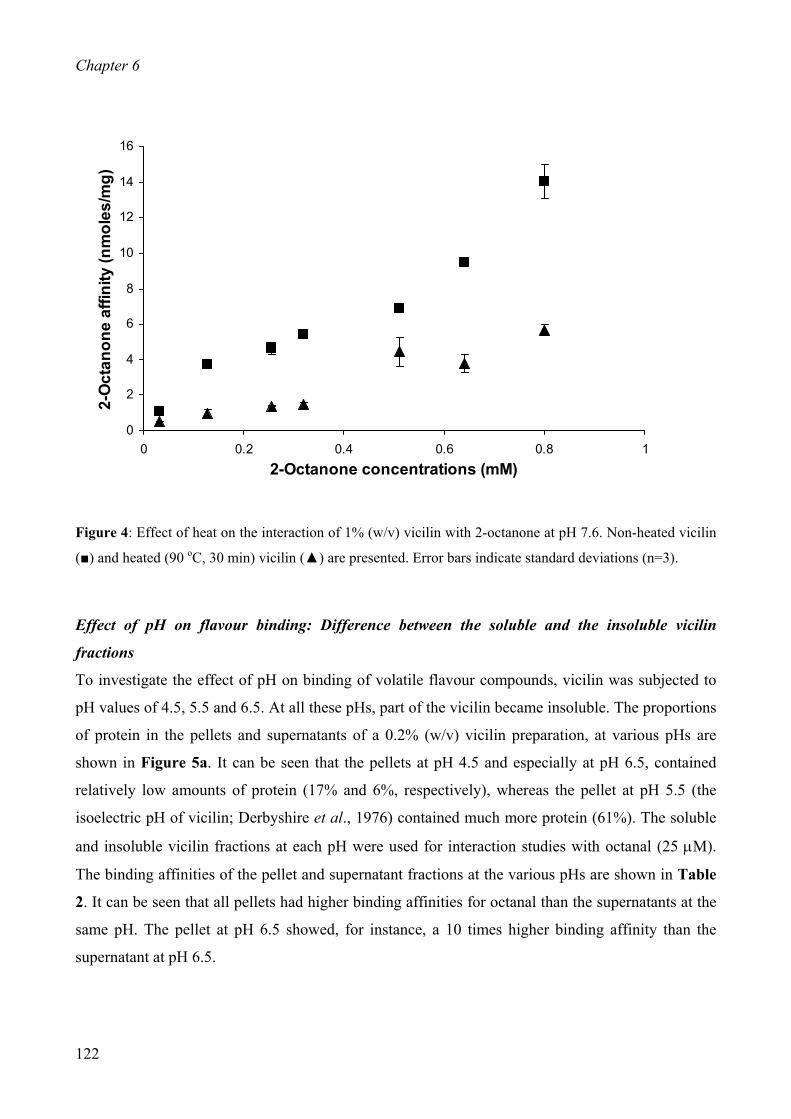
Chapter 6
0
2
4
6
8
10
12
14
16
0 0.2 0.4 0.6 0.8 12-Octanone concentrations (mM)
2-O
ctan
one
affin
ity (n
mol
es/m
g)
Figure 4: Effect of heat on the interaction of 1% (w/v) vicilin with 2-octanone at pH 7.6. Non-heated vicilin
(■) and heated (90 oC, 30 min) vicilin (▲) are presented. Error bars indicate standard deviations (n=3).
Effect of pH on flavour binding: Difference between the soluble and the insoluble vicilin
fractions
To investigate the effect of pH on binding of volatile flavour compounds, vicilin was subjected to
pH values of 4.5, 5.5 and 6.5. At all these pHs, part of the vicilin became insoluble. The proportions
of protein in the pellets and supernatants of a 0.2% (w/v) vicilin preparation, at various pHs are
shown in Figure 5a. It can be seen that the pellets at pH 4.5 and especially at pH 6.5, contained
relatively low amounts of protein (17% and 6%, respectively), whereas the pellet at pH 5.5 (the
isoelectric pH of vicilin; Derbyshire et al., 1976) contained much more protein (61%). The soluble
and insoluble vicilin fractions at each pH were used for interaction studies with octanal (25 µM).
The binding affinities of the pellet and supernatant fractions at the various pHs are shown in Table
2. It can be seen that all pellets had higher binding affinities for octanal than the supernatants at the
same pH. The pellet at pH 6.5 showed, for instance, a 10 times higher binding affinity than the
supernatant at pH 6.5.
122
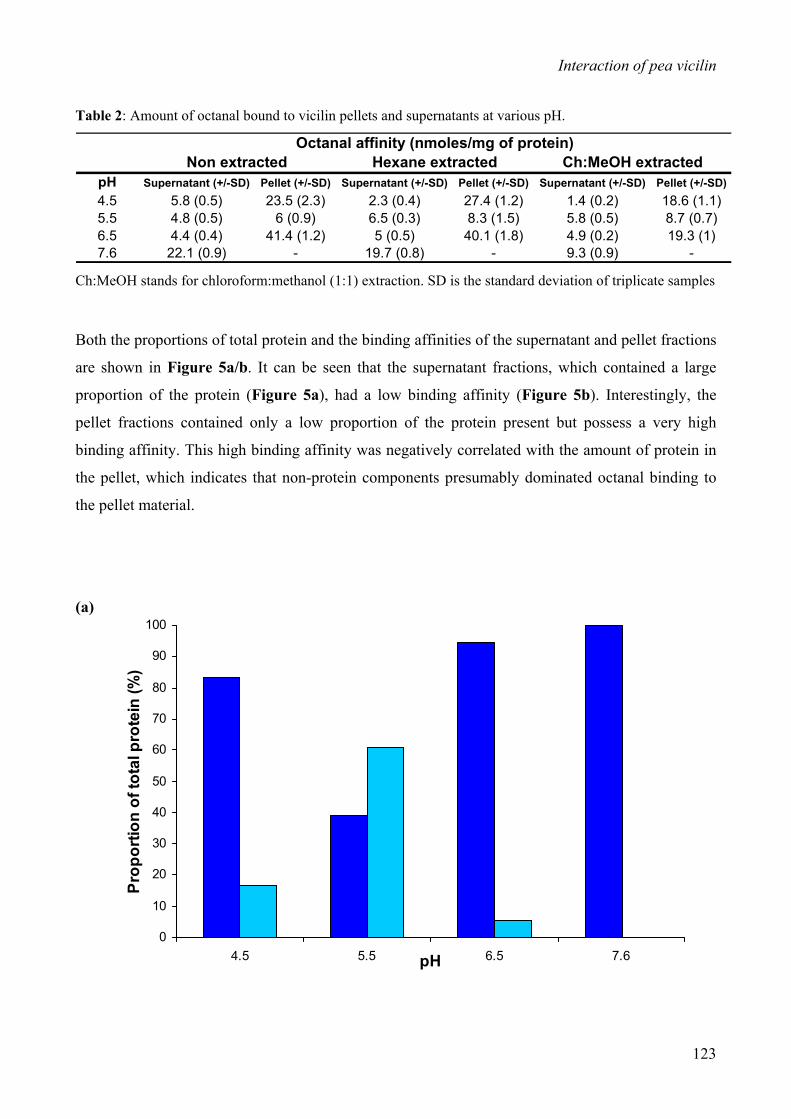
Interaction of pea vicilin
Table 2: Amount of octanal bound to vicilin pellets and supernatants at various pH.
pH Supernatant (+/-SD) Pellet (+/-SD) Supernatant (+/-SD) Pellet (+/-SD) Supernatant (+/-SD) Pellet (+/-SD)4.5 5.8 (0.5) 23.5 (2.3) 2.3 (0.4) 27.4 (1.2) 1.4 (0.2) 18.6 (1.1)5.5 4.8 (0.5) 6 (0.9) 6.5 (0.3) 8.3 (1.5) 5.8 (0.5) 8.7 (0.7)6.5 4.4 (0.4) 41.4 (1.2) 5 (0.5) 40.1 (1.8) 4.9 (0.2) 19.3 (1)7.6 22.1 (0.9) - 19.7 (0.8) - 9.3 (0.9) -
Octanal affinity (nmoles/mg of protein)Non extracted Hexane extracted Ch:MeOH extracted
Ch:MeOH stands for chloroform:methanol (1:1) extraction. SD is the standard deviation of triplicate samples
Both the proportions of total protein and the binding affinities of the supernatant and pellet fractions
are shown in Figure 5a/b. It can be seen that the supernatant fractions, which contained a large
proportion of the protein (Figure 5a), had a low binding affinity (Figure 5b). Interestingly, the
pellet fractions contained only a low proportion of the protein present but possess a very high
binding affinity. This high binding affinity was negatively correlated with the amount of protein in
the pellet, which indicates that non-protein components presumably dominated octanal binding to
the pellet material.
(a)
0
10
20
30
40
50
60
70
80
90
100
4.5 5.5 6.5 7.6pH
Prop
ortio
n of
tota
l pro
tein
(%)
123

Chapter 6
(b)
0
20
40
60
80
100
120
140
160
180
200
4.5 5.5 6.5 7.6pH
Oct
anal
affi
nity
(%)
Figure 5: The proportion of protein (a) and octanal binding affinity (b) in supernatants ( ) and pellets ( ) of
vicilin at various pH. The proportion of protein and octanal binding affinity are expressed as proportion of
the total amount of protein and the binding affinity at pH 7.6, respectively.
Extraction of non-protein components
(i) Hexane extraction
In order to investigate the presence of binding of flavour compounds of non-protein components,
the pellets were analysed for the presence of lipids and carbohydrates, which are known to bind
flavour molecules (Godshall & Solms, 1992; Godshall, 1997; Plug & Haring, 1993; 1994;
Hatchwell, 1994; de Roos, 1997; Rogacheva et al., 1999; Guichard, 2002). Table 3 shows that both
lipids and carbohydrates were found in the untreated vicilin pellets in amounts that could be
responsible for the observed flavour binding.
124

Interaction of pea vicilin
Table 3: Amounts of lipid and carbohydrate of insoluble vicilin fractions at various pHs.
pH Lipids (+/-SD) Carbohydrates (+/-SD) Lipids (+/-SD) Carbohydrates (+/-SD) Lipids (+/-SD) Carbohydrates (+/-SD)
4.5 151 (10) 334 (15) 112 (5) 66 (2) 28 (7) 11 (4)5.5 248 (31) 592 (15) 192 (14) 99 (4) 43 (4) 10 (3)6.5 96 (6) 126 (12) 93 (13) 43 (4) 26 (4) 18 (6)
Non extracted Hexane extracted Ch:MeOH extractedAmount in pellet (µg)
Ch:MeOH stands for chloroform:methanol (1:1) extractionSD is the standard deviation of triplicate samples
Next, the vicilin preparation was subjected to hexane extraction to remove the lipids. The amount of
lipids in the pellets decreased by about 25% after hexane extraction, except in the pellet formed at
pH 6.5 (Table 3). Similarly, the total amount of carbohydrates in the pellets also decreased
substantially after hexane extraction (Table 3). The decrease in the amount of carbohydrates was
larger than the decrease in the amount of lipids. The decrease in the amount of lipids and the
efficient removal of carbohydrates upon hexane extraction, however, did not lead to a decrease in
the binding affinity of the pellets (Table 2).
(ii) Chloroform/methanol extraction
As the hexane extracted vicilin pellets still contained a relatively high amount of lipids, and the
amount of binding of volatile flavour compounds had not decreased upon extraction with hexane
(Table 2), it was speculated that polar lipids, which are not extracted by hexane, might be present.
Hence, the hexane extracted pellets were further extracted with chloroform/methanol (1:1). It can be
seen in Table 3 that the amount of lipids in the pellets decreased on average by about 75% upon
chloroform/methanol (1:1) extraction. Chloroform/methanol (1:1) extraction also removed most of
the carbohydrates that remained after hexane extraction. The removal of lipid components using the
chloroform/methanol extraction led to a decrease in octanal binding, as observed for the pellets
obtained at pH 4.5 and pH 6.5 (Table 2), suggesting that the presence of polar lipid components
might be partly responsible for the high binding affinity for octanal. The decrease in binding affinity
was more pronounced with the pellet obtained at pH 6.5 than with the pellet obtained at pH 4.5.
There was no significant change in the binding affinity of the pellet obtained at pH 5.5, upon
chloroform/methanol extraction, indicating that the pellet obtained at pH 5.5 had a composition
different from those obtained at pH 4.5 and 6.5. Although chloroform/methanol extraction did
reduce the flavour compounds binding affinity, an apparent binding affinity of as low as 1.4
moles/mg protein should be possible (Table 2).
125
Chapter 6
Possible presence of polar lipids
The affinity for octanal seemed to be correlated to carbohydrate content as well as to the lipid
content (Table 2). The lipids present consisted mainly of C18 fatty acid chains (results not shown),
the content of which seemed to correlate with octanal binding. Possible compounds in peas that are
known to be rich in C18 fatty acids are polar lipids such as galactolipids. There are 2 predominant
classes of galactolipids in higher plants, the monogalactosyldiacylglycerols (MGDGs) and the
digalactosyldiacylglycerols (DGDGs) (Dormann & Benning, 2002). MGDGs in general constitute
up to 50% of polar lipids, whereas DGDGs constitute about 20% (Slabas, 1997). The most abundant
class of fatty acids attached to the galactolipids is long chain polyunsaturated fatty acids e.g. α-
linolenic acid (C18) (Dormann & Benning, 2002). It can be seen in Table 3 that the weight ratio
between the removed amounts of lipid (e.g. 149 µg) and the amount of carbohydrate (e.g. 89 µg),
upon chloroform/methanol extraction of hexane treated material, is about 2, for all the pellets. The
molar ratio between the non-polar moiety (glycerol and two C18 fatty acids; molecular weight =
620) and the 2 polar galactose units (Molecular weight = 324) in a DGDG is also approximately 2.
These results may indicate that DGDG type galactolipids were initially present in the pellets and
have been removed during chloroform/methanol extraction (Table 3), which has led to the observed
decrease in the binding affinity of the pellets obtained at pH 4.5 and 6.5 (Table 2).
The vicilin preparation used had a higher binding affinity for aldehydes than for ketones. Although
heat treatment of the protein resulted in an overall reduction in binding of flavour compounds, this
could not be ascribed to a change in the affinity of vicilin for the VOCs. The insoluble vicilin
fractions obtained at various pH contained non-protein components (lipids and carbohydrates),
which had a higher binding affinity for octanal than the protein itself. This finding shows that the
presence of impurities can have a significant influence on observed flavour binding. The presence
of lipids and other non-protein components in protein preparations and their role in flavour binding
should thus be investigated further.
126

Interaction of pea vicilin
LITERATURE CITED
Andriot, I.; Marin, I.; Feron, G.; Relkin, P; Guichard, E. Binding of benzaldehyde by β-lactoglobulin, by
static-headspace and high performance liquid chromatography in different physico-chemical
conditions. Le Lait, 1999, 79, 577-586.
Andriot, I.; Harrison, M.; Fournier, N.; Guichard, E. Interactions between methyl ketones and β-
lactoglobulin: Sensory analysis, headspace analysis, and mathematical modelling. J. Agric. Food
Chem., 2000, 48, 4246-4251.
Arai, S.; Masatochi, N.; Yamashita, M.; Kato, H.; Fujimaki, M. Studies on Flavour components in soybean.
Part VI. Some evidence for occurrence of protein-flavour binding. Agric. Biol. Chem., 1970, 34, 1569-
1573.
Aspelund, T. G.; Wilson, L. A. Adsorption of off-flavour compounds onto soy protein: A thermodynamic
study. J. Agric. Food Chem., 1983, 31, 539-545.
Bligh, E.G.; Dyer, W. J. A rapid method of total lipid extraction and purification. Can. J. Biochem. Physiol.,
1959, 37, 911-916.
Bora, P. S.; Brekke, C. J.; Powers, J. R. Heat induced gelation of pea (Pisum sativum) mixed globulins,
vicilin and legumin. J. Food Sci., 1994, 59, 3, 594-596.
Chung, S.; Villota, R. Binding of alcohols by soy protein in aqueous solutions. J. Food Sci., 1989, 54, 6,
1604-1606.
Creighton, T. E. Proteins, structures and molecular properties, second edition. W. H. Freeman and company,
New York, 1993, pp 507.
Damodaran, S.; Kinsella, J. E. Flavour protein interactions. Binding of carbonyls to bovine serum albumin:
Thermodynamic and conformational effects. J. Agric. Food Chem., 1980, 28, 567-571.
Damodaran, S.; Kinsella, J. E. Interaction of carbonyls with soy protein: Thermodynamic effects. J. Agric.
Food Chem., 1981a, 29, 1249-1253.
Damodaran, S.; Kinsella, J. E. Interaction of carbonyls with soy protein: Conformational effects. J. Agric.
Food Chem., 1981b, 29, 1253-1257.
Damodaran, S.; Kinsella, J. E. Binding of carbonyls to fish actomyosin. J. Agric. Food Chem., 1983, 31,
856-859.
Davies, J.; Lightowler, H. Plant-based alternatives to meat. Nutr. Food Sci., 1998, 98(2), 90-94.
De Ruiter, G. D.; Schols, H. A.; Voragen, A. G. J.; Rombouts, F. M. Carbohydrate analysis of water-soluble
uronic acid-containing polysaccharides with high-performance anion-exchange chromatography using
methanolysis combined with TFA hydrolysis is superior to four other methods. Anal. Biochem., 1992,
207, 176-185.
127
Chapter 6
Derbyshire, E.; Wright, D. J.; Boulter, D. Review. Legumin and vicilin, storage proteins of legume seeds.
Phytochemistry, 1976, 15, 3-24.
DÖrmann, P.; Benning, C. Galactolipids rule in seed plants. Trends Plant Sci., 2002, 7(3), 112-118.
Druaux, C.; Lubbers, S.; Charpentier, C.; Voilley, A. Effects of physico-chemical parameters of a model
wine on the binding of γ-decalactone on bovine serum albumin. Food Chem., 1995, 53, 203-207.
Dumont, J. P. Diacetyl retention by pea protein used as an emulsifier. In: Progress in Flavour Research;
Developments Food sci., 1985, 10, pp. 501-504.
Dumont, J. P.; Land, D. G. Binding of diacetyl by pea proteins. J. Agric. Food Chem., 1986, 34, 1041-1045.
Gatehouse, J. A.; Croy, R. R. D.; Morton, H., Tyler, M., Boulter, D. Characterisation and subunit structures
of the vicilin storage proteins of pea (Pisum sativum L.). Eur. J. Biochem., 1981, 118, 627-633.
Godshall, M. A.; Solms, J. Flavour and sweetener interactions with starch. Food Technol., 1992, 140-145.
Godshall, M. A. How carbohydrates influence flavour. Food Technol., 1997, 51(1), 63-67.
Guéguen, J.; Chevalier, M.; Barbot, J.; Schaeffer, F. Dissociation and aggregation of pea legumin induced by
pH and ionic strength. J. Sci. Food Agric., 1988, 44, 167-182.
Guichard, E.; Langourieux, S. Interactions between β-lactoglobulin and flavour compounds. Food Chem.,
2000, 71, 301-308.
Guichard, E. Interactions between flavour compounds and food ingredients and their influence on flavour
perception. Food Rev. Int., 2002, 18(1), 49-70.
Hansen, A. P.; Booker, D. C. Flavour interaction with casein and whey protein. In: Flavour Food
Interactions, R. J. McGorrin and J. V. Leland Eds.; ACS symposium series 633; American Chemical
Society: Washington, DC, 1996, pp 75-89.
Hatchwell, L. C. Overcoming flavour challenges in low-fat frozen desserts. Food Technol., 1994, 98-102.
King, B. M.; Solms, J. Interactions of flavour compounds in model food systems using benzyl alcohol as an
example. J. Agric. Food Chem., 1979, 27(6), 1331-1334.
Koyoro, H.; Powers, J. R. Functional properties of pea globulin fractions. Cereal Chem., 1987, 64, 97-101.
Landy, P.; Druaux, C.; Voilley, A. Retention of aroma compounds by proteins in aqueous solution. Food
Chem., 1995, 54(4), 387-392.
Li, Z.; Grun, I. U.; Fernando, L. N. Interaction of vanillin with soy and dairy proteins in aqueous model
systems: A thermodynamic study. J. Food Sci., 2000, 65, 6, 997-1001.
Martens, M.; Dalen, A.; Russwurm, H. Flavour science and technology: Proceedings of the 5th Weurman
flavour research symposium. Publisher: Chichester; Wiley, 1987.
O’Keefe, S. F.; Resurreccion, A. P.; Wilson, L. A.; Murphy, P. A. Temperature effect on binding of volatile
flavour compounds to soy protein in aqueous model systems. J. Food Sci., 1991a, 56, 3, 802-806.
128

Interaction of pea vicilin
129
O’Keefe, S. F.; Wilson, L. A.; Resurreccion, A. P.; Murphy, P. A. Determination of the binding of hexanal to
soy glycinin and β-conglycinin in an aqueous model system using headspace technique. J. Agric.
Food Chem., 1991b, 39, 1022-1028.
O’Neill, T. E.; Kinsella, J. E. Flavour protein interactions: Characteristics of 2-nonanone binding to isolated
soy protein fractions. J. Food Sci., 1987a, 52, 1, 98-101.
O’Neill, T.E., Kinsella, J.E. Binding of alkanone flavours to β-lactoglobulin: Effects of conformational and
chemical modification. J. Agric. Food Chem., 1987b, 35(5), 770-774.
O’Neill, T. E.; Kinsella, J. E. Effect of heat treament and modification on conformation and flavor binding
by β-lactoglobulin. J. Food Sci., 1988, 53(3), 906-909.
Owusu-Ansah, Y. J.; McCurdy, S. M. Pea proteins: A review of chemistry, technology of production and
utilisation. Food Rev. Int., 1991, 7, 1, 103-134.
Plug, H.; Haring, P. The role of ingredient-flavour interactions in the development of fat-free foods. Trends
Food Sci. Technol., 1993, 4, 150-152
Plug, H.; Haring, P. The influence of flavour-ingredient interactions on flavour perception. Food Quality &
Preference, 1994, 5, 95-102.
Rogacheva, S.; Espinosa-Diaz, M. A.; Voilley, A. Transfer of aroma compounds in water-lipid systems:
Binding tendency of β-lactoglobulin. J. Agric. Food Chem., 1999, 47, 259-263.
de Roos, K. B. How lipids influence food flavour. Food Technol., 1997, 51(1), 60-62.
Slabas, T. Galactolipid biosynthesis genes and endosymbiosis. Trends Plant Sci., 1997, 2(5), 161-162.
Sosulski, F. W.; McCurdy, A. R. Functionality of flours, protein fractions and isolates from field peas and
faba bean. J. Food Sci., 1987, 52 (4), 1010-1014.

Chapter 7
General Discussion

Chapter 7
The flavour of a food is an important aspect that contributes to a large extent to its acceptability and
quality, which is also true for Novel Protein Foods (NPFs). The interdisciplinary program,
PROFETAS, PROtein Foods Environment Technology And Society, was established with the aim
of providing a toolbox, in which aspects of technology, environment and society are addressed.
Flavour aspects were part of the technological aim to provide knowledge on the production of NPFs
using green peas. Little was known about the endogenous flavour composition of peas and its
protein preparations. In this thesis, both volatile and non-volatile pea flavour compounds were
investigated. For volatiles, the presence of endogenous volatile organic compounds (VOCs) and the
interaction of exogenous VOCs with pea proteins were explored. A number of exogenous VOCs
that resembles those in peas were chosen for interaction studies so as to study retention of flavour
compounds by pea proteins. The influence of heating and the presence of non-protein components,
e.g. lipids, on these interactions were investigated. For non-volatiles, the presence of saponins in
pea flour, and their perceived sensory characteristics, and stability, were studied.
(A) VOLATILES
Affinity of pea proteins for VOCs
Pea vicilin and legumin have shown to differ in their affinities for VOCs as suggested by their
endogenous VOC concentrations (Chapter 5). The interaction of pea vicilin with exogenous VOCs
was studied further in Chapter 6, as it showed greater VOC interaction capacity than pea legumin.
Pea legumin (~60 kDa) was found to have affinity for aldehydes only (Figure 1). At 0.13 mM of
octanal, about 70 nmoles of octanal were bound per mg of legumin and at 0.18 mM of pentanal,
about 50 nmoles of pentanal were bound per mg of legumin, constituting ~51% and ~28% of the
total amount of octanal and pentanal added to the system, respectively. Compared to vicilin,
legumin retains much less aldehyde at the same aldehyde concentration (At 0.03 mM octanal,
vicilin retains ~3500 nmoles/mg, whereas legumin retains ~16 nmoles/mg). From Chapter 5 (Table
2), it was observed that legumin contained substantially more VOCs (in arbitrary units; AU),
noticeably aldehydes and alcohols, than vicilin. This may indicate that legumin has substantially
higher affinity than vicilin and might have endogenous VOCs occupying its available interaction
sites. As a result, a legumin preparation might have little or no retaining capacity for added
aldehydes. In order to make a better comparison on the affinities for flavour retention of legumin
and vicilin, both proteins should ideally be free of any VOCs before interaction studies.
132

General Discussion
0
20
40
60
80
0.00 0.05 0.10 0.15 0.20
Aldehydes concentrations (mM)
Ald
ehyd
es a
ffini
ty (n
mol
es/m
g)
Figure 1: The interaction of 0.1% legumin with aldehydes, octanal (■), heptanal (•), hexanal (▲) and
pentanal (♦) at pH 7.6. Error bars indicate standard deviations.
Factors influencing the retention of VOCs
In addition to proteins, other components in a food matrix such as fats and carbohydrates tend to
adsorb flavour compounds (Plug & Haring, 1993; 1994; Fischer & Widder, 1997), resulting in their
retention (Chapter 5). The retained compounds in peas are mostly odour active VOCs (e.g.
aldehydes, ketones and alcohols), which are degradation products of fatty acids that lead to peas
being perceived as having an ‘off-flavour’ (Murray et al., 1976). For pea proteins to be used as
ingredients, a manufacturer would have to take into consideration the types and quantity of the
VOCs that are present in the pea flour and its protein preparations (Chapter 5), and their odour
activities. For example, three 3-alkyl-2-methoxypyrazines have been identified as natural green pea
flavour by several authors (Murray et al., 1970, 1976; Murray and Whitfield, 1975; Jakobsen et al.,
1998). Although these components were not identified in our studies, in which dried green peas
were used, they should not be overlooked because they are odour active compounds at minute
quantities due to their low threshold values. The detection of these compounds by others may be
due to the use of different types of peas, such as raw green peas (Murray and Whitfield, 1975),
unblanched or blanched frozen peas (Murray et al., 1976; Jakobsen et al., 1998). The absence of
these compounds could also likely be due to the treatments involved in the production of pea
133
Chapter 7
protein preparations. In this thesis, the factors contributing to flavour retention were identified and
discussed further.
(i) Effect of purification
The extraction of pea flour and the purification of pea proteins led to the removal or reduction in
concentrations of some VOCs (Chapter 5; Table 2), which is a positive effect for pea flour and pea
protein preparations to be used as ‘flavour free’ starting materials that would allow wider use of
these ingredients in food production. Depending on the pH, the retention of VOCs in pea flour
varies (Chapter 5; Table 1) with the class and the hydrophobicity of VOC. A higher amount of
VOCs was observed to be released at pH 8 than at pH 4 (Chapter 5; Table 1) and the protein
preparations (protein isolate, legumin and vicilin) contain a lower amount of total volatiles than the
pea flour at the same pH (Chapter 5; Table 2). With respect to NPFs production, one would like to
use the protein preparations that have a low amount of endogenous VOCs, i.e. less probability for
‘off-flavour’. Nevertheless, the success of NPFs should also consider texture, in addition to flavour.
From the work of O’Kane (2004), it is known that pea vicilin has the ability to form transparent
gels, whereas pea legumin and protein isolate formed opaque gels, at minimum gelling
concentrations of 14% (w/v), 10% (w/v) and 16% (w/v), respectively. As the production of NPFs
involves the addition of many other ingredients, gel transparency would be of minor importance
compared to the minimum gelling concentration. Although legumin requires the least amount of
material in order to form a gel, it has the largest amount of endogenous VOCs (Chapter 5; Table 2)
compared to vicilin or protein isolate. Vicilin has lower minimum gelling concentration than protein
isolate, but it would require additional cost for further purification. Depending on the type of NPFs
to be produced, pea vicilin may be an option because it has the minimum amount of components
leading to off-flavour compared to legumin and protein isolate (Chapter 5; Table 2), whereas
protein isolate has the advantage of more cost-effective preparation compared to vicilin. From the
results obtained in this thesis, protein extraction from peas could be done preferably at pH 8, at
which the removal of endogenous VOCs is evidently a positive benefit, however, it may be more
economical to mask off-flavour by e.g. addition of exogenous VOCs.
(ii) Effect of non-protein components on pea vicilin-VOC interactions
The presence of lipids and carbohydrates and their influence on VOC interactions proved to be of
significant importance (Chapter 6). Our results showed that the supposedly ‘pure protein
preparations’ of vicilin contained other components, such as lipids and carbohydrates, which have
134
General Discussion
higher affinity for VOCs than the proteins themselves. Lipids may have a more predominant
influence on flavour retention than carbohydrates (Godshall, 1997). The addition of vegetable oil
has been shown to decrease the odour thresholds of aldehydes significantly (Buttery et al., 1973),
indicating the interaction of lipids and aldehydes. It can be expected that the presence of lipids may
also influence the retention of VOCs by other pea proteins, such as legumin and convicilin. Lipids
may possibly be the reason for the retention of endogenous VOCs (Chapter 5) in the protein
preparations, which may lead to ‘off-flavours’, if used for NPF production. Lipids themselves may
also be ‘off-flavours’. To remove such ‘off-flavours’, one may need to apply an efficient lipid
extraction step prior to protein extraction and purification. Hexane extraction may not sufficiently
remove lipids compared to chloroform/methanol extraction, as can be seen from Chapter 6. As
chloroform/methanol is not food grade, this solvent cannot be used to remove (polar) lipids (and
together with this, off-flavours) from materials to be used as food ingredients. Aqueous ethanol
(e.g. 70%) could be used as an alternative, but the efficiency with respect to lipids/off-flavours
removal remains to be established. In addition, this treatment may lead to a change in protein
conformation, which may result in a protein that is not functional for gelling, and this requires
further investigation.
In conclusion, the presence of VOCs in pea flours and pea protein isolates would be of greater
importance than their presence in the pure protein preparations, as most industrial products contain
these two ingredients. In addition, heating was found to cause a significant reduction in the amount
of exogenous VOCs retained by vicilin (Chapter 6), which is likely due to a change in the protein’s
structure (e.g. aggregation). On the other hand, heat can also cause the release of endogenous VOCs
(Chapter 5), giving a ‘flavour free’ protein with more industrial flexibility.
(B) NON-VOLATILES
Characteristics of pea saponins
Most of the saponins isolated from plants are reported to be bitter in taste, such as from peas (Price
& Fenwick, 1984; Price et al., 1985; Heng et al., 2005). Pea saponins, namely DDMP saponin and
saponin B, were found to be present in pea flour of various pea varieties (Chapter 3) with DDMP
saponin being the predominating saponin. These saponins were found to be bitter even at
concentrations as low as 2 mg/L, with DDMP saponin being significantly more bitter than saponin
B (Chapter 3). DDMP saponin has a similar threshold level to the common bitter reference
135
Chapter 7
compound, quinine sulphate, both are perceived at concentration < 2 mg/L, whereas that of saponin
B is ~ 8 mg/L (Chapter 3). Moreover, saponins were also reported to have affinity for proteins
(Potter et al., 1993; Ikedo et al., 1996; Shimoyamada et al., 1998, 2000; Morton & Murray, 2001;
Liu et al., 2003) and were found to be present in pea protein isolates (Heng et al., 2004). Therefore,
pea flours and pea protein isolates, which are used industrially as ingredients for non-meat products,
e.g. NPFs (Davies & Lightowler, 1998), may be bitter and bitterness should preferably be removed
or masked. Assuming that there are 0.2% (w/w) saponins in pea flour (Heng et al., 2005), which has
a protein content of ~25% (Casey, 2003), and that all saponins end up in the protein isolate fraction
during protein extraction, it can be calculated that the protein isolate contains approximately 0.8%
(w/w) saponins. The protein isolate is used to make NPF, which requires a high amount of protein,
e.g. 55% protein is used to make Tivall vegetarian frankfurter. This will result in 4.4 g of saponin
per kg of the NPF product. Assume that during processing, all DDMP saponins are converted to
saponin B (Chapter 2). The resulting NPF would have a threshold value of 4400 mg/kg, which is at
least 500 times more than the threshold value of saponin B (8 mg/L = 8 mg/kg), and therefore the
taste of the product will be very bitter. One may consider using pea varieties that contain relatively
low amount of saponins (Chapter 3). The variety with the lowest saponin content is 3 times lower
than the variety with the highest saponin content. This is, however, insufficient to overcome the
much higher threshold present in the NPF. Therefore, to produce an NPF that has no bitterness and
has an acceptable texture, saponins would preferably be removed; by e.g. 70% ethanol extraction.
Alternatively, exogenous VOCs would have to be added to mask bitterness. It is also important to
note that the results obtained in our studies (Chapter 2 and 3) were achieved from tests using pure
saponin preparations that contained only DDMP saponin and saponin B. It is possible that the
behaviour of DDMP saponin, which was observed to be unstable in the pure systems, and its taste
perception, may be different within a complex food matrix containing other components e.g.
proteins, and this is thus worth investigating further.
Saponin analysis
The bitterness of peas is related to their saponin contents, which is in turn dependent on the pea
variety (Chapter 3). Several other studies have shown that pea varieties differ in saponin content
(Bishnoi & Khetarpaul, 1994; Daveby et al., 1997), but the saponin contents reported in these
studies vary greatly and often depend on the methods used for extraction and quantitative analysis
(Table 1).
136
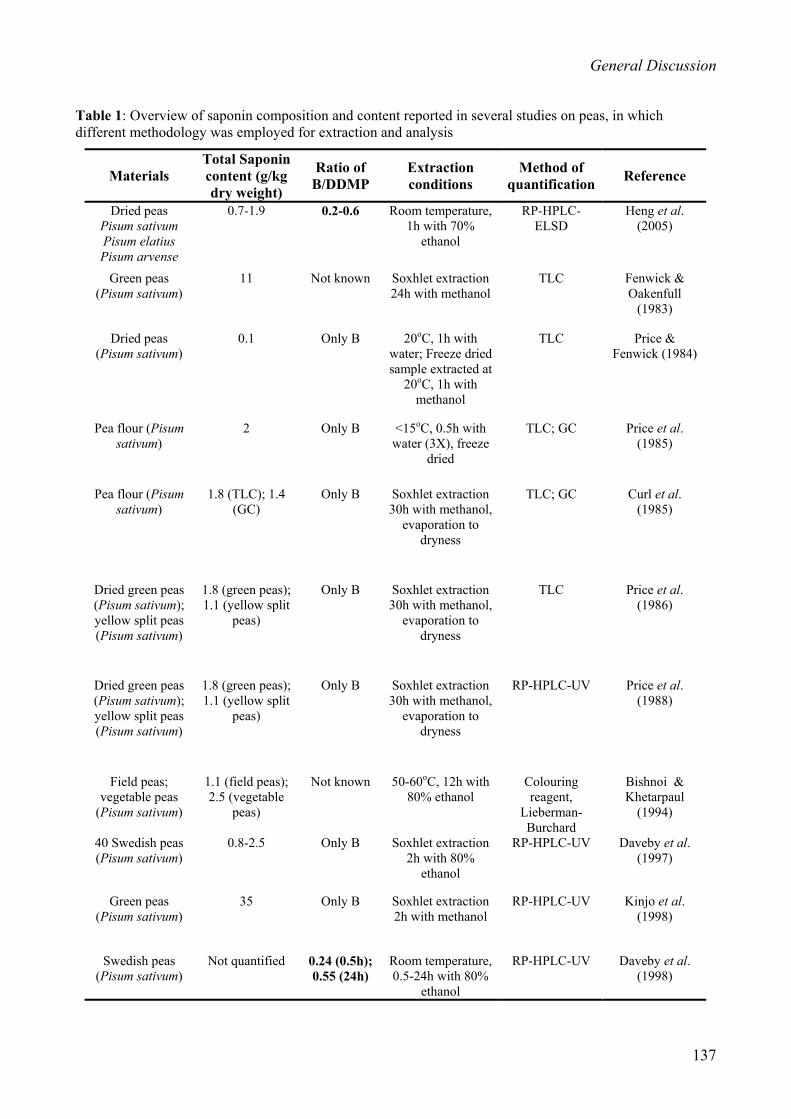
General Discussion
Table 1: Overview of saponin composition and content reported in several studies on peas, in which different methodology was employed for extraction and analysis
Materials Total Saponin content (g/kg dry weight)
Ratio of B/DDMP
Extraction conditions
Method of quantification Reference
Dried peas Pisum sativum Pisum elatius Pisum arvense
0.7-1.9 0.2-0.6 Room temperature, 1h with 70%
ethanol
RP-HPLC-ELSD
Heng et al. (2005)
Green peas (Pisum sativum)
11 Not known Soxhlet extraction 24h with methanol
TLC Fenwick & Oakenfull
(1983)
Dried peas (Pisum sativum)
0.1 Only B 20oC, 1h with water; Freeze dried sample extracted at
20oC, 1h with methanol
TLC Price & Fenwick (1984)
Pea flour (Pisum sativum)
2 Only B <15oC, 0.5h with water (3X), freeze
dried
TLC; GC Price et al. (1985)
Pea flour (Pisum sativum)
1.8 (TLC); 1.4 (GC)
Only B Soxhlet extraction 30h with methanol,
evaporation to dryness
TLC; GC Curl et al. (1985)
Dried green peas (Pisum sativum); yellow split peas (Pisum sativum)
1.8 (green peas); 1.1 (yellow split
peas)
Only B Soxhlet extraction 30h with methanol,
evaporation to dryness
TLC Price et al. (1986)
Dried green peas (Pisum sativum); yellow split peas (Pisum sativum)
1.8 (green peas); 1.1 (yellow split
peas)
Only B Soxhlet extraction 30h with methanol,
evaporation to dryness
RP-HPLC-UV Price et al. (1988)
Field peas; vegetable peas
(Pisum sativum)
1.1 (field peas); 2.5 (vegetable
peas)
Not known 50-60oC, 12h with 80% ethanol
Colouring reagent,
Lieberman-Burchard
Bishnoi & Khetarpaul
(1994)
40 Swedish peas (Pisum sativum)
0.8-2.5 Only B Soxhlet extraction 2h with 80%
ethanol
RP-HPLC-UV Daveby et al. (1997)
Green peas (Pisum sativum)
35 Only B Soxhlet extraction 2h with methanol
RP-HPLC-UV Kinjo et al. (1998)
Swedish peas (Pisum sativum)
Not quantified 0.24 (0.5h); 0.55 (24h)
Room temperature, 0.5-24h with 80%
ethanol
RP-HPLC-UV Daveby et al. (1998)
137

Chapter 7
It can be seen from Table 1 that other authors, who used TLC or RP-HPLC methods, reported the
presence of only saponin B, except for Daveby et al. (1998). Although these authors used mild
extraction conditions, they may have overlooked a critical factor that is necessary to maintain
DDMP saponin stability (Chapter 2), and hence only found saponin B. Although the extractions
used by these authors were done using Soxhlet refluxing (boiling) in the presence of ethanol or
methanol, i.e. at conditions at which DDMP saponin may be expected to be stable (Chapter 2), the
prolonged evaporation step, which is necessary after extraction to remove the ethanol or methanol,
may have resulted in the release of all DDMP groups present.
The DDMP group is attached to C19 of saponin B aglycone (Chapter 4; Table 2) by an ether
linkage, which is sensitive under various conditions (Chapter 2) and easily removed from the
aglycone. It is possible that other groups attached to C19 (Chapter 4; Table 2) by the same linkage
might also be easily detached from their aglycones under similar conditions mentioned in Chapter
2. The angeloyl group attached by an ether linkage to C19 (Chapter 4; Figure 5) of the aglycones,
protoaescigenin or barringtogenol (Chapter 4; Figure 3; Skeleton 1), may likely detached under the
extraction conditions of 20% methanol and boiling for 3 h (Voutquenne et al., 2002) and boiling in
20% methanol (Massiot et al., 1992). Under such extraction conditions, labile saponins may be
relatively unstable (Chapter 2). Therefore, it would be necessary to use mild extraction conditions
(Chapter 2) when isolating these saponins, to avoid underestimating their quantities.
In conclusion, the work done on saponins has provided a deeper understanding of saponins
stabilities through the process of optimising the method of extraction. With the various conditions
for DDMP stability known, the controversial issue of native saponin in peas was resolved. A
reproducible method that extracts native saponin from peas also allowed the determination of
DDMP saponin bitterness in comparison to saponin B. The relationship between saponin contents
and bitterness has given a reason for the use of pea varieties with low saponin contents for food
application.
Future exploration
The results achieved in this research have contributed to a better understanding on the behaviour of
flavour compounds in pea and its protein preparations, which is helpful in exploring further use of
peas as food ingredients, with the ultimate aim to produce pea products with acceptable aroma and
138
General Discussion
taste. Although pea proteins play a role in flavour retention, results from this thesis show that non-
protein components may be of major importance in flavour retention. Therefore, their flavour
retention ability and/or their removal without interfering with the properties of proteins should be
explored further. The interaction of flavour compounds with pea flour and pea protein isolates, the
most likely pea ingredients in NPFs production, should be further investigated.
Although not investigated, the possibility of saponins interfering with protein-VOC interactions
should not be overlooked. There are several reports that have shown saponins interacting
hydrophobically with proteins, such as bovine serum albumin (Ikedo et al., 1996), soy proteins
(Shimoyamada et al., 1998) and β-lactoglobulin (Shimoyamada et al., 2000). This means that
saponins may occupy the hydrophobic pockets on the proteins and thus may compete with VOCs
for the same interaction sites, or create more sites on the proteins. The retention of added VOCs
could, hence, be reduced or be enhanced due to the presence of saponins, which would be an
interesting area to explore.
It is known that there are some saponins that are sweet. Chapter 1 shows that saponins containing
different skeletons can have the same sensory property, and that saponins of the same skeleton can
have different taste. This indicates that sweetness or bitterness is not skeleton-dependent, but that
taste perception resides in the type of substituents (both sugar residues and other functional groups)
attached to the skeletons, as well as the stereochemistry of the attached substituents. Consider the
structures of sweet liquorice saponins in comparison to that of bitter saponin B (Chapter 1; Figure
2). To become sweet, saponin B would require a number of modifications, such as the addition of a
carbonyl at C11. Nevertheless, it would already be sufficient to obtain a saponin with a neutral
taste, which probably requires less conversion steps. The conversion of bitterness to neutral taste,
which can possibly be obtained by fermentation, is another interesting aspect for further research.
139
Chapter 7
LITERATURE CITED
Bishnoi, S.; Khetarpaul, N. Saponin content and trypsin inhibitor of pea cultivars: Effect of domestic
processing and cooking methods. J. Food Sci Tech., 1994, 31, 73-76.
Buttery, R. G.; Guadagni, D. G.; Ling, L. C. Flavour compounds: Volatilities in vegetable oil and oil-water
mixtures. Estimation of odor thresholds. J. Agric. Food Chem., 1973, 21, 2, 198-201.
Casey, R. Pea legumins and vicilins. In Industrial Proteins in Perspective; W. Y. Aalbersberg, R. J. Hamer,
P. Jasperse, H. J. J. de Jongh, C. G. de Kruif, P. Walstra, F. A. de Wolf Eds; Elvesier Science B. V.,
The Netherlands, 2003, Progress in Biotechnology Volumn 23, pp. 49-55.
Curl, C. L.; Price, K. R.; Fenwick, G. R. The quantitative estimation of saponin in pea (Pisum sativum L.)
and soya (Glycine max). Food Chem., 1985, 18, 241-250.
Daveby, Y. D.; Aman, P.; Betz, J. M.; Musser, S. M.; Obermeyer, W. R. The variation in content and
changes during development of soyasaponin I in dehulled Swedish peas (Pisum sativum L). J. Sci.
Food Agric., 1997, 73, 391-395.
Daveby, Y. D.; Aman, P.; Betz, J. M.; Musser, S. M. Effect of storage and extraction on the ratio of
soyasaponin I to 2,3-Dihydro-2,5-dihydroxy-6-methyl-4-pyrone-conjugated soyasaponin I in dehulled
peas (Pisum sativum L). J. Sci. Food Agric., 1998, 78, 141-146.
Davies, J.; Lightowler, H. Plant-based alternatives to meat. Nutr. Food Sci., 1998, 98(2), 90-94.
Fenwick, D. E.; Oakenfull, D. Saponin content of food plants and some prepared foods. J. Sci. Food Agric.,
1983, 34, 186-191.
Fischer, N.; Widder, S. How proteins influence food flavour. Food Tech., 1997, 51, 1, 68-70.
Godshall, M. A. How carbohydrates influence flavour. Food Technol., 1997, 51(1) 63-67.
Heng, L.; van Koningsveld, G. A.; Gruppen, H.; van Boekel, M. J. A. S.; Vincken, J-P.; Roozen, J. P.;
Voragen, A. G. J. Protein-flavour interactions in relation to development of novel protein foods.
Trends Food Sci. Technol., 2004, 15, 217-224.
Heng, L.; Vincken, J-P.; van Koningsveld, G. A.; Legger, L.; Roozen, J. P; Gruppen, H.; van Boekel, M. A.
J. S.; Voragen, A. G. J. Bitterness of saponins and their contents in peas. J. Agric. Food Chem., 2005,
(Submitted).
Ikedo, S.; Shimoyamada, M.; Watanabe, K. Interaction between bovine serum albumin and saponin as
studied by heat stability and protease digestion. J. Agric. Food Chem., 1996, 44, 792-795.
Jakobsen, H. B.; Hansen, M.; Christensen, M. R.; Brockhoff, P. B.; Olsen, C. E. Aroma volatiles of blanched
green peas (Pisum sativum L.) J. Agric. Food Chem., 1998, 46, 3727-3734.
Kinjo, J.; Hatakeyama, M.; Udayama, M.; Tsutanaga, Y.; Yamashita, M.; Hohara, T.; Yoshika, Y. HPLC
profile analysis of oleanene-glucuronides in several edible beans. Biosci. Biotechnol. Biochem., 1998,
62(3), 429-433.
140

General Discussion
141
Liu, Y.; Xie, M-X.; Kang, J.; Zheng, D. Studies on the interaction of total saponins of panaz notoginseng and
human serum albumin by Fourier transform infrared spectroscopy. Spectrochimica Acta Part A:
Molecular and Biomolecular Spectroscopy, 2003, 59(12), 2747-2758.
Massiot G.; Chen, X. F.; Lavaud, C.; Le Men-Olivier, L.; Delaude, C.; Viari, A.; Vigny, P.; Duval, J.
Saponins from stem bark of Petersianthus macrocarpus. Phytochemistry, 1992, 31(10), 3571-3576.
Morton, P. A. J.; Murray, B. S. Acid beverage floc: protein-saponin interactions and an unstable emulsion
model. Colloids Surf., B, 2001, 21, 101-106.
Murray, K. E.; Shipton, J.; Whitfield, F. B. 2-methoxypyrazines and the flavour of green peas (Pisum
sativum). Chem. Ind., 1970, 897-898.
Murray, K. E.; Whitfield, F. B. The occurrence of 3-alkyl-2-methoxypyrazines in raw vegetables. J. Sci.
Food Agric., 1975, 26, 973-986.
Murray, K. E.; Shipton, J.; Whitfield, F. B.; Last, J. H. The volatiles of off-flavoured unblanched green peas
(Pisum sativum). J. Sci. Food Agric., 1976, 27, 1039-1107.
O’Kane, F. E. Molecular characterisation and heat-induced gelation of pea vicilin and legumin. PhD thesis,
Wageningen University, The Netherlands, 2004.
Plug, H.; Haring, P. The role of ingredient-flavour interactions in the development of fat-free foods. Trends
Food Sci. Technol., 1993, 4, 150-152.
Plug, H.; Haring, P. The influence of flavour-ingredient interactions on flavour perception. Food Quality &
Preference, 1994, 5, 95-102.
Potter, S. M.; Flores, J. R.; Pollack, J.; Lone, T. A.; Jimenez, M. D. B. Protein-saponin interaction and its
influence on blood lipids. J. Agric. Food Chem., 1993, 41, 1287-1291.
Price, K. R.; Fenwick, G. R. Soyasaponin I, a compound possessing undesirable taste characteristics isolated
from dried pea (Pisum sativum L.). J. Sci. Food Agric., 1984, 35, 887-892.
Price, K. R.; Griffiths, N. M.; Curl, C. L.; Fenwick, G. R. Undesirable sensory properties of the dried pea
(Pisum sativum). The role of saponins. Food Chem., 1985, 17, 105-115.
Price, K. R.; Curl, C. L.; Fenwick, G. R. The saponin content and sapogenol composition of the seed of 13
varieties of legume. J. Sci. Food Agric., 1986, 37, 1185-1191.
Price, K. R.; Eagles, J.; Fenwick, G. R. Saponin composition of 13 varieties of legume seed using fast atom
bombardment mass spectrometry. J. Sci. Food Agric., 1988, 42, 183-193.
Shimoyamada, M.; Ikedo, S.; Ootsubo, R.; Watanabe, K. Effects of soybean saponins on chymotryptic
hydrolyses of soybean proteins. J. Agric. Food Chem., 1998, 46, 2, 4793-4794.
Shimoyamada, M.; Ootsubo, R.; Naruse, T.; Watanabe, K. Effects of soybean saponin on protease
hydrolyses of β-lactoglobulin and α-lactalbumin. Biosci. Biotechnol. Biochem., 2000, 64, 4, 891-893.
Voutquenne, L.; Kokougan, C.; Lavaud, C.; Pouny, I; Litaudon, M. Triterpenoid saponins and acylated
prosapogenins from Harpullia austro-caledonica. Phytochemistry, 2002, 59, 825-832.


Summary
SUMMARY
This thesis forms part of the multidisciplinary program, PROFETAS, PROtein Foods Environment
Technology And Society, which was established with the aims to provide knowledge on
technological, environmental and societal aspects for the development of novel protein foods
(NPFs) based on pea proteins. The aim of this thesis is to investigate the flavour aspects of peas and
its protein fractions, which are potential ingredients for use in NPFs. Both volatile and non-volatile
pea flavours were explored. For volatiles, an inventory of endogenous volatile organic compounds
(VOCs) from pea flour and pea protein preparations was made, and the interactions of exogenous
VOCs with pea proteins were studied. The influence of heat and the presence of non-protein
components on flavour retention were also investigated. For non-volatiles, saponins in pea flour
were identified and quantified, and their sensory characteristics and stability were studied.
Chapter 1 introduces pea and its composition, which include pea proteins as well as endogenous
flavour components. Flavour properties and perception in general as well as the types of flavour
components present in peas, namely the volatile organic compounds and the non-volatile saponins
are described. Interactions of proteins with volatile and non-volatile components are discussed.
Chapter 2 illustrates a method designed for isolating native saponins from peas, and how
temperature, pH and ethanol concentration influence the stability of the saponins. DDMP saponin
and saponin B were found to be present in peas. With careful optimisation of an extraction method,
DDMP saponin was isolated as the predominant saponin and was used for stability studies. DDMP
saponin in water was observed to be unstable at temperatures > 30 oC, and at acidic and alkaline
pHs, with an optimal stability around pH 7. The loss of the DDMP group at 65 °C was prevented at
> 30% (v/v) ethanol. The breakdown reaction of DDMP saponin (to give saponin B) has an
activation energy of ~49 kJ/mol, indicating a chemical reaction with moderate temperature
dependence. The mechanism of DDMP saponin decomposition is suggested to consist of a fast
protonation or deprotonation, followed by a rate-determining step in which maltol is the leaving
group.
Chapter 3 presents the types and amounts of saponin in 16 pea varieties with the optimised method
of Chapter 2, and shows the difference in bitterness of saponin B and DDMP saponin. Using a
trained panel, DDMP saponin was found to be significantly more bitter than saponin B and the
143
Summary
perceived bitterness was found to correlate to saponin concentration. DDMP saponin has similar
threshold level to the common reference bitter compound, quinine sulphate; both are perceived at a
concentration of < 2 mg/L, whereas that of saponin B is ~ 8 mg/L. In addition, the 16 pea varieties
investigated differed significantly in saponin content (0.7-1.9 g/kg; dry matter). DDMP saponin was
more abundant than saponin B in all varieties; in two varieties, DDMP saponin was the only
saponin present.
Chapter 4 gives an overview of the structures of plant saponins that have been isolated and
characterised till present, and relates the structures to their distribution in the plant kingdom. The
different cyclization mechanisms of oxidosqualene formed the basis of skeletal classification. A
total of 21 skeletons were classified into 5 main classes of 66666, 66665A, 66665B, 6665A and
6665B, and the oleanane skeleton of group 66666 was found to be the most common skeleton
present in most orders of the plant kingdom. An overview of the type of substituents and sugar
chains attached to oleanane skeleton showed that the type of substituents and their position of
attachment do not seem to be plant order-specific, and that sugar chains of 1 to 8 sugar residues can
be attached to mainly C2 and/or C18 of the skeleton.
Chapter 5 gives an overview of the type and amount of volatile organic compounds (VOCs)
released from pea flour, pea protein isolate and legumin and vicilin preparations. The effect of pH
on the release of the volatiles from the pea flour and the effect of protein purification steps were
investigated. There were 3 main groups of volatile organic compounds released from pea flour and
its protein preparations: the aldehydes, ketones and alcohols, which differed in concentration. Both
pH and protein purification were found to have a large effect on the amount and type of VOCs
released, which could be explained by their log P values: VOCs with low log P values were
extracted with aqueous solvents, whereas those with high log P values were retained in the protein
preparations.
Chapter 6 describes the interaction of model VOCs (aldehydes and ketones) with pea vicilin at
various concentrations. Vicilin was found to interact with both aldehydes and ketones at pH 7.6, and
heating at 90 oC resulted in a decrease of these interactions. The insoluble fractions of vicilin
preparations at pH 4.5, 5.5 and 6.5, which showed remarkably high affinities for octanal, were
found to contain relatively high amounts of lipids and carbohydrates. The insoluble fractions at pH
4.5 and 6.5 showed a greater decrease in lipid than in carbohydrate contents after extraction with
144
Summary
145
various organic solvents. This decrease also led to a significant reduction in the retention of VOCs,
indicating that lipids and carbohydrates have higher affinity than vicilin for the tested VOCs.
Chapter 7 discusses the factors affecting volatile flavour retention and the characteristics of pea
saponins, and relates the importance of volatile and non-volatile flavour compounds of pea
ingredients for use in the development of novel protein foods. This thesis encompasses substantial
knowledge on endogenous and exogenous flavour aspects of pea flour and ingredients, which are
essential for successful development of NPFs that have good taste.

Samenvatting
SAMENVATTING
Het werk beschreven in dit proefschrift is onderdeel van het multidisciplinaire programma
PROFETAS, PROtein Foods Environment Technology And Society. Het doel van PROFETAS was
het ontwikkelen van innovatieve, eiwitrijke levensmiddelen op basis van erwteneiwitten, met
speciale aandacht voor technologische, maatschappelijke en milieu implicaties. Dit proefschrift
beschrijft de relatie tussen eiwitfracties uit erwten welke als potentiële ingrediënten voor NPF’s zijn
geïdentificeerd en hun impact op aroma. Zowel vluchtige als niet-vluchtige erwtenaroma’s zijn
onderzocht. Voor vluchtige aroma’s werd een inventarisatie gemaakt van vluchtige organische
componenten (VOC’s) uit erwtenbloem- en erwteneiwitpreparaten. Tevens werden interacties
tussen toegevoegde niet-erwten VOC’s en erwteneiwitten bestudeerd. Daarnaast is de invloed van
verhitting en de aanwezigheid van niet-eiwitcomponenten op aromabehoud onderzocht. Saponinen
werden als niet-vluchtige componenten in erwtenbloem geïdentificeerd. Naast een kwantificering
van saponinen in erwtenbloem werden de sensorische eigenschappen en de stabiliteit van een
specifiek saponine-type bestudeerd.
In Hoofdstuk 1 werden erwten en de samenstelling van erwten inclusief erwteneiwitten
geïntroduceerd. De eigenschappen van endogene aromacomponenten, waaronder de VOC’s en de
niet-vluchtige saponinen, worden beschreven. De interacties van erwteneiwitten met vluchtige en
niet-vluchtige componenten worden bediscussieerd.
In Hoofdstuk 2 wordt een methode voor isolatie van natieve saponinen uit erwten toegelicht.
Ofschoon de klasse der saponinen vele verschillende verbindingen omvat, bleek erwt slechts twee
typen te bevatten, DDMP-saponine en saponine B. Het was bekend dat DDMP-saponine labiel is,
en gemakkelijk omgezet kan worden tot saponine B door afsplitsing van de DDMP-groep. Met
behulp van een zorgvuldig geoptimaliseerde extractiemethode kon DDMP-saponine worden
geïdentificeerd als het meest voorkomende saponine in erwt.. De stabiliteit van de verkregen
saponinen wordt onderzocht in relatie tot de temperatuur, pH en ethanolconcentratie. DDMP-
saponine bleek instabiel te zijn in water bij temperaturen boven de 30°C en bij zure en basische pH-
waarden, en had een maximale stabiliteit rond pH 7. Het verlies van de DDMP-groep bij 65°C trad
niet op wanneer de ethanolconcentratie van het oplosmiddel groter was dan 30% (v/v). De
activeringsenergie voor het uiteenvallen van DDMP-saponine is ongeveer 49 kJ/mol, hetgeen een
147

Samenvatting
chemische reactie met een matige temperatuursafhankelijkheid suggereert. Het mechanisme van
uiteenvallen van DDMP-saponine bestaat waarschijnlijk uit een snelle protonerings- of
deprotoneringsreactie, gevolgd door een snelheidsbepalende stap met maltol als de vertrekkende
groep.
In Hoofdstuk 3 wordt de geoptimaliseerde extractiemethode, beschreven in hoofdstuk 2, toegepast
om saponinegehalte en –compositie in 16 erwtenrassen te bepalen. De 16 erwtenrassen waren
significant verschillend in saponinegehalte (0.7-1.9 g/kg drooggewicht). In alle rassen was de
concentratie DDMP-saponine groter dan die van saponine B. In twee varianten was alleen DDMP-
saponine aanwezig. Tevens wordt het verschil in bitterheid tussen saponine B en DDMP-saponine
beschreven. Met behulp van een getraind panel werd DDMP-saponine significant bitterder
bevonden dan saponine B, en de waargenomen bitterheid correleerde aan de saponineconcentratie.
DDMP-saponine heeft een vergelijkbare waarnemingsdrempel als de bittere referentiecomponent
quininesulfaat. DDMP-saponine wordt reeds waargenomen bij een concentratie van 2 mg/mL,
terwijl saponine B wordt waargenomen bij 8 mg/mL.
In Hoofdstuk 4 wordt een overzicht gegeven van de structuren van alle saponinen in planten die tot
nu toe zijn geïsoleerd en gekarakteriseerd; de distributie van de verschillende structuren over het
plantenrijk wordt beschreven. Saponinen worden in de plant gesynthetiseerd uit oxidosqualeen, een
molecuul met 30 koolstofatomen. Dit nagenoeg lineaire molecuul kan op verschillende manieren
gecycliseerd worden, onder invloed van zogenaamde cyclasen. De verschillende
cyclisatiemechanismen van oxidosqualeen tot een koolstofskelet bestaande uit verschillende ringen
vormde de basis voor onze classificatie van saponinen. In totaal werden 21 skeletten geclassificeerd
binnen de volgende vijf hoofdgroepen; 66666, 66665A, 66665B, 6665A en 6665B. Het
zogenaamde oleanaanskelet van groep 66666 bleek in vrijwel het gehele plantenrijk voor te komen.
Een overzicht van de typen substituenten en de suikerketens verbonden aan het oleanaanskelet
toonden aan dat het type substitutie en hun positie aan het skelet niet plantorde-specifiek waren. De
suikerketens bestaande uit 1 tot 8 suikerresiduen waren voornamelijk gebonden aan C2 en/of C18
van het skelet.
In Hoofdstuk 5 wordt een overzicht gegeven van de typen en de concentratie vluchtige organische
componenten (VOC’s) vrijgemaakt uit erwtenbloem, erwteneiwitisolaat en legumine- en
vicilinepreparaten. Legumine en viciline zijn de twee belangrijkste klassen van opslageiwitten in de
148

Samenvatting
149
erwt. Drie hoofdgroepen VOC’s werden geïdentificeerd. Dit zijn aldehyden, ketonen en alcoholen
en ze verschillen in concentratie. De pH en de wijze van eiwitzuivering bleken beide een groot
effect te hebben op de concentratie en het type van de vrijgekomen VOC’s. De waarnemingen
waren in overeenstemming met de log P-waarden (een maat voor polariteit) van de VOC’s. VOC’s
met lage log P-waarden werden geëxtraheerd met waterige oplosmiddelen, terwijl VOC’s met een
hoge log P-waarden in de eiwitpreparaten werden behouden.
In Hoofdstuk 6 wordt de binding van model-VOC’s (aldehydes en ketonen) aan erwtenviciline in
diverse concentraties beschreven. Viciline liet een interactie zien met zowel aldehydes als ketonen
bij pH 7.6. Verhitten bij 90°C vertoonde een afname van binding van VOCs aan viciline. Viciline
bleek niet volledig oplosbaar te zijn bij verschillende pHs. Het onoplosbare deel bij pH 4.5, 5.5 en
6.5 had een opvallend hoge affiniteit voor octanal. Waarschijnlijk is dit te wijten aan een relatief
hoge concentratie aan lipiden en koolhydraten. Na extractie met diverse organische oplosmiddelen
vertoonden de onoplosbare fracties bij pH 4.5 en 6.5 een relatief grote afname in, met name,
lipiden. De organisch oplosmiddel geëxtraheerde fracties lieten een significante reductie in de
retentie van VOC’s zien, hetgeen suggereert dat lipiden en koolhydraten een hogere affiniteit voor
de geteste VOC’s hebben dan het eiwit viciline.
Tenslotte worden in Hoofdstuk 7 de factoren beschreven die invloed hebben op de retentie van
vluchtige aroma’s en de eigenschappen van erwtensaponines. De toepassing van vluchtige en niet-
vluchtige aromacomponenten uit erwteningrediënten worden bediscussieerd besproken in het kader
van innovatieve eiwitlevensmiddelen. Dit proefschrift bevat substantiële kennis over endogene en
exogene aroma-aspecten van erwtenbloem en -ingrediënten welke essentieel zijn voor een
succesvolle ontwikkeling van sensorisch acceptabele NPF’s.

PROFETAS( )
(NPFs)
pH
DDMP B
DDMP
DDMP 30oC pH
7 65oC 30% DDMP D
DMP 49KJ/mol
DDMP
16
B DDMP DDMP
B DDMP
2mg/L B 8mg/
L 16 0.7 1.9g/kg
DDMP B DDMP
151
152
21
5 66666 66665A 66665B 6665A
6665B 66666
1 8 C2
C8
VOCs(
) pH
3 VOCs
pH VOCs
LogP LogP VOCs
LogP VOCs
VOCs( )
pH7.6 90oC p
H4.5 5.5 6.5
pH4.5 6.
5 VO
Cs VOCs


Acknowledgements
Success and accomplishments are achieved with advice and assistance
With no exception, this thesis was completed with help from many directions
Therefore, everyone who have given his/her presence and guidance
I want to thank them all with sincere compliments
My gratefulness to the Lord Almighty
Who has given me His Provision continually
For His presence and wisdom infinitely
And His peace to me unceasingly
Mum and Dad who are supportive all the way
Brother and sisters who remember to pray
Uncles and aunties who give their blessings from far away
Blessed I am everyday
Many thanks to my Promoters, Fons and Tiny
For giving me this PhD opportunity
You have given your time despite being busy
And your scientific wisdom generously
My Co-promoter and mentor, Jean-Paul
Who always ensure that I never trip and fall
Time and knowledge you graciously give them all
Whenever I need your help I can easily call
Gerrit and Sander, my supervisors who helped me daily
Thank you for your patience and availability
With your encouragement and help continuously
My daily tasks I had performed more efficiently
Two more supervisors, Jacques and Harry
Your contribution is also plenty
Jacques for your Flavour Theory
Harry for your Protein Chemistry
Francesca, the dearest green pea colleague of mine
Whom I worked with from 7am to evening at nine
Laborious and problematic is our pea purification line
But all went easy with your company and laughter combine
Oom (Uncle) Jan, my GC assistance and friend
We are generations apart, but look! How well we have blend!
No matter how busy, your helping hand is ready to lend
The GC that I had ‘destroyed’ you were ready to mend!
My travel mates, Kerensa and Stephanie
To Singapore you had been to spend your money
You found Vietnam rather than Korea more sunny
And realised that Asian men can never be your honey!
Laurice, Stephanie G and Nathalie
Dearest colleagues of the French community
Thank you for your valuable company
And the many dinners we had shared occasionally
Sergio, my dear colleague from Spain
An ‘old’ man he is, who always has back pain
Despite lots of complaints, laughter you have maintain
Your jokes and philosophy have keep me entertain
René and Joris, who shared the same office with me
Both of them like coffee but I only drink tea
René loves walking in the forest and fishing in the sea
Joris loves dancing salsa in Café Vrijheid he will be

Karel, my saponin buddy
Always appears with your hair a bit messy
HPLC is always our worse calamity
But our friendship is the best eventuality
My students, Sanne, Alex and Kristin
Great help to me you had been
Thank you for the work that you were doing
The results obtained I put them down in writing
Renate, Gert-Jan, Marianne and Catriona,
Bas, Bram, Hauke, and Julia,
Toos, Peter W, Peter I, Jolanda
Your company is as great as you are
Margaret, Aagje, Wil and Karin,
Ben, Mirjam, Junrong, and Edwin
René K, Jolan, Willemiek and Dayun
How helpful you had all been
Chantal, Chen, Maria and Ada
Egle, Mingwei, Manolis and Nika
Hans B, Agnes, Rosita and Laynah
Your friendship is like a shining star
I hope I did not miss out anybody
If I do, I am truly sorry
Simply come and tell me directly
And I’ll surely acknowledge you personally!

Specially to Jean-Paul
I am sure you remember our saponin soap story
The brilliant idea that you came up so suddenly!
Cutting and pasting structures for several weeks daily
From a few hundred articles I got them ready
I had more than 80 pages documented
Showing it to you, you almost fainted!
Must shrink it down to 1 single page, you commanded
It has to be published and to be cited, you ordered!
Painstakingly, I began the process of shrinking
From 40 to 18 to 12 to 6...seems never ending...
Correction and discussion till 9pm in the evening
You were very helpful yet demanding...
At last! I got it down to a single page!
19 structures 'squeezed' almost to the edge
So much time and effort that we had engaged
I thought over the months a lot I had aged!
Thereafter we still had much discussion and revision
From 19 structures, one by one we had few more addition
From Netherlands to Sweden we obtained comments and suggestion
With the ultimate aim to get it accepted for publication

Especially to Alessandro
To my confidant and companion, Alessandro
Who loves the dark, cream-filled cookies, Oreo
You have expertise from fishing to cocoa
And also a bit of art deco
Thank you for all the gifts to me you had bought
And the Italian cuisine you had taught
Knowing that I am a chocolate soft spot
Baci chocolates from Italy you had brought
Thank you for your help and support
Especially the saponin structures you had done a lot
Several hundred papers you had helped to sort
Making my task easy and short
Thank you for your company
And also your honesty
Helpful is your personality
Patient you always be
Lynn Heng

This study is part of the research program PROFETAS (Protein Foods, Environment Technology
and Society) and is funded by the Dutch Technology Foundation, STW.

CURRICULUM VITAE
Lynn Heng was born on 6 March 1974 in Singapore. She did her studies in Singapore Polytechnic,
first obtaining her Diploma in Chemical Process Technology, majoring in Food Technology in
1994, and went on to pursue an Advance Diploma in Food Technology, graduating in 1997. While
doing her advance diploma studies, she was working as a Quality Control Analyst with a Flavour &
Fragrance company, Takasago International (S). In addition, she was also a private tutor teaching
Maths and Science. In 1997, she went to the University of Leeds, Procter Department of Food
Science, and did a Master degree course in Food Science, graduating with distinction. Thereafter,
she came to Wageningen (The Netherlands) and started her PhD at the Laboratory of Food
Chemistry, working on a project of PROFETAS (PROtein Food Environment Technology And
Society), and completed the research presented in this thesis.
LIST OF PUBLICATIONS
1. Lynn Heng, G. A. van Koningsveld, H. Gruppen, M. A. J. S. van Boekel, J.-P. Vincken, J. P. Roozen and A. G. J. Voragen. Protein-Flavour Interactions in Relation to Development of Novel Protein Foods. Trends Food Sci. Technol., 15(3), 2003, 217-224.
2. Decroos, K.; Vincken, J.-P.; Heng, L.; Bakker, R.; Gruppen, H.; Verstraete, W. Simultaneous quantification of differently glycosylated, acetylated, and DDMP-conjugated soyasaponins using reversed-phase high-performance liquid chromatography with evaporative light scattering detection. J. Chromatogr. A, 2005, 1072, 185-193.
3. Heng, L.; Vincken, J-P.; Hoppe, K.; van Koningsveld, G. A.; Decroos, K.; Gruppen, H.; van Boekel, M. A. J. S.; Voragen, A. G. J. Stability of pea DDMP saponin and the mechanism of its decomposition. Submitted for publication.
4. Heng, L.; Vincken, J-P.; van Koningsveld, G. A.; Legger, L.; Roozen, J. P; Gruppen, H.; van Boekel, M. A. J. S.; Voragen, A. G. J. Bitterness in peas is related to their saponin content. Submitted for publication.
5. Heng, L.; Vincken, J-P.; van Koningsveld, G. A.; Gruppen, H.; van Boekel, M. A. J. S.; Voragen, A. G. J. Saponins stripped down to skeleton. To be published.
6. Heng, L. Book of PROFETAS. Chapter 3: Technological feasibility: Protein-flavour interactions. To be published.

Cover picture and layout by Alessandro and my sister, Bishan
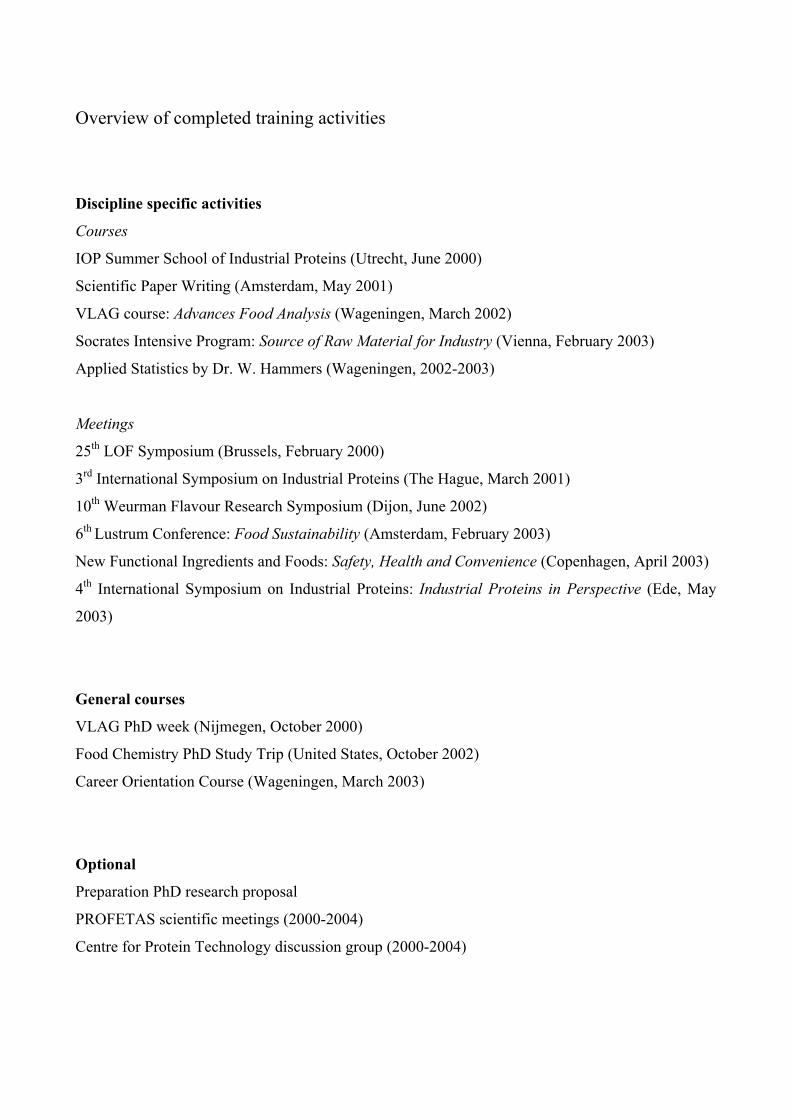
Overview of completed training activities
Discipline specific activities
Courses
IOP Summer School of Industrial Proteins (Utrecht, June 2000)
Scientific Paper Writing (Amsterdam, May 2001)
VLAG course: Advances Food Analysis (Wageningen, March 2002)
Socrates Intensive Program: Source of Raw Material for Industry (Vienna, February 2003)
Applied Statistics by Dr. W. Hammers (Wageningen, 2002-2003)
Meetings
25th LOF Symposium (Brussels, February 2000)
3rd International Symposium on Industrial Proteins (The Hague, March 2001)
10th Weurman Flavour Research Symposium (Dijon, June 2002)
6th Lustrum Conference: Food Sustainability (Amsterdam, February 2003)
New Functional Ingredients and Foods: Safety, Health and Convenience (Copenhagen, April 2003)
4th International Symposium on Industrial Proteins: Industrial Proteins in Perspective (Ede, May
2003)
General courses
VLAG PhD week (Nijmegen, October 2000)
Food Chemistry PhD Study Trip (United States, October 2002)
Career Orientation Course (Wageningen, March 2003)
Optional
Preparation PhD research proposal
PROFETAS scientific meetings (2000-2004)
Centre for Protein Technology discussion group (2000-2004)

Printing: Ponsen & Looijen B. V., Wageningen