El Quevar PEA - Golden Minerals Company
298
El Quevar Project Salta Province, Argentina NI 43-101 Technical Report on Preliminary Economic Assessment Prepared for: Golden Minerals Prepared by: Mr Gordon Seibel, RM SME, Wood Mr John E. Thompson, QP MMSA, John E. Thompson LLC Mr Al Kustermeyer, RM SME, Samuel Engineering Mr Steven Pozder, P.E., Samuel Engineering Effective Date: 4 September, 2018 Project Number: 196410 John E. Thompson LLC
-
Upload
khangminh22 -
Category
Documents
-
view
1 -
download
0
Transcript of El Quevar PEA - Golden Minerals Company

El Quevar ProjectSalta Province, ArgentinaNI 43-101 Technical Report on Preliminary Economic Assessment
Prepared for: Golden Minerals
Prepared by:Mr Gordon Seibel, RM SME, WoodMr John E. Thompson, QP MMSA, John E. Thompson LLCMr Al Kustermeyer, RM SME, Samuel EngineeringMr Steven Pozder, P.E., Samuel Engineering
Effective Date: 4 September, 2018
Project Number: 196410
John E. Thompson LLC

Amec Foster Wheeler E&C Services, Inc., a Wood company 10615 Professional Circle, Suite 100
Reno, NV 89521 Tel: 775 331 2375 Fax: 775-331-4153
www.woodplc.com
CERTIFICATE OF QUALIFIED PERSON I, Gordon Seibel, RM SME, am employed as a Principal Geologist with Amec Foster Wheeler E&C Services Inc., a Wood company (Wood), located at 10615 Professional Circle, Suite 100, Reno, NV 89521.
This certificate applies to the technical report titled “El Quevar Project Salta Province, Argentina, NI 43-101 Technical Report on Preliminary Economic Assessment” that has an effective date of 4 September, 2018 (the “technical report”).
I am a Registered Member of the Society for Mining, Metallurgy and Exploration (#2894840). I graduated from the University of Colorado with a Bachelor of Arts degree in Geology in 1980. In addition, I obtained a Masters of Science degree in Geology from Colorado State University in 1991.
I have practiced my profession for 35 years, during which time I have been directly involved in the development of resource models and mineral resource estimation for precious metals mineral projects in North America, South America, Africa, and Australia since 1991.
As a result of my experience and qualifications, I am a Qualified Person as defined in National Instrument 43–101 Standards of Disclosure for Mineral Projects (NI 43–101).
I visited the El Quevar Project from 20 to 23 March 2018.
I am responsible for Sections 1.1 to 1.8, 1.10, 1.11, 1.16, 1.22.1, 1.24, Section 2; Sections 3.1, 3.2, 3.3, Section 4; Section 5; Section 6; Section 7; Section 8; Section 9; Section 10; Section 11; Section 12; Section 14; Section 20; Section 23; Section 24.1.1; Sections 25.1 to 25.4, 25.6, 25.10, 25.15.1; Sections 26.1, 26.2.1 to 26.2.4, 26.3.1 and Section 27 of the technical report.
I am independent of Golden Minerals Company as independence is described by Section 1.5 of NI 43–101.
I have previously co-authored a technical report on the project, entitled:
• Seibel, G., Colquhoun, W., and Rehn, W, 2018: El Quevar Project, Salta Province, Argentina, NI 43-101 Technical Report on Updated Mineral Resource Estimate: technical report prepared by Amec Foster Wheeler for Golden Minerals Company, effective date 26 February, 2018
I have read NI 43–101 and the sections of the technical report for which I am responsible have been prepared in compliance with that Instrument.
As of the effective date of the technical report, to the best of my knowledge, information and belief, the sections of the technical report for which I am responsible contain all scientific and technical information that is required to be disclosed to make the technical report not misleading.
Dated: 17 October, 2018
“Signed and stamped”
Gordon Seibel, RM SME

CERTIFICATE OF QUALIFIED PERSON
I, John E Thompson, QP MMSA, am an independent mining consultant with John E Thompson LLC, with an office at 2622 Driftwood Lane, Rock Springs, Wyoming, 82901.
This certificate applies to the technical report titled “El Quevar Project Salta Province, Argentina, NI 43-101 Technical Report on Preliminary Economic Assessment” that has an effective date of 4 September, 2018 (the “technical report”).
I am a member of the Mining and Metallurgical Society of America, #1448 QP. I graduated from the New Mexico Institute of Mining and Technology with a Bachelor of Science degree in Mining Engineering in 1968.
I have practiced my profession for 50 years. I have been directly involved in the base and precious metals mining industry in positions of responsibility at the executive level, operations and management consulting, operations management, construction management, and engineering in underground and surface mining operations in the US, Canada, Argentina, Mexico, Russia, Peru and Brazil.
As a result of my experience and qualifications, I am a Qualified Person as defined in National Instrument 43–101 Standards of Disclosure for Mineral Projects (NI 43–101).
I have not visited the El Quevar property.
I am responsible for Sections 1.1, 1.2, 1.12, 1.14, 1.17.1, 1.17.3 to 1.17.5, 1.18.1, 1.18.3 to 1.18.5, 1.22.2, 1.23.1, 1.24; Sections 2.1, 2.2, 2.3, 2.6; Section 3; Section 15; Section 16; Section 18; Sections 21.1.1, 21.1.3 to 21.2.1, 21.2.3 to 21.2.6, 21.3.1, 21.3.3 to 21.2.6, 21.3; Sections 24.1.2, 24.2.1; Sections 25.1, 25.7, 25.9, 25.12, 25.13, 25.15.1, 25.15.2; Sections 26.1, 26.3.2; and Section 27 of the technical report.
I am independent of Golden Minerals Company as independence is described by Section 1.5 of NI 43–101.
I have previous involvement with the El Quevar Project and authored a preliminary internal study to investigate mining methods in 2012.
I have read NI 43–101 and the sections of the technical report for which I am responsible have been prepared in compliance with that Instrument.
As of the effective date of the technical report, to the best of my knowledge, information and belief, the sections of the technical report for which I am responsible contain all scientific and technical information that is required to be disclosed to make the technical report not misleading.
Dated: 17 October, 2018
“Signed and sealed”
John E Thompson QP MMSA

8450 E. Crescent Parkway, Suite 200 Greenwood Village, Colorado, USA 80111 Main: (303) 714-4840 l Fax: (303) 714-4800 Direct: (303) 714-4848 Ext 7599
CERTIFICATE OF QUALIFIED PERSON
I, Alva L. Kuestermeyer, Registered Member SME (“RM”), am employed as a Senior Process Engineer with Samuel Engineering, Inc.
This certificate applies to the technical report titled “El Quevar Project Salta Province, Argentina, NI 43-101 Technical Report on Preliminary Economic Assessment” that has an effective date of 4 September, 2018 (the “technical report”).
I am a RM of the Society of Mining, Metallurgy and Exploration (SME #1802010). I graduated from the South Dakota School of Mines and Technology with a Bachelor of Science degree in Metallurgical Engineering in 1973 and from the Colorado School of Mines with a Masters of Science degree in Mineral Economics in 1982. I have practiced my profession for 45 years during which time I have been directly involved in mineral processing, metallurgical consulting and engineering studies in Europe, Africa, Russia, Australia, Dominican Republic, North and South America including Argentina. As a result of my experience and qualifications, I am a Qualified Person as defined in National Instrument 43–101 Standards of Disclosure for Mineral Projects (NI 43–101).
I have not visited the El Quevar Project, Salta Province, Argentina. I am responsible for Sections 1.9, 1.13, 1.15, 1.17.2, 1.18.2, 1.23.2, Section 13; Section 17; Section 19; Sections 21.1.2, 21.2.2, 24.2.2, 25.1, 25.5, 25.8, 25.11, 26.2.5; and Contributed to Sections 1.1, 1.2, 1.17.5, 1.18.5, 1.24, 2.1, 2.2, 2.6, 3.1, 3.2, 25.1, 25.12, 25.13, 25.15.2, 26.1 and 27 of the technical report. I am independent of Golden Minerals Company as independence is described by Section 1.5 of NI 43–101.
I was previously involved with the El Quevar Project as the QP mineral processing engineer for the preparation of the NI 43-101 technical report entitled, “NI 43-101 Technical Report on Resources for Apex Silver Mines Corporation El Quevar Project, Argentina” prepared by SRK Consulting, with an effective date of 31 January 2009, and a report date of 27 February 2009.
I have read NI 43–101 and the sections of the technical report for which I am responsible have been prepared in compliance with that Instrument.
At the effective date of the technical report, to the best of my knowledge, information and belief, the sections of the technical report for which I am responsible contain all scientific and technical information that is required to be disclosed to make the technical report not misleading.
Dated: 17 October, 2018
“Signed and Stamped”
Alva L. Kuestermeyer, RM SME.

CERTIFICATE OF QUALIFIED PERSON
I, Steven A. Pozder, Professional Engineer (Colorado #29144), am employed as a Senior Director with Samuel Engineering, Inc.
This certificate applies to the technical report titled “El Quevar Project Salta Province, Argentina, NI 43-101 Technical Report on Preliminary Economic Assessment” that has an effective date of 4 September, 2018 (the “technical report”).
I am a graduate of the University of Denver with a B.S. in Mechanical Engineering in 1988. I am a graduate of the University of Denver with an M.B.A. in General Business in 1994.
I am registered as a Professional Engineer (P.E.) with the State of Colorado, Registration Number 29144.
I have practiced my profession as a Mechanical Engineer and Project Manager in mineral processing and mining for over 30 years. My relevant experience for the purpose of the Technical Report is:
• I have worked as a consulting engineer on mining projects in roles such a mechanical engineer, project engineer, area manager, study manager, and project manager. Projects have included Scoping Studies, Prefeasibility Studies, Feasibility Studies, basic engineering, detailed engineering and startup and commissioning of new projects.
• In engineering positions, I have estimated and reviewed capital and operating costs and completed economic analyses including power requirements, reagent costs, labor requirements and costs, etc. for 23 years.
As a result of my experience and qualifications, I am a Qualified Person as defined in National Instrument 43–101 Standards of Disclosure for Mineral Projects (NI 43–101).
I have not visited the El Quevar Project, Salta Province, Argentina.
I am responsible for Sections 1.19, 1.20, 1.21, 1.23.3, 1.23.4, Section 22; 24.2.3, 24.2.4, 25.14; and Contributed to Sections 1.1, 1.2, 2.1, 2.2, 2.3, 2.5, 2.6, Section 3, 25.1, 25.15.1, 25.15.2, 26.1 and 27 of the technical report.
I am independent of Golden Minerals Company as independence is described by Section 1.5 of NI 43–101.
I was previously involved in the El Quevar Project on scoping level work for Golden Minerals, in which no report was issued. The work was performed as a reviewer in the position as Director of Engineering, in the years 2010 and 2011.
I have read NI 43–101 and the sections of the technical report for which I am responsible have been prepared in compliance with that Instrument.
As of the effective date of the technical report, to the best of my knowledge, information and belief, the sections of the technical report for which I am responsible contain all scientific and technical information that is required to be disclosed to make the technical report not misleading.
Dated: 17 October, 2018
“Signed and Sealed”
Steven A. Pozder, P.E., MBA
8450 E. Crescent Parkway, Suite 200 Greenwood Village, Colorado, USA 80111 Main: (303) 714-4840 l Fax: (303) 714-4800 Direct: (303) 714-4828
IMPORTANT NOTICE
This report was prepared as National Instrument 43-101 Technical Report for Golden Minerals Company (Golden Minerals) by Amec Foster Wheeler E&C Services Inc, John E. Thompson LLC, and Samuel Engineering Inc (collectively the “Report Authors”). The quality of information, conclusions, and estimates contained herein is consistent with the level of effort involved in the Report Authors’ services, based on i) information available at the time of preparation, ii) data supplied by outside sources, and iii) the assumptions, conditions, and qualifications set forth in this report. This report is intended for use by Golden Minerals subject to terms and conditions of its individual contracts with each of the Report Authors. Except for the purposed legislated under Canadian provincial and territorial securities law, any other uses of this report by any third party is at that party’s sole risk.
El Quevar Project Salta Province, Argentina
NI 43-101 Technical Report on Preliminary Economic Assessment
TOC i
October 2018 Project Number: 196410
C O N T E N T S
1.0 SUMMARY ............................................................................................................... 1-1 1.1 Introduction ................................................................................................... 1-1 1.2 Terms of Reference ...................................................................................... 1-1 1.3 Project Setting .............................................................................................. 1-1 1.4 Mineral Tenure, Surface Rights, Water Rights, Royalties and Agreements . 1-2 1.5 Geology and Mineralization .......................................................................... 1-2 1.6 History .......................................................................................................... 1-4 1.7 Drilling and Sampling .................................................................................... 1-4 1.8 Data Verification ........................................................................................... 1-7 1.9 Metallurgical Testwork .................................................................................. 1-8 1.10 Mineral Resource Estimation ........................................................................ 1-9 1.11 Mineral Resource Statement ...................................................................... 1-12 1.12 Mining Methods .......................................................................................... 1-13
1.12.1 Mining Method Evaluation .............................................................. 1-13 1.12.2 Post-Pillar Cut-And-Fill ................................................................... 1-14 1.12.3 Backfill ............................................................................................ 1-15 1.12.4 Ventilation ....................................................................................... 1-15 1.12.5 Mine Dewatering ............................................................................. 1-15 1.12.6 Geotechnical Considerations .......................................................... 1-16 1.12.7 Underground Infrastructure ............................................................. 1-16 1.12.8 Production Plan .............................................................................. 1-17 1.12.9 Drilling, Blasting and Grade Control ............................................... 1-17 1.12.10 Equipment Fleet .......................................................................... 1-17
1.13 Recovery Methods ...................................................................................... 1-17 1.14 Project Infrastructure .................................................................................. 1-19 1.15 Markets and Contracts ............................................................................... 1-20 1.16 Environmental, Permitting and Social Considerations ................................ 1-20
1.16.1 Baseline Studies ............................................................................. 1-20 1.16.2 Environmental Considerations ........................................................ 1-21 1.16.3 Closure and Reclamation Planning ................................................ 1-21 1.16.4 Permitting Considerations ............................................................... 1-21 1.16.5 Social Considerations ..................................................................... 1-21
1.17 Capital Cost Estimates ............................................................................... 1-22 1.17.1 Mining Capital Costs ....................................................................... 1-22 1.17.2 Process Capital Costs .................................................................... 1-22 1.17.3 Infrastructure Capital Costs ............................................................ 1-22 1.17.4 Sustaining Capital Costs ................................................................. 1-24 1.17.5 Summary Capital Costs .................................................................. 1-25
1.18 Operating Cost Estimates ........................................................................... 1-25 1.18.1 Mining Operating Costs .................................................................. 1-25 1.18.2 Process Operating Costs ................................................................ 1-25 1.18.3 Infrastructure Operating Costs ........................................................ 1-27 1.18.4 General and Administrative Operating Costs ................................. 1-27
El Quevar Project Salta Province, Argentina
NI 43-101 Technical Report on Preliminary Economic Assessment
TOC ii
October 2018 Project Number: 196410
1.18.5 Summary Operating Costs ............................................................. 1-28 1.19 Economic Analysis ..................................................................................... 1-29
1.19.1 Cautionary Statement ..................................................................... 1-29 1.19.2 Methodology Used .......................................................................... 1-30 1.19.3 Outcomes ....................................................................................... 1-31
1.20 Sensitivity Analysis ..................................................................................... 1-31 1.21 Interpretations and Conclusions ................................................................. 1-31 1.22 Opportunities .............................................................................................. 1-35
1.22.1 Exploration ...................................................................................... 1-35 1.22.2 Mining ............................................................................................. 1-35
1.23 Risks ........................................................................................................... 1-36 1.23.1 Mining ............................................................................................. 1-36 1.23.2 Process Plant .................................................................................. 1-36 1.23.3 Taxation .......................................................................................... 1-36 1.23.4 Exchange Rates ............................................................................. 1-36
1.24 Recommendations ...................................................................................... 1-36
2.0 INTRODUCTION ...................................................................................................... 2-1 2.1 Introduction ................................................................................................... 2-1 2.2 Terms of Reference ...................................................................................... 2-1 2.3 Qualified Persons ......................................................................................... 2-1 2.4 Site Visits and Scope of Personal Inspection ............................................... 2-1 2.5 Effective Dates ............................................................................................. 2-1 2.6 Information Sources and References ........................................................... 2-1 2.7 Previous Technical Reports .......................................................................... 2-2
3.0 RELIANCE ON OTHER EXPERTS .......................................................................... 3-1 3.1 Introduction ................................................................................................... 3-1 3.2 Mineral Tenure, Surface Rights, and Royalties ............................................ 3-1 3.3 Environmental, Permitting, and Social and Community Impacts .................. 3-1 3.4 Taxation ........................................................................................................ 3-2
4.0 PROPERTY DESCRIPTION AND LOCATION ........................................................ 4-1 4.1 Introduction ................................................................................................... 4-1 4.2 Property and Title in Argentina ..................................................................... 4-1
4.2.1 Mineral Tenure .................................................................................. 4-1 4.2.2 Surface Rights .................................................................................. 4-3 4.2.3 Water Rights ..................................................................................... 4-3 4.2.4 Environmental Regulations ............................................................... 4-3 4.2.5 Closure Considerations .................................................................... 4-4 4.2.6 Fraser Institute Policy Perception Index ........................................... 4-4
4.3 Project Ownership ........................................................................................ 4-4 4.4 Mineral Tenure ............................................................................................. 4-5 4.5 Surface Rights .............................................................................................. 4-5 4.6 Water Rights ................................................................................................. 4-9 4.7 Royalties and Encumbrances ....................................................................... 4-9 4.8 Permitting Considerations ............................................................................ 4-9 4.9 Environmental Considerations .................................................................... 4-10

El Quevar Project Salta Province, Argentina
NI 43-101 Technical Report on Preliminary Economic Assessment
TOC iii
October 2018 Project Number: 196410
4.10 Social License Considerations ................................................................... 4-10 4.11 Comments on Section 4 ............................................................................. 4-10
5.0 ACCESSIBILITY, CLIMATE, LOCAL RESOURCES, INFRASTRUCTURE, AND PHYSIOGRAPHY ..................................................................................................... 5-1 5.1 Accessibility .................................................................................................. 5-1 5.2 Climate ......................................................................................................... 5-1 5.3 Local Resources and Infrastructure .............................................................. 5-1 5.4 Physiography ................................................................................................ 5-2 5.5 Comments on Section 5 ............................................................................... 5-3
6.0 HISTORY ................................................................................................................. 6-1 6.1 Exploration History ....................................................................................... 6-1 6.2 Production .................................................................................................... 6-1
7.0 GEOLOGICAL SETTING AND MINERALIZATION ................................................. 7-1 7.1 Regional Geology ......................................................................................... 7-1 7.2 Project Geology ............................................................................................ 7-1
7.2.1 Lithologies ......................................................................................... 7-1 7.2.2 Structure ........................................................................................... 7-1 7.2.3 Alteration ........................................................................................... 7-3 7.2.4 Mineralization .................................................................................... 7-3
7.3 Deposit Description ...................................................................................... 7-3 7.3.1 Lithologies ......................................................................................... 7-3 7.3.2 Alteration ........................................................................................... 7-6 7.3.3 Mineralization .................................................................................... 7-9
7.4 Prospects/Exploration Targets ................................................................... 7-10 7.5 Comments on Section 7 ............................................................................. 7-10
8.0 DEPOSIT TYPES ..................................................................................................... 8-1 8.1 Comments on Section 8 ............................................................................... 8-4
9.0 EXPLORATION ........................................................................................................ 9-1 9.1 Grids and Surveys ........................................................................................ 9-1 9.2 Geological Mapping ...................................................................................... 9-1 9.3 Geochemical Sampling ................................................................................. 9-1 9.4 Geophysics ................................................................................................... 9-3 9.5 Pits and Trenches ......................................................................................... 9-3 9.6 Decline/Adit .................................................................................................. 9-7 9.7 Petrology, Mineralogy, and Research Studies ............................................. 9-8 9.8 Exploration Potential ................................................................................... 9-13 9.9 Comments on Section 9 ............................................................................. 9-16
10.0 DRILLING ............................................................................................................... 10-1 10.1 Introduction ................................................................................................. 10-1 10.2 Drill Methods ............................................................................................... 10-1 10.3 Logging Procedures ................................................................................... 10-1
10.3.1 2009 Drill Campaign ....................................................................... 10-5 10.3.2 2010 Drill Campaign ....................................................................... 10-5
El Quevar Project Salta Province, Argentina
NI 43-101 Technical Report on Preliminary Economic Assessment
TOC iv
October 2018 Project Number: 196410
10.4 Recovery .................................................................................................... 10-6 10.4.1 2006–2008 Drill Campaign ............................................................. 10-6 10.4.2 2009 Drill Campaign ....................................................................... 10-6 10.4.3 2010 Drill Campaign ....................................................................... 10-6 10.4.4 2011–2012 Drill Campaign ............................................................. 10-6 10.4.5 2012–2013 Drill Campaign ............................................................. 10-6
10.5 Collar Surveys ............................................................................................ 10-7 10.5.1 2006–2008 Drill Campaign ............................................................. 10-7 10.5.2 2009 Drill Campaign ....................................................................... 10-7 10.5.3 2010 Drill Campaign ....................................................................... 10-7 10.5.4 2011–2012 Drill Campaign ............................................................. 10-8 10.5.5 2012–2013 Drill Campaign ............................................................. 10-8
10.6 Downhole Surveys ...................................................................................... 10-8 10.6.1 2006–2008 Drill Campaign ............................................................. 10-8 10.6.2 2009 Drill Campaign ....................................................................... 10-8 10.6.3 2010 Drill Campaign ....................................................................... 10-8 10.6.4 2011–2012 Drill Campaign ............................................................. 10-8 10.6.5 2012–2013 Drill Campaign ............................................................. 10-9 10.6.6 Magnetic Declination ...................................................................... 10-9
10.7 Sample Length/True Thickness .................................................................. 10-9 10.8 Summary of Drill Intercepts ...................................................................... 10-10 10.9 Comments on Section 10 ......................................................................... 10-10
11.0 SAMPLE PREPARATION, ANALYSES, AND SECURITY .................................... 11-1 11.1 Sampling Methods ...................................................................................... 11-1
11.1.1 Core Sampling ................................................................................ 11-1 11.1.2 Adit Sampling .................................................................................. 11-1
11.2 Density Determinations .............................................................................. 11-1 11.3 Analytical and Test Laboratories ................................................................ 11-3 11.4 Sample Preparation and Analysis .............................................................. 11-3
11.4.1 Alex Stewart .................................................................................... 11-3 11.4.2 ALS Chemex ................................................................................... 11-4 11.4.3 Acme ............................................................................................... 11-5 11.4.4 SGS ................................................................................................ 11-5
11.5 Quality Assurance and Quality Control ....................................................... 11-5 11.6 Databases .................................................................................................. 11-6 11.7 Sample Security ......................................................................................... 11-7 11.8 Comments on Section 11 ........................................................................... 11-7
12.0 DATA VERIFICATION ............................................................................................ 12-1 12.1 Internal Data Verification ............................................................................ 12-1 12.2 SRK (2009) ................................................................................................. 12-1 12.3 Chlumsky, Armbrust & Meyer, LLC (2009a, 2009b, 2010) ......................... 12-1 12.4 Micon (2010) ............................................................................................... 12-2 12.5 Pincock, Allen and Holt (2012) ................................................................... 12-3 12.6 Wood (2018) ............................................................................................... 12-7
12.6.1 April 2018 Verification ..................................................................... 12-7
El Quevar Project Salta Province, Argentina
NI 43-101 Technical Report on Preliminary Economic Assessment
TOC v
October 2018 Project Number: 196410
12.6.2 June–July 2018 Verification ............................................................ 12-8 12.7 Comments on Section 12 ......................................................................... 12-10
13.0 MINERAL PROCESSING AND METALLURGICAL TESTING .............................. 13-1 13.1 Introduction ................................................................................................. 13-1 13.2 Metallurgical Testwork ................................................................................ 13-2
13.2.1 DML 2008 Testwork ........................................................................ 13-2 13.2.2 DML 2009 Testwork ........................................................................ 13-4 13.2.3 DML 2010 Testwork ........................................................................ 13-5 13.2.4 JKTech/Hazen 2010 Testwork ...................................................... 13-10 13.2.5 DML 2011 Testwork ...................................................................... 13-10 13.2.6 DML 2012 Testwork ........................................................................ 13-2
13.3 Recovery Estimates .................................................................................... 13-1 13.4 Metallurgical Variability ............................................................................... 13-3 13.5 Deleterious Elements ................................................................................. 13-4 13.6 Comments on Section 13 ........................................................................... 13-4
14.0 MINERAL RESOURCE ESTIMATES ..................................................................... 14-1 14.1 Introduction ................................................................................................. 14-1 14.2 Exploratory Data Analysis .......................................................................... 14-1
14.2.1 Database and Statistical Studies .................................................... 14-1 14.2.2 Core Recovery ................................................................................ 14-4
14.3 Geological Models ...................................................................................... 14-5 14.3.1 Visual Zonation Studies .................................................................. 14-5 14.3.2 Alteration Model (QAI) .................................................................... 14-5 14.3.3 Silver Grade Shell ......................................................................... 14-10 14.3.4 Oxide–Sulfide Boundary ............................................................... 14-11
14.4 Density Assignment .................................................................................. 14-11 14.5 Grade Capping/Outlier Restrictions .......................................................... 14-13 14.6 Composites ............................................................................................... 14-15 14.7 Variography .............................................................................................. 14-15 14.8 Silver Estimation ....................................................................................... 14-18 14.9 Metallurgical Models ................................................................................. 14-19 14.10 Block Model Validation ............................................................................. 14-22
14.10.1 Visual ........................................................................................ 14-22 14.10.2 Global Bias ................................................................................ 14-22 14.10.3 Local Bias ................................................................................. 14-22
14.11 Classification of Mineral Resources ......................................................... 14-25 14.12 Reasonable Prospects of Eventual Economic Extraction ......................... 14-25 14.13 Yaxtché Mineral Resource Statement ...................................................... 14-25 14.14 Sensitivity of Mineral Resources to Cut-off Grade .................................... 14-26 14.15 Factors That May Affect the Mineral Resource Estimate ......................... 14-26 14.16 Comments on Section 14 ......................................................................... 14-28
15.0 MINERAL RESERVE ESTIMATES ........................................................................ 15-1
16.0 MINING METHODS ............................................................................................... 16-1 16.1 Throughput Rate and Supporting Assumptions .......................................... 16-1
El Quevar Project Salta Province, Argentina
NI 43-101 Technical Report on Preliminary Economic Assessment
TOC vi
October 2018 Project Number: 196410
16.1.1 Stope Sizing .................................................................................... 16-1 16.1.2 Dilution and Mine Losses ................................................................ 16-2
16.2 Subset of Mineral Resources Within the PEA Mine Plan ........................... 16-2 16.3 Mining Method Selection ............................................................................ 16-2
16.3.1 Sublevel End Slicing ....................................................................... 16-3 16.3.2 Transverse with Pillars .................................................................... 16-3 16.3.3 Transverse with Cemented Fill ....................................................... 16-3 16.3.4 Post-Pillar Cut-and-Fill .................................................................... 16-4 16.3.5 Comparisons ................................................................................... 16-4
16.4 Post-Pillar Cut-and-Fill ................................................................................ 16-4 16.5 Rock Mechanics Tests ............................................................................... 16-6 16.6 Pillar Sizing and Roof Calculations ............................................................. 16-6 16.7 Mine Design Assumptions and Design Criteria .......................................... 16-7 16.8 Backfill ........................................................................................................ 16-9 16.9 Ventilation ................................................................................................... 16-9 16.10 Mine Dewatering ....................................................................................... 16-10 16.11 Underground Infrastructure and Facilities ................................................ 16-11 16.12 Production Plan ........................................................................................ 16-12
16.12.1 Production Schedule ................................................................. 16-12 16.12.2 Mining Sequence ...................................................................... 16-13
16.13 Drilling, Blasting and Explosives ............................................................... 16-13 16.14 Grade Control ........................................................................................... 16-16 16.15 Mine Fleet Estimation ............................................................................... 16-16 16.16 Comments on Section 16 ......................................................................... 16-16
17.0 RECOVERY METHODS ........................................................................................ 17-1 17.1 Process Flow Sheet .................................................................................... 17-1 17.2 Reagents, Water, and Power ..................................................................... 17-7 17.3 Comments on Section 17 ........................................................................... 17-7
18.0 PROJECT INFRASTRUCTURE ............................................................................. 18-1 18.1 Introduction ................................................................................................. 18-1 18.2 Road and Logistics ..................................................................................... 18-1 18.3 Stockpiles ................................................................................................... 18-1 18.4 Waste Storage Facilities ............................................................................. 18-1 18.5 Tailings Storage Facilities ........................................................................... 18-1 18.6 Water Management .................................................................................... 18-5 18.7 Camps and Accommodation ...................................................................... 18-5 18.8 Power and Electrical ................................................................................... 18-5 18.9 Fuel ............................................................................................................. 18-7 18.10 Water Supply .............................................................................................. 18-7 18.11 Comments on Section 18 ........................................................................... 18-7
19.0 MARKET STUDIES AND CONTRACTS ................................................................ 19-1 19.1 Market Studies ............................................................................................ 19-1 19.2 Commodity Price Projections ..................................................................... 19-3 19.3 Contracts .................................................................................................... 19-3 19.4 QP Conclusions .......................................................................................... 19-3
El Quevar Project Salta Province, Argentina
NI 43-101 Technical Report on Preliminary Economic Assessment
TOC vii
October 2018 Project Number: 196410
19.5 Comments on Section 19 ........................................................................... 19-3
20.0 ENVIRONMENTAL STUDIES, PERMITTING, AND SOCIAL OR COMMUNITY IMPACT .................................................................................................................. 20-1 20.1 Baseline Studies ......................................................................................... 20-1 20.2 Protected Areas .......................................................................................... 20-1 20.3 Water Monitoring ........................................................................................ 20-1 20.4 Climate Monitoring ...................................................................................... 20-3 20.5 Closure Plan ............................................................................................... 20-3 20.6 Remediation Activities ................................................................................ 20-4 20.7 Permitting ................................................................................................... 20-4
20.7.1 Current Permits ............................................................................... 20-4 20.7.2 Future Permits ................................................................................ 20-5
20.8 Considerations of Social and Community Impacts ..................................... 20-7 20.9 Comments on Section 20 ........................................................................... 20-1
21.0 CAPITAL AND OPERATING COSTS .................................................................... 21-1 21.1 Capital Cost Estimates ............................................................................... 21-1
21.1.1 Mine Capital Costs .......................................................................... 21-1 21.1.2 Process Capital Costs .................................................................... 21-1 21.1.3 Infrastructure Capital Costs ............................................................ 21-3 21.1.4 General and Administrative Capital Costs ...................................... 21-6 21.1.5 Owner (Corporate) Capital Costs ................................................... 21-6 21.1.6 Sustaining Capital ........................................................................... 21-6 21.1.7 Capital Cost Summary .................................................................... 21-7
21.2 Operating Cost Estimates ........................................................................... 21-7 21.2.1 Mine Operating Costs ..................................................................... 21-7 21.2.2 Process Operating Costs ................................................................ 21-9 21.2.3 Infrastructure Operating Costs ...................................................... 21-12 21.2.4 General and Administrative Operating Cost ................................. 21-13 21.2.5 Owner (Corporate) Operating Costs ............................................. 21-14 21.2.6 Operating Cost Summary ............................................................. 21-14
21.3 Comments on Section 21 ......................................................................... 21-14
22.0 ECONOMIC ANALYSIS ......................................................................................... 22-1 22.1 Cautionary Statement ................................................................................. 22-1 22.2 Methodology Used ...................................................................................... 22-2 22.3 Financial Model Parameters ....................................................................... 22-2
22.3.1 Mineral Resource, Mineral Reserve, and Mine Life ........................ 22-3 22.3.2 Smelting and Refining Terms ......................................................... 22-4 22.3.3 Metal Price ...................................................................................... 22-4 22.3.4 Capital Costs .................................................................................. 22-4 22.3.5 Operating Costs .............................................................................. 22-4 22.3.6 Working Capital .............................................................................. 22-4 22.3.7 Taxes and Royalties ....................................................................... 22-4 22.3.8 Closure Costs ................................................................................. 22-8 22.3.9 Salvage Value ................................................................................. 22-9 22.3.10 Financing .................................................................................... 22-9
El Quevar Project Salta Province, Argentina
NI 43-101 Technical Report on Preliminary Economic Assessment
TOC viii
October 2018 Project Number: 196410
22.3.11 Inflation ....................................................................................... 22-9 22.4 Economic Analysis ..................................................................................... 22-9
22.4.1 PEA Results .................................................................................... 22-9 22.4.2 Cash Costs ..................................................................................... 22-9
22.5 Sensitivity Analysis ..................................................................................... 22-1 22.6 Comments on Section 22 ........................................................................... 22-4
23.0 ADJACENT PROPERTIES .................................................................................... 23-1
24.0 OTHER RELEVANT DATA AND INFORMATION ................................................. 24-1 24.1 Opportunities .............................................................................................. 24-1
24.1.1 Exploration ...................................................................................... 24-1 24.1.2 Mining ............................................................................................. 24-1
24.2 Risks ........................................................................................................... 24-1 24.2.1 Mining ............................................................................................. 24-1 24.2.2 Process Plant .................................................................................. 24-1 24.2.3 Taxation .......................................................................................... 24-2 24.2.4 Exchange Rates ............................................................................. 24-2
25.0 INTERPRETATION AND CONCLUSIONS ............................................................ 25-1 25.1 Introduction ................................................................................................. 25-1 25.2 Mineral Tenure, Surface Rights, Water Rights, Royalties, Agreements ..... 25-1 25.3 Geology and Mineralization ........................................................................ 25-1 25.4 Exploration, Drilling and Analytical Data Collection in Support of Mineral
Resource Estimation .................................................................................. 25-2 25.5 Metallurgical Testwork ................................................................................ 25-3 25.6 Mineral Resource Estimates ....................................................................... 25-4 25.7 Mine Plan .................................................................................................... 25-4 25.8 Recovery Plan ............................................................................................ 25-5 25.9 Infrastructure .............................................................................................. 25-6 25.10 Environmental, Permitting and Social Considerations ................................ 25-6 25.11 Markets and Contracts ............................................................................... 25-7 25.12 Capital Cost Estimates ............................................................................... 25-7 25.13 Operating Cost Estimates ........................................................................... 25-8 25.14 Economic Analysis ..................................................................................... 25-8 25.15 Risks and Opportunities ............................................................................. 25-9
25.15.1 Opportunities ............................................................................... 25-9 25.15.2 Risks ......................................................................................... 25-10
25.16 Conclusions .............................................................................................. 25-10
26.0 RECOMMENDATIONS .......................................................................................... 26-1 26.1 Introduction ................................................................................................. 26-1 26.2 Phase 1 ...................................................................................................... 26-1
26.2.1 Exploration ...................................................................................... 26-1 26.2.2 Geology .......................................................................................... 26-1 26.2.3 Database ........................................................................................ 26-2 26.2.4 Mineral Resource Estimation .......................................................... 26-2 26.2.5 Metallurgy and Process .................................................................. 26-3

El Quevar Project Salta Province, Argentina
NI 43-101 Technical Report on Preliminary Economic Assessment
TOC ix
October 2018 Project Number: 196410
26.3 Phase 2 ...................................................................................................... 26-3 26.3.1 Mineral Resources .......................................................................... 26-3 26.3.2 Mining ............................................................................................. 26-3
27.0 REFERENCES ....................................................................................................... 27-1
T A B L E S
Table 1-1: Mineral Resource Table (250 g/t Ag cut-off) ................................................................. 1-13 Table 1-2: Pre-Production Mine Capital Schedule Summary ......................................................... 1-23 Table 1-3: Pre-production Process Capital Cost Summary ........................................................... 1-23 Table 1-4: Infrastructure Capital Costs ........................................................................................... 1-24 Table 1-5: TSF Capital and Reclamation Costs ............................................................................. 1-24 Table 1-6: Sustaining Capital Costs ............................................................................................... 1-25 Table 1-7: Total Pre-Production Capital Cost Estimate ................................................................. 1-26 Table 1-8: Mine Operating Cost for Static Operation ..................................................................... 1-26 Table 1-9: Summary Table for Estimated Process Plant Operating Costs .................................... 1-27 Table 1-10: Basis of Operating Cost Estimates, Process Plant ....................................................... 1-27 Table 1-11: Infrastructure Operating Costs ...................................................................................... 1-28 Table 1-12: General and Administrative Operating Costs ................................................................ 1-28 Table 1-13: Operating Costs Summary ............................................................................................ 1-29 Table 1-14: Summary, Financial Analysis (after-tax; base case is highlighted) ............................... 1-32 Table 4-1: Mineral Tenure Table ...................................................................................................... 4-6 Table 4-2: Granted Easements ........................................................................................................ 4-9 Table 6-1: Project History ................................................................................................................. 6-2 Table 7-1: Mineralization Styles by Oxidation State ....................................................................... 7-10 Table 9-1: Geophysical Targets ....................................................................................................... 9-5 Table 9-2: 2007 Trenching Program ................................................................................................ 9-7 Table 9-3: Prospects Within Quevar South .................................................................................... 9-18 Table 9-4: Drill Intercepts for Drill Holes and Prospects Identified in Figure 9-8 and Figure 9-9 ... 9-19 Table 10-1: Drill Program Summary Table ....................................................................................... 10-2 Table 10-2: Drill Companies ............................................................................................................. 10-5 Table 10-3: Density Determinations ................................................................................................. 10-7 Table 10-4: Drill Intercept Summary Table, Selected Intercepts .................................................... 10-11 Table 11-1: SGS Peru Specific Gravity Test Results Statistics ....................................................... 11-3 Table 11-2: Analytical and Preparation Laboratories ....................................................................... 11-4 Table 13-1: Summary, Metallurgical Testwork Programs ................................................................ 13-2 Table 13-2: 2008 Composites for Metallurgical Testing ................................................................... 13-3 Table 13-3: Summary of 2008 Test Results ..................................................................................... 13-5 Table 13-4: Head Grade Assays from Composites used in 2009 Testwork .................................... 13-6 Table 13-5: Silver Recoveries by Composite and Recovery Method ............................................... 13-6 Table 13-6: Head Grades for the 2010 Test Composites ................................................................ 13-7 Table 13-7: Summary of Silver Recovery by Flotation and Leaching .............................................. 13-8 Table 13-8: Head Grade Analysis, Yaxtché West Composite .......................................................... 13-9 Table 13-9: Results for the JKTech/Hazen Testwork ..................................................................... 13-11 Table 13-10:Estimated Consumption Rates for Wear Materials by Area ........................................ 13-11

El Quevar Project Salta Province, Argentina
NI 43-101 Technical Report on Preliminary Economic Assessment
TOC x
October 2018 Project Number: 196410
Table 13-11:Head Grade Analysis, YWMC-2010 Composite ........................................................... 13-2 Table 13-12:Batch Flotation Results 2011, YWMC-2010 Composite ............................................... 13-2 Table 13-13:Batch Flotation Results 2012, YWMC-2010 Composite ............................................... 13-1 Table 13-14:Locked Cycle Flotation Results 2012, YWMC-2010 Composite ................................... 13-2 Table 13-15:Grind Sensitivity Batch Flotation Results ...................................................................... 13-2 Table 13-16:Head Analysis of the Oct 2011 Low Grade Yaxtché West Bulk Composite ................. 13-2 Table 13-17:DML 2012 Locked Cycle Test Parameters ................................................................... 13-3 Table 13-18:Silver Recoveries by Selective Flotation and Deposit Zone ......................................... 13-4 Table 13-19:El Quevar Concentrate Assays ..................................................................................... 13-5 Table 14-1: Capping Thresholds, Final Capping Values Highlighted in Gray ................................ 14-16 Table 14-2: Drill Composite Statistics (2.5 m capped composites) ................................................ 14-16 Table 14-3: Variogram Parameters ................................................................................................ 14-18 Table 14-4: Estimation Parameters ................................................................................................ 14-20 Table 14-5: Global Bias by Metal ................................................................................................... 14-23 Table 14-6: Mineral Resource Table (250 g/t Ag cut-off) ............................................................... 14-27 Table 14-7: Indicated Sulfide Resource Sensitivity Table .............................................................. 14-28 Table 14-8: Indicated Oxide Resource Sensitivity Table ............................................................... 14-28 Table 14-9: Inferred Sulfide Resource Sensitivity Table ................................................................ 14-28 Table 16-1: Comparison Data of Transverse and Fill, and Post Pillar Cut and Fill Mining Methods
(selected levels only) ..................................................................................................... 16-5 Table 16-2: Pump Station Characteristics ...................................................................................... 16-12 Table 16-3: Critical Fleet Purchase Analysis .................................................................................. 16-17 Table 17-1: Proposed Major Equipment List .................................................................................... 17-4 Table 17-2: El Quevar Process Design Criteria ............................................................................... 17-5 Table 19-1: Concentrate Transport, Smelting, Refining, and Related Costs ................................... 19-2 Table 19-2: Concentrate Impurity Assays ........................................................................................ 19-2 Table 19-3: Indicated Penalties for El Quevar Concentrate ............................................................. 19-2 Table 20-1: Baseline Studies ............................................................................................................ 20-2 Table 20-2: Regulations Summary ................................................................................................... 20-1 Table 21-1: Pre-Production Mine Capital Summary ......................................................................... 21-2 Table 21-2: Construction Crew Average Composite Wage Rates ................................................... 21-4 Table 21-3: Process Plant Capital Costs .......................................................................................... 21-4 Table 21-4: Pre-Production Infrastructure Capital Costs ................................................................. 21-5 Table 21-5: TSF Capital and Reclamation Costs ............................................................................. 21-6 Table 21-6: Sustaining Capital Costs ............................................................................................... 21-7 Table 21-7: Total Pre-Production Capital Cost Estimate ................................................................. 21-8 Table 21-8: Mine Operating Cost for Static Operation ..................................................................... 21-9 Table 21-9: Summary Table for Estimated Process Plant Operating Costs .................................. 21-10 Table 21-10:Basis of Operating Cost Estimates, Process Plant ..................................................... 21-10 Table 21-11:Labor Cost Estimate, Process ..................................................................................... 21-11 Table 21-12:Consumable Operating Cost Estimate ........................................................................ 21-12 Table 21-13:Wear Material Operating Cost Estimate ...................................................................... 21-13 Table 21-14:Infrastructure Operating Costs .................................................................................... 21-14 Table 21-15:General and Administrative Operating Costs .............................................................. 21-15 Table 21-16:Operating Costs Summary .......................................................................................... 21-15 Table 22-1: Model Input .................................................................................................................... 22-3

El Quevar Project Salta Province, Argentina
NI 43-101 Technical Report on Preliminary Economic Assessment
TOC xi
October 2018 Project Number: 196410
Table 22-2: Summary, Financial Analysis (after-tax; base case is highlighted) ............................. 22-10 Table 22-3: Annualized Cash Flow................................................................................................... 22-1 Table 22-4: Key Assumptions for Table 22-3. .................................................................................. 22-1 Table 22-5: Sensitivity Table (base case is highlighted) .................................................................. 22-1 Table 26-1: Drill Program Costs ....................................................................................................... 26-2
F I G U R E S
Figure 1-1: Capital Cost Sensitivity.................................................................................................. 1-32 Figure 1-2: Silver Price Sensitivity ................................................................................................... 1-33 Figure 1-3: Operating Cost Sensitivity ............................................................................................. 1-33 Figure 1-4: Metallurgical Recovery Sensitivity ................................................................................. 1-34 Figure 1-5: Silver Grade Sensitivity ................................................................................................. 1-34 Figure 1-6: Peso to US$ Exchange Rate Sensitivity ....................................................................... 1-35 Figure 2-1: Project Location Plan ...................................................................................................... 2-2 Figure 4-1: Mineral Tenure Layout Plan ............................................................................................ 4-7 Figure 4-2: Mineral Resource Outline in Relation to Claim Boundaries ............................................ 4-8 Figure 7-1: Regional Geology Plan ................................................................................................... 7-2 Figure 7-2: Yaxtché Deposit Outline Relative to Large Zones of Exposed Hydrothermal
Alteration ......................................................................................................................... 7-4 Figure 7-3: Schematic Stratigraphic Column ..................................................................................... 7-5 Figure 7-4: Quevar South Project Geology ....................................................................................... 7-6 Figure 7-5: Quevar Alteration Index .................................................................................................. 7-8 Figure 7-6: Yaxtché Cross-Section (looking northwest) .................................................................. 7-11 Figure 8-1: Diagnostic Minerals of Various States of pH, Sulfidation and Oxidation State Used to
Distinguish Epithermal Ore-Forming Environments ........................................................ 8-2 Figure 8-2: Schematic, Intermediate Sulfidation System .................................................................. 8-3 Figure 8-3: Schematic Diagram of Yaxtché Hydrothermal Fluid Evolution ....................................... 8-3 Figure 9-1: Rock Chip Sampling ........................................................................................................ 9-2 Figure 9-2: Resistivity and Chargeability Anomalies Associated with the Yaxtché Central Deposit . 9-4 Figure 9-3: Quevar Interpreted Geophysical Targets ........................................................................ 9-6 Figure 9-4: Results of Underground Structural Mapping ................................................................... 9-9 Figure 9-5: Plan Map Showing Location and Silver Grade of Underground Bulk Samples ............ 9-10 Figure 9-6: Automated Mineralogy of QVD-276 (preliminary results) ............................................. 9-13 Figure 9-7: Plan Map Showing Exploration Potential Relative to Yaxtché 150 g/t Ag Grade Shell 9-14 Figure 9-8: Plan View Showing Selected Intervals Within Yaxtché West Extension Zone ............. 9-15 Figure 9-9: Identified Prospects Within Quevar South .................................................................... 9-17 Figure 9-10: Vince Prospect .............................................................................................................. 9-23 Figure 10-1: Regional Drill Hole Location Plan .................................................................................. 10-3 Figure 10-2: Yaxtché Deposit Drill Hole Location Plan ..................................................................... 10-4 Figure 12-1: Results of the 2018 Pulp Re-Sampling Study ............................................................. 12-10 Figure 13-1: YWMC 2010 Metallurgical Sample Drill Hole Locations (looking northeast) ................ 13-1 Figure 14-1: Example of Element Zonation Between Yaxtché West and Central Using Na% .......... 14-3 Figure 14-2: Yaxtché Domains with All Drill Hole Collars in the Database ....................................... 14-3 Figure 14-3: Yaxtché West, Ag Grades Categorized by Core Recovery .......................................... 14-6 Figure 14-4: Yaxtché Central, Ag Grades Categorized by Core Recovery ....................................... 14-6
El Quevar Project Salta Province, Argentina
NI 43-101 Technical Report on Preliminary Economic Assessment
TOC xii
October 2018 Project Number: 196410
Figure 14-5: Perspective View Looking South of the 150 g/t Ag Shell (red) in Relation to Cu Mineralization (green).................................................................................................... 14-6
Figure 14-6: Perspective View Looking South of the 150 g/t Ag Shell (Red) in Relation to Pb Mineralization (Purple) .................................................................................................. 14-7
Figure 14-7: Perspective View Looking South of the 150 g/t Ag Shell (Red) in Relation to Zn Mineralization (Cyan) .................................................................................................... 14-7
Figure 14-8: Perspective View Looking South of the 150 g/t Ag Shell (Red) in Relation to the As Mineralization (Brown)................................................................................................... 14-8
Figure 14-9: Perspective View Looking South of the 150 g/t Ag Shell (Red) in Relation to the Sb Mineralization (Blue)...................................................................................................... 14-8
Figure 14-10: Perspective View Looking South of the 150 g/t Ag Shell (Red) in Relation to the Quevar Alteration Index (QAI) (Yellow) ......................................................................... 14-9
Figure 14-11: Cross Section Looking 300º Showing the 150 g/t Ag Shell (Dark Gray) in Relation to the Alteration Index (QAI) (Yellow) ............................................................................ 14-9
Figure 14-12: Perspective View Looking South of the 150 g/t Ag Grade Shell (Red) and the Ag Composites >150 g/t (White) ....................................................................................... 14-11
Figure 14-13: Perspective View Looking South of the Oxide-Mixed-Sulfide Codes and the DTM used to Delineate Oxide and Sulfide in the Resource Model ..................................... 14-12
Figure 14-14: Perspective View Looking South 150 g/t Ag Shell and the DTM used to Delineate Oxide and Sulfide in the Resource Model ................................................................... 14-12
Figure 14-15: Perspective View Looking South of Distribution of Density Samples.................... 14-14 Figure 14-16: Histogram of SG Values Showing Lower and Upper Trimming ............................ 14-14 Figure 14-17: Example Variograms for Ag................................................................................... 14-17 Figure 14-18: Example of Indicator Model ................................................................................... 14-20 Figure 14-19: Example of the PACK Ag Model ........................................................................... 14-21 Figure 14-20: Ag Grade Trends Along Strike .............................................................................. 14-23 Figure 14-21: Ag Grade Trends Along Dip-Direction ................................................................... 14-24 Figure 14-22: Ag Grade Trends Along Relative Elevation ........................................................... 14-24 Figure 16-1: 3D Conceptual Schematic of Post-Pillar ....................................................................... 16-5 Figure 16-2: Planned Mine Development ........................................................................................ 16-14 Figure 16-3: Proposed Stoping Zones ............................................................................................. 16-15 Figure 17-1: Schematic Layout, Process Plant ................................................................................. 17-2 Figure 17-2: El Quevar Proposed Block Flow Diagram ..................................................................... 17-3 Figure 18-1: Infrastructure Layout Plan ............................................................................................. 18-2 Figure 18-2:Layout Plan, TSF Phase I .............................................................................................. 18-4 Figure 18-3:Layout Plan, TSF Phase II ............................................................................................. 18-6 Figure 18-4: Simple One-Line Power Distribution Plan for Quevar Project ...................................... 18-8 Figure 22-1: Capital Cost Sensitivity.................................................................................................. 22-1 Figure 22-2: Silver Price Sensitivity ................................................................................................... 22-1 Figure 22-3: Operating Cost Sensitivity ............................................................................................. 22-2 Figure 22-4: Metallurgical Recovery Sensitivity ................................................................................. 22-2 Figure 22-5: Silver Grade Sensitivity ................................................................................................. 22-3 Figure 22-6: Silver Grade Sensitivity ................................................................................................. 22-3

El Quevar Project Salta Province, Argentina
NI 43-101 Technical Report on Preliminary Economic Assessment
Page 1-1
October 2018 Project Number: 196410
1.0 SUMMARY
1.1 Introduction
Amec Foster Wheeler E&C Services, Inc., a Wood company (Wood), John E. Thompson LLC, and Samuel Engineering Inc. (Samuel Engineering) have prepared a technical report (the Report) for Golden Minerals Company (Golden Minerals) on the results of a preliminary economic assessment (PEA) for the El Quevar Project (the Project) located in the Salta Province of Argentina.
1.2 Terms of Reference
The Report was prepared to support disclosure of the results of the PEA in Golden Mineral’s news release of 5 September 2018, entitled “Golden Minerals Reports Positive Preliminary Economic Assessment For El Quevar”.
1.3 Project Setting
The El Quevar Project is located in northwestern Argentina, approximately 300 km northwest of the provincial capital of Salta, within the San Antonio de los Cobres municipality, Salta Province.
The Project is accessed from Salta by following National Road 51 (NR51) to the turnoff to Provincial Road 27 (PR27) for approximately 226 km. From Salta to San Antonio de los Cobres, NR51 consists of either a paved or well-maintained gravel surface. Beyond San Antonio de los Cobres, NR51 is a well-maintained gravel road to the junction with PR27. From the intersection, the El Quevar Project is accessed by driving south for approximately 30 km to the junction with the access road and then east, with the camp currently located approximately 10 km from the junction. Driving time from Salta to the Project camp is four to five hours.
The climate is characteristic of high mountain environments. The weather is extremely dry and ranges from polar conditions on the higher mountain peaks to arid steppe environments at the valley floors. It is expected that any future underground mining operations will be conducted year-round. Exploration activities can be temporarily curtailed by rainfall or snow especially during winter months.
Most of the mineralized areas are located between 4,500 and 5,100 meters above sea level (masl), with the Yaxtché zone surface exposures located between 4,800 and 4,900 masl. Vegetation is characteristic of steppe climates. Wildlife is rare due to the altitude and aridity.
Salta is the major regional supply center and has all major services.

El Quevar Project Salta Province, Argentina
NI 43-101 Technical Report on Preliminary Economic Assessment
Page 1-2
October 2018 Project Number: 196410
1.4 Mineral Tenure, Surface Rights, Water Rights, Royalties and Agreements
The El Quevar Project consists of 31 exploitation concessions (approx. 57,000 ha). Providing certain obligations are met, including annual canon payments, the concessions are granted indefinitely. Concessions are held in the name of Silex Argentina S.A. (Silex Argentina), a wholly indirectly-owned subsidiary of Golden Minerals.
Surface rights at the El Quevar Project are owned by the province of Salta, and as a result there are no agreements required for access. The El Quevar area has no existing private properties or other infrastructure that would limit exploration activities. Golden Minerals holds seven easements, granted by the Province of Salta, which cover items such as, road access, power, water, and the camp and other infrastructure sites.
Silex Argentina has applied for both surface and underground water concessions which are currently pending.
A 1% net smelter return (NSR) royalty is payable on the value of all minerals extracted from the El Quevar II concession and a 1% NSR royalty on one-half of the minerals extracted from the Castor concession. Golden Minerals can purchase one half of the combined royalty interests for US $1 million in the first two years of production.
Golden Minerals may also be required to pay a 3% royalty to the Salta Province based on the mine mouth value of minerals extracted from any of the concessions less costs of mineral processing and sale.
All previous work was completed under fully authorized permits. Silex Argentina maintains the required environmental permits. These permits must be renewed every two years. New permits would be obtained as needed for exploration and further development work. A program of surface water sampling and reporting is currently in place as a condition for the ongoing environmental permits.
There are artisanal prospecting pits and minor workings within the Project area. There is an expectation that there will be environmental liabilities associated with the artisanal and small-scale mining activity. Golden Minerals has initiated reclamation activities on some of the historical disturbances.
The Project lies completely within the Andean Natural Reserve Zone (La Reserva Natural Los Andes) which is classified as a multi-use area (Categoría de Manejo de Uso Múltiple VIII). This classification allows for production/extraction activities including exploration and mining.
1.5 Geology and Mineralization
The El Quevar Project is located along the southern margin of the Miocene Altiplano-Puna volcanic complex of the Andean Central Volcanic Zone, within the Quevar volcanic
El Quevar Project Salta Province, Argentina
NI 43-101 Technical Report on Preliminary Economic Assessment
Page 1-3
October 2018 Project Number: 196410
complex (QVC). The QVC sits within a northeast-trending belt of Quaternary stratovolcanoes and associated domes. The Yaxtché deposit has been identified within the Quevar South alteration zone.
In the Yaxtché deposit area, an epiclastic unit consisting of a matrix-supported volcanic breccia is intruded by a complex of porphyritic dacite domes and associated breccias and flows. A series of dacite–andesite flows cap the volcanic succession and form prominent ridges in the Quevar South area. Hydrothermal breccias have been widely reported in Yaxtché drill holes and outcrop intermittently across the deposit area.
The Yaxtché structural trend strikes at approximately 292° and dips to the north at 65° to 70° near surface, shallowing to 45° to 55° at depth. Due to the geometry of the zone, the structure has been interpreted to represent a listric fault. A series of northeast–southwest-trending structures cut through the deposit area and were largely identified during underground development.
Zoned advanced argillic alteration is typical of that which might be expected to occur in association with high-sulfidation epithermal gold deposits.
Mineralization at Yaxtché consists of fine-grained black sulfides and sulfosalts, occurring as disseminations, open-space filling, and in massive veinlets or clots. Mineralization is controlled primarily by zones of high paleo-permeability. Silver is the element of economic significance, and anomalous concentrations of copper, lead, zinc, and lesser gold occur locally. Mineralization is classified by oxidation state:
• Oxide (supergene): plumbojarosite, argentojarosite, limonite, stibiconite
• Mixed (secondary enrichment): chalcocite, covellite, argentite, native silver, chlorargyrite: when rimming hypogene sulfides
• Sulfide (hypogene): pyrite, galena, sphalerite, tetrahedite–tennantite, complex Pb–Sb–Bi ± Ag sulfosalts, bismuthinite, stibnite, chalcopyrite.
The Yaxtché deposit alteration assemblages are typical of high sulfidation epithermal deposits, whereas the metal content and sulfide assemblages are characteristic of mineralizing fluids with an intermediate sulfidation state.
The Yaxtché deposit remains open along strike and several areas adjacent to the resource estimate area have returned significant silver intercepts. Deeper drill holes at Yaxtché West extension show that significant widths and grades of silver mineralization continue down plunge on the Yaxtché trend.
Within the greater Quevar South project area, several additional prospects have been identified and remain to be fully tested.

El Quevar Project Salta Province, Argentina
NI 43-101 Technical Report on Preliminary Economic Assessment
Page 1-4
October 2018 Project Number: 196410
1.6 History
Prior to Golden Minerals’ property interest, exploration activities had been conducted by Fabricaciones Militares, BHP-Utah Minerals International, Industrias Peñoles, Minera Hochschild, Mansfield Minerals, and Apex Silver Mines Corporation/ Apex Silver Mines Limited (Apex Silver) in the period from 1971–2008.
Work completed included geological mapping, surface channel and rock chip sampling, ground induced polarization (IP)/resistivity geophysical surveys, trenching, petrographic examination, reverse circulation (RC) and diamond core drilling, initial metallurgical testwork, and completion of an initial Mineral Resource estimate.
Golden Minerals acquired an interest in the Project in 2009. Work conducted has included:
• Geological mapping: surface 1:2,000 scale that was compiled at 1:5,000; underground mapping at 1:50 and 1:100 scale and compiled at 1:500 scale
• Collection of 3,100 surface samples
• Reprocessing and interpretation of the 2007–2008 IP survey
• Construction of an adit and decline to access the eastern part of the Yaxtché zone and to investigate the continuity of the mineralization by drifting, channel sampling and bulk sampling of development rounds
• Petrographic, mineralogical, X-ray diffraction, passive infrared mineral analyzer (PIMA), and automated mineralogy analysis examinations
• Additional core drilling
• Metallurgical tests
• Updated Mineral Resource estimates.
1.7 Drilling and Sampling
Two drill programs were completed by Fabricaciones Militares and BHP-Utah Minerals International in the 1970s. Six to seven drill holes appear to have been completed, but meterages are not known. There is no other available information on these programs.
Apex Silver and Golden Minerals completed drill campaigns from 2006–2013. These programs total 417 holes for 104,163 m. There has been no drilling on the Project since 2013.
Core has primarily been drilled at HQ size (63.5 mm core diameter). Occasional reductions to NQ size (47.6 mm) occurred in areas of poor ground conditions. Two drill holes of PQ size (85 mm diameter) were completed in 2011.
El Quevar Project Salta Province, Argentina
NI 43-101 Technical Report on Preliminary Economic Assessment
Page 1-5
October 2018 Project Number: 196410
Geological logging was typically completed on paper sheets and later transferred to a database. The paper log had sections for comments and a graphic log with a separate area for drawing fractures. Mineralization, alteration and alteration intensity were recorded on the log sheet and there was an area for sample interval, sample number and analytical results. The geologist marked the core for any additional observations; for example, some of the early logging programs included PIMA measurements. A paper file was maintained for each stored drill hole with a checklist for each item that must be completed for every hole and included in the file. This included a hole summary, geological log, geotechnical log, analytical results, drill reports, certificate from the surveyor, photographs, downhole survey information and density measurements. Core was photographed.
Geotechnical information such as recovery, rock quality designation (RQD) and mechanical and physical fracture frequency was recorded.
Between April and August of 2012, 113 drill holes in the Yaxtché zone were re-logged on 29 cross sections spaced about 50 m apart, spanning the Yaxtché area. The purpose of the re-logging program was to standardize logging codes and facilitate reinterpretation of the Yaxtché zone.
The average core recovery for all El Quevar Project drill holes averages 93.9% for over 30,000 measured intervals.
Drill sites were located using a handheld global positioning system receiver (GPS). Yaxtché drill holes from the 2006–2008 and 2009 campaigns were surveyed by PDOP Servicios Topograficos (PDOP). PDOP used a Trimble model R3 GPS and a Trimble model M3 total station instrument for drill collar surveying. After 2009, surveys were competed by a surveyor who was an employee of Golden Minerals also using the Trimble model R3 GPS and a Trimble model M3 total station instrument.
Down-hole surveys were taken at 25 m intervals during the 2008–2012 campaigns, using either a Reflex Photobor or Sperry Sun instrument. During the 2012–2013 campaign, readings were at 25–50 m intervals, and performed using a Reflex magnetic survey tool.
Most holes in the Yaxtché deposit were drilled to cross-cut the mineralized zone at a high angle in terms of dip, and nearly all holes were at right angles to the strike of the mineralized Quevar structure. Due to the nature of the mineralization occurring as shoots and veins, the true width of the mineralization will vary both along strike and in the down dip direction. In areas where the strike and dip of the mineralization are well established, a true width for the mineralized intersection may be estimated. However, in areas of poor surface exposure or where there is no drilling or poor drilling, the true width of the mineralization cannot be estimated.

El Quevar Project Salta Province, Argentina
NI 43-101 Technical Report on Preliminary Economic Assessment
Page 1-6
October 2018 Project Number: 196410
The entire mineralized zone was sampled, and 2 to 3 m shoulder was sampled on either side of the mineralized zone. Generally, the core sample intervals were a nominal 1 m length within the mineralized zone but could be longer or shorter due to a lithological boundary. Outside the mineralized zone, samples were typically 2 m in length.
Golden Minerals conducted an extensive 1 m, chip–channel sampling program in the adit/decline and associated underground workings. The sampling consisted of chip–channels cut at the mining face, in the roof, ribs, and fault zone as exposed in the workings.
Density determinations were completed on unwaxed core samples using the water displacement method.
Laboratories used during the drill and sampling campaigns were independent of Apex Silver and Golden Minerals, and included Alex Stewart (ISO 9001:2000 accredited), ALS Chemex, Chile (ISO 9001:2000; Instituto Nacional de Normalizacion Chile ISO 17025.Of2005), Acme (IRAM – RI 9000-t 295), TSL Laboratories Inc. (ISO/IEC Standard 17025 Guidelines), SGS (ISO 9001; ISO/IEC Standard 17025 Guidelines) and American Assay Laboratories (ISO/IEC 17025:2005).
Sample preparation at Alex Stewart consisted of crushing to 80% passing 10 mesh, and pulverizing to 85% passing 200 mesh. The samples were analyzed for 39 elements by inductively coupled plasma (ICP); method ICP-MA-390) with four acid digestion of a 0.2 g sample. All samples were analyzed for silver and gold by fire assay of a 50 g sample with gravimetric finish for silver (method AG4A-50) and atomic absorption (AA) finish for gold (method Au450).
Sample preparation at ALS Chemex consisted of crushing to 70% passing 10 mesh, then pulverizing to 85% passing 200 mesh. Samples were analyzed for 33 elements by ICP (ME-ICP61) using four acid digestion. Silver over-limits were analyzed by fire assay with AA finish (Ag-AA62). Gold was analyzed by fire assay with AA finish (Au-AA24).
Sample preparation at Acme consisted of crushing to 80% passing 10 mesh and pulverizing to 85% passing 200 mesh. Samples were analyzed for 39 elements by ICP-MS (Group 1DX) analysis. Silver over-limits were analyzed by gravimetric finish (AG-G6-Grav). Gold was analyzed using method Au-GRA22.
Less than 1% of the samples in the database were sent to SGS. Samples were analyzed for 39 elements by ICP-MS (Group IDX) analysis. The silver over-limit analyses were analyzed by fire assay with gravimetric finish (AG-G6 -Grav). Gold was analyzed using Au-GRA22). Over-limit samples of lead, zinc, and copper are analyzed by 7AR with a multi-acid digestion.
No internal quality assurance and quality control (QA/QC) program was in place until drill hole QVD-043. The early analytical programs rely upon the internal Alex Stewart laboratory QA/QC program. The QA/QC program instigated by Apex Silver could use
El Quevar Project Salta Province, Argentina
NI 43-101 Technical Report on Preliminary Economic Assessment
Page 1-7
October 2018 Project Number: 196410
two types of blanks, three types of duplicates, six precious metal standard reference samples (SRMs) and four base metal SRMs. The sampling completed under Golden Minerals continued with the same insertion rates and materials as the Apex Silver programs.
Sample security procedures met industry standards at the time the samples were collected. Current sample storage procedures and storage areas are consistent with industry standards.
1.8 Data Verification
Data verification was undertaken in support of technical reports on the Project by external consultants SRK (2009), Chlumsky, Armbrust & Meyer, LLC (2009, 2010), Micon (2010) and Pincock, Allen and Holt (2012). These consultants concluded, at the time of their examination, that the data were suitable to support Mineral Resource estimation.
Wood was provided with electronic data files for the density and geotechnical data, and with assay files from Alex Stewart Laboratories, ALS, Acme (now Bureau Veritas) and SGS laboratories. Based on these data, an updated assay database was constructed. This database was merged with the existing assay table and an updated assay table was created to support resource estimation. Updated tables for density and geotechnical information were also constructed.
Wood (2018) reviewed the QA/QC data supplied by Golden Minerals. The review focused on results obtained for standards, duplicates and blanks. There were no significant issues noted with the duplicate or blank QA/QC results. However, the SRMs used between 2006 and 2013 were a combination of commercial reference standards (CRMs) and six SRMs created from material collected from the Quevar site (likely drill core reject material). The CRMs were noted to be well below the 150 g/t Ag grades used to constrain the 2018 resource model and are not considered by Wood to be appropriate for the current resource model. In Wood’s opinion, the site-specific SRMs were not created using industry-accepted practices, and thus should not be considered as reference materials.
As a result, Wood traveled to site to supervise and assist in the collection, shipping and re-assaying of a representative set of pulps within the Mineral Resource estimate area. A total of 472 samples (including CRMs and blanks) were submitted to ALS for analysis. Results of the re-sampling study showed that the assays of the re-sampled pulps results agreed very closely to the original assays.
Wood has audited collar survey, downhole survey, assays, density, lithology and redox tables. These data are considered acceptable to support Mineral Resource estimates.

El Quevar Project Salta Province, Argentina
NI 43-101 Technical Report on Preliminary Economic Assessment
Page 1-8
October 2018 Project Number: 196410
1.9 Metallurgical Testwork
Dawson Metallurgical Laboratories, Inc. (DML) of Salt Lake City, Utah, (now owned by FLSmidth) was initially commissioned by Apex Silver in 2008 to complete testwork on sample composites from the Yaxtché deposit at El Quevar. Composites for the initial 2008 testwork were designated as being oxide, mixed supergene, and deeper sulfides taking into consideration that both open pit and underground were potential mining options. In 2009, Golden Minerals assumed ownership of El Quevar and continued the metallurgical testwork at DML. The objectives of the metallurgical tests were to develop technical parameters and inputs for design of the process plant including
• Process flow sheet
• Design criteria
• Consumables
• Material and water balances
• Optimizing processing results (such as grind size and silver recovery).
As Project work progressed between 2008 and 2010 for identifying the Project’s potential development, DML’s testwork was focused on sulfide mineralization from the underground portions of the deposit.
Numerous metallurgical test programs have been conducted on samples from the Yaxtché deposit between 2008 and 2012. The composites in the 2009 testwork were changed from mineralization type to deposit locations of east, west, central, sulfide and a master composite. Subsequent tests in 2010–2012 centered on optimizing sulfide flotation for composite samples from the west zone (YWMC 2010) as the majority of the potential mill feed material is contained in the Yaxtché west zone. Metallurgical investigations have evaluated the amenability of composite samples from deposit zones to numerous silver recovery flowsheets including:
• Flotation (concentrate)
• Flotation and cyanidation of flotation tailings (concentrate and doré)
• Flotation and concentrate cyanidation and flotation tailings cyanidation (doré).
• Flotation and concentrate cyanidation (pressure oxidation or POX) and flotation tailings cyanidation (doré)
• Whole ore cyanidation (doré)
• Whole ore cyanidation (post POX) (doré).
In general, this work has concluded the following for sulfide mineralization and metallurgy:
El Quevar Project Salta Province, Argentina
NI 43-101 Technical Report on Preliminary Economic Assessment
Page 1-9
October 2018 Project Number: 196410
• Acceptable silver recoveries were observed by flotation using commercially-available reagents
• The use of selective flotation resulted in the highest recoveries up to 93% for YWMC 2010. The results of the batch and locked cycle flotation on the YWMC 2010 composite indicated 93% Ag could be recovered to a 6.41 wt% weight pull concentrate with a 10,600 g/t Ag grade by two stages of rougher flotation and two stages of cleaner flotation. However, the head silver grade of YWMC 2010 was 745 g/t Ag, which is significantly higher than the current resource grade of 409 g/t Ag. Metallurgical modelling was performed on these test results at the resource silver grade where cleaner stages were added to increase the concentrate silver grade to an acceptable level. No regrind of the rougher concentrate was performed on the locked cycle tests. Batch tests indicate that higher silver concentrate grades could be obtained with rougher concentrate regrind and are recommended in future studies. Additionally, elevated levels of arsenic, antimony and bismuth were noted in the silver concentrate
• High variabilities in silver recovery by flotation were noted going from the west (93%) to the central (60%) and east (88%) zones in the earlier tests. The silver mineralization appears to be different in these zones. Additional mineralogical and testwork need to be completed to identify the specific silver minerals in order to optimize the processing results.
The currently preferred flowsheet is selective rougher and cleaner flotation to produce a bulk silver concentrate. Although the implementation of cyanide leaching was not considered in this project analysis, it is recommended that economic trade-off studies be completed examining the various production options. Silver recoveries are highly variable across the deposit from west to east, suggesting a change in silver mineralization that needs to be examined in future studies. There also seems to be a change in material hardness (Bond work index) and abrasiveness across the deposit zones which should be investigated further by Golden Minerals in future studies.
Based on current testwork results, the bulk silver concentrate would contain elevated levels of arsenic, antimony and bismuth impurities, which could potentially result in higher concentrate treatment charges and incur penalty charges.
1.10 Mineral Resource Estimation
A hybrid silver model was constructed by first defining the overall geometry of the silver mineralization using implicit modeling software, and then estimating Mineral Resources within the Ag shell using probability assigned constrained kriging (PACK).
A total of 331 drill holes (80,955.0 m) support the resource model. A 150 g/t (ppm) Ag shell was constructed, and 1 m composites inside the shell were used for exploratory data analysis and capping studies. Visual inspection was undertaken of wireframe

El Quevar Project Salta Province, Argentina
NI 43-101 Technical Report on Preliminary Economic Assessment
Page 1-10
October 2018 Project Number: 196410
models constructed for copper, lead, zinc, arsenic, antimony and silver to identify zonation patterns.
Higher alteration intensity codes (visually logged codes that range from 0–3) correlate to higher silver grades, and lower calcium, magnesium and sodium grades. A Quevar alteration index (QAI) was created using calcium, magnesium and sodium assay data to better delineate the geometry of the alteration that can then be used to help define the geometry of the silver mineralization.
Structural trends controlling the silver mineralization were delineated using grade trends, the QAI alteration index, and key lithological units. The trends were recorded using digital terrain model wireframes (DTM), and then imported into Leapfrog Geo software. The composites and the structural trends were then used together to construct a 150 g/t Ag wireframe shell. The grade shell was subsequently imported into Datamine studio for resource estimation.
Visually logged oxide, sulfide and mixed codes in the database (OXIDOS, SULFURO, and MIXTO) were refined by comparing the logged codes to the core photos and codes in adjacent holes. Since the processing method currently being evaluated is a sulfide mill, the mixed was combined with the oxide, and a near-horizontal DTM was constructed to delineate oxide above and sulfide below the DTM.
Density measurements were performed on 1,568 diamond drill core samples by the on-site exploration geologists using the water displacement method. Density data were recorded in the database and reviewed spatially and statistically. The spatial review showed that the density samples were representative of the deposit. Density values were estimated into the block model separately for oxide and sulfide using inverse distance squared (ID2) method and an anisotropic flat lying search to reflect the near-horizontal oxide–sulfide boundary.
Grade capping studies were performed for the Yaxtché West and Yaxtché Central domains. Capping was performed on the 1 m composites before further compositing into the 2.5 m composites used for the Mineral Resource estimations. For arsenic and antimony, no capping was applied since many assays exceed the upper limit of the assay method used.
As no obvious changes in attitude were noted between Yaxtché West and Yaxtché Central, variograms and grade estimations were performed for both domains combined. Any local variations within the overall trend were accounted for by using dynamic anisotropy during grade estimations which aligns the search ellipse with the structural trends for every block in the model during grade estimation.
The PACK estimation method was selected for its ease to construct multiple models using different silver thresholds. The model was constructed using a 250 g/t Ag threshold:

El Quevar Project Salta Province, Argentina
NI 43-101 Technical Report on Preliminary Economic Assessment
Page 1-11
October 2018 Project Number: 196410
• The extents of the Ag mineralization were defined using a 150 g/t Ag wireframe shell
• The 150 g/t Ag shell was populated with blocks rotated 30º clockwise around the Z axis. A block size 5.0 m x 2.5 m x 2.5 m (along strike, perpendicular to strike, vertical) was selected
• The 2.5 m composites within the 150 g/t Ag shell were flagged and used to construct an indicator model. If the Ag grade was <250 g/t, the indicator was set to 0, if the Ag grade was ≥250 g/t, the indicator was set to 1
• The indicators were estimated into the150 g/t Ag shell using an inverse distance to the third power (ID3) interpolation method
• The estimated indicator values in the block model were then tagged back into the composites, and only blocks with an estimated indicator ≥0.30 were estimated using only those composites with tagged estimated indicator values ≥0.30
• Silver grades were estimated into the blocks using ordinary kriging (OK), on composites with estimated indicator ≥0.30.
The interpolation was checked using visual inspection of plans, cross- and longitudinal sections. The block model was checked for global bias by comparing the average silver, gold, copper, lead, and zinc (with no cut-off) from the model (OK grades) with means from nearest-neighbor (NN) estimates. In general, an estimate is considered acceptable if the bias is at or below 5%; there were no biases over 5%. Local trends in the grade estimates (swath checks) were performed by plotting the mean silver values from the NN estimate versus the kriged results along strike, along dip-direction and vertical directions. Although the global comparisons agree well, the swath plots illustrate the existence of slight local differences between the NN and kriged model grades, which are considered to be acceptable.
Mineral Resources were classified using a guideline that Indicated Mineral Resources should be quantified within relative ± 15% with 90% confidence on an annual basis and Measured Mineral Resources should be known within ± 15% with 90% confidence on a quarterly basis. For the Yaxtché model, a drill hole spacing study was performed to determine the nominal drill hole spacing required to classify material as Indicated. The confidence limits, a review of continuity on sections and plans, and an assessment of data quality were all used to determine that a minimum drill hole spacing of 30 by 30 m was required to classify Indicated Mineral Resources. The classification was then smoothed to remove the isolated blocks with a different classification than the surrounding blocks. Material within the 150 g/t Ag shell not classified as Indicated was classified as Inferred, and no Measured is reported.
There are reasonable prospects for eventual economic extraction using the following assumptions: a silver price of $16.62/oz, employment of underground, mechanized,
El Quevar Project Salta Province, Argentina
NI 43-101 Technical Report on Preliminary Economic Assessment
Page 1-12
October 2018 Project Number: 196410
modified room‐and‐pillar mining methods, and silver concentrates will be produced and sold to a smelter. Mining costs are estimated to be $55/t at a nominal production rate of 365,000 t/a. Concentrator and general and administrative (G&A) costs are assumed to be $30/t and $20/t respectively. Metallurgical recovery of silver is projected to be 88.5%.
Although silver, copper, lead, zinc, arsenic, and antimony were estimated, the model was optimized to estimate the silver mineralization as it is the only economic contributor and only metal being reported as a Mineral Resource. Gold was estimated to determine if any significant gold credits could be expected, but gold grades were too low to warrant any further studies at this Project stage. Copper, lead, zinc, arsenic, and antimony were estimated to better understand the deposit, and assist with future metallurgical studies.
1.11 Mineral Resource Statement
The Yaxtché underground resource model was constructed by Gordon Seibel, R.M. SME and Principal Geologist with Wood in conjunction with Golden Minerals’ personnel.
Mineral Resources are reported in accordance with the Canadian Institute of Mining, Metallurgy and Petroleum (CIM) Definition Standards for Mineral Resources and Mineral Reserves (May 2014; the 2014 CIM Definition Standards) and the CIM Estimation of Mineral Resources and Mineral Reserves Best Practice Guidelines (November 2003; 2003 CIM Best Practice Guidelines).
Mineral Resources are summarized in Table 1-1, and have an effective date of 26 February 2018.
A number of factors were noted that may affect the Mineral Resource estimate, including: commodity price assumptions; changes in local interpretations of mineralization geometry and continuity of mineralization zones; changes to geotechnical, hydrogeological, and metallurgical recovery assumptions; density and domain assignments; changes to assumed mining method which may change block size and orientation assumptions used in the resource model; input factors used to assess reasonable prospects for eventual economic extraction; assumptions as to social, permitting and environmental conditions; and additional infill or step out drilling or results obtained from extending the exploration decline.
The QP notes that a portion of the 150 g/t Ag wireframe shell occurs in upper portions of the Yaxtché East domain. This material may be amenable to open pit mining methods; however, this would require a separate resource model designed using a lower-cut-off grade, refinement of the oxide-mixed logged codes, and consideration of reasonable prospects of eventual economic extraction using an open pit mining scenario.
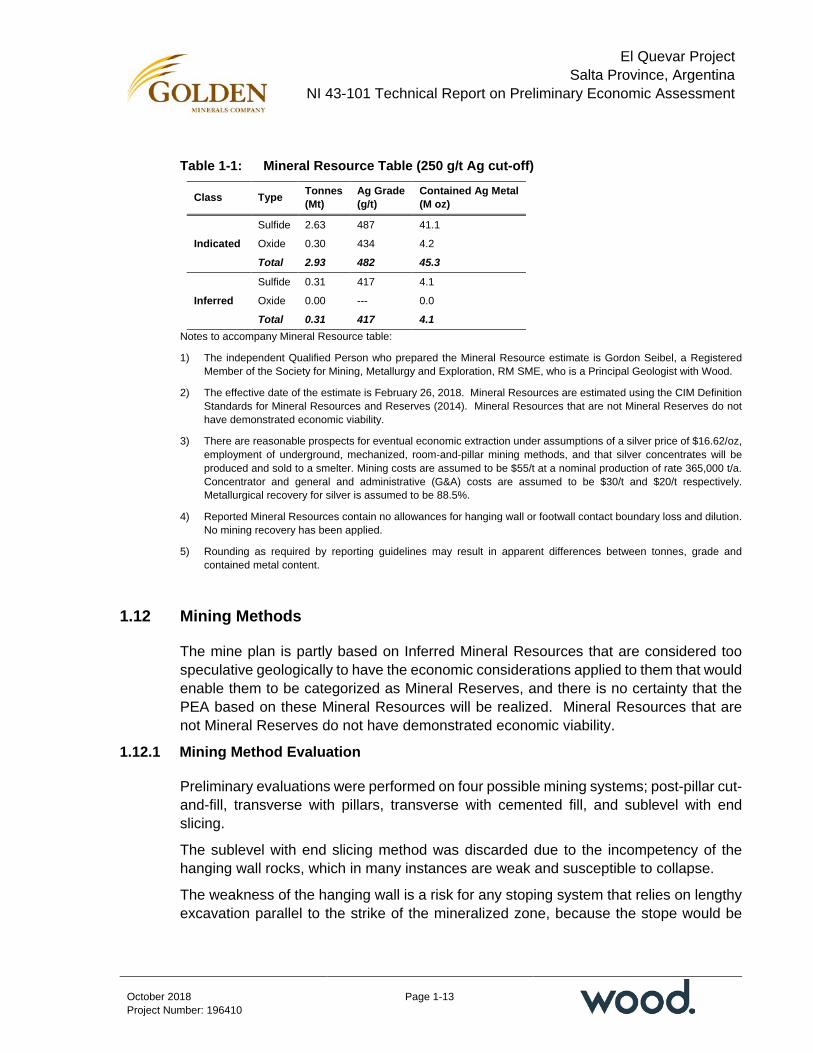
El Quevar Project Salta Province, Argentina
NI 43-101 Technical Report on Preliminary Economic Assessment
Page 1-13
October 2018 Project Number: 196410
Table 1-1: Mineral Resource Table (250 g/t Ag cut-off)
Class Type Tonnes (Mt)
Ag Grade (g/t)
Contained Ag Metal (M oz)
Indicated Sulfide 2.63 487 41.1
Oxide 0.30 434 4.2
Total 2.93 482 45.3
Inferred Sulfide 0.31 417 4.1
Oxide 0.00 --- 0.0
Total 0.31 417 4.1 Notes to accompany Mineral Resource table:
1) The independent Qualified Person who prepared the Mineral Resource estimate is Gordon Seibel, a Registered Member of the Society for Mining, Metallurgy and Exploration, RM SME, who is a Principal Geologist with Wood.
2) The effective date of the estimate is February 26, 2018. Mineral Resources are estimated using the CIM Definition Standards for Mineral Resources and Reserves (2014). Mineral Resources that are not Mineral Reserves do not have demonstrated economic viability.
3) There are reasonable prospects for eventual economic extraction under assumptions of a silver price of $16.62/oz, employment of underground, mechanized, room‐and‐pillar mining methods, and that silver concentrates will be produced and sold to a smelter. Mining costs are assumed to be $55/t at a nominal production of rate 365,000 t/a. Concentrator and general and administrative (G&A) costs are assumed to be $30/t and $20/t respectively. Metallurgical recovery for silver is assumed to be 88.5%.
4) Reported Mineral Resources contain no allowances for hanging wall or footwall contact boundary loss and dilution. No mining recovery has been applied.
5) Rounding as required by reporting guidelines may result in apparent differences between tonnes, grade and contained metal content.
1.12 Mining Methods
The mine plan is partly based on Inferred Mineral Resources that are considered too speculative geologically to have the economic considerations applied to them that would enable them to be categorized as Mineral Reserves, and there is no certainty that the PEA based on these Mineral Resources will be realized. Mineral Resources that are not Mineral Reserves do not have demonstrated economic viability.
1.12.1 Mining Method Evaluation
Preliminary evaluations were performed on four possible mining systems; post-pillar cut-and-fill, transverse with pillars, transverse with cemented fill, and sublevel with end slicing.
The sublevel with end slicing method was discarded due to the incompetency of the hanging wall rocks, which in many instances are weak and susceptible to collapse.
The weakness of the hanging wall is a risk for any stoping system that relies on lengthy excavation parallel to the strike of the mineralized zone, because the stope would be

El Quevar Project Salta Province, Argentina
NI 43-101 Technical Report on Preliminary Economic Assessment
Page 1-14
October 2018 Project Number: 196410
lost if the hanging wall collapses. The transverse-with-pillars stoping method was discarded because it would recover about 45% of the mineralized material.
Post-pillar cut-and-fill and transverse with cemented fill were further reviewed. Detailed layouts for comparison of each mining method were completed for the required accesses, pillars, mined grade, recovered tonnage, and direct mining cost could be compared. The cost of the fill is the significant difference between the two proposed methods. The transverse-and-cemented-fill method requires a ‘concrete’ pillar top to bottom to support the entire stope area, so the adjacent extractions can be performed. The post-pillar cut-and-fill mining method was selected for the PEA evaluation.
1.12.2 Post-Pillar Cut-And-Fill
The mineralization plunges from the east to the west at approximately 10º. Main development will extend down plunge with ramps and spiral declines. Accesses will be excavated to the stoping zones from the ramp system and will intersect the lowest elevation mineralized material in the various sections of the deposit, enabling the extraction to advance upward.
The post-pillar cut-and-fill method depends on intersecting the mineralized material at the lowest elevation, then progressing upwards to the highest level. Initial rooms from the accesses will be excavated at 5 m x 5 m. The typical advance per round will be 5 m, although the drill depth can be adjusted if the hole cuttings indicate there is a waste zone less than 5 m beyond the face.
Extractable pillars will be “pulled” once the rooms in the area have been fully developed. Extractable pillars are those pillars not required to carry any load from the previous excavation level. “Pig pen” cribs will be installed in the rooms adjacent to the pillar that is being pulled to add a degree of load-carrying capability in the tributary area. Sized fill will be placed in the initial rooms using scoops with rammer units. Fill may be concurrent with mining in some circumstances.
Mining of the next rooms, located directly above the initial rooms, will commence once the filling is complete or at a point where it can be done concurrently with the ongoing excavation. Room excavation and filling cycles will continue until the uppermost portion of the mineralization, in a particular zone, is reached. The next level room excavations, following the initial excavation, will be done by working horizontally from the placed fill. The concept of using a vertical excavation system was reviewed and discarded because of the mineralization characteristics that have the deposit geometry differing significantly over five vertical meters.
Work performed in the stope areas will be completed using a “multiple heading” concept. There will be sufficient active faces so drilling, blasting and mucking in the area can be performed concurrently and independently. The drilling cycles will have the longest duration of all of the three major excavation tasks. Daily stope productivity depends on
El Quevar Project Salta Province, Argentina
NI 43-101 Technical Report on Preliminary Economic Assessment
Page 1-15
October 2018 Project Number: 196410
the number of drill cycles a single drill unit can be perform in a typical stope area. Work will be carried out using two 10 hr shifts per day, which leaves four hours for daily machine maintenance and “catch-up” work if required. The current plan assumes two stope areas in operation to deliver 1,200 t/d of mill feed material to the plant, 350 d/a.
1.12.3 Backfill
Backfill in the stope areas will be accomplished by hauling material from development or internal stope waste headings to the area requiring fill, and by backhauling crushed/sized backfill from the surface.
The surface backfill will consist of existing loose material that is prepared using a small mobile crushing/sizing plant then loaded into empty haul trucks returning to the mine after delivering mill feed material to the run-of-mine (ROM) pad. The underground trucks will deliver the fill products at or near the point of usage.
A load–haul–dump (LHD) scooptram, fitted with a rammer, will be used to push the fill into place.
1.12.4 Ventilation
The mining operation will require 176 m3/sec (375,000 ft3/min) in the initial years of the operation, increasing to 200 m3/sec (430,000 ft3/min) by year 5. The required ventilation increase is due to the increase in the haulage truck fleet, because of longer travel distances.
The initial mine ventilation circuit will be constructed using the existing raise that was driven to the surface during the original project development, completed in 2010. Future ventilation raises will be up-reamed boreholes, 3–4 m in diameter that will be bored from the surface immediately following the completion of the development to a production area. A leap-frog method of the borehole equipment and moves will reduce the ventilation capital expenditures to a minimum.
The required mine ventilation is based on 100 cfm per brake horsepower (bhp), using 100% for the first diesel unit, and 80% for the remaining diesel units. An additional 200 cfm is added for each person working underground.
1.12.5 Mine Dewatering
The required mine dewatering system has been estimated using the current inflow of approximately 3 L/sec (50 gpm) and assumes a predicted flow increase proportional to the increase in underground development and stoping areas. These assumptions were derived following discussions with Golden Minerals personnel and are based on historical flow data from the trial mining operation.
El Quevar Project Salta Province, Argentina
NI 43-101 Technical Report on Preliminary Economic Assessment
Page 1-16
October 2018 Project Number: 196410
The maximum projected inflow at the deepest area of the mine is projected to be 13 L/sec (200 gpm). Phase 1 of the pump system is designed to handle 50 L/sec (800 gpm) from the deepest area of the mine. All mine water will be pumped to a decantation pond that will be located on the surface near the mine portal.
1.12.6 Geotechnical Considerations
The general width of the mineralized zone is ±50 m; this will generate a pressure arch depth of 202 m, and the 200 m overburden depth will dictate the pillar load. The pillar size selected is a 5 m x 5 m square. The height of the rooms is 5 m; however, the room height used in the calculations was assumed to be the room that excavation is in progress and the upper 2.5 m of fill in the previous room below (7.5 m total). This assumes that the fill beyond the 7.5 m vertical boundary reinforces the pillar and enables the pillar to safely carry the tributary load.
The calculated pillar tributary load is 2,880 psi (199 MPa), and the pillar strength is 4,720 psi (32.5 MPa), giving a 1.6 factor of safety (FOS). The pillars with an overburden depth of less than 170 m have a safety factor of 1.8, with only those pillars between the maximum depth of 200 m and 170 m having a FOS of less than 1.8. A 1.8 FOS is acceptable for pillars in areas of average conditions. A FOS of 1.6 should suffice for pillars in active mining areas below the 170 m overburden level.
1.12.7 Underground Infrastructure
The mine’s surface facilities, located at the portal pad, will include the following:
• Office/dry/lamp room building
• Underground shop
• Surface maintenance shop with wash bay and tire repair facilities (complete)
• Explosive magazines (complete)
• Fuel depot (complete)
• Generator/compressor building (complete)
• Generators set and connected (complete)
• Electrical workshop (complete)
• Decantation pond for mine dewatering (complete)
• Clean water system and heated tanks (complete)
• Clean water well (complete)
• 4160-volt substation (complete).

El Quevar Project Salta Province, Argentina
NI 43-101 Technical Report on Preliminary Economic Assessment
Page 1-17
October 2018 Project Number: 196410
Many of the required facilities, noted as complete, were constructed with the initial Project trial mining development in 2010. These existing facilities have been well maintained and are ready for use.
1.12.8 Production Plan
Year -1 will be used to complete the required pre-production physical development, year 1 will be the ramp up to production of 1,200 t/d of mill feed material, and the sustaining development. Year 2 to year 5 will have sustained production at 1,200 t/d, with sustaining development at 939 m/a. Year 6 sustains production at 1,200 t/d, with all development completed by the end of year 6.
Any feed grade material encountered in development in Year -1 and early Year 1 will be stockpiled for processing when the plant is available.
Mine production assumes producing 1,200 t/d for 350 d/a, from two active stope areas. Two stopes are planned to be in operation throughout the mine life thus enabling the mine-out of the mineralized zone to occur without a slow drop in production at the end of the mine life. Slow production declines typically occur in mines with a large number of active stopes. A typical year of 350 days is used to accommodate the last two weeks of the year being idle, which is traditional in the northern Argentinean industries.
The proposed production schedule assumes equipment procurement; pre-production development and plant construction to be completed in Years -2 and -1. Year 1 assumes four quarters of production ramp-up.
Mine development will consist of 6,000 m of main ramp, stope accesses, raise accesses, muck bays and other miscellaneous excavations. The sum of the development will be completed in Year -1 and the first five years of production.
1.12.9 Drilling, Blasting and Grade Control
The drilling and blasting will be completed using typical underground drill-blast technologies. Grade control will be accomplished through face sampling, elementary drill-hole analysis, and muck pile sampling.
1.12.10 Equipment Fleet
Mechanical availability of the major underground equipment is assumed to be 85%. Equipment will include jumbos, 7 yd3 LHD, blasting and haulage trucks, and rammer units.
1.13 Recovery Methods
The recovery methods for the El Quevar processing plant were developed to recovery silver from the Yaxtché sulfide deposit. The current design basis is set to process 1,200

El Quevar Project Salta Province, Argentina
NI 43-101 Technical Report on Preliminary Economic Assessment
Page 1-18
October 2018 Project Number: 196410
t/d of mineralized silver material from the underground mine for the production of a bulk silver concentrate by conventional crushing (two stages), grinding (single stage), flotation (rougher [two stages] and cleaners [five stages]) techniques. The process plant would treat 1,200 t/d of mineralized material from the underground mine at an average 90.2% recovery for the production of a bulk silver concentrate with an average grade of 11.5 kg/t Ag.
Testwork results completed by DML and JKTech/Hazen were used as the basis for the design of the process plant. The results of DML’s 2012 locked cycle flotation testwork (see section 13.7) was Samuel Engineering’s primary data source for sulfide materials from the Yaxtché West deposit. This testwork included only two cleaner stages for producing the bulk silver concentrate. Samuel Engineering modeled the mass balance for the process plant to include five cleaner stages in order to produce a marketable, high-grade bulk silver concentrate.
Run-of-mine (ROM) mineralized silver material from the underground mine would be fed to the comminution circuit. Comminution would be accomplished by two stage crushing followed by ball milling to produce a particle diameter of 80% passing (P80) of 45 µm. The ROM material would be dumped by mine trucks into a primary bin equipped with a grizzly feeder. Oversize material from the grizzly feeder would be discharged to the primary jaw crusher. The primary crushed material would be combined with the undersize material from the grizzly and conveyed to the coarse crushed stockpile. Coarse material from the stockpile would be reclaimed and conveyed to the secondary crushing circuit. The coarse material would be pre-screened by the double-deck secondary screen. The screen oversize would be fed to a secondary cone crusher. The secondary crushing circuit would produce a fine product which would be conveyed to a fine crushed stockpile as feed to the ball mill grinding circuit.
The ball mill circuit would operate in closed circuit with cyclones for size classification. The ground slurry from the ball mill would discharge to the ball mill discharge sump for feeding the ball mill cyclone cluster. The ball mill cyclone cluster would size the pulp to a P80 of 45 µm for flotation with the cyclone underflow returned to the ball mill for further grinding. Cyclone overflow would be pumped to the flotation circuit via the flotation feed conditioning tank. Flotation reagents (collectors, promoters and frothers) would be added to the slurry for conditioning along with recycled process water from the concentrate thickener overflow and tailings reclaim water.
The rougher flotation circuit would be done in two stages separated by a conditioning tank where more reagents are added. The flotation concentrates from both rougher stages would be combined and pumped to cleaner flotation. Cleaner flotation would be done in five stages operating in closed-circuit to produce a bulk silver concentrate. Reagents would be added to each cleaner stage. The final concentrate from the fifth cleaner stage represents the final bulk silver concentrate which would be pumped to the concentrate thickener.
El Quevar Project Salta Province, Argentina
NI 43-101 Technical Report on Preliminary Economic Assessment
Page 1-19
October 2018 Project Number: 196410
The concentrate thickener overflow would be returned to the process water tank and the thickener underflow would be pumped to a holding tank ahead of the concentrate pressure filter. The concentrate filter would reduce the concentrate cake to about 10% moisture and the filtrate would be pumped back to the concentrate thickener. The final silver concentrate would be packaged in one tonne super sacks for shipment. Testwork indicates the silver concentrate would contain elevated levels of arsenic, bismuth and antimony.
The tailings from the first cleaner stage would be sent to cleaner scavenger flotation with the scavenger concentrate returned to the ball mill and the scavenger tailings to the tailings thickener. The tailings from the second rougher stage would be combined with the cleaner scavenger tailings as the final plant tailings which would be pumped to the tailings thickener. The final plant tailings in the thickener underflow would be pumped to the planned tailings impoundment location, a distance of about 670 m. Reclaim water from the tailings impoundment would be returned as process water to the plant circuits.
1.14 Project Infrastructure
There are no permanent waste rock storage facilities designed for the Project as part of this PEA. Waste rock from pre-development will be stored in a temporary stockpile on the surface. The temporary stockpile and all other waste rock produced will be used as backfill for the extracted stopes. The waste rock stored on surface will be backhauled to the underground stoping areas using the haul trucks after the trucks have delivered their loads to the plant ROM area.
The tailings storage facility (TSF) will be located approximately 600 m west of the plant facility in a natural bowl at a base elevation of 4,842 masl. The TSF will be constructed in two phases; Phase I will be constructed in year -1 and Phase II will be constructed during year 3 for operation in year 4. The plant discharge into the tailing pond will use cyclones that will be positioned around the TSF perimeter.
Existing camp accommodations will provide offices, dining and lodging accommodations for the pre-development and building construction phase. The current camp also has a power generator adequate for the expansion, diesel and lube depot, trash pit, water treatment plant and potable well water system. The current camp provides room and board for 100 workers. The PEA would expand the camp bedrooms, kitchen and ancillary services to 350-person capacity.
The camp water supply is provided from a well 2.6 km east of the camp. The well is drilled into an alluvial fan that contains a large reservoir of potable of water. The existing well has sufficient capacity to provide the expanded camp’s water requirement during the Project life.
The Project power will be supplied using natural gas generators with gas provided from a major natural gas line that is located about 2 km from the El Quevar camp. The capital

El Quevar Project Salta Province, Argentina
NI 43-101 Technical Report on Preliminary Economic Assessment
Page 1-20
October 2018 Project Number: 196410
estimate includes a natural gas supply line extended from this gas line to the generator site adjacent to the El Quevar camp. The generation facility will consist of three 3.0 MW generators with two generators running and one generator on standby. The generators will develop 13.8 kV, which will be stepped up to 25 kV for delivery to the mine and plant. A 25 kV overhead line will be used to deliver power from the generator site to the mine and plant site. The plant and mine will each have 3.0 MW substations accepting the 25 kV power and stepping the power down to distribution system voltages.
1.15 Markets and Contracts
The El Quevar Project would produce a single silver-bearing concentrate assaying about 11.5 kg/t Ag of concentrate from the on-site process plant. This concentrate would be loaded into one tonne super sacks at the process plant and trucked to the Chilean port of Antofagasta for export to foreign smelters for treatment (smelting) and refining.
Concentrate handling and transportation costs are estimated at US$255/wet metric tonne (wmt) concentrate plus an insurance cost of 0.2% of the concentrate value. Golden Minerals has not entered into any discussions for concentrate sales contracts or terms and has not committed any tonnages of concentrate with potential buyers or consumers.
The El Quevar concentrate will contain high payable values of silver; however, no other payable metals for copper, gold, lead or zinc are envisioned at this time. The silver payfor is estimated at 95% based on the concentrate assays from metallurgical testwork and plant material balances. Metallurgical testwork indicates elevated levels of impurities for bismuth, arsenic and antimony in the concentrate, which would result in penalties totaling US$236.65/dry metric tonne (dmt) of silver concentrate. The smelting, refining and penalty terms are based on benchmarks to current terms.
No marketing studies for El Quevar silver concentrate have been completed by Golden Minerals or its consultants. Future metallurgical testwork and trade-off studies should examine various methods for improving the silver recovery and concentrate grade and reduce impurity levels and penalties. The commodity price for silver used for the economic analysis is US$16.66/oz Ag, based on the three-year period from July 1, 2015 to June 30, 2018.
1.16 Environmental, Permitting and Social Considerations
1.16.1 Baseline Studies
Silex Argentina prepared impact reports on behalf of Golden Minerals in support of work programs including prospecting and exploration programs, and in support of easement applications.

El Quevar Project Salta Province, Argentina
NI 43-101 Technical Report on Preliminary Economic Assessment
Page 1-21
October 2018 Project Number: 196410
In 2010, Ausenco Vector prepared an environmental baseline study that evaluated areas that were likely to be affected by mining activities. Areas covered included hydrology, hydrogeology, geology, soils, water and air quality, paleontology, limnology, flora, fauna, terrestrial ecology, landscapes, legal frameworks, socio-economics and archaeology.
Most of the studies indicated typical settings for a project in that area of Salta Province.
1.16.2 Environmental Considerations
The Project is situated within two Protected Areas designated under the Provincial System of Protected Areas (SIPAP), administered by the Secretariat of Environment and Sustainable Development of the Ministry of Environment and Sustainable Production of the Province of Salta:
• The Los Andes Wildlife Reserve
• The Vicuña (Vicugna vicugna) Protection Zone.
1.16.3 Closure and Reclamation Planning
A formal closure plan would be developed as part of more detailed mining and permitting studies. The conceptual closure plan presented in this Report assumes that progressive rehabilitation will be conducted where practicable and will be followed by closure activities and post-closure monitoring. A 5–10 year period is suggested for the post-closure period.
Closure costs are included in the capital cost estimate.
1.16.4 Permitting Considerations
As noted, Ausenco Vector prepared an environmental baseline study report in 2010, which was accepted by the relevant authorities.
In March 2018, a Stage IIA environmental impact report was submitted to the relevant authorities to support surface exploration activities, including project reviews and 1:2,000 scale geological mapping. The Stage IIA report was approved in May 2018.
Silex Argentina holds two water permits, one for extraction from a water well, the second for extraction from the Quevar Sur Stream for mining purposes.
Permitting of a mining operation would require a number of steps.
1.16.5 Social Considerations
Silex Argentina conducted detailed community relations discussions on behalf of the company in the period August 2010–February 2013. These community consultations built on activities undertaken by Silex Argentina from August 2006 to August 2009. Key
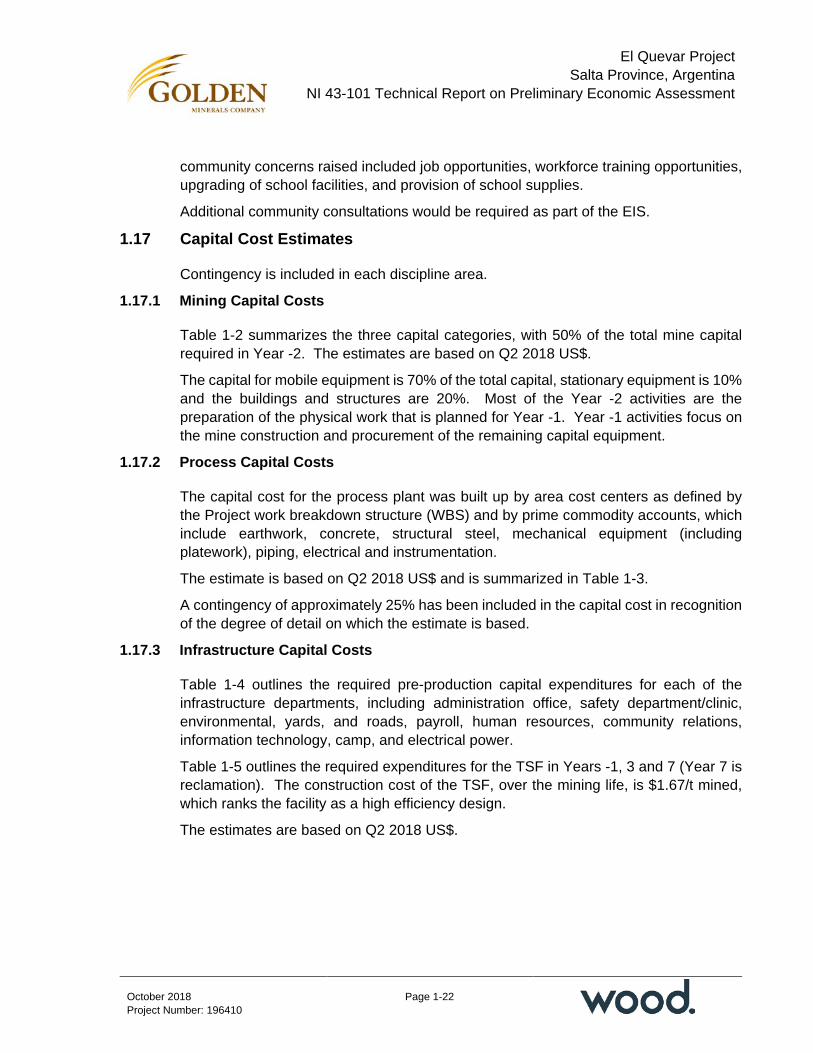
El Quevar Project Salta Province, Argentina
NI 43-101 Technical Report on Preliminary Economic Assessment
Page 1-22
October 2018 Project Number: 196410
community concerns raised included job opportunities, workforce training opportunities, upgrading of school facilities, and provision of school supplies.
Additional community consultations would be required as part of the EIS.
1.17 Capital Cost Estimates
Contingency is included in each discipline area.
1.17.1 Mining Capital Costs
Table 1-2 summarizes the three capital categories, with 50% of the total mine capital required in Year -2. The estimates are based on Q2 2018 US$.
The capital for mobile equipment is 70% of the total capital, stationary equipment is 10% and the buildings and structures are 20%. Most of the Year -2 activities are the preparation of the physical work that is planned for Year -1. Year -1 activities focus on the mine construction and procurement of the remaining capital equipment.
1.17.2 Process Capital Costs
The capital cost for the process plant was built up by area cost centers as defined by the Project work breakdown structure (WBS) and by prime commodity accounts, which include earthwork, concrete, structural steel, mechanical equipment (including platework), piping, electrical and instrumentation.
The estimate is based on Q2 2018 US$ and is summarized in Table 1-3.
A contingency of approximately 25% has been included in the capital cost in recognition of the degree of detail on which the estimate is based.
1.17.3 Infrastructure Capital Costs
Table 1-4 outlines the required pre-production capital expenditures for each of the infrastructure departments, including administration office, safety department/clinic, environmental, yards, and roads, payroll, human resources, community relations, information technology, camp, and electrical power.
Table 1-5 outlines the required expenditures for the TSF in Years -1, 3 and 7 (Year 7 is reclamation). The construction cost of the TSF, over the mining life, is $1.67/t mined, which ranks the facility as a high efficiency design.
The estimates are based on Q2 2018 US$.

El Quevar Project Salta Province, Argentina
NI 43-101 Technical Report on Preliminary Economic Assessment
Page 1-23
October 2018 Project Number: 196410
Table 1-2: Pre-Production Mine Capital Schedule Summary
Description Value (US$ 000)
Mining equipment 15,077
Stationary equipment 1,798
Buildings and structures 2,114
Pre-production development 7,677
Critical spares and first fills 1,476
Total after direct costs 28,141
Contingency (mine) 2,848
Total all mine capital costs 30,989 Note: Totals may not sum due to rounding
Table 1-3: Pre-production Process Capital Cost Summary
Description Value (US$ 000)
Crushing, handling of mineralized material 6,143
Grinding and classification 4,702
Flotation and concentration 6,601
Tailings (TSF and thickening) 3,167
Reagents storage, buildings 973
General and infrastructure 3,605
Critical spares and first fills 670
Freight 1,698
Construction costs 4,436
Total direct costs 31,994
EPCM cost 9,982
Total including contractor costs 41,976
Contingency (process plant) 11,329
Total process plant costs 53,306 Note: Totals may not sum due to rounding

El Quevar Project Salta Province, Argentina
NI 43-101 Technical Report on Preliminary Economic Assessment
Page 1-24
October 2018 Project Number: 196410
Table 1-4: Infrastructure Capital Costs
Description Value (US$ 000)
Power generation and overhead lines 4,783
Site development and roads 697
Buildings and structures 1,049
Camp expansion 1,297
Camp operation and transportation 1,695
Owner’s operating cost 1,239
Total direct costs 10,761
Contingency (infrastructure) 1,782
Total infrastructure costs 12,543 Note: Totals may not sum due to rounding
Table 1-5: TSF Capital and Reclamation Costs
Units Year -1 (US$)
Year 3 (US$)
Year 7 (US$)
Phase I Dam area preparation US$ 000 38
Dig key way US$ 000 72
Entire pond site prep US$ 000 183
Clay or liner installation US$ 000 236
Install drain system, chinos US$ 000 345
Reclaim pump, pipe, valve system US$ 000 25
Construct Phase I dam US$ 000 848
Plant to tailing dam pipe, cyclones, etc. US$ 000 424
Phase II Contractor costs US$ 000 100
Clay or liner installation US$ 000 136
Build Phase II dam US$ 000 1,587
Reclamation
Clay cap placement US$ 000 648
Topsoil placement US$ 000 183
Totals US$ 000 2,171 1,823 832 Note: Totals may not sum due to rounding
1.17.4 Sustaining Capital Costs
Sustaining capital provisions are summarized in Table 1-6.

El Quevar Project Salta Province, Argentina
NI 43-101 Technical Report on Preliminary Economic Assessment
Page 1-25
October 2018 Project Number: 196410
Table 1-6: Sustaining Capital Costs
Area Units LOM Year 1 Year 2 Year 3 Year 4 Year 5 Year 6 Year 7
Mining equipment US$ 000 2,600 — 1,300 — 1,300 — — —
Ancillary equipment US$ 000 5,043 481 2,305 — 2,257 — — —
Tailings storage facility US$ 000 1,823 — — 1,823 — — — —
Infrastructure US$ 000 108 108 — — — — — —
Mine reclamation & closure US$ 000 3,733 — — — — — — 3,733
Total US$ 000 13,307 588 3,605 1,823 3,557 — — 3,733 Note: Totals may not sum due to rounding
1.17.5 Summary Capital Costs
The overall pre-production capital cost estimate is summarized in Table 1-7.
1.18 Operating Cost Estimates
1.18.1 Mining Operating Costs
The mine operating cost contains five major components: labor, operating costs, supplies and materials, fuel and lubricants, and power. Table 1-8 outlines the operating cost, by major category, for static operation (Year 2 to Year 6).
The annual operating cost of the main ventilation system throughout the mine life is projected to be $72,000 (not including power), with the exception of Year -1, which has an annual projected cost of $7,000. The operating cost considers the fan and motor, electrical hardware and the upkeep of the associated facilities.
1.18.2 Process Operating Costs
The operating costs for the El Quevar process plant were estimated in Q2 2018 US$ by first principles for the following cost areas:
• Labor (salaried, operating, maintenance and laboratory)
• Consumables
• Wear materials
• Power
• Maintenance parts/supplies
• Operating supplies
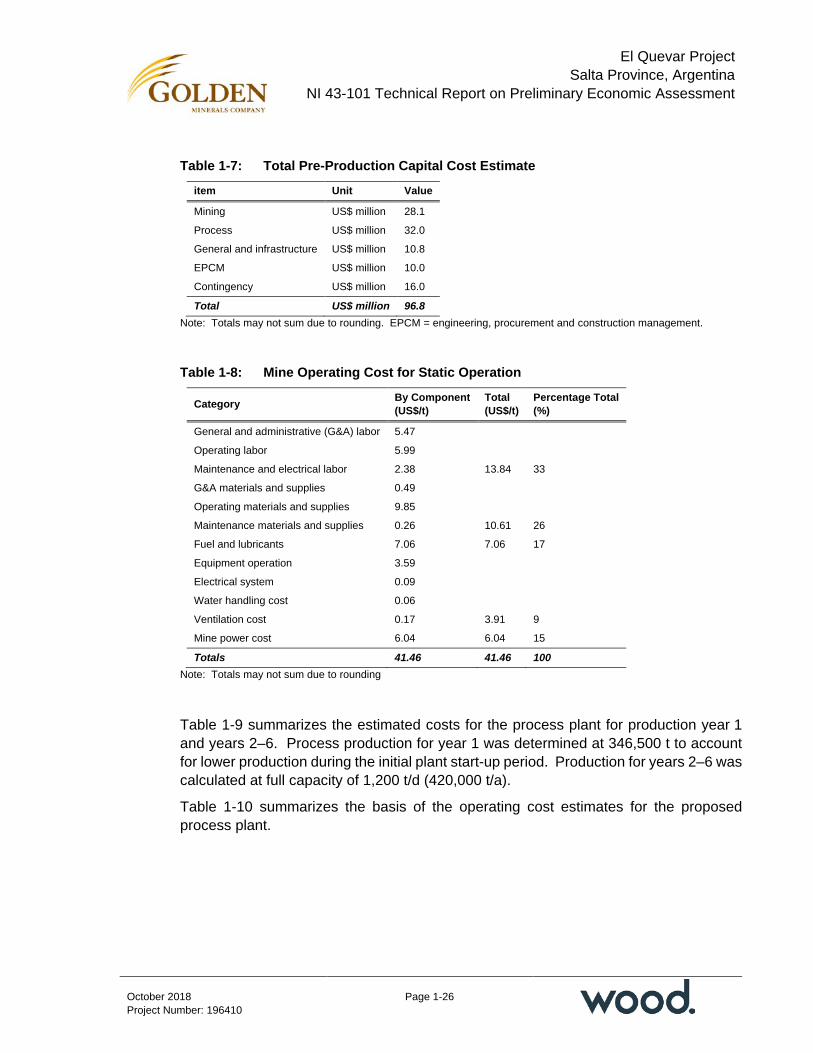
El Quevar Project Salta Province, Argentina
NI 43-101 Technical Report on Preliminary Economic Assessment
Page 1-26
October 2018 Project Number: 196410
Table 1-7: Total Pre-Production Capital Cost Estimate
item Unit Value
Mining US$ million 28.1
Process US$ million 32.0
General and infrastructure US$ million 10.8
EPCM US$ million 10.0
Contingency US$ million 16.0
Total US$ million 96.8 Note: Totals may not sum due to rounding. EPCM = engineering, procurement and construction management.
Table 1-8: Mine Operating Cost for Static Operation
Category By Component (US$/t)
Total (US$/t)
Percentage Total (%)
General and administrative (G&A) labor 5.47
Operating labor 5.99
Maintenance and electrical labor 2.38 13.84 33
G&A materials and supplies 0.49
Operating materials and supplies 9.85
Maintenance materials and supplies 0.26 10.61 26
Fuel and lubricants 7.06 7.06 17
Equipment operation 3.59
Electrical system 0.09
Water handling cost 0.06
Ventilation cost 0.17 3.91 9
Mine power cost 6.04 6.04 15
Totals 41.46 41.46 100 Note: Totals may not sum due to rounding
Table 1-9 summarizes the estimated costs for the process plant for production year 1 and years 2–6. Process production for year 1 was determined at 346,500 t to account for lower production during the initial plant start-up period. Production for years 2–6 was calculated at full capacity of 1,200 t/d (420,000 t/a).
Table 1-10 summarizes the basis of the operating cost estimates for the proposed process plant.

El Quevar Project Salta Province, Argentina
NI 43-101 Technical Report on Preliminary Economic Assessment
Page 1-27
October 2018 Project Number: 196410
Table 1-9: Summary Table for Estimated Process Plant Operating Costs
Operating Cost Description Fixed or Variable
Annual Cost (US$ 000)
Cost (US$/t)
Year 1 Years 2–6 Year 1 Years 2–6
Salaried labor Fixed 407 407 1.17 0.97
Operations labor Fixed 1,142 1,142 3.30 2.72
Maintenance labor Fixed 690 690 1.99 1.64
Laboratory labor Fixed 209 209 0.60 0.50
Consumables Variable 111 135 0.32 0.32
Wear materials Variable 463 561 1.34 1.34
Power Variable 1,322 1,603 3.82 3.82
Maintenance supplies Fixed 750 750 2.16 1.79
Operating supplies Fixed 113 113 0.32 0.27
Totals 5,206 5,608 15.02 13.35 Note: totals may not sum due to rounding.
Table 1-10: Basis of Operating Cost Estimates, Process Plant
Operating Cost Area Basis of Estimate
Labor Manpower schedule; labor costs (including burden) by job classification provided by Golden Minerals
Consumables Reagents based on DML test results; delivered unit costs to site; allowances for laboratory supplies, fuels and lubricants
Wear materials Liners and grinding balls based on JKTech/Hazen test results; delivered unit costs to site
Power Calculated from installed plant horsepower at unit power cost of US$0.20085/kWhr provided by Golden Minerals
Maintenance parts/supplies Annual cost calculated as 5% of equipment costs
Operating supplies Annual cost calculated as 15% of maintenance costs
1.18.3 Infrastructure Operating Costs
Infrastructure operating costs include provision for environment, roads, and roads, the accommodations camp, and power. These costs are summarized in Table 1-11.
1.18.4 General and Administrative Operating Costs
General and administrative (G&A) costs include allocations for administration, safety and health clinic, purchasing and warehouse, human resources (HR), information technology (IT), and providing for sustaining capital requirements. These costs are summarized in Table 1-12.
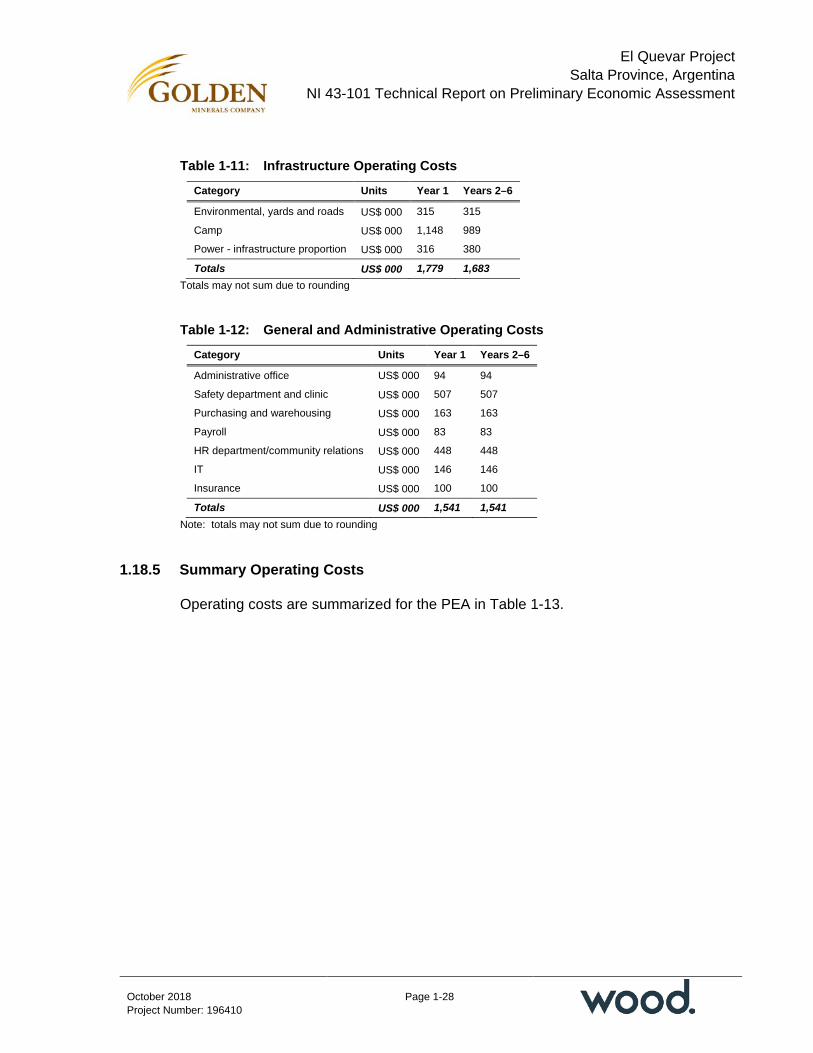
El Quevar Project Salta Province, Argentina
NI 43-101 Technical Report on Preliminary Economic Assessment
Page 1-28
October 2018 Project Number: 196410
Table 1-11: Infrastructure Operating Costs
Category Units Year 1 Years 2–6
Environmental, yards and roads US$ 000 315 315
Camp US$ 000 1,148 989
Power - infrastructure proportion US$ 000 316 380
Totals US$ 000 1,779 1,683 Totals may not sum due to rounding
Table 1-12: General and Administrative Operating Costs
Category Units Year 1 Years 2–6
Administrative office US$ 000 94 94
Safety department and clinic US$ 000 507 507
Purchasing and warehousing US$ 000 163 163
Payroll US$ 000 83 83
HR department/community relations US$ 000 448 448
IT US$ 000 146 146
Insurance US$ 000 100 100
Totals US$ 000 1,541 1,541 Note: totals may not sum due to rounding
1.18.5 Summary Operating Costs
Operating costs are summarized for the PEA in Table 1-13.
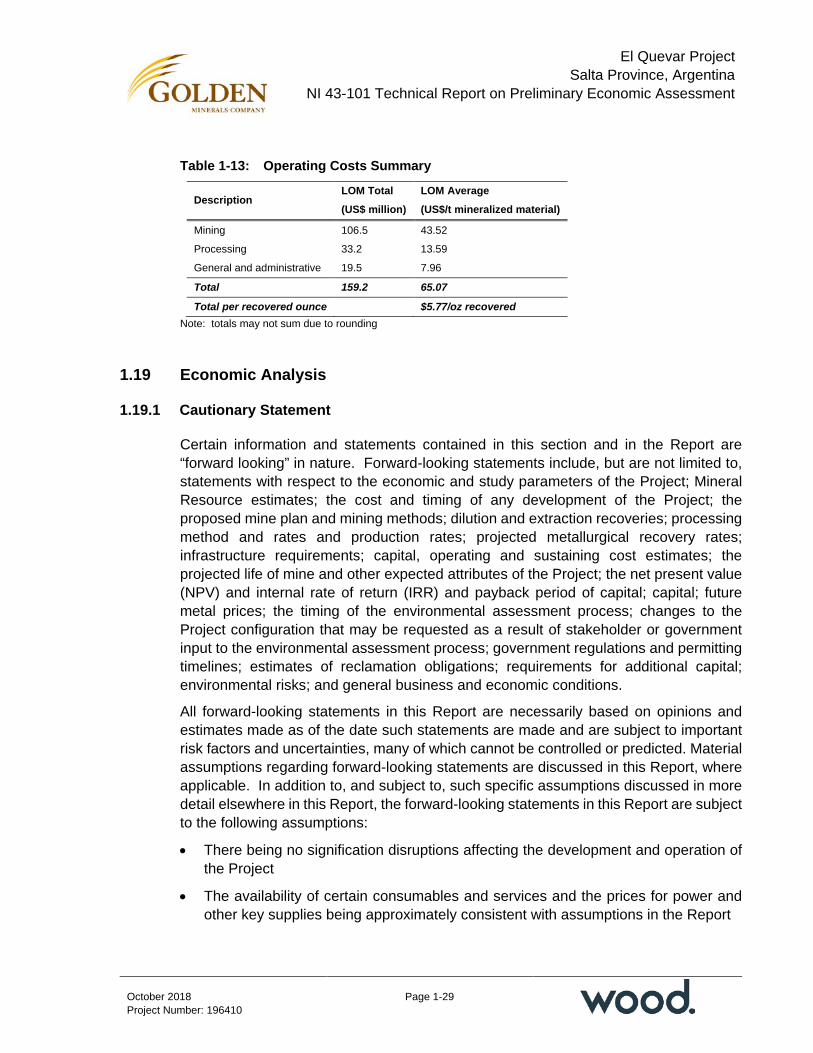
El Quevar Project Salta Province, Argentina
NI 43-101 Technical Report on Preliminary Economic Assessment
Page 1-29
October 2018 Project Number: 196410
Table 1-13: Operating Costs Summary
Description LOM Total LOM Average (US$ million) (US$/t mineralized material)
Mining 106.5 43.52
Processing 33.2 13.59
General and administrative 19.5 7.96
Total 159.2 65.07
Total per recovered ounce $5.77/oz recovered Note: totals may not sum due to rounding
1.19 Economic Analysis
1.19.1 Cautionary Statement
Certain information and statements contained in this section and in the Report are “forward looking” in nature. Forward-looking statements include, but are not limited to, statements with respect to the economic and study parameters of the Project; Mineral Resource estimates; the cost and timing of any development of the Project; the proposed mine plan and mining methods; dilution and extraction recoveries; processing method and rates and production rates; projected metallurgical recovery rates; infrastructure requirements; capital, operating and sustaining cost estimates; the projected life of mine and other expected attributes of the Project; the net present value (NPV) and internal rate of return (IRR) and payback period of capital; capital; future metal prices; the timing of the environmental assessment process; changes to the Project configuration that may be requested as a result of stakeholder or government input to the environmental assessment process; government regulations and permitting timelines; estimates of reclamation obligations; requirements for additional capital; environmental risks; and general business and economic conditions.
All forward-looking statements in this Report are necessarily based on opinions and estimates made as of the date such statements are made and are subject to important risk factors and uncertainties, many of which cannot be controlled or predicted. Material assumptions regarding forward-looking statements are discussed in this Report, where applicable. In addition to, and subject to, such specific assumptions discussed in more detail elsewhere in this Report, the forward-looking statements in this Report are subject to the following assumptions:
• There being no signification disruptions affecting the development and operation of the Project
• The availability of certain consumables and services and the prices for power and other key supplies being approximately consistent with assumptions in the Report

El Quevar Project Salta Province, Argentina
NI 43-101 Technical Report on Preliminary Economic Assessment
Page 1-30
October 2018 Project Number: 196410
• Labor and materials costs being approximately consistent with assumptions in the Report
• Permitting and arrangements with stakeholders being consistent with current expectations as outlined in the Report
• All environmental approvals, required permits, licenses and authorizations will be obtained from the relevant governments and other relevant stakeholders
• Certain tax rates, including the allocation of certain tax attributes, being applicable to the Project
• The availability of financing for Golden Mineral’s planned development activities
• The timelines for exploration and development activities on the Project
• Assumptions made in Mineral Resource estimate and the financial analysis based on that estimate, including, but not limited to, geological interpretation, grades, commodity price assumptions, extraction and mining recovery rates, hydrological and hydrogeological assumptions, capital and operating cost estimates, and general marketing, political, business and economic conditions.
The production schedules and financial analysis annualized cash flow table are presented with conceptual years shown. Years shown in these tables are for illustrative purposes only. If additional mining, technical, and engineering studies are conducted, these may alter the Project assumptions as discussed in this Report and may result in changes to the calendar timelines presented.
The economic analysis is partly based on Inferred Mineral Resources that are considered too speculative geologically to have the economic considerations applied to them that would enable them to be categorized as Mineral Reserves, and there is no certainty that the PEA based on these Mineral Resources will be realized.
1.19.2 Methodology Used
Samuel Engineering has prepared a discounted cash flow analysis of the El Quevar Project. Technical and cost inputs for the economic model were developed by Samuel Engineering with specific inputs provided by Golden Minerals. These inputs have been reviewed in detail by Samuel Engineering and are accepted as reasonable.
The discounted cash flow analysis was performed on a stand-alone project basis with annual cash flows discounted on an end-of-year basis. The economic evaluation used a real discount rate of 5% and was performed at commencement of construction (denoted as Year -2 of the El Quevar Project) using Q2 2018, US dollars.
All costs prior to the start of construction are considered as “sunk costs” and are not considered in the economic analysis.

El Quevar Project Salta Province, Argentina
NI 43-101 Technical Report on Preliminary Economic Assessment
Page 1-31
October 2018 Project Number: 196410
This economic analysis is a direct result of the capital cost estimate and is therefore considered to have the same level of accuracy (±25%).
1.19.3 Outcomes
A summary of the PEA results includes:
• After-tax net present value (NPV): US$45 million at a 5% discount rate
• After-tax internal rate of return (IRR): 17.0%
• After-tax payback period: 3.4 years
• Total pre-production capital cost: $97 million, including $16 million contingency
• Pre-production development time: two years
• Life of mine (LOM): six years, based on the subset of the Mineral Resource estimate in the PEA mine plan
• LOM free cash flow $80 million
• LOM payable silver production 29 Moz
• LOM average silver grade 409 g/t Ag
• Post start-up cash cost $9.10/oz payable silver
• Post start-up all-in sustaining costs (AISC) $9.45/oz payable silver.
The El Quevar Project’s after-tax economic results are summarized in Table 1-14.
1.20 Sensitivity Analysis
Figure 1-1 to Figure 1-5 present sensitivities to capital and operating costs, metal price, metallurgical recovery, and silver grade.
The Project is most sensitive to changes in silver price, less sensitive to changes in capital costs, operating costs and silver grade, and least sensitive to changes in metallurgical recovery.
Figure 1-6 indicates the sensitivity to changes in the exchange rate. As the exchange rate varies, the change in local costs can affect the Project economics, and the impact of such short-terms variations can be seen in this sensitivity analysis.
1.21 Interpretations and Conclusions
Under the assumptions set out in this Report, the Project has a positive economic outcome.

El Quevar Project Salta Province, Argentina
NI 43-101 Technical Report on Preliminary Economic Assessment
Page 1-32
October 2018 Project Number: 196410
Table 1-14: Summary, Financial Analysis (after-tax; base case is highlighted)
Financial Results Units Value
Cumulative cash flow (LOM) US$ million 80
Net present value (5%) US$ million 45
Net present value (8%) US$ million 30
Net present value (10%) US$ million 21
Internal rate of return (IRR) % 17.0
Payback years 3.4
Total capital costs US$ million 97
Figure 1-1: Capital Cost Sensitivity
Note: Figure prepared by Samuel Engineering, 2018.

El Quevar Project Salta Province, Argentina
NI 43-101 Technical Report on Preliminary Economic Assessment
Page 1-33
October 2018 Project Number: 196410
Figure 1-2: Silver Price Sensitivity
Note: Figure prepared by Samuel Engineering, 2018.
Figure 1-3: Operating Cost Sensitivity
Note: Figure prepared by Samuel Engineering, 2018.
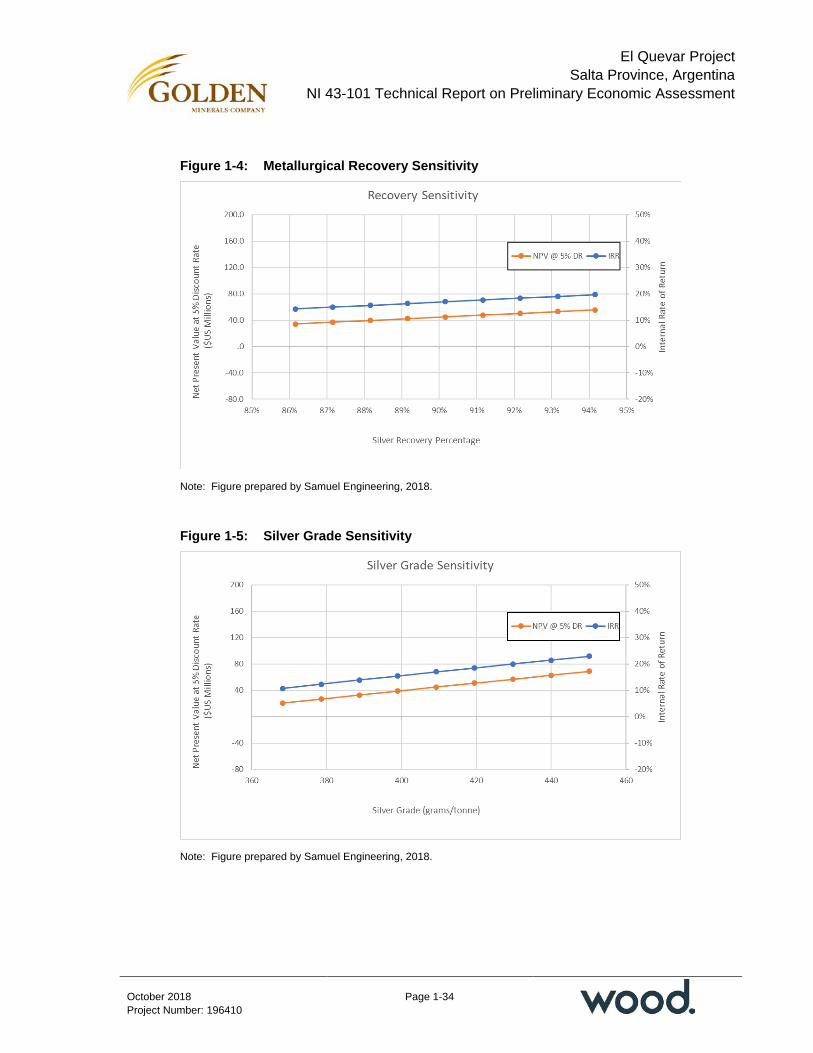
El Quevar Project Salta Province, Argentina
NI 43-101 Technical Report on Preliminary Economic Assessment
Page 1-34
October 2018 Project Number: 196410
Figure 1-4: Metallurgical Recovery Sensitivity
Note: Figure prepared by Samuel Engineering, 2018.
Figure 1-5: Silver Grade Sensitivity
Note: Figure prepared by Samuel Engineering, 2018.
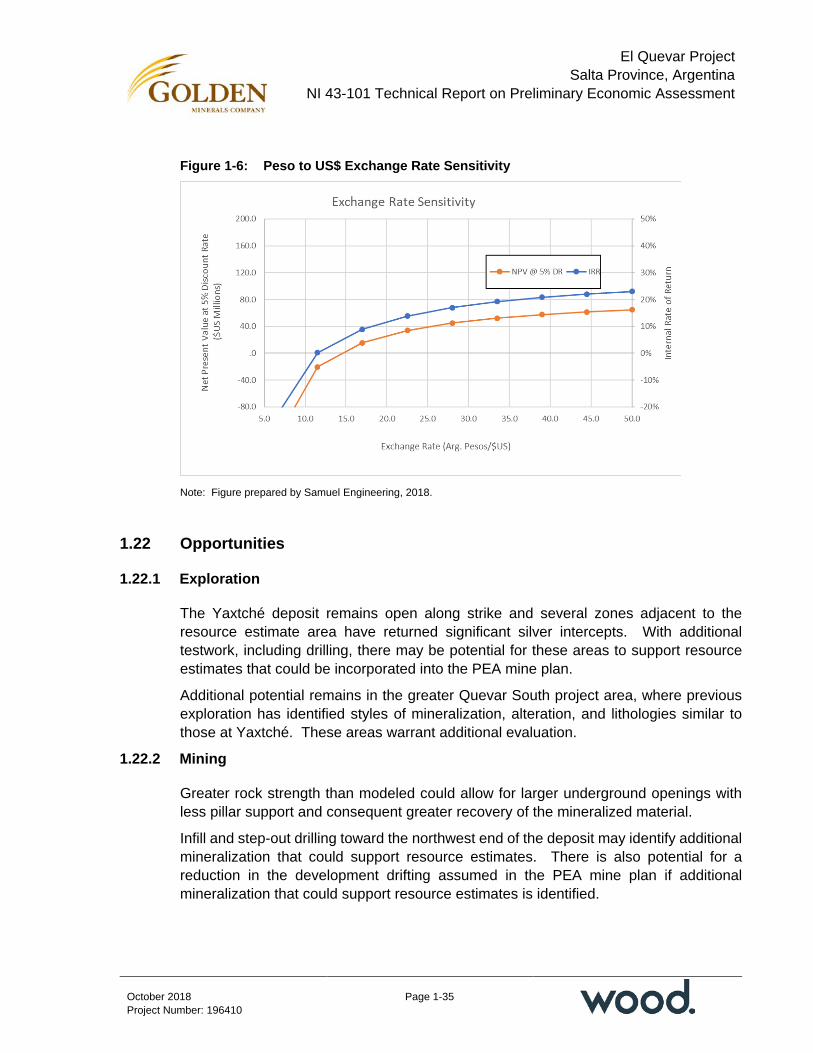
El Quevar Project Salta Province, Argentina
NI 43-101 Technical Report on Preliminary Economic Assessment
Page 1-35
October 2018 Project Number: 196410
Figure 1-6: Peso to US$ Exchange Rate Sensitivity
Note: Figure prepared by Samuel Engineering, 2018.
1.22 Opportunities
1.22.1 Exploration
The Yaxtché deposit remains open along strike and several zones adjacent to the resource estimate area have returned significant silver intercepts. With additional testwork, including drilling, there may be potential for these areas to support resource estimates that could be incorporated into the PEA mine plan.
Additional potential remains in the greater Quevar South project area, where previous exploration has identified styles of mineralization, alteration, and lithologies similar to those at Yaxtché. These areas warrant additional evaluation.
1.22.2 Mining
Greater rock strength than modeled could allow for larger underground openings with less pillar support and consequent greater recovery of the mineralized material.
Infill and step-out drilling toward the northwest end of the deposit may identify additional mineralization that could support resource estimates. There is also potential for a reduction in the development drifting assumed in the PEA mine plan if additional mineralization that could support resource estimates is identified.
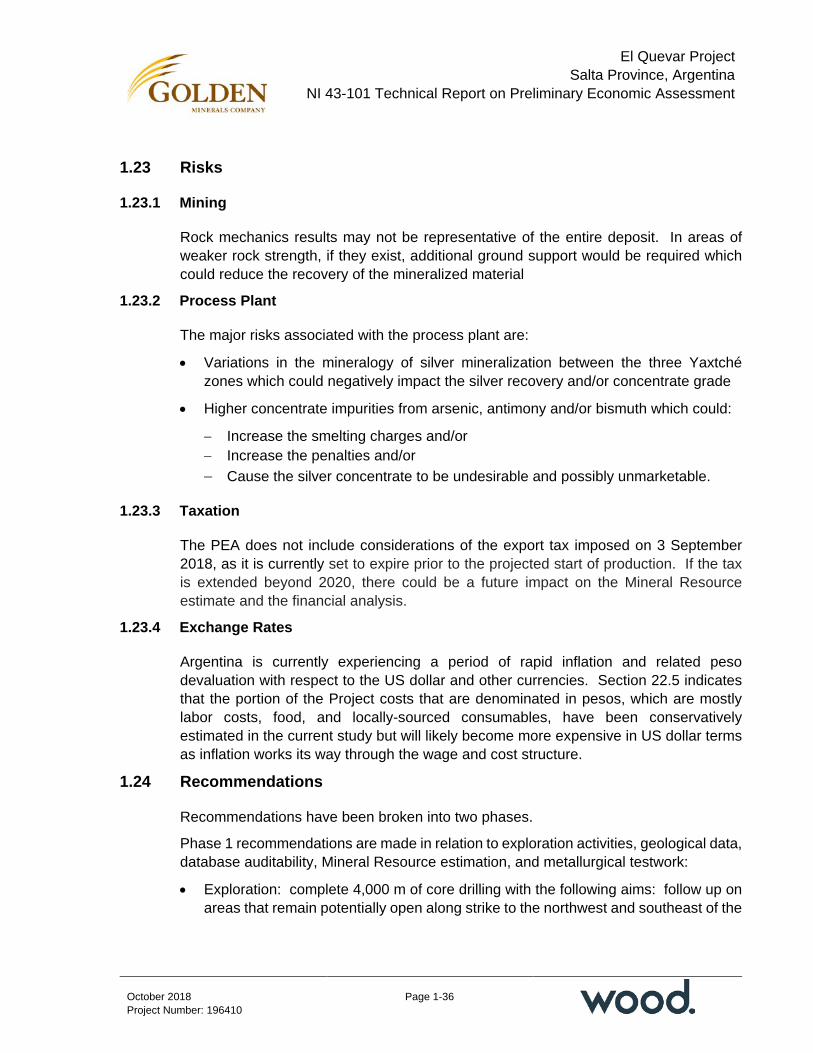
El Quevar Project Salta Province, Argentina
NI 43-101 Technical Report on Preliminary Economic Assessment
Page 1-36
October 2018 Project Number: 196410
1.23 Risks
1.23.1 Mining
Rock mechanics results may not be representative of the entire deposit. In areas of weaker rock strength, if they exist, additional ground support would be required which could reduce the recovery of the mineralized material
1.23.2 Process Plant
The major risks associated with the process plant are:
• Variations in the mineralogy of silver mineralization between the three Yaxtché zones which could negatively impact the silver recovery and/or concentrate grade
• Higher concentrate impurities from arsenic, antimony and/or bismuth which could:
− Increase the smelting charges and/or − Increase the penalties and/or − Cause the silver concentrate to be undesirable and possibly unmarketable.
1.23.3 Taxation
The PEA does not include considerations of the export tax imposed on 3 September 2018, as it is currently set to expire prior to the projected start of production. If the tax is extended beyond 2020, there could be a future impact on the Mineral Resource estimate and the financial analysis.
1.23.4 Exchange Rates
Argentina is currently experiencing a period of rapid inflation and related peso devaluation with respect to the US dollar and other currencies. Section 22.5 indicates that the portion of the Project costs that are denominated in pesos, which are mostly labor costs, food, and locally-sourced consumables, have been conservatively estimated in the current study but will likely become more expensive in US dollar terms as inflation works its way through the wage and cost structure.
1.24 Recommendations
Recommendations have been broken into two phases.
Phase 1 recommendations are made in relation to exploration activities, geological data, database auditability, Mineral Resource estimation, and metallurgical testwork:
• Exploration: complete 4,000 m of core drilling with the following aims: follow up on areas that remain potentially open along strike to the northwest and southeast of the

El Quevar Project Salta Province, Argentina
NI 43-101 Technical Report on Preliminary Economic Assessment
Page 1-37
October 2018 Project Number: 196410
Yaxtché resource estimate area; follow up on numerous previous intercepts that show elevated silver grades, particularly where those intercepts are currently not included in the Mineral Resource estimate; drill test several geophysical targets with characteristics similar to those of the Yaxtché deposit; and generate fresh drill core for future metallurgical tests
• Geology: complete a structural study to confirm the deposit structural setting, and preferred vein orientations; reassay drill intercepts where penalty element assay values were above the tolerances for the analytical method used
• Database: develop auditability trails documenting magnetic declination, logging code changes, and total station survey records
• Mineral Resources: improve understanding of the oxide–sulfide boundary; construct additional PACK models to assess sensitivities of the mineralization to changes in commodity prices and changes in cut-off grades; structural data used to define the dynamic anisotropy should be refined
• Metallurgy: better define local metallurgical variability between various zones within the Yaxtché deposit; develop geometallurgical domains; complete economic trade-off studies examining various production options
Recommendations proposed in Phase 2 are suggestions for additional data collection and data support for future mining studies. A portion of the recommended work is dependent on the results of the first phase program. Recommendations include:
• Once the metallurgical testwork data are available from the Phase 1 work programs recommended, the resulting metallurgical domains should be added to the resource model
• A trial mining program should be undertaken to extend the decline to the core deposit area to provide additional geotechnical information.
• A review should be undertaken of the estimated grade of deleterious elements in the resource model to determine if a mine scheduling/blending program can be devised to minimize the arsenic, bismuth and/or antimony in the mill feed and thereby diminish the total penalties for those elements currently assumed to apply to payable amounts from concentrate sales
Phase 1 is estimated at about US$1.22 million to US$1.32 million. Phase 2 is budgeted at approximately US$510,000 to US$765,000.
El Quevar Project Salta Province, Argentina
NI 43-101 Technical Report on Preliminary Economic Assessment
Page 2-1
October 2018 Project Number: 196410
2.0 INTRODUCTION
2.1 Introduction
Amec Foster Wheeler E&C Services, Inc., a Wood company (Wood), John E. Thompson LLC, and Samuel Engineering Inc. (Samuel Engineering) have prepared a technical report (the Report) for Golden Minerals Company (Golden Minerals) on the results of a preliminary economic assessment (PEA) for El Quevar Project (the Project) located in the Salta Province of Argentina (Figure 2-1).
2.2 Terms of Reference
The Report was prepared to support disclosure of the results of the PEA in Golden Mineral’s news release of 5 September 2018, entitled “Golden Minerals Reports Positive Preliminary Economic Assessment For El Quevar”.
Mineral Resources and Mineral Reserves are reported in accordance with the Canadian Institute of Mining, Metallurgy and Petroleum (CIM) Definition Standards for Mineral Resources and Mineral Reserves (May 2014; the 2014 CIM Definition Standards) and the CIM Estimation of Mineral Resources and Mineral Reserves Best Practice Guidelines (November 2003; 2003 CIM Best Practice Guidelines).
Measurement units used in this Report are metric units and currency is expressed in US dollars (US$), unless stated otherwise. The Argentinean currency is the Argentine peso (AR$). The Report uses Canadian English.
2.3 Qualified Persons
The following persons serve as Qualified Persons (QPs) as defined in NI 43-101:
• Mr Gordon Seibel, RM SME, Principal Geologist, Wood
• Mr John E. Thompson, QP MMSA, John E. Thompson LLC
• Mr Al Kuestermeyer, RM SME, Samuel Engineering
• Mr Steven Pozder, P.E., Samuel Engineering.

El Quevar Project Salta Province, Argentina
NI 43-101 Technical Report on Preliminary Economic Assessment
Page 2-2
October 2018 Project Number: 196410
Figure 2-1: Project Location Plan
Note: Figure courtesy Golden Minerals, 2018.
El Quevar Project Salta Province, Argentina
NI 43-101 Technical Report on Preliminary Economic Assessment
Page 2-1
October 2018 Project Number: 196410
2.4 Site Visits and Scope of Personal Inspection
Mr. Gordon Seibel visited the El Quevar Project from 20 to 23 March 2018. The site visits included presentations by Golden Minerals’ staff, inspection of core and surface outcrops, viewing historic drill platforms, sample cutting and logging facilities, and discussions of geology and mineralization interpretations with Golden Minerals’ staff. During his visit, Mr. Seibel checked drill hole locations, inspected drill core, and collected witness samples from the Yaxtché deposit.
2.5 Effective Dates
The Report has the following effective dates:
• Date of the latest drill hole in the database: 5 March 2012
• Date of the last drilling on the Project: 13 December 2012
• Date of database close-out for Mineral Resource estimation: 13 February 2018
• Date of Mineral Resource estimate: 26 February 2018
• Date of supply of latest information on mineral tenure: 3 August 2018
• Date of PEA financial analysis: 4 September 2018.
The overall effective date of the Report is the date of the PEA economic analysis and is 4 September 2018.
2.6 Information Sources and References
The key information sources for the Report include the reports and documents listed in Section 3.0 (Reliance on Other Experts) and Section 27.0 (References) of this Report and were used to support the preparation of the Report.
Mineral Resources Engineering performed the mine plan, evaluated infrastructure requirements, and estimated capital and operating costs for the mining, infrastructure and general and administrative (G&A) areas under the supervision of Mr J.E. Thompson, QP MMSA. Mr Thompson is the Qualified Person for the work performed by Mineral Resources Engineering.
Additional information was sought from Golden Minerals, Wood, Mineral Resources Engineering, and Samuel Engineering personnel where required.

El Quevar Project Salta Province, Argentina
NI 43-101 Technical Report on Preliminary Economic Assessment
Page 2-2
October 2018 Project Number: 196410
2.7 Previous Technical Reports
A number of technical reports have been prepared on the Project for Golden Minerals, including:
• Seibel, G., Colquhoun, W., and Rehn, W, 2018: El Quevar Project, Salta Province, Argentina, NI 43-101 Technical Report on Updated Mineral Resource Estimate: technical report prepared by Amec Foster Wheeler for Golden Minerals Company, effective date 26 February 2018
• Gates, P.A. and Horlacher, C.F., 2012: NI 43-101 Technical Report for Resources Yaxtché Silver Deposit, El Quevar Property, Salta Province, Argentina: technical report prepared by Pincock, Allen and Holt for Golden Minerals Company, effective date 8 June 2012
• Lewis, W.J., and San Martin, A.J., 2010: NI 43-101 Technical Report and Updated Mineral Resource Estimate for the Yaxtché Silver Deposit El Quevar Project Salta Province, Argentina: report prepared by Micon International for Golden Minerals Company, effective date 10 August 2010
• Barnard, F., and Sandefur, R.L., 2010: NI 43-101 Technical Report Mineral Resource Estimate Update Yaxtché Silver Deposit El Quevar Project Salta Province, Argentina: report prepared by Chlumsky, Armbrust & Meyer, LLC for Golden Minerals Company, effective date 14 January 2010
• Barnard, F., and Sandefur, R.L., 2009a: NI 43-101 Technical Report Mineral Resource Estimate Yaxtché Silver Deposit El Quevar Project Salta Province, Argentina: report prepared by Chlumsky, Armbrust & Meyer, LLC for Golden Minerals Company, effective date 12 October 2009
• Barnard, F., and Sandefur, R.L., 2009b: Mineral Resource Estimate Yaxtché Central Zone Silver Deposit El Quevar Project Salta Province, Argentina: report prepared by Chlumsky, Armbrust & Meyer, LLC for Golden Minerals Company, effective date 15 August 2009.
A technical report was prepared for Apex Silver Mines (Apex Silver) as follows:
• Mach, L., Hollenbeck, P., Bair, D., Kuestermeyer, A., 2009: NI 43-101 Technical Report on Resources Apex Silver Mines Corporation El Quevar Project Argentina: report prepared by SRK Consulting for Apex Silver, effective date January 31, 2009.

El Quevar Project Salta Province, Argentina
NI 43-101 Technical Report on Preliminary Economic Assessment
Page 3-1
October 2018 Project Number: 196410
3.0 RELIANCE ON OTHER EXPERTS
3.1 Introduction
The QPs have relied upon the following other expert reports, which provided information regarding mineral rights, surface rights, royalties, environmental, permitting, social and community impacts, and taxation as follows.
3.2 Mineral Tenure, Surface Rights, and Royalties
The QPs have not independently reviewed ownership of the Project area and any underlying mineral tenure, surface rights, or royalties. The QPs have fully relied upon, and disclaim responsibility for, information derived from Golden Minerals and legal experts retained by Golden Minerals for this information through the following documents:
• Castañeda Nordmann, R.M., 2018: Due Diligence Report, Golden Minerals Company, Mining Properties, Salta Province, El Quevar Project, Argentina: report prepared by Castañeda Nordmann Abogados for Golden Minerals Company, 3 August 2018.
This information is used in Section 4 of the Report. The information is also used in support of the Mineral Resource estimate in Section 14 and the financial analysis in Section 22.
3.3 Environmental, Permitting, and Social and Community Impacts
The QPs have relied upon, and disclaim responsibility for the information on environmental, permitting and social and community impacts, which was sourced from the following documents:
• Silex Argentina S.A., 2018a: Permisos Ambientales, Áreas Protegidas y Relaciones Comunitarias: document prepared for Golden Minerals, 12 August 2018, 29 p.
• Silex Argentina S.A., 2018b: Environmental Permits, Protected Areas and Community Relations: document prepared for Golden Minerals, 19 August 2018, 29 p.
This information is used in Section 20 of the Report. The information is also used in support of the Mineral Resource estimate in Section 14 and the financial analysis in Section 22.

El Quevar Project Salta Province, Argentina
NI 43-101 Technical Report on Preliminary Economic Assessment
Page 3-2
October 2018 Project Number: 196410
3.4 Taxation
The QPs have relied upon, and disclaim responsibility for, experts retained by Golden Minerals for the taxation information as applied in the financial model, which was sourced from the following document:
• Espeche, B.L., 2018: Argentina Taxation for 2018 El Quevar PEA: document prepared for Golden Minerals, 17 July 2018, 8 p.
This information is used in Section 22 of the Report.
El Quevar Project Salta Province, Argentina
NI 43-101 Technical Report on Preliminary Economic Assessment
Page 4-1
October 2018 Project Number: 196410
4.0 PROPERTY DESCRIPTION AND LOCATION
4.1 Introduction
The El Quevar Project is located in northwestern Argentina, approximately 300 km northwest of the provincial capital of Salta, within the San Antonio de los Cobres municipality, Salta Province.
The Project is located close to geographic coordinates 24.3° south latitude and 66.8° west longitude. The 1994 Argentinian Zone 3 GCS POSGAR coordinates for the Yaxtché zone are approximately 3,418,000 E and 7,307,000 N.
4.2 Property and Title in Argentina
Information in this subsection is based on data in the public domain (Baker Mackenzie, 2013, 2018; Parravicini, 2014; Fraser Institute, 2018; and Heredia et al., 2017), and has not been independently verified by Wood.
4.2.1 Mineral Tenure
According to the Argentine Political State Organization, the mines belong to the Provinces, which grant exploration and exploitation concession rights to the applicants. However, the Federal Government is entitled to enact the Argentine Mining Code (AMC) which is applicable to the whole country, while the Provinces have the power to regulate the procedural aspects of the National Mining Code through each Provincial Mining Procedure Code (PC) and to organize its local authorities.
In the Province of Salta, the mining rights are granted by a Mining Judge who is the Mining Authority in charge of the procedure.
According to the AMC there are two types of mining rights, exploration and exploitation concessions. Currently, the El Quevar Project consists only of exploitation concessions.
Exploitation Concessions
Exploitation concessions have no time limit provided the holder complies with the requirements of law. Compliance requires an annual canon payment, compliance with a working and investment plan, and the submission of an environmental impact assessment that must be updated every two years. There are different ways of acquiring an exploitation permit:
• By discovering a mine as a consequence of an exploration process
• When a mine is discovered by “chance,” that is, without an exploration process
• When an exploitation right has been declared and posted in the register as “vacant” due to a non-compliance with the requirements settled by law.

El Quevar Project Salta Province, Argentina
NI 43-101 Technical Report on Preliminary Economic Assessment
Page 4-2
October 2018 Project Number: 196410
The measurement unit area for such permits, the tenement (pertenencia), will vary depending on the mineralization to be exploited. Permits over gold, silver, copper, and, generally, hard rock minerals deposits (e.g. vein-style and discrete deposits) are typically 6 ha in extent; however, disseminated mineralization-style deposits may see claim sizes reach a maximum of 100 ha. Exploitation permits can consist of one or more tenements.
The holder of an exploitation permit must meet a series of obligations to maintain the permit in full force and effect. Failure to comply with such obligations could result in revocation of the exploitation permit.
• Canon: must be paid twice a year (June 30 and December 31). Lack of payment results in revocation of the permit unless the title holder pays the canon plus a 20% fine within 45 days. According to the AMC, the amount to be paid annually is AR$3,200 per unit of disseminated tenement (100 ha) and $320 per unit of tenements of gold, copper or silver (typically 6 ha). A three-year period free of canon payment is allowed if a mine is discovered
• Legal labor and legal survey: a legal labor to establish the limits of the mine must be performed within 100 days of registration of the mining right. Within 30 days of compliance with the legal labor, a filing requesting a legal survey must be made. The Mining Authority then sets a date and names the professional who will carry out the survey. Once the latter is completed, the concession is registered with the mining cadaster and perfected
• Working and investment plan: a working and investment plan must be created to achieve a minimum expenditure equivalent to 300 times the annual canon paid within five years following the year in which the application of the legal survey is submitted. During each of the first two years, the amount of the investment shall not be less than 20%, while the remaining investment can be freely distributed throughout the remaining three years. An annual investment affidavit should be submitted to the Mining Authority. If the affidavit is not submitted or does not correspond to real investment, the license expires, and the mine is declared vacant, unless the holder amends the mistake or omission within the following 30 days counting from the receipt by the holder of the notification from the Mining Authority. When a mine remains without activity for four years, the Mining Authority may ask the titleholder for the presentation of a “Reactivation Plan.” The obligation should be fulfilled within six months, otherwise the mine is declared vacant. The owner should comply with each stage as described in the plan, which cannot exceed five years.
• Environmental impact assessment (EIA): must be filed prior to initiating the field works and must be updated every two years.

El Quevar Project Salta Province, Argentina
NI 43-101 Technical Report on Preliminary Economic Assessment
Page 4-3
October 2018 Project Number: 196410
4.2.2 Surface Rights
The AMC sets out rules under which surface rights and easements can be granted for a mining operation, and these cover aspects including land occupation, rights of way, access routes, transport routes, rail lines, water usage and any other infrastructure needed for operations.
In general, compensation has to be paid to an affected landowner in proportion to the amount of damage or inconvenience incurred; however, no provisions or regulations have been enacted as to the nature or amount of the compensation payment.
In instances where no agreement can be reached with the landowner, the AMC provides the mining right holder with the right to expropriate the required property.
4.2.3 Water Rights
Typically, Provincial water authorities:
• Issue water usage permits, including usage purpose, amount of water required, how the water is to be delivered to the end-user, and any infrastructure requirements
• Establish a priority system for the permits, based on the type of water consumption
• Govern the duration of issued permits
• Levy usage fees based on the amount of water consumed/used.
Water use rights may be acquired by permit, by concession, and, under laws enacted in some Provinces, through authorization. Revocable permits for water use can be granted for a specific purpose. A grant (concesión) is awarded for a time period that is based on the intended use.
4.2.4 Environmental Regulations
Minimum environmental standards are enacted federally, with Provincial governments able to enact supplementary legislation to these minimum standards. The AMC incorporates National Law No. 24.585, key features of which include:
• An environmental impact statement (EIS) must be filed with the relevant regulatory authority
• The AMC has adopted a sectorial approach, in that each mining stage, including prospecting, exploration, exploitation, development, extraction, storage and beneficiation phases, as well as mine closure, requires separate environmental impact reports (EIRs), each of which are reviewed separately prior to any approval

El Quevar Project Salta Province, Argentina
NI 43-101 Technical Report on Preliminary Economic Assessment
Page 4-4
October 2018 Project Number: 196410
• If the EIS meets the relevant requirements under National Law No. 24.585, an environmental impact declaration (EID) will be granted; this allows work to commence
• EIDs have a two-year duration or the duration of the activity for which the EID was approved, and a set of conditions and requirements that must be met to keep the EID current
Provinces may also have their own additional requirements relating to EIS preparation.
Provinces also regulate the generation of hazardous waste, water extraction for mining purposes, liquid effluent discharges, and soil protection.
4.2.5 Closure Considerations
Closure must be covered by submission of a new EIR. The document must include details of the proposed environmental rehabilitation, reclamation or adjustment activities, and discuss how post-closure environmental impacts will be avoided. The EIR must include data on post-closure monitoring, but current regulatory requirements do not entail submission of formal closure plans.
4.2.6 Fraser Institute Policy Perception Index
Wood has used the Policy Perception Index from the 2017 Fraser Institute Annual Survey of Mining Companies report (the 2017 Fraser Institute survey) as a credible source for the assessment of the overall political risk facing an exploration or mining project in Argentina. Each year, the Fraser Institute sends a questionnaire to selected mining and exploration companies globally. The Fraser Institute survey is an attempt to assess how mineral endowments and public policy factors such as taxation and regulatory uncertainty affect exploration investment.
Wood has relied on the 2017 Fraser Institute survey because it is globally regarded as an independent report-card style assessment to governments on how attractive their policies are from the point of view of an exploration manager or mining company and forms a proxy for the assessment by industry of political risk in specific political jurisdictions from the mining industry’s perspective.
Of the 91 jurisdictions surveyed in the 2017 Fraser Institute survey, Salta Province ranks 45th for investment attractiveness, 38th for policy perception and 54th for best practices mineral potential.
4.3 Project Ownership
Apex Silver Mines Corporation, a subsidiary of Apex Silver Mines Limited (collectively Apex Silver), acquired the initial interest in the Project in 2004. The Project interest was held by the wholly indirectly-owned subsidiary Silex Argentina S.A. (Silex Argentina).

El Quevar Project Salta Province, Argentina
NI 43-101 Technical Report on Preliminary Economic Assessment
Page 4-5
October 2018 Project Number: 196410
Following reorganization under Chapter 11 bankruptcy in 2009, the assets of Apex Silver were transferred to Golden Minerals Company. As part of that transaction, Silex Argentina became a wholly indirectly-owned subsidiary of Golden Minerals.
Legal opinion provided supports that Silex Argentina S.A. is a company incorporated under Argentine laws and was registered at the Public Registry of Commerce of Salta Province on March 2005.
4.4 Mineral Tenure
The El Quevar Project consists of 31 exploitation concessions (approx. 57,000 ha). Exploitation concessions are subject to an annual canon payment fee (refer to Section 4.2.1).
To maintain all of the El Quevar concessions, Golden Minerals paid canon payment fees to the Argentine government of approximately US$110,000 in 2016 and in 2017. In 2018 the company expects to pay approximately US$90,000.
The concession holdings are summarized in Table 4-1 and shown in Figure 4-1. Figure 4-2 shows the footprint of the Yaxtché Mineral Resource estimate, with respect to the claim outlines. The figure also shows claims for which a private royalty obligation exists.
Wood was provided with legal opinion that supports that Silex Argentina had met its obligations in terms of canon payments, legal labor and legal surveys and the submission of working and investment plans for the concessions, as of 3 August 2018 (Castañeda Nordmann, 2018).
4.5 Surface Rights
Surface rights at the El Quevar Project are owned by the province of Salta, and as a result there are no agreements required for access. In addition, the El Quevar area has no existing private properties or other infrastructure that would limit exploration activities. Although Golden Minerals has unrestricted access to its facilities, the company has been granted easements from the Province of Salta to further protect access rights. These easements are summarized in Table 4-2.

El Quevar Project Salta Province, Argentina
NI 43-101 Technical Report on Preliminary Economic Assessment
Page 4-6
October 2018 Project Number: 196410
Table 4-1: Mineral Tenure Table
Concession Name File # Hectares
Arjona II 18080 3,000.00
Armonia 1542 17.91
Castor 3902 384.10
Mariana 15190 26.31
Quespejahuar 12222 18.00
Quevar 10 20219 1,997.80
Quevar 11 20240 1,988.03
Quevar 12 20360 1,146.48
Quevar 19 20706 3,500.00
Quevar Decima Quinta 20445 3,254.66
Quevar Decimo Tercera 20501 3,354.93
Quevar II 17114 330.04
Quevar IV 19558 3,500.00
Quevar Novena 20215 1,312.99
Quevar Primera 19534 2,626.07
Quevar Quinta 19617 2,242.73
Quevar Séptima 20319 2,301.05
Quevar Sexta 19992 2,493.53
Quevar Tercera 19557 2,999.76
Quevar Veinteava 20988 21,51.58
Quevar Vigesimo Cuarto 21044 468.00
Quevar Vigesimo Primera 20997 3,499.99
Quevar Vigesimo Quinto 21054 1,993.71
Quevar Vigesimo Segundo 21042 2,143.63
Quevar Vigesimo Sexta 22087 992.55
Quevar Vigesimo Tercero 21043 995.63
Quevar Vigésimo Séotima 22403 497.84
Quirincolo I 18036 3,500.00
Quirincolo II 18037 3,500.00
Toro I 18332 436.61
Vince 1578 44.73
56,718.66

El Quevar Project Salta Province, Argentina
NI 43-101 Technical Report on Preliminary Economic Assessment
Page 4-7
October 2018 Project Number: 196410
Figure 4-1: Mineral Tenure Layout Plan
Note: Figure courtesy Golden Minerals, 2018.
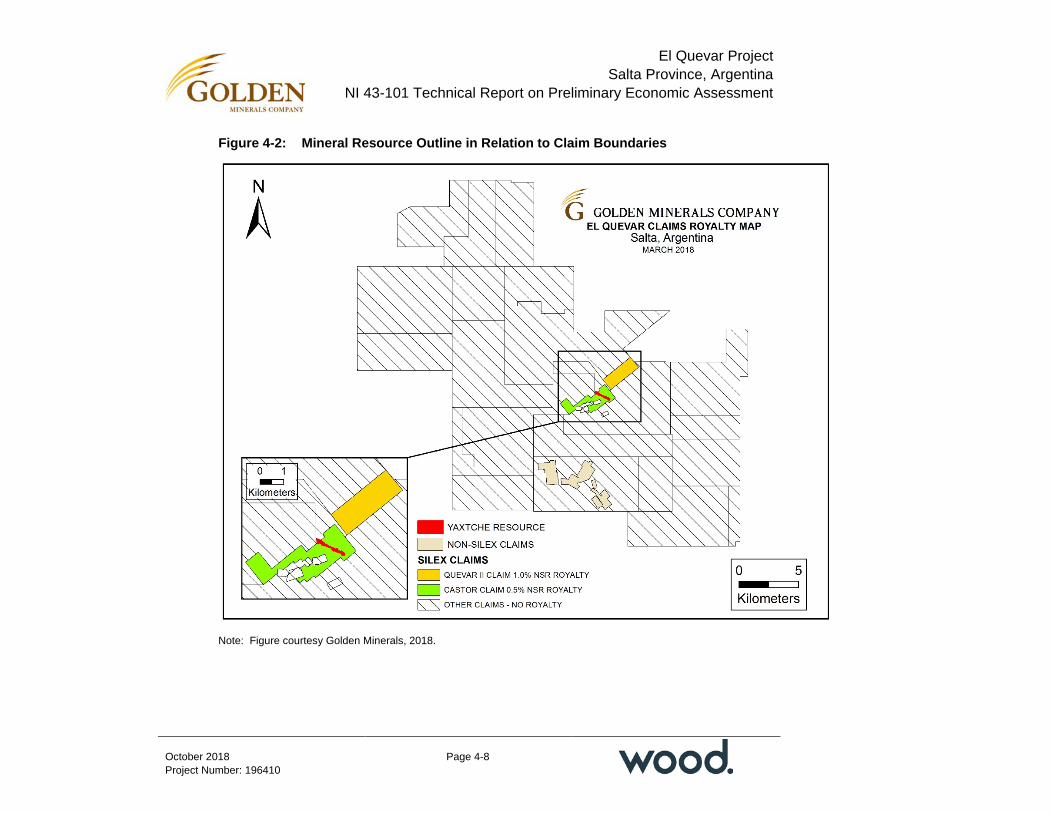
El Quevar Project Salta Province, Argentina
NI 43-101 Technical Report on Preliminary Economic Assessment
Page 4-8
October 2018 Project Number: 196410
Figure 4-2: Mineral Resource Outline in Relation to Claim Boundaries
Note: Figure courtesy Golden Minerals, 2018.

El Quevar Project Salta Province, Argentina
NI 43-101 Technical Report on Preliminary Economic Assessment
Page 4-9
October 2018 Project Number: 196410
Table 4-2: Granted Easements
Easement Number Type of Easement
19.137 Camp
21.003 Road
21.004 Waste rock facility
21.005 Water
21.006 Electric
21.009 Services road
20.666 Plant
4.6 Water Rights
Silex Argentina has applied for both surface and underground water concessions which are currently pending. These concessions currently provide water for the camp and for other exploration activities and can be re-permitted as needed for higher-capacity usage.
In 2017, the amount to be paid was AR$1.52/m3. The amount for 2018 is AR$1.90 m3.
4.7 Royalties and Encumbrances
Golden Minerals is required to pay a 1% net smelter return (NSR) royalty on the value of all minerals (i.e. 100%) extracted from the El Quevar II concession and a 1% NSR royalty on one-half of the minerals (i.e. 50%) extracted from the Castor concession to the third party from whom the concessions were acquired. Golden Minerals can purchase one half of the combined royalty interests for US$1 million during the first two years of production.
The Yaxtché deposit is located primarily on the Castor concession.
Golden Minerals may also be required to pay a 3% royalty to the Salta Province based on the mine mouth value of minerals extracted from any of the concessions less costs of processing and sales.
4.8 Permitting Considerations
Silex Argentina maintains the required environmental permits for exploration-related activities. These permits must be renewed every two years. New permits will be obtained as needed for additional exploration disturbance or for further development work. Typically, such permits take a maximum of 90 days to be approved once submitted.
El Quevar Project Salta Province, Argentina
NI 43-101 Technical Report on Preliminary Economic Assessment
Page 4-10
October 2018 Project Number: 196410
All previous work, including the decline, mine site installations, exploration drilling and trenching, road construction and camp installation, was completed under fully-authorized permits.
Silex Argentina is registered with the Registro Nacional de Armas (National Registry of Weapons) and is allowed to store explosives at the El Quevar Project.
A program of surface water sampling and reporting is in place as a condition for the ongoing environmental permits.
Additional information is provided in Section 20.
4.9 Environmental Considerations
There are artisanal prospecting pits and minor workings within the Project area. There are small-scale workings at the El Queva (Jaguar or Mani) mine, which operated from 1968 to 1973. There is an expectation that there will be environmental liabilities associated with the artisanal and small-scale mining activity.
Golden Minerals has initiated reclamation activities on some of the historical disturbances including reclaiming and recontouring all pre-2012 trenches, drill stations, and non-essential drill access roads.
Sulfide-bearing muck extracted from the decline was placed in lined and covered trenches, now fully recontoured, according to an approved reclamation plan.
Perlite quarries (see Section 6) are inactive. Golden Minerals will be responsible for reclamation of these quarries if any is required. To date, there has been no estimate or determination as to whether a liability exists.
4.10 Social License Considerations
The Project lies completely within the Andean Natural Reserve Zone (La Reserva Natural Los Andes) which is classified as a multi-use area (Categoría de Manejo de Uso Múltiple VIII). This classification allows for production/extraction activities including exploration and mining. The reserve’s main purpose is to provide vicuña habitat.
Additional information is provided in Section 20.
4.11 Comments on Section 4
The QP notes:
• Legal opinion provided supports that Golden Minerals currently holds an indirect 100% interest in the El Quevar property through its subsidiary Silex Argentina
• Legal opinion provided supports that the mineral tenures held are valid and sufficient to support declaration of Mineral Resources
El Quevar Project Salta Province, Argentina
NI 43-101 Technical Report on Preliminary Economic Assessment
Page 4-11
October 2018 Project Number: 196410
• The AMC sets out rules under which surface rights and easements can be granted for a mining operation. In instances where no agreement can be reached with the landowner, the AMC provides the mining right holder with the right to expropriate the required property
• Water use rights may be acquired by permit, by concession, and, under laws enacted in some Provinces, through authorization
• Golden Minerals is required to pay a 1% NSR royalty on the value of all minerals extracted from the El Quevar II concession and a 1% NSR royalty on one-half of the minerals extracted from the Castor concession. Golden Minerals can purchase one half of the combined royalty interests for US$1 million during the first two years of production
• Golden Minerals may also be required to pay a 3% royalty to the Salta Province based on the mine mouth value of minerals extracted from any of the concessions less costs of processing and sales
• Silex Argentina maintains the required environmental permits. All previous work was completed under fully-authorized permits.
The QP was advised by Golden Minerals that Golden Minerals is not aware of any significant environmental, social or permitting issues that would prevent future exploitation of the Yaxtché deposit.

El Quevar Project Salta Province, Argentina
NI 43-101 Technical Report on Preliminary Economic Assessment
Page 5-1
October 2018 Project Number: 196410
5.0 ACCESSIBILITY, CLIMATE, LOCAL RESOURCES, INFRASTRUCTURE, AND PHYSIOGRAPHY
5.1 Accessibility
The El Quevar property is accessed from Salta (capital of Salta Province) by following National Road 51 (NR51) to the turnoff to Provincial Road 27 (PR27) for approximately 226 km. From Salta to San Antonio de los Cobres, NR51 consists of either a paved or well-maintained gravel surface. Beyond San Antonio de los Cobres, NR51 is a well-maintained gravel road to the junction with PR27. From the intersection, the El Quevar property is accessed by driving south for approximately 30 km to the junction with the access road and then east, with the camp currently located approximately 10 km from the junction. Driving time from Salta to the Project camp is approximately four to five hours.
Salta is accessed by a number of highways and roads which connect it with the rest of Argentina, as well as with Chile and Bolivia. Salta has a major airport with daily flights to Buenos Aires as well as a number of other Argentinean and Bolivian cities.
A narrow-gauge railway which connects Salta with the city of Antofagasta in Chile passes within 5 km of the Project area. This government-owned railway is currently active only as a tourist train near San Antonio de Los Cobres and does not now connect with Salta or Antofagasta.
5.2 Climate
The climate is characteristic of high mountain environments. The weather is extremely dry and ranges from polar conditions on the higher mountain peaks to arid steppe environments at the valley floors. Most precipitation falls between November and March as heavy rains, hail and snow. Total precipitation is variable and can range from 50mm in dry years to 200mm during wetter years. Temperatures during the winter months vary from 10ºC day during the day to -25ºC at night. During the summer months, temperatures in the daytime can reach 25ºC falling to -5º C at night. Moderate to high winds are characteristic of the winter months.
It is expected that any future underground mining operations will be conducted year-round. Exploration activities can be temporarily curtailed by rainfall or snow during the period from November to March.
5.3 Local Resources and Infrastructure
Salta (pop. 619,000) is the major regional supply center and has all major services.
The closest settlement, in a sparsely-populated area, is the town of Pocitos (pop. circa 80), 20 km southwest of the Project. The next closest settlement is San Antonio de los
El Quevar Project Salta Province, Argentina
NI 43-101 Technical Report on Preliminary Economic Assessment
Page 5-2
October 2018 Project Number: 196410
Cobres (pop. 4,000), the local departmental government seat, about 90 km to the southeast of El Quevar, on the road to Salta. Minor services are available.
The 210,000 m3/d high-pressure Gasoducto Minero natural gas pipeline passes through the Project area, about 5 km west of the exploration camp. Gas is available for mining projects in Salta Province.
Grid electricity is potentially available from a 354 kV high-voltage power line, owned by Termo Andes, which passes 30 km north of Yaxtché (no spare capacity at present). There is currently no external electric power to El Quevar. Power to the exploration camp is supplied by two 275 kVA diesel generators.
Water for camp use is pumped from a 100 m deep well that is pumped at a rate of about 10 m3/d, but which can be expanded to about 50 m3/d by paying the required usage fees. Additional water resources sufficient for mineral processing use can be obtained from the same groundwater source.
The exploration camp, rated for 100 persons, is situated on the El Quevar III concession. The camp consists of accommodations, offices, and core splitting, logging, and equipment maintenance facilities.
Manpower can be sourced for exploration activities in the Province.
Additional information is provided in Section 18.
5.4 Physiography
The Project is located in the altiplano (puna) region of the Puna Block of the central Andes, on the western slope of a volcanic edifice. The volcanic massif has two peaks, Nevado de Quevar (6,130 m) and Cerro El Azufre (5,840 m). Drainage from the edifice slopes has formed steep canyons, with the water draining to an extensive complex of alluvial fans that grade into three salt flats, Salar de Pocitos (elevation 3,700 m) to the southwest, Rincon (3,800 m) to the west, and Cauchari (3,900 m) to the northwest.
Most of the mineralized areas are located between 4,500 and 5,100 m above sea level, with the Yaxtché zone surface exposures located between 4,800 and 4,900 m. The exploration camp is located west of the deposit area where a canyon opens up into a large alluvial fan at an elevation of 4,000 m.
Vegetation is characteristic of steppe climates adapted to harsh conditions, consisting of clumps of spiny grass known as coirón or ichu with no native trees or large shrubs. Most of the Project area consists of barren outcrop, talus, alluvium and landslide blocks.
Wildlife is rare due to the altitude and aridity. Native wildlife observed has included tinamou (birds), ñandu (rhea), fox, vicuña (camelid), guanaco (camelid), and mountain lion. Domesticated livestock includes burros, sheep, cattle, llamas and alpacas.

El Quevar Project Salta Province, Argentina
NI 43-101 Technical Report on Preliminary Economic Assessment
Page 5-3
October 2018 Project Number: 196410
5.5 Comments on Section 5
Any future underground mining operations are expected to be operated year-round.
There is sufficient suitable land available within the mineral tenure held by Golden Minerals for infrastructure such as tailings disposal, mine waste disposal, and process plant and related mine facilities.
A review of the existing power and water sources, manpower availability, and transport options indicates that there are reasonable expectations that sufficient labor and infrastructure will be available to support exploration activities and any future mine development.
El Quevar Project Salta Province, Argentina
NI 43-101 Technical Report on Preliminary Economic Assessment
Page 6-1
October 2018 Project Number: 196410
6.0 HISTORY
6.1 Exploration History
The Project history is summarized in Table 6-1.
Golden Minerals commenced underground exploration drifting in June 2010 and completed trial mining in early 2011. The experience gained from the trial underground mining allowed an excellent understanding of penetration rates, rock engineering properties, water-handling needs, and the costs related to these and other mining-related activities. This understanding of costs and rates of mining advance has been used as a basis for the estimates of underground development and mining costs used in the 2018 PEA.
Golden Minerals contracted with Samuel Engineering to begin a prefeasibility study on El Quevar in August 2010 based on the resource estimate at the time. In March 2011 the prefeasibility study was suspended pending completion of a new resource estimate. While the estimation and planning in support of the prefeasibility study was begun, the study was not completed. Some of the testwork and planning including metallurgical studies begun in support of the prefeasibility study have been reviewed, adjusted and provide support for the 2018 PEA.
6.2 Production
Small scale mining and prospecting on the El Quevar property is reported to have occurred intermittently since the 1800s. After 1930, access to the region improved, and mining and prospecting activity increased locally.
Production is not well documented. Sillitoe (1975) notes that the “El Queva mine has produced a little over 3,000 tons of ore during its intermittent operating life from 1968 to early 1973, with a maximum output of 1,270 tons in 1970. Ore grades are difficult to estimate but hand-cobbed material seems to have averaged about 8% Pb and 0.2% Ag”.
The El Queva mine has also been referred to as the Jaguar Mine, and the mine area is now part of the Mani zone (Chlumsky, Armbrust & Meyer, 2009).
There is no known commercial production of base metals, gold, or silver from the Project. Minor production of perlite has occurred; however, there are no official production figures.
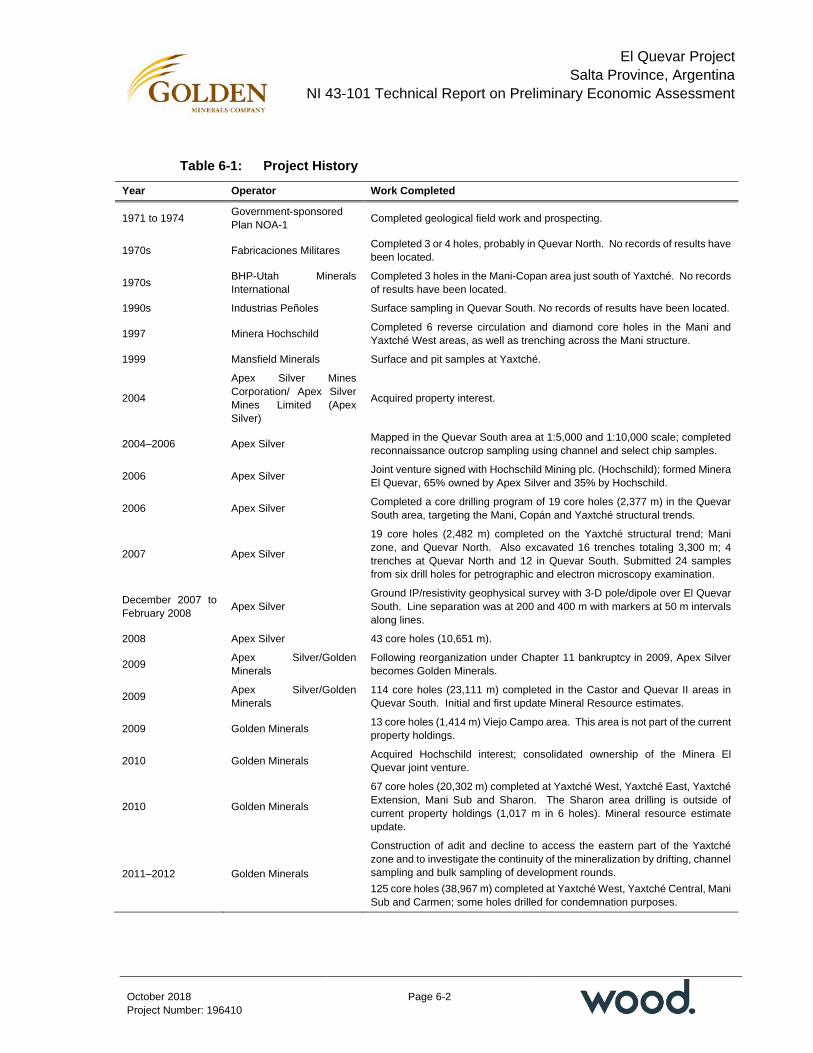
El Quevar Project Salta Province, Argentina
NI 43-101 Technical Report on Preliminary Economic Assessment
Page 6-2
October 2018 Project Number: 196410
Table 6-1: Project History
Year Operator Work Completed
1971 to 1974 Government-sponsored Plan NOA-1 Completed geological field work and prospecting.
1970s Fabricaciones Militares Completed 3 or 4 holes, probably in Quevar North. No records of results have been located.
1970s BHP-Utah Minerals International
Completed 3 holes in the Mani-Copan area just south of Yaxtché. No records of results have been located.
1990s Industrias Peñoles Surface sampling in Quevar South. No records of results have been located.
1997 Minera Hochschild Completed 6 reverse circulation and diamond core holes in the Mani and Yaxtché West areas, as well as trenching across the Mani structure.
1999 Mansfield Minerals Surface and pit samples at Yaxtché.
2004
Apex Silver Mines Corporation/ Apex Silver Mines Limited (Apex Silver)
Acquired property interest.
2004–2006 Apex Silver Mapped in the Quevar South area at 1:5,000 and 1:10,000 scale; completed reconnaissance outcrop sampling using channel and select chip samples.
2006 Apex Silver Joint venture signed with Hochschild Mining plc. (Hochschild); formed Minera El Quevar, 65% owned by Apex Silver and 35% by Hochschild.
2006 Apex Silver Completed a core drilling program of 19 core holes (2,377 m) in the Quevar South area, targeting the Mani, Copán and Yaxtché structural trends.
2007 Apex Silver
19 core holes (2,482 m) completed on the Yaxtché structural trend; Mani zone, and Quevar North. Also excavated 16 trenches totaling 3,300 m; 4 trenches at Quevar North and 12 in Quevar South. Submitted 24 samples from six drill holes for petrographic and electron microscopy examination.
December 2007 to February 2008 Apex Silver
Ground IP/resistivity geophysical survey with 3-D pole/dipole over El Quevar South. Line separation was at 200 and 400 m with markers at 50 m intervals along lines.
2008 Apex Silver 43 core holes (10,651 m).
2009 Apex Silver/Golden Minerals
Following reorganization under Chapter 11 bankruptcy in 2009, Apex Silver becomes Golden Minerals.
2009 Apex Silver/Golden Minerals
114 core holes (23,111 m) completed in the Castor and Quevar II areas in Quevar South. Initial and first update Mineral Resource estimates.
2009 Golden Minerals 13 core holes (1,414 m) Viejo Campo area. This area is not part of the current property holdings.
2010 Golden Minerals Acquired Hochschild interest; consolidated ownership of the Minera El Quevar joint venture.
2010 Golden Minerals
67 core holes (20,302 m) completed at Yaxtché West, Yaxtché East, Yaxtché Extension, Mani Sub and Sharon. The Sharon area drilling is outside of current property holdings (1,017 m in 6 holes). Mineral resource estimate update.
2011–2012 Golden Minerals
Construction of adit and decline to access the eastern part of the Yaxtché zone and to investigate the continuity of the mineralization by drifting, channel sampling and bulk sampling of development rounds. 125 core holes (38,967 m) completed at Yaxtché West, Yaxtché Central, Mani Sub and Carmen; some holes drilled for condemnation purposes.

El Quevar Project Salta Province, Argentina
NI 43-101 Technical Report on Preliminary Economic Assessment
Page 6-3
October 2018 Project Number: 196410
2012 Golden Minerals Resource estimate update.
2012–2013 Golden Minerals
16 core holes (2,433 m) drilled in exploration areas in Quevar South (Carla, Andrea, Puntana, Argentina) and Quevar North (Sharon, Amanda, Luisa, Julia) areas. Drilling in the Quevar North areas is outside of the current property holdings (7 drill holes, 895 m).
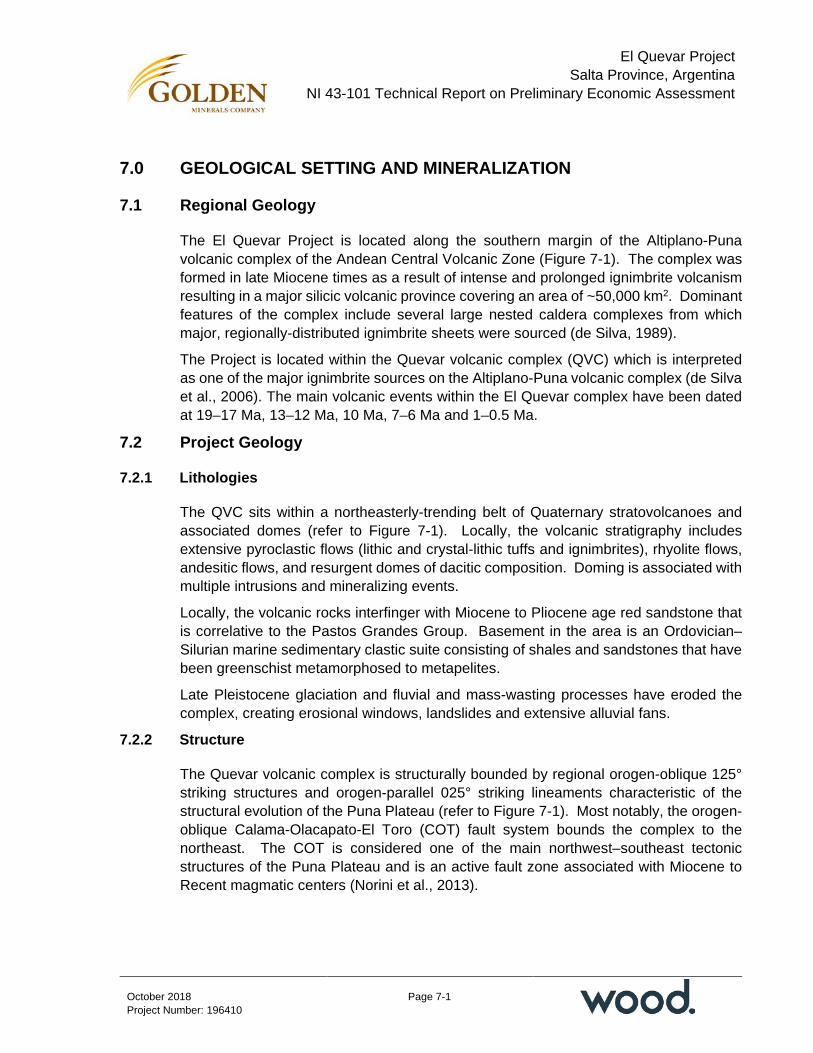
El Quevar Project Salta Province, Argentina
NI 43-101 Technical Report on Preliminary Economic Assessment
Page 7-1
October 2018 Project Number: 196410
7.0 GEOLOGICAL SETTING AND MINERALIZATION
7.1 Regional Geology
The El Quevar Project is located along the southern margin of the Altiplano-Puna volcanic complex of the Andean Central Volcanic Zone (Figure 7-1). The complex was formed in late Miocene times as a result of intense and prolonged ignimbrite volcanism resulting in a major silicic volcanic province covering an area of ~50,000 km2. Dominant features of the complex include several large nested caldera complexes from which major, regionally-distributed ignimbrite sheets were sourced (de Silva, 1989).
The Project is located within the Quevar volcanic complex (QVC) which is interpreted as one of the major ignimbrite sources on the Altiplano-Puna volcanic complex (de Silva et al., 2006). The main volcanic events within the El Quevar complex have been dated at 19–17 Ma, 13–12 Ma, 10 Ma, 7–6 Ma and 1–0.5 Ma.
7.2 Project Geology
7.2.1 Lithologies
The QVC sits within a northeasterly-trending belt of Quaternary stratovolcanoes and associated domes (refer to Figure 7-1). Locally, the volcanic stratigraphy includes extensive pyroclastic flows (lithic and crystal-lithic tuffs and ignimbrites), rhyolite flows, andesitic flows, and resurgent domes of dacitic composition. Doming is associated with multiple intrusions and mineralizing events.
Locally, the volcanic rocks interfinger with Miocene to Pliocene age red sandstone that is correlative to the Pastos Grandes Group. Basement in the area is an Ordovician–Silurian marine sedimentary clastic suite consisting of shales and sandstones that have been greenschist metamorphosed to metapelites.
Late Pleistocene glaciation and fluvial and mass-wasting processes have eroded the complex, creating erosional windows, landslides and extensive alluvial fans.
7.2.2 Structure
The Quevar volcanic complex is structurally bounded by regional orogen-oblique 125° striking structures and orogen-parallel 025° striking lineaments characteristic of the structural evolution of the Puna Plateau (refer to Figure 7-1). Most notably, the orogen-oblique Calama-Olacapato-El Toro (COT) fault system bounds the complex to the northeast. The COT is considered one of the main northwest–southeast tectonic structures of the Puna Plateau and is an active fault zone associated with Miocene to Recent magmatic centers (Norini et al., 2013).
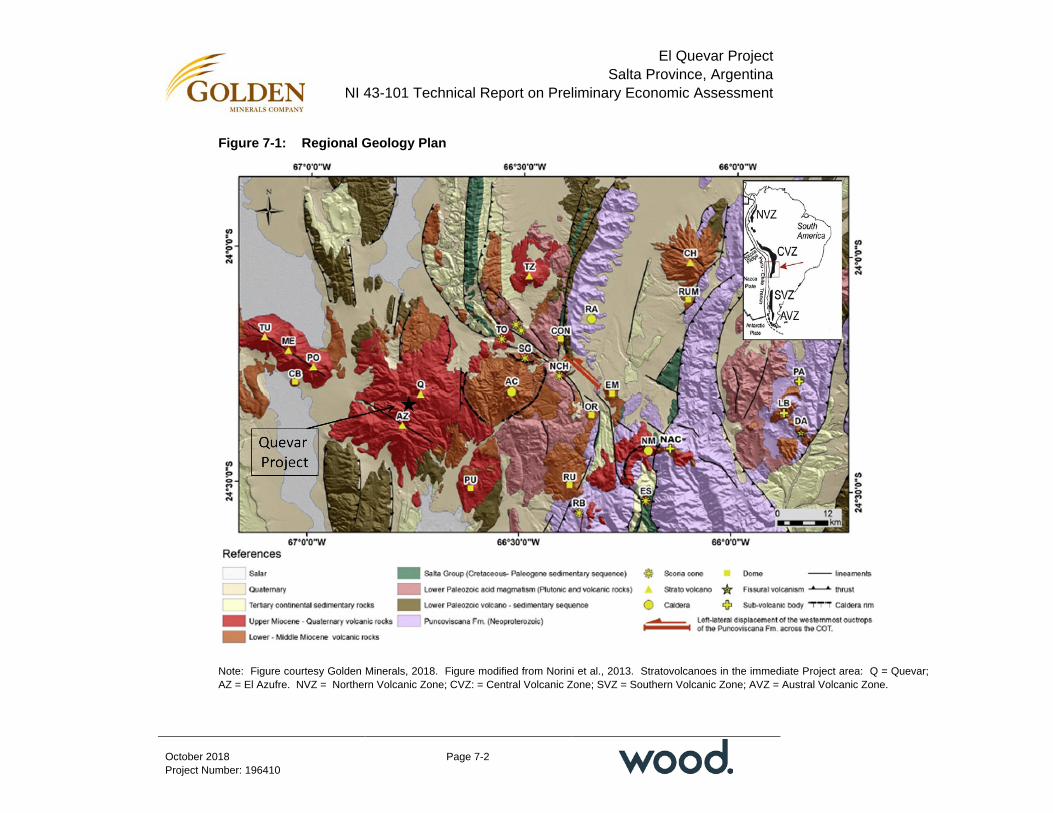
El Quevar Project Salta Province, Argentina
NI 43-101 Technical Report on Preliminary Economic Assessment
Page 7-2
October 2018 Project Number: 196410
Figure 7-1: Regional Geology Plan
Note: Figure courtesy Golden Minerals, 2018. Figure modified from Norini et al., 2013. Stratovolcanoes in the immediate Project area: Q = Quevar; AZ = El Azufre. NVZ = Northern Volcanic Zone; CVZ: = Central Volcanic Zone; SVZ = Southern Volcanic Zone; AVZ = Austral Volcanic Zone.

El Quevar Project Salta Province, Argentina
NI 43-101 Technical Report on Preliminary Economic Assessment
Page 7-3
October 2018 Project Number: 196410
7.2.3 Alteration
The Project sits within one of three large erosional windows that have exposed expansive zones of steam-heated alteration (Figure 7-2). Such lithocaps have been widely reported within the high sulfidation epithermal environment above porphyry copper deposits. Mineralization was discovered at Yaxtché within a low-lying outcrop of leached and silicified dacite that is exposed at the base of the Quevar South alteration halo. With the exception of the surficial steam-heated alteration and a few scattered silicified outcrops, the bulk of information relating to hydrothermal alteration is known from drill core (see Section 7.3).
7.2.4 Mineralization
Silver is the element of economic significance at El Quevar and anomalous concentrations of copper, lead, zinc, and lesser gold occur locally. The nature of mineralization is consistent with that of a high- to intermediate-sulfidation state (see Section 8).
Mineralization occurs in various styles across the Project area from mineralized veins (e.g. Mani prospect) to disseminated and replacement style mineralization at Yaxtché.
Sillitoe (1975) noted the native sulfur deposits occur near the summits of Queva and El Azufre, with several small manganese deposits located around the periphery of the volcanic complex. The spatial and temporal relationships of the silver, sulfur, and manganese mineralization were used by Sillitoe to reconstruct an idealized paleo-hydrothermal system that formed above an inferred porphyry copper deposit.
7.3 Deposit Description
7.3.1 Lithologies
The major lithologies within the Yaxtché deposit are depicted and summarized in Figure 7-3.
Although poorly exposed on surface, the most abundant rock type encountered in Yaxtché drill holes is the epiclastic unit (EP). This unit is characterized as a matrix-supported volcanic breccia with large (few centimeters to tens of centimeters), rounded to sub-rounded, polymictic volcanic clasts within a fine-grained matrix. The EP unit is interpreted to have formed as a debris flow.

El Quevar Project Salta Province, Argentina
NI 43-101 Technical Report on Preliminary Economic Assessment
Page 7-4
October 2018 Project Number: 196410
Figure 7-2: Yaxtché Deposit Outline Relative to Large Zones of Exposed Hydrothermal Alteration
Note: Image courtesy Golden Minerals, 2018. Silex = Silex Argentina.
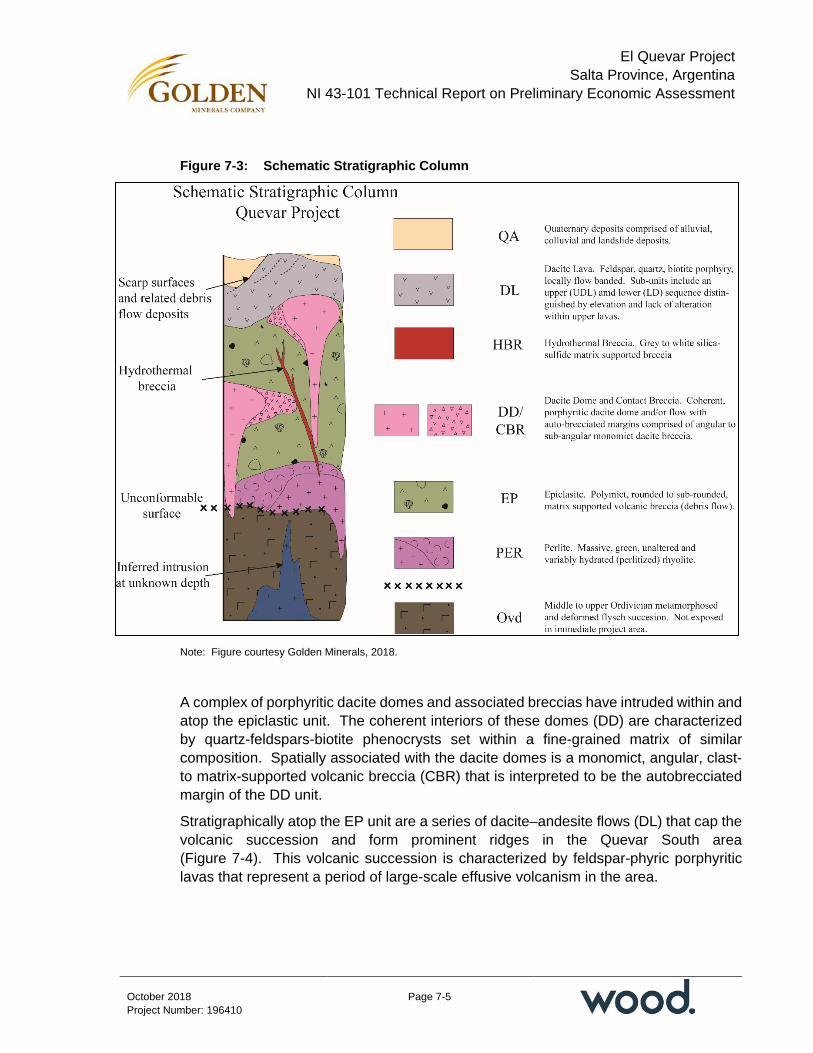
El Quevar Project Salta Province, Argentina
NI 43-101 Technical Report on Preliminary Economic Assessment
Page 7-5
October 2018 Project Number: 196410
Figure 7-3: Schematic Stratigraphic Column
Note: Figure courtesy Golden Minerals, 2018.
A complex of porphyritic dacite domes and associated breccias have intruded within and atop the epiclastic unit. The coherent interiors of these domes (DD) are characterized by quartz-feldspars-biotite phenocrysts set within a fine-grained matrix of similar composition. Spatially associated with the dacite domes is a monomict, angular, clast- to matrix-supported volcanic breccia (CBR) that is interpreted to be the autobrecciated margin of the DD unit.
Stratigraphically atop the EP unit are a series of dacite–andesite flows (DL) that cap the volcanic succession and form prominent ridges in the Quevar South area (Figure 7-4). This volcanic succession is characterized by feldspar-phyric porphyritic lavas that represent a period of large-scale effusive volcanism in the area.
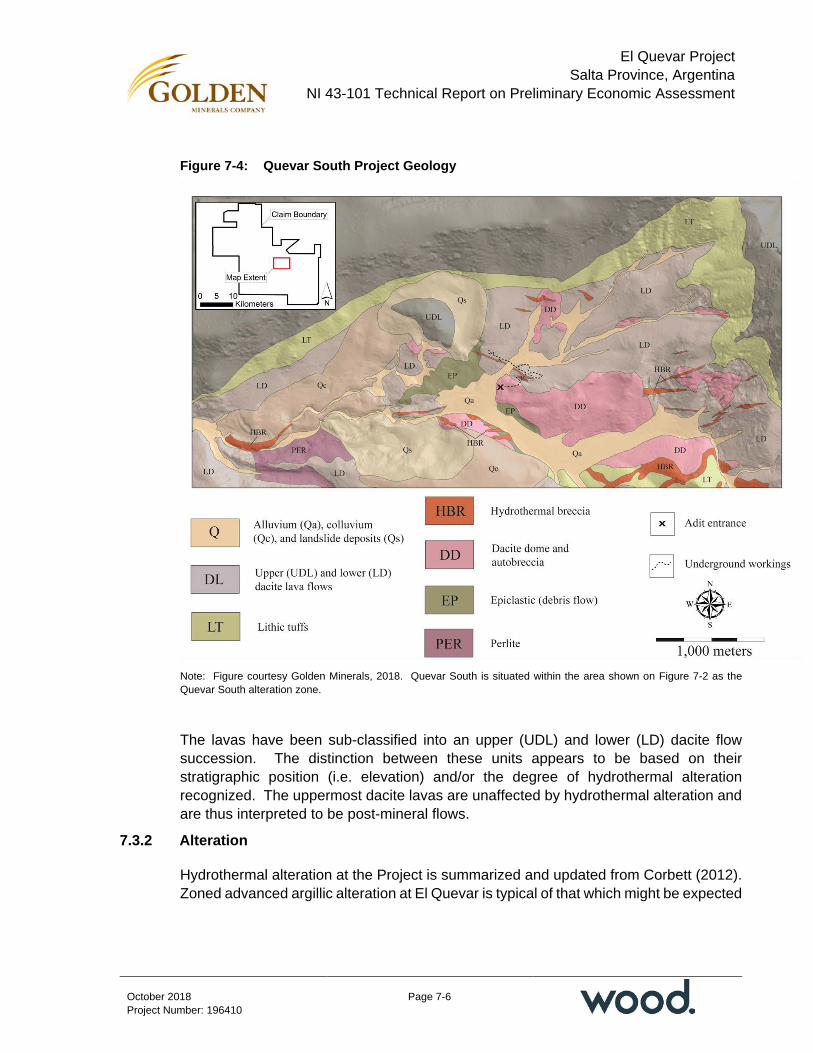
El Quevar Project Salta Province, Argentina
NI 43-101 Technical Report on Preliminary Economic Assessment
Page 7-6
October 2018 Project Number: 196410
Figure 7-4: Quevar South Project Geology
Note: Figure courtesy Golden Minerals, 2018. Quevar South is situated within the area shown on Figure 7-2 as the Quevar South alteration zone.
The lavas have been sub-classified into an upper (UDL) and lower (LD) dacite flow succession. The distinction between these units appears to be based on their stratigraphic position (i.e. elevation) and/or the degree of hydrothermal alteration recognized. The uppermost dacite lavas are unaffected by hydrothermal alteration and are thus interpreted to be post-mineral flows.
7.3.2 Alteration
Hydrothermal alteration at the Project is summarized and updated from Corbett (2012). Zoned advanced argillic alteration at El Quevar is typical of that which might be expected

El Quevar Project Salta Province, Argentina
NI 43-101 Technical Report on Preliminary Economic Assessment
Page 7-7
October 2018 Project Number: 196410
to occur in association with high-sulfidation epithermal gold deposits. Elements of the zoned advanced argillic alteration from the center outwards are classed as:
• Vuggy silica: forms as hot extremely acidic (pH 1–2) fluid leaches feldspars to provide rectangular pseudomorphous vugs after feldspar and participates in textural destruction to provide rounded vugs. The textural destruction caused by acidic alteration forms zones of enhanced permeability through which the later mineralized fluids ascended
• Pervasive silica: displays similarities to that developed in the core zones of many structurally-controlled zones of advanced argillic alteration, and occurs outboard of the leached vuggy silica domains
• Silica–alunite: develops in a marginal setting to the vuggy silica core as the causative hydrothermal fluid becomes progressively cooled and neutralized by reaction with wall rocks and so deposits alteration mineralogy typical of less acidic conditions of formation
• Kaolinite–dickite: forms marginal to the silica–alunite alteration by reaction with wall rocks of the progressively cooled and neutralized hydrothermal fluid
• Neutral argillic: characterized by silica–smectite–illite–ankerite ± pyrite is common outside the advanced argillic alteration and is interpreted to have developed in response to polyphasal dome emplacement. The smectite-rich alteration is apparent as swelling clays. The neutral argillic alteration is overprinted by the advanced argillic alteration
• Steam-heated: is apparent in the uppermost portions of El Quevar as typical powdery alunite–cristobalite–kaolin developed by reaction with wall rocks of acidic waters derived from the oxidation of rising H2S above the water table. It therefore occurs as ‘blankets’ overlying many high-sulfidation epithermal systems
• Propylitic: occurs as the outermost zone of alteration at El Quevar and is characterized by a chlorite–epidote ± pyrite mineral assemblage yielding a distinctive green color to the affected rocks.
An attempt to quantify the effects of hydrothermal alteration has resulted in the development of the Quevar alteration index (QAI). The QAI tracks the changes of the mobile major elements, calcium, magnesium and sodium, in response to acid-leaching processes associated with hydrothermal alteration as described above.
The QAI follows the advanced argillic alteration index (AAAI) of Williams and Davidson (2004) but is specific to the El Quevar Project and the available chemical analyses. The relationship between the AAAI and the QAI is shown in Figure 7-5, together with the correlation of silver grade to alteration intensity.
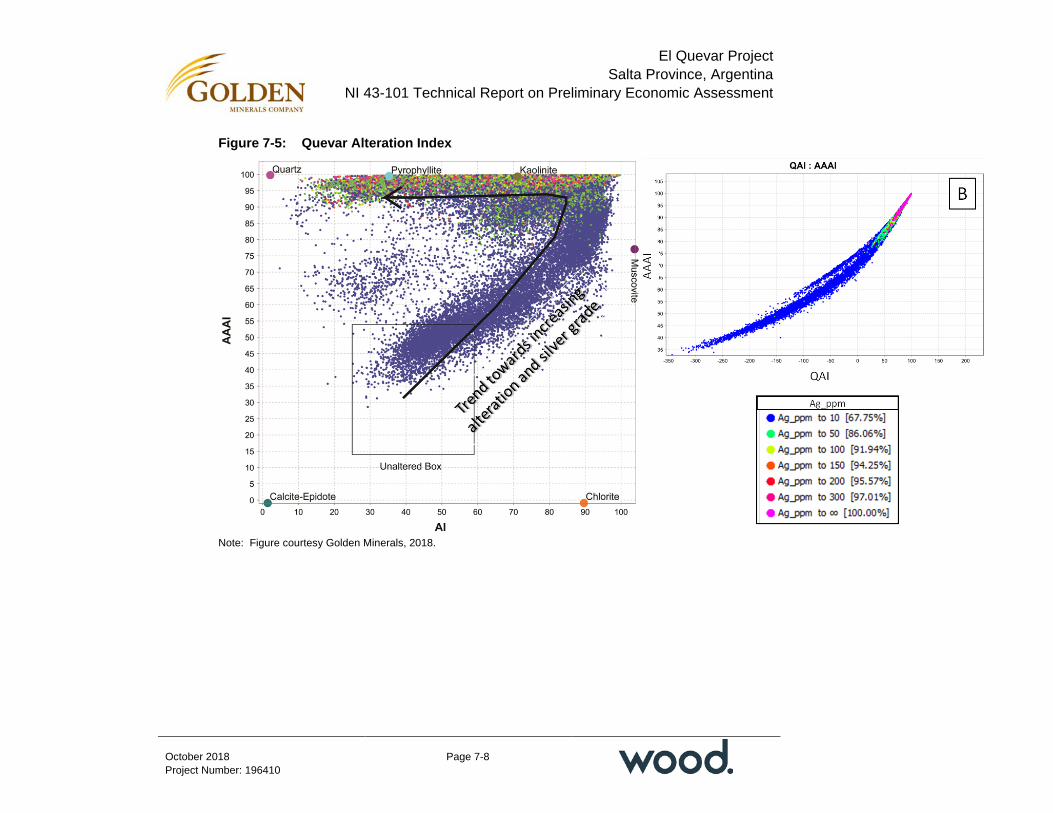
El Quevar Project Salta Province, Argentina
NI 43-101 Technical Report on Preliminary Economic Assessment
Page 7-8
October 2018 Project Number: 196410
Figure 7-5: Quevar Alteration Index
Note: Figure courtesy Golden Minerals, 2018.

El Quevar Project Salta Province, Argentina
NI 43-101 Technical Report on Preliminary Economic Assessment
Page 7-9
October 2018 Project Number: 196410
The QAI is defined as
QAI = 100(SUM: LA Ca% + LA Mg% + LA Na% ) – (SUM: Ca% + Mg% + Na%) (SUM : LA Ca% + LA Mg% + LA Na%)
where LA stands for the average least altered composition for Quevar host rocks.
The QAI is an effective tool for determining hydrothermal fluid pathways that contain silver mineralization. Zones of leaching and feldspar destruction defined by the QAI are typically much broader than areas of silver mineralization, and thus has proven to be a useful exploration tool outside of the Yaxtché deposit.
7.3.3 Mineralization
Mineralization at Yaxtché consists of fine-grained black sulfides and sulfosalts that are difficult to identify in hand specimens. The mineralization occurs variously as disseminations, open-space filling, and in massive veinlets or clots. The identified mineralogy is consistent with that expected within a high- to intermediate-sulfidation epithermal deposit (refer to discussion in Section 8).
Based on petrographic studies, Golden Minerals’ geologists have classified the mineralization by oxidation state (Table 7-1).
Coote (2010) observed:
• Tennantite–tetrahedrite is both intergrown with and overgrowing/replacing enargite–luzonite defining a trend of progressively decreasing sulfidation state of acid hydrothermal fluids with time at any given location within the hydrothermal system. The association of minor amounts of very fine-grained chalcopyrite with tennantite–tetrahedrite as overgrowths to or replacement of enargite–luzonite is consistent with the interpreted decreasing hydrothermal fluid sulfidation state. Sphalerite, locally abundant in association with the tennantite–tetrahedrite, formed about or after luzonite–enargite, also formed as a component of the physio-chemically evolving acid hydrothermal system
• Silver is mostly identified (from electron microprobe analyses and reflected light optical properties) as a component of the complex antimony- and lead-bearing and bismuth-rich sulfosalts which span the enargite–luzonite through to predominant tennantite–tetrahedrite paragenesis. It would appear that silver is poor in early bismuth-rich sulfosalts and rich in the later bismuth-rich sulfosalts that are mostly associated with tennantite/tetrahedrite. Silver mineralization therefore is also genetically associated with the evolving high-sulfidation system. Only minor to trace amounts of argentite are associated with tennantite–tetrahedrite and sphalerite.
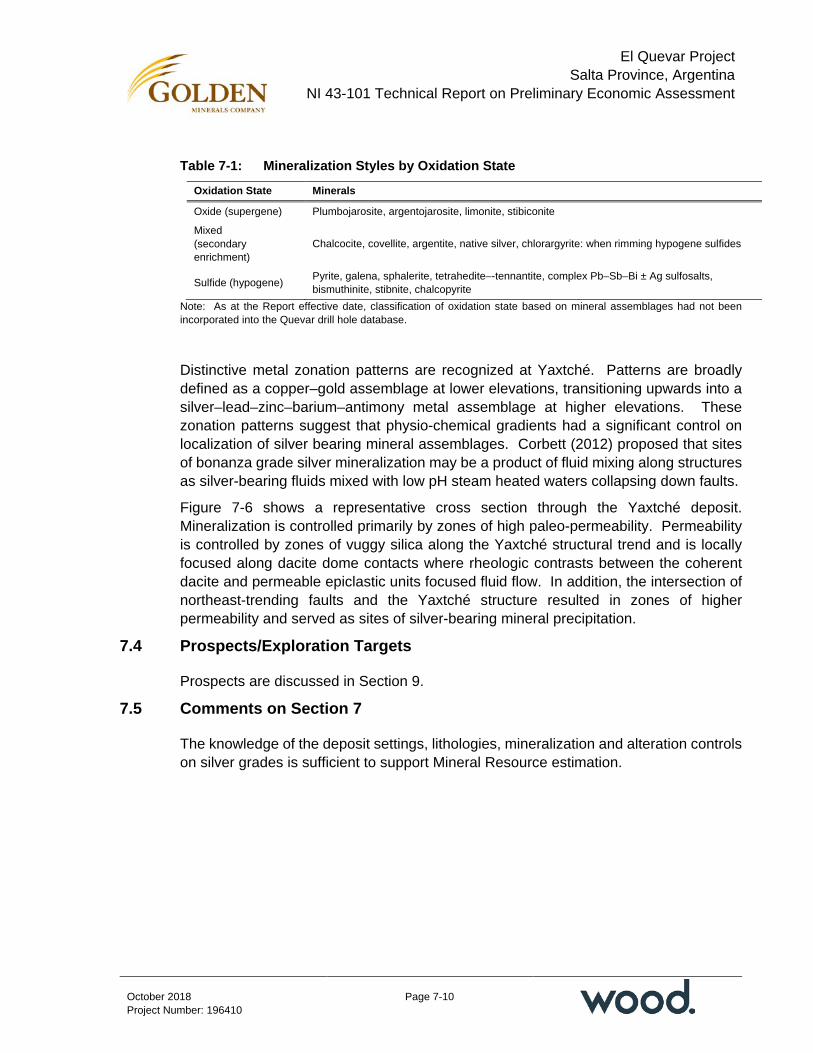
El Quevar Project Salta Province, Argentina
NI 43-101 Technical Report on Preliminary Economic Assessment
Page 7-10
October 2018 Project Number: 196410
Table 7-1: Mineralization Styles by Oxidation State
Oxidation State Minerals
Oxide (supergene) Plumbojarosite, argentojarosite, limonite, stibiconite
Mixed (secondary enrichment)
Chalcocite, covellite, argentite, native silver, chlorargyrite: when rimming hypogene sulfides
Sulfide (hypogene) Pyrite, galena, sphalerite, tetrahedite–-tennantite, complex Pb–Sb–Bi ± Ag sulfosalts, bismuthinite, stibnite, chalcopyrite
Note: As at the Report effective date, classification of oxidation state based on mineral assemblages had not been incorporated into the Quevar drill hole database.
Distinctive metal zonation patterns are recognized at Yaxtché. Patterns are broadly defined as a copper–gold assemblage at lower elevations, transitioning upwards into a silver–lead–zinc–barium–antimony metal assemblage at higher elevations. These zonation patterns suggest that physio-chemical gradients had a significant control on localization of silver bearing mineral assemblages. Corbett (2012) proposed that sites of bonanza grade silver mineralization may be a product of fluid mixing along structures as silver-bearing fluids mixed with low pH steam heated waters collapsing down faults.
Figure 7-6 shows a representative cross section through the Yaxtché deposit. Mineralization is controlled primarily by zones of high paleo-permeability. Permeability is controlled by zones of vuggy silica along the Yaxtché structural trend and is locally focused along dacite dome contacts where rheologic contrasts between the coherent dacite and permeable epiclastic units focused fluid flow. In addition, the intersection of northeast-trending faults and the Yaxtché structure resulted in zones of higher permeability and served as sites of silver-bearing mineral precipitation.
7.4 Prospects/Exploration Targets
Prospects are discussed in Section 9.
7.5 Comments on Section 7
The knowledge of the deposit settings, lithologies, mineralization and alteration controls on silver grades is sufficient to support Mineral Resource estimation.

El Quevar Project Salta Province, Argentina
NI 43-101 Technical Report on Preliminary Economic Assessment
Page 7-11
October 2018 Project Number: 196410
Figure 7-6: Yaxtché Cross-Section (looking northwest)
Note: Figure courtesy Golden Minerals, 2018; modified after Cummings, 2010. Refer to Figure 7-4 for detailed geological legend.
El Quevar Project Salta Province, Argentina
NI 43-101 Technical Report on Preliminary Economic Assessment
Page 8-1
October 2018 Project Number: 196410
8.0 DEPOSIT TYPES
Epithermal deposits have been variably classified on the basis of their alteration and gangue mineral assemblages, metal and sulfide contents, and their sulfide mineral assemblages. The Yaxtché deposit shows alteration assemblages typical of high sulfidation epithermal deposits (refer to Section 7.3) whereas the metal content and sulfide assemblages are characteristic of mineralizing fluids with an intermediate sulfidation state (Figure 8-1).
The transition from high- to intermediate-sulfidation state is thought to define an evolving epithermal system as high-sulfidation state metal-bearing fluids cooled and interacted with host rocks as they moved vertically and laterally though the Yaxtché structure. This is depicted in Figure 8-1 with three stages of primary fluid evolution:
• Alteration and gangue mineral assemblages related to acidic magmatic–hydrothermal fluids created permeability through acid leaching (i.e. vuggy silica)
• High-sulfidation state mineral assemblages (namely enargite–luzonite–famatinite) and metal contents (copper–gold dominant) formed at lower elevations within the Yaxtché structure
• Transition of high- to intermediate-sulfidation state as metal-bearing fluids ascended and further interacted with host rocks. The final phase of fluid evolution was critical for precipitation of silver-bearing minerals as tennantite–tetrahedrite became stable.
Sillitoe and Hedenquist (2003) defined the following key features of intermediate-sulfidation systems:
• Intermediate-sulfidation deposits occur in calc-alkaline andesitic–dacitic arcs, although more felsic rocks can locally act as mineralization hosts
• The arcs typically display neutral to mildly extensional stress states
• Deposits form under acidic, oxidizing conditions within 1 km of the surface and between temperatures of 150º and 250ºC
• Deposits show a large range in metal content and characteristics and can vary along the spectrum from gold-dominant to silver-dominant mineralization
• Although there is a large range of sulfide and sulfosalt minerals, these are dominated by sphalerite with low FeS content, and include galena, tetrahedrite–tennantite, and chalcopyrite. Sulfide abundance can vary from 5–20 vol%

El Quevar Project Salta Province, Argentina
NI 43-101 Technical Report on Preliminary Economic Assessment
Page 8-2
October 2018 Project Number: 196410
Figure 8-1: Diagnostic Minerals of Various States of pH, Sulfidation and Oxidation State Used to Distinguish Epithermal Ore-Forming Environments
Note: Figure modified from Simmons et al., 2005.
• Mineral assemblages typically contain Ag ± Pb, Zn (Au)
• The typical Ag:Au ratio is > 20:1
• Minor mineral associations can include Mo, As, Sb; may have associated tellurides
• Silica alteration can include vein-filling crustiform- and comb-textured veins
• Typical alteration assemblages include advanced argillic, alunite and kaolinite with pyrophyllite deeper in the system; the proximal alteration mineral is often sericite.
Figure 8-2 is a schematic diagram showing the general geological setting of high- to intermediate-sulfidation epithermal deposits. Corbett (2012) related the epithermal model to the Yaxtché silver deposit. Important aspects of this work include the proposed relationship between silver grade and sulfidation state of the metal-bearing fluids including zones of bonanza silver grades where collapsing steam-heated waters interacted with metal-rich fluids (Figure 8-3).

El Quevar Project Salta Province, Argentina
NI 43-101 Technical Report on Preliminary Economic Assessment
Page 8-3
October 2018 Project Number: 196410
Figure 8-2: Schematic, Intermediate Sulfidation System
Note: Figure from Sillitoe and Hedenquist, 2003
Figure 8-3: Schematic Diagram of Yaxtché Hydrothermal Fluid Evolution
Note: Figure from Corbett, 2012.
El Quevar Project Salta Province, Argentina
NI 43-101 Technical Report on Preliminary Economic Assessment
Page 8-4
October 2018 Project Number: 196410
8.1 Comments on Section 8
Features that support the Yaxtché deposit as a high to intermediate-sulfidation system include the deposit setting, host rocks, and mineralization and alteration assemblages.
The deposit model is a reasonable basis for the design of additional exploration programs.

El Quevar Project Salta Province, Argentina
NI 43-101 Technical Report on Preliminary Economic Assessment
Page 9-1
October 2018 Project Number: 196410
9.0 EXPLORATION
9.1 Grids and Surveys
Golden Minerals provided topographic control which was acquired by PDOP Servicios Topograficos (PDOP) during May–June 2008. PDOP used GPS Trimble R3 and Trimble ME Base Station instruments for the survey. The contour interval is 2 m, and the data are reported in the 1994 Argentinian Zone 3 GCS POSGAR coordinate system.
9.2 Geological Mapping
Surface mapping in the Quevar South area by Silex Argentina was completed at 1:5,000 and 1:10,000 scales during campaigns from 2006 through 2008.
Surface mapping by G. Cummins in 2010 was completed at a 1:2,000 scale and compiled at a 1:5,000 scale.
Silex Argentina personnel mapped surface trenches at a 1:500 scale between 2007–2008.
Geological mapping of the adit/decline in 2011 was completed at 1:50 and 1:100 scales and compiled at a 1:500 scale by Silex Argentina personnel.
Geological mapping aided in the exploration effort by identifying the extent and zonations of that alteration related to mineralization by identifying the most favorable mineralization host unit—the epiclastic breccia volcaniclastic unit. Mapping the post-mineral volcanic units led to identification of prospective areas beneath unaltered surface exposures, especially in the Yaxtché West area.
A geological map of the Project area is included as Figure 7-4.
9.3 Geochemical Sampling
Exploration sampling was conducted by Silex Argentina from 2004–2013, with the majority of samples being collected between 2007–2008. The work programs included reconnaissance outcrop sampling using channel and select chip samples. Results from this sampling program were used to identify drill targets. In total over 3,100 surface samples have been collected from the Project area (Figure 9-1).

El Quevar Project Salta Province, Argentina
NI 43-101 Technical Report on Preliminary Economic Assessment
Page 9-2
October 2018 Project Number: 196410
Figure 9-1: Rock Chip Sampling
Note: Figure courtesy Golden Minerals, 2018.

El Quevar Project Salta Province, Argentina
NI 43-101 Technical Report on Preliminary Economic Assessment
Page 9-3
October 2018 Project Number: 196410
9.4 Geophysics
A ground-based geophysical program was completed between December 2007 and February 2008, consisting of an induced polarization (IP)/resistivity with three-dimensional (3D) pole/dipole survey over Quevar South. This work was contracted to Quantec Geoscience Argentina S.A. based in Mendoza, Argentina. Lines were oriented north–south, with line separation at 200 m, and stations at 50 m intervals along lines. The instruments used were an Iris Elrec-6 receiver and an Iris VIP 3000 transmitter. The offset dipole array provided information to approximately 600 m depth at the center of the survey.
Results of the IP survey have recently been reprocessed by EarthEx Geophysical Solutions Inc. Reprocessing of the data consisted of a new 3D inversion and interpreted cross sections throughout the survey area. Results of the interpretation include:
• A well-defined high resistivity and high chargeability anomaly coincident with mineralization at Yaxtché Central. A cross-section showing the anomaly is provided in Figure 9-2)
• A conductivity high associated with mineralization at Yaxtché West
• Identification of targets with similar geophysical signatures to those identified at Yaxtché
• Recommendations for additional geophysical work to further define prospective areas.
High priority geophysical targets generated by Golden Minerals are summarized in Table 9-1 and the target locations are provided in Figure 9-3.
The various Yaxtché deposit zones and their locations are discussed further in Section 9.8. Locations of Yaxtché West and Yaxtché Central are included in the figures in Section 10.
9.5 Pits and Trenches
Trenching was undertaken in 2007 and 2008, using a backhoe. Some encouraging results were returned; however, the method was slow, sometimes encountered thick overburden, and was discontinued.
In 2007, 16 trenches were excavated (four at Quevar North and 12 at Quevar South) with the aim of identifying and extending the known mineralized areas. Results are compiled in Table 9-2.

El Quevar Project Salta Province, Argentina
NI 43-101 Technical Report on Preliminary Economic Assessment
Page 9-4
October 2018 Project Number: 196410
Figure 9-2: Resistivity and Chargeability Anomalies Associated with the Yaxtché Central Deposit
Note: Figure courtesy Golden Minerals, 2018. Figure shows the resistivity and chargeability anomalies associated with Yaxtché Central. Grey drill hole histograms represent alteration intensity, and red histograms represent g/t silver assays.

El Quevar Project Salta Province, Argentina
NI 43-101 Technical Report on Preliminary Economic Assessment
Page 9-5
October 2018 Project Number: 196410
Table 9-1: Geophysical Targets
Target Zones Line Numbers Description
EXT02 16900–17700 A shallow, pervasive, strongly resistive area with associated anomalous chargeability present in the northwestern corner of the survey area.
EXT03 17100–17900 A well-defined resistive trend sits at shallow to moderate depth, with a strong chargeable bullseye on line 17500.
EXT04 17300–18300 A resistive and chargeable trend that connects EXT02 to Yaxtché. The trend includes a chargeable bullseye on line 17700, in a conductive area.
EXT06 17700–19100 Deep chargeable feature in a mainly conductive area below a resistive cap, similar to the signature in the down-plunge area of the Yaxtché deposit.
EXT08 18300–20300 Strongly resistive trend with chargeable feature that plunges away from the resistive feature. This well-defined trend connects the Copán and Mani prospects and has some historical drilling.
EXT09 18700–20300 A discrete resistive trend at shallow to mid-depth correlates with chargeable bullseye features. The trend lies north of the Copán trend and to the south of the Yaxtché trend. It is well defined and continues east toward the Argentina prospect.
EXT23 18700–20300 Deep chargeable feature from east end of grid near the Argentina prospect. In places correlates with a resistive feature that shows some indication of dip. May be the connecting trend between Yaxtché and Argentina.
EXT24 19300–20300 Deep chargeable feature coming from east end of grid near the Argentina prospect. Appears to connect EXT08 and EXT06 and could be related to the Copán, Mani, and Vince prospects via EXT08.
Note: Prospect locations mentioned in the table are shown on Figure 9-3.

El Quevar Project Salta Province, Argentina
NI 43-101 Technical Report on Preliminary Economic Assessment
Page 9-6
October 2018 Project Number: 196410
Figure 9-3: Quevar Interpreted Geophysical Targets
Note: Figure courtesy Golden Minerals, 2018.
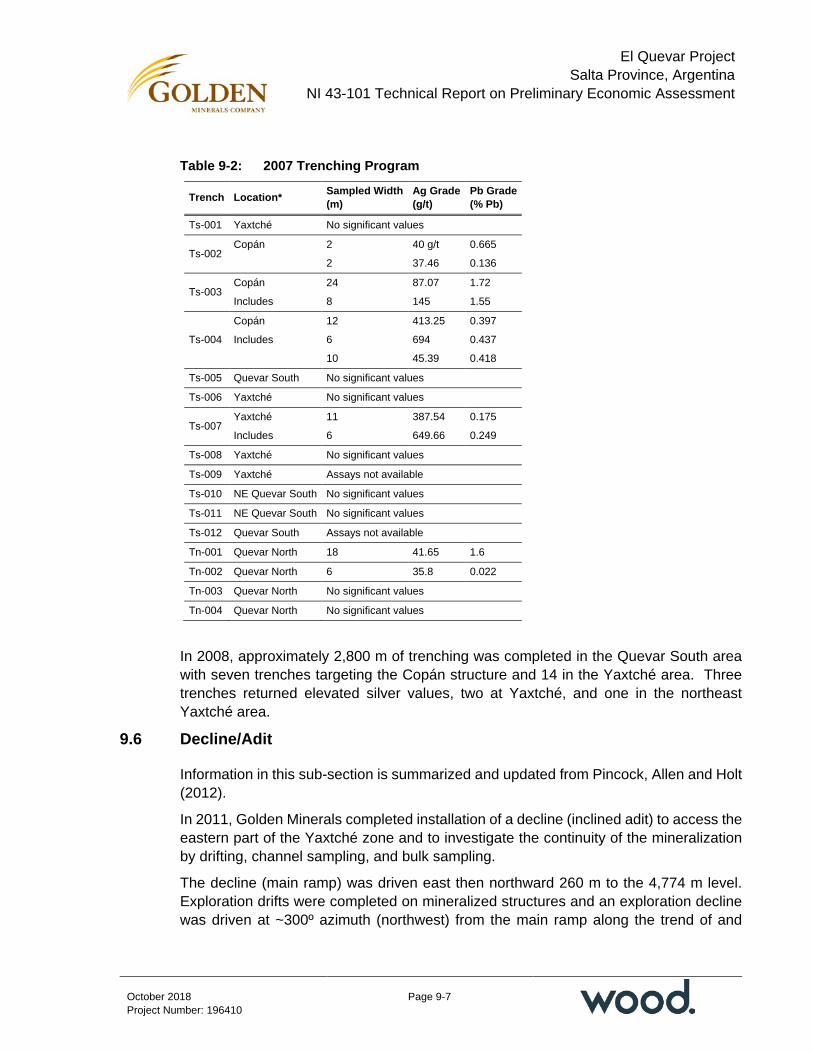
El Quevar Project Salta Province, Argentina
NI 43-101 Technical Report on Preliminary Economic Assessment
Page 9-7
October 2018 Project Number: 196410
Table 9-2: 2007 Trenching Program
Trench Location* Sampled Width (m)
Ag Grade (g/t)
Pb Grade (% Pb)
Ts-001 Yaxtché No significant values
Ts-002 Copán 2 40 g/t 0.665
2 37.46 0.136
Ts-003 Copán 24 87.07 1.72
Includes 8 145 1.55
Ts-004
Copán 12 413.25 0.397
Includes 6 694 0.437
10 45.39 0.418
Ts-005 Quevar South No significant values
Ts-006 Yaxtché No significant values
Ts-007 Yaxtché 11 387.54 0.175
Includes 6 649.66 0.249
Ts-008 Yaxtché No significant values
Ts-009 Yaxtché Assays not available
Ts-010 NE Quevar South No significant values
Ts-011 NE Quevar South No significant values
Ts-012 Quevar South Assays not available
Tn-001 Quevar North 18 41.65 1.6
Tn-002 Quevar North 6 35.8 0.022
Tn-003 Quevar North No significant values
Tn-004 Quevar North No significant values
In 2008, approximately 2,800 m of trenching was completed in the Quevar South area with seven trenches targeting the Copán structure and 14 in the Yaxtché area. Three trenches returned elevated silver values, two at Yaxtché, and one in the northeast Yaxtché area.
9.6 Decline/Adit
Information in this sub-section is summarized and updated from Pincock, Allen and Holt (2012).
In 2011, Golden Minerals completed installation of a decline (inclined adit) to access the eastern part of the Yaxtché zone and to investigate the continuity of the mineralization by drifting, channel sampling, and bulk sampling.
The decline (main ramp) was driven east then northward 260 m to the 4,774 m level. Exploration drifts were completed on mineralized structures and an exploration decline was driven at ~300º azimuth (northwest) from the main ramp along the trend of and
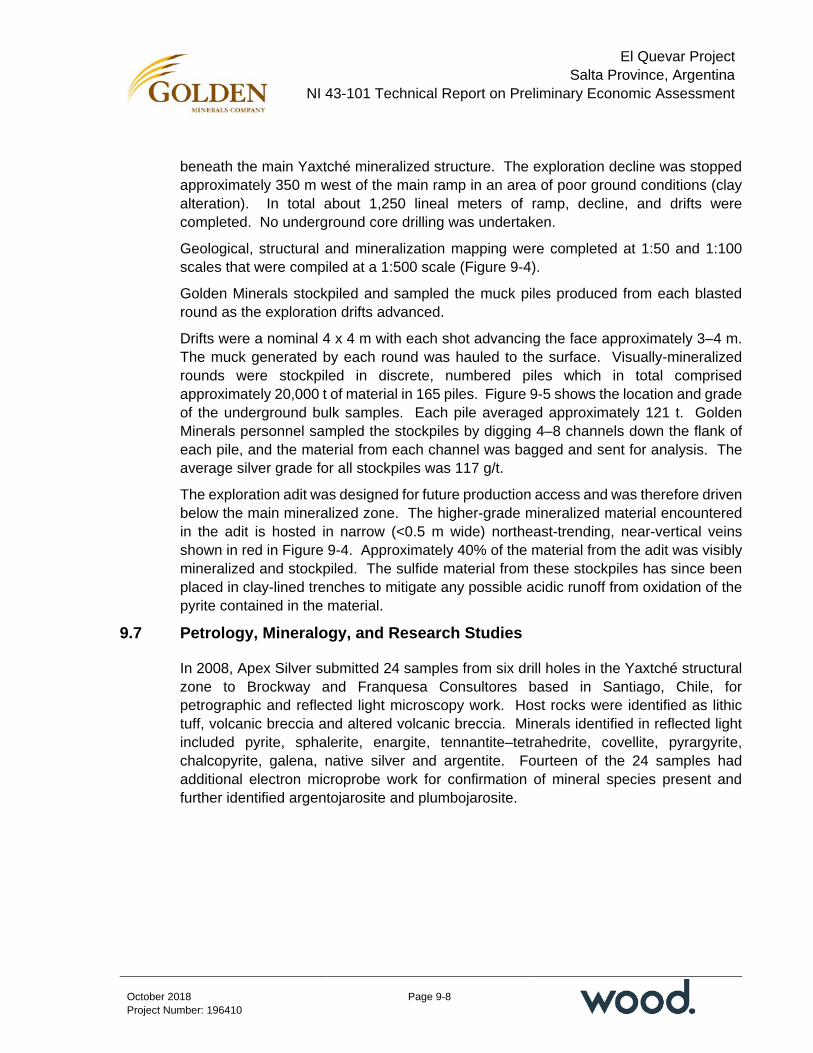
El Quevar Project Salta Province, Argentina
NI 43-101 Technical Report on Preliminary Economic Assessment
Page 9-8
October 2018 Project Number: 196410
beneath the main Yaxtché mineralized structure. The exploration decline was stopped approximately 350 m west of the main ramp in an area of poor ground conditions (clay alteration). In total about 1,250 lineal meters of ramp, decline, and drifts were completed. No underground core drilling was undertaken.
Geological, structural and mineralization mapping were completed at 1:50 and 1:100 scales that were compiled at a 1:500 scale (Figure 9-4).
Golden Minerals stockpiled and sampled the muck piles produced from each blasted round as the exploration drifts advanced.
Drifts were a nominal 4 x 4 m with each shot advancing the face approximately 3–4 m. The muck generated by each round was hauled to the surface. Visually-mineralized rounds were stockpiled in discrete, numbered piles which in total comprised approximately 20,000 t of material in 165 piles. Figure 9-5 shows the location and grade of the underground bulk samples. Each pile averaged approximately 121 t. Golden Minerals personnel sampled the stockpiles by digging 4–8 channels down the flank of each pile, and the material from each channel was bagged and sent for analysis. The average silver grade for all stockpiles was 117 g/t.
The exploration adit was designed for future production access and was therefore driven below the main mineralized zone. The higher-grade mineralized material encountered in the adit is hosted in narrow (<0.5 m wide) northeast-trending, near-vertical veins shown in red in Figure 9-4. Approximately 40% of the material from the adit was visibly mineralized and stockpiled. The sulfide material from these stockpiles has since been placed in clay-lined trenches to mitigate any possible acidic runoff from oxidation of the pyrite contained in the material.
9.7 Petrology, Mineralogy, and Research Studies
In 2008, Apex Silver submitted 24 samples from six drill holes in the Yaxtché structural zone to Brockway and Franquesa Consultores based in Santiago, Chile, for petrographic and reflected light microscopy work. Host rocks were identified as lithic tuff, volcanic breccia and altered volcanic breccia. Minerals identified in reflected light included pyrite, sphalerite, enargite, tennantite–tetrahedrite, covellite, pyrargyrite, chalcopyrite, galena, native silver and argentite. Fourteen of the 24 samples had additional electron microprobe work for confirmation of mineral species present and further identified argentojarosite and plumbojarosite.
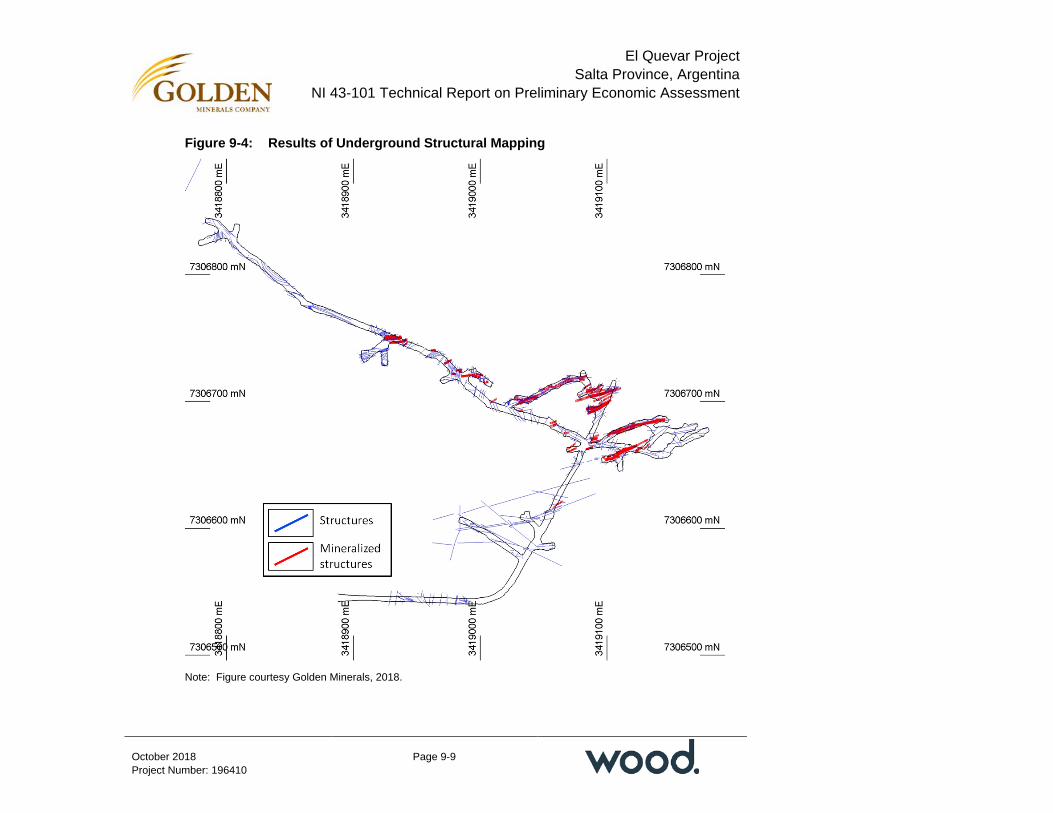
El Quevar Project Salta Province, Argentina
NI 43-101 Technical Report on Preliminary Economic Assessment
Page 9-9
October 2018 Project Number: 196410
Figure 9-4: Results of Underground Structural Mapping
Note: Figure courtesy Golden Minerals, 2018.

El Quevar Project Salta Province, Argentina
NI 43-101 Technical Report on Preliminary Economic Assessment
Page 9-10
October 2018 Project Number: 196410
Figure 9-5: Plan Map Showing Location and Silver Grade of Underground Bulk Samples
Note: Figure courtesy Golden Minerals, 2018. Silver values shown in g/t.

El Quevar Project Salta Province, Argentina
NI 43-101 Technical Report on Preliminary Economic Assessment
Page 9-11
October 2018 Project Number: 196410
In 2009, petrological and mineralogical examination of eight drill core samples from two diamond drill holes were analyzed by Dr. B.J. Barron, a consulting petrologist. The suite of samples was collected from drill holes QVD-036 and QVD-041, both drilled at the eastern end of the Yaxtché Central area. QVD-036 was drilled within the near-surface mineralized area of the Yaxtché structure, whereas QVD-041 was drilled approximately 200 m northeast and intersected the structure below the primary silver mineralization at Yaxtché Central.
X-ray diffraction (XRD) and field portable spectrographic analyses (PIMA) were reported for the same suite of samples by Lantana Exploration in 2009. The main minerals identified were: quartz, plagioclase feldspar, K feldspar, smectite, illite, kaolinite, dickite, calcite, alunite, pyrite, enargite, and barite. Results indicated that “the silicate, sulphide, and sulphate mineral components and assemblages are consistent with alteration types that occur in high sulphidation systems” (Camuti, 2009).
In 2010, 28 samples from 21 holes along the Yaxtché structure were submitted to Applied Petrologic Services & Research in Wanaka, New Zealand. The study concluded that “gangue and mineralization mineralogy at Yaxtché are indicative of a high sulfidation epithermal system and chemical zonation defines a trend of decreasing sulfidation state as the ore-bearing fluids traveled upwards in a northwesterly direction along the Yaxtché structure”. Additional findings included (Coote, 2010):
• Petrological studies of diamond core identified silver-bearing and bismuth-rich sulfosalts related to a lateral and vertical variation in the sulfidation state as defined by the distribution of hypogene enargite–luzonite and tennantite–tetrahedrite
• Alteration and mineralization are developed locally in hydrothermally-brecciated and more extensively in tectonically shear/fragmented dacite/rhyodacite lithic fragmental textured rocks with a compositional and textural variation to indicate the rocks comprise a mixture of epiclastic and pyroclastic rocks and possible high-level intrusion breccias. The presence of eutaxitic lithic textures support the interpretation of pyroclastic rocks being present along the length of the Yaxtché structure
• Pervasive quartz, alunite, kaolin clay (locally dickite), and alunite together with pyrite and rutile define the acidic hydrothermal alteration. The crystallinity of the hydrothermal wall rock replacement and fracture/cavity-fill minerals together with the composition and morphology of the fluid inclusions in the hydrothermal quartz indicate wall rock interaction with hydrothermal fluids of pH less than four and temperatures between 200 and 230ºC
• Abundant enargite, luzonite, tennantite, and tetrahedrite intergrown with the acid alteration mineralogy defines a high sulfidation epithermal system. Native gold is intergrown with both enargite–luzonite and tennantite–tetrahedrite. Silver mineralization is mostly in the form of variably silver-rich, complex Ag–Cu–Sb–
El Quevar Project Salta Province, Argentina
NI 43-101 Technical Report on Preliminary Economic Assessment
Page 9-12
October 2018 Project Number: 196410
Pb–Bi sulfosalts that are associated with enargite–luzonite and tennantite–tetrahedrite and related acid alteration mineralogy. Zinc mineralization is defined by sphalerite mostly occurring as intergrowths with tennantite–tetrahedrite together with minor to trace amounts of argentite
• The distribution of silver relative to copper can be related to a spatial and temporal chemical zonation within the high-sulfidation system along the Yaxtché structural trend as defined by the distribution of enargite–luzonite and tennantite–tetrahedrite. The distribution of enargite–luzonite and tennantite–tetrahedrite can be interpreted in terms of a decrease in sulfidation state of hot acid fluids with time and elevation as they travelled upwards and in a north-westerly direction along the Yaxtché structure
• The complex geochemistry of the high-sulfidation system, including lead, zinc and silver, might in part be the result of remobilization of metals from a pre-existing mineralized source by hot acid fluids themselves entraining metals of magmatic source.
More recently, 13 polished sections were prepared at Spectrum Petrographics in Vancouver, Washington. The sections were taken from mineralized intervals from seven drill holes along a single cross-section from Yaxtché West. Six of the samples have been submitted to Colorado School of Mines for automated mineralogy analysis, using quantitative evaluation of minerals by scanning electron microscopy (QEMSCAN) and this work is ongoing.
The goals of the current study are to:
• Quantify the mineral assemblages for intervals with varying metal contents found at different elevations within the Yaxtché structure
• Provide paragenetic information between different minerals and mineral assemblages.
A preliminary image from this work is provided in Figure 9-6.
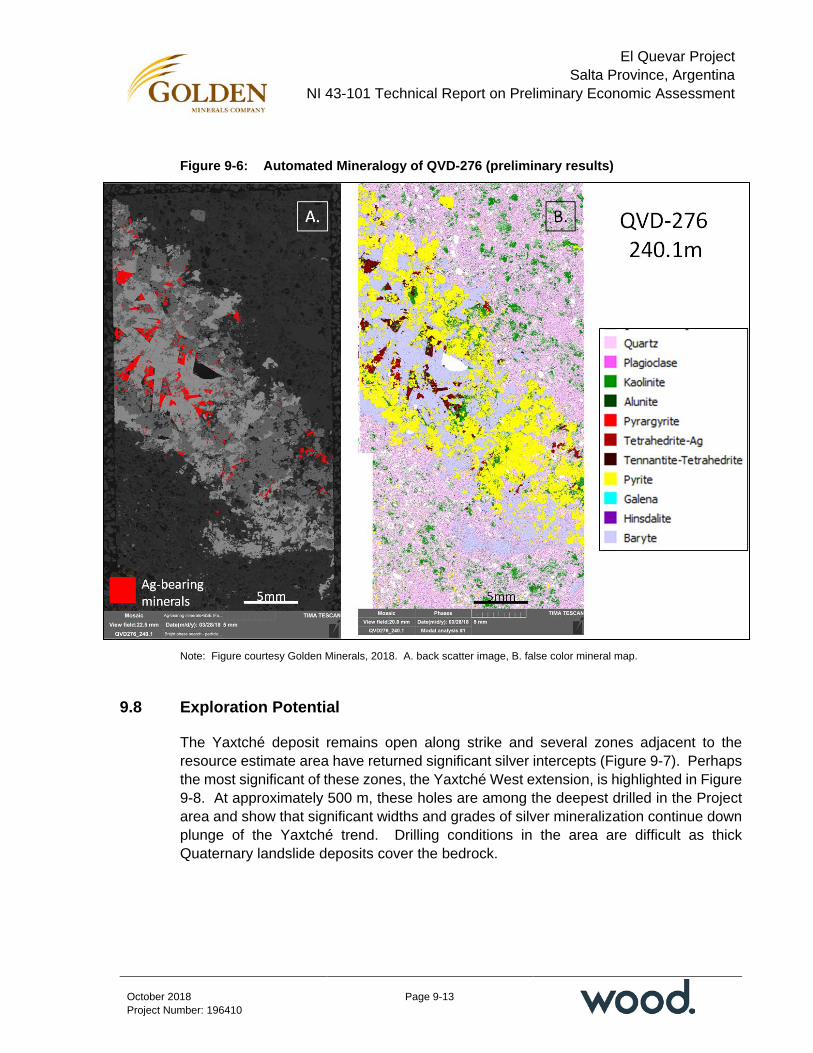
El Quevar Project Salta Province, Argentina
NI 43-101 Technical Report on Preliminary Economic Assessment
Page 9-13
October 2018 Project Number: 196410
Figure 9-6: Automated Mineralogy of QVD-276 (preliminary results)
Note: Figure courtesy Golden Minerals, 2018. A. back scatter image, B. false color mineral map.
9.8 Exploration Potential
The Yaxtché deposit remains open along strike and several zones adjacent to the resource estimate area have returned significant silver intercepts (Figure 9-7). Perhaps the most significant of these zones, the Yaxtché West extension, is highlighted in Figure 9-8. At approximately 500 m, these holes are among the deepest drilled in the Project area and show that significant widths and grades of silver mineralization continue down plunge of the Yaxtché trend. Drilling conditions in the area are difficult as thick Quaternary landslide deposits cover the bedrock.

El Quevar Project Salta Province, Argentina
NI 43-101 Technical Report on Preliminary Economic Assessment
Page 9-14
October 2018 Project Number: 196410
Figure 9-7: Plan Map Showing Exploration Potential Relative to Yaxtché 150 g/t Ag Grade Shell
Note: Figure courtesy Golden Minerals, 2018.
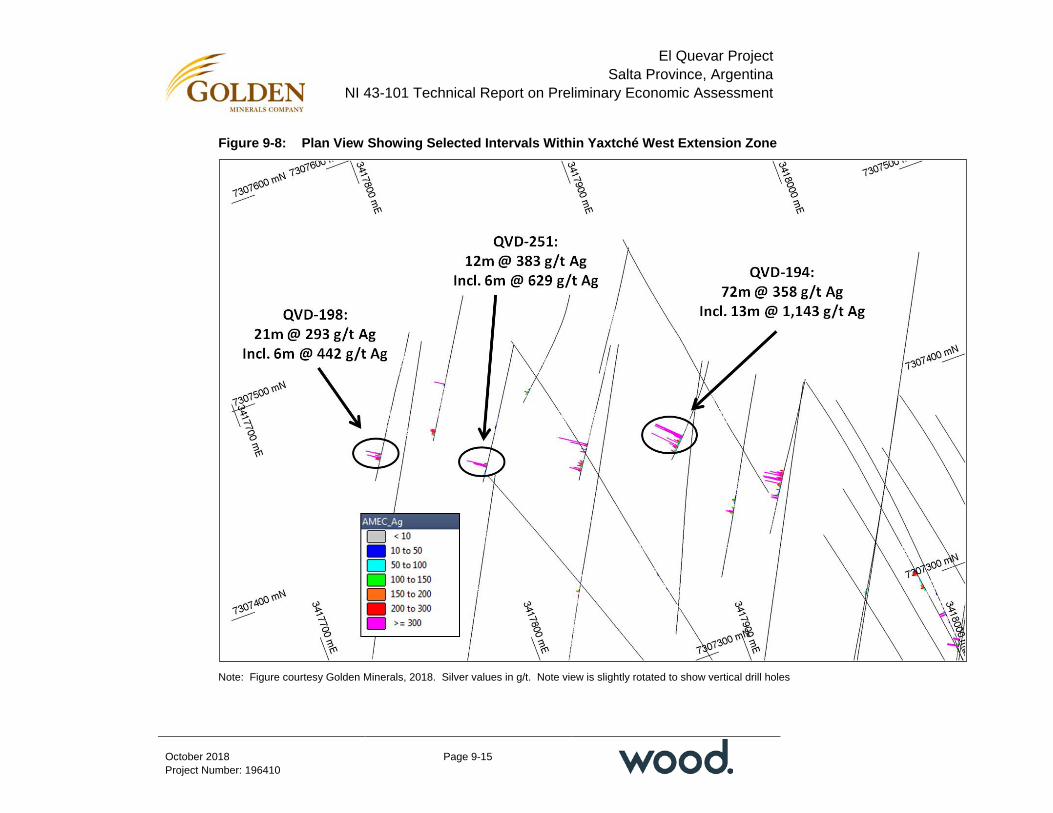
El Quevar Project Salta Province, Argentina
NI 43-101 Technical Report on Preliminary Economic Assessment
Page 9-15
October 2018 Project Number: 196410
Figure 9-8: Plan View Showing Selected Intervals Within Yaxtché West Extension Zone
Note: Figure courtesy Golden Minerals, 2018. Silver values in g/t. Note view is slightly rotated to show vertical drill holes
El Quevar Project Salta Province, Argentina
NI 43-101 Technical Report on Preliminary Economic Assessment
Page 9-16
October 2018 Project Number: 196410
Within the greater Quevar South area, several additional prospects have been identified (Figure 9-9) and remain to be fully tested. These targets have been identified through various efforts, most notably that of Corbett (2009), Corbett (2012), and Spurney et al., (2013).
A summary of selected targets is provided in Table 9-3 (after Spurney et al., 2013). These targets are considered to be the highest priority as previous exploration has identified styles of mineralization, alteration, and lithologies similar to those at Yaxtché.
Collar information for the drill intercepts shown in Figure 9-8 and Figure 9-9 and mentioned in Table 9-3 are provided in Table 9-4.
9.9 Comments on Section 9
Exploration to date has identified the Yaxtché deposit and a number of regional targets, and the Project area retains significant exploration potential.
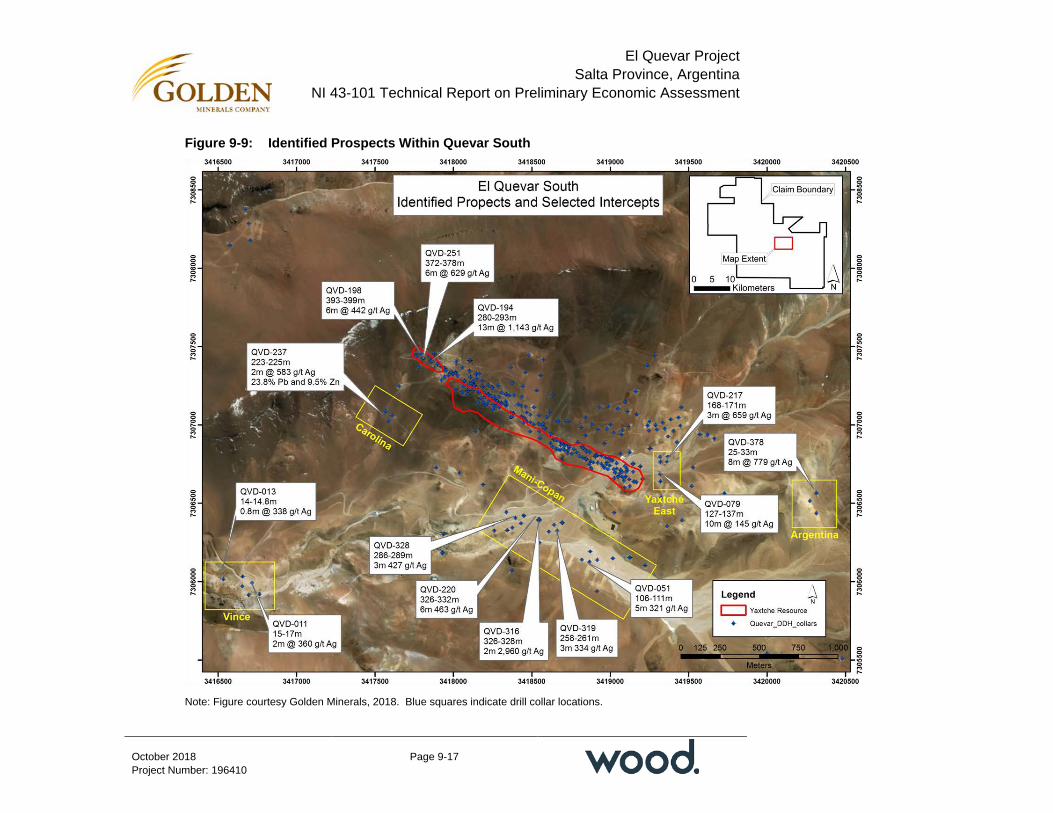
El Quevar Project Salta Province, Argentina
NI 43-101 Technical Report on Preliminary Economic Assessment
Page 9-17
October 2018 Project Number: 196410
Figure 9-9: Identified Prospects Within Quevar South
Note: Figure courtesy Golden Minerals, 2018. Blue squares indicate drill collar locations.

El Quevar Project Salta Province, Argentina
NI 43-101 Technical Report on Preliminary Economic Assessment
Page 9-18
October 2018 Project Number: 196410
Table 9-3: Prospects Within Quevar South
Prospect Notes
Yaxtché East
Limited drilling (six holes) has been completed east of the current Yaxtché resource. Significant drill intercepts include QVD-079, drilled approximately 140 m east of Yaxtché Central which intercepted 10 m of 145 g/t Ag. A further 50 m east, QVD-217 intersected a 3 m interval grading 659 g/t from 168–171 m, including a 1 m interval of 1,831 g/t Ag. Other drill holes in the vicinity returned only low grade or anomalous silver mineralization, suggesting the geometry and/or controls of mineralization remain uncertain.
Argentina
Located approximately 1,100 m east of Yaxtché Central, the Argentina area has seen only limited exploration consisting of surface mapping/sampling, trenching, and three closely-spaced drill holes (QVD-02, QVD-32, and QVD-378). QVD-378 returned an 8 m wide intercept from 25–33 m grading 779 g/t Ag. The remaining drill holes appeared to have missed the structure altogether with no significant values reported from QVD-02, and a low-grade intercept returned from QVD-32. The interval was hosted in dacite and epiclastics cut by hydrothermal breccias exhibiting silicification and advanced argillic alteration. The zone lies along the eastern strike projection of the Yaxtché mineralized trend and contains similar lithologies, alteration styles and, potentially, silver grades.
Vince
The exploration target at Vince in map view consists of an arcuate, convex to the south, zone of silicification approximately 800 m long, with silver-bearing, quartz–barite–galena–sulfosalt mineralization in a thick dacite porphyry flow sequence (Figure 9-10). Surface sampling along a linear trend of subcrop has returned strongly anomalous results with many silver values in the 200–2,000 g/t range. Six widely-spaced drill holes testing this zone had varied success with two holes encountering thin zones of silver mineralization including 2 m of 360 g/t Ag from 15–17 m in QVD-011 and 0.8 m of 338 g/t Ag from 14–14.8 m in QVD-013. The remaining holes, QVD-017 and QVD-012 returned only minor anomalous silver values.
Mani–Copán
The Mani structural zone is located approximately 700 m southwest of Yaxtché and was an area of historic silver mining along high-grade structures. Sillitoe (1975) reported that small scale historic production was estimated to have produced approximately 3,000 t averaging 8% Pb and 2,000 g/t Ag. The Mani structure and its southeast extension (known as the Copán target) have been variably defined through surface sampling and drilling over a strike length of approximately 1,100 m. Limited drilling along the strike length has had varied results with intermittent high-grade and barren intercepts. A tight cluster of five drill holes with average spacing of approximately 10 m were collared approximately 650 m from the historic mine workings. These drill holes highlight the locally high-grade nature of mineralization within the Mani structure, with example intercepts including: 6 m of 463 g/t Ag, 0.73% Cu from 326–332 m in QVD-220; and 2 m of 2,960 g/t Ag, 1.6% Cu from 326–328 m in QVD-316.
Carolina
Located 300 m southwest of Yaxtché West and covered by >50 m of overburden, four drill holes have tested the Carolina prospect. Only one of these holes intersected the targeted structure and thus its orientation remains to be defined. Assay results from the Carolina structure include 1 8 m at 193 g/t Ag, 7.8% Pb, 4.5% Zn from 207–225 m in drill hole QVD-237. Within this interval a 2 m wide high-grade zone containing abundant galena and sphalerite returned 583 g/t Ag, 23.8% Pb and 9.5% Zn from 223–225 m. No other drill holes returned significant silver values.

El Quevar Project Salta Province, Argentina
NI 43-101 Technical Report on Preliminary Economic Assessment
Page 9-19
October 2018 Project Number: 196410
Table 9-4: Drill Intercepts for Drill Holes and Prospects Identified in Figure 9-8 and Figure 9-9
Drill Hole ID Target Easting
(X) Northing (Y)
Elevation (Z)
Azimuth (º)
Dip (º)
Total Hole Depth (m)
Intercept Depth From (m)
Intercept Depth To (m)
Silver Grade (g/t Ag)
QVD-237
Carolina
3417566.20 7307088.15 4761.27 208 -61 416.5 219 225 308.5
QVD-248 3417610.09 7307061.25 4752.65 208 -61 206.35 NSV
QVD-334 3417588.88 7307025.29 4749.84 162 -60 286.5 NSV
QVD-011
Vince
3416715.01 7305992.50 4557.42 180 -50 129.4 15 17 359.5
QVD-012 3416653.66 7305971.47 4555.47 180 -60 140.3 NSV
QVD-013 3416531.76 7306016.40 4523.64 180 -63 89.5 14 14.8 338.0
QVD-017 3416656.05 7306032.67 4557.43 180 -58 89.3 NSV
QVD-028 3416694.63 7305913.79 4533.27 0 -90 77 NSV
QVD-029 3416764.34 7305920.30 4539.63 0 -60 55.75 NSV
QVD-079
Yaxtché East
3419319.15 7306686.27 4868.89 180 -65 332 128 129 404.7
QVD-079 Incl. 133 134 606.7
QVD-183 3419320.09 7306640.05 4870.83 180 -65 204.5 NSV
QVD-208 3419317.67 7306795.66 4872.02 180 -65 434 NSV
QVD-212 3419368.98 7306798.25 4885.38 180 -65 440 NSV
QVD-214 3419320.04 7306764.36 4869.04 180 -60 365 NSV
QVD-217 3419361.48 7306764.85 4879.98 180 -58 420 167 177 375.6
QVD-002
Argentina
3420977.00 7310927.00 5110.7 145 -55 101 NSV
QVD-032 3420274.12 7306515.16 4981.56 180 -55 109.5 NSV
QVD-378 3420315.00 7306565.00 4996 190 -60 143 25 33 779.4
QVD-014
Copan
3418916.88 7305939.87 4807.47 0 -59 130 NSV
QVD-051 3418868.64 7306126.52 4775.53 180 -58 155 15 16 323.0
QVD-051 Incl. 105 111 295.3
QVD-055 3418917.44 7306137.83 4777.43 180 -45 155 29 30 319.0
QVD-056 3418820.23 7306140.00 4773.15 180 -54 160 NSV
QVD-057 3418872.86 7306192.68 4773.71 180 -55 250 159 160 244.0
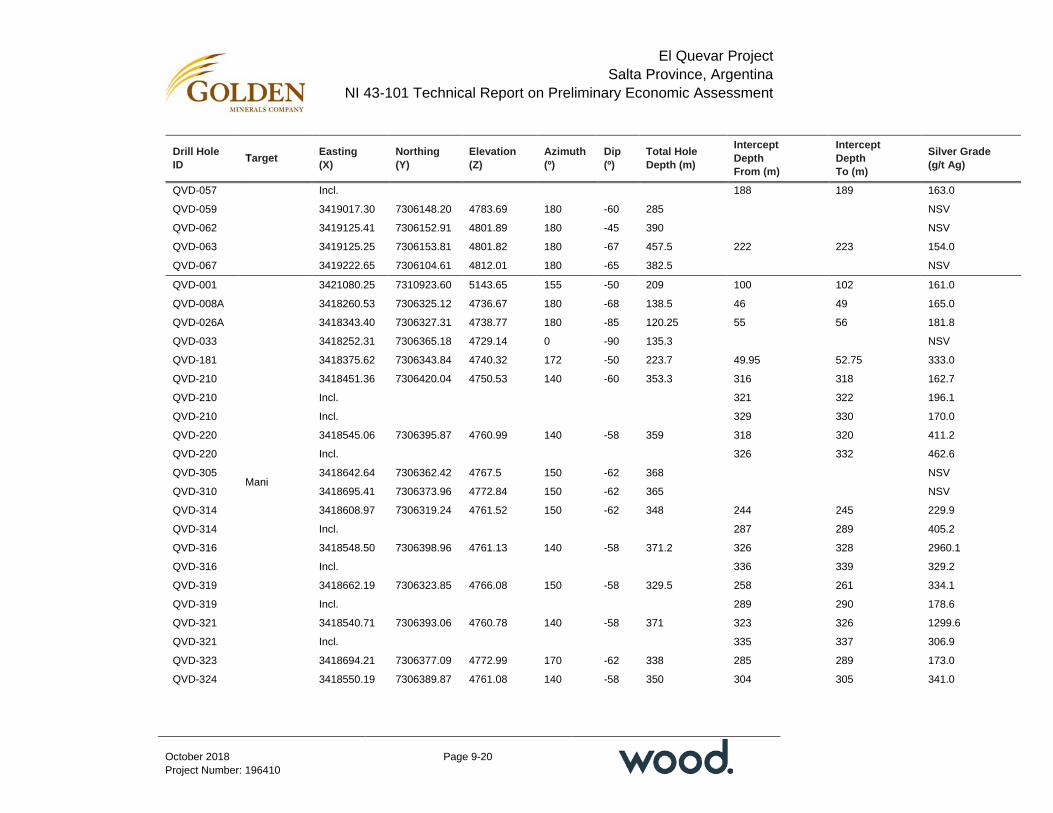
El Quevar Project Salta Province, Argentina
NI 43-101 Technical Report on Preliminary Economic Assessment
Page 9-20
October 2018 Project Number: 196410
Drill Hole ID Target Easting
(X) Northing (Y)
Elevation (Z)
Azimuth (º)
Dip (º)
Total Hole Depth (m)
Intercept Depth From (m)
Intercept Depth To (m)
Silver Grade (g/t Ag)
QVD-057 Incl. 188 189 163.0
QVD-059 3419017.30 7306148.20 4783.69 180 -60 285 NSV
QVD-062 3419125.41 7306152.91 4801.89 180 -45 390 NSV
QVD-063 3419125.25 7306153.81 4801.82 180 -67 457.5 222 223 154.0
QVD-067 3419222.65 7306104.61 4812.01 180 -65 382.5 NSV
QVD-001
Mani
3421080.25 7310923.60 5143.65 155 -50 209 100 102 161.0
QVD-008A 3418260.53 7306325.12 4736.67 180 -68 138.5 46 49 165.0
QVD-026A 3418343.40 7306327.31 4738.77 180 -85 120.25 55 56 181.8
QVD-033 3418252.31 7306365.18 4729.14 0 -90 135.3 NSV
QVD-181 3418375.62 7306343.84 4740.32 172 -50 223.7 49.95 52.75 333.0
QVD-210 3418451.36 7306420.04 4750.53 140 -60 353.3 316 318 162.7
QVD-210 Incl. 321 322 196.1
QVD-210 Incl. 329 330 170.0
QVD-220 3418545.06 7306395.87 4760.99 140 -58 359 318 320 411.2
QVD-220 Incl. 326 332 462.6
QVD-305 3418642.64 7306362.42 4767.5 150 -62 368 NSV
QVD-310 3418695.41 7306373.96 4772.84 150 -62 365 NSV
QVD-314 3418608.97 7306319.24 4761.52 150 -62 348 244 245 229.9
QVD-314 Incl. 287 289 405.2
QVD-316 3418548.50 7306398.96 4761.13 140 -58 371.2 326 328 2960.1
QVD-316 Incl. 336 339 329.2
QVD-319 3418662.19 7306323.85 4766.08 150 -58 329.5 258 261 334.1
QVD-319 Incl. 289 290 178.6
QVD-321 3418540.71 7306393.06 4760.78 140 -58 371 323 326 1299.6
QVD-321 Incl. 335 337 306.9
QVD-323 3418694.21 7306377.09 4772.99 170 -62 338 285 289 173.0
QVD-324 3418550.19 7306389.87 4761.08 140 -58 350 304 305 341.0
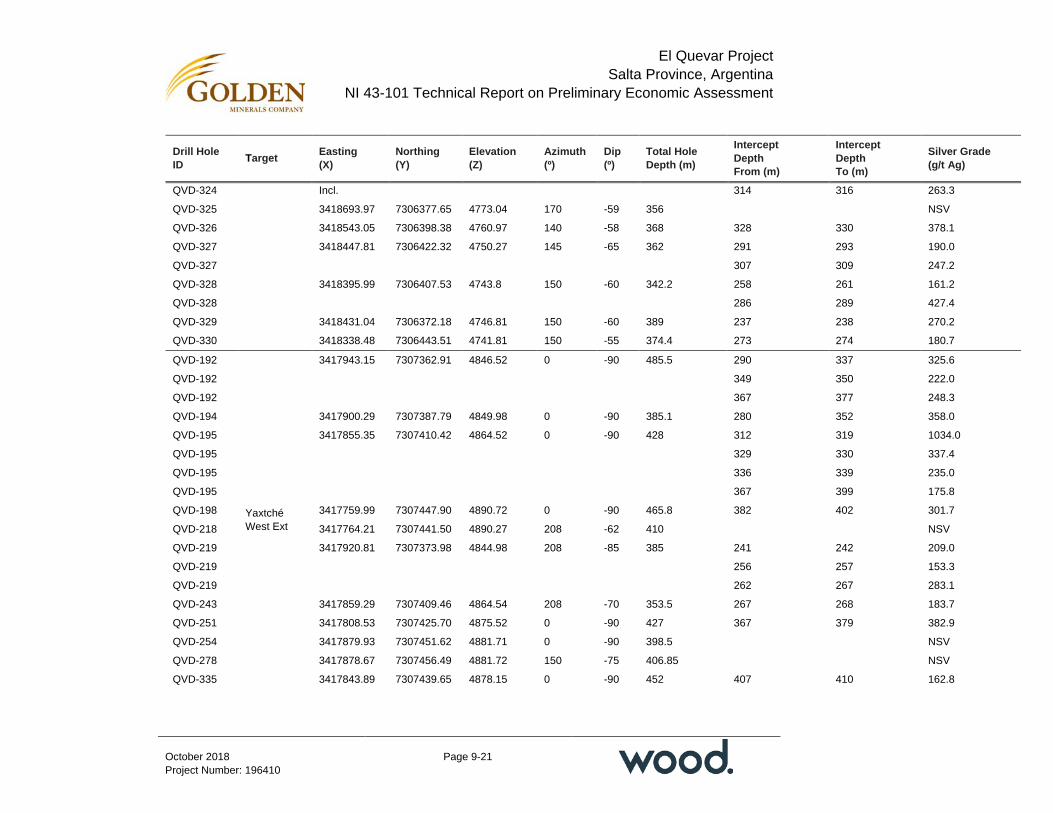
El Quevar Project Salta Province, Argentina
NI 43-101 Technical Report on Preliminary Economic Assessment
Page 9-21
October 2018 Project Number: 196410
Drill Hole ID Target Easting
(X) Northing (Y)
Elevation (Z)
Azimuth (º)
Dip (º)
Total Hole Depth (m)
Intercept Depth From (m)
Intercept Depth To (m)
Silver Grade (g/t Ag)
QVD-324 Incl. 314 316 263.3
QVD-325 3418693.97 7306377.65 4773.04 170 -59 356 NSV
QVD-326 3418543.05 7306398.38 4760.97 140 -58 368 328 330 378.1
QVD-327 3418447.81 7306422.32 4750.27 145 -65 362 291 293 190.0
QVD-327 307 309 247.2
QVD-328 3418395.99 7306407.53 4743.8 150 -60 342.2 258 261 161.2
QVD-328 286 289 427.4
QVD-329 3418431.04 7306372.18 4746.81 150 -60 389 237 238 270.2
QVD-330 3418338.48 7306443.51 4741.81 150 -55 374.4 273 274 180.7
QVD-192
Yaxtché West Ext
3417943.15 7307362.91 4846.52 0 -90 485.5 290 337 325.6
QVD-192 349 350 222.0
QVD-192 367 377 248.3
QVD-194 3417900.29 7307387.79 4849.98 0 -90 385.1 280 352 358.0
QVD-195 3417855.35 7307410.42 4864.52 0 -90 428 312 319 1034.0
QVD-195 329 330 337.4
QVD-195 336 339 235.0
QVD-195 367 399 175.8
QVD-198 3417759.99 7307447.90 4890.72 0 -90 465.8 382 402 301.7
QVD-218 3417764.21 7307441.50 4890.27 208 -62 410 NSV
QVD-219 3417920.81 7307373.98 4844.98 208 -85 385 241 242 209.0
QVD-219 256 257 153.3
QVD-219 262 267 283.1
QVD-243 3417859.29 7307409.46 4864.54 208 -70 353.5 267 268 183.7
QVD-251 3417808.53 7307425.70 4875.52 0 -90 427 367 379 382.9
QVD-254 3417879.93 7307451.62 4881.71 0 -90 398.5 NSV
QVD-278 3417878.67 7307456.49 4881.72 150 -75 406.85 NSV
QVD-335 3417843.89 7307439.65 4878.15 0 -90 452 407 410 162.8
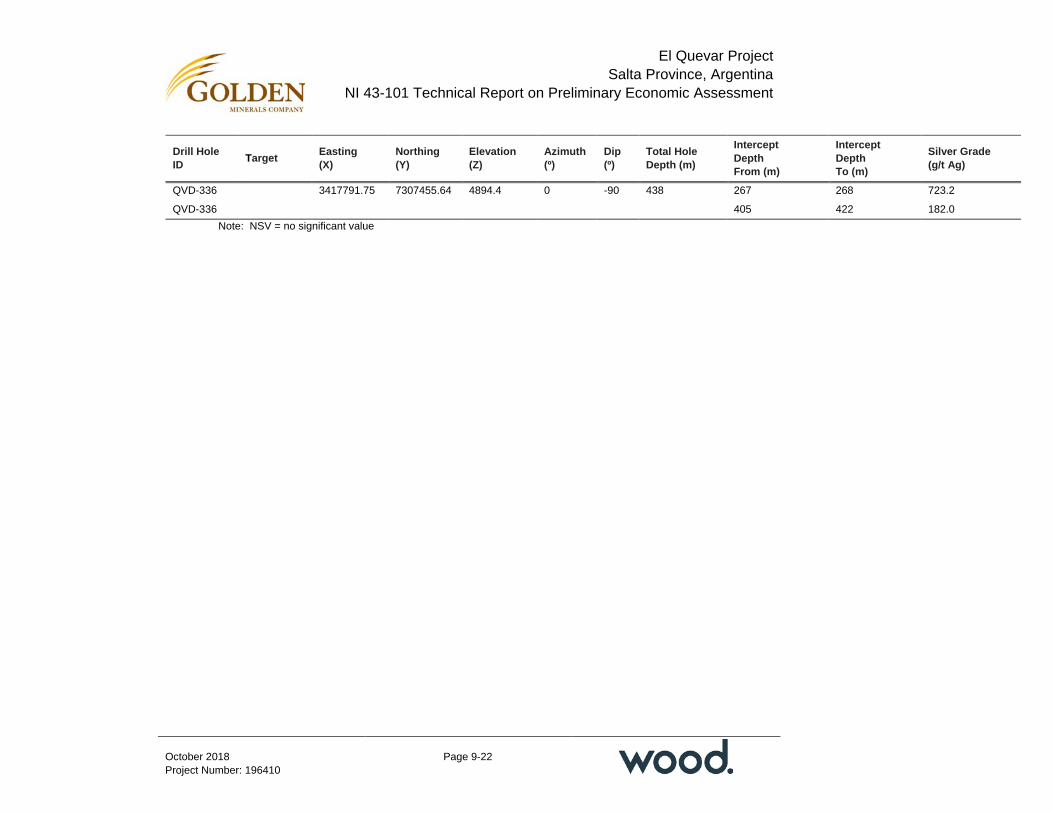
El Quevar Project Salta Province, Argentina
NI 43-101 Technical Report on Preliminary Economic Assessment
Page 9-22
October 2018 Project Number: 196410
Drill Hole ID Target Easting
(X) Northing (Y)
Elevation (Z)
Azimuth (º)
Dip (º)
Total Hole Depth (m)
Intercept Depth From (m)
Intercept Depth To (m)
Silver Grade (g/t Ag)
QVD-336 3417791.75 7307455.64 4894.4 0 -90 438 267 268 723.2
QVD-336 405 422 182.0 Note: NSV = no significant value
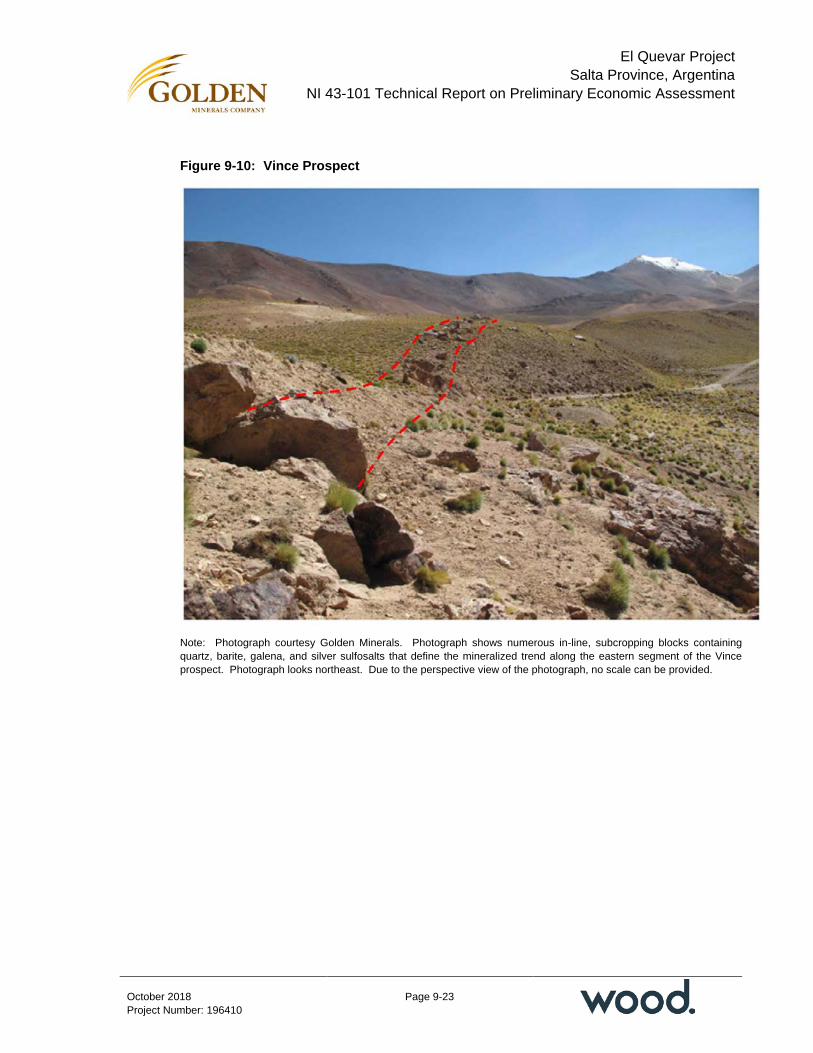
El Quevar Project Salta Province, Argentina
NI 43-101 Technical Report on Preliminary Economic Assessment
Page 9-23
October 2018 Project Number: 196410
Figure 9-10: Vince Prospect
Note: Photograph courtesy Golden Minerals. Photograph shows numerous in-line, subcropping blocks containing quartz, barite, galena, and silver sulfosalts that define the mineralized trend along the eastern segment of the Vince prospect. Photograph looks northeast. Due to the perspective view of the photograph, no scale can be provided.

El Quevar Project Salta Province, Argentina
NI 43-101 Technical Report on Preliminary Economic Assessment
Page 10-1
October 2018 Project Number: 196410
10.0 DRILLING
10.1 Introduction
Two drill programs were completed by Fabricaciones Militares and BHP-Utah Minerals International in the 1970s. Six to seven drill holes appear to have been competed, but meterages are not known. There is no other available information on these programs.
Apex Silver and Golden Minerals completed drill campaigns from 2006–2013 (Table 10-1). These programs total 417 holes for 104,163 m. There has been no drilling on the Project since 2013.
Figure 10-1 is a drill collar location plan that shows all drilling within the Project. Figure 10-2 shows the drilling in the Yaxtché deposit area.
10.2 Drill Methods
Table 10-2 summarizes the drilling companies that completed the core drilling, where known.
Core has primarily been drilled at HQ size (63.5 mm core diameter). Occasional reductions to NQ size (47.6 mm) occurred in areas of poor ground conditions. Two drill holes, QPD-01 and QPD-02, of PQ size (85 mm diameter) were completed in 2011.
10.3 Logging Procedures
10.3.1 2006–2008 Drill Campaign
Information in this sub-section for the 2006–2008 drill campaigns is summarized from SRK (2009).
Core was placed in wooden boxes at the rig and moved to the core shed under the supervision of an operations chief or a technician. The core was either in the custody of the drilling contractor or Silex Argentina at all times.
The technician recorded hole number, start and end intervals, and marked up meter intervals on the core boxes. Geotechnical information such as recovery, rock quality designation (RQD) and mechanical and physical fracture frequency was recorded.
Geological logging was completed on paper sheets and later transferred to a database. The paper log had sections for comments and a graphic log with a separate area for drawing fractures. Mineralization, alteration and alteration intensity were recorded on the log sheet and there was an area for sample interval, sample number and analytical results. The geologist marked the core for any additional observations including PIMA measurements.

El Quevar Project Salta Province, Argentina
NI 43-101 Technical Report on Preliminary Economic Assessment
Page 10-2
October 2018 Project Number: 196410
Table 10-1: Drill Program Summary Table
Year Company Number of Drill Holes Meters Drilled
1970s Fabricaciones Militares 3 or 4 Unknown
1970s BHP-Utah Minerals International 3 Unknown
1997 Minera Hochschild 6 582
2006 Apex Silver 19 2,377
2007 Apex Silver 19 2,482
2008 Apex Silver 43 10,651
2009 Apex Silver 114 23,111
2010 Golden Minerals 67 20,302
2011 Golden Minerals 118 37,792
2012 Golden Minerals 28 6,434
2013 Golden Minerals 3 432
417 104,163 Note: totals do not sum due to uncertainties with legacy information from the 1970s. Totals reflect only Apex Silver and Golden Minerals drill programs.

El Quevar Project Salta Province, Argentina
NI 43-101 Technical Report on Preliminary Economic Assessment
Page 10-3
October 2018 Project Number: 196410
Figure 10-1: Regional Drill Hole Location Plan
Note: Figure courtesy Golden Minerals, 2018.

El Quevar Project Salta Province, Argentina
NI 43-101 Technical Report on Preliminary Economic Assessment
Page 10-4
October 2018 Project Number: 196410
Figure 10-2: Yaxtché Deposit Drill Hole Location Plan
Note: Figure courtesy Golden Minerals, 2018.
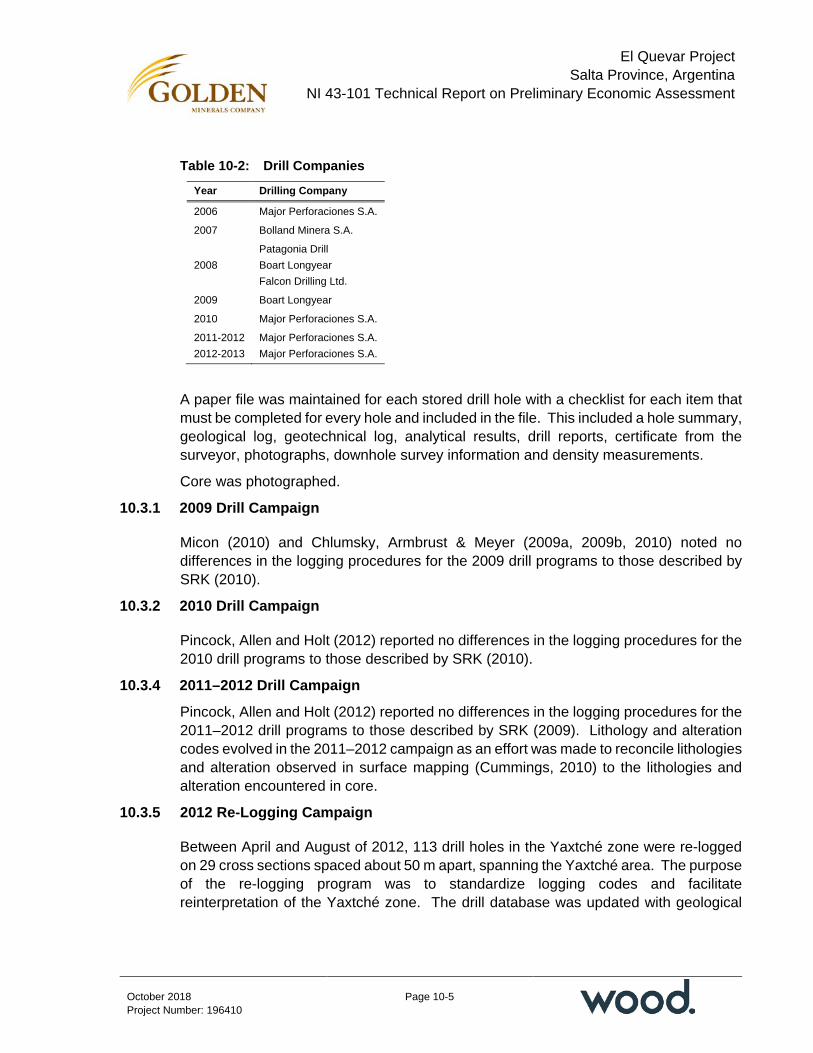
El Quevar Project Salta Province, Argentina
NI 43-101 Technical Report on Preliminary Economic Assessment
Page 10-5
October 2018 Project Number: 196410
Table 10-2: Drill Companies
Year Drilling Company
2006 Major Perforaciones S.A.
2007 Bolland Minera S.A.
2008 Patagonia Drill Boart Longyear Falcon Drilling Ltd.
2009 Boart Longyear
2010 Major Perforaciones S.A.
2011-2012 2012-2013
Major Perforaciones S.A. Major Perforaciones S.A.
A paper file was maintained for each stored drill hole with a checklist for each item that must be completed for every hole and included in the file. This included a hole summary, geological log, geotechnical log, analytical results, drill reports, certificate from the surveyor, photographs, downhole survey information and density measurements.
Core was photographed.
10.3.1 2009 Drill Campaign
Micon (2010) and Chlumsky, Armbrust & Meyer (2009a, 2009b, 2010) noted no differences in the logging procedures for the 2009 drill programs to those described by SRK (2010).
10.3.2 2010 Drill Campaign
Pincock, Allen and Holt (2012) reported no differences in the logging procedures for the 2010 drill programs to those described by SRK (2010).
10.3.4 2011–2012 Drill Campaign
Pincock, Allen and Holt (2012) reported no differences in the logging procedures for the 2011–2012 drill programs to those described by SRK (2009). Lithology and alteration codes evolved in the 2011–2012 campaign as an effort was made to reconcile lithologies and alteration observed in surface mapping (Cummings, 2010) to the lithologies and alteration encountered in core.
10.3.5 2012 Re-Logging Campaign
Between April and August of 2012, 113 drill holes in the Yaxtché zone were re-logged on 29 cross sections spaced about 50 m apart, spanning the Yaxtché area. The purpose of the re-logging program was to standardize logging codes and facilitate reinterpretation of the Yaxtché zone. The drill database was updated with geological
El Quevar Project Salta Province, Argentina
NI 43-101 Technical Report on Preliminary Economic Assessment
Page 10-6
October 2018 Project Number: 196410
codes based on the re-logging effort. Generation and interpretation of geological and geochemical cross sections at 1:1,500 scale was completed. as well as level plan maps in order to show the trend in the distribution of mineralization.
10.3.6 2012–2013 Drill Campaign
Methodology of drill core handling, logging and sampling followed the procedures described from the 2006–2008 campaign with the exception that PIMA spectral analysis was not completed, nor were collar survey certificates included in the drill hole documentation. The collar coordinates of these exploration drill holes were acquired using handheld GPS units. No drilling in this campaign was located in the Yaxtché area. Lithology and alteration codes followed the units defined in the 2012 relogging campaign.
10.4 Recovery
Table 10-3 summarizes core recovery by year. The average core recovery for all Quevar drill holes averages 93.9% for over 30,000 measured intervals and is consistent with that reported in earlier technical reports.
10.4.1 2006–2008 Drill Campaign
Information in this sub-section for the 2006–2008 drill campaigns is summarized from SRK (2009).
Core recovery was stated to be 90% or better.
10.4.2 2009 Drill Campaign
Micon (2010) and Chlumsky, Armbrust & Meyer (2009a, 2009b, 2010) also reported recoveries of >90%.
10.4.3 2010 Drill Campaign
Micon (2010) and Chlumsky, Armbrust & Meyer (2009a, 2009b, 2010) also reported recoveries of >90%.
10.4.4 2011–2012 Drill Campaign
Pincock Allen and Holt (2012) reported core recoveries of over 90%.
10.4.5 2012–2013 Drill Campaign
Core recoveries for the 2012–2013 drill program averaged 94%.
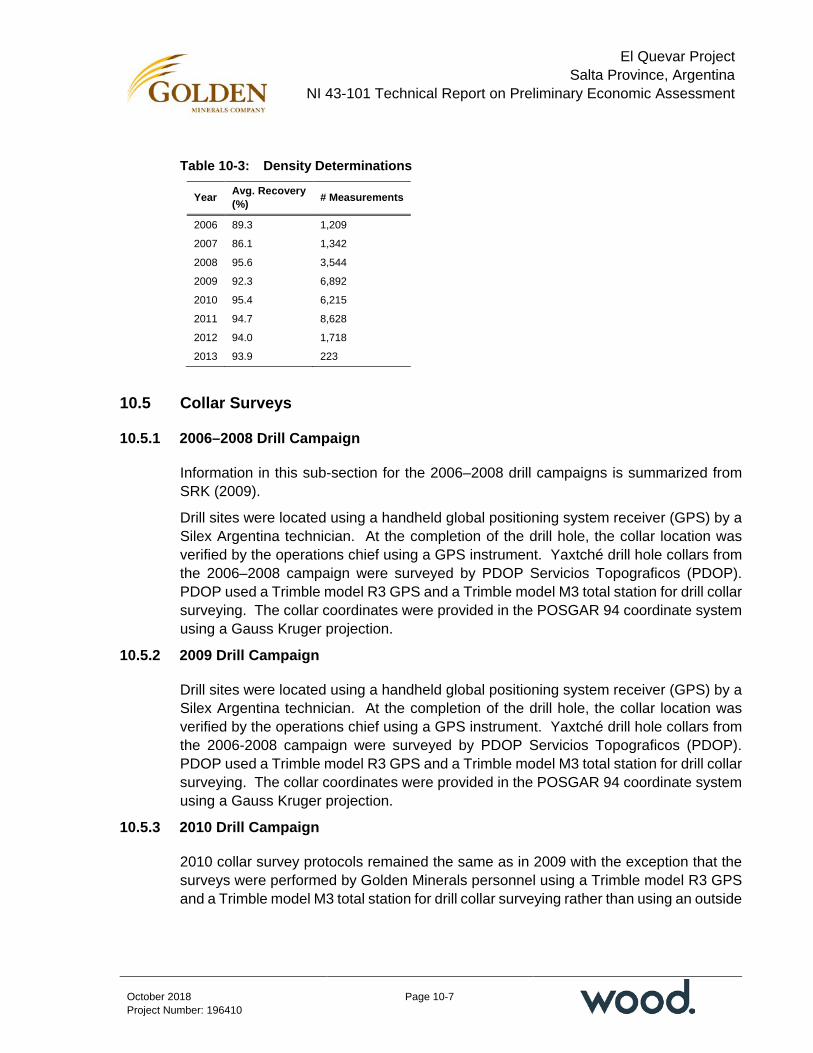
El Quevar Project Salta Province, Argentina
NI 43-101 Technical Report on Preliminary Economic Assessment
Page 10-7
October 2018 Project Number: 196410
Table 10-3: Density Determinations
Year Avg. Recovery (%) # Measurements
2006 89.3 1,209
2007 86.1 1,342
2008 95.6 3,544
2009 92.3 6,892
2010 95.4 6,215
2011 94.7 8,628
2012 94.0 1,718
2013 93.9 223
10.5 Collar Surveys
10.5.1 2006–2008 Drill Campaign
Information in this sub-section for the 2006–2008 drill campaigns is summarized from SRK (2009).
Drill sites were located using a handheld global positioning system receiver (GPS) by a Silex Argentina technician. At the completion of the drill hole, the collar location was verified by the operations chief using a GPS instrument. Yaxtché drill hole collars from the 2006–2008 campaign were surveyed by PDOP Servicios Topograficos (PDOP). PDOP used a Trimble model R3 GPS and a Trimble model M3 total station for drill collar surveying. The collar coordinates were provided in the POSGAR 94 coordinate system using a Gauss Kruger projection.
10.5.2 2009 Drill Campaign
Drill sites were located using a handheld global positioning system receiver (GPS) by a Silex Argentina technician. At the completion of the drill hole, the collar location was verified by the operations chief using a GPS instrument. Yaxtché drill hole collars from the 2006-2008 campaign were surveyed by PDOP Servicios Topograficos (PDOP). PDOP used a Trimble model R3 GPS and a Trimble model M3 total station for drill collar surveying. The collar coordinates were provided in the POSGAR 94 coordinate system using a Gauss Kruger projection.
10.5.3 2010 Drill Campaign
2010 collar survey protocols remained the same as in 2009 with the exception that the surveys were performed by Golden Minerals personnel using a Trimble model R3 GPS and a Trimble model M3 total station for drill collar surveying rather than using an outside

El Quevar Project Salta Province, Argentina
NI 43-101 Technical Report on Preliminary Economic Assessment
Page 10-8
October 2018 Project Number: 196410
contractor. No survey certificates were placed in the drill hole files; however, the surveyed locations were entered into the database.
10.5.4 2011–2012 Drill Campaign
The 2011–2012 collar survey protocols remained the same as in 2009, with the exception that the surveys were performed by Golden Minerals personnel rather than an outside contractor. The same survey equipment was used, collar locations were entered into the database, but no survey certificates or documentation were placed in the drill hole files.
10.5.5 2012–2013 Drill Campaign
Exploration drill holes for the 2012–2013 campaign were outside of the Yaxtché resource area and the collar coordinates were acquired using handheld GPS units.
10.6 Downhole Surveys
10.6.1 2006–2008 Drill Campaign
Information in this sub-section for the 2006–2008 drill campaigns is summarized from SRK (2009).
After completion of a drill hole, the drilling contractor performed a downhole survey. During the 2008 drilling program, Falcon Drilling Ltd., provided a Sperry Sun and Patagonia Drill provided a Reflex Photobor. Downhole surveys were taken at 25 m intervals and checked by an operations chief.
10.6.2 2009 Drill Campaign
Micon (2010) and Chlumsky, Armbrust & Meyer (2009a, 2009b, 2010) reported that down-hole surveys were performed on all drill holes, generally using a Reflex Photobor and in some cases a Sperry Sun. Readings were made at 25 m intervals.
10.6.3 2010 Drill Campaign
Micon (2010) and Chlumsky, Armbrust & Meyer (2009a, 2009b, 2010) reported that down-hole surveys were performed on all drill holes, generally using a Reflex Photobor and in some cases a Sperry Sun. Readings were made at 25 m intervals.
10.6.4 2011–2012 Drill Campaign
Pincock Allen and Holt (2012) noted no differences in the downhole survey instrumentation or reading intervals procedures for the 2010–2011 drill programs to those described by Micon (2010) and Chlumsky, Armbrust & Meyer (2009a, 2009b, 2010).
El Quevar Project Salta Province, Argentina
NI 43-101 Technical Report on Preliminary Economic Assessment
Page 10-9
October 2018 Project Number: 196410
10.6.5 2012–2013 Drill Campaign
Major Perforaciones reportedly used a Reflex magnetic survey tool to collect downhole survey readings at 25–50 m intervals.
10.6.6 Magnetic Declination
The general protocol was that drill holes and down-hole surveys used magnetic north, with no correction for declination.
During Wood’s site visit in April 2018 a spot check of down-hole survey data revealed that some of the earliest drilling may have had magnetic declination corrections applied. Wood recommended that all survey information be reviewed to ensure that the data are being presented on the same basis.
Throughout the 2006–2014 period of exploration drilling, magnetic declination at the Project changed from 4.2º west in 2006 to 5.7º west in 2014.
10.7 Sample Length/True Thickness
Most holes in the Yaxtché deposit were drilled so as to cross-cut the mineralized zone at a high angle in terms of dip, and nearly all holes were at right angles to the strike of the mineralized Quevar Breccia. The average angle of intercept was approximately 80°.
Pincock Allen and Holt (2012) observed that drill collar azimuths were variable, as follows:
• “158 holes (58%) were oriented on an average azimuth of 209º
• 69 holes (25%) were oriented at an average azimuth of 155º.
The remaining 43 holes ranged from vertical (15) to 180º azimuth to variable azimuths.
The principal azimuth of 209º was oriented perpendicular to the strike of the mineralized Quevar Breccia (300º az)”.
In 2011, Golden Minerals changed the drilling azimuth to 155º perpendicular to the 60–70º strike of extensional structures noted in the adit and associated underground workings. It was later noted that the drill holes drilled on the 155º azimuth encountered the mineralized structure at greater depth and had the same mineralized thicknesses, indicating that holes with the 155º azimuth were cutting the principal structure on an oblique angle (Pincock Allen and Holt, 2012).
Due to the nature of the mineralization occurring as shoots and veins, the true width of the mineralization will vary both along strike and in the down dip direction. In areas where the strike and dip of the mineralization are well established, a true width for the mineralized intersection may be estimated. However, in areas of poor surface exposure
El Quevar Project Salta Province, Argentina
NI 43-101 Technical Report on Preliminary Economic Assessment
Page 10-10
October 2018 Project Number: 196410
or where there is no drilling or poor drilling, the true width of the mineralization cannot be estimated.
10.8 Summary of Drill Intercepts
A drill section through the deposit illustrating the typical drill orientations in relation to the mineralization is illustrated in Figure 7-6.
Table 10-4 provides examples of the drill intercepts encountered in the Yaxtché deposit. All drill holes are within the 150 g/t Ag wireframe used in Mineral Resource estimation.
10.9 Comments on Section 10
In the opinion of the QP, the quantity and quality of the lithological, collar and down-hole survey data collected in the exploration and infill drill programs completed at the Yaxtché deposit since 2007 are sufficient to support Mineral Resource estimation.
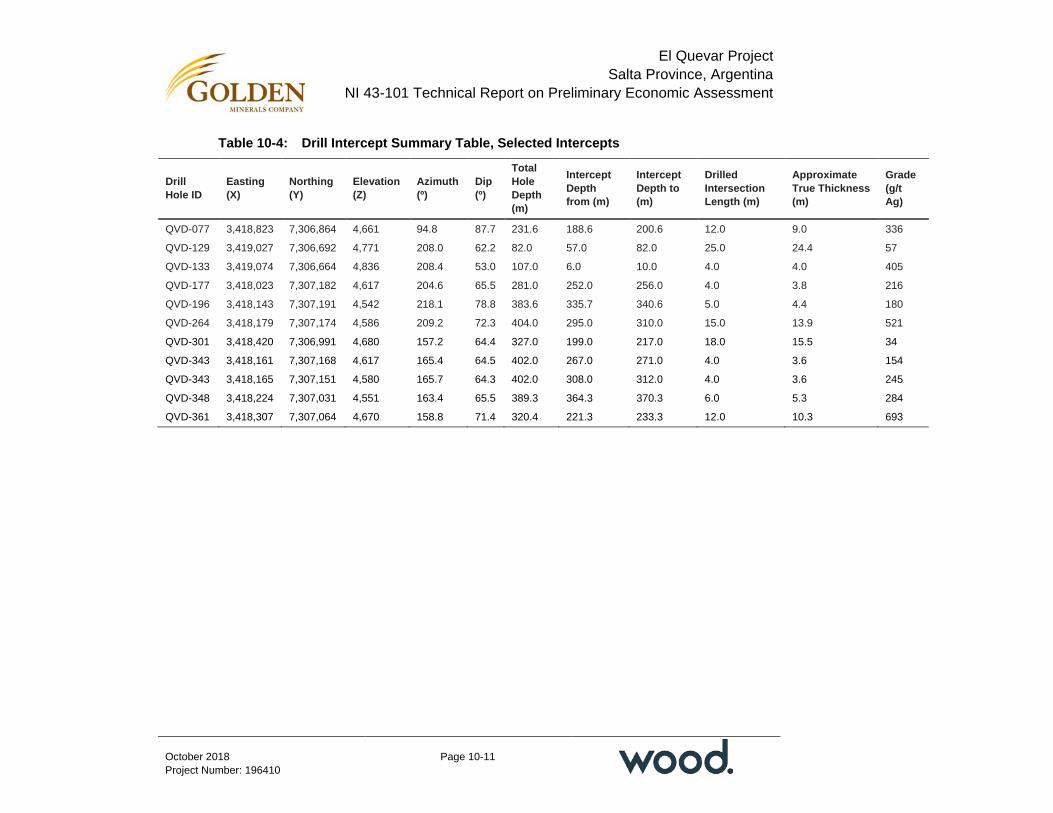
El Quevar Project Salta Province, Argentina
NI 43-101 Technical Report on Preliminary Economic Assessment
Page 10-11
October 2018 Project Number: 196410
Table 10-4: Drill Intercept Summary Table, Selected Intercepts
Drill Hole ID
Easting (X)
Northing (Y)
Elevation (Z)
Azimuth (º)
Dip (º)
Total Hole Depth (m)
Intercept Depth from (m)
Intercept Depth to (m)
Drilled Intersection Length (m)
Approximate True Thickness (m)
Grade (g/t Ag)
QVD-077 3,418,823 7,306,864 4,661 94.8 87.7 231.6 188.6 200.6 12.0 9.0 336
QVD-129 3,419,027 7,306,692 4,771 208.0 62.2 82.0 57.0 82.0 25.0 24.4 57
QVD-133 3,419,074 7,306,664 4,836 208.4 53.0 107.0 6.0 10.0 4.0 4.0 405
QVD-177 3,418,023 7,307,182 4,617 204.6 65.5 281.0 252.0 256.0 4.0 3.8 216
QVD-196 3,418,143 7,307,191 4,542 218.1 78.8 383.6 335.7 340.6 5.0 4.4 180
QVD-264 3,418,179 7,307,174 4,586 209.2 72.3 404.0 295.0 310.0 15.0 13.9 521
QVD-301 3,418,420 7,306,991 4,680 157.2 64.4 327.0 199.0 217.0 18.0 15.5 34
QVD-343 3,418,161 7,307,168 4,617 165.4 64.5 402.0 267.0 271.0 4.0 3.6 154
QVD-343 3,418,165 7,307,151 4,580 165.7 64.3 402.0 308.0 312.0 4.0 3.6 245
QVD-348 3,418,224 7,307,031 4,551 163.4 65.5 389.3 364.3 370.3 6.0 5.3 284
QVD-361 3,418,307 7,307,064 4,670 158.8 71.4 320.4 221.3 233.3 12.0 10.3 693
El Quevar Project Salta Province, Argentina
NI 43-101 Technical Report on Preliminary Economic Assessment
Page 11-1
October 2018 Project Number: 196410
11.0 SAMPLE PREPARATION, ANALYSES, AND SECURITY
11.1 Sampling Methods
11.1.1 Core Sampling
The logging geologist was responsible for selection of sample intervals and samples for density measurements.
The geologist logging the core marked the sample intervals on the core. Generally, the sample intervals were a nominal 1 m length within the mineralized zone but could be longer or shorter due to a lithological boundary. Outside the mineralized zone, samples were typically 2 m in length. The entire mineralized zone was sampled, and 2 to 3 m shoulder was sampled on either side of the mineralized zone. Silex Argentina personnel did not always sample the entire length of the drill hole. In some drill programs such as the 2012 drill program, a 10–15 m shoulder was sampled; in others such as the 2009 program, the shoulder interval was 2–3 m.
If necessary, the geologist could also draw a longitudinal cut line on the core to guide the sample technician in splitting the core. Drill core was split using a core saw in competent zones and a trowel in broken zones.
11.1.2 Adit Sampling
Golden Minerals conducted an extensive 1 m, chip–channel sampling program in the adit/decline and associated underground workings. The sampling consisted of chip–channels cut at the mining face, in the roof, ribs, and fault zone as exposed in the workings.
Bulk samples were also collected for each face advance as described in Section 9.6.
11.2 Density Determinations
SRK (2009) noted that at the time, there had been 209 density determinations completed on core samples from 17 drill holes using the water displacement method. The following steps were taken when determining sample density:
• Core samples 10 cm in length were selected at a frequency of about 10 to 15 m downhole
• Samples were dried and if necessary, coated with varnish to make the sample impermeable
• The rock type and oxidation state were noted on the data sheet as well as the length of the sample and whether it was whole or half core

El Quevar Project Salta Province, Argentina
NI 43-101 Technical Report on Preliminary Economic Assessment
Page 11-2
October 2018 Project Number: 196410
• The scale was set to 0 and the core sample was weighed
• A graduated test tube was filled 1,000 mL of water, and the level was noted on the data sheet
• The sample was placed in the water and the water level was noted
• The density was calculated according to the following equation:
− Weight of rock (g)/volume of sample (mL)).
During 2009, Golden Minerals measured an additional 600-plus samples from previous and current drilling, most of which were from outside the Yaxtché Central Zone, using the same methodology (Chlumsky, Armbrust & Meyer, 2010). Chlumsky, Armbrust & Meyer noted that the measurement protocol used by Golden Minerals did not meet rigorous quality standards:
• Very small samples, often only 10 cm long, are used
• 24-hour oven drying of samples at 105º C prior to measurement is not called for
• The procedure of varnishing samples to seal against porosity does not accurately represent the volumes of breccias containing large open spaces
• The criteria for selecting samples is not specified rigorously and could possibly lead to selection of the least-fractured (and therefore most-dense) rock for measurement.
Chlumsky, Armbrust & Meyer was of the opinion that further work needed to be done to accurately determine the bulk densities of the various rock types. It was recommended that more rigorous procedures be used to ensure that samples are thoroughly dry and that volumes are accurately measured (e.g. by sealing cores in cellophane).
Chlumsky, Armbrust & Meyer prepared a scatter diagram, showing bulk density as a function of downhole distance below collar. There was no significant correlation between density and depth.
Overall, Chlumsky, Armbrust & Meyer considered that the data could support Mineral Resource estimation.
Micon (2010) reported that Golden Minerals had updated and improved its density data with a new set of samples analyzed by SGS Peru S.A.C. (SGS Peru). A total of 190 samples from the mineralized zone were submitted for specific gravity testing in July 2010. The values from the SGS Peru testing are summarized in Table 11-1.
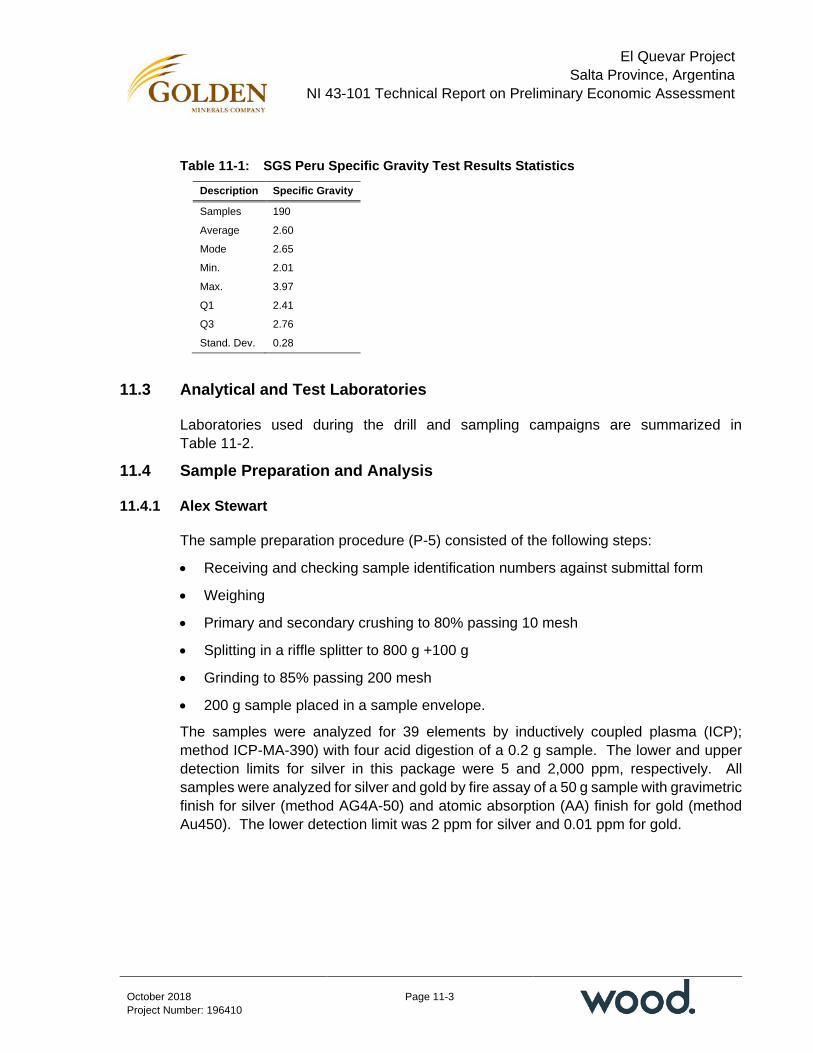
El Quevar Project Salta Province, Argentina
NI 43-101 Technical Report on Preliminary Economic Assessment
Page 11-3
October 2018 Project Number: 196410
Table 11-1: SGS Peru Specific Gravity Test Results Statistics
Description Specific Gravity
Samples 190
Average 2.60
Mode 2.65
Min. 2.01
Max. 3.97
Q1 2.41
Q3 2.76
Stand. Dev. 0.28
11.3 Analytical and Test Laboratories
Laboratories used during the drill and sampling campaigns are summarized in Table 11-2.
11.4 Sample Preparation and Analysis
11.4.1 Alex Stewart
The sample preparation procedure (P-5) consisted of the following steps:
• Receiving and checking sample identification numbers against submittal form
• Weighing
• Primary and secondary crushing to 80% passing 10 mesh
• Splitting in a riffle splitter to 800 g +100 g
• Grinding to 85% passing 200 mesh
• 200 g sample placed in a sample envelope.
The samples were analyzed for 39 elements by inductively coupled plasma (ICP); method ICP-MA-390) with four acid digestion of a 0.2 g sample. The lower and upper detection limits for silver in this package were 5 and 2,000 ppm, respectively. All samples were analyzed for silver and gold by fire assay of a 50 g sample with gravimetric finish for silver (method AG4A-50) and atomic absorption (AA) finish for gold (method Au450). The lower detection limit was 2 ppm for silver and 0.01 ppm for gold.

El Quevar Project Salta Province, Argentina
NI 43-101 Technical Report on Preliminary Economic Assessment
Page 11-4
October 2018 Project Number: 196410
Table 11-2: Analytical and Preparation Laboratories
Year Laboratory Accreditation Independent Function
2006–2011; 2012–2013
Alex Stewart (Mendoza) ISO 9001:2000 Yes
Sample preparation and analysis; check sampling for high-grade Ag samples
2006–early 2009
ALS Chemex (Lima)
ISO 9001:2000; Instituto Nacional de Normalizacion Chile ISO 17025.Of2005
Yes Sample preparation and analysis
2009–2011
Acme (Mendoza)
IRAM – RI 9000-t 295 certification Yes Sample preparation and
analysis
2010 TSL Laboratories Inc. (Saskatoon)
ISO/IEC Standard 17025 Guidelines Yes Witness samples taken by
Micon
2010 SGS Peru (Lima)
ISO 9001; ISO/IEC Standard 17025 Guidelines Yes Sample analysis, density
determinations
2012 American Assay Laboratories (Nevada)
ISO/IEC 17025:2005 Yes Check laboratory for high-grade Ag samples
11.4.2 ALS Chemex
The sample preparation procedures (Prep-31) consisted of the following:
• Receiving and checking sample identification numbers against the submittal form
• Weighing
• Crushing to 70% passing 10 mesh
• Splitting to 250 g
• Pulverizing to 85% passing 200 mesh
• Placing sample in sample envelope.
Samples were analyzed for 33 elements by ICP (ME-ICP61) using four acid digestion, with lower and upper detection limits for silver of 0.5 and 100 ppm, respectively. The silver over-limits were analyzed by fire assay with AA finish (Ag-AA62) with lower and upper detection limits of 1 and 1,500 ppm, respectively. The resultant over-limits were analyzed by fire assay with gravimetric finish (AG-GRA22) with lower and upper detection limits of 5 and 10,000 ppm, respectively.
Gold was analyzed by fire assay with AA finish (Au-AA24) with lower and upper detection limits of 0.005 ppm and 10 ppm, respectively; gold over-limits were analyzed by fire assay with gravimetric finish (Au-GRA22), with lower and upper detection limits

El Quevar Project Salta Province, Argentina
NI 43-101 Technical Report on Preliminary Economic Assessment
Page 11-5
October 2018 Project Number: 196410
of 0.05 and 1,000 ppm respectively. Over-limits of lead, zinc, and copper were analyzed by AA following a multi acid digestion.
11.4.3 Acme
The sample preparation procedures (R-200) consisted of the following:
• Receiving and checking sample identification numbers against the submittal form
• Weighing
• Crushing to 80% passing 10 mesh
• Splitting to 250 g
• Pulverizing to 85% passing 200 mesh
• Placing sample in sample envelope.
Samples were analyzed for 39 elements by ICP-MS (Group 1DX) analysis. Sample splits of 0.5 g were leached in hot (95º C) aqua regia. The silver over-limits were analyzed by gravimetric finish (AG-G6-Grav) with lower and upper detection limits of 5 and 10,000 ppm, respectively. Gold was analyzed using method Au-GRA22, with lower and upper detection limits of 0.05 and 1,000 ppm respectively. Over-limit samples of lead, zinc, and copper were analyzed by 7AR following a multi-acid digestion.
11.4.4 SGS
Less than 1% of the samples in the database were sent to SGS.
Samples were analyzed for 39 elements by ICP-MS (Group IDX) analysis. The silver over-limit analyses were analyzed by fire assay with gravimetric finish (AG-G6 -Grav) with lower and upper detection limits of 5 and 10,000 ppm. Gold was analyzed (Au-GRA22), with lower and upper detection limits of 0.05 and 1,000 ppm respectively. Over-limit samples of lead, zinc, and copper are analyzed by 7AR with a multi-acid digestion.
11.5 Quality Assurance and Quality Control
No internal quality assurance and quality control (QA/QC) program was in place until drill hole QVD-043. The early analytical programs rely upon the internal Alex Stewart laboratory QA/QC program.
The QA/QC program instigated by Apex Silver could use two types of blanks, three types of duplicates, six precious metal standard reference samples (SRMs) and four base metal SRMs.
The QA/QC program used for surface samples (channel and select outcrop samples), consisted of a SRM, coarse blank, and pulp blank at a frequency of one per 50 samples

El Quevar Project Salta Province, Argentina
NI 43-101 Technical Report on Preliminary Economic Assessment
Page 11-6
October 2018 Project Number: 196410
or approximately 2%. For drill core, Apex Silver included one SRM every 20 samples (5%), a coarse duplicate every 20 samples (5%), a pulp duplicate every 20 samples (5%), a core duplicate every 50 samples (2%), and a pulp blank and coarse blank every 20 samples (5%).
SRK (2009) noted that the precious metals SRMs and coarse blank samples were site-specific. The precious metals SRMs were generated from material collected at the site and prepared by Alex Stewart. In Wood’s opinion, the site-specific SRMs were not created using industry-accepted practices, and thus should not be considered as true reference materials (see also discussion in Section 12.6.2). Wood selected almost 400 pulps and along with CRMs and blanks obtained from CDN Laboratories submitted the samples to ALS Chemex for analysis.
Coarse blank material was collected from a fresh dacite flow located approximately 3.5 km southeast of the camp. The flow is younger than the mineralization host at Yaxtché.
The fine blank material was purchased from Alex Stewart. The base metal SRMs were purchased from Geostats Pty Ltd. (Geostats) and were certified.
The QA/QC samples were inserted into the sample stream in two steps. At the El Quevar camp, coarse blanks and core duplicates were inserted into the sample shipment. The samples were taken to Salta by Apex Silver, and then shipped to either ALS Chemex or Alex Stewart for sample preparation. Each laboratory prepared the sample for analysis, after which all sample materials were returned to Silex Argentina’s Mendoza office. Silex Argentina stored the reject materials, renumbered the samples, inserted the remaining QA/QC samples and submitted the pulps for analysis to the respective laboratories. Pulps prepared by ALS were returned to ALS for analysis and likewise pulps prepared by Alex Stewart were returned to Alex Stewart for analysis. The QA/QC samples submitted into the sample stream at this time included SRMs, pulp duplicates and pulp (fine) blanks.
The sampling completed under Golden Minerals continued with the same insertion rates and materials as the Apex Silver programs for both drill and underground sampling programs.
11.6 Databases
The current database is maintained on Golden Minerals main server in Golden, Colorado, USA, which is a mirrored multi-disk array, and which is also backed up every three days to an external drive and stored offsite.
El Quevar Project Salta Province, Argentina
NI 43-101 Technical Report on Preliminary Economic Assessment
Page 11-7
October 2018 Project Number: 196410
11.7 Sample Security
The drill core was maintained in a facility at the El Quevar camp, before and directly after splitting. The cores shed was not locked; however, the overall facility has locked access and was under guard 24/7.
Older core was stored on pallets at the campsite. Golden Minerals or Apex Silver personnel were responsible for logging, sampling, splitting and shipping core to the laboratory facilities.
11.8 Comments on Section 11
Sample collection, preparation, analysis and security for underground sampling and core drill programs conducted since 2007 are in line with industry-standard methods for epithermal silver deposits.
Specific gravity data are measured from unwaxed core samples using the water displacement method. There are sufficient estimates to support tonnage estimates for the various lithologies.
Drill and underground sampling programs included insertion of blank, duplicate and SRM samples.
QA/QC program results do not indicate any problems with the analytical programs (refer to discussion in Section 12).
The QP is of the opinion that the quality of the silver analytical data is sufficiently reliable to support Mineral Resource estimation without limitations on Mineral Resource confidence categories.

El Quevar Project Salta Province, Argentina
NI 43-101 Technical Report on Preliminary Economic Assessment
Page 12-1
October 2018 Project Number: 196410
12.0 DATA VERIFICATION
12.1 Internal Data Verification
Golden Minerals’ internal procedures for the collar, lithology, alteration, and survey data include detailed re-survey of collar locations, re-checks on logged lithology and alteration, including re-logging of drill holes and correcting overlapping intervals when noted.
12.2 SRK (2009)
SRK did not observe active drilling because, at the time of the 2009 site visit, all drill programs had been completed. SRK found the completed drill pads to be clean and marked as described. The core logging and storage facilities at El Quevar were described as being clean and well organized, enabling Apex Silver staff to easily locate reference core and supporting data.
SRK completed the following checks:
• Visits to each of the exploration targets with examination of trenches, outcrops, and drill pads
• Examination of drill core and logging and sampling procedures
• Comparison of lithological logs to database
• Comparison of assay certificates to 10% of the database, with no errors detected
• Review of cross-sections and geological model
• Review and analysis of laboratory QA/QC procedures and results.
SRK did not identify any errors in the database and found the drilling and logging procedures to meet industry standards
12.3 Chlumsky, Armbrust & Meyer, LLC (2009a, 2009b, 2010)
Chlumsky, Armbrust & Meyer completed a digital check of the database provided by Golden Minerals in 2009. In evaluating an existing database Chlumsky, Armbrust & Meyer used values flagged by these automated procedures as a starting point for database review and noted that if the error rates in the statistically-anomalous values were acceptable then the entire database was generally acceptable.
Some anomalies were noted as part of the review, and were forwarded to Golden Minerals, but the number and type of anomalies were within industry norms for databases of this size, and even if the anomalies turn out to be errors, they would have no effect on the overall resource estimate.
El Quevar Project Salta Province, Argentina
NI 43-101 Technical Report on Preliminary Economic Assessment
Page 12-2
October 2018 Project Number: 196410
On the basis of these statistical checks Chlumsky, Armbrust & Meyer was of the opinion that the Yaxtché Central Zone exploration database had been prepared according to industry norms and was suitable for the development of geological and grade models.
The second database check later in 2009 and the 2010 evaluation found no significant database errors and the Yaxtché exploration database was concluded to have been prepared according to industry norms and was suitable for the development of geological and grade models.
12.4 Micon (2010)
Micon also visited the Golden Minerals/Silex Argentina offices in Salta where the exploration and development program was discussed. Two days were spent on site where the core logging, sampling and assaying procedures and techniques were discussed, and the general exploration, drilling, QA/QC and development programs were reviewed. During the visits to the offices and to the Project site, the database was reviewed for any errors and omissions. During the 2010 Micon site visit, the drill pads for the drilling program underway at the time were inspected and a number of the drill hole collars were located. Micon noted that the drill sites were very clean.
During the site visit to the Project eight samples were taken by Micon, six of which consisted of reject samples from the drilling program, and two were grab samples from two mineralized outcrops on the Yaxtché zone. Micon arranged for its samples to be analyzed for gold, silver, copper, lead and zinc. All assaying was conducted by TSL Laboratories Inc. (TSL) of Saskatoon, Saskatchewan, a laboratory that was independent of Golden Minerals and registered to ISO/IEC Standard 17025 Guidelines. There was a general agreement between the assay results obtained by Golden Minerals and Micon for the reject core samples. In addition, Micon’s grab samples from two mineralized outcrops in the Yaxtché area both indicated elevated silver grades, and in one sample there was an elevated lead grade as well. Micon concluded that the independent sampling confirmed the presence of silver mineralization at Yaxtché.
During the initial site visit, Micon reviewed the database and found a small number of data entry errors. Micon asked Golden Minerals to correct these errors prior to reviewing the model and conducting the 2010 resource estimate. During a second visit, Micon verified the data included in the updated database and assisted Golden Minerals with the creation of a new interpretation for the mineralized solids upon which the 2010 updated resource estimate for the Yaxtché deposit was based.
Micon performed a random check of assays against laboratory certificates and a review of the database during the site visits and was satisfied that the database at the time was sufficiently complete and free of errors to allow its use in the preparation of a mineral resource estimate.

El Quevar Project Salta Province, Argentina
NI 43-101 Technical Report on Preliminary Economic Assessment
Page 12-3
October 2018 Project Number: 196410
12.5 Pincock, Allen and Holt (2012)
During the 2012 site visit to the El Quevar property, Pincock, Allen and Holt (2012) observed and interviewed Golden Minerals personnel in the procedures of core handling, sampling, logging and sample security that are performed at the Project base camp, noting:
• Processing and sampling of core is performed in a well-appointed metal building at the El Quevar camp. The facility has separate rooms for a geology office, core cutting and a large area for laying out, sampling and storage of core
• The handling and sampling of core is industry standard
• Core is laid out, washed, measured from block to block to determine recovery
• A technician marks-up sample intervals for bulk density measurements every 4–6 boxes, and performs RQD measurements
• The geologist lays out the 1 m sample intervals and logs the core. The practice is to sample 10–15 m above and below the mineralized zone. Core is cut by a diamond saw into 1 m samples weighing about 2-3 kg and bagged. Sample tags are fixed on the inside and outside of the bags
• Multiple sample bags are placed in large rice bags and sealed with wire. The rice bags are stored in the shed which is generally not locked but the remote location and 24 hr security guards provide a measure of sample security.
• Chain of custody is maintained in the form of commercial shipping documents
• Coarse reject samples are placed on pallets, covered in plastic, and stored in the camp yard, while sample pulps are boxed and stored at the camp or at the laboratory.
Pincock, Allen and Holt concluded that these procedures were being performed with diligence, care and were industry standard for advanced exploration projects such as El Quevar.
Pincock, Allen and Holt personnel spent four days reviewing core from 12 drill holes including the core logging, sampling and assaying procedures and the general exploration, drilling, QA/QC and underground exploration development. By visual comparison of the core with the corresponding log sheets and assays, Pincock, Allen and Holt verified that the logging and sample intervals had been correctly recorded.
During the site visit, a validation of several hole collar positions was undertaken by Pincock, Allen and Holt using GPS. Many hole collars had been obliterated due to the Company’s site reclamation activities. Drill collar locations were checked by comparison of collar locations with digital topography of the Project area. Pincock, Allen and Holt

El Quevar Project Salta Province, Argentina
NI 43-101 Technical Report on Preliminary Economic Assessment
Page 12-4
October 2018 Project Number: 196410
observed that the collar elevations for approximately 12 drill holes were inconsistent with the current digital topography. Golden Minerals then provided updated collar elevation information for these holes.
Pincock, Allen and Holt reviewed 78 drill holes, approximately 29% of the drill holes in the February 9, 2012 database and checked the database assays against laboratory certificates. Pincock, Allen and Holt identified several inconsistencies in the assay database for which the corresponding corrective actions were taken. General findings were:
• Field checking, original drill logs, and database were all consistent showing the appropriate angle and inclination of the drill holes completed
• Sample intervals were correct for assays entered. PAH noted only one error in the updated database caused by typographical error
• Assay certificates, drill logs and sample sheets were available for all drill holes
• Loading of assay data from laboratory certificates was correct
• During the 2011 drilling program, Golden Minerals assayed all intervals for silver by two analytical methods, ICP with reruns greater than 200 ppm Ag by the fire assay-gravimetric method (50 g charge) at the same laboratory (Alex Stewart)
• No issues with the conversion of the database were identified.
QA/QC data were compiled and examined with respect to two types of control samples:
• Control samples inserted by Silex Argentina into the sample stream sent to Alex Stewart
• Internal laboratory control samples assayed by Alex Stewart
Results included:
• A total of 35,910 assay determinations were compiled, of which 35,654 could be used for analysis. Approximately 256 entries (<1%) could not be used due to errors and inconsistencies with the laboratories.
• A total of 380 fine blanks and 1,283 coarse blanks were analyzed to test for cross-contamination from sample to sample during crushing and pulp separation. Of the 380 fine blanks assayed, only one sample was above 1 ppm Ag. Of the 1,283 coarse blanks assayed, 23 were above 1 ppm Ag. The results from the blank sample analysis indicated there was no contamination during the sample preparation stage
• Duplicate submission included 2,816 fine duplicate pairs, 1,424 coarse duplicate pairs, and 673 field duplicate pairs. A graphical check showed good correlation between original and duplicate samples analyzed for silver with the correlation coefficient R2 -values ranging from 0.8756 to 0.9849. The three types of duplicate

El Quevar Project Salta Province, Argentina
NI 43-101 Technical Report on Preliminary Economic Assessment
Page 12-5
October 2018 Project Number: 196410
sample analyses that were routinely submitted by Silex Argentina showed acceptable levels of variance
• Silex Argentina SRM G997-5 was the only standard to stay within ±10% of the accepted value, based on graphical analysis. The SRM graphs, exemplified by the graph for SRM STD-6, show anomalous spikes perhaps due to laboratory errors or mislabeling. Pincock, Allen and Holt noted that if one ignores the five outlier points, the graph of STD-6 also displays good accuracy and precision over a long time period
• Review of the blank sample results does not indicate signs of sample cross-contamination during sample preparation
• Analysis of duplicates and SRMs suggest that silver assays are reasonably accurate and precise.
The analysis of blanks, duplicates and standard reference materials submitted by Silex Argentina to the laboratories was considered by Pincock, Allen and Holt to provide positive indications that assay results from 2006 to 2011 were reliable and suitable for use in resource estimation.
Pincock, Allen and Holt commented on a gap in Silex Argentina’s submission of SRMs to the laboratories between approximately December 2009 and December 2011. Lacking Silex Argentina’s SRM analyses, instead PAH reviewed the internal control sample results reported by Alex Stewart to assess QA/QC.
Pincock, Allen and Holt found that Alex Stewart was not inserting high-grade silver standards in the sample stream going to the fire assay-gravimetric analysis. Approximately 9% of the samples (~1,100) assayed were >200 ppm Ag, and did not have corresponding standards analyzed by fire assay gravimetric methods:
• The high-grade silver SRM 999-3 has an accepted value of 291 ppm Ag (±16). When inserted into the sample stream its analysis would be reported in the ICP field as “>200 ppm”, with no value reported in the fire assay-gravimetric data field
• An insufficient quantity of high-grade silver SRMs were inserted, knowing the previous samples assayed originated from a high-grade silver deposit. For example, SRM G 397-8 has an accepted silver value of 410 ppm and only four standards were inserted into the sample stream. The low to high-grade silver SRMs chosen for graphical representation all fell within their respective ±1 standard deviation.
Pincock, Allen and Holt therefore requested that an independent, blind check sample program be undertaken to confirm the accuracy and precision of silver analyses on high-grade samples greater than 200 ppm Ag for the period December 2009 to August 2011.
A total of 152 high-grade silver pulp samples were retrieved from storage in Argentina and forwarded to Minerals Exploration Geochemistry (Reno) where the pulps were dried,

El Quevar Project Salta Province, Argentina
NI 43-101 Technical Report on Preliminary Economic Assessment
Page 12-6
October 2018 Project Number: 196410
blended and repackaged with new sample numbers. Three high-grade certified standards were inserted in the renumbered sample stream. Minerals Exploration Geochemistry forwarded 170 blinded splits to Alex Stewart and American Assay Laboratories in Reno. The high-grade check samples ranged from 200 to 9,500 ppm Ag, averaging 1,185 ppm with a median value of 642 ppm Ag. The samples were rerun for silver at the laboratories by fire assay-gravimetric on 25 g assay charges, necessitated by the shortage of material for some samples. The list of check samples with original analyses was kept confidential until the program was completed.
Of the 152 pulps, only 151 were re-assayed by American Assay Laboratory and compared to the original samples assayed by Alex Stewart. A graphical check displayed an acceptable correlation between the original assay value and the re-assay value from American Assay Laboratory, with an R2 value of 0.9205.
Pincock, Allen and Holt requested that Minerals Exploration Geochemistry insert three high-grade SRMs into the sample stream. SRM CU112 had one sample that fell just below two standard deviations of the 358.9 ppm accepted silver value and the other two SRMs fell within ±10% of the accepted value. The two internal SRMs, CU154 and OXQ75, inserted by American Assay Laboratory also fell within satisfactory upper and lower accepted ranges. In addition to the SRMs, American Assay Laboratory conducted 16 repeats of samples, and analysis of these samples revealed an R2 value of 0.9994.
A total of 170 high-grade samples were re-assayed by Alex Stewart and were compared to their original samples assayed. A graphical check of the original sample results with the re-assay sample results was undertaken, showing a good correlation with an R2 value of 0.9249.
Three internal SRMs were inserted by Alex Stewart, and three by Minerals Exploration Geochemistry. All SRMs were within ±10% of their respective accepted values. Two of the three internal SRMs inserted by Alex Stewart also fell within ±10% of their respective accepted values. SRM 305-3 showed one sample falling below 10%. Alex Stewart assayed 18 duplicate pairs, and analysis of these samples revealed an R2 value of 0.9944.
Following the site visit and database reviews, Pincock, Allen and Holt concluded that:
“The audit of Golden Minerals’ data collection procedures and resultant database by PAH has resulted in a digital database that is supported by verified certified assay certificates, original drill logs and sample books. PAH has confidence that the silver assays used in the Mineral Resource estimate are consistent with information in drill logs and sample books. A comparison of the assay certificates and drill hole logs show consistency for the 2009–2011 drill holes. PAH believes there is sufficient data to enable their use in a Mineral Resource estimate and resultant classification following NI 43-101”.
El Quevar Project Salta Province, Argentina
NI 43-101 Technical Report on Preliminary Economic Assessment
Page 12-7
October 2018 Project Number: 196410
“The un-sampled zones within the host rocks appear to be significant to the deposit, comprising zones of barren overburden or inter-burden. As a result, PAH believes these zones should be classified as internal waste zones in any resource calculation”.
“Based on data supplied by Golden Minerals, PAH believes that the analytical data has sufficient accuracy for use in resource estimation for the Yaxtché deposit”.
12.6 Wood (2018)
12.6.1 April 2018 Verification
Wood was provided electronic data files (Excel or csv format) for the density and geotechnical data. Using these files, updated tables for density and geotechnical information were constructed, and reviewed.
Wood was provided with assay files (Excel or csv format) directly from the Alex Stewart, ALS, Acme (now Bureau Veritas) and SGS laboratories. Based on these data, an updated assay database was constructed. The assays from the laboratories were merged with the existing assay table based on sample ID to create an updated assay table. The hole, ID, from and to intervals from the existing assay table were retained. Assays in the original table were replaced with assay data provided by the laboratories. The assay tables were reviewed.
During the Wood April 2018 site visit, Wood selected 11 witness sample intervals, quartered the half core, and shipped the samples to the Alex Stewart laboratory in Mendoza Argentina. The silver assays recorded in the database were then compared to the silver assays received from the laboratory. The assays correlated within expected variances except for one assay pair where the high variance was attributed to difficulties in sampling the irregular patches of visible silver sulfides.
The remaining database tables were provided by Golden Minerals.
Wood audited the database used to support the estimation of Mineral Resources. Collar survey, downhole survey, assays, density, lithology and redox tables were audited. The records contained in the database were compared to original logs for 21 (approximately 10%) of the drill holes contained in the database.
Collar records were only available for QVD-001 through QVD-191. Subsequent drill holes were surveyed using a total station instrument. Wood recommended that efforts should be made to locate the original total station survey records for the later drill holes and ensure these are appropriately filed.
During the site visit, Wood compared the locations of 24 collars located in the field using the Golden Minerals’ hand-held GPS, Wood’s GPS, and the coordinates in the database. The comparisons showed that all coordinates to agree within reasonable

El Quevar Project Salta Province, Argentina
NI 43-101 Technical Report on Preliminary Economic Assessment
Page 12-8
October 2018 Project Number: 196410
limits (median of the differences was 2.6 m). A few hole collars, however, showed differences up to 10.5 m which should be checked.
The audit of the down hole survey data revealed a number of differences between the database and the original records. This appears to be prevalent in the early drill holes and may reflect some drilling that has had magnetic declination applied.
The comparison of assay data to the original certificates found five samples with errors to the silver assays. This issue is not considered material, and the data have been corrected in the database.
The audit of the density data revealed only occasional errors in the data entry.
During the site visit, Wood collected eight samples that that were measured for specific gravity (SG) using un-waxed volumetric method by on-site Golden Minerals personnel. These samples were sent to Alex Stewart for re-analysis using both the waxed and unwaxed SG methods. Results showed little difference between the on-site unwaxed measurements and the waxed measurements from the laboratory.
The audit of the lithology data was difficult due to a 2012 relogging campaign. Only a few logs matched with the codes contained in the database.
It appears the redox data was revised in 2008, 2010, and again in 2012. As such, very few holes matched the database. In cases were the holes did not match, it was not possible to determine if the correct version of the drill hole log had been located. The redox codes were re-evaluated for the resource model by comparing the redox codes in the database to the drill core photos, and adjacent drill holes. These data were then used to construct a digital terrain model (DTM) that was used to categorize oxide and sulfide in the resource model. Material logged as mixed was included with the oxide, and not included in the sulfide resource model.
Golden Minerals continues to compile the historical QA/QC data into the Project database. Once the compilation is completed, Wood recommends a review of the results to validate the compilation. Validation should include checks for data entry errors and checks to ensure all of the QA/QC data examined during the 2012 Pincock Allen and Holt review have been captured.
12.6.2 June–July 2018 Verification
Wood reviewed the QA/QC data supplied by Golden Minerals. The review focused on results obtained for SRMs, duplicates and blanks. There were no significant issues noted with the duplicate or blank QA/QC results.
The SRMs used between 2006 and 2013 were a combination of commercial reference standards (CRMs) and six SRMs created from material collected from the Quevar site (likely drill core reject material). The CRMs were noted to be well below the 150 g/t Ag
El Quevar Project Salta Province, Argentina
NI 43-101 Technical Report on Preliminary Economic Assessment
Page 12-9
October 2018 Project Number: 196410
grades used to constrain the 2018 resource model and are not considered by Wood to be appropriate for the current resource model.
Although little information is available to validate the property SRM, it was noted that only four assay laboratories were involved in the round robin testing and only two samples were provided to each laboratory. Typically, a minimum of 10 laboratories participate in round robin testing and each laboratory receives at least 10 samples. Thus, the property standards should not be considered as reliable SRMs.
In addition, Alex Stewart was used to:
• Prepare the standard material from the supplied material
• Participate in the round robin analysis
• Act as the primary assay laboratory during much of the drilling.
In Wood’s opinion, an assay laboratory involved in creating SRMs should not also act as the primary assay laboratory. Wood recommended that a representative number of pulps be collected from the mineralized zone used in the current resource model and submitted along with appropriate CRMs for re-assaying. This program is intended to provide the required QA/QC support for the current and future El Quevar resource models.
As a result, Wood traveled to site (25 June to 1 July 2018) to supervise and assist in the collection and shipping of the pulps. A total of 472 samples (including CRMs and blanks) were submitted to ALS for analysis. Results of the re-sampling study for silver assays are shown in Figure 12-1, and demonstrate that the re-sampled silver results agreed very closely to the previous silver assays.
The CRMs and blanks were obtained from Canadian Resource Laboratories Ltd, located in Langley, BC, Canada. The CRM results indicated acceptable assay accuracy was achieved by ALS and the blank samples did not indicate any signs of contamination during the analysis.
In Wood’s opinion, the results of the pulp submission confirm the previous results and provide sufficient QA/QC support for use of the analytical data in estimation of Mineral Resources.
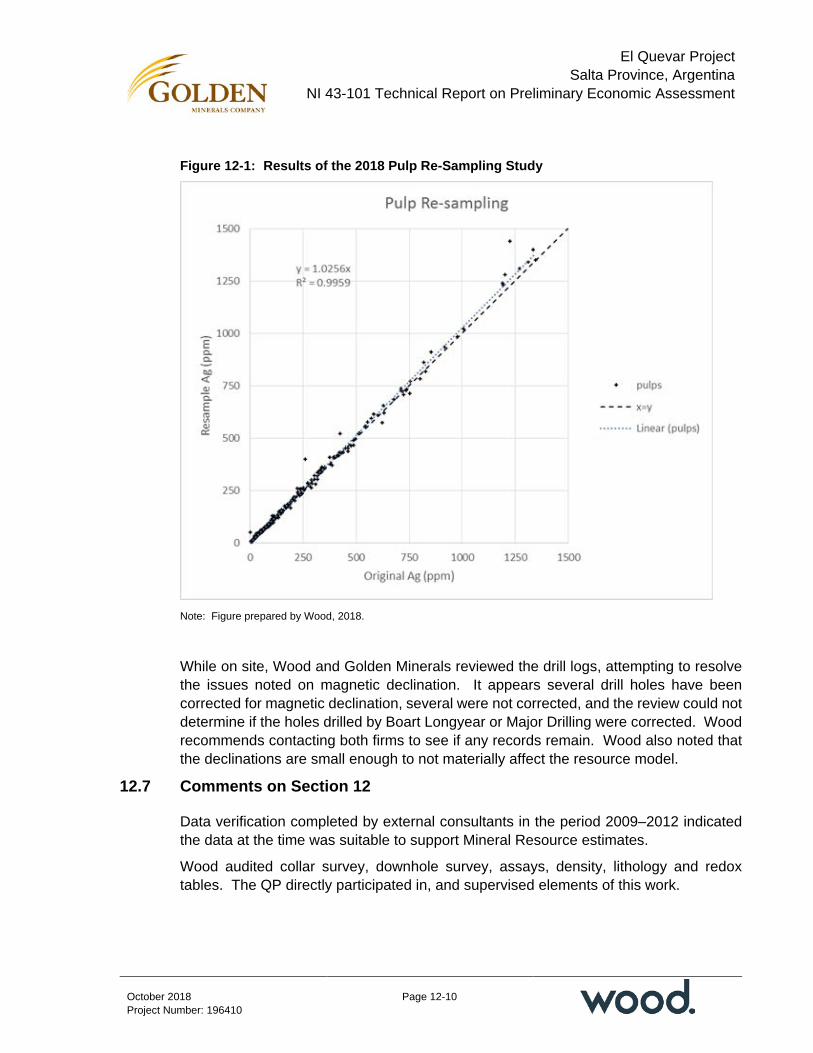
El Quevar Project Salta Province, Argentina
NI 43-101 Technical Report on Preliminary Economic Assessment
Page 12-10
October 2018 Project Number: 196410
Figure 12-1: Results of the 2018 Pulp Re-Sampling Study
Note: Figure prepared by Wood, 2018.
While on site, Wood and Golden Minerals reviewed the drill logs, attempting to resolve the issues noted on magnetic declination. It appears several drill holes have been corrected for magnetic declination, several were not corrected, and the review could not determine if the holes drilled by Boart Longyear or Major Drilling were corrected. Wood recommends contacting both firms to see if any records remain. Wood also noted that the declinations are small enough to not materially affect the resource model.
12.7 Comments on Section 12
Data verification completed by external consultants in the period 2009–2012 indicated the data at the time was suitable to support Mineral Resource estimates.
Wood audited collar survey, downhole survey, assays, density, lithology and redox tables. The QP directly participated in, and supervised elements of this work.
El Quevar Project Salta Province, Argentina
NI 43-101 Technical Report on Preliminary Economic Assessment
Page 12-11
October 2018 Project Number: 196410
Wood also submitted umpire samples to selected external laboratories as verification of rock density and the presence of mineralization at the site.
The QP is of the opinion that the verified data are considered acceptable to support Mineral Resource estimates.
Wood recommends that Golden Minerals annotates the existing database in support of auditability. This should include documentation of which drill holes have had magnetic declination applied, and a record of where changes to original logging codes have been made as a result of the completed re-logging and redox re-coding campaigns.
El Quevar Project Salta Province, Argentina
NI 43-101 Technical Report on Preliminary Economic Assessment
Page 13-1
October 2018 Project Number: 196410
13.0 MINERAL PROCESSING AND METALLURGICAL TESTING
13.1 Introduction
Mineral processing and metallurgical testing for the El Quevar Project focused on the testing of composite samples from the Yaxtché deposit. Major differences were noted in the mineralization between the upper and lower deposit domains with alteration observed in the upper domains of the east zone containing oxide minerals. The oxide mineralization in the east zone overlies mixed supergene and sulfide mineralization, whereas the mineralization in the central and west zones comprises dominantly sulfides.
Initial testwork was commissioned by Apex Silver in 2008 at the Dawson Metallurgical Laboratory (DML) in Salt Lake City, Utah (now owned by FLSmidth). Composites for the initial 2008 testwork were designated as being oxide, mixed supergene, and deeper sulfides taking into consideration that both open pit and underground were potential mining options. In 2009, Golden Minerals assumed ownership of El Quevar and continued the metallurgical testwork at DML. The objectives of the metallurgical tests were to develop technical parameters and inputs for the process plant including
• Process flow sheet
• Design criteria
• Consumables
• Material and water balances
Optimizing processing results (such as grind size and silver recovery).
As Project work progressed between 2008 and 2010 for identifying the Project’s potential development, DML’s testwork was refocused on the sulfide mineralization from the underground portions of the deposit.
Numerous metallurgical test programs were conducted on selected samples from the Yaxtché deposit between 2008 and 2012. The composites in the 2009 testwork were changed from mineralization type to deposit locations of east, west, central, sulfide and a master composite. Subsequent tests in 2010–2012 centered on optimizing sulfide flotation for composite samples from the west zone (YWMC 2010) as the majority of the estimated Mineral Resources are contained in the Yaxtché west zone.
Table 13-1 summarizes the historic metallurgical test programs for Yaxtché (El Quevar).
The following section describes the historic testwork for report completeness.

El Quevar Project Salta Province, Argentina
NI 43-101 Technical Report on Preliminary Economic Assessment
Page 13-2
October 2018 Project Number: 196410
Table 13-1: Summary, Metallurgical Testwork Programs
Laboratory Date Samples Testwork
DML July 2008 6 composites; oxide, mixed and sulfide
Initial testwork on composite samples of oxide, mixed and sulfide samples for whole ore cyanidation; selective silver flotation and cyanidation of flotation tailings;
DML January 2009 5 composites; master, east, west, central and sulfide only
Continued testwork from 2008 program for whole composite cyanidation, sulfide flotation with cyanide leaching of sulfide concentrate and flotation tailings.
DML January 2010 4 composites; master, east, west and central (sulfide only)
Continued testwork from 2009 program on the four composites for whole ore cyanidation, sulfide flotation with cyanide leaching of sulfide concentrate and flotation tailings.
DML March 2010 January 2010 master composite Continued selective flotation for copper/silver and cyanidation of flotation tailings on January 2010 Master Composite sample
JKTech/Hazen April 2010 Not identified Semiautogenous mill comminution (SMC); Bond ball mill work index (BWi); Bond abrasion index (Ai)
DML June 2010 January 2010 West Composite Memorandum for completed testwork on January 2010 West Composite of March 15.
DML February 2011 New YWMC 2010 west master; 129 individual samples from drill core and core rejects
Flotation and cyanidation testwork (with POX) on new YWMC 2010 West Master Composite comprised of samples from Oct 2010 and March 2010 drill core and core rejects.
DML October 2012 YWMC 2010 composite & May 2012 bulk sample
Continued testwork from 2011 program for flotation and cyanidation on YWMC 2010 composite and May 2012 bulk sample
13.2 Metallurgical Testwork
13.2.1 DML 2008 Testwork
Forty-five individual mineralized core samples from Yaxtché drill holes QVD-018 through QVD-022, and QVD024 were composited into six composites for the metallurgical test program. The composites were crushed to 10 Tyler mesh size and split into 1 kg charges. One charge from each composite was then split into four 250 g samples with two of the splits pulverized and submitted for head analysis. The composites were classified by degree of oxidation and grade (Table 13-2).
All tests were performed at a fine primary grind of approximately 80% passing 74 µm. No attempt was made to optimize either the cyanidation or flotation parameters.
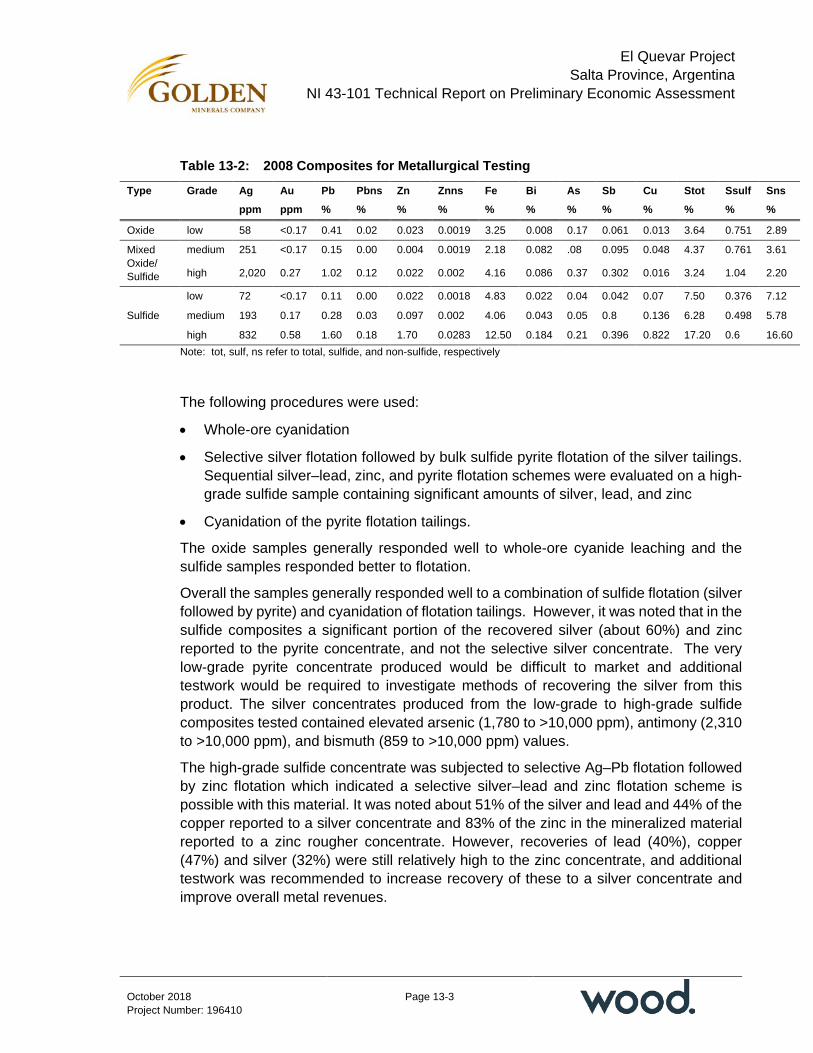
El Quevar Project Salta Province, Argentina
NI 43-101 Technical Report on Preliminary Economic Assessment
Page 13-3
October 2018 Project Number: 196410
Table 13-2: 2008 Composites for Metallurgical Testing
Type Grade Ag Au Pb Pbns Zn Znns Fe Bi As Sb Cu Stot Ssulf Sns ppm ppm % % % % % % % % % % % %
Oxide low 58 <0.17 0.41 0.02 0.023 0.0019 3.25 0.008 0.17 0.061 0.013 3.64 0.751 2.89
Mixed Oxide/ Sulfide
medium 251 <0.17 0.15 0.00 0.004 0.0019 2.18 0.082 .08 0.095 0.048 4.37 0.761 3.61
high 2,020 0.27 1.02 0.12 0.022 0.002 4.16 0.086 0.37 0.302 0.016 3.24 1.04 2.20
Sulfide
low 72 <0.17 0.11 0.00 0.022 0.0018 4.83 0.022 0.04 0.042 0.07 7.50 0.376 7.12
medium 193 0.17 0.28 0.03 0.097 0.002 4.06 0.043 0.05 0.8 0.136 6.28 0.498 5.78
high 832 0.58 1.60 0.18 1.70 0.0283 12.50 0.184 0.21 0.396 0.822 17.20 0.6 16.60 Note: tot, sulf, ns refer to total, sulfide, and non-sulfide, respectively
The following procedures were used:
• Whole-ore cyanidation
• Selective silver flotation followed by bulk sulfide pyrite flotation of the silver tailings. Sequential silver–lead, zinc, and pyrite flotation schemes were evaluated on a high- grade sulfide sample containing significant amounts of silver, lead, and zinc
• Cyanidation of the pyrite flotation tailings.
The oxide samples generally responded well to whole-ore cyanide leaching and the sulfide samples responded better to flotation.
Overall the samples generally responded well to a combination of sulfide flotation (silver followed by pyrite) and cyanidation of flotation tailings. However, it was noted that in the sulfide composites a significant portion of the recovered silver (about 60%) and zinc reported to the pyrite concentrate, and not the selective silver concentrate. The very low-grade pyrite concentrate produced would be difficult to market and additional testwork would be required to investigate methods of recovering the silver from this product. The silver concentrates produced from the low-grade to high-grade sulfide composites tested contained elevated arsenic (1,780 to >10,000 ppm), antimony (2,310 to >10,000 ppm), and bismuth (859 to >10,000 ppm) values.
The high-grade sulfide concentrate was subjected to selective Ag–Pb flotation followed by zinc flotation which indicated a selective silver–lead and zinc flotation scheme is possible with this material. It was noted about 51% of the silver and lead and 44% of the copper reported to a silver concentrate and 83% of the zinc in the mineralized material reported to a zinc rougher concentrate. However, recoveries of lead (40%), copper (47%) and silver (32%) were still relatively high to the zinc concentrate, and additional testwork was recommended to increase recovery of these to a silver concentrate and improve overall metal revenues.
El Quevar Project Salta Province, Argentina
NI 43-101 Technical Report on Preliminary Economic Assessment
Page 13-4
October 2018 Project Number: 196410
Whole-ore cyanidation results yielded lower silver extractions than the leaching of flotation concentrates and tails. Generally, the sulfide samples indicated the lowest recovery, possibly due to the presence of silver sulfosalts. Cyanide consumptions for the whole-ore leach tests varied from 1.4 to 10.4 kg/t depending upon the sample tested, when 5 g/L NaCN leach solution strength was used. Leach kinetic curves indicated that almost all the leachable silver was extracted in 48 hours. The testwork results are summarized in Table 13-3.
Based on DML’s 2008 metallurgical test results, the envisioned plant flowsheet for treating both oxides and sulfides would consist of the following processes:
• Primary crushing
• Semi-autogenous grind (SAG) and ball mill grinding with a vibrating screen and cyclones for size classification
• Rougher and cleaner flotation with regrind for the production of a final sulfide silver concentrate. Possible production of a separate zinc concentrate
• Thickening, filtering, and packaging for shipment of final sulfide silver and zinc concentrates
• Leaching (cyanide) of the flotation tailings
• Counter-current decantation circuit with thickeners producing a silver-bearing pregnant leach solution (PLS)
• Merrill-Crowe circuit for processing the PLS solution producing a doré for shipment to an off-site refinery
• Cyanide destruction circuit
• Disposal of final plant tailings.
13.2.2 DML 2009 Testwork
Five metallurgical composites were tested by DML during November and December of 2009 for their response to various sequential processing steps to determine the overall recovery of silver from the mineralized material of relevant zones. The processes tested on each composite comprised the following.
• Cyanide leaching of whole composites
• Flotation of the sulfides followed by cyanide leaching of the floated sulfides, plus cyanide leaching of the flotation tails
• Flotation (without leaching) of the sulfides, followed by cyanide leaching of the flotation tails.

El Quevar Project Salta Province, Argentina
NI 43-101 Technical Report on Preliminary Economic Assessment
Page 13-5
October 2018 Project Number: 196410
Table 13-3: Summary of 2008 Test Results
Composite Ag Recovered % From Composite Material
Whole-Ore Leach Head Assay **
Flotation Float Tails Leach Total* Ag (opt)
S= (wt%)
Low-grade oxide 36.2 27.2 63.4 53.0 65.0 2.81
Medium grade 74.5 15.2 89.7 83.0 314.0 3.48
Mixed high grade 78.1 11.6 89.7 83.4 1785.0 2.30
Sulfide low grade 79.1 11.8 90.9 44.2 80.0 6.58
Sulfide medium grade 88.l 8.4 96.5 56.9 189.0 6.15 Note: *Flotation + Flotation Tails Leach **Head assay back-calculated from flotation tests
Table 13-4 presents the head grade assays for the composites used in the 2009 testwork.
The tests showed that the various types of mineralization in the deposit were amenable to silver recovery by a combination of flotation and cyanide leaching of the flotation tails. Sulfide sample was less amenable to whole-ore cyanidation compared to flotation, especially the eastern composite sample. Table 13-5 summarizes the silver recoveries by composite for the three recovery methods.
13.2.3 DML 2010 Testwork
Laboratory testwork was performed to investigate silver recovery by a combination of flotation and cyanidation of mineralized material and flotation products from three new samples. The previous work performed on El Quevar samples had indicated good silver recovery by flotation (+90%), but not by whole-ore cyanidation (±60%). Attempts to increase silver extraction by ultra-fine grinding of float concentrate and two-stage, high cyanide leaching gave a 72% silver overall extraction with extremely high cyanide consumption.
A grind size of 80% minus 325 mesh was selected for the 2010 testwork. The leach cyanide concentration was determined according to the copper content of each composite material sample, to limit cyanide consumption. The NaCN concentration was added at a cyanide:copper ratio of 4.0, to supply sufficient cyanide for copper complexing, with only another 2 g/L NaCN added in excess.

El Quevar Project Salta Province, Argentina
NI 43-101 Technical Report on Preliminary Economic Assessment
Page 13-6
October 2018 Project Number: 196410
Table 13-4: Head Grade Assays from Composites used in 2009 Testwork
Composite Master West Central East Sulfide
Head grade Ag (g/t) 544 575 335 680 529
Table 13-5: Silver Recoveries by Composite and Recovery Method
Composite Whole-Ore Leach (%)
Flotation Conc Leach Plus Tails Leach (%)
Flotation Conc Plus Tails Leach (%)
Master 51.2 59.7 90.6
West 59.3 60.6 95.5
Central 67.0 68.7 80.2
East 18.5 57.9 92.8
Sulfide 59.7 70.1 91.2
The following tests were performed:
• Whole-ore cyanide leach with assay screen analysis of the leach residue
• Bulk sulfide flotation with assay screen analysis of the rougher tailings
• Cyanide leach of reground float concentrate with assay screen analysis of the leach residue
• Cyanide leach of rougher tailings with assay screen analysis of the leach residue.
• Selective flotation for silver recovery
• Gravity concentration of ground mineralized material for free silver determination.
The first four tests were performed on each of the three samples and on an equal weight master composite (MC). The last two tests were performed only on the master composite.
A total of 116 samples were received for testing, 65 of which were used to make up the three composites. The samples were each blended, and 1.0 kg charges were split out for the testwork using a rotary splitter. Six charges of each of the three composites were combined to produce an 18 kg MC. Head samples were sub-split, pulverized, and submitted for analysis. Table 13-6 summarizes the head grades.

El Quevar Project Salta Province, Argentina
NI 43-101 Technical Report on Preliminary Economic Assessment
Page 13-7
October 2018 Project Number: 196410
Table 13-6: Head Grades for the 2010 Test Composites
Head Grades
ppm Weight %
Composite Au Ag Cu Fe Pb Zn S= As Bi Sb
Master 0.185 517 0.41 4.24 0.46 0.16 4.02 0.15 0.10 0.15
West Zone <0.001 529 0.11 5.07 0.25 0.02 5.35 0.07 0.00 No assay
Central Zone 0.008 313 0.03 2.64 0.90 0.35 2.13 0.06 0.10 No assay
East Zone 0.218 658 1.02 0.47 0.22 0.09 4.89 0.28 0.20 No assay
The mineralized material was treated by a combination of cyanide and flotation test procedures at a grind of 80% minus 45 µm. About 51% of the silver was leached from the master composite utilizing a whole-ore leach, whereas 81% was recovered by bulk sulfide flotation. The flotation concentrate was reground and leached, and the flotation tails leached separately, for a combined float/leach recovery of 60%. A total of 90% recovery was obtained from the combined bulk float concentrate plus leaching of the rougher tailings.
Very high cyanide consumption was noted for the cyanide leach of the master and east composites due mainly to the presence of copper in the mineralized material. Cyanide consumption of about 14 kg/t and 41 kg/t of mineralized material was determined for the two samples, respectively, and 1–2 kg/t for the other two samples, for the combined regrind concentrate and tailings leaches. The consumption was about the same as for the whole-ore leaches (the East composite was slightly less due to insufficient NaCN), even though the silver and copper extraction was significantly greater.
Table 13-7 summarizes the silver recovery by flotation and cyanide leaching.
Testwork continued on the MC sample to investigate the effect of variations in the test procedure on overall silver recovery. The baseline procedure consisted of selective flotation of a silver/copper concentrate at ambient pH, followed by cyanide leaching of the flotation tailings. An assay screen analysis was determined on both the rougher tailings and the leach residue.
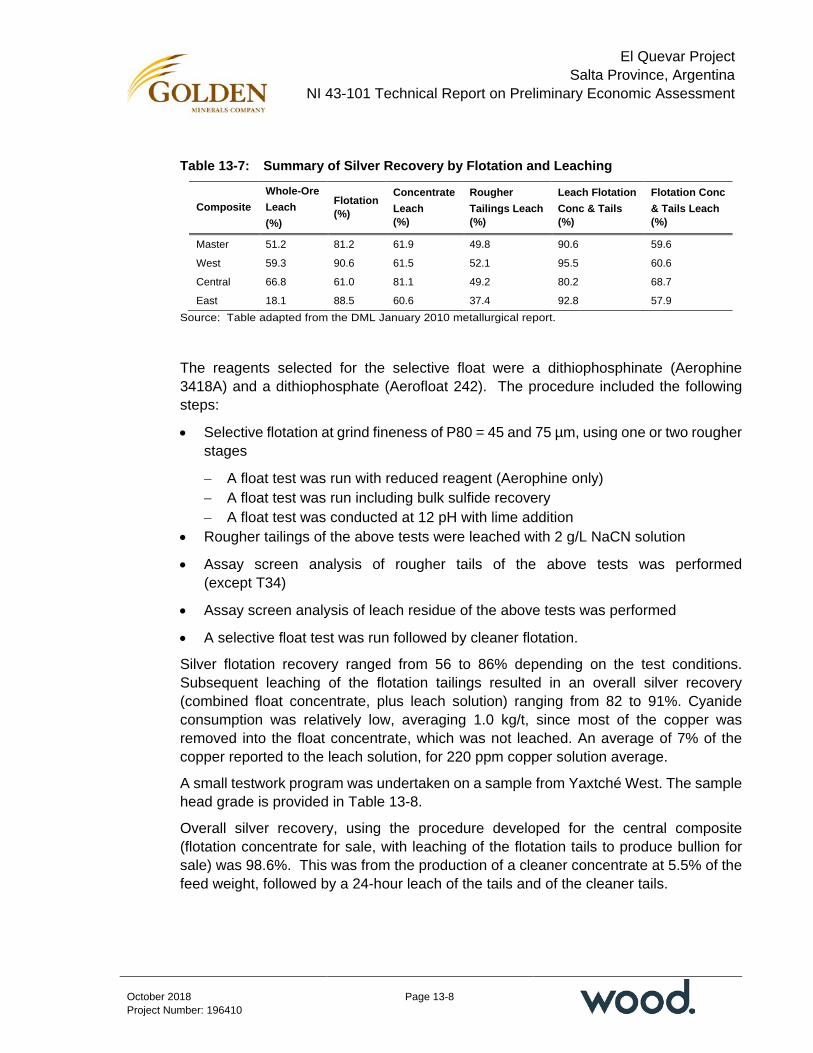
El Quevar Project Salta Province, Argentina
NI 43-101 Technical Report on Preliminary Economic Assessment
Page 13-8
October 2018 Project Number: 196410
Table 13-7: Summary of Silver Recovery by Flotation and Leaching
Composite Whole-Ore Leach (%)
Flotation (%)
Concentrate Leach (%)
Rougher Tailings Leach (%)
Leach Flotation Conc & Tails (%)
Flotation Conc & Tails Leach (%)
Master 51.2 81.2 61.9 49.8 90.6 59.6
West 59.3 90.6 61.5 52.1 95.5 60.6
Central 66.8 61.0 81.1 49.2 80.2 68.7
East 18.1 88.5 60.6 37.4 92.8 57.9 Source: Table adapted from the DML January 2010 metallurgical report.
The reagents selected for the selective float were a dithiophosphinate (Aerophine 3418A) and a dithiophosphate (Aerofloat 242). The procedure included the following steps:
• Selective flotation at grind fineness of P80 = 45 and 75 µm, using one or two rougher stages
− A float test was run with reduced reagent (Aerophine only) − A float test was run including bulk sulfide recovery − A float test was conducted at 12 pH with lime addition
• Rougher tailings of the above tests were leached with 2 g/L NaCN solution
• Assay screen analysis of rougher tails of the above tests was performed (except T34)
• Assay screen analysis of leach residue of the above tests was performed
• A selective float test was run followed by cleaner flotation.
Silver flotation recovery ranged from 56 to 86% depending on the test conditions. Subsequent leaching of the flotation tailings resulted in an overall silver recovery (combined float concentrate, plus leach solution) ranging from 82 to 91%. Cyanide consumption was relatively low, averaging 1.0 kg/t, since most of the copper was removed into the float concentrate, which was not leached. An average of 7% of the copper reported to the leach solution, for 220 ppm copper solution average.
A small testwork program was undertaken on a sample from Yaxtché West. The sample head grade is provided in Table 13-8.
Overall silver recovery, using the procedure developed for the central composite (flotation concentrate for sale, with leaching of the flotation tails to produce bullion for sale) was 98.6%. This was from the production of a cleaner concentrate at 5.5% of the feed weight, followed by a 24-hour leach of the tails and of the cleaner tails.
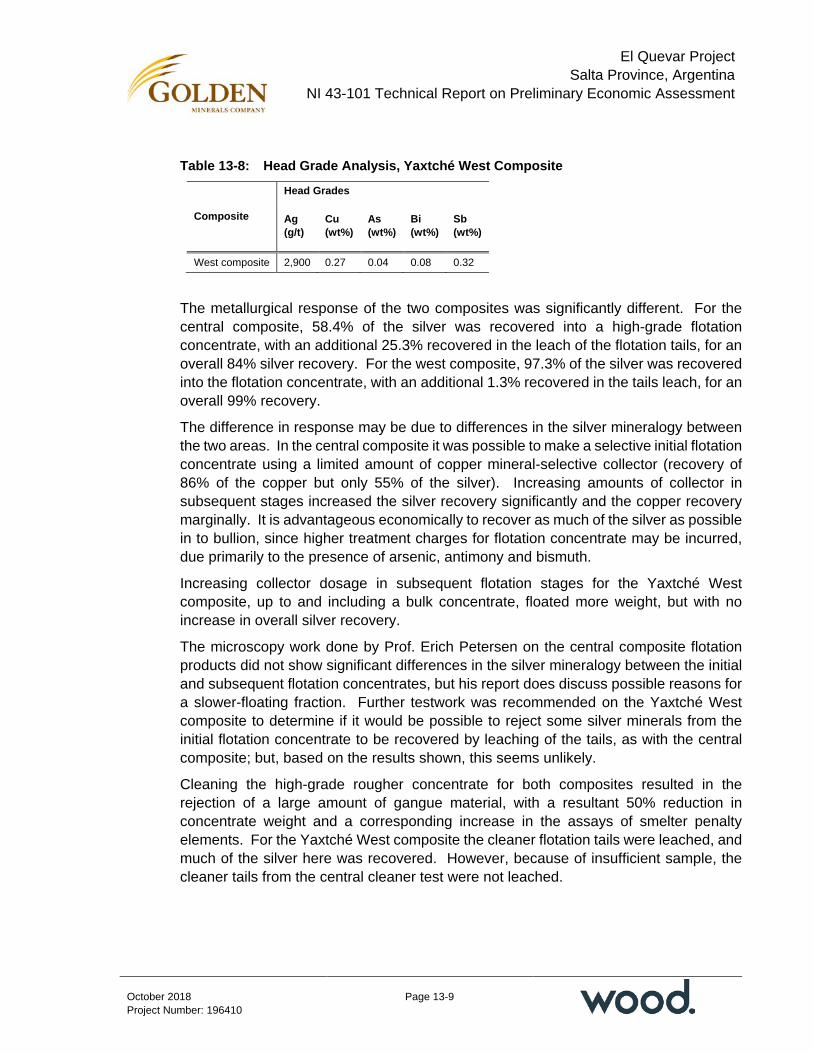
El Quevar Project Salta Province, Argentina
NI 43-101 Technical Report on Preliminary Economic Assessment
Page 13-9
October 2018 Project Number: 196410
Table 13-8: Head Grade Analysis, Yaxtché West Composite
Composite
Head Grades
Ag (g/t)
Cu (wt%)
As (wt%)
Bi (wt%)
Sb (wt%)
West composite 2,900 0.27 0.04 0.08 0.32
The metallurgical response of the two composites was significantly different. For the central composite, 58.4% of the silver was recovered into a high-grade flotation concentrate, with an additional 25.3% recovered in the leach of the flotation tails, for an overall 84% silver recovery. For the west composite, 97.3% of the silver was recovered into the flotation concentrate, with an additional 1.3% recovered in the tails leach, for an overall 99% recovery.
The difference in response may be due to differences in the silver mineralogy between the two areas. In the central composite it was possible to make a selective initial flotation concentrate using a limited amount of copper mineral-selective collector (recovery of 86% of the copper but only 55% of the silver). Increasing amounts of collector in subsequent stages increased the silver recovery significantly and the copper recovery marginally. It is advantageous economically to recover as much of the silver as possible in to bullion, since higher treatment charges for flotation concentrate may be incurred, due primarily to the presence of arsenic, antimony and bismuth.
Increasing collector dosage in subsequent flotation stages for the Yaxtché West composite, up to and including a bulk concentrate, floated more weight, but with no increase in overall silver recovery.
The microscopy work done by Prof. Erich Petersen on the central composite flotation products did not show significant differences in the silver mineralogy between the initial and subsequent flotation concentrates, but his report does discuss possible reasons for a slower-floating fraction. Further testwork was recommended on the Yaxtché West composite to determine if it would be possible to reject some silver minerals from the initial flotation concentrate to be recovered by leaching of the tails, as with the central composite; but, based on the results shown, this seems unlikely.
Cleaning the high-grade rougher concentrate for both composites resulted in the rejection of a large amount of gangue material, with a resultant 50% reduction in concentrate weight and a corresponding increase in the assays of smelter penalty elements. For the Yaxtché West composite the cleaner flotation tails were leached, and much of the silver here was recovered. However, because of insufficient sample, the cleaner tails from the central cleaner test were not leached.
El Quevar Project Salta Province, Argentina
NI 43-101 Technical Report on Preliminary Economic Assessment
Page 13-10
October 2018 Project Number: 196410
Testwork at both 45 µm and 75 µm grinds was evaluated, and although the difference is small, preliminary calculations indicated that the finer grind would be economically warranted.
13.2.4 JKTech/Hazen 2010 Testwork
Three samples from El Quevar were sent to Hazen Research laboratory in Golden, Colorado in April 2010. The samples were from drill core and labelled as Area A (Yaxtché East), Area C (Yaxtché Central) and Area G (Yaxtché West). Testwork was done at Hazen based on JKTech test parameters and evaluated by JKTech. The objectives of the testwork were to determine the following comminution parameters:
• Semiautogenous (SAG) mill comminution (SMC)
• Bond ball mill work index (BWi)
• Bond abrasion index (Ai).
Table 13-9 summarizes the test results for the JKTech/Hazen program.
The results of the JKTech/Hazen testwork were used by SE in the plant’s design criteria and wear material consumption rates for grinding media and liner wear as summarized in Table 13-10.
13.2.5 DML 2011 Testwork
A total of 129 individual samples with a total weight of about 65 kg sampled from drill core and drill core laboratory reject material distributed from throughout the deposit was received in October 2010 and was combined with previously composited drill core and drill core reject material received in March 2010 to form a representative sulfide sample from Yaxtché. A new blended-grade composite designated as YWMC-2010 (Yaxtché West master composite) was created using these samples. Figure 13-1 shows the drill core locations for the YWMC 2010 metallurgical samples.
Testwork was performed on this composite following the flotation and cyanide leach procedures used in the previous work. Previous work recommended further testwork on the Yaxtché West composite to determine if it would be possible to reject some silver minerals from the initial flotation concentrate to be recovered by leaching of the tails, as with the central composite. In addition, due to the presence of high levels of deleterious elements in flotation concentrate in previous work, as an alternative flowsheet it was also recommended to investigate the pre-treatment of the mineralized material using pressure oxidation to try and improve the low direct- cyanidation recoveries.

El Quevar Project Salta Province, Argentina
NI 43-101 Technical Report on Preliminary Economic Assessment
Page 13-11
October 2018 Project Number: 196410
Table 13-9: Results for the JKTech/Hazen Testwork
Test Parameter Units Samples Area A Area C Area G
Bond work index (BWi) kWh/t 15.5 9.4 14.2
Abrasion index (Ai) g 1.0338 0.1885 0.1974
SMC testwork:
A x b Hardness 49.9 137.9 67.3
Drop weight index (DWi) kWh/m3 5.67 2.05 3.64
Drop weight index (DWi) % 50 9 23
Table 13-10: Estimated Consumption Rates for Wear Materials by Area Samples Wear Materials Units Area A Area C Area G
Crusher liners lb/kWh 0.1140 0.0371 0.0379
Ball mill liners lb/kWh 0.02610 0.0154 0.0156
Ball mill grinding balls lb/kWh 0.3522 0.1964 0.1996

El Quevar Project Salta Province, Argentina
NI 43-101 Technical Report on Preliminary Economic Assessment
Page 13-1
October 2018 Project Number: 196410
Figure 13-1: YWMC 2010 Metallurgical Sample Drill Hole Locations (looking northeast)
Note: Figure courtesy Golden Minerals, 2018.
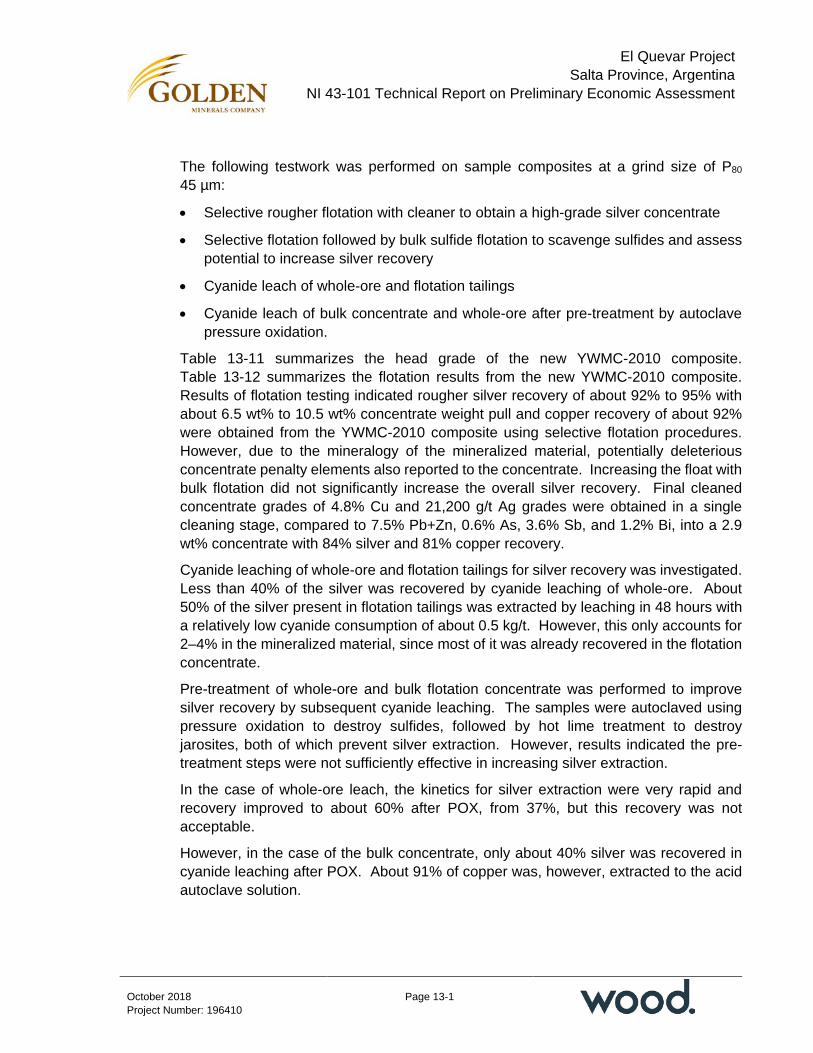
El Quevar Project Salta Province, Argentina
NI 43-101 Technical Report on Preliminary Economic Assessment
Page 13-1
October 2018 Project Number: 196410
The following testwork was performed on sample composites at a grind size of P80 45 µm:
• Selective rougher flotation with cleaner to obtain a high-grade silver concentrate
• Selective flotation followed by bulk sulfide flotation to scavenge sulfides and assess potential to increase silver recovery
• Cyanide leach of whole-ore and flotation tailings
• Cyanide leach of bulk concentrate and whole-ore after pre-treatment by autoclave pressure oxidation.
Table 13-11 summarizes the head grade of the new YWMC-2010 composite. Table 13-12 summarizes the flotation results from the new YWMC-2010 composite. Results of flotation testing indicated rougher silver recovery of about 92% to 95% with about 6.5 wt% to 10.5 wt% concentrate weight pull and copper recovery of about 92% were obtained from the YWMC-2010 composite using selective flotation procedures. However, due to the mineralogy of the mineralized material, potentially deleterious concentrate penalty elements also reported to the concentrate. Increasing the float with bulk flotation did not significantly increase the overall silver recovery. Final cleaned concentrate grades of 4.8% Cu and 21,200 g/t Ag grades were obtained in a single cleaning stage, compared to 7.5% Pb+Zn, 0.6% As, 3.6% Sb, and 1.2% Bi, into a 2.9 wt% concentrate with 84% silver and 81% copper recovery.
Cyanide leaching of whole-ore and flotation tailings for silver recovery was investigated. Less than 40% of the silver was recovered by cyanide leaching of whole-ore. About 50% of the silver present in flotation tailings was extracted by leaching in 48 hours with a relatively low cyanide consumption of about 0.5 kg/t. However, this only accounts for 2–4% in the mineralized material, since most of it was already recovered in the flotation concentrate.
Pre-treatment of whole-ore and bulk flotation concentrate was performed to improve silver recovery by subsequent cyanide leaching. The samples were autoclaved using pressure oxidation to destroy sulfides, followed by hot lime treatment to destroy jarosites, both of which prevent silver extraction. However, results indicated the pre-treatment steps were not sufficiently effective in increasing silver extraction.
In the case of whole-ore leach, the kinetics for silver extraction were very rapid and recovery improved to about 60% after POX, from 37%, but this recovery was not acceptable.
However, in the case of the bulk concentrate, only about 40% silver was recovered in cyanide leaching after POX. About 91% of copper was, however, extracted to the acid autoclave solution.
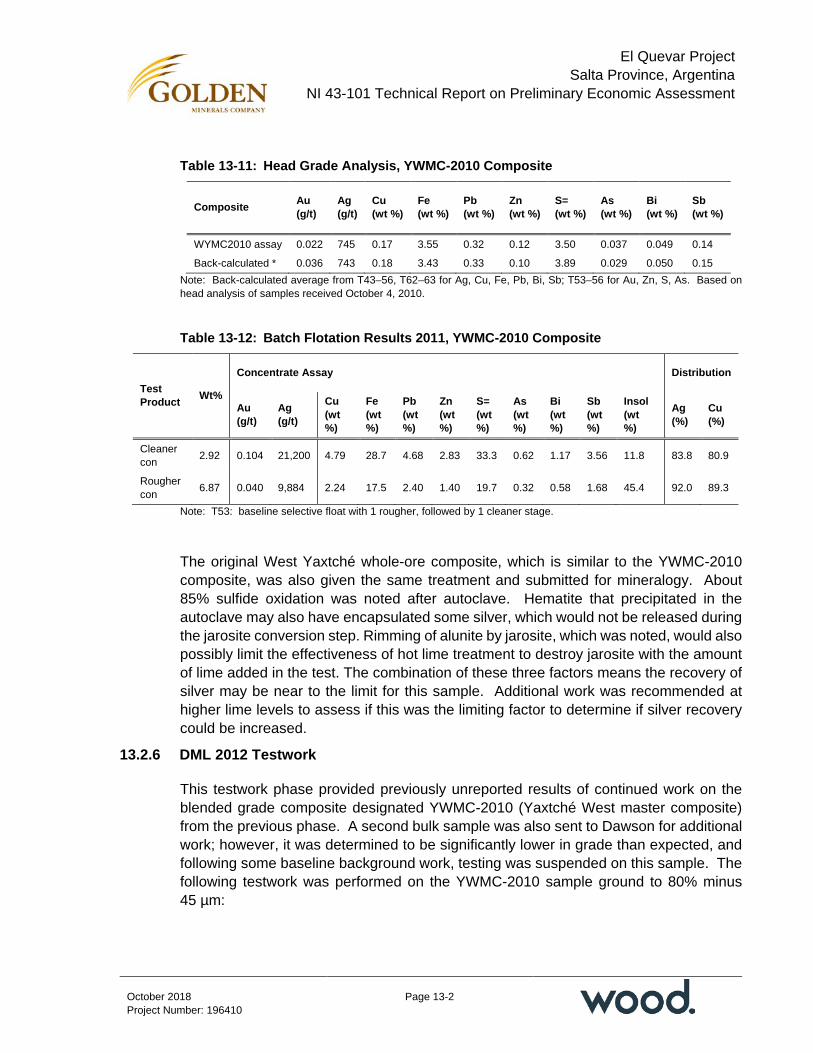
El Quevar Project Salta Province, Argentina
NI 43-101 Technical Report on Preliminary Economic Assessment
Page 13-2
October 2018 Project Number: 196410
Table 13-11: Head Grade Analysis, YWMC-2010 Composite
Composite Au (g/t)
Ag (g/t)
Cu (wt %)
Fe (wt %)
Pb (wt %)
Zn (wt %)
S= (wt %)
As (wt %)
Bi (wt %)
Sb (wt %)
WYMC2010 assay 0.022 745 0.17 3.55 0.32 0.12 3.50 0.037 0.049 0.14
Back-calculated * 0.036 743 0.18 3.43 0.33 0.10 3.89 0.029 0.050 0.15 Note: Back-calculated average from T43–56, T62–63 for Ag, Cu, Fe, Pb, Bi, Sb; T53–56 for Au, Zn, S, As. Based on head analysis of samples received October 4, 2010.
Table 13-12: Batch Flotation Results 2011, YWMC-2010 Composite
Test Product Wt%
Concentrate Assay Distribution
Au (g/t)
Ag (g/t)
Cu (wt %)
Fe (wt %)
Pb (wt %)
Zn (wt %)
S= (wt %)
As (wt %)
Bi (wt %)
Sb (wt %)
Insol (wt %)
Ag (%)
Cu (%)
Cleaner con 2.92 0.104 21,200 4.79 28.7 4.68 2.83 33.3 0.62 1.17 3.56 11.8 83.8 80.9
Rougher con 6.87 0.040 9,884 2.24 17.5 2.40 1.40 19.7 0.32 0.58 1.68 45.4 92.0 89.3
Note: T53: baseline selective float with 1 rougher, followed by 1 cleaner stage.
The original West Yaxtché whole-ore composite, which is similar to the YWMC-2010 composite, was also given the same treatment and submitted for mineralogy. About 85% sulfide oxidation was noted after autoclave. Hematite that precipitated in the autoclave may also have encapsulated some silver, which would not be released during the jarosite conversion step. Rimming of alunite by jarosite, which was noted, would also possibly limit the effectiveness of hot lime treatment to destroy jarosite with the amount of lime added in the test. The combination of these three factors means the recovery of silver may be near to the limit for this sample. Additional work was recommended at higher lime levels to assess if this was the limiting factor to determine if silver recovery could be increased.
13.2.6 DML 2012 Testwork
This testwork phase provided previously unreported results of continued work on the blended grade composite designated YWMC-2010 (Yaxtché West master composite) from the previous phase. A second bulk sample was also sent to Dawson for additional work; however, it was determined to be significantly lower in grade than expected, and following some baseline background work, testing was suspended on this sample. The following testwork was performed on the YWMC-2010 sample ground to 80% minus 45 µm:

El Quevar Project Salta Province, Argentina
NI 43-101 Technical Report on Preliminary Economic Assessment
Page 13-3
October 2018 Project Number: 196410
• Selective rougher flotation with two stages of batch cleaning, to try and obtain a higher grade of concentrate than obtained previously with one stage
• Repeat selective batch rougher and two cleaner stage of cleaning including a cleaner scavenger to define conditions for a subsequent locked cycle test
• A locked cycle flotation test using two cleaner stages, with no rougher concentrate regrind
• A second stage of lime treatment prior to cyanide leach of rougher flotation concentrate which had already been given POX plus hot lime treatment
• A second stage of lime treatment prior to cyanide leach of whole-ore which had already been given POX plus hot lime treatment.
Primary grind sensitivity and batch rougher cleaner flotation tests with and without rougher concentrate regrind were also conducted on the YWMC composite and other previous samples.
Table 13-13 summarizes the 2012 reported batch flotation results with the YWMC-2010 composite relative to the baseline 2011 test result with only one stage of cleaning. Table 13-14 summarizes the flotation locked cycle tests performed.
The results of the batch and locked cycle flotation on the composite indicated 93% Ag could be recovered to a 6.4 wt% weight pull concentrate with a 10,600 g/t Ag grade. The cleaner test was performed without regrind of the rougher concentrate. Tests indicated that a much higher silver grade could be obtained with regrind. However, the relatively high content of arsenic, antimony and bismuth in the concentrate remains a marketing concern.
Table 13-15 summarizes the results of a primary grind sensitivity on the composite with and without concentrate regrind using a single cleaner stage.
The results indicated an average silver recovery to the combined cleaner concentrate plus scavenger cleaner concentrate increased from 85.2% to 88.5% as the primary grind P80 fineness increased from 106 to 75 µm. Recovery did not increase with further grinding. The first cleaner concentrate grade averaged 500 g/t Ag when the rougher concentrate was not re-ground, and 750 g/t Ag when it was re-ground to a target of 45 µm. However, this compared with 10,000 g/t Ag for the WYMC-2010 composite. About 15 wt% of the mineralized material weight reported to the rougher stage, reduced to 9.5 wt% with one stage of cleaning.
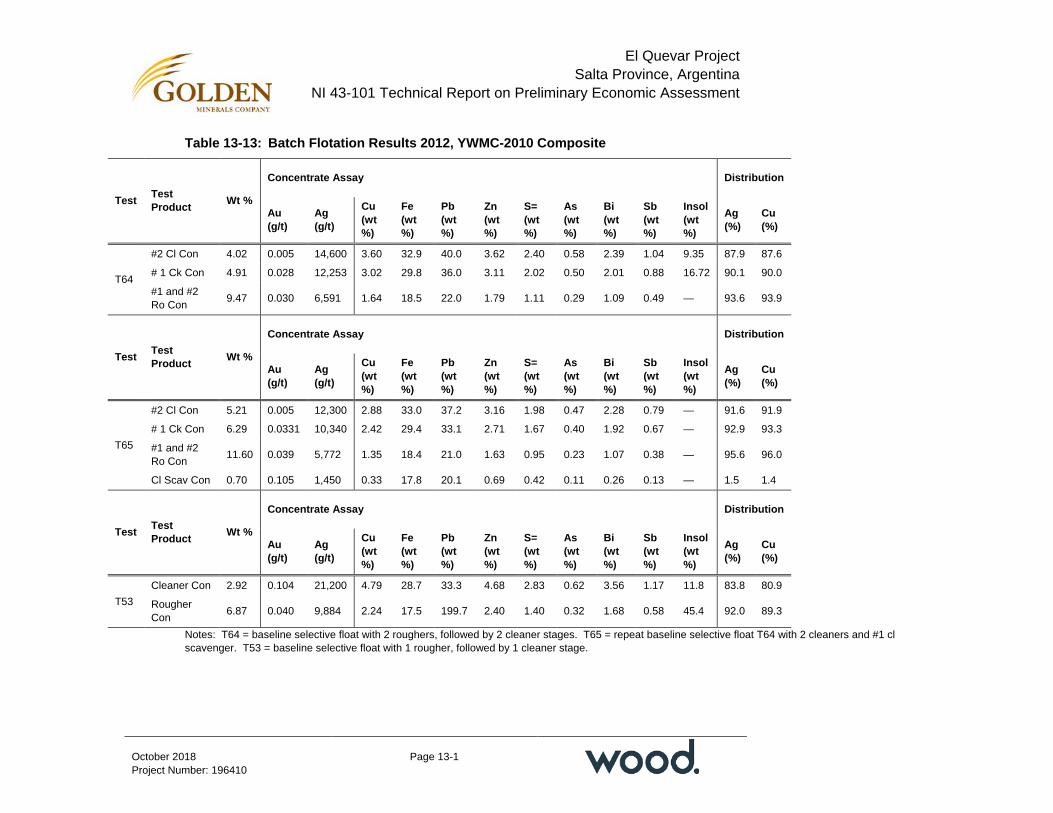
El Quevar Project Salta Province, Argentina
NI 43-101 Technical Report on Preliminary Economic Assessment
Page 13-1
October 2018 Project Number: 196410
Table 13-13: Batch Flotation Results 2012, YWMC-2010 Composite
Test Test Product Wt %
Concentrate Assay Distribution
Au (g/t)
Ag (g/t)
Cu (wt %)
Fe (wt %)
Pb (wt %)
Zn (wt %)
S= (wt %)
As (wt %)
Bi (wt %)
Sb (wt %)
Insol (wt %)
Ag (%)
Cu (%)
T64
#2 Cl Con 4.02 0.005 14,600 3.60 32.9 40.0 3.62 2.40 0.58 2.39 1.04 9.35 87.9 87.6
# 1 Ck Con 4.91 0.028 12,253 3.02 29.8 36.0 3.11 2.02 0.50 2.01 0.88 16.72 90.1 90.0
#1 and #2 Ro Con 9.47 0.030 6,591 1.64 18.5 22.0 1.79 1.11 0.29 1.09 0.49 — 93.6 93.9
Test Test Product Wt %
Concentrate Assay Distribution
Au (g/t)
Ag (g/t)
Cu (wt %)
Fe (wt %)
Pb (wt %)
Zn (wt %)
S= (wt %)
As (wt %)
Bi (wt %)
Sb (wt %)
Insol (wt %)
Ag (%)
Cu (%)
T65
#2 Cl Con 5.21 0.005 12,300 2.88 33.0 37.2 3.16 1.98 0.47 2.28 0.79 — 91.6 91.9
# 1 Ck Con 6.29 0.0331 10,340 2.42 29.4 33.1 2.71 1.67 0.40 1.92 0.67 — 92.9 93.3
#1 and #2 Ro Con 11.60 0.039 5,772 1.35 18.4 21.0 1.63 0.95 0.23 1.07 0.38 — 95.6 96.0
Cl Scav Con 0.70 0.105 1,450 0.33 17.8 20.1 0.69 0.42 0.11 0.26 0.13 — 1.5 1.4
Test Test Product Wt %
Concentrate Assay Distribution
Au (g/t)
Ag (g/t)
Cu (wt %)
Fe (wt %)
Pb (wt %)
Zn (wt %)
S= (wt %)
As (wt %)
Bi (wt %)
Sb (wt %)
Insol (wt %)
Ag (%)
Cu (%)
T53 Cleaner Con 2.92 0.104 21,200 4.79 28.7 33.3 4.68 2.83 0.62 3.56 1.17 11.8 83.8 80.9
Rougher Con 6.87 0.040 9,884 2.24 17.5 199.7 2.40 1.40 0.32 1.68 0.58 45.4 92.0 89.3
Notes: T64 = baseline selective float with 2 roughers, followed by 2 cleaner stages. T65 = repeat baseline selective float T64 with 2 cleaners and #1 cl scavenger. T53 = baseline selective float with 1 rougher, followed by 1 cleaner stage.

El Quevar Project Salta Province, Argentina
NI 43-101 Technical Report on Preliminary Economic Assessment
Page 13-2
October 2018 Project Number: 196410
Table 13-14: Locked Cycle Flotation Results 2012, YWMC-2010 Composite
Product Overall wt%
Assay Distribution Ag (g/t)
Cu (%)
Fe (%)
S (%)
Au (g/t) Ag
(%) Cu (%)
Fe (%)
S (%)
Au (%)
#2 Cleaner Con 6.41 10,598 2.37 35.16 39.2 0.350 93.10 92.6
Cl Scav Tails 5.59 272 0.060 3.40 4.53 0.040 2.08 2.0
Ro Tails 88.01 40.0 0.010 1.07 3.04 0.016 4.82 5.4
Total Av 100 730 0.164 3.39 4.56 0.039 100.00 100.0
Product Overall wt%
Assay Distribution Pb (%)
Zn (%)
As (%)
Sb (%)
Bi (%)
Insol (%)
Pb (%)
Zn (%)
As (%)
Sb (%)
Bi (%)
#2 Cleaner Con 6.41 2.53 1.71 0.40 1.89 0.63 11.3 52.3 90.9 77.9 80.9 85.3
Cl Scav Tails 5.59 0.32 0.04 0.02 0.07 0.030 84.6 5.7 1.9 3.4 2.6 3.5
Ro Tails 88.01 0.15 0.01 0.01 0.03 0.006 90.0 42.0 7.3 18.77 16.5 11.2
Total Av 100 0.31 0.12 0.03 0.15 0.047 84.7 100.0 100.0 100.0 100.0 100.0 Note: T66: metallurgical balance based on average of cycles 4–6.
Table 13-15: Grind Sensitivity Batch Flotation Results
Test #
Target P80 (µm)
Cl Con (wt%)
Cleaner Concentrate Assay Dist Cl = Scav. Con
Ro Grind
Cl Regrind Au
(g/t) Ag (g/t)
Cu (wt %)
Fe (wt %)
Pb (wt %)
Zn (wt %)
S= (wt %)
As (wt %)
Bi (wt %)
Sb (wt %)
Insol (wt %)
Ag (%)
Cu (%)
67 106 106 15.5 0.073 489 1.58 29.0 34.5 0.05 0.03 0.48 0.30 0.12 31.7 85.0 93.4
68 106 45 9.3 0.118 767 2.65 40.6 48.4 0.08 0.09 0.47 0.47 0.19 6.7 85.4 92.4
69 75 75 14.3 0.086 522 1.9 31.8 37.5 0.05 0.04 0.48 0.32 0.12 24.1 89.1 93.0
70 75 45 9.6 0.122 731 2.42 42.4 48.5 0.07 0.06 0.64 0.43 0.18 5.8 88.0 92.5
71 45 45 11.3 0.092 644 2.18 36.3 43.0 0.06 0.05 0.56 0.38 0.17 13.4 84.7 90.1 Note: selective flotation with/without regrind and 1 stage cleaning.

El Quevar Project Salta Province, Argentina
NI 43-101 Technical Report on Preliminary Economic Assessment
Page 13-1
October 2018 Project Number: 196410
An autoclave/hot lime leach alternative to extract the silver while excluding these impurities was investigated as recommended from the previous phase, without satisfactory results. Efforts to improve the silver recovery by including a second lime boil stage were only partly successful in this study. An overall recovery of 51% Ag was achieved for the flotation concentrate and 70% for whole-ore. The presence of hematite that could encapsulate silver and the occurrence of silver containing lead locked in quartz was also noted in a mineralogical assessment of autoclave discharge in the previous testwork phase. The recovery of silver using this process alternative still appears to be mineralogically limiting, and further mineralogical studies and testwork are required to identify the factors negatively impacting silver recovery and assess the potential to improve the results.
Table 13-16 summarizes the head analysis of the October 2011 low-grade Yaxtché West bulk sample on which some preliminary work was conducted to obtain background data. The silver grade of the bulk sample (83 g/t Ag) is significantly lower than the YWMC- 2010 composite (745 g/t Ag) and previous samples. A grind study on the bulk sample showed that the mineralized material was significantly harder than the earlier composites.
Tests indicated that silver could be recovered from this sample using the selective flotation procedure. However, the concentrate grade was low, with relatively high arsenic, antimony and bismuth contents. This bulk sample apparently was extremely lower in grade than anticipated, and most of the testing was not completed.
However, preliminary flotation tests on this sample did indicate comparable rougher recovery at 106 and 75 µm primary grind, and it may not be necessary to grind the mineralized material to the finer size.
Additional tests on representative samples with typical silver grades would be needed to confirm this.
13.3 Recovery Estimates
The metallurgical programs conducted at DML examined several processing options including:
• Whole ore cyanidation;
• Whole ore cyanidation after POX;
• Flotation (rougher and cleaner);
• Flotation and cyanidation of flotation tailings;
• Flotation and cyanidation of flotation concentrate and flotation tailings; and
• Flotation and POX cyanidation of flotation concentrate and flotation tailings.
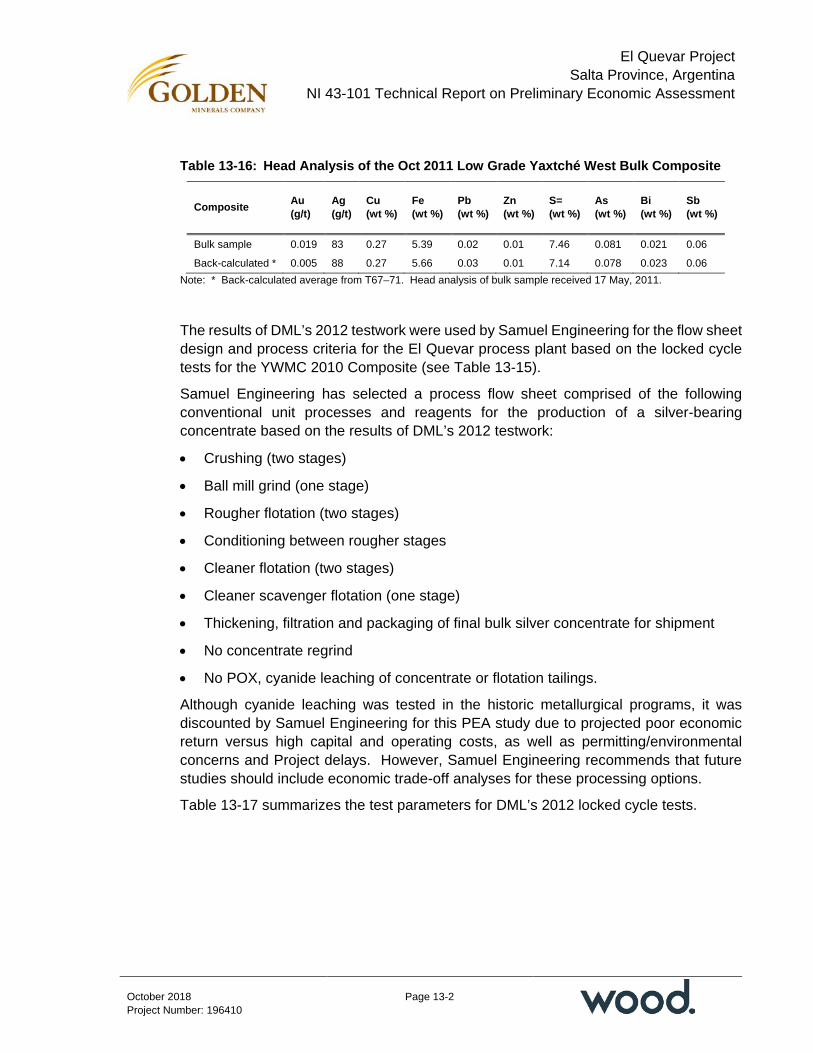
El Quevar Project Salta Province, Argentina
NI 43-101 Technical Report on Preliminary Economic Assessment
Page 13-2
October 2018 Project Number: 196410
Table 13-16: Head Analysis of the Oct 2011 Low Grade Yaxtché West Bulk Composite
Composite Au (g/t)
Ag (g/t)
Cu (wt %)
Fe (wt %)
Pb (wt %)
Zn (wt %)
S= (wt %)
As (wt %)
Bi (wt %)
Sb (wt %)
Bulk sample 0.019 83 0.27 5.39 0.02 0.01 7.46 0.081 0.021 0.06
Back-calculated * 0.005 88 0.27 5.66 0.03 0.01 7.14 0.078 0.023 0.06 Note: * Back-calculated average from T67–71. Head analysis of bulk sample received 17 May, 2011.
The results of DML’s 2012 testwork were used by Samuel Engineering for the flow sheet design and process criteria for the El Quevar process plant based on the locked cycle tests for the YWMC 2010 Composite (see Table 13-15).
Samuel Engineering has selected a process flow sheet comprised of the following conventional unit processes and reagents for the production of a silver-bearing concentrate based on the results of DML’s 2012 testwork:
• Crushing (two stages)
• Ball mill grind (one stage)
• Rougher flotation (two stages)
• Conditioning between rougher stages
• Cleaner flotation (two stages)
• Cleaner scavenger flotation (one stage)
• Thickening, filtration and packaging of final bulk silver concentrate for shipment
• No concentrate regrind
• No POX, cyanide leaching of concentrate or flotation tailings.
Although cyanide leaching was tested in the historic metallurgical programs, it was discounted by Samuel Engineering for this PEA study due to projected poor economic return versus high capital and operating costs, as well as permitting/environmental concerns and Project delays. However, Samuel Engineering recommends that future studies should include economic trade-off analyses for these processing options.
Table 13-17 summarizes the test parameters for DML’s 2012 locked cycle tests.

El Quevar Project Salta Province, Argentina
NI 43-101 Technical Report on Preliminary Economic Assessment
Page 13-3
October 2018 Project Number: 196410
Table 13-17: DML 2012 Locked Cycle Test Parameters
Description Units Values
Grind size P80 µm 45
Grind solids % 50
Rougher flotation first stage min 5
Conditioner min 2
Rougher flotation second stage min 5
Cleaner flotation first stage min 4
Cleaner scavenger flotation first stage min 4
Cleaner flotation second stage min 4
Cytec 3418A: ball mill g/t 25
Cytec 3418A: conditioner g/t 5
Cytec 3418A: cleaner scavenger first stage g/t 2.5
Cytec 242: ball mill g/t 25
Cytec 242: conditioner g/t 5
Cytec 242: cleaner scavenger first stage g/t 2.5
MIBC frother: rougher first stage g/t 0.030
MIBC frother: rougher second stage g/t 0.015
pH: rougher flotation first stage — 6.8
pH: rougher flotation second stage — 6.3
pH: cleaner flotation first stage — 6.9
pH: cleaner scavenger flotation first stage — 7.1
pH: cleaner flotation second stage — 7.5
Samuel Engineering estimates that the only payable metal in the flotation concentrate is silver. The combined assays for the copper, lead and zinc base metals only totaled 6.61% and would not be payable, and the gold assay of 0.35 g/t is below the minimum cut-off of 1 g/t (see Table 13-14). Elevated assay levels for the impurities of arsenic, antimony and bismuth were noted in the silver concentrate. At these levels, penalties would be expected for smelting terms.
13.4 Metallurgical Variability
Large variations in silver recovery were noted for selective flotation in the test programs primarily being related to the testing parameters and deposit zone (east, central and west) as summarized in Table 13-18.
These variations in silver recoveries from zone to zone likely indicate differences in silver mineralogy and lithology for recovery by flotation, but also could be due to the differences in silver grades between the samples.
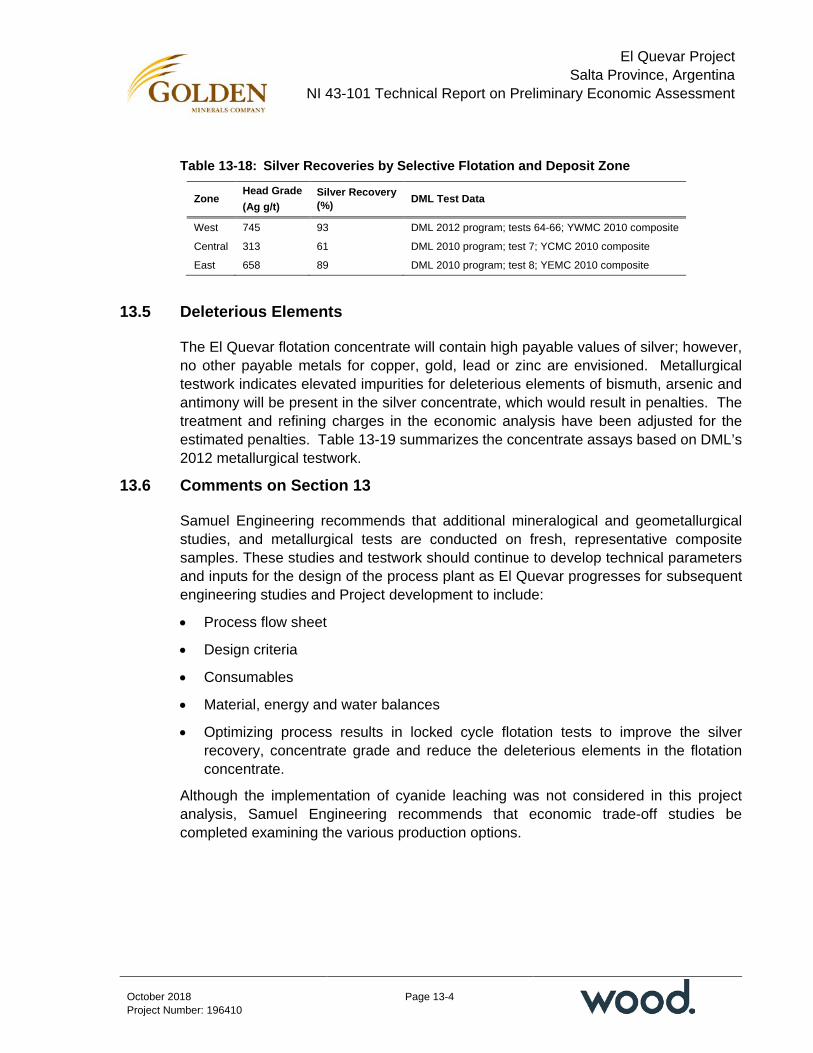
El Quevar Project Salta Province, Argentina
NI 43-101 Technical Report on Preliminary Economic Assessment
Page 13-4
October 2018 Project Number: 196410
Table 13-18: Silver Recoveries by Selective Flotation and Deposit Zone
Zone Head Grade (Ag g/t)
Silver Recovery (%) DML Test Data
West 745 93 DML 2012 program; tests 64-66; YWMC 2010 composite
Central 313 61 DML 2010 program; test 7; YCMC 2010 composite
East 658 89 DML 2010 program; test 8; YEMC 2010 composite
13.5 Deleterious Elements
The El Quevar flotation concentrate will contain high payable values of silver; however, no other payable metals for copper, gold, lead or zinc are envisioned. Metallurgical testwork indicates elevated impurities for deleterious elements of bismuth, arsenic and antimony will be present in the silver concentrate, which would result in penalties. The treatment and refining charges in the economic analysis have been adjusted for the estimated penalties. Table 13-19 summarizes the concentrate assays based on DML’s 2012 metallurgical testwork.
13.6 Comments on Section 13
Samuel Engineering recommends that additional mineralogical and geometallurgical studies, and metallurgical tests are conducted on fresh, representative composite samples. These studies and testwork should continue to develop technical parameters and inputs for the design of the process plant as El Quevar progresses for subsequent engineering studies and Project development to include:
• Process flow sheet
• Design criteria
• Consumables
• Material, energy and water balances
• Optimizing process results in locked cycle flotation tests to improve the silver recovery, concentrate grade and reduce the deleterious elements in the flotation concentrate.
Although the implementation of cyanide leaching was not considered in this project analysis, Samuel Engineering recommends that economic trade-off studies be completed examining the various production options.
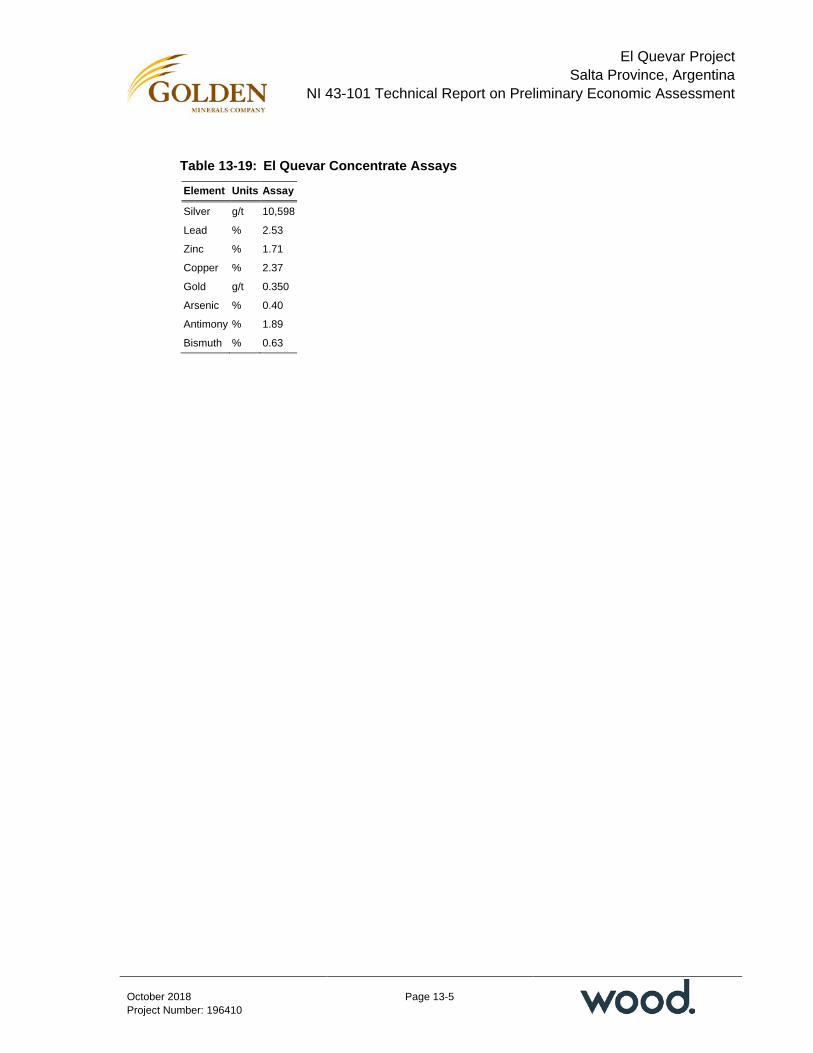
El Quevar Project Salta Province, Argentina
NI 43-101 Technical Report on Preliminary Economic Assessment
Page 13-5
October 2018 Project Number: 196410
Table 13-19: El Quevar Concentrate Assays
Element Units Assay
Silver g/t 10,598
Lead % 2.53
Zinc % 1.71
Copper % 2.37
Gold g/t 0.350
Arsenic % 0.40
Antimony % 1.89
Bismuth % 0.63

El Quevar Project Salta Province, Argentina
NI 43-101 Technical Report on Preliminary Economic Assessment
Page 14-1
October 2018 Project Number: 196410
14.0 MINERAL RESOURCE ESTIMATES
14.1 Introduction
Traditional Mineral Resource modeling methods are commonly undertaken by manually constructing wireframes around the economic mineralization. Such methods are labor intensive, time consuming, and difficult to update with additional drilling or changing cut-off grades. Due to these concerns, a hybrid silver model was constructed by first defining the overall geometry of the silver mineralization using implicit modeling software, and then estimating resources within the Ag shell using probability assigned constrained kriging (PACK). Major steps for the modeling process included:
• Perform exploratory data analyses (EDA) to better understand the geological controls on the silver mineralization
• Define the structural trends that control the geometry of the silver mineralization using geochemical depletion and enrichment studies, base-metal assay trends, and silver assay trends
• Construct a wireframe or mineralized shell using a 150 g/t Ag threshold using commercially-available Leapfrog Geo software that honors the structural trends defined during the EDA studies
• Estimate silver grades within the mineralized shell using PACK. PACK first constructs a probabilistic model or envelope using an indicator model within the implicit model shell. An indicator threshold is then chosen, and blocks with an estimated indicator above this threshold are used to define an envelope around the economic mineralization. Elements are then estimated into these blocks using ordinary kriging (OK) of only the composites within these blocks
• The PACK method prevents economic grades inside the probabilistic envelope from being smeared into the waste, and restricts low-grade material outside the probabilistic envelope from diluting the mineralized material inside the envelope
• A series of PACK models were constructed using a range of silver thresholds to evaluate how tonnages and silver grades vary using different silver thresholds. The models were then evaluated, and the model based on a 250 g/t Ag threshold was selected for Mineral Resource estimation purposes.
14.2 Exploratory Data Analysis
14.2.1 Database and Statistical Studies
The cut-off date for exporting the drill holes from the database to be used in the resource model was February 13, 2018. The database contained 389 drill holes with a total of
El Quevar Project Salta Province, Argentina
NI 43-101 Technical Report on Preliminary Economic Assessment
Page 14-2
October 2018 Project Number: 196410
98,968.7 m of drilling. Of this dataset, 331 drill holes (80,955.0 m) have collar coordinates within the Yaxtché deposit that were used to construct the Mineral Resource model.
In general, the drill-hole spacing ranged from 5 to 60 m and averaged approximately 20 m. Azimuths of the drill holes range between 140–220º with two main populations orientated at 155º and 205º. Inclination of the drill holes varies from -45º to -90º with a median of -65º. A total of 51% of the 1 m drill hole intervals were “visually assayed”, determined to be void of mineralization, and not sampled. For these intervals silver, gold, copper, lead, and zinc assays were assigned a value of 0.0001 g/t for statistical analyses and Mineral Resource estimation purposes.
For initial statistical studies, the drill data set was selected using all data within the Yaxtché area. Initial visual review of the data, however, showed distinct differences in assay values between Yaxtché West (YW, X<3,419,320) and Yaxtché Central (YC, X≥ 3,419,320). As an example, sodium showed a very clear zonation (Figure 14-1).
To filter out non-mineralized material that may mask the EDA and capping studies, a 150 g/t (ppm) Ag shell was constructed, and 1 m composites inside the shell were used for EDA and capping studies. Initial studies were categorized using two domains, Yaxtché West and Yaxtché Central. Drill collar locations within each domain are shown in Figure 14-2.
The main EDA studies undertaken were:
• Univariate statistics for key elements
• Silver histograms and probability plots
• Boxplots categorized by alteration
• Boxplots categorized by lithology
• Correlation coefficients for key elements.
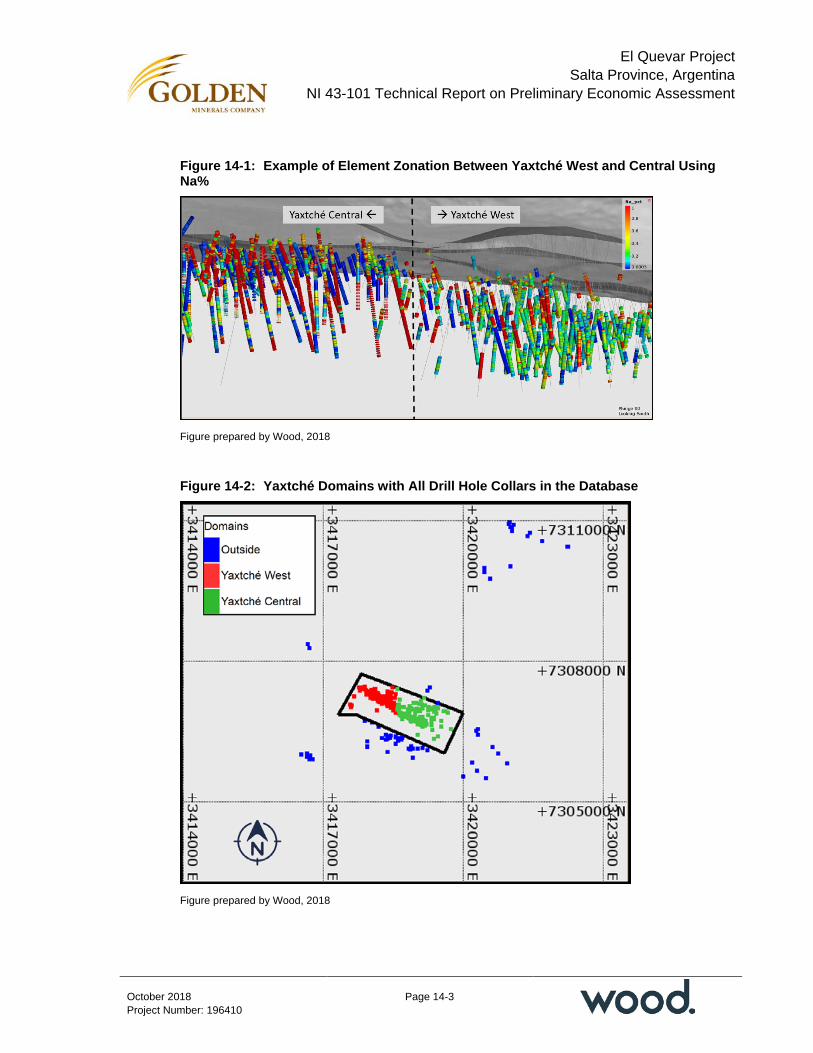
El Quevar Project Salta Province, Argentina
NI 43-101 Technical Report on Preliminary Economic Assessment
Page 14-3
October 2018 Project Number: 196410
Figure 14-1: Example of Element Zonation Between Yaxtché West and Central Using Na%
Figure prepared by Wood, 2018
Figure 14-2: Yaxtché Domains with All Drill Hole Collars in the Database
Figure prepared by Wood, 2018

El Quevar Project Salta Province, Argentina
NI 43-101 Technical Report on Preliminary Economic Assessment
Page 14-4
October 2018 Project Number: 196410
Key findings from the EDA statistical studies include:
• Although statistics for the key elements can be similar, visually-distinct spatial zonations were observed
• Silver appears to be a single population above 10 g/t Ag
• A significant portion of the silver composites within the 150 g/t Ag shell are <150 g/t (75% in Yaxtché West and 80% in Yaxtché Central), indicating that a modeling method such as PACK needs to be incorporated to minimize diluting the higher-grade material
• Correlation coefficients show associations between Ag/Cu/As/Sb
• Although a stronger correlation probably exists between silver and sulfur on a mineralogical level as suggested by correlation between silver, arsenic and antimony, this correlation is probably masked by the much larger episode of non-argentiferous sulfide mineralization
• Statistics categorized by lithology should be used with caution as several of the codes (e.g. MS or mineralized structure) are a combination of lithology and visually-observed alteration and mineralization. The contact breccia (CB), however, does appear to control mineralization and should be evaluated in more detail for future models
• Boxplots show that higher alteration codes (3 is the highest) are correlated to lower calcium, magnesium and sodium grades and higher silver grades. As a result, the more quantitative calcium, magnesium and sodium assays should be evaluated to define the alteration in preference to the less reliable 0–3 alteration code that was visually logged.
14.2.2 Core Recovery
The possible effects of low core recovery on grades were evaluated by constructing boxplots for silver, copper, lead, zinc, arsenic and antimony with the data binned by percent core recovery.
Results from the core recovery studies are as follows:
• In Yaxtché West, 93% of the samples have core recoveries greater than 80%, and 94% of the samples in Yaxtché Central have core recoveries greater than 80%, which are acceptable core recoveries for resource estimation
• No correlation exists between any of the elements and core recovery
• There is no reliable determination if silver grades increase or decrease with lower core recoveries since there are very few samples with low core recoveries.

El Quevar Project Salta Province, Argentina
NI 43-101 Technical Report on Preliminary Economic Assessment
Page 14-5
October 2018 Project Number: 196410
Examples for silver are shown for Yaxtché West in Figure 14-3, and for Yaxtché Central in Figure 14-4.
14.3 Geological Models
14.3.1 Visual Zonation Studies
In order to better understand the relationships between copper, lead, zinc, arsenic, antimony and silver zonations, wireframes were constructed for each of these elements and viewed visually. Thresholds used in Figure 14-5 through Figure 14-9 for copper, lead, zinc, arsenic, and antimony were adjusted to best illustrate the zonations, and do not correspond to any economic or metallurgical threshold. The 150 g/t Ag shell (in red) is shown as a reference. The zonations were later used to model these elements to better understand how these elements may affect metallurgical recoveries.
Key findings from the visual zonation studies are as follows:
• Copper typically occurs below the silver mineralization
• Lead and zinc occur together and are more extensive towards the western end of the silver mineralization
• Arsenic and antimony occur together within and below the silver mineralization.
14.3.2 Alteration Model (QAI)
EDA studies using boxplots showed that higher alteration intensity codes (visually logged codes that range from 0–3) correlate to higher silver grades and lower calcium, magnesium and sodium grades. Since the calcium, magnesium and sodium assays are more quantitative than the logged alteration codes, a Quevar alteration index (QAI) was created to better delineate the geometry of the alteration that can then be used to help define the geometry of the silver mineralization.
The derivation of the QAI is discussed in Section 7.3.3.
A wireframe was constructed for QAI review purposes, where samples have a 60% chance of having an QAI>40 (Figure 14-10 and Figure 14-11).
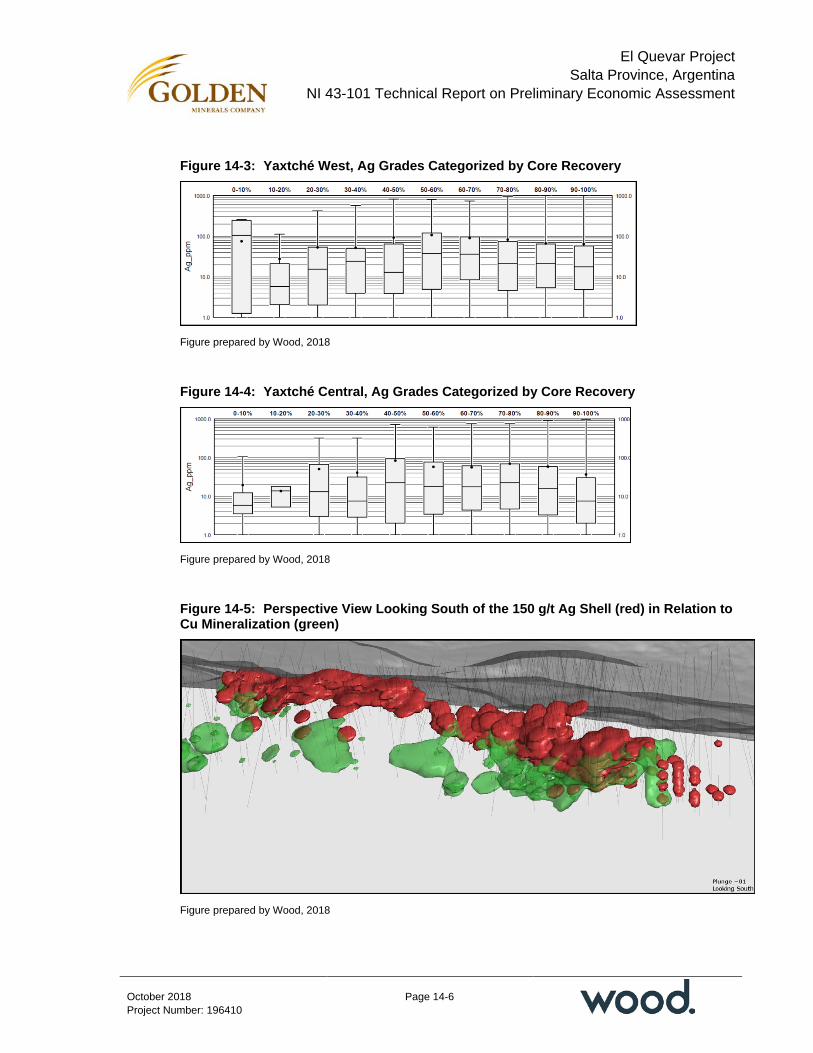
El Quevar Project Salta Province, Argentina
NI 43-101 Technical Report on Preliminary Economic Assessment
Page 14-6
October 2018 Project Number: 196410
Figure 14-3: Yaxtché West, Ag Grades Categorized by Core Recovery
Figure prepared by Wood, 2018
Figure 14-4: Yaxtché Central, Ag Grades Categorized by Core Recovery
Figure prepared by Wood, 2018
Figure 14-5: Perspective View Looking South of the 150 g/t Ag Shell (red) in Relation to Cu Mineralization (green)
Figure prepared by Wood, 2018

El Quevar Project Salta Province, Argentina
NI 43-101 Technical Report on Preliminary Economic Assessment
Page 14-7
October 2018 Project Number: 196410
Figure 14-6: Perspective View Looking South of the 150 g/t Ag Shell (Red) in Relation to Pb Mineralization (Purple)
Figure prepared by Wood, 2018
Figure 14-7: Perspective View Looking South of the 150 g/t Ag Shell (Red) in Relation to Zn Mineralization (Cyan)
Figure prepared by Wood, 2018

El Quevar Project Salta Province, Argentina
NI 43-101 Technical Report on Preliminary Economic Assessment
Page 14-8
October 2018 Project Number: 196410
Figure 14-8: Perspective View Looking South of the 150 g/t Ag Shell (Red) in Relation to the As Mineralization (Brown)
Figure prepared by Wood, 2018
Figure 14-9: Perspective View Looking South of the 150 g/t Ag Shell (Red) in Relation to the Sb Mineralization (Blue)
Figure prepared by Wood, 2018
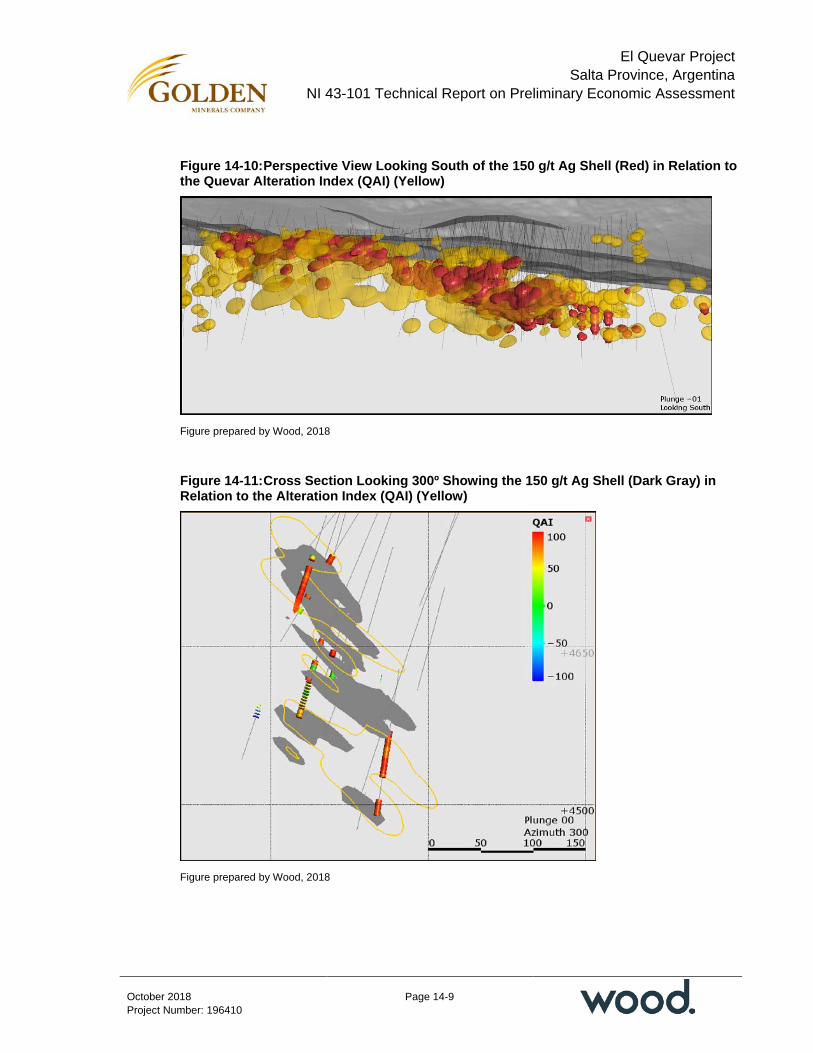
El Quevar Project Salta Province, Argentina
NI 43-101 Technical Report on Preliminary Economic Assessment
Page 14-9
October 2018 Project Number: 196410
Figure 14-10: Perspective View Looking South of the 150 g/t Ag Shell (Red) in Relation to the Quevar Alteration Index (QAI) (Yellow)
Figure prepared by Wood, 2018
Figure 14-11: Cross Section Looking 300º Showing the 150 g/t Ag Shell (Dark Gray) in Relation to the Alteration Index (QAI) (Yellow)
Figure prepared by Wood, 2018
El Quevar Project Salta Province, Argentina
NI 43-101 Technical Report on Preliminary Economic Assessment
Page 14-10
October 2018 Project Number: 196410
Key findings from the alteration index studies are as follows:
• Higher-grade silver mineralization correlates to more intense alteration
• Alteration can be more precisely quantified using the calcium, magnesium and sodium assays that are depleted during alteration using a relative QAI
• Although the QAI visually follows the silver mineralization, it is not an exact correlation and economic mineralization occurs both inside and outside of the QAI shells
• QAI can only be used to help define the geometry of the silver mineralization; it cannot be used alone to define the geometry of the silver mineralization. It should, however, be evaluated as an exploration tool to guide future drilling.
14.3.3 Silver Grade Shell
The limits of the potentially economic mineralization were established by constructing a 150 g/t Ag wireframe shell. The shell was made within a defined boundary, sufficiently large enough to cover areas of interest for block modeling (refer to Figure 14-2). The edges of the shell were softened to allow the mineralization to be projected along strike to a reasonable distance. Although this incorporates lower-grade composites into the shell, the PACK estimation method excludes these low-grade assays from the mineralized envelope during grade estimation.
Drill data used to construct the shell were first composited using Datamine RM software version 1.3.41.2, and then imported into Leapfrog Geo software version 4.2.3 for the construction of the wireframe shell.
Structural trends controlling the silver mineralization were delineated using grade trends, the QAI alteration index, and key lithological units. The trends were recorded using digital terrain model wireframes (DTM), and then imported into Leapfrog Geo software. The composites and the structural trends were then used together to construct a 150 g/t Ag wireframe shell. The grade shell was then imported into Datamine studio for resource estimation. The structural trends vary locally but generally strike 120º and dip -40º to the northeast (Figure 14-12).

El Quevar Project Salta Province, Argentina
NI 43-101 Technical Report on Preliminary Economic Assessment
Page 14-11
October 2018 Project Number: 196410
Figure 14-12: Perspective View Looking South of the 150 g/t Ag Grade Shell (Red) and the Ag Composites >150 g/t (White)
Figure prepared by Wood, 2018
14.3.4 Oxide–Sulfide Boundary
Visually-logged oxide, sulfide and mixed codes in the database (OXIDOS, SULFURO, and MIXTO) were refined by comparing the logged codes to the core photos and codes in adjacent holes. Since the processing method currently being evaluated is a sulfide mill, the mixed material was combined with the oxide, and a near-horizontal DTM was constructed to delineate oxide above and sulfide below the DTM (Figure 14-13). Figure 14-14 shows that a portion of 150 g/t Ag shell occurs in upper portions of Yaxtché East. This oxide portion has the potential of being a lower-grade open-pit oxide deposit, but this would require a separate resource model designed using a lower-cut-off grade, refinement of the oxide–mixed logged codes, and consideration of reasonable prospects for eventual economic extraction.
14.4 Density Assignment
Density measurements were performed on 1,568 unwaxed diamond-drill core samples by the on-site exploration geologists using the water displacement method. During the site visit, Wood collected eight samples that had previously been measured for SG using un-waxed volumetric method by on-site Golden Minerals personnel. These samples were sent to Alex Stewart for re-analysis using both the waxed and unwaxed SG methods. Results showed little difference between the on-site unwaxed measurements and the waxed measurements at the laboratory.
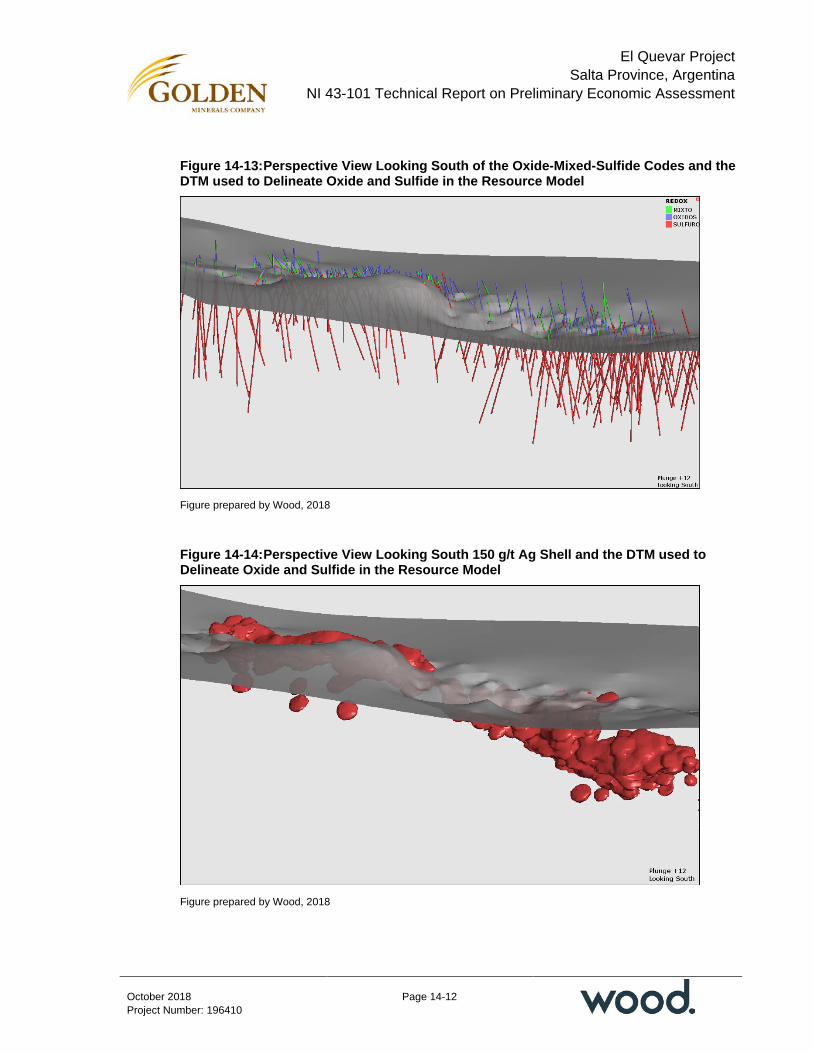
El Quevar Project Salta Province, Argentina
NI 43-101 Technical Report on Preliminary Economic Assessment
Page 14-12
October 2018 Project Number: 196410
Figure 14-13: Perspective View Looking South of the Oxide-Mixed-Sulfide Codes and the DTM used to Delineate Oxide and Sulfide in the Resource Model
Figure prepared by Wood, 2018
Figure 14-14: Perspective View Looking South 150 g/t Ag Shell and the DTM used to Delineate Oxide and Sulfide in the Resource Model
Figure prepared by Wood, 2018

El Quevar Project Salta Province, Argentina
NI 43-101 Technical Report on Preliminary Economic Assessment
Page 14-13
October 2018 Project Number: 196410
Density data were recorded in the database and reviewed spatially and statistically. The spatial review showed the density samples to be representative of the deposit, Figure 14-15. Statistical review showed several density values fell outside the expected upper and lower density limits. These samples were determined to be outliers and removed (Figure 14-16).
The relative high variability (coefficient of variation = 0.09) of the SG values was noted and attributed to the various degrees of brecciation of the dacite.
Density values were estimated into the block model separately for oxide and sulfide using inverse distance squared (ID2) method and an anisotropic flat-lying search (search distances in X and Y direction were three times the distances vertically) to reflect the near-horizontal oxide-sulfide boundary.
14.5 Grade Capping/Outlier Restrictions
In mineral deposits having skewed distributions, it is not uncommon for 1% of the highest assays to disproportionately account for over 20% of the total metal content in the resource model. Although these assays are real and reproducible, they commonly show little continuity and add a significant amount of uncertainty to the Mineral Resource estimate.
Since high-grade material is not usually drilled to a suitable spacing to verify its spatial limits, the very high-grade assays should be constrained during Mineral Resource estimation to minimize the high risk of this material and local grade overestimation. One way to minimize the influence of these samples is to apply a top cut or cap grade to the assays before compositing and mineral resource estimation.
To determine an appropriate capping grade, capping studies were performed for Yaxtché West and Yaxtché Central domains. The capping studies performed were:
• Looking for kinks or discontinuities in cumulative log probability plot (CLPP)
• Decile analysis
• Quantifying the number of high-grade samples lying in close proximity to each other (Dist)
• Filtering higher-grade assays and filtering the assays to determine when the higher-grade assays begin to cluster together.
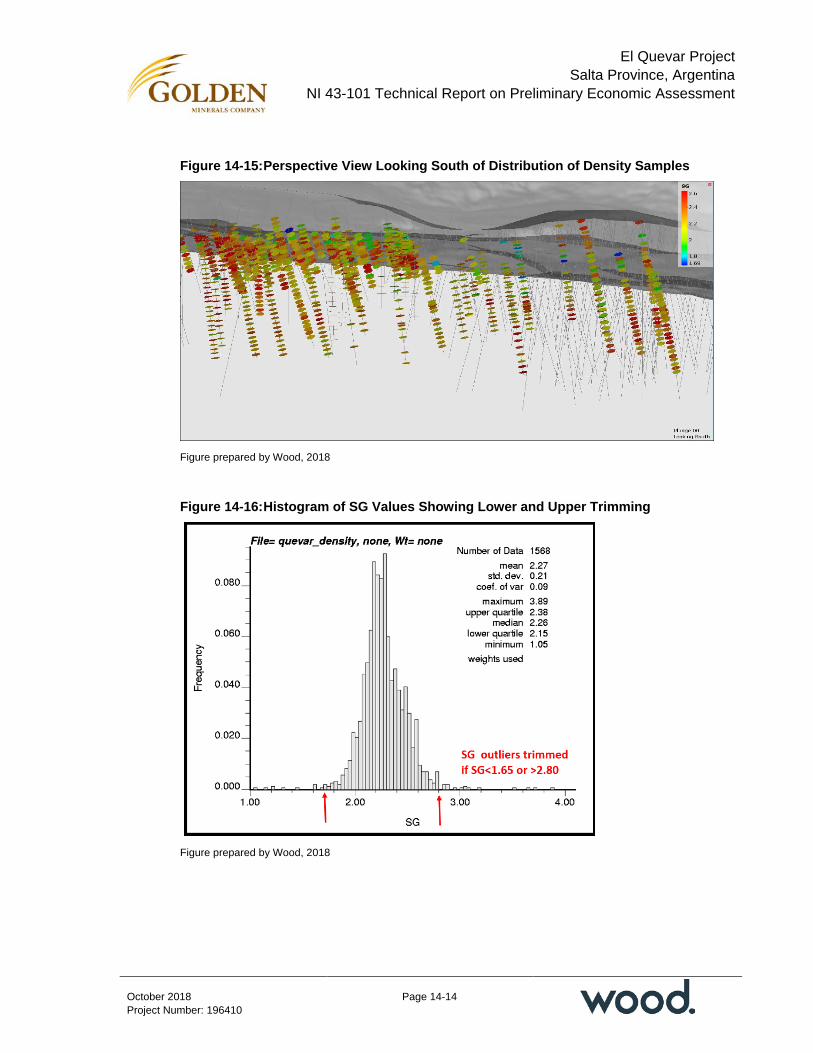
El Quevar Project Salta Province, Argentina
NI 43-101 Technical Report on Preliminary Economic Assessment
Page 14-14
October 2018 Project Number: 196410
Figure 14-15: Perspective View Looking South of Distribution of Density Samples
Figure prepared by Wood, 2018
Figure 14-16: Histogram of SG Values Showing Lower and Upper Trimming
Figure prepared by Wood, 2018

El Quevar Project Salta Province, Argentina
NI 43-101 Technical Report on Preliminary Economic Assessment
Page 14-15
October 2018 Project Number: 196410
Results for each capping method were compared and a final capping threshold was selected (Table 14-1). Capping was performed on the 1 m composites before further compositing into the 2.5 m composites used for the Mineral Resource estimations.
For arsenic and antimony, no capping was applied since many assays exceed the upper limit of the assay method used. As a result, the arsenic and antimony models should be used with caution as the assays in the database and model do not represent the very high arsenic and antimony grades.
14.6 Composites
For grade estimations, the samples were first capped and then composited into 2.5 m down-hole composite intervals to match the proposed mining height. Statistics for 2.5 m composites within the 150 g/t Ag shell and 250 g/t Ag PACK envelope are summarized in Table 14-2. There is a high percentage of composites with Ag grades below 150 g/t within the 150 g/t Ag shell. The PACK estimation method was selected for grade estimation as it excludes these lower-grade composites from being used during grade estimation. The last column in Table 14-2 provides the composite statistics used for final PACK grade estimation.
14.7 Variography
Review of the structural, assay trends and QAI studies showed that the trend of the Ag mineralization is relatively consistent, following a strike of 120º and dipping at -40º to the northeast. As no obvious changes in direction were noted between Yaxtché West and Yaxtché Central, variograms and grade estimations were performed for both domains combined to avoid any unnecessary artefacts that may occur at domain boundaries if the domains were estimated separately. Any local variations within the overall trend were accounted for by using dynamic anisotropy during grade estimations which aligns the search ellipse with the structural trends for every block in the model during grade estimation.
Variograms (correlograms) were calculated and modeled following the main structural trend (along strike, down-dip, and perpendicular) for silver, copper, lead and zinc using the 2.5 m composites within the 150 g/t Ag shell. The nugget effects for each variogram were first established using down-hole variograms and then directional variograms were modeled using the nugget effect established from the down-hole variograms. An example of modeled silver variograms in three primary directions are shown in Figure 14-17 and summarized in Table 14-3.

El Quevar Project Salta Province, Argentina
NI 43-101 Technical Report on Preliminary Economic Assessment
Page 14-16
October 2018 Project Number: 196410
Table 14-1: Capping Thresholds, Final Capping Values Highlighted in Gray
Metal CLPP Parish Dist Visual Avg Final Metal Removed (%)
Yaxtché West
Ag_ppm 1,800 1,902 1,500 1,640 1,711 1,800 12
Au_ppm 0.35 0.28 0.40 0.25 0.32 0.32 32
Cu_pct 1.50 1.24 0.90 1.20 1.21 1.50 9
Pb_pct 4.00 3.22 3.00 2.70 3.23 4.00 12
Zn_pct 2.50 1.77 2.00 1.80 2.02 2.50 9
Yaxtché Central
Ag_ppm 1,500 1,899 1,400 1,288 1,522 1,600 15
Au_ppm 0.60 0.34 0.40 0.12 0.37 0.50 15
Cu_pct 1.00 1.00 1.00 0.90 0.98 1.00 9
Pb_pct 4.00 2.90 2.00 3.80 3.18 4.00 5
Zn_pct 1.80 1.70 1.50 1.00 1.50 1.80 6
Table 14-2: Drill Composite Statistics (2.5 m capped composites)
Within 150 g/t Grade Shell Within PACK Envelope
Element Ag_ppm Au_ppm Cu_pct Pb_pct Zn_pct S_pct As_ppm Sb_ppm Ag_ppm
No Samples 3,584 3,584 3,584 3,584 3,584 3,584 3,584 3,584 598
Mean 116 0.02 0.07 0.22 0.12 4.23 478 354 437
Std Dev 201.10 0.04 0.15 0.42 0.26 2.55 774.25 449.97 306.53
CV 1.74 2.69 2.19 1.93 2.20 0.60 1.62 1.27 0.70
Maximum 1,800 0.32 1.50 4.00 2.50 13.75 11,919 3,808 1,800
Q75 131 0.01 0.06 0.21 0.09 6.02 523 482 574
Q50 37 0.01 0.01 0.11 0.02 3.92 251 173 361
Q25 5 0.00 0.00 0.03 0.00 2.26 124 40 261
Minimum 0 0.00 0.00 0.00 0.00 0.04 3 0 0
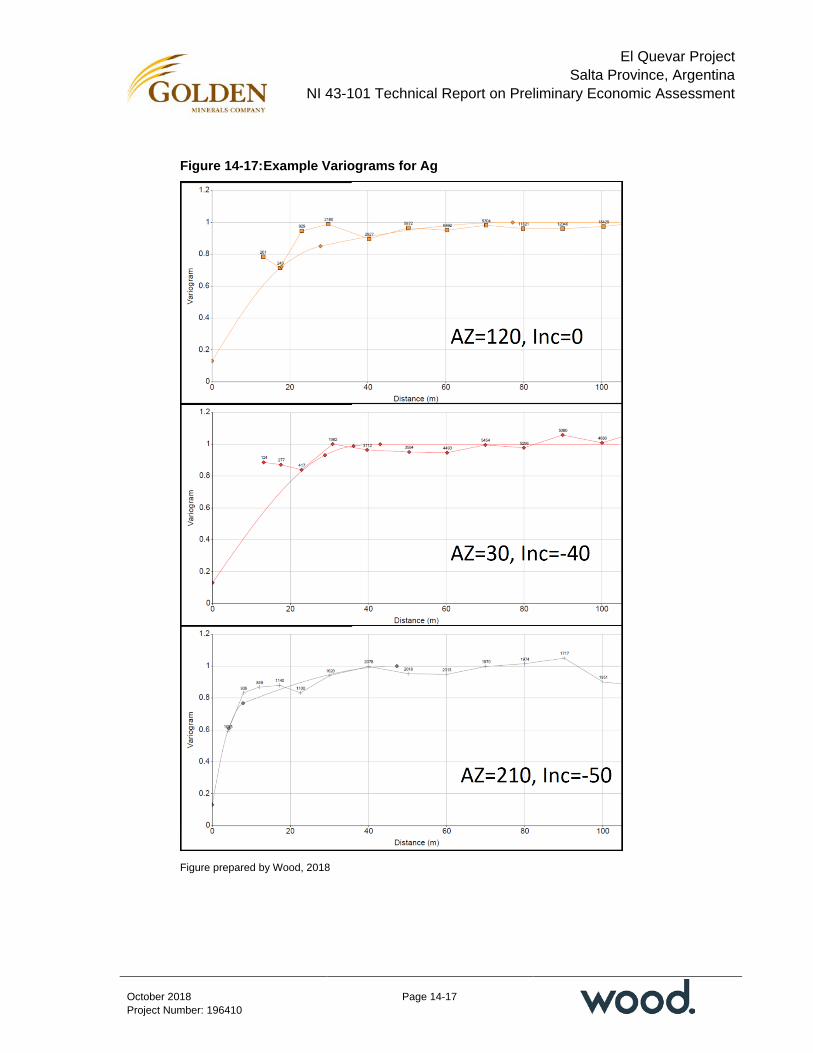
El Quevar Project Salta Province, Argentina
NI 43-101 Technical Report on Preliminary Economic Assessment
Page 14-17
October 2018 Project Number: 196410
Figure 14-17: Example Variograms for Ag
Figure prepared by Wood, 2018
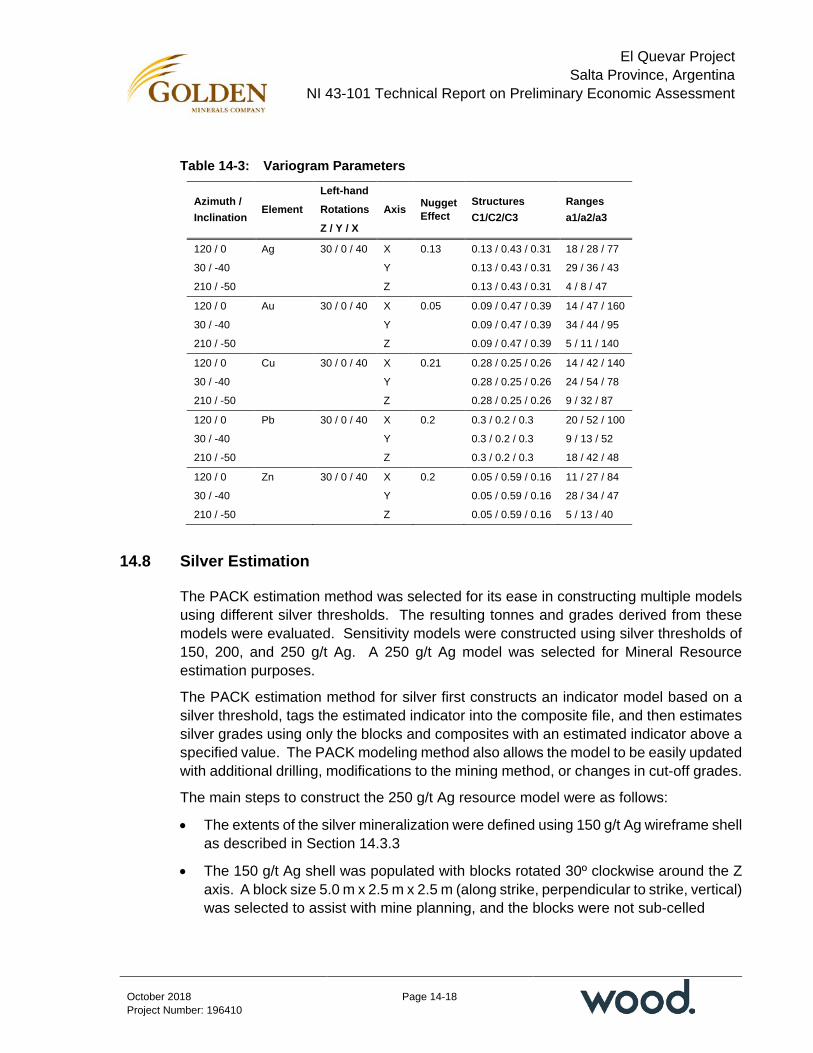
El Quevar Project Salta Province, Argentina
NI 43-101 Technical Report on Preliminary Economic Assessment
Page 14-18
October 2018 Project Number: 196410
Table 14-3: Variogram Parameters
Azimuth / Inclination
Element Left-hand
Axis Nugget Effect
Structures C1/C2/C3
Ranges a1/a2/a3
Rotations Z / Y / X
120 / 0 Ag 30 / 0 / 40 X 0.13 0.13 / 0.43 / 0.31 18 / 28 / 77
30 / -40 Y 0.13 / 0.43 / 0.31 29 / 36 / 43
210 / -50 Z 0.13 / 0.43 / 0.31 4 / 8 / 47
120 / 0 Au 30 / 0 / 40 X 0.05 0.09 / 0.47 / 0.39 14 / 47 / 160
30 / -40 Y 0.09 / 0.47 / 0.39 34 / 44 / 95
210 / -50 Z 0.09 / 0.47 / 0.39 5 / 11 / 140
120 / 0 Cu 30 / 0 / 40 X 0.21 0.28 / 0.25 / 0.26 14 / 42 / 140
30 / -40 Y 0.28 / 0.25 / 0.26 24 / 54 / 78
210 / -50 Z 0.28 / 0.25 / 0.26 9 / 32 / 87
120 / 0 Pb 30 / 0 / 40 X 0.2 0.3 / 0.2 / 0.3 20 / 52 / 100
30 / -40 Y 0.3 / 0.2 / 0.3 9 / 13 / 52
210 / -50 Z 0.3 / 0.2 / 0.3 18 / 42 / 48
120 / 0 Zn 30 / 0 / 40 X 0.2 0.05 / 0.59 / 0.16 11 / 27 / 84
30 / -40 Y 0.05 / 0.59 / 0.16 28 / 34 / 47
210 / -50 Z 0.05 / 0.59 / 0.16 5 / 13 / 40
14.8 Silver Estimation
The PACK estimation method was selected for its ease in constructing multiple models using different silver thresholds. The resulting tonnes and grades derived from these models were evaluated. Sensitivity models were constructed using silver thresholds of 150, 200, and 250 g/t Ag. A 250 g/t Ag model was selected for Mineral Resource estimation purposes.
The PACK estimation method for silver first constructs an indicator model based on a silver threshold, tags the estimated indicator into the composite file, and then estimates silver grades using only the blocks and composites with an estimated indicator above a specified value. The PACK modeling method also allows the model to be easily updated with additional drilling, modifications to the mining method, or changes in cut-off grades.
The main steps to construct the 250 g/t Ag resource model were as follows:
• The extents of the silver mineralization were defined using 150 g/t Ag wireframe shell as described in Section 14.3.3
• The 150 g/t Ag shell was populated with blocks rotated 30º clockwise around the Z axis. A block size 5.0 m x 2.5 m x 2.5 m (along strike, perpendicular to strike, vertical) was selected to assist with mine planning, and the blocks were not sub-celled

El Quevar Project Salta Province, Argentina
NI 43-101 Technical Report on Preliminary Economic Assessment
Page 14-19
October 2018 Project Number: 196410
• The 2.5 m composites within the 150 g/t Ag shell were flagged and used to construct an indicator model. An indicator field was first added to the composites. If the silver grade was <250 g/t, the indicator was set to 0, if the Ag grade was ≥250 g/t, the indicator was set to 1
• The indicators were estimated into the150 g/t Ag shell using inverse distance to the third power (ID3) using parameters shown in Table 14-4
• The estimated indicator values in the block model were then tagged back into the composites, and only blocks with an estimated indicator ≥0.30 were estimated using only those composites with tagged estimated indicator values ≥0.30. Figure 14-18 is an example cross section of the 250 g/t Ag indicator model within the 150 g/t Ag shell (black outline) showing estimated indicators in the model that range from 0–1 (colored indicator), and composites (black = 1, gray = 0). Blocks with estimated indicators ≥0.30 are highlighted as solid blocks and form the Mineral Resource model
• Figure 14-19 shows the silver grades estimated into the solid blocks using composites with estimated indicator ≥0.30, ordinary kriging, and the same estimation parameters as those used for the indicator model summarized in Table 14-4, with variogram parameters summarized in Table 14-3. Blocks with estimated indicator <0.30 (non-solid blocks) were estimated using the same method but using composites with estimated indicators <0.30. These blocks were included to support future mine planning and dilution studies
• The solid blocks in Figure 14-19 are the Mineral Resource model blocks. The continuity of the mineralization could be increased by lowering the silver threshold which will significantly increase the number of blocks (tonnes) at the expense of lowering the grade.
14.9 Metallurgical Models
Although silver, copper, lead, zinc, arsenic and antimony were estimated, the model was optimized to estimate the Ag mineralization as it is the only economic contributor and only metal being reported as a Mineral Resource. Gold was estimated to determine if any significant gold credits could be expected, but gold grades were considered to be too low to warrant any further studies at this stage of Project evaluation.

El Quevar Project Salta Province, Argentina
NI 43-101 Technical Report on Preliminary Economic Assessment
Page 14-20
October 2018 Project Number: 196410
Table 14-4: Estimation Parameters
Azimuth / Inclination
Field Left-hand Rotations Z / Y / X
Search Pass 1 Search Pass 2 Search Pass 3 Maximum Number per Drill Hole Distance Min / Max Distance Min / Max Distance Min / Max
120 / 0 All indicators and elements
30 / 40 / 0 20 3 / 8 30 3 / 8 40 1 / 8 2
30 / -40 20 3 / 8 30 3 / 8 40 1 / 8 2
210 / -50 10 3 / 8 15 3 / 8 20 1 / 8 2
Figure 14-18: Example of Indicator Model
Figure prepared by Wood, 2018. Blocks with estimated indicator ≥ 0.3 are shown as solid. Composites colored by indicator (black = 1, gray = 0)

El Quevar Project Salta Province, Argentina
NI 43-101 Technical Report on Preliminary Economic Assessment
Page 14-21
October 2018 Project Number: 196410
Figure 14-19: Example of the PACK Ag Model
Figure prepared by Wood, 2018. Blocks estimated within the indicator envelope are shown as solid blocks.
Copper, lead, zinc, arsenic and antimony were estimated to better understand the deposit and to assist with future metallurgical studies. Copper, lead, zinc, arsenic and antimony were estimated into all blocks within the 150 g/t Ag shell using a PACK modeling method similar to the silver estimation. The only difference was that instead of using a silver threshold based on economics, the thresholds were selected if the copper, lead, zinc, arsenic and antimony grades were above a threshold that would result in a penalty when selling the concentrates. If the grades were below the metallurgical penalty threshold and an inflection was recognized in the probability plots, the PACK threshold was set to the inflection. If no inflection was noted, the element was modeled as a single domain.

El Quevar Project Salta Province, Argentina
NI 43-101 Technical Report on Preliminary Economic Assessment
Page 14-22
October 2018 Project Number: 196410
PACK thresholds used are as follows:
• Copper: 0.2% threshold. If grades exceed this value, the mill concentrates may occur a copper penalty. However, the amount of high-grade copper is small enough that the penalty may be avoided through blending
• Lead: too low for metallurgical threshold; inflection at 0.01% was used to domain and model the higher grades
• Zinc: too low for metallurgical threshold, weak inflection at 0.2% was used to domain and model the higher grades
• Arsenic: 200 g/t threshold. If grades exceed this value, the mill concentrates may occur an arsenic penalty
• Antimony: 0 g/t threshold, and mill concentrates are expected to occur an antimony penalty for all material.
14.10 Block Model Validation
14.10.1 Visual
The estimated silver grades in the model were compared to the composite grades by visual inspection in plan views, cross sections, and longitudinal sections. In general, the model and composite grades compared well.
14.10.2 Global Bias
The block model was checked for global bias by comparing the average silver, gold, copper, lead, and zinc grades (with no cut-off) from the model (OK grades) with means from nearest-neighbor (NN) estimates. The NN estimator produces a theoretically unbiased (de-clustered) estimate of the average value when no cut-off grade is imposed and provides a good basis for checking the performance of different estimation methods. In general, an estimate is considered acceptable if the bias is at or below 5%. Table 14-5 shows the bias results on a global basis.
14.10.3 Local Bias
Local trends in the grade estimates (swath checks) were performed by plotting the mean silver values from the NN estimate versus the kriged results along strike, along dip-direction and vertical directions. Swath plots by direction are shown in Figure 14-20 through Figure 14-22.
The swath grade profile plots help in assessing the local mean grades and are used to validate grade trends in the model. Although the global comparisons agree well, the swath plots illustrate the existence of slight local differences between the NN and kriged model grades. This is considered normal.
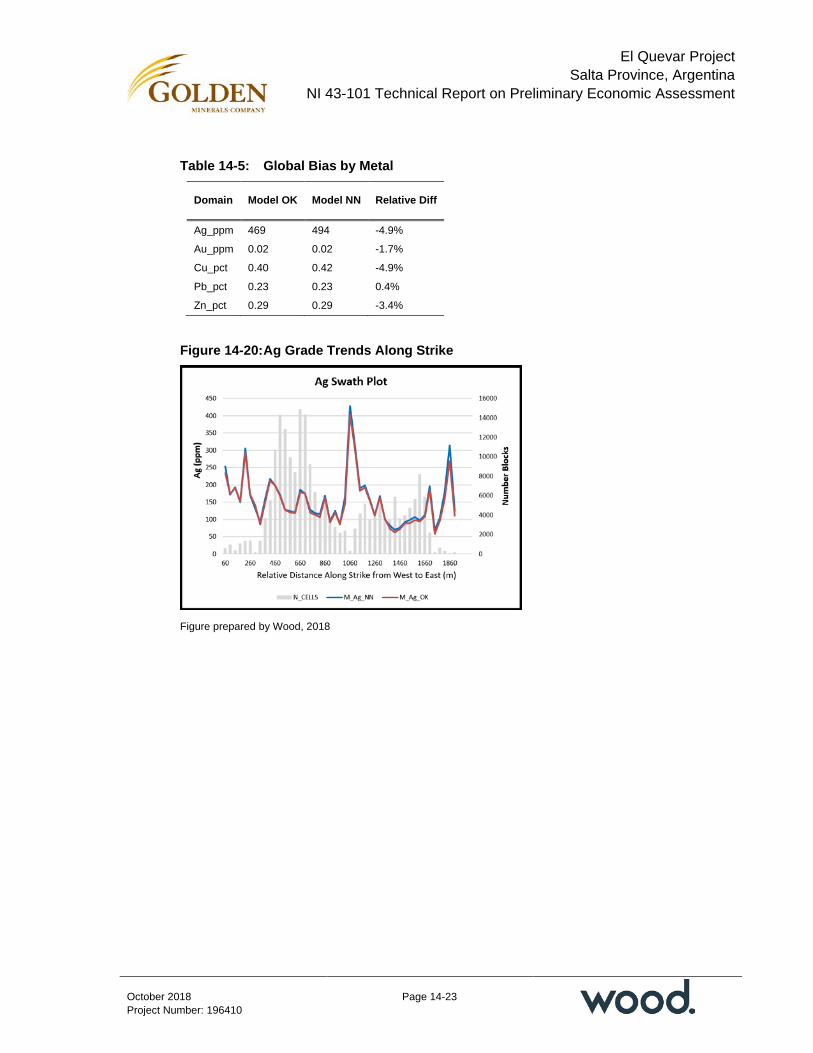
El Quevar Project Salta Province, Argentina
NI 43-101 Technical Report on Preliminary Economic Assessment
Page 14-23
October 2018 Project Number: 196410
Table 14-5: Global Bias by Metal
Domain Model OK Model NN Relative Diff
Ag_ppm 469 494 -4.9%
Au_ppm 0.02 0.02 -1.7%
Cu_pct 0.40 0.42 -4.9%
Pb_pct 0.23 0.23 0.4%
Zn_pct 0.29 0.29 -3.4%
Figure 14-20: Ag Grade Trends Along Strike
Figure prepared by Wood, 2018

El Quevar Project Salta Province, Argentina
NI 43-101 Technical Report on Preliminary Economic Assessment
Page 14-24
October 2018 Project Number: 196410
Figure 14-21: Ag Grade Trends Along Dip-Direction
Figure prepared by Wood, 2018
Figure 14-22: Ag Grade Trends Along Relative Elevation
Figure prepared by Wood, 2018
El Quevar Project Salta Province, Argentina
NI 43-101 Technical Report on Preliminary Economic Assessment
Page 14-25
October 2018 Project Number: 196410
14.11 Classification of Mineral Resources
Mineral Resources were classified using a common industry and Wood internal guideline that Indicated Mineral Resources should be quantified within relative ± 15% with 90% confidence on an annual basis and Measured Mineral Resources should be known within ± 15% with 90% confidence on a quarterly basis. At this level, the drilling is usually sufficiently close-spaced enough to permit confirmation (Measured) or assumption of continuity (Indicated) between points of observation.
For the Yaxtché model, a drill hole spacing study was performed to determine the nominal drill hole spacing required to classify material as Indicated. Material within the 150 g/t Ag shell not classified as Indicated was classified as Inferred, and no Measured is reported.
Confidence limits were calculated on a single block that represents one month’s production (365,000 t/a). The confidence limits, a review of continuity on sections and plans, and an assessment of data quality were all used to determine that a minimum drill hole spacing of 30 by 30 m was necessary to meet the requirements for Indicated. The classification was then smoothed to remove the isolated blocks with a different classification than the surrounding blocks.
14.12 Reasonable Prospects of Eventual Economic Extraction
Four underground mining methods that included sublevel end slicing, transverse with pillars, transverse with cemented fill, and random room-and-pillar were investigated to identify the potentially most favorable mining method for the Yaxtché underground resource deposit (Mineral Resources Engineering, 2018).
The comparative analysis supports the selection of the random room-and-pillar mining method as the best for the current Mineral Resource estimate, based on the criteria of overall resource extraction and the anticipated cost per contained ounce that could be delivered to a plant.
There are reasonable prospects for eventual economic extraction using the following assumptions: a silver price of $16.62/oz, employment of underground, mechanized, room‐and‐pillar mining methods, and silver concentrates will be produced and sold to a smelter. Mining costs are assumed to be $55/t at a nominal production rate of 365,000 t/a. Concentrator and general and administrative (G&A) costs are assumed to be $30/t and $20/t respectively. Metallurgical recovery of silver is assumed to be 88.5%.
14.13 Yaxtché Mineral Resource Statement
The Yaxtché underground resource model was constructed by Gordon Seibel, R.M. SME and Principal Geologist with Wood, in conjunction with Golden Minerals’ personnel. The resource model in this Report assumes that mining will be undertaken using
El Quevar Project Salta Province, Argentina
NI 43-101 Technical Report on Preliminary Economic Assessment
Page 14-26
October 2018 Project Number: 196410
underground methods. Although a portion of the mineralization is oxide material that could potentially support an open-pit oxide operation, this would require a different resource model than the one documented in this Report.
Gordon Seibel is the QP for the resource model and Mineral Resource estimate. The QP considers that the mineral resource models and Mineral Resource estimates derived from those models are consistent with the 2014 CIM Definition Standards and were performed in accordance with the 2003 CIM Best Practice Guidelines.
Mineral Resources are summarized in Table 14-6 and have an effective date of 26 February 2018.
14.14 Sensitivity of Mineral Resources to Cut-off Grade
Table 14-7 through Table 14-9 summarize the Yaxtché Mineral Resource at a range of cut-off grades. The base case Mineral Resource model reported at a 250 g/t Ag cut-off is highlighted in grey. All sensitivity numbers are reported within the 250 g/t Ag PACK model. If the sensitivity study was performed using a different silver threshold for the PACK model, differences in tonnages and grades between cut-offs would be much larger.
14.15 Factors That May Affect the Mineral Resource Estimate
Factors that may affect the Mineral Resource estimate include:
• Commodity price assumptions
• Changes in local interpretations of mineralization geometry and continuity of mineralization zones, and impact on mining selectivity
• Changes to geotechnical, hydrogeological, and metallurgical recovery assumptions
• Density and domain assignments
• Changes to assumed mining method which may change block size and orientation assumptions used in the resource model
• Input factors used to assess reasonable prospects for eventual economic extraction
• Assumptions as to social, permitting and environmental conditions
• Additional infill or step out drilling; results obtained from extending the exploration decline.

El Quevar Project Salta Province, Argentina
NI 43-101 Technical Report on Preliminary Economic Assessment
Page 14-27
October 2018 Project Number: 196410
Table 14-6: Mineral Resource Table (250 g/t Ag cut-off)
Class Type Tonnes (Mt)
Ag Grade (g/t)
Contained Ag Metal (Moz)
Indicated Sulfide 2.63 487 41.1
Oxide 0.30 434 4.2
Total 2.93 482 45.3
Inferred Sulfide 0.31 417 4.1
Oxide 0.00 — 0.0
Total 0.31 417 4.1 Notes to accompany Mineral Resource table:
1) The independent Qualified Person who prepared the Mineral Resource estimate is Gordon Seibel, a Registered Member of the Society for Mining, Metallurgy and Exploration, RM SME, who is a Principal Geologist with Wood.
2) The effective date of the estimate is February 26, 2018. Mineral Resources are estimated using the CIM Definition Standards for Mineral Resources and Reserves (2014). Mineral Resources that are not Mineral Reserves do not have demonstrated economic viability.
3) There are reasonable prospects for eventual economic extraction under assumptions of a silver price of $16.62/oz, employment of underground, mechanized, room‐and‐pillar mining methods, and that silver concentrates will be produced and sold to a smelter. Mining costs are assumed to be $55/t at a nominal production of rate 365,000 t/a. Concentrator and general and administrative (G&A) costs are assumed to be $30/t and $20/t respectively. Metallurgical recovery for silver is assumed to be 88.5%.
4) Reported Mineral Resources contain no allowances for hanging wall or footwall contact boundary loss and dilution. No mining recovery has been applied.
5) Rounding as required by reporting guidelines may result in apparent differences between tonnes, grade and contained metal content.
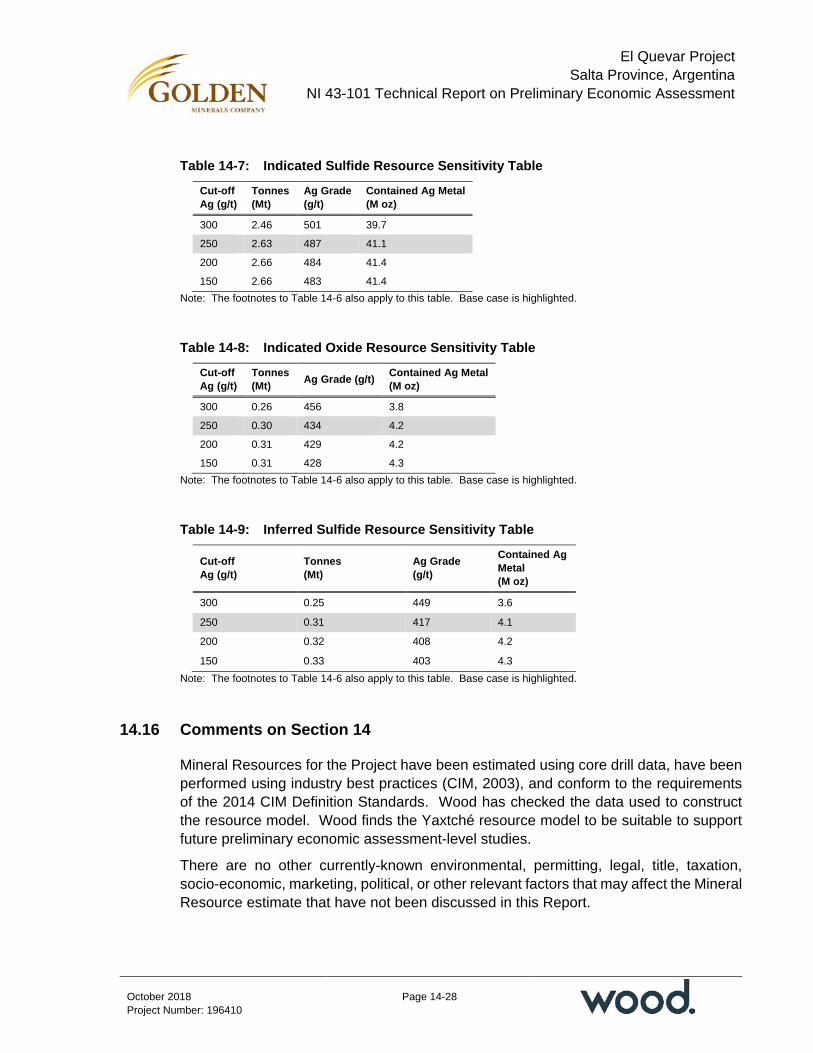
El Quevar Project Salta Province, Argentina
NI 43-101 Technical Report on Preliminary Economic Assessment
Page 14-28
October 2018 Project Number: 196410
Table 14-7: Indicated Sulfide Resource Sensitivity Table
Cut-off Ag (g/t)
Tonnes (Mt)
Ag Grade (g/t)
Contained Ag Metal (M oz)
300 2.46 501 39.7
250 2.63 487 41.1
200 2.66 484 41.4
150 2.66 483 41.4 Note: The footnotes to Table 14-6 also apply to this table. Base case is highlighted.
Table 14-8: Indicated Oxide Resource Sensitivity Table
Cut-off Ag (g/t)
Tonnes (Mt) Ag Grade (g/t) Contained Ag Metal
(M oz)
300 0.26 456 3.8
250 0.30 434 4.2
200 0.31 429 4.2
150 0.31 428 4.3 Note: The footnotes to Table 14-6 also apply to this table. Base case is highlighted.
Table 14-9: Inferred Sulfide Resource Sensitivity Table
Cut-off Ag (g/t)
Tonnes (Mt)
Ag Grade (g/t)
Contained Ag Metal (M oz)
300 0.25 449 3.6
250 0.31 417 4.1
200 0.32 408 4.2
150 0.33 403 4.3 Note: The footnotes to Table 14-6 also apply to this table. Base case is highlighted.
14.16 Comments on Section 14
Mineral Resources for the Project have been estimated using core drill data, have been performed using industry best practices (CIM, 2003), and conform to the requirements of the 2014 CIM Definition Standards. Wood has checked the data used to construct the resource model. Wood finds the Yaxtché resource model to be suitable to support future preliminary economic assessment-level studies.
There are no other currently-known environmental, permitting, legal, title, taxation, socio-economic, marketing, political, or other relevant factors that may affect the Mineral Resource estimate that have not been discussed in this Report.
El Quevar Project Salta Province, Argentina
NI 43-101 Technical Report on Preliminary Economic Assessment
Page 14-29
October 2018 Project Number: 196410
It is recommended that Golden Minerals extend the existing decline to expose the higher-grade mineralization to establish feasible ore control procedures that can practically define mill feed material and waste. Additional PACK modelling should be constructed to better understand how changes in silver prices and exchange rates may affect the cut-off grade and considerations of reasonable prospects for eventual economic extraction.
The QP notes:
• Visual inspection of the core shows that the mineralization can be highly variable, and ore control procedures will need to be developed to address this variability during future mine planning
• The amount of contact dilution related to local undulations has yet to be determined
• Mining recovery could be lower, and dilution increased in the more complex portions of the deposit
• The exploration decline should provide an appropriate trial of the conceptual room-and-pillar mining method on the Yaxtché deposit in terms of costs, dilution, and mining recovery. The decline will also provide access to data and metallurgical samples at a bulk scale that cannot be collected at the scale of a drill sample
• Existing metallurgical studies have shown significant variabilities in silver recovery in the deposit. These variabilities should be evaluated in conjunction with the data in the geological database and the resource model with the goal of adding the metallurgical recoveries to the resource model
• The relative high variability in the SG values should be studied to determine if additional SG estimation domains should be developed
• Changes in the assumptions as to conceptual operating costs may affect the base case cut-off grades selected for the Yaxtché Mineral Resource estimate.
There are no other known factors or issues not discussed in this Report that may materially affect the estimate other than normal risks faced by mining projects in terms of environmental, permitting, taxation, socio-economic, marketing and political factors.

El Quevar Project Salta Province, Argentina
NI 43-101 Technical Report on Preliminary Economic Assessment
Page 15-1
October 2018 Project Number: 196410
15.0 MINERAL RESERVE ESTIMATES
This section is not relevant to this Report.

El Quevar Project Salta Province, Argentina
NI 43-101 Technical Report on Preliminary Economic Assessment
Page 16-1
October 2018 Project Number: 196410
16.0 MINING METHODS
The mine plan is partly based on Inferred Mineral Resources that are considered too speculative geologically to have the economic considerations applied to them that would enable them to be categorized as Mineral Reserves, and there is no certainty that the PEA based on these Mineral Resources will be realized. Mineral Resources that are not Mineral Reserves do not have demonstrated economic viability.
16.1 Throughput Rate and Supporting Assumptions
16.1.1 Stope Sizing
Productivity calculations and unit costs for the final selection of a post-pillar cut-and-fill mine plan are based on the following criteria:
• Two 10 hr shifts per day, which yield 16 hr of actual work time
• The ground is considered medium–hard for the drilling and blasting variable
• Drilling of 18 ft (5.5 m) holes (providing 16.6 ft (5.1 m) of advance) with a two-boom production jumbo. Hydraulic drifter (drill) penetration rate is assumed to be 3.5 ft/min (1.1 m/min)
• No standard ground support is indicated; however, 1.5 hr per cycle is allotted for ground control (e.g. rock bolting), spot bolting or other cycle interruptions
• Blasting will be carried out using gelatin-class dynamite and ammonium nitrate/fuel oil (ANFO) as the primary blasting agent. Non-electric (non-el) type detonating systems would be used
• Stope areas will be ventilated with 75,000 ft3/min (2,123.8 m3/min) fans and 42 in (106.7 cm) flexible brattice ducts
• Mucking will be conducted using 7 yd3 (5.4 m3) load-haul–dump (LHD) units. Fill placement will be done by the same mucking units in conjunction with an LHD setup with a rammer for ensuring the fill is tightly compacted before excavating the next cut (above)
• Jumbo availability is assumed to be 85% with a 4 hr repair interruption resulting in a 7.4 hr cycle that includes 2.5 hr for travel and other non-productive time
• LHD availability is estimated at 85% with a 2 hr maintenance and repair period resulting in a 3.3 hr mucking cycle per blasted heading that includes ¾ hr for travel and utilization
• The blasting cycle is seven hours, which includes one hour for travel and lack of utilization.

El Quevar Project Salta Province, Argentina
NI 43-101 Technical Report on Preliminary Economic Assessment
Page 16-2
October 2018 Project Number: 196410
A typical stope (section) area is predicted to have a production of 1,400 t/d (1,200 t/d of mill feed material and 200 t/d of waste). Backfilling and access development are not on the critical path. The typical stope level will have 98 m of linear development, which results in an average of 200 t/d of internal stope waste development. Analysis of the level plans show that an average of 55% of the room excavations use a horizontal breasting technique.
The drilling task of the excavation cycle will have the longest cycle time of the three components (drill, blast, muck) of a complete production cycle. The drilling cycle dictates the stope output, assuming a single drill unit per stope area (based on the typical stope areas). Drill jumbos selected for the stopes are capable of completing two room cycles per day, and 2.4 breast cycles per day (for a combined 700 t/d of broken material). A single blasting unit will produce 800 t/d. A single 7 yd3 (5.4 m3) LHD unit can produce 1,359 t/d.
Two active stopes are required to satisfy the production requirement of 1,200 t/d. Advance rates of 2.7 m/d of main development (e.g. ramp, accesses) are required to sustain the daily production rate.
16.1.2 Dilution and Mine Losses
The 2018 Mineral Resource estimate (refer to Section 14) was adjusted as follows:
• The oxide material was removed from the subset of the Mineral Resource estimate used in the PEA mine plan because the PEA room-and-pillar study only focuses on sulfide material;
• There are more isolated blocks of material above the 4803.25 level and below the 4513.25 level; these have also been removed from the subset of the Mineral Resource estimate used in the PEA mine plan;
16.2 Subset of Mineral Resources Within the PEA Mine Plan
Discussions with Golden Minerals personnel resulted in an assumed mining rate of 1,200 t/d that gives the Project a six-year mine life. The first year of mining operations will extract both Indicated and Inferred Mineral Resources. The remaining five years of production will be based on Indicated Mineral Resources.
A cut-off of 250 g/t Ag was selected to ensure that the mine plan would result in mineralized material being fed to the plant averaging above 400 g/t Ag.
16.3 Mining Method Selection
Preliminary work was performed on four possible mining systems: post-pillar cut-and-fill, transverse with pillars, transverse with cemented fill, and sublevel with end slicing.

El Quevar Project Salta Province, Argentina
NI 43-101 Technical Report on Preliminary Economic Assessment
Page 16-3
October 2018 Project Number: 196410
The following subsections summarize the four methods and the reasoning behind the discarded and selected mining methods.
16.3.1 Sublevel End Slicing
A preliminary layout of the stopes was performed assuming the entries to be 7 m wide by 5 m high; the end slice was chosen to be 5 m thick. The end-slicing method requires the selections of the length of the sublevels and the pillar size between sublevels. In many cases the mineralization width and stoping zone are both wider than the end-slice excavation, which means that there would be more adjacent sublevel entries along strike at the same elevation.
Cemented fill of the sublevel panel or a pillar left between the sublevel panels would be used for the support required due to the proximity of adjacent panels.
The main factor in discarding this method is the incompetency of the hanging wall rocks, which in many instances is weak and susceptible to collapse.
The end-slice system does not have a significantly greater extraction of the resource than some of the other mining methods reviewed.
The weakness of the hanging wall is a risk for any stoping system that relies on lengthy excavation parallel to the strike of the mineralized zone, because the stope would be lost if the hanging wall collapses.
16.3.2 Transverse with Pillars
The transverse-with-pillars mining system would consist of 11 m wide by 5 m high entries that are perpendicular to the mineralized zone (stoping area), started in the footwall side, and extended to the hanging wall side of the zone. Two entries would be aligned vertically with a 5 m thick vertical pillar left between them that would be extracted using an end-slice method.
Non-cemented fill would be used to fill the excavations once the excavations are complete. A 7 m wide pillar would be left between the excavations to provide stability to the stoping area.
The transverse-with-pillars stoping method was discarded because it would recover about 45% of the resource.
16.3.3 Transverse with Cemented Fill
The transverse-with-cemented-fill mining system would consist of 7 m wide by 5 m high entries that are perpendicular to the mineralized zone (stoping area), started in the footwall side, and extended to the hanging wall side of the mineralized zone. Entries would be vertically aligned with a 5 m thick vertical pillar left between them that will be extracted using an end slice method.
El Quevar Project Salta Province, Argentina
NI 43-101 Technical Report on Preliminary Economic Assessment
Page 16-4
October 2018 Project Number: 196410
Cemented fill (8% cement by weight) would be used to fill the excavations once the excavations were complete, so that extraction of the areas adjacent to the finished panel can be performed safely.
This system eliminates the need for a pillar between transverse panels, which significantly increases the resource recovery.
16.3.4 Post-Pillar Cut-and-Fill
This mining method relies on using 5 m x 5 m rooms and 5 m x 5 m square pillars. The pillars of one level are planned to align vertically with the next mining level to provide support. Mining starts at the lowest elevation in a mining area and is completed working upward. Some pillars can be extracted when they occur in an area of the stope where there will be no mining above.
16.3.5 Comparisons
The transverse cemented fill and the post-pillar cut-and-fill methods have the highest potential extraction rate of mineralized material. These methods narrow the mining method choices to two. Further investigation was performed to determine the more favorable of the two mining methods.
The investigation analyzed the 4666.25, 4671.25 and the 4676.25 levels using both methods. The levels were selected because they are typical of the better part of the mineralization with respect to grade and tonnage. Detailed layouts for comparison of each mining method were completed for the required accesses, pillars, mined grade, recovered tonnage, and direct mining cost. Table 16-1 lists the comparison of the pertinent data for the two stoping methods.
The direct mining cost is a summary of developing the accesses, the rooms/entries in mineralized material, the horizontal breasting (room and pillar), the end slicing (transverse), backfill, the work involved with filling, the mineralized material and fill haulage, and haulage of the excess material generated. The cost of the fill is the significant difference between the two proposed methods. The transverse-and-cemented-fill method requires a ‘concrete’ pillar top to bottom to support the entire stope area, so the adjacent extractions can be performed.
The post-pillar cut-and-fill mining method was selected for the PEA evaluation.
16.4 Post-Pillar Cut-and-Fill
The mining method outline is provided in Section 16.3.4 and is shown schematically in Figure 16-1.
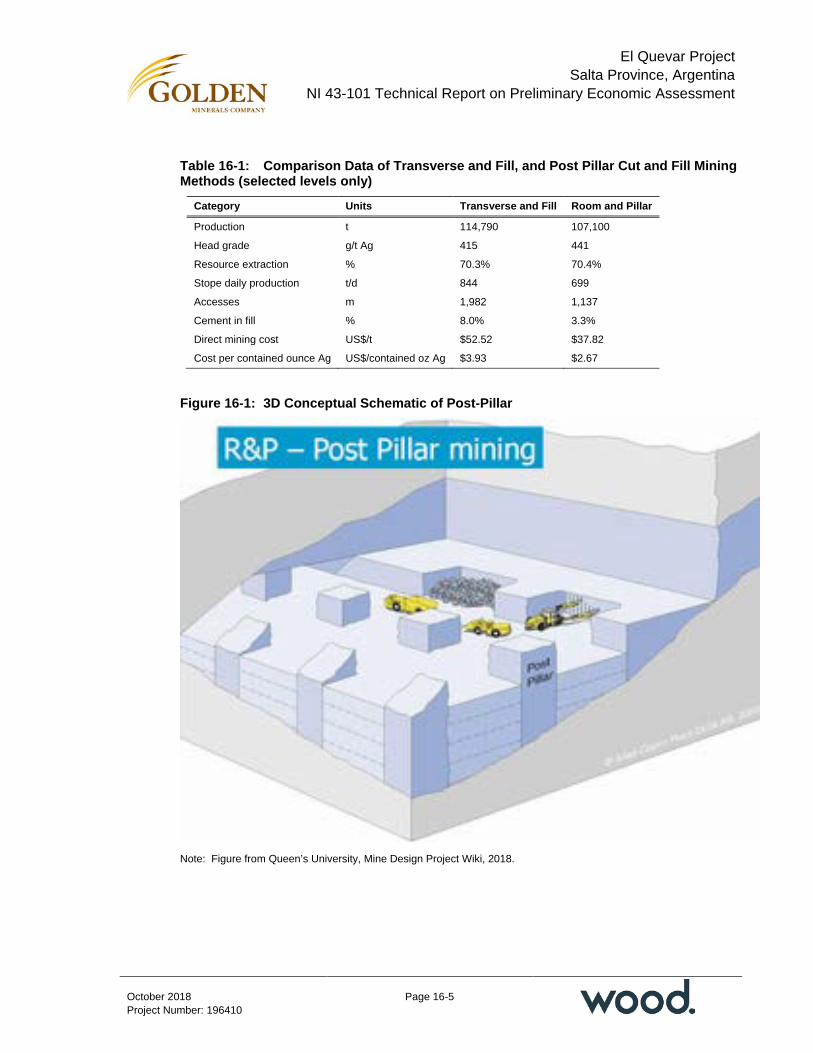
El Quevar Project Salta Province, Argentina
NI 43-101 Technical Report on Preliminary Economic Assessment
Page 16-5
October 2018 Project Number: 196410
Table 16-1: Comparison Data of Transverse and Fill, and Post Pillar Cut and Fill Mining Methods (selected levels only)
Category Units Transverse and Fill Room and Pillar
Production t 114,790 107,100
Head grade g/t Ag 415 441
Resource extraction % 70.3% 70.4%
Stope daily production t/d 844 699
Accesses m 1,982 1,137
Cement in fill % 8.0% 3.3%
Direct mining cost US$/t $52.52 $37.82
Cost per contained ounce Ag US$/contained oz Ag $3.93 $2.67
Figure 16-1: 3D Conceptual Schematic of Post-Pillar
Note: Figure from Queen’s University, Mine Design Project Wiki, 2018.
El Quevar Project Salta Province, Argentina
NI 43-101 Technical Report on Preliminary Economic Assessment
Page 16-6
October 2018 Project Number: 196410
16.5 Rock Mechanics Tests
Two samples, approximately 20 lb (9 kg) each, were taken by Golden Minerals personnel from the surface dump at the El Quevar mine site during a site visit in December 2017. Representative samples of the likely mining grade in the mineralized zone were used in the geotechnical testing. The samples were shipped from Argentina to the Golden Minerals corporate office, and then delivered to Advanced Terra Testing, Lakewood, Colorado, (Advanced Terra) for testing by Advanced Terra, as follows:
• Direct shear (ASTM D 5607)
• Unconfined compressive strength (UCS) with stress and strain measurements (ASTM D7012 (D))
• Triaxial compressive strength with stress and strain measurements (ASTM D7012 (B)).
The material testing gave the following results:
• UCS: σc = 14,713-psi (101.4 MPa)
• Angle of internal friction: φ = 28.0º
• Cohesive strength: To = 372 psi (2.6 MPa)
• Specific gravity: SG = 2.53
• Poisson’s ratio: v = 0.145
• Young’s modulus: E = 3,195,000 psi (22.0 gPa)
• Sample diameter: 2.006 in (5.1 cm)
• Sample height: 4.559 in (11.6 cm).
The UCS tests show that the mineralization has a strength of ±15,000-psi. By comparison, UCS values for other typical rocks are:
• Granite: 21,000 psi (144.8 MPa)
• Basalt: 21,500 psi (148.2 MPa)
• Limestone: 11,000 psi (75.8 MPa).
16.6 Pillar Sizing and Roof Calculations
The pillar strength is calculated using a formula suggested by Hardy and Agapito (1975), based on a study of shale pillars in Western Colorado. This approach is also supported by the approach of Stacey and Page (1986; also reported in Radouane et al., 2015),
El Quevar Project Salta Province, Argentina
NI 43-101 Technical Report on Preliminary Economic Assessment
Page 16-7
October 2018 Project Number: 196410
using a design rock mass strength (DRMS) of 70, which is considered to be “Good Rock”.
• 80% of the UCS test strength used: 11,770 psi (81.2 Mpa)
• Pillar strength (Hardy and Agapito, 1975; also reported in Radouane et al., 2015): σp = 4,850 psi (33.4 Mpa).
The immediate roof width conditions predicted were calculated using recommendations from Abels (1976) as follows: a 5 m wide room, or less, can be safely excavated with only spot bolting the weak areas that may be periodically present, using an overburden depth of 200 m and a ‘beam’ thickness of 0.12 ft (3.7 cm). A ground support system of rock bolts, split sets or similar fixtures will be required for entries greater than 5 m in width.
The general width of the mineralized zone is ±50 m; this will generate a pressure arch depth of 202 m, and the 200 m overburden depth will dictate the pillar load. The pillar size selected is a 5 m x 5 m square. The height of the rooms is 5 m; however, the room height used in the calculations was assumed to be the room that excavation is in progress and the upper 2.5 m of fill in the previous room below (7.5 m total). This assumes that the fill beyond the 7.5 m vertical boundary reinforces the pillar and enables the pillar to safely carry the tributary load.
The calculated pillar tributary load is 2,880 psi (199 MPa), and the pillar strength is 4,720 psi (32.5 MPa), giving a 1.6 factor of safety (FOS). The pillars with an overburden depth of less than 170 m have a safety factor of 1.8, with only those pillars between the maximum depth of 200 m and 170 m having a FOS of less than 1.8. A 1.8 FOS is acceptable for pillars in areas of average conditions. A FOS of 1.6 should suffice for pillars in active mining areas below the 170 m overburden level.
16.7 Mine Design Assumptions and Design Criteria
The mineralized zone is a wide zone of altered material dipping at approximately 45º. Typical wide zone mining methods, such as end-slicing, are not suggested because of the poor rock quality that is in the hanging wall. Additionally, mining will benefit from a high degree of grade control, which is a benefit of a post-pillar cut-and-fill method.
The mineralization plunges from the east to the west at approximately 10º. Main development will extend down plunge with ramps and spiral declines. Accesses will be excavated to the stoping zones from the ramp system and will intersect the lowest elevation mineralized material in the various sections of the deposit, enabling the extraction to advance upward.
The post-pillar cut-and-fill method depends on intersecting the mineralized material at the lowest elevation, then progressing upwards to the highest level. Initial rooms from the accesses will be excavated at 5 m x 5 m. The typical advance per round will be 5 m,

El Quevar Project Salta Province, Argentina
NI 43-101 Technical Report on Preliminary Economic Assessment
Page 16-8
October 2018 Project Number: 196410
although the drill depth can be adjusted if the hole cuttings indicate there is a waste zone less than 5 m beyond the face.
Extractable pillars will be “pulled” once the rooms in the area have been fully developed. Extractable pillars are those pillars not required to carry any load from the previous excavation level. “Pig pen” cribs will be installed in the rooms adjacent to the pillar that is being pulled to add a degree of load-carrying capability in the tributary area. Sized fill will be placed in the initial rooms using scoops with rammer units. Fill may be concurrent with mining in some circumstances.
Mining of the next rooms, located directly above the initial rooms, will commence once the filling is complete or at a point where it can be done concurrently with the ongoing excavation. Room excavation and filling cycles will continue until the uppermost portion of the mineralization, in a particular zone, is reached. The next level room excavations following the initial excavation will be done by working horizontally from the placed fill. The concept of using a vertical excavation system was reviewed and discarded because of the mineralization characteristics that have the deposit geometry differing significantly over five vertical meters.
Work performed in the stope areas will be completed using a “multiple heading” concept. There will be sufficient active faces so drilling, blasting and mucking in the area can be performed concurrently and independently. The drilling cycles will have the longest duration of all of the three major excavation tasks. Daily stope productivity depends on the number of drill cycles a single drill unit can be perform in a typical stope area. Work will be carried out using two 10 hr shifts per day, which leaves four hours for daily machine maintenance and “catch-up” work if required. The current plan has two stope areas in operation to deliver 1,200 t/d of mill feed material to the plant, 350 d/a.
Level plans were developed by isolating the ≥250 g/t Ag blocks for a specific elevation. An average grade of these blocks was determined, and the blocks were assigned the calculated average grade of the area. The room-and-pillar layout was then superimposed on these blocks. The level plans include some blocks that fall under established pillar areas, and some blocks that are in clusters too isolated to be mined effectively. There are planned drift areas where there are blocks that have sufficient grade to be sent to the process plant.
All of the <250 g/t Ag blocks were isolated for the same elevation. Blocks that were not relevant to the mining areas developed for the level were eliminated. The average grade of the remaining <250 g/t Ag blocks was calculated and all of the <250 g/t Ag blocks were assigned the calculated value. A test was conducted to check if there was a significant difference between using the average grade, as explained in the preceding sentence or using the actual grade of the blocks inside the proposed drift outline. The check showed that there was no significant difference between the two values.
El Quevar Project Salta Province, Argentina
NI 43-101 Technical Report on Preliminary Economic Assessment
Page 16-9
October 2018 Project Number: 196410
In the case where excavation is required but no ≥250 g/t Ag block exists, the material will be used as fill and the tonnes and grade of this material will be left out of the production summary tonnes and average grade. The final mining tally for the level was completed by counting the ≥250 g/t Ag and the <250 g/t Ag blocks inside the proposed drift outline to generate mined tonnes and an average grade for the level. The areas of excavation with no ≥250 g/t Ag blocks were summed, so that the cost of excavation in this area would be captured.
Mining level assumptions included:
• No levels were used that had <10,000 t that could be mined
• Post-pillar cut-and-fill mining should provide a 74% mining recovery for the mineralized material
• One meter of 5 x 5 m internal development per floor is required per 360 t of mill feed material shipped to the plant
• The overall grade dilution is projected at 14.7%
• The overall mineralization loss, including the tonnes gained from inclusion of the low-grade and the loss of tonnes to permanent pillars, is expected to be 15.9%.
16.8 Backfill
Backfill in the stope areas will be accomplished by hauling material from development or internal stope waste headings to the area requiring fill, and by backhauling crushed/sized backfill from the surface. The surface backfill will consist of existing loose material that is prepared using a small mobile crushing/sizing plant then loaded into empty haul trucks returning to the mine after delivering mill feed material to the run-of-mine (ROM) pad. The underground trucks will deliver the fill products at or near the point of usage.
An LHD scooptram, fitted with a rammer, will be used to push the fill into place. The objective of the rammer will be to push the fill against the back as tightly as possible, to ensure there are no voids. Voids similar to potholes in the backfill would be filled with blasted rock in the excavation cycle, resulting in mill feed material lost in the fill.
The reductions of fill voids typically created by large rock sizes in fill are the reason for selecting the relatively fine-sized material generated with blasting in the development headings and the use of the mobile crushing/sizing unit for the surface fill.
16.9 Ventilation
The mining operation will require 176 m3/sec (375,000 ft3/min) in the initial years of the operation, increasing to 200 m3/sec (430,000 ft3/min) by Year 5. The required ventilation
El Quevar Project Salta Province, Argentina
NI 43-101 Technical Report on Preliminary Economic Assessment
Page 16-10
October 2018 Project Number: 196410
increase is due to the increase in the haulage truck fleet, because of longer travel distances.
The initial mine ventilation circuit will be constructed using the existing raise (bore hole #1) that was driven to the surface during the original project development, completed in 2010. The existing raise will have a 75 hp axivane fan mounted in a bulkhead underground at the base of the raise. Air will be pulled through the workings and discharged up the raise in a negative pressure system.
Three planned ventilation raises (bore holes #2, #3, #4) will be up-reamed boreholes, 3–4 m in diameter that will be bored from the surface immediately following the completion of the development to a production area. Surface electrical distribution lines carrying 4,160 v, will connect the ventilation surface units with the plant substation. The spending plan for the borehole capital is to purchase fan units that will meet the largest predicted air volume requirement (300 hp per fan) including starters, évasé (discharge cone), diffuser and other required hardware.
An évasé and diffuser unit will be purchased once bore hole 3 is completed. Fan units and electrical hardware will be moved from bore hole 2 to bore hole 3 upon installation of the new diffuser and évasé. Each fan move will require mining operations to be idled for approximately three days.
The évasé and diffuser unit from bore hole 2 will be moved to bore hole 4 once bore hole 4 construction is completed. The fan units will be moved from bore hole 3 to bore hole 4. A leap-frog method of the bore hole equipment and moves will reduce the ventilation capital expenditures to a minimum.
The required mine ventilation is based on 100 cfm per brake horsepower (bhp), using 100% for the first diesel unit and 80% for the remaining diesel units. An additional 200 cfm is added for each person working underground.
An emergency portable escape hoist, escape capsule (bullet), and headframe structure will be purchased during the construction and equipping of bore hole 2. The escape hoist will be moved to the active bore hole along with the ventilation equipment as the mining advances.
The development drifts and stopes will be ventilated using 75 hp fans hung from the back of the development drifts. Rigid 48 in (121.9 cm) diameter fibreglass ducting will be used in the development headings to provide ventilation air to an auxiliary stope fan(s) for distribution in the active stope areas.
16.10 Mine Dewatering
The required mine dewatering system has been estimated using the current inflow of approximately 3 L/sec (50 gpm) and assumes a predicted flow increase proportional to the increase in underground development and stoping areas. These assumptions were
El Quevar Project Salta Province, Argentina
NI 43-101 Technical Report on Preliminary Economic Assessment
Page 16-11
October 2018 Project Number: 196410
derived following discussions with Golden Minerals personnel and are based on historical flow data from the trial mining operation.
The maximum projected inflow at the deepest area of the mine is projected to be 13 L/sec (200 gpm). Phase 1 of the pump system is designed to handle 50 L/sec (800 gpm) from the deepest area of the mine. All mine water will be pumped to a decantation pond that will be located on the surface near the mine portal. Characteristics of the four proposed skid-mounted pumps are shown in Table 16-2; the table shows the anticipated mine inflow, the head associated with the station, and the horsepower required at maximum inflow of 200 gpm. Pumping will be staged from the lowest to highest stations, until it discharges on the surface. The proposed pump sizes and installed motors will meet the requirement to move up to 800 gpm if required.
Each pump station will have a decantation sump adjacent to the station to remove sediments. Decant sumps will add to the serviceable life of pumps even though they are designed for slurry handling duty. Water from the active working areas will be pumped to the decantation sumps using submersible pumps located throughout the workings at locations where water is generated and/or collected.
16.11 Underground Infrastructure and Facilities
The mine’s surface facilities, located at the portal pad, will include the following:
• Office/dry/lamp room building
• Underground shop
• Surface maintenance shop with wash bay and tire repair facilities (complete)
• Explosive magazines (complete)
• Fuel depot (complete)
• Generator/compressor building (complete)
• Generators set and connected (complete)
• Electrical workshop (complete)

El Quevar Project Salta Province, Argentina
NI 43-101 Technical Report on Preliminary Economic Assessment
Page 16-12
October 2018 Project Number: 196410
Table 16-2: Pump Station Characteristics
Water Handling Station Total (gpm)
Total Head (m)
∆ Head (m) Running (bhp) Installed
Motors
Station 1 (4780) 50 26 26 6.3 30
Station 2 (4716) 100 90 64 15.5 75
Station 3 (4636) 150 170 80 19.4 100
Station 4 (4516) 200 290 120 29.2 150
Max pump system design 800
• Decantation pond for mine dewatering (complete)
• Clean water system and heated tanks (complete)
• Clean water well (complete)
• 4160-volt substation (complete)
Many of the required facilities, noted as complete, were constructed with the initial Project trial mining development in 2010. These existing facilities have been well maintained and are ready for use.
16.12 Production Plan
Year -1 will be used to complete the required pre-production physical development, while Year 1 will be the ramp up to production of 1,200 t/d of mill feed material and will incur sustaining development costs. Years 2 to 5 will have sustained production at 1,200 t/d, with sustaining development at 939 m/a. Year 6 sustains production at 1,200 t/d, with all development completed by the end of Year 6.
Any feed grade material encountered in development in Year -1 and early Year 1 will be stockpiled for processing when the plant is available.
16.12.1 Production Schedule
Mine production assumes producing 1,200 t/d for 350 d/a, from two active stope areas. Two stopes are planned to be in operation throughout the mine life thus enabling the mine-out of the mineralized zone to continue without a slow drop in production at the end of the mine life. Slow production declines typically occur in mines with a large number of active stopes. A typical year of 350 days is used to accommodate the last two weeks of the year being idle, which is traditional in the northern Argentinean industries.
The proposed production schedule assumes equipment procurement; pre-production development and plant construction will be completed in Years -2 and -1. Year 1 assumes four quarters of production ramp-up:

El Quevar Project Salta Province, Argentina
NI 43-101 Technical Report on Preliminary Economic Assessment
Page 16-13
October 2018 Project Number: 196410
• Quarter 1 production: 52,500 t
• Quarter 2 production: 89,250 t
• Quarter 3 production: 99,750 t
• Quarter 4 production: 105,000 t.
Year 1 production will be 346,500 t, followed by five years of 420,000 t/a.
Mine development will consist of 6,000 m of main ramp, stope accesses, raise accesses, muck bays and other miscellaneous excavations. The sum of the development will be completed in Year -1 and the first five years of production.
16.12.2 Mining Sequence
Figure 16-2 displays the general mine development plan that will extend the existing development and follows the deposit as it plunges to the northwest. The development in Figure 16-2 has been color-coded to identify the development associated with the 4500 to 4600 levels (violet), 4600 to 4700 levels (orange), and 4700+ levels (green). Main accesses will be developed on 10 m vertical centers, with an internal stope access developed on 5 m centers. The main development will be located in the footwall of the mineralized zone. Four ventilation bore holes have been strategically placed to minimize the use of ventilation ducting.
Figure 16-3 displays the 14 stoping zones, which are areas that have sufficiently continuous mineralization over an acceptable vertical distance.
16.13 Drilling, Blasting and Explosives
The drilling and blasting will be completed using typical underground drill-blast technologies. Drilling will be accomplished using two-boom, hydraulic drifter jumbos, with 18 ft (5.5 m) penetration slides, drilling two 3 in (7.6 cm) diameter break holes and 1 3/4 in (4.4 cm) diameter holes for loading with explosives. The average advance per drilled round will be 16.6 ft (5.1 m). This advance is based on empirical blasting formulas for medium–hard ground. The average advance per drilled round when breasting will be 18 ft (5.5 m), based on the same empirical blasting formulas. Full-face rounds require 73 holes including the 3 in (7.6 cm) diameter break holes, and the horizontal breasting rounds require 56 holes
The explosives used will include 30 ft (9.1 m) LP caps that are components of a non-el detonating system, with fuse and cap for initiation. Cartridges of emulsion will be used for primers and for loading any wet/damp holes. Dry holes that do not require cartridge explosives will be loaded with bulk ANFO, delivered by the bulk ANFO explosive carriers specified for procurement.
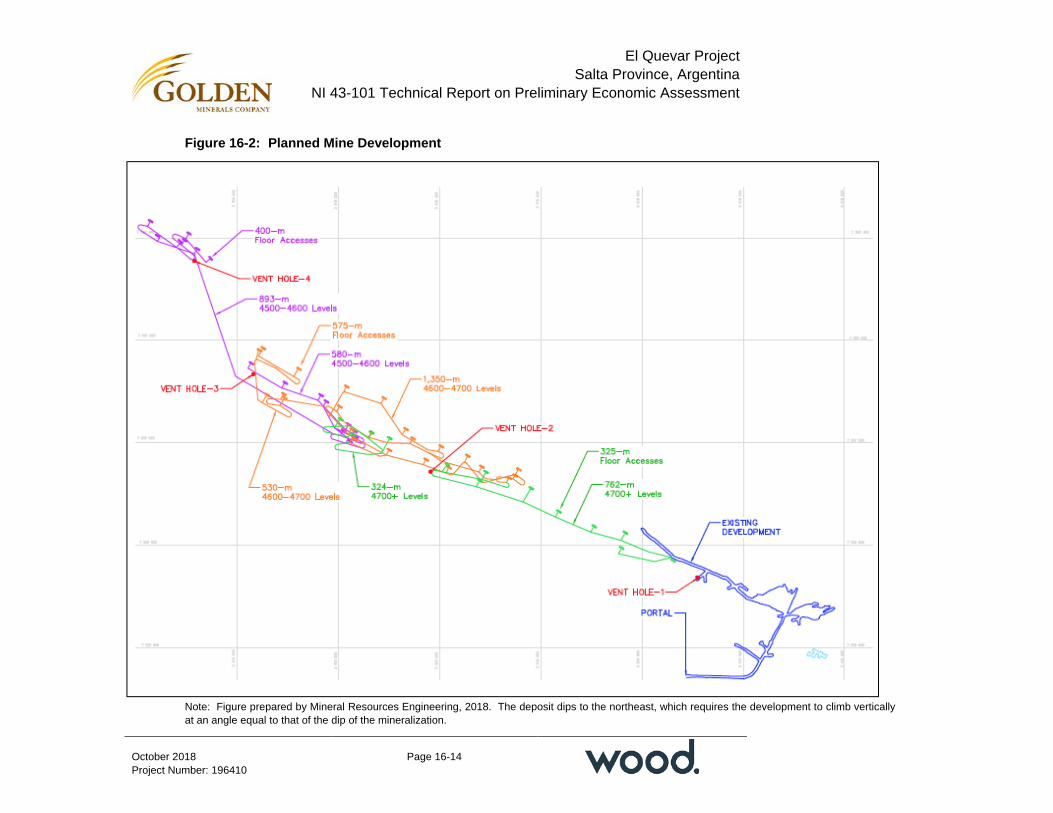
El Quevar Project Salta Province, Argentina
NI 43-101 Technical Report on Preliminary Economic Assessment
Page 16-14
October 2018 Project Number: 196410
Figure 16-2: Planned Mine Development
Note: Figure prepared by Mineral Resources Engineering, 2018. The deposit dips to the northeast, which requires the development to climb vertically at an angle equal to that of the dip of the mineralization.

El Quevar Project Salta Province, Argentina
NI 43-101 Technical Report on Preliminary Economic Assessment
Page 16-15
October 2018 Project Number: 196410
Figure 16-3: Proposed Stoping Zones
Note: Figure prepared by Mineral Resources Engineering 2018. The stoping zones are continuous vertically with the elevation interval (in m) noted in the figure. The shapes represent the boundary of the mineralization within each of the stoping zones.
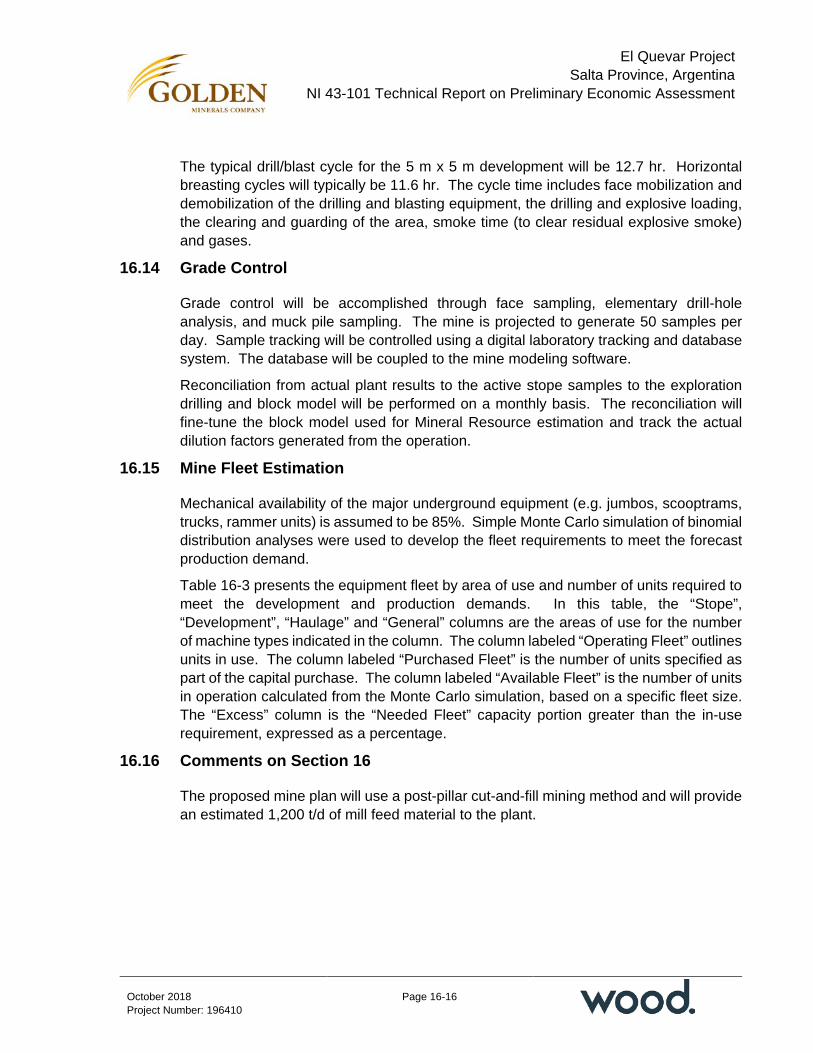
El Quevar Project Salta Province, Argentina
NI 43-101 Technical Report on Preliminary Economic Assessment
Page 16-16
October 2018 Project Number: 196410
The typical drill/blast cycle for the 5 m x 5 m development will be 12.7 hr. Horizontal breasting cycles will typically be 11.6 hr. The cycle time includes face mobilization and demobilization of the drilling and blasting equipment, the drilling and explosive loading, the clearing and guarding of the area, smoke time (to clear residual explosive smoke) and gases.
16.14 Grade Control
Grade control will be accomplished through face sampling, elementary drill-hole analysis, and muck pile sampling. The mine is projected to generate 50 samples per day. Sample tracking will be controlled using a digital laboratory tracking and database system. The database will be coupled to the mine modeling software.
Reconciliation from actual plant results to the active stope samples to the exploration drilling and block model will be performed on a monthly basis. The reconciliation will fine-tune the block model used for Mineral Resource estimation and track the actual dilution factors generated from the operation.
16.15 Mine Fleet Estimation
Mechanical availability of the major underground equipment (e.g. jumbos, scooptrams, trucks, rammer units) is assumed to be 85%. Simple Monte Carlo simulation of binomial distribution analyses were used to develop the fleet requirements to meet the forecast production demand.
Table 16-3 presents the equipment fleet by area of use and number of units required to meet the development and production demands. In this table, the “Stope”, “Development”, “Haulage” and “General” columns are the areas of use for the number of machine types indicated in the column. The column labeled “Operating Fleet” outlines units in use. The column labeled “Purchased Fleet” is the number of units specified as part of the capital purchase. The column labeled “Available Fleet” is the number of units in operation calculated from the Monte Carlo simulation, based on a specific fleet size. The “Excess” column is the “Needed Fleet” capacity portion greater than the in-use requirement, expressed as a percentage.
16.16 Comments on Section 16
The proposed mine plan will use a post-pillar cut-and-fill mining method and will provide an estimated 1,200 t/d of mill feed material to the plant.
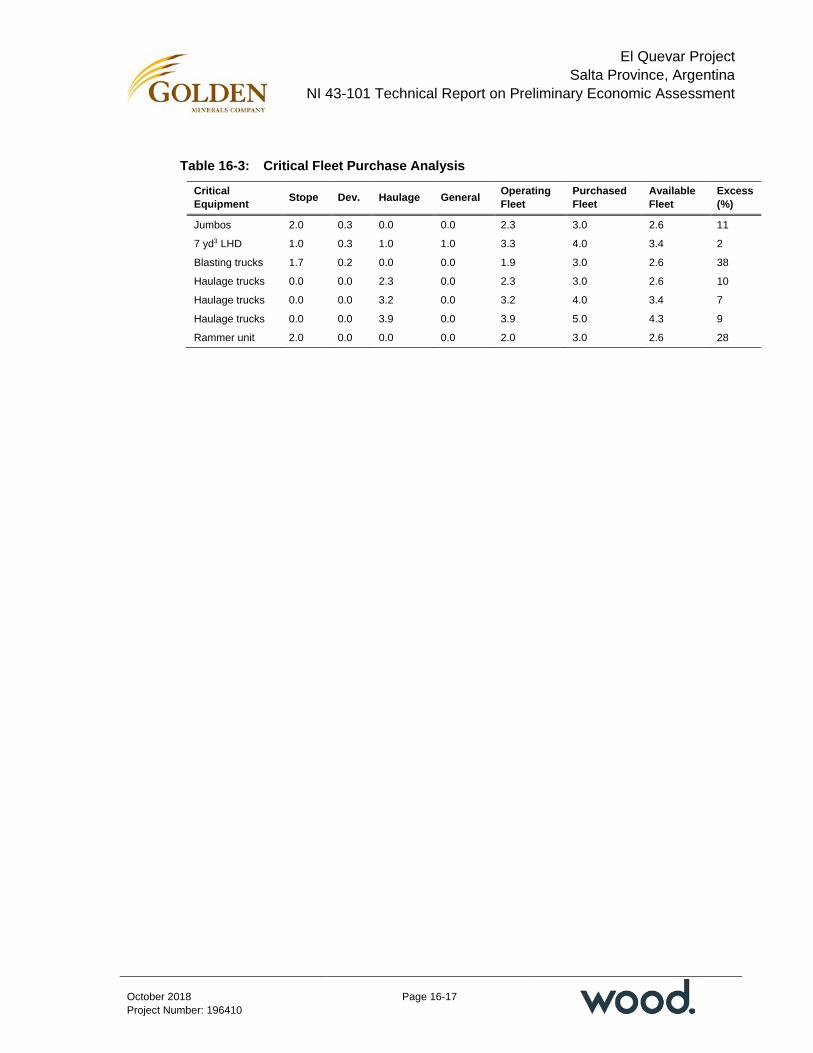
El Quevar Project Salta Province, Argentina
NI 43-101 Technical Report on Preliminary Economic Assessment
Page 16-17
October 2018 Project Number: 196410
Table 16-3: Critical Fleet Purchase Analysis
Critical Equipment Stope Dev. Haulage General Operating
Fleet Purchased Fleet
Available Fleet
Excess (%)
Jumbos 2.0 0.3 0.0 0.0 2.3 3.0 2.6 11 7 yd3 LHD 1.0 0.3 1.0 1.0 3.3 4.0 3.4 2
Blasting trucks 1.7 0.2 0.0 0.0 1.9 3.0 2.6 38
Haulage trucks 0.0 0.0 2.3 0.0 2.3 3.0 2.6 10
Haulage trucks 0.0 0.0 3.2 0.0 3.2 4.0 3.4 7
Haulage trucks 0.0 0.0 3.9 0.0 3.9 5.0 4.3 9
Rammer unit 2.0 0.0 0.0 0.0 2.0 3.0 2.6 28

El Quevar Project Salta Province, Argentina
NI 43-101 Technical Report on Preliminary Economic Assessment
Page 17-1
October 2018 Project Number: 196410
17.0 RECOVERY METHODS
17.1 Process Flow Sheet
The processing facility flowsheet was developed to recover silver from the Yaxtché sulfide deposit. The current design basis is set to process 1,200 t/d of mineralized material from the underground mine for the production of a bulk silver concentrate by conventional crushing (two stages), grinding (single stage) and flotation (rougher [two stages] and cleaners [five stages]) techniques. Testwork completed by DML and JKTech was used as the basis for the design of the process plant. The results of DML’s 2012 locked cycle flotation testwork (see Section 13.7) was Samuel Engineering’s primary data source. This testwork included only two cleaner stages for producing the bulk silver concentrate. Samuel Engineering modeled the mass balance for the process plant to include five cleaner stages in order to produce a marketable, high-grade bulk silver concentrate of about 11.5 kg/t Ag.
Figure 17-1 shows a rendition of the El Quevar process plant and Figure 17-2 shows a simplified block flow diagram for the proposed process plant. Table 17-1 lists the major equipment for the process plant, and Table 17-2 summarizes the plant’s design criteria.
Run-of-mine (ROM) mineralized material would be fed to the comminution circuit. Comminution would be accomplished by two stage crushing followed by ball milling to produce a particle diameter of 80% passing (P80) of 45 µm. The ROM material would be dumped by mine trucks into a primary bin equipped with a grizzly feeder (1.2 m by 3.0 m). Oversize material from the grizzly feeder would be discharged to the primary crusher, a 115 kW jaw crusher (0.86 m by 1.12 m) with a rated capacity of 225 t/h. The primary crushed material would be combined with the undersize material from the grizzly and conveyed to the coarse crushed stockpile. The coarse crushed stockpile would have a live capacity of 800 t (or about 16 hrs surge). Coarse material from the stockpile would be reclaimed and conveyed to the secondary crushing circuit.
The coarse material would be pre-screened by the double-deck secondary screen. The screen oversize would be fed to a secondary cone crusher (2.1 m diameter) at an estimated throughput rate of 28 t/h. The secondary crushing circuit would produce a fine product at a rate of about 70 t/h at a nominal P80 of 13 mm. The fine crushed product would be conveyed to a fine crushed stockpile as feed to the ball mill grinding circuit. The fine crushed stockpile would have a live capacity of about 750 t which would provide a surge capacity feeding the grinding circuit of about 13 hr.
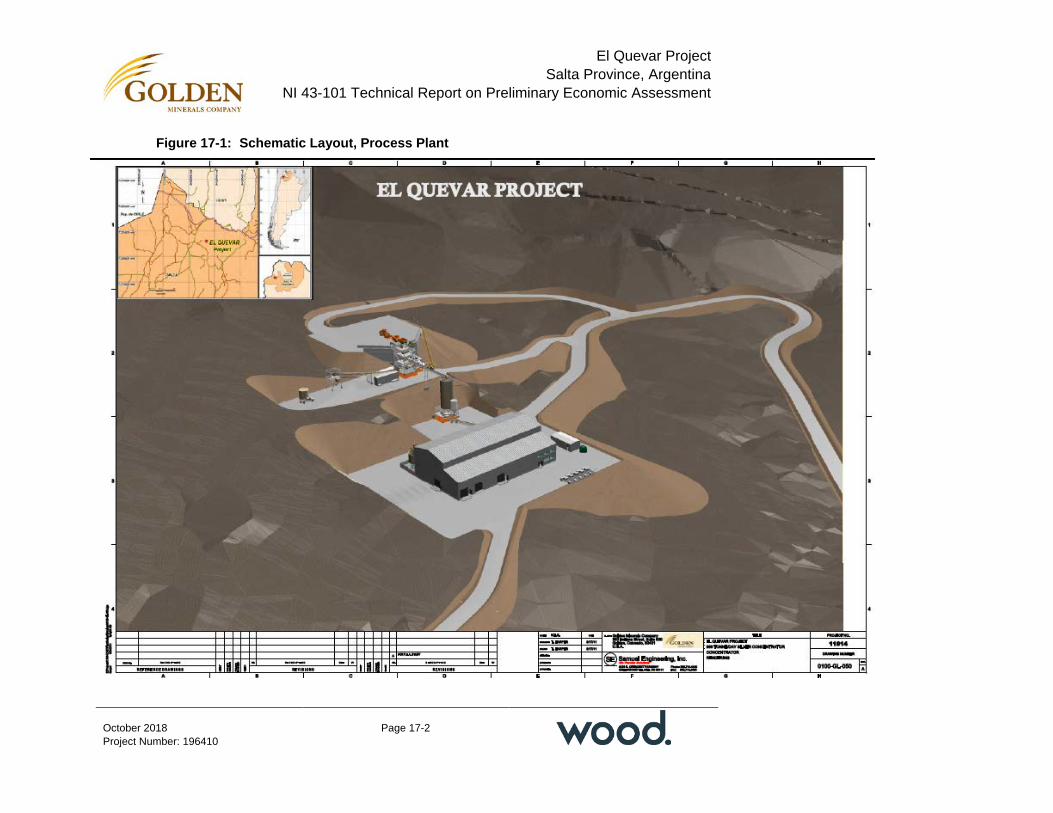
El Quevar Project Salta Province, Argentina
NI 43-101 Technical Report on Preliminary Economic Assessment
Page 17-2
October 2018 Project Number: 196410
Figure 17-1: Schematic Layout, Process Plant

El Quevar Project Salta Province, Argentina
NI 43-101 Technical Report on Preliminary Economic Assessment
Page 17-3
October 2018 Project Number: 196410
Figure 17-2: El Quevar Proposed Block Flow Diagram
Grizzly Feeder
Overflow
Primary Crusher
Secondary Crusher Screen Secondary Crusher
Fine Crushed Stockpile
Ball Mill
Ball Mill Cyclones
1st/2nd Rougher Flotation
1st Cleaner Flotation
2nd Cleaner Flotation
Tailings Thickener
Tailings Storage Facility
Process Water Tank
Concentrate Thickener
Concentrate Filtration
Bulk Silver Concentrate Packaging and Shipping
Undersize
Overflow
Rougher Concentrate
Concentrate
Underflow
Tails
Underflow
1st Cleaner Scavenger Flotation
Tails
Tails
Tails
Concentrate
Underflow
Overflow
Concentrate
Oversize
Filtrate3rd Cleaner Flotation
4th Cleaner Flotation
5th Cleaner Flotation
Concentrate
Concentrate
Concentrate
Tails
Tails
Tails
ROM Material
Primary Crushed Stockpile
Note: Figure prepared by Samuel Engineering, 2018.
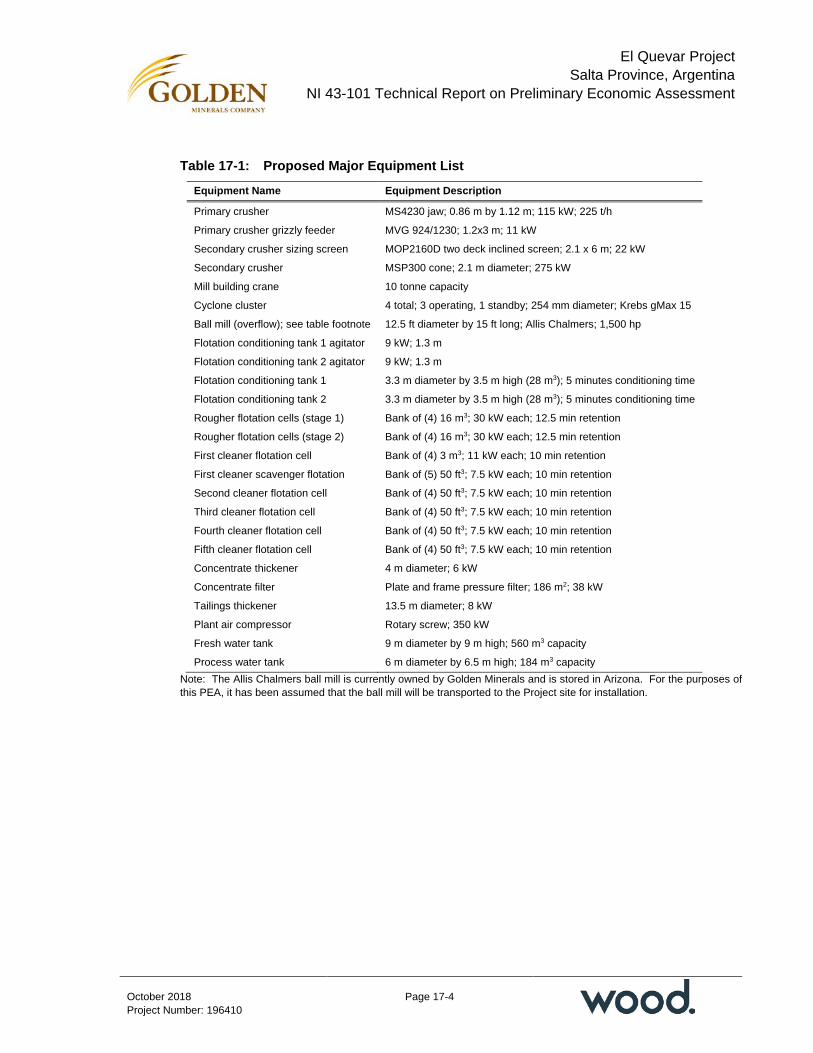
El Quevar Project Salta Province, Argentina
NI 43-101 Technical Report on Preliminary Economic Assessment
Page 17-4
October 2018 Project Number: 196410
Table 17-1: Proposed Major Equipment List
Equipment Name Equipment Description
Primary crusher MS4230 jaw; 0.86 m by 1.12 m; 115 kW; 225 t/h
Primary crusher grizzly feeder MVG 924/1230; 1.2x3 m; 11 kW
Secondary crusher sizing screen MOP2160D two deck inclined screen; 2.1 x 6 m; 22 kW
Secondary crusher MSP300 cone; 2.1 m diameter; 275 kW
Mill building crane 10 tonne capacity
Cyclone cluster 4 total; 3 operating, 1 standby; 254 mm diameter; Krebs gMax 15
Ball mill (overflow); see table footnote 12.5 ft diameter by 15 ft long; Allis Chalmers; 1,500 hp
Flotation conditioning tank 1 agitator 9 kW; 1.3 m
Flotation conditioning tank 2 agitator 9 kW; 1.3 m
Flotation conditioning tank 1 3.3 m diameter by 3.5 m high (28 m3); 5 minutes conditioning time
Flotation conditioning tank 2 3.3 m diameter by 3.5 m high (28 m3); 5 minutes conditioning time
Rougher flotation cells (stage 1) Bank of (4) 16 m3; 30 kW each; 12.5 min retention
Rougher flotation cells (stage 2) Bank of (4) 16 m3; 30 kW each; 12.5 min retention
First cleaner flotation cell Bank of (4) 3 m3; 11 kW each; 10 min retention
First cleaner scavenger flotation Bank of (5) 50 ft3; 7.5 kW each; 10 min retention
Second cleaner flotation cell Bank of (4) 50 ft3; 7.5 kW each; 10 min retention
Third cleaner flotation cell Bank of (4) 50 ft3; 7.5 kW each; 10 min retention
Fourth cleaner flotation cell Bank of (4) 50 ft3; 7.5 kW each; 10 min retention
Fifth cleaner flotation cell Bank of (4) 50 ft3; 7.5 kW each; 10 min retention
Concentrate thickener 4 m diameter; 6 kW
Concentrate filter Plate and frame pressure filter; 186 m2; 38 kW
Tailings thickener 13.5 m diameter; 8 kW
Plant air compressor Rotary screw; 350 kW
Fresh water tank 9 m diameter by 9 m high; 560 m3 capacity
Process water tank 6 m diameter by 6.5 m high; 184 m3 capacity Note: The Allis Chalmers ball mill is currently owned by Golden Minerals and is stored in Arizona. For the purposes of this PEA, it has been assumed that the ball mill will be transported to the Project site for installation.

El Quevar Project Salta Province, Argentina
NI 43-101 Technical Report on Preliminary Economic Assessment
Page 17-5
October 2018 Project Number: 196410
Table 17-2: El Quevar Process Design Criteria
Description Units Values
Bond ball mill work index kWhr/t 11.8
Grind size p80 µm 45
Grind solids % 55
Conditioning min 5
Rougher flotation first stage min 12.5
Conditioning min 5
Rougher flotation second stage min 12.5
Cleaner flotation first stage min 10
Cleaner scavenger flotation first stage min 10
Cleaner flotation second stage min 10
Cleaner flotation third stage min 10
Cleaner flotation fourth stage min 10
Cleaner flotation fifth stage min 10
Flotation collector (Cytec 3418A): ball mill g/t 25
Flotation collector (Cytec 3418A): conditioner g/t 5.0
Flotation collector (Cytec 3418A): cleaner scavenger g/t 2.5
Flotation collector (Cytec 3418A)-each cleaner stage g/t 2.5
Flotation promoter (Cytec 242): ball mill g/t 25
Flotation promoter (Cytec 242): conditioner g/t 5.0
Flotation promoter (Cytec 242): cleaner scavenger g/t 2.5
Flotation promoter (Cytec 242): each cleaner stage g/t 2.5
Frother MIBC: rougher first stage g/t 0.030
Frother MIBC: rougher second stage g/t 0.015
Frother MIBC: each cleaner stage g/t 0.015
pH: rougher flotation first stage — 6.8
pH: rougher flotation second stage — 6.3
pH: cleaner flotation first stage — 6.9
pH: cleaner scavenger flotation — 7.1
pH: cleaner flotation second stage — 7.1
pH: cleaner flotation third stage — 7.5
pH: cleaner flotation fourth stage — 7.5
pH: cleaner flotation fifth stage — 7.5
El Quevar Project Salta Province, Argentina
NI 43-101 Technical Report on Preliminary Economic Assessment
Page 17-6
October 2018 Project Number: 196410
The ball mill circuit would operate in closed circuit with cyclones to achieve a grind size at a nominal P80 of 45 µm. The ground slurry from the ball mill (12.5 ft diameter by 15 ft long; 1,500 hp) would discharge to the ball mill discharge sump with about 98 t/h reclaim water to bring the pulp density to about 55% solids. The ball mill cyclone cluster would size the pulp to a P80 of 45 µm for flotation with an overflow of 54 t/h solids in a slurry at a pulp density of 35% by weight solids. Underflow from the cyclones at 170 t/h dry solids (300% circulating load) with a pulp density of about 64% solids by weight would be returned to the ball mill for further grinding.
Cyclone overflow would be pumped to the flotation circuit via the flotation feed conditioning tank. Flotation reagents (collectors, promoters and frothers) would be added to the slurry for conditioning along with recycled process water from the concentrate thickener overflow and tailings reclaim water. The rougher flotation circuit would be done in two stages. Rougher flotation stages one and two would be comprised of four 16 m3 mechanical cells in each stage separated by a second conditioning tank where more reagents are added. The flotation concentrates from both rougher stages would be combined and pumped to cleaner flotation. Cleaner flotation would be done in five stages using 3 m3 and 50 ft3 cells operating in closed-circuit to produce a high-grade silver concentrate. Testwork indicates the silver concentrate would contain elevated levels of arsenic, bismuth and antimony. Reagents would be added to each cleaner stage. The final concentrate from the fifth cleaner stage represents the final bulk silver concentrate. The tailings from the first cleaner stage would be sent to cleaner scavenger flotation with the scavenger concentrate returned to the ball mill and the scavenger tailings to the tailings thickener.
The tailings from the second rougher stage would be combined with the cleaner scavenger tailings as the final plant tailings which would be pumped to the tailings thickener at about 52 dry t/h in a slurry with a pulp density of about 37% solids by weight.
The bulk silver concentrate from the fifth cleaner stage would be pumped to the concentrate thickener where it would be thickened to about 30% solids by weight. The thickener overflow would be returned to the process water tank and the thickener underflow would be pumped to a holding tank ahead of the concentrate pressure filter. The concentrate filter would reduce the concentrate cake to about 10% moisture and the filtrate would be pumped back to the concentrate thickener. The final silver concentrate would be packaged in one tonne super sacks for shipment.
The final plant tailings in the thickener underflow would be pumped to the tailings impoundment location, a distance of about 670 m, at a rate of 52 dry t/h with a pulp density of about 55% solids by weight. The final settled density of the tailings in the tailings impoundment is estimated at about 70% solids by weight with about 24 t/h reclaim water returned as process water to the plant circuits.
El Quevar Project Salta Province, Argentina
NI 43-101 Technical Report on Preliminary Economic Assessment
Page 17-7
October 2018 Project Number: 196410
17.2 Reagents, Water, and Power
Projected requirements are:
• Energy: 22.5 kWhr/t processed
• Makeup fresh water: 600 L/min
• Crusher liners: 16 t/a
• Ball mill liners: 46 t/a
• Ball mill grinding balls: 614 t/a
• Flotation collector: 16.8 t/a
• Flotation promoter: 16.8 t/a
• Frother: 3.8 t/a
• Flocculant: 0.4 t/a
17.3 Comments on Section 17
The proposed process plant at El Quevar would utilize conventional unit processes for the production of a high-grade silver concentrate. This concentrate would be marketable but would likely incur penalties for the elevated levels of arsenic, antimony and bismuth. Additional testwork for reducing these penalties as well as optimizing the plant performance should be completed on fresh representative samples as noted in Section 13.

El Quevar Project Salta Province, Argentina
NI 43-101 Technical Report on Preliminary Economic Assessment
Page 18-1
October 2018 Project Number: 196410
18.0 PROJECT INFRASTRUCTURE
18.1 Introduction
A layout plan showing the locations of existing and proposed infrastructure is provided in Figure 18-1.
18.2 Road and Logistics
The Project camp facilities are reached using a company-built 4.1 km access from state route RP 27. The mine and plant areas are located 14.8 km from the camp via a company-built access road. Accesses to the explosive magazines, mine to plant haul road, fuel depot, and other points of access were previously constructed during the trial development performed in 2010. The upkeep and maintenance of Project roads is accounted for in the environmental department estimate in Section 21.
18.3 Stockpiles
Stockpile requirements will be minimal. Trucks from the mine will dump mill-feed material into a grizzly or into an area provided at the ROM pad adjacent to the plant. A FEL assigned to the ROM pad will feed mill feed material to the grizzly from the truck piles when no trucks are dumping directly onto the grizzly.
18.4 Waste Storage Facilities
There are no permanent waste storage facilities designed for the Project as part of this PEA. Waste from pre-development will be stored in a temporary stockpile on the surface. The temporary stockpile and all other waste produced will be used as backfill for the extracted stopes. Waste stored on surface will be used for stope backfill and transported underground using the mine haul trucks after the trucks have delivered their loads to the plant ROM area.
18.5 Tailings Storage Facilities
The tailings storage facility (TSF) will be located approximately 600 m west of the plant facility in a natural bowl at a base elevation of 4,842 masl. Construction of the TSF will be in two phases: Phase I will be constructed in Year -1 and Phase II will be constructed during Year 3 for operation in Year 4 through the remaining scheduled mine life. The current TSF design enables the storage of 2.7 Mt, with an additional 0.7 Mt able to be deposited using a wedding cake deposition methodology.

El Quevar Project Salta Province, Argentina
NI 43-101 Technical Report on Preliminary Economic Assessment
Page 18-2
October 2018 Project Number: 196410
Figure 18-1: Infrastructure Layout Plan
El Quevar Project Salta Province, Argentina
NI 43-101 Technical Report on Preliminary Economic Assessment
Page 18-3
October 2018 Project Number: 196410
The construction methodology will be as follows:
• Top soil in the containment area will be removed and stored nearby. Special care is used to maintain vegetation for replanting and final reclamation. About 7,150 m2 of area will need topsoil removal
• Excavation of the main dam keyway will require 5,200 m3 of excavation. The material excavated will be used as structural fill in the construction of the three required dams
• Top soil in the containment’s internal area will be removed and stored, with special care given to vegetation that requires re-planting. This is about 31,000 m2 of area for removal
• A clay liner, approximately 300 mm thick, will be constructed throughout the Phase I area. Approximately 20,100 m3 of clay is required to cover the entire internal surface of the bowl and dam for Phase I. The clay will be excavated from a clay source located about 5 km (distance per W. Rehn, Golden Minerals) from the planned TSF
• The drain collectors and “chinos” will be installed along the various contours leading downhill to the collection area. The 150 mm perforated drain pipe will be covered with Geo-Fabric to allow seepage into the pipes. The chinos will tie directly into the drain system to accommodate seepage. The system will drain into a concrete collection chamber where submersible pumps will be used to transport the decant water back to the plant for re-use
• The Phase 1 dam will be constructed with typical structural fill, in 300 mm lifts. About 49,000 m3 of fill is required to complete the Phase I dam
• Plant discharge into the tailing pond will use cyclones positioned around the TSF perimeter.
Figure 18-2 shows the proposed layout for the Phase 1 dam.
Phase II construction will consist of the following activities:
• A clay liner approximately 300 mm thick will be constructed above the clay installed during the Phase I construction. Approximately 10,800 m3 of clay will be required
• The Phase II dam will be constructed with typical structural fill, normally 300 mm lifts. About 87,300 m3 of fill will be required to complete the Phase II dam
• A small dam, shown on the northwest corner of Figure 18-1, will be constructed in Phase II with typical structural fill, in 300 mm lifts. About 3,000 m3 of fill will be required to complete the Phase II TSF.
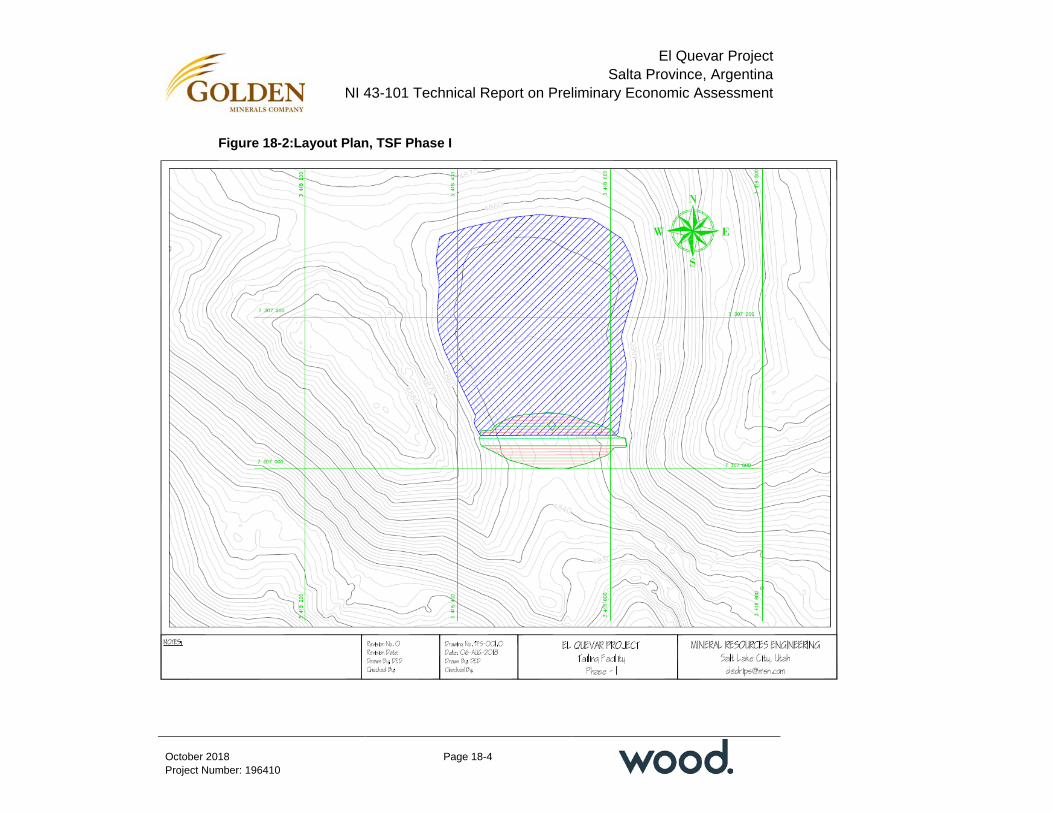
El Quevar Project Salta Province, Argentina
NI 43-101 Technical Report on Preliminary Economic Assessment
Page 18-4
October 2018 Project Number: 196410
Figure 18-2:Layout Plan, TSF Phase I
El Quevar Project Salta Province, Argentina
NI 43-101 Technical Report on Preliminary Economic Assessment
Page 18-5
October 2018 Project Number: 196410
• The plant discharge into the tailing pond will continue to use cyclones positioned around the TSF perimeter. Stacked tailings in a “wedding cake” or tiered configuration will be used to deposit the last 3 m of tailings above the dam elevations. This method of tailings deposition simplifies future reclamation efforts
• Reclamation will be completed using clay from the existing clay pit to cap the dam and tailings followed by topsoil from the topsoil storage area. Revegetation and reseeding of the area with native plants will complete the process.
Figure 18-3 shows the proposed layout for the Phase 2 dam.
Reclamation will be completed using clay from the existing clay pit to cap the dam. The removed topsoil will be placed on top of the cap and reseeding of the area with native plants will complete the process.
18.6 Water Management
The mine discharge will be routed to a decantation pond near the mine portal. Mine water is not acidic and will not require treatment. Minor amounts of sediment at times will be settled in the decantation pond. The decantation pond water will discharge into alluvium that covers the area.
The El Quevar Project is located in an arid climate with little moisture; however, the small amount of non-contact water from precipitation will be diverted around the Project facilities using a combination of collection areas and drainage ditches.
18.7 Camps and Accommodation
Existing camp accommodations will provide offices, dining and lodging accommodations for the pre-development and building construction phase. The current camp also has a power generator adequate for the expansion, diesel and lube depot, trash pit, water treatment plant and potable well water system. The current camp provides room and board for 100 workers. The PEA plan envisages expanding the camp to 350-person capacity.
18.8 Power and Electrical
The project power will be supplied using natural gas generators with gas provided from a major natural gas line that is located about 2 km from the El Quevar camp. The capital estimate includes a natural gas supply line extended from this gas line to the generator site adjacent to the El Quevar camp.
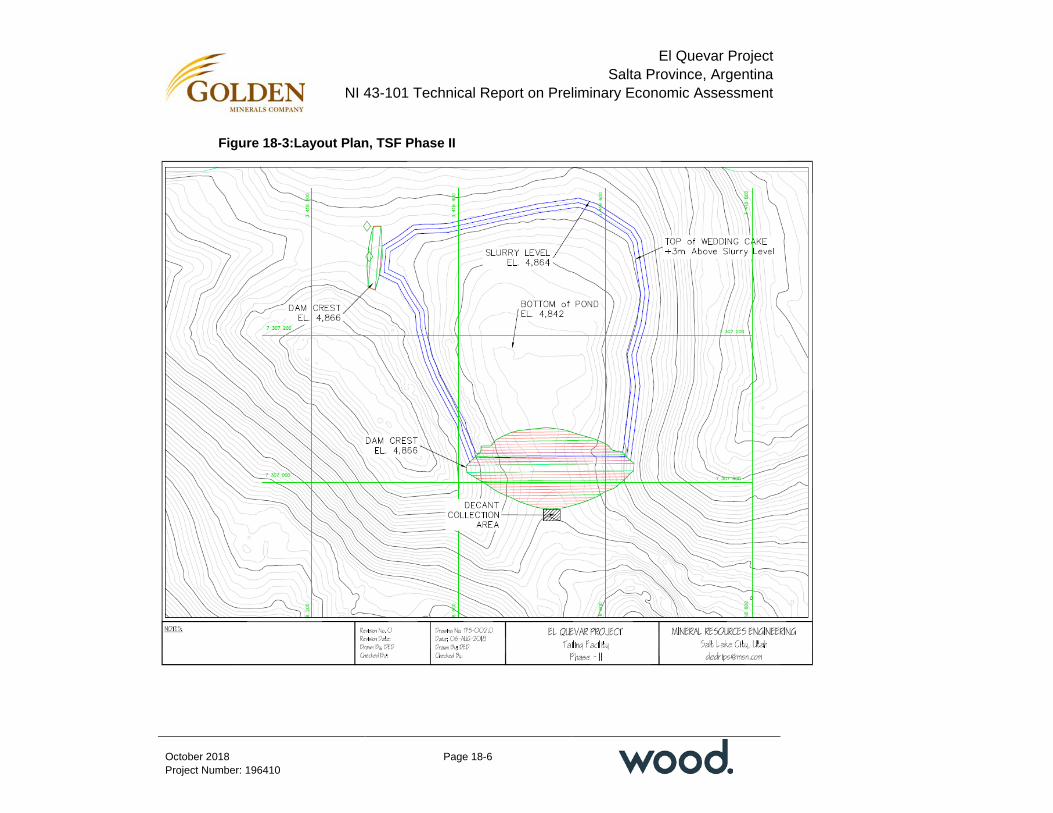
El Quevar Project Salta Province, Argentina
NI 43-101 Technical Report on Preliminary Economic Assessment
Page 18-6
October 2018 Project Number: 196410
Figure 18-3:Layout Plan, TSF Phase II
El Quevar Project Salta Province, Argentina
NI 43-101 Technical Report on Preliminary Economic Assessment
Page 18-7
October 2018 Project Number: 196410
The generation facility will consist of three 3.0 MW generators with two generators running and one generator on standby. The generators will develop 13.8 kV, which will be stepped up to 25 kV for delivery to the mine and plant. A 25 kV overhead line will be used to deliver power from the generator site to the mine and plant site. The plant and mine will each have 3.0 MW substations accepting the 25 kV power and stepping the power down to distribution system voltages.
The camp area will obtain power directly from the generator substation via a distribution transformer.
A simple one-line for the Project was developed to ensure that the selected generators could handle the designed load, and to ensure that the selected mill motor can be started under typical operating conditions. This is provided as Figure 18-4.
18.9 Fuel
The existing camp fuel depot has a 20,000 L fuel and lubricant storage area. The existing mine site has a 300,000 L fuel depot and isolated lubricant area with waste oil storage. Both existing fuel storages are sufficient for the planned operation.
This PEA assumes that fuel will be delivered from vendors in Salta. A fuel cost of US$0.91/L, delivered to site, was used as the cost basis for the economic model.
18.10 Water Supply
The camp water supply is provided from a well 2.6 km east of the camp. The well is drilled into an alluvial fan that contains a large reservoir of potable water. The existing well has sufficient capacity to provide the expanded camp’s water requirement during the Project life (refer to discussion in Section 20.7.1).
18.11 Comments on Section 18
The Project has existing infrastructure, constructed to support the 2010–2011 trial mining effort. This infrastructure will be expanded in the PEA scenario.
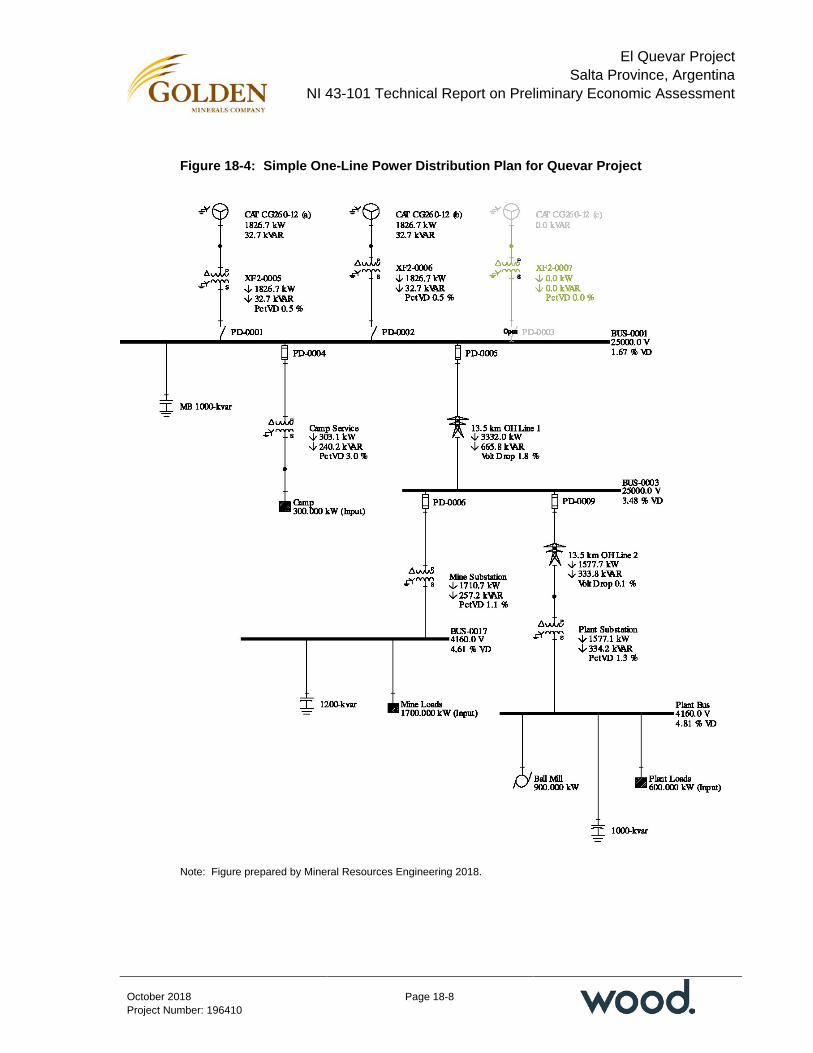
El Quevar Project Salta Province, Argentina
NI 43-101 Technical Report on Preliminary Economic Assessment
Page 18-8
October 2018 Project Number: 196410
Figure 18-4: Simple One-Line Power Distribution Plan for Quevar Project
Note: Figure prepared by Mineral Resources Engineering 2018.
El Quevar Project Salta Province, Argentina
NI 43-101 Technical Report on Preliminary Economic Assessment
Page 19-1
October 2018 Project Number: 196410
19.0 MARKET STUDIES AND CONTRACTS
19.1 Market Studies
The El Quevar Project will produce a single silver-bearing concentrate assaying about 11.5 kg/t Ag of concentrate from the on-site process plant. This concentrate will be loaded into one tonne super sacks at the process plant and trucked to the Chilean port of Antofagasta for export to foreign smelters for treatment (smelting) and refining.
The marketing strategy for the El Quevar concentrate will focus on Golden Minerals progressing the Project forward into development and production. Golden Minerals has not entered into any discussions for concentrate sales contracts or terms and has not committed any tonnages of concentrate with potential buyers or consumers. The metal concentrate market is forecasted to be in a deficit in the future when there exists the potential for the El Quevar Project to be placed into production. Reportedly, China will continue to expand the capacity of its smelting industry, and thus, the needs for additional concentrate feed materials. As part of future engineering studies, it is recommended that Golden Minerals pursue discussions with potential concentrate buyers and traders in both the Asian and European markets.
For this study, it has been assumed that the El Quevar silver concentrate will be packaged on-site, trucked to the Antofagasta port in Chile, and ocean-shipped to Asian smelters for treatment. Table 19-1 summarizes the estimated costs for the concentrate transport, smelting, refining, and related costs.
The El Quevar concentrate will contain high payable values of silver. The silver payable is estimated at 95% based on the concentrate assays from metallurgical testwork and plant material balances.
Metallurgical testwork indicates elevated levels of impurities for bismuth, arsenic and antimony in the concentrate, which would result in penalties. The treatment and refining charges in the economic analysis have been adjusted for the estimated penalties.
Table 19-2 summarizes the concentrate assays for the impurities based on DML’s 2012 metallurgical testwork.
The indicated penalties for El Quevar concentrate are summarized in Table 19-3 based on the impurity concentrate assays in Table 19-2.
The smelting, refining and penalty terms stated in Table 19-2 and Table 19-3 are based on benchmarks to current terms based on similar projects contained in Samuel Engineering’s databases. No marketing studies for El Quevar concentrate have been completed by or on behalf of Golden Minerals.

El Quevar Project Salta Province, Argentina
NI 43-101 Technical Report on Preliminary Economic Assessment
Page 19-2
October 2018 Project Number: 196410
Table 19-1: Concentrate Transport, Smelting, Refining, and Related Costs
Description Units Value
Smelter and refining
Smelter concentrate treatment charge US$/dmt concentrate 110
Refining - silver US$/oz of payable silver 1.10
Concentrate handling and transportation
Site packaging/handling US$/wmt concentrate 20
Land freight to Antofagasta, Chile US$/wmt concentrate 100
Antofagasta port handling charges US$/wmt concentrate 20
Freight to Asian smelter US$/wmt concentrate 100
Agent/umpire fees US$/wmt concentrate 15
Insurance % of concentrate value 0.2 Note: wmt = wet metric tonne; dmt = dry metric tonne.
Table 19-2: Concentrate Impurity Assays
Element Units Assay
Arsenic % 0.40
Antimony % 1.89
Bismuth % 0.63 Note: Element and assay data from DML locked cycle flotation results 2012, YWMC-2010 composite.
Table 19-3: Indicated Penalties for El Quevar Concentrate
Element Units Assay Penalty Terms Indicated Penalty (US$/dmt conc)
Arsenic % 0.40 Limit 0.5% As + Sb; US$3.50 for every 0.1% As + Sb over 0.5% As + Sb 62.65
Antimony % 1.89
Bismuth % 0.63 Limit 0.05% Bi; US$3.00 for every 0.01% Bi over 0.05% Bi 174.00
Note: Element and assay data from DML locked cycle flotation results 2012, YWMC-2010 composite.
El Quevar Project Salta Province, Argentina
NI 43-101 Technical Report on Preliminary Economic Assessment
Page 19-3
October 2018 Project Number: 196410
Future metallurgical testwork and trade-off studies should examine various methods for improving the silver recovery and concentrate assays and reduce impurity levels and penalties.
19.2 Commodity Price Projections
The commodity price for silver used for the economic analysis is US$16.66/oz Ag based on the three-year rolling average from July 1, 2015 to June 30, 2018.
19.3 Contracts
Golden Minerals has no current contracts for property development, mining, concentrating, smelting, refining, transportation, handling, sales and hedging, forward sales contracts or arrangements.
19.4 QP Conclusions
A marketable silver concentrate would be produced at El Quevar. Silver would be the only payable metal in the concentrate; however, smelting (treatment) penalties would be incurred for the elevated impurities of arsenic, antimony and bismuth.
The QP has reviewed and analyzed the results of the metallurgical tests for the production of a bulk silver concentrate to support the assumptions in this Technical Report.
19.5 Comments on Section 19
Mining analysts are forecasting deficits in future supplies of concentrates with scheduled expansions of China’s smelting and refining industries. Thus, a comprehensive marketing strategy should be formulated by Golden Minerals as the El Quevar Project progresses to development and production to include discussions with potential concentrate buyers and traders in both the Asian and European markets.

El Quevar Project Salta Province, Argentina
NI 43-101 Technical Report on Preliminary Economic Assessment
Page 20-1
October 2018 Project Number: 196410
20.0 ENVIRONMENTAL STUDIES, PERMITTING, AND SOCIAL OR COMMUNITY IMPACT
20.1 Baseline Studies
Silex Argentina prepared impact reports for Golden Minerals in support of work programs including prospecting and exploration programs, and in support of easement applications.
In 2010, Ausenco Vector prepared an environmental baseline study that evaluated areas that were likely to be affected by mining activities (Table 20-1).
Most of the studies indicated typical settings for a project located in that area of Salta Province.
20.2 Protected Areas
The Project is situated within two Protected Areas designated under the Provincial System of Protected Areas (SIPAP), administered by the Secretariat of Environment and Sustainable Development of the Ministry of Environment and Sustainable Production of the Province of Salta:
• The Los Andes Wildlife Reserve. The reserve, created in 1980, occupies the northern portion of the Los Andes Department and was set up to preserve wildlife (particularly vicuña), flora and soils (edaphic environment)
• The Vicuña (Vicugna vicugna) Protection Zone. This zone was promulgated in 1992 and encompasses the entire species territory. Vicuña are Category 1 Convention on International Trade in Endangered Species of Wildlife and Flora (CITES) listed. Vicuña are also covered under the "Convention for the Conservation of Vicuña" through Act No. 19.282/71, which was approved on 16/08/69 between Peru and Bolivia, and by Act No. 23.582/88 the "Convention for the Conservation and Handling of the Vicuña " (the Vicuña Convention) signed in Lima by Bolivia, Chile, Ecuador and Peru.
The next-closest protected area (Los Cardones National Park) is about 130 km southeast of the Project.
20.3 Water Monitoring
Surface and water quality monitoring programs commenced in 2006. In 2011, a 12-point fixed monitoring network was established in the Viejo Campo (one monitoring point), Quevar Norte (one) and Quevar Sur streams (10).

El Quevar Project Salta Province, Argentina
NI 43-101 Technical Report on Preliminary Economic Assessment
Page 20-2
October 2018 Project Number: 196410
Table 20-1: Baseline Studies
Study Area Notes
Hydrology
Completed basic hydrogeological mapping of the main river basins in the Project area of influence; characterized water environment; reviewed water supply areas, water boundaries and divides, drainage networks, surface storage, morphological, hydrological, hydrometeorological, hydrographic, orographic, infrastructure and surface coverage; evaluated satellite images; determined the maximum runoff, through runoff simulation models, using GIS and hydrological modeling tools.
Hydrogeology Conducted desktop data reviews; prepared base cartography and completed satellite image interpretation; identified hydrogeological units. Completed 18 vertical electrical sounding (VES) tests.
Geology Characterized geological and geomorphological environment, including regional geology, deposit genesis, local geology, structure and mineralization.
Soils Conducted soils mapping; evaluated presence of any heavy metals; classified soil types; classified soil usability.
Water quality
Prepared according to the guidelines established in the National Law No. 24,585 on the Environmental Impact of Mining and Provincial Environmental Law No. 7070. Evaluated the physical–chemical characteristics of the relevant surface water bodies in the Project area of influence.
Air quality
Established baseline levels of SO2, CO, fine particulate matter (PM10), ozone and nitrogen oxides (NOx) for later comparison with the Reference Legislation, Law 24585 Annex IV-Table 8 of the Mining Legal Framework.
Paleontology Identified any occurrences of sedimentary rocks; conducted field inspections of sedimentary outcrops for fossiliferous material. No fossiliferous materials were found.
Limnology
Identified phytoplankton, phytobenthos, zooplankton and macroinvertebrate species present in the Project area of influence; calculated community diversity and abundance; characterized ecological requirements.
Flora Evaluated flora diversity; identified different flora communities; established a species list; characterized ecological requirements; identified any species that may be threatened or vulnerable.
Wildlife Evaluated faunal diversity; area usage both annually and seasonally; established a species list; characterized ecological requirements; identified any species that may be threatened or vulnerable.
Terrestrial ecology Identified the ecoregions within the Project area of influence; identified organisms within these ecoregions, document interactions and communities. Evaluated degree of man-made disturbance.
Landscape Evaluated visual landscape; documented key landscape elements.
Legal framework Identified the applicable international, national and provincial standards and criteria for the preparation of the Environmental Impact Report for the exploitation stage.
Socioeconomics Described and characterized the population that would be directly and indirectly affected within the Project area of influence; determined the
El Quevar Project Salta Province, Argentina
NI 43-101 Technical Report on Preliminary Economic Assessment
Page 20-3
October 2018 Project Number: 196410
Study Area Notes potential impact and evaluated the level of social acceptance of the Project.
Archaeology Desktop data review; field investigation to identify archaeological sites.
Systematic sampling is undertaken on an annual basis under the requirements of Resolution 295/13 of the Ministry of Mining, and samples are checked for pH, conductivity, salinity and total dissolved solids (TDS).
20.4 Climate Monitoring
A Davis weather station was operated from late 2009 to 2013. The station collected air temperature, relative humidity, solar radiation, wind speed and direction, atmospheric pressure and rainfall data. The station was located near the access road to the trial mining decline, at an elevation of 4,740 masl.
20.5 Closure Plan
A formal closure plan would be developed as part of advanced mining and permitting studies.
A closure plan that details the following activities will need to be developed:
• Where possible, returns the site to a viable self-sustaining ecosystem compatible with the surrounding environment and post-mining land use
• Ensures the natural integration of disturbed areas into the surrounding landscape and, where possible, restores the overall natural conditions of the mine site
• Ensures the long-term physical stability of engineered structures
• Ensures the chemical stability of mining products so that water resources are protected and sustained
• Returns the land to the pre-mining level of productivity, wherever possible
• Develops measures to prevent or minimize discharges of contaminants to surface water, groundwater, air, and soils, or when these are not possible treat the effluent to appropriate standards
• Meets or exceeds applicable regulatory requirements and standards for protection of human health and the environment
• Presents a durable and cost-effective strategy that minimizes the long-term expenditure of post-closure maintenance and monitoring.
Closure is likely to use a progressive closure approach that will incorporate the aspects in the bullet-point list of closure considerations. This concept of progressive remediation

El Quevar Project Salta Province, Argentina
NI 43-101 Technical Report on Preliminary Economic Assessment
Page 20-4
October 2018 Project Number: 196410
while mining is considered an industry best management practice, respects the environment, and improves performance when final closure is to be implemented. Once a decision has been made to permanently close the site, it is anticipated that the major closure activities would be completed within a period of approximately two years, if not already completed progressively.
Once rehabilitation has been completed, there will be a period of post-closure monitoring of various site aspects such as water quality, TSF stability, and diversion channels, estimated at about 5–10 years.
The level of monitoring required for these phases will be a function of environmental performance of the site and national requirements, such as physical and chemical stability of the site. The need for environmental monitoring is expected to decline once the Project facilities have been fully decommissioned, dismantled and removed and the site has been reclaimed. Reductions in monitoring frequency will be a function of environmental performance and it can be demonstrated that the reclamation work has achieved the agreed objectives. Clear identification of the objectives, such as water quality parameters, will be key to the development and implementation of the monitoring program.
The main monitoring targets for the Project will be physical stability, chemical stability and water resources.
In the absence of a detailed closure plan, the closure cost estimate was assumed as a percentage of the overall Project initial capital costs. Closure costs are included in Section 21.
20.6 Remediation Activities
Golden Minerals has completed remediation related to exploration activities, including infilling exploration trenches, closing disused roads, and encapsulation of about 7,320 m3 of stockpiled mineralization in order to avoid acid drainage issues.
20.7 Permitting
20.7.1 Current Permits
Ausenco Vector prepared an environmental baseline study report in 2010, which was accepted by the relevant authorities.
In March 2018, a Stage IIA environmental impact report was submitted to the relevant authorities to obtain approval for planned surface exploration activities, including Project reviews and 1:2,000 scale geological mapping. The Stage IIA report was approved in May 2018.
El Quevar Project Salta Province, Argentina
NI 43-101 Technical Report on Preliminary Economic Assessment
Page 20-5
October 2018 Project Number: 196410
As part of the Biannual Renewal of the Environmental Impact Report application in March 2018, Golden Minerals noted:
• Roads: The company would continue to use the access road easement, would continue construction of 6 km of internal Project service roads, and undertake road maintenance
• Plant: An easement over land identified for a future process plant site was still required; the company would provide all required additional data to relevant authorities if a decision was made to develop a mine
• Water: The company would continue to use the water pipeline easement. The water pipeline to the camp is still in use, and the company maintains the current pipeline, equipment and pumps.
• Camp: The 95-person El Quevar camp is still in use. Current infrastructure at the Project base camp would continue to be maintained
• Powerline: An easement was identified for a future powerline; the company would provide all required additional data to relevant authorities if a decision was made to develop a mine
• Waste collection: Common waste is currently collected on site. This is planned to continue, and waste facilities will be maintained.
Two water concessions were granted in August 2014 by resolution of the Secretariat of Water Resources:
• Water well: allows for one well, water usage of 10 m3/day, based on a maximum of two hours of pumping from the well
• Stream: allows for 50 m3/day of water to be extracted from the Quevar Sur Stream for mining purposes on the Quirincolo and Castor claims. The annual limit is set at 18,250 m3.
The fuel depot on site is licensed through February 2019. Two powder magazines are licensed through June 2021.
20.7.2 Future Permits
The following discussion outlines the key permits that would be required in support of any future mining operations.
An Environmental Impact Study (EIA) must be conducted. This study must address specific content requirements, including:
• General description of the environment (e.g. physical, biological, archaeological and paleontological)
El Quevar Project Salta Province, Argentina
NI 43-101 Technical Report on Preliminary Economic Assessment
Page 20-6
October 2018 Project Number: 196410
• Social baseline description
• Social consultations (including a social perception study, outreach program, communication program and bonding, social contingency plan)
• Project description (includes study of alternatives, acid rock drainage studies, process designs and supporting studies)
• Description of environmental impacts
• Environmental Management Plan
• Action plan that addresses environmental contingencies
• Emergency and health and safety plans
• Easement requirements (roads, infrastructure, water).
Once approved, an environmental impact statement (EIS) with operating condition stipulations would be granted. The EIA must be renewed two years after approval, and a report needs to be provided that outlines how the company has met the operating condition stipulations. The report must also identify any new considerations that have arisen as a result of operations. If for some reason, there are changes to the operation as envisaged in the original EIA, a new EIA must be submitted.
Infrastructure designs will also need to be approved by the Salta provincial reviewing body (Professional Association of Surveyors, Engineers and Allied Professions or COPAIPA).
The main sectorial permits required include:
• Fuel storage: must be authorized by the Energy Ministry, and permits are valid for a year
• Communications: must be authorized by the National Communications Authority (ENACOM), which operates under the Modernization Ministry of the Nation
• Explosives handling: must be registered and authorized by the National Agency of Controlled Materials (ANMaC)
• Waste management: must be registered under the National Register of Generators and Transporters of Hazardous Wastes from the Ministry of Environment and Sustainable Development, of the Ministry of Environment and Sustainable Development of the Province of Salta. If waste is transported between jurisdictions, it will also need to be registered in the National Registry of Generators and Operators of Hazardous Waste under the Hazardous Waste Management Direction of the Ministry of Environment and Sustainable Development of Argentina. Common wastes would need to be handled as indicated by Provincial Act No. 7.070. Where

El Quevar Project Salta Province, Argentina
NI 43-101 Technical Report on Preliminary Economic Assessment
Page 20-7
October 2018 Project Number: 196410
a landfill for final waste disposal is to be built, an Environmental and Social Impact Assessment will be required
• Chemicals and reagents management: must be authorized by the Ministry of Planning for the Prevention of Drug Addiction and Action against Drug Trafficking (SEDRONAR)
• Water usage: drilling permits issued by the Ministry of Water Resources of the Province of Salta are required. Groundwater usage requests must be made. The use of surface water resources requires concession permits issued by the Ministry of Water Resources of the Province of Salta.
Financial securities must be posted for activities that have a certain level of “environmental complexity” (defined as the degree of potential to produce environmental damage), which is calculated based on a polynomial formula.
Table 20-2 provides a summary of the key legislations and regulations that the Project will need to consider.
20.8 Considerations of Social and Community Impacts
Silex Argentina conducted detailed community relations discussions on behalf of the company in the period August 2010–February 2013. These community consultations built on activities undertaken by Silex Argentina from August 2006 to August 2009.
The first work phase consisted of identifying key areas of concern from stakeholders by way of focused interviews, informal conversations and observations, the photographic record, and general information gathering. Visits were made to the Community of Salar de Pocitos, the Community of San Antonio de los Cobres, and the Community of Olacapato, where informal discussions were held with representatives of the local primary schools, health clinics, and local community members.
Key community concerns raised included job opportunities, workforce training opportunities, upgrading of school facilities, and provision of school supplies.

El Quevar Project Salta Province, Argentina
NI 43-101 Technical Report on Preliminary Economic Assessment
Page 20-1
October 2018 Project Number: 196410
Table 20-2: Regulations Summary
Discipline/Area Regulation
General national regulations
National Constitution of the Argentine Republic, Article 41 National Law No. 1,919: National Mining Code. Decree 456/97 National Law No. 24,196: Mining investments National Law No. 24,585: Incorporates the Complementary Title into the National Mining Code: Environmental Protection for Mining Activity National Law No. 25.675: General Law of the Environment National Law No. 25,831: Regime of Free Access to Public Environmental Information National Law No. 19,587: Hygiene and Safety at Work National Law No. 24,557: Occupational Hazards
General provincial regulations
Provincial Constitution of Salta, Article 30 and Chapter VIII - Title II Provincial Law No. 7,070: Protection of the Environment. Decree 3,097/00 Decree 1,587/03 Provincial Law No 7,141: Law of Mining Procedures. Articles 34 and 91 Resolution Secretariat for the Environment and Sustainable Development 011/01 Technical Standard of An Environmental Nature for the Discharge of Residual and/or Industrial Liquid Effluents
General municipal regulations
The Municipal Ordinances set out the terms and conditions for installation of camps and infrastructure The Municipality of San Antonio de los Cobres inspects the premises, facilities, camps, workplaces, warehouses, offices and in general any property or premises where activities that are subject to municipal control are carried out, including industrial and service activities of any kind within the Territorial Jurisdiction of the Municipality; in order to preserve the environment and ensure appropriate safety, health and hygiene practices for communities The Municipality has an Environmental Protection Code and charges a Security, Hygiene and Ecology Inspection Fee
Protected areas Provincial Law No. 7,107 Law on Protected Areas Provincial Law No. 6,709 Creates the Vicuña protection zone (Vicugna vicugna) Provincial Decree No. 308/80 Creates the Los Andes Wildlife Reserve
Archaeology and paleontology
National Law No. 25,743: Protection of archaeological and paleontological heritage. Decree No. 1022/04 Provincial Law No. 6,649: Preservation of the Palaeontological, Archaeological, Artistic and Historical Collection
Biodiversity National Law No. 22,421: Protection and Conservation of Wild Fauna National Law No. 24,375: Adherence to the "Convention on Biological Diversity" Provincial Law No. 5.513: Wildlife Protection
Air quality National Law No. 20,284: Plan for the Prevention of Critical Air Pollution
Fuel and energy
National Law No. 24,065: Electric power regime. Applies to the generation, transport and distribution of electricity Secretary of Energy Resolution No. 404/93: General Provisions. Register of Independent Professionals and Security Audit Companies. Audits Sanctions Disabilities Validity Resolution of the Ministry of Energy No. 1.102/04: Creates the registry of gas stations for the sale of liquid fuels, own consumption, storage, distributors and marketers of fuels and hydrocarbons in bulk and compressed natural gas

El Quevar Project Salta Province, Argentina
NI 43-101 Technical Report on Preliminary Economic Assessment
Page 20-2
October 2018 Project Number: 196410
Discipline/Area Regulation Resolution Secretariat of Energy No. 785/05: Creates the national program for the control of losses of aerial storage tanks for hydrocarbons and their derivatives
Waste management National Law No. 24,051: Hazardous waste National Law No. 25,612: Comprehensive Management of Industrial Waste and Service Activities National Law No. 25.916: Management of Household Waste
Environmental impact reports
Provincial Decree of Salta No.1.342/97. Basic regulations and minimum budgets that complement Law No. 24,585 (Mining Code). Resolution Ministry of Mining of Salta No. 130/09. It establishes the mining zoning and requirements for the presentation of Environmental Impact Reports in its different stages Resolution Ministry of Mining of Salta No. 448/09. It approves the instructive of minimum budgets for the elaboration of Reports of Environmental Impact in its different stages. Ratified by Resolution 172/10 of the Ministry of Economic Development Resolution Secretariat of Mining of Salta No. 343/15. General and specific conditions for the submission of Environmental Impact Reports for different mining activities (general requirements, advanced exploration with drilling, salt extraction, extraction of aggregates, extraction in pearlite quarries, onyx, slabs, clay and limestones, and social aspects)
Explosives handling National Law No. 20,429/73: National Law on Weapons and Explosives. Decree 302/83 National Law No. 27,192/05: Creation of the National Agency for Controlled Materials (ANMaC) Provision ANMaC 099/04: Approves the Instructions for Registration - Re-registration of Explosives Users
Chemical products handling
National Law No. 23.737/89: Modification of the penal code. Tenure and trafficking of narcotics. Article 44 National Law No. 26,045/05: creates the National Registry of Chemical Precursors within the scope of the Secretariat of Programming for the Prevention of Drug Addiction and the Fight against Drug Trafficking (SEDRONAR) Decree No. 1,161/00. Modifies Decree No. 1,095/96. It updates the lists of precursors and chemical products that can be used in the illicit manufacture of narcotic drugs and psychotropic substances
Water resources
National Law No. 25,688. Environmental water management regime. Provincial Law No. 7,017. Water Code of the Province of Salta Decree No. 2,299/03. Regulation of Water Code Law No. 7017 Resolution of the Water Resources Agency No. 277/04. Protection of perforations Resolution of the Water Resources Agency No. 278/04. Regulation on drilling. Prior to the start of the work to collect groundwater, the interested party must submit a permit application

El Quevar Project Salta Province, Argentina
NI 43-101 Technical Report on Preliminary Economic Assessment
Page 20-1
October 2018 Project Number: 196410
Golden Minerals developed a Corporate Social Responsibility Plan that was based on meetings with community leaders from the towns of Salar de Pocitos and Olacapato. Golden Minerals included direct community action in the plan, which ranged from donations of goods and materials, support of development of physical education programs, repairs to community infrastructure, support of construction of new community infrastructure, support of community social events, and direct participation in events organized by the Municipality of San Antonio de los Cobres. The company also supported selected training workshops, health and vaccination programs for livestock, improvement programs for health clinics, and schools, and encouraged development of recycling programs for paper and plastics.
20.9 Comments on Section 20
A number of baseline studies were completed in support of the trial mining program in 2010–2011.
Exploration and trial mining were conducted under the required permits for those activities. Any future mining activity will require an EIA and EIS, and sectorial permit grants for aspects such as fuel storage, communications, explosives handling, waste management, chemicals and reagents management, and water usage.
Additional community consultations would be required as part of the EIS.
El Quevar Project Salta Province, Argentina
NI 43-101 Technical Report on Preliminary Economic Assessment
Page 21-1
October 2018 Project Number: 196410
21.0 CAPITAL AND OPERATING COSTS
21.1 Capital Cost Estimates
21.1.1 Mine Capital Costs
Table 21-1 summarizes the three capital categories, with 50% of the total mine capital required in Year -2. The capital for mobile equipment is 70% of the total capital, stationary equipment is 10% and the buildings and structures are 20%.
Most of the Year -2 activity relates to preparation of the physical work planned for Year -1. The following activity will be performed in Year -2:
• Procurement of the mobile and stationary mine equipment required to drive the main underground development and stope accesses.
Year -1 activities focus on the mine construction and procurement of the remaining capital equipment. Year -1 planned activities are:
• Procure the balance of stationary and mobile equipment required for sustained production
• Excavate approximately 1,300 m of main development and stope accesses
• Construct the mine office and dry (change room facility) near the mine portal
• Construct the mine substation at the termination of the overhead line extending from the natural gas generation facility located near the camp
• Purchase the required computers, software, survey equipment, office furnishings and light vehicles required by the mine staff and administration.
21.1.2 Process Capital Costs
The capital costs for the El Quevar process plant were estimated in Q2 2018 US$ using the following preliminary inputs:
• Process design criteria
• Process flow diagrams with mass balance
• Mechanical equipment list
• Electrical single line diagrams
• Site/plot plans and general arrangement drawings
• Preliminary load analysis

El Quevar Project Salta Province, Argentina
NI 43-101 Technical Report on Preliminary Economic Assessment
Page 21-2
October 2018 Project Number: 196410
Table 21-1: Pre-Production Mine Capital Summary
Description Value (US$ 000)
Mining equipment 15,077
Stationary equipment 1,798
Buildings and structures 2,114
Pre-production development 7,677
Critical spares and first fills 1,476
Total after direct costs 28,141
Contingency (mine) 2,848
Total all mine capital costs 30,989 Note: Totals may not sum due to rounding
• Mass earthwork quantities
• In-house historical data and database information.
Items not included in the process capital estimate are as follows:
• Sunk costs (costs prior to completion of positive feasibility study)
• Allowance for special incentives (schedule, safety, etc.)
• All Owner’s taxes including: financial transaction tax, withholding tax and value added tax
• Owner’s costs
• Reclamation costs (included in economic model)
• Escalation beyond 2Q 2018
• Foreign currency exchange rate fluctuations
• Working capital and sustaining capital
• Interest and financing cost
• Risk due to political upheaval, government policy changes, labor disputes, permitting delays or any other force majeure occurrences.
The estimate is built by area cost centers as defined by the Project work breakdown structure (WBS) and by prime commodity accounts, which include earthwork, concrete, structural steel, mechanical equipment (including platework), piping, electrical and instrumentation.
Not all WBS (area) numbers have been used in this estimate; costs for some areas are combined due to lack of definition at this level of study, but cost items will be more
El Quevar Project Salta Province, Argentina
NI 43-101 Technical Report on Preliminary Economic Assessment
Page 21-3
October 2018 Project Number: 196410
detailed in future estimates where the structure will facilitate metrics comparison with other projects as well as reconciliation with past and future estimates.
Capital costs assume that equipment and materials will be purchased on a competitive basis and installation contracts will be awarded in defined packages for lump sum contracts (when definition is adequate), or on a time and material or unit rate basis when design is not fully defined.
The hourly labor rates include the following:
• Basic wage
• Overtime pay
• Subsistence
• Site uplift
• Burdens and benefits
• Incidentals (recruitment, safety, small tools, consumables)
• Supervision through foreman level.
The wage rates reflect a six-day workweek of 60 hours. Labor rates do not cover contractor field indirect costs such as mobilization, demobilization, temporary facilities, temporary utilities, testing services and overhead and profit. These items are included with the construction indirect cost. Overall, the labor man-hours reflect 3.5 times decrease in productivity from US standards to account for longer workday/workweek, general workforce skill level, the extent of manual production, altitude and the remoteness of the site.
Average construction crew rates have been developed for each commodity type from the labor information by blending appropriate labor and skill levels to derive reasonable crew mixes.
The construction crew average composite wage rates used in the estimate are provided in Table 21-2.
A contingency of approximately 25% has been included in the capital cost in recognition of the degree of detail on which the estimate is based.
Table 21-3 summarizes the estimated costs for the process plant as defined by the areas Samuel Engineering was responsible for.
21.1.3 Infrastructure Capital Costs
Table 21-4 outlines the required pre-production capital expenditures for each of the infrastructure departments.

El Quevar Project Salta Province, Argentina
NI 43-101 Technical Report on Preliminary Economic Assessment
Page 21-4
October 2018 Project Number: 196410
Table 21-2: Construction Crew Average Composite Wage Rates
Composite Crew Labor Rates
Discipline Composite Wage Rate (US$/hr)
Earthwork 27.88
Concrete 34.38
Steel 36.14
Buildings 32.54
Mechanical 50.78
Piping 49.96
Electrical 54.55
Instrumentation 58.32 Note: The wage rates reflect a six-day workweek of 60 hours (10 hours/day)
Table 21-3: Process Plant Capital Costs
Description Value (US$ 000)
Crushing, handling of mineralized material 6,143
Grinding and classification 4,702
Flotation and concentration 6,601
Tailings (TSF and thickening) 3,167
Reagents storage, buildings 973
General and infrastructure 3,605
Critical spares and first fills 670
Freight 1,698
Construction costs 4,436
Total direct costs 31,994
EPCM cost 9,982
Total including contractor costs 41,976
Contingency (process plant) 11,329
Total process plant costs 53,306 Note: Totals may not sum due to rounding
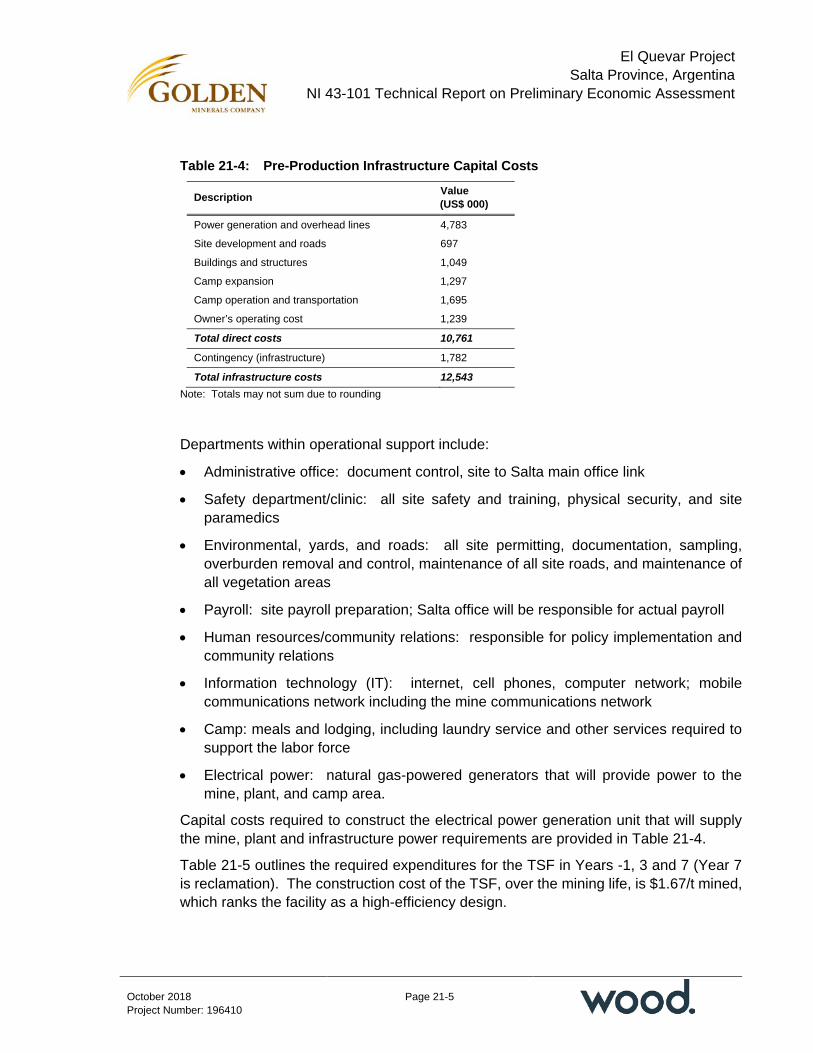
El Quevar Project Salta Province, Argentina
NI 43-101 Technical Report on Preliminary Economic Assessment
Page 21-5
October 2018 Project Number: 196410
Table 21-4: Pre-Production Infrastructure Capital Costs
Description Value (US$ 000)
Power generation and overhead lines 4,783
Site development and roads 697
Buildings and structures 1,049
Camp expansion 1,297
Camp operation and transportation 1,695
Owner’s operating cost 1,239
Total direct costs 10,761
Contingency (infrastructure) 1,782
Total infrastructure costs 12,543 Note: Totals may not sum due to rounding
Departments within operational support include:
• Administrative office: document control, site to Salta main office link
• Safety department/clinic: all site safety and training, physical security, and site paramedics
• Environmental, yards, and roads: all site permitting, documentation, sampling, overburden removal and control, maintenance of all site roads, and maintenance of all vegetation areas
• Payroll: site payroll preparation; Salta office will be responsible for actual payroll
• Human resources/community relations: responsible for policy implementation and community relations
• Information technology (IT): internet, cell phones, computer network; mobile communications network including the mine communications network
• Camp: meals and lodging, including laundry service and other services required to support the labor force
• Electrical power: natural gas-powered generators that will provide power to the mine, plant, and camp area.
Capital costs required to construct the electrical power generation unit that will supply the mine, plant and infrastructure power requirements are provided in Table 21-4.
Table 21-5 outlines the required expenditures for the TSF in Years -1, 3 and 7 (Year 7 is reclamation). The construction cost of the TSF, over the mining life, is $1.67/t mined, which ranks the facility as a high-efficiency design.
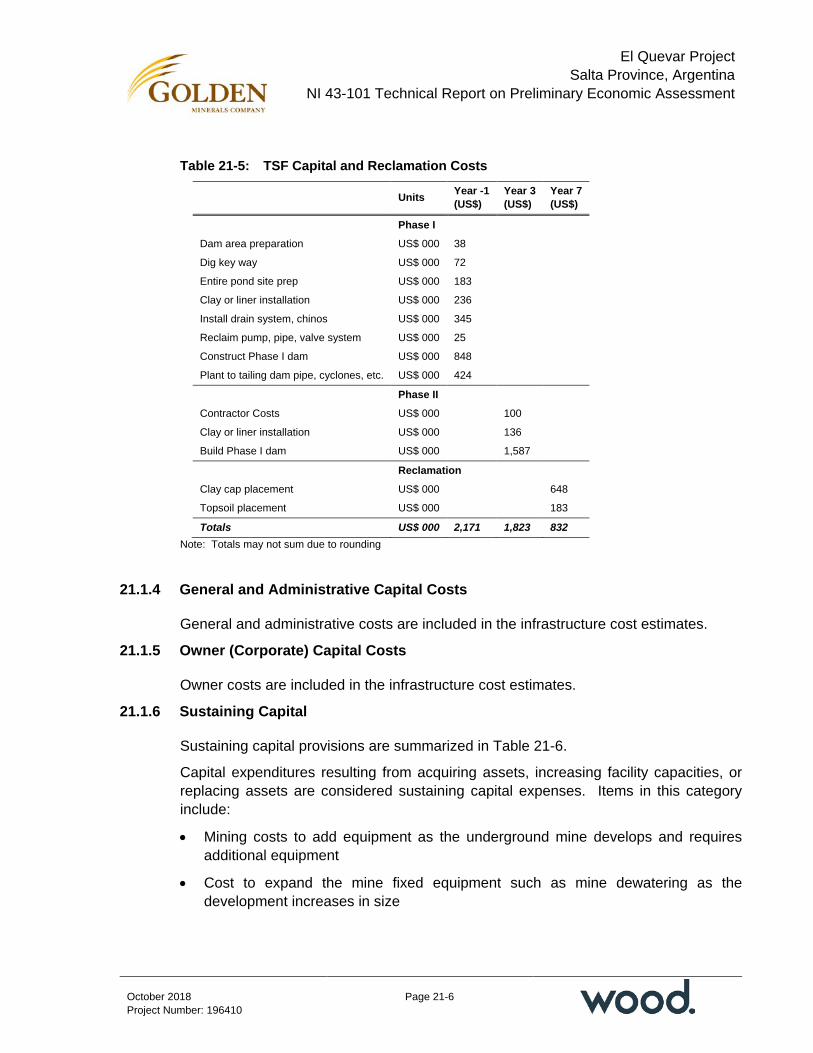
El Quevar Project Salta Province, Argentina
NI 43-101 Technical Report on Preliminary Economic Assessment
Page 21-6
October 2018 Project Number: 196410
Table 21-5: TSF Capital and Reclamation Costs
Units Year -1 (US$)
Year 3 (US$)
Year 7 (US$)
Phase I Dam area preparation US$ 000 38
Dig key way US$ 000 72
Entire pond site prep US$ 000 183
Clay or liner installation US$ 000 236
Install drain system, chinos US$ 000 345
Reclaim pump, pipe, valve system US$ 000 25
Construct Phase I dam US$ 000 848
Plant to tailing dam pipe, cyclones, etc. US$ 000 424
Phase II Contractor Costs US$ 000 100
Clay or liner installation US$ 000 136
Build Phase I dam US$ 000 1,587
Reclamation
Clay cap placement US$ 000 648
Topsoil placement US$ 000 183
Totals US$ 000 2,171 1,823 832 Note: Totals may not sum due to rounding
21.1.4 General and Administrative Capital Costs
General and administrative costs are included in the infrastructure cost estimates.
21.1.5 Owner (Corporate) Capital Costs
Owner costs are included in the infrastructure cost estimates.
21.1.6 Sustaining Capital
Sustaining capital provisions are summarized in Table 21-6.
Capital expenditures resulting from acquiring assets, increasing facility capacities, or replacing assets are considered sustaining capital expenses. Items in this category include:
• Mining costs to add equipment as the underground mine develops and requires additional equipment
• Cost to expand the mine fixed equipment such as mine dewatering as the development increases in size

El Quevar Project Salta Province, Argentina
NI 43-101 Technical Report on Preliminary Economic Assessment
Page 21-7
October 2018 Project Number: 196410
Table 21-6: Sustaining Capital Costs
Area Units LOM Year 1 Year 2 Year 3 Year 4 Year 5 Year 6 Year 7
Mining equipment US$ 000 2,600 — 1,300 — 1,300 — — —
Ancillary equipment US$ 000 5,043 481 2,305 — 2,257 — — —
Tailings storage facility US$ 000 1,823 — — 1,823 — — — —
Infrastructure US$ 000 108 108 — — — — — —
Mine reclamation and closure US$ 000 3,733 — — — — — — 3,733
Total US$ 000 13,307 588 3,605 1,823 3,557 — — 3,733 Note: Totals may not sum due to rounding
• Owner facilities, engineering and safety equipment
• Costs associated with the future development of the tailings storage facility
• Closure costs of the processing facilities, mine and tailings storage facility.
21.1.7 Capital Cost Summary
The total pre-production capital cost estimate is summarized in Table 21-7.
21.2 Operating Cost Estimates
21.2.1 Mine Operating Costs
Mining Costs
The mine operating cost contains five major components: labor, operating costs, supplies and materials, fuel and lubricants, and power. The following variables and cost drivers were used to develop the costs:
• Expatriate labor burden: 50%, in-country housing allowance, typical overseas insurance, and home country visit flight allowance
• In-country professional labor burden: 100% that covers all required typical company and country costs associated with employees, and regional housing allowance for relocation. Salta is not a mining center and skilled positions will be filled with personnel brought in from other provinces
• There will be two working shifts of 10 hours each per day. Three crews will be rotated using a 10-days working and five days off schedule. Past operating history shows that this is a reasonable schedule for working at this altitude and area of Argentina. The employees will be bussed from the main population centers and stay at the camp during their rotation
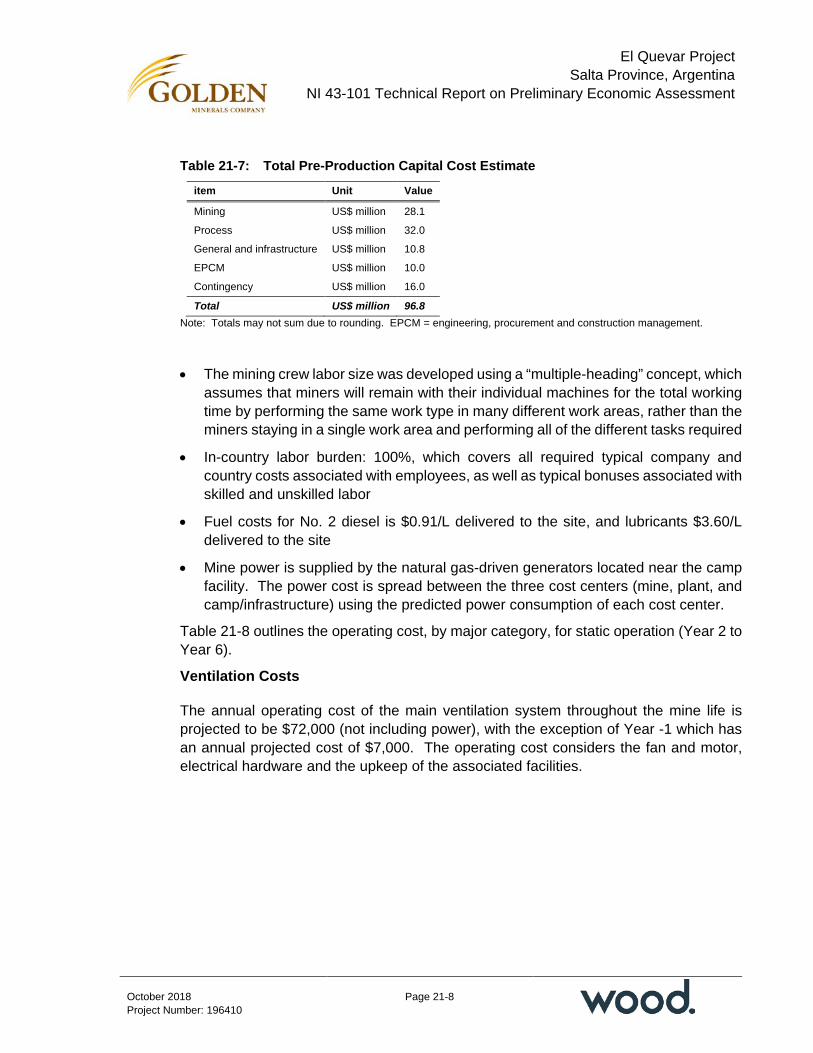
El Quevar Project Salta Province, Argentina
NI 43-101 Technical Report on Preliminary Economic Assessment
Page 21-8
October 2018 Project Number: 196410
Table 21-7: Total Pre-Production Capital Cost Estimate
item Unit Value
Mining US$ million 28.1
Process US$ million 32.0
General and infrastructure US$ million 10.8
EPCM US$ million 10.0
Contingency US$ million 16.0
Total US$ million 96.8 Note: Totals may not sum due to rounding. EPCM = engineering, procurement and construction management.
• The mining crew labor size was developed using a “multiple-heading” concept, which assumes that miners will remain with their individual machines for the total working time by performing the same work type in many different work areas, rather than the miners staying in a single work area and performing all of the different tasks required
• In-country labor burden: 100%, which covers all required typical company and country costs associated with employees, as well as typical bonuses associated with skilled and unskilled labor
• Fuel costs for No. 2 diesel is $0.91/L delivered to the site, and lubricants $3.60/L delivered to the site
• Mine power is supplied by the natural gas-driven generators located near the camp facility. The power cost is spread between the three cost centers (mine, plant, and camp/infrastructure) using the predicted power consumption of each cost center.
Table 21-8 outlines the operating cost, by major category, for static operation (Year 2 to Year 6).
Ventilation Costs
The annual operating cost of the main ventilation system throughout the mine life is projected to be $72,000 (not including power), with the exception of Year -1 which has an annual projected cost of $7,000. The operating cost considers the fan and motor, electrical hardware and the upkeep of the associated facilities.

El Quevar Project Salta Province, Argentina
NI 43-101 Technical Report on Preliminary Economic Assessment
Page 21-9
October 2018 Project Number: 196410
Table 21-8: Mine Operating Cost for Static Operation
Category By Component (US$/t)
Total (US$/t)
Percentage Total (%)
General and administrative (G&A) labor 5.47
Operating labor 5.99
Maintenance and electrical labor 2.38 13.84 33
G&A materials and supplies 0.49
Operating materials and supplies 9.85
Maintenance materials and supplies 0.26 10.61 26
Fuel and lubricants 7.06 7.06 17
Equipment operation 3.59
Electrical system 0.09
Water handling cost 0.06
Ventilation cost 0.17 3.91 9
Mine power cost 6.04 6.04 15
Totals 41.46 41.46 100
21.2.2 Process Operating Costs
The operating costs for the El Quevar process plant were estimated in Q2 2018 US$ by first principles for the following cost areas:
• Labor (salaried, operating, maintenance and laboratory)
• Consumables
• Wear materials
• Power
• Maintenance parts/supplies
• Operating supplies.
Table 21-9 summarizes the estimated costs for the process plant for production Year 1 and Years 2–6. Process production for Year 1 was determined at 346,500 t to account for lower production during the initial plant start-up period. Production for Years 2–6 was calculated at the full capacity of 1,200 t/d (420,000 t/a).
Basis of Estimates for Operating Costs for El Quevar Process Plant
Table 21-10 summarizes the basis of the operating cost estimates for the process plant.
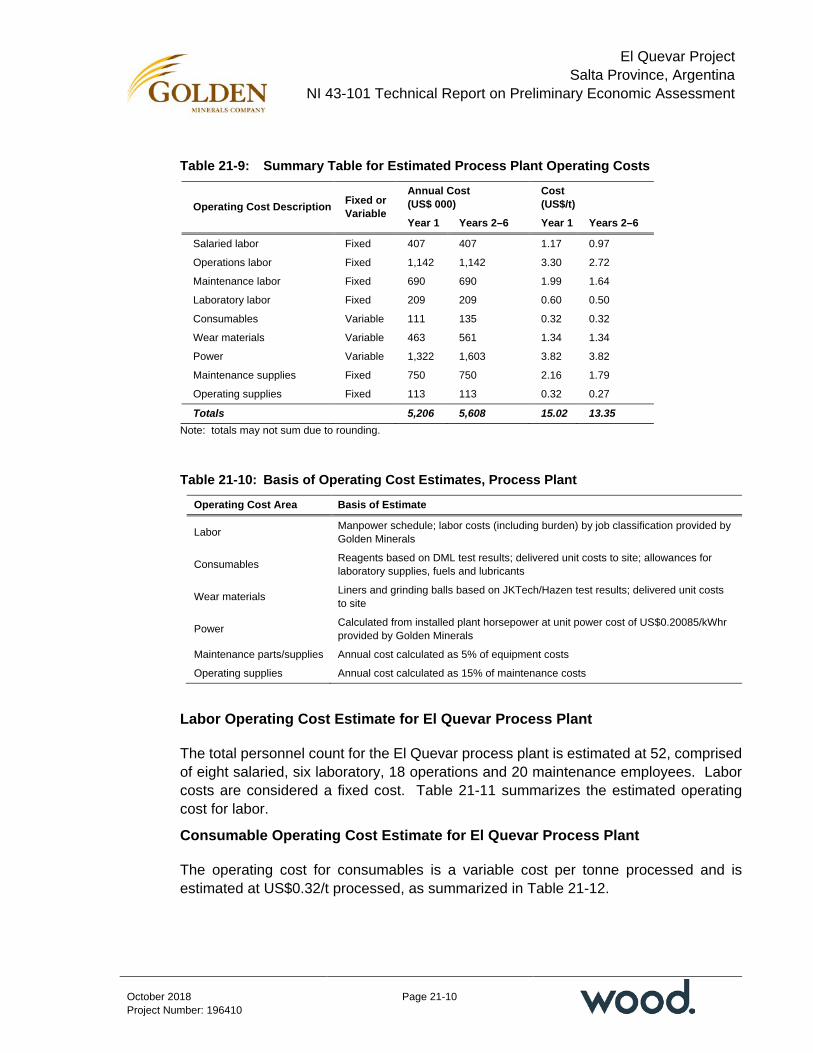
El Quevar Project Salta Province, Argentina
NI 43-101 Technical Report on Preliminary Economic Assessment
Page 21-10
October 2018 Project Number: 196410
Table 21-9: Summary Table for Estimated Process Plant Operating Costs
Operating Cost Description Fixed or Variable
Annual Cost (US$ 000)
Cost (US$/t)
Year 1 Years 2–6 Year 1 Years 2–6
Salaried labor Fixed 407 407 1.17 0.97
Operations labor Fixed 1,142 1,142 3.30 2.72
Maintenance labor Fixed 690 690 1.99 1.64
Laboratory labor Fixed 209 209 0.60 0.50
Consumables Variable 111 135 0.32 0.32
Wear materials Variable 463 561 1.34 1.34
Power Variable 1,322 1,603 3.82 3.82
Maintenance supplies Fixed 750 750 2.16 1.79
Operating supplies Fixed 113 113 0.32 0.27
Totals 5,206 5,608 15.02 13.35 Note: totals may not sum due to rounding.
Table 21-10: Basis of Operating Cost Estimates, Process Plant
Operating Cost Area Basis of Estimate
Labor Manpower schedule; labor costs (including burden) by job classification provided by Golden Minerals
Consumables Reagents based on DML test results; delivered unit costs to site; allowances for laboratory supplies, fuels and lubricants
Wear materials Liners and grinding balls based on JKTech/Hazen test results; delivered unit costs to site
Power Calculated from installed plant horsepower at unit power cost of US$0.20085/kWhr provided by Golden Minerals
Maintenance parts/supplies Annual cost calculated as 5% of equipment costs
Operating supplies Annual cost calculated as 15% of maintenance costs
Labor Operating Cost Estimate for El Quevar Process Plant
The total personnel count for the El Quevar process plant is estimated at 52, comprised of eight salaried, six laboratory, 18 operations and 20 maintenance employees. Labor costs are considered a fixed cost. Table 21-11 summarizes the estimated operating cost for labor.
Consumable Operating Cost Estimate for El Quevar Process Plant
The operating cost for consumables is a variable cost per tonne processed and is estimated at US$0.32/t processed, as summarized in Table 21-12.

El Quevar Project Salta Province, Argentina
NI 43-101 Technical Report on Preliminary Economic Assessment
Page 21-11
October 2018 Project Number: 196410
Table 21-11: Labor Cost Estimate, Process
Labor Description Salary (Incl Burdens/Person) (US$)
Number Total Annual Cost (US$ 000)
Salaried labor
Operations superintendent (expat) 150,000 1 150
Operations foremen 37,595 4 150
Maintenance foremen 37,595 2 75
Secretary/clerk 31,025 1 31
per tonne (Yrs 2–6)
Total salaried labor 0.97 8 407
Laboratory labor
Chemist 35,770 1 36
Samplers 34,675 3 104
Assayers 34,675 2 69
per tonne (Yrs 2–6)
Total laboratory labor 0.50 6 209
Hourly operations labor
Plant operating labor
Crusher operator 34,675 3 104
Crusher helper 29,930 3 90
Grinding operator 34,675 4 139
Flotation operator 34,675 4 139
Concentrate filter/loadout operator 34,675 4 139
Operations helpers 29,930 6 180
Reagents 34,675 1 35
Tailings/water operator 34,675 4 139
Plant laborers 25,550 7 179
per tonne (Years 2–6)
Total operating labor 2.72 18 1,142
Maintenance labor
Mechanics 36,135 8 289
Welders 36,135 2 72
Electrician/instrumentation 36,135 4 145
Maintenance helpers 30,295 5 151
Maintenance planner/clerk 32,600 1 33
per tonne (Years 2–6)
Total maintenance labor costs 1.64 20 670
Total labor costs 5.83 52 2,447 Note: totals may not sum due to rounding.
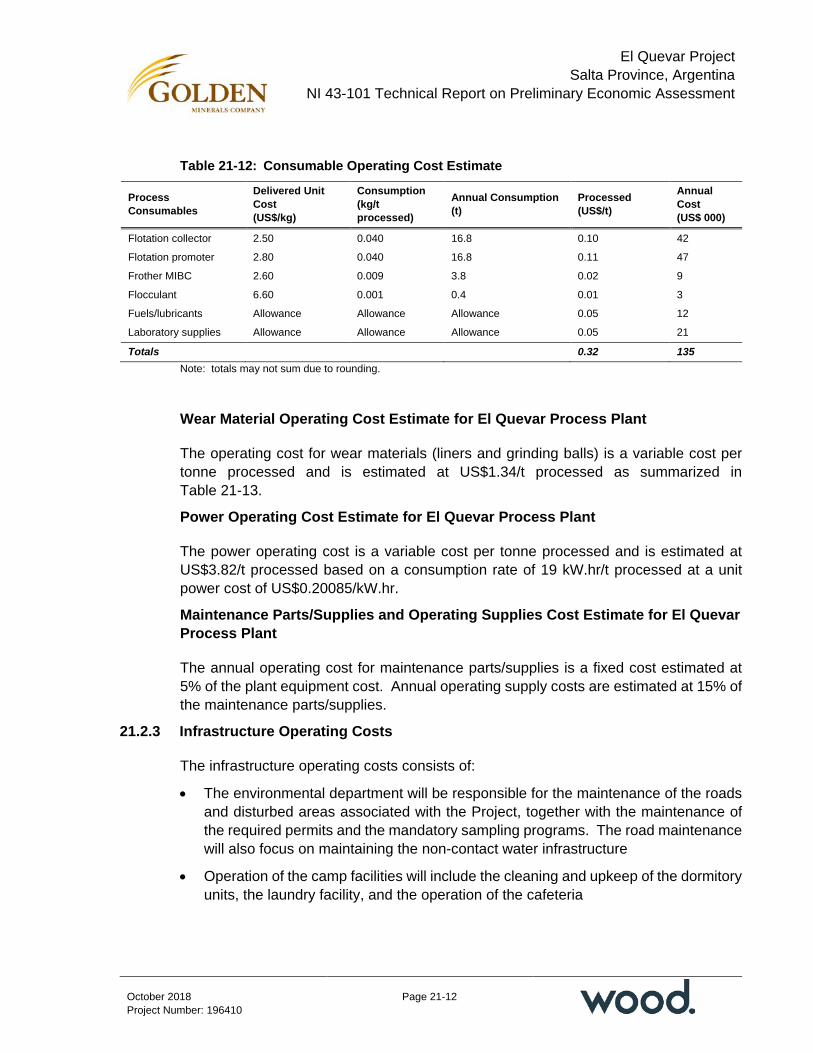
El Quevar Project Salta Province, Argentina
NI 43-101 Technical Report on Preliminary Economic Assessment
Page 21-12
October 2018 Project Number: 196410
Table 21-12: Consumable Operating Cost Estimate
Process Consumables
Delivered Unit Cost (US$/kg)
Consumption (kg/t processed)
Annual Consumption (t)
Processed (US$/t)
Annual Cost (US$ 000)
Flotation collector 2.50 0.040 16.8 0.10 42
Flotation promoter 2.80 0.040 16.8 0.11 47
Frother MIBC 2.60 0.009 3.8 0.02 9
Flocculant 6.60 0.001 0.4 0.01 3
Fuels/lubricants Allowance Allowance Allowance 0.05 12
Laboratory supplies Allowance Allowance Allowance 0.05 21
Totals 0.32 135 Note: totals may not sum due to rounding.
Wear Material Operating Cost Estimate for El Quevar Process Plant
The operating cost for wear materials (liners and grinding balls) is a variable cost per tonne processed and is estimated at US$1.34/t processed as summarized in Table 21-13.
Power Operating Cost Estimate for El Quevar Process Plant
The power operating cost is a variable cost per tonne processed and is estimated at US$3.82/t processed based on a consumption rate of 19 kW.hr/t processed at a unit power cost of US$0.20085/kW.hr.
Maintenance Parts/Supplies and Operating Supplies Cost Estimate for El Quevar Process Plant
The annual operating cost for maintenance parts/supplies is a fixed cost estimated at 5% of the plant equipment cost. Annual operating supply costs are estimated at 15% of the maintenance parts/supplies.
21.2.3 Infrastructure Operating Costs
The infrastructure operating costs consists of:
• The environmental department will be responsible for the maintenance of the roads and disturbed areas associated with the Project, together with the maintenance of the required permits and the mandatory sampling programs. The road maintenance will also focus on maintaining the non-contact water infrastructure
• Operation of the camp facilities will include the cleaning and upkeep of the dormitory units, the laundry facility, and the operation of the cafeteria

El Quevar Project Salta Province, Argentina
NI 43-101 Technical Report on Preliminary Economic Assessment
Page 21-13
October 2018 Project Number: 196410
Table 21-13: Wear Material Operating Cost Estimate
Wear Materials Consumption Annual
Consumption (t)
Delivered Unit Cost (US$)
Costs
Usage Units Annual (US$ 000)
Processed (US$/t)
Crushers
Liners 0.038 kg/t 16 4,500 72 0.17
Ball Mill
Balls 1.461 kg/t 614 700 430 1.02
Liners 0.109 kg/t 46 1,300 60 0.14
Totals 561 1.34 Note: totals may not sum due to rounding.
• The camp facilities power requirement is estimated at 5,400 kW per day. The power facility will be located near the camp, to take advantage of the generators operating at the lowest elevation available. The cost of power is divided between the mine, plant, and camp facilities based on the projected demands of each area.
The annual operating costs for the infrastructure departments are listed in Table 21-14.
21.2.4 General and Administrative Operating Cost
The general and administrative (G&A) area operating costs consist of the following departments:
• The administrative office will be the site link with the Salta corporate office. The link will provide consistency of operating policies, accounting principles, software selection, and synergies with common departments, such as purchasing
• The safety department and clinic will provide all site safety, including during the development and construction period. The clinic will provide day to day services and emergency services that are normally associated with accidents at industrial operations. The clinic will be staffed 24/7 with paramedics, and the office will have the necessary equipment required to stabilize an accident victim for transport to the nearest hospital
• The purchasing and warehousing unit will control the inventories of supplies and materials required for the successful operation of the facility. The department will supervise the personnel associated with the site warehouses
• The payroll department will be responsible for the preparation of the site payroll. The payroll system will use “Direct Deposit” which eliminates cash handling at the site

El Quevar Project Salta Province, Argentina
NI 43-101 Technical Report on Preliminary Economic Assessment
Page 21-14
October 2018 Project Number: 196410
Table 21-14: Infrastructure Operating Costs
Category Units Year 1 Years 2–6
Environmental, yards and roads US$ 000 315 315
Camp US$ 000 1,148 989
Power - infrastructure proportion US$ 000 316 380
Totals US$ 000 1,779 1,683 Note: totals may not sum due to rounding
• The human resources (HR) department will provide services including the hiring of required employees, the discipline of employees and the implementation of all Golden Minerals corporate policies. The HR department will also develop and maintain community relations
• The IT department will control the site internet system, communications, camp entertainment system and the radio-based communication system for the mine and the plant. The department will also control the required computers and their software, copiers and printers.
The annual G&A operating costs are listed in Table 21-15.
21.2.5 Owner (Corporate) Operating Costs
Owner operating costs are included in the infrastructure and G&A operating costs.
21.2.6 Operating Cost Summary
Operating costs for the PEA are summarized in Table 21-16.
21.3 Comments on Section 21
Pre-production capital costs for the PEA scenario presented in this Report total US$96.8 million.
Operating costs total US$5.77/oz silver recovered.
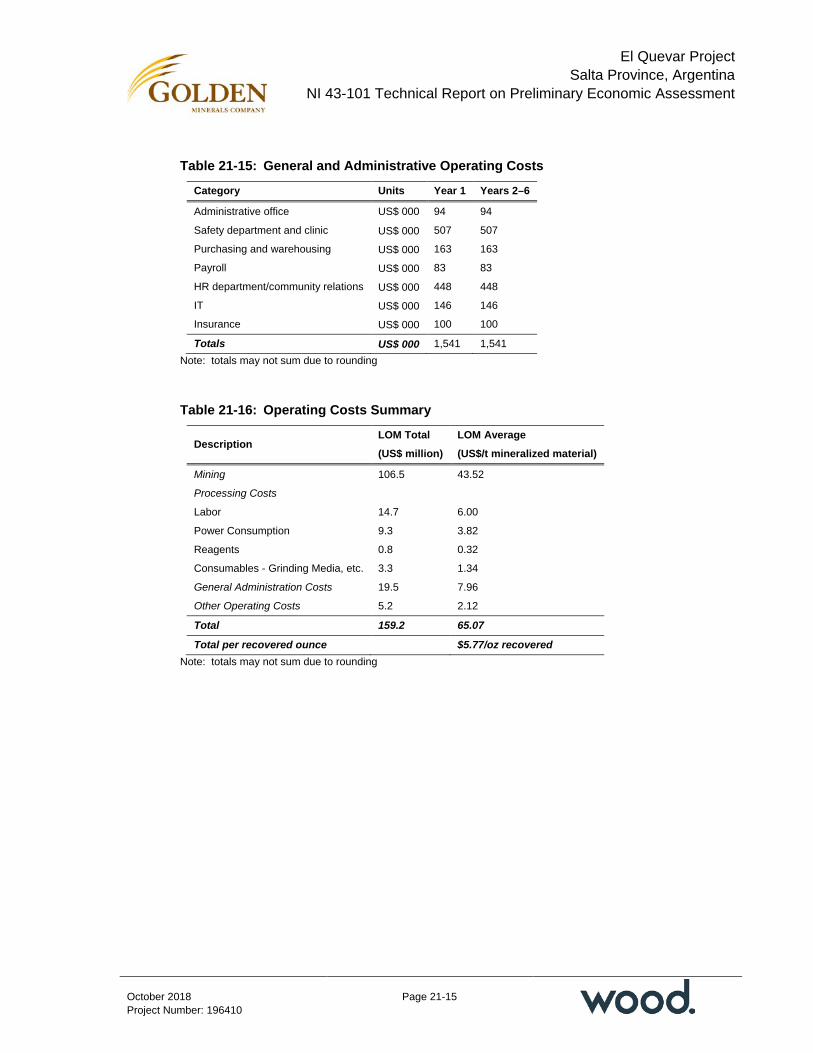
El Quevar Project Salta Province, Argentina
NI 43-101 Technical Report on Preliminary Economic Assessment
Page 21-15
October 2018 Project Number: 196410
Table 21-15: General and Administrative Operating Costs
Category Units Year 1 Years 2–6
Administrative office US$ 000 94 94
Safety department and clinic US$ 000 507 507
Purchasing and warehousing US$ 000 163 163
Payroll US$ 000 83 83
HR department/community relations US$ 000 448 448
IT US$ 000 146 146
Insurance US$ 000 100 100
Totals US$ 000 1,541 1,541 Note: totals may not sum due to rounding
Table 21-16: Operating Costs Summary
Description LOM Total LOM Average (US$ million) (US$/t mineralized material)
Mining 106.5 43.52
Processing Costs
Labor 14.7 6.00
Power Consumption 9.3 3.82
Reagents 0.8 0.32
Consumables - Grinding Media, etc. 3.3 1.34
General Administration Costs 19.5 7.96
Other Operating Costs 5.2 2.12
Total 159.2 65.07
Total per recovered ounce $5.77/oz recovered Note: totals may not sum due to rounding
El Quevar Project Salta Province, Argentina
NI 43-101 Technical Report on Preliminary Economic Assessment
Page 22-1
October 2018 Project Number: 196410
22.0 ECONOMIC ANALYSIS
22.1 Cautionary Statement
Certain information and statements contained in this section and in the Report are “forward looking” in nature. Forward-looking statements include, but are not limited to, statements with respect to the economic and study parameters of the Project; Mineral Resource estimates; the cost and timing of any development of the Project; the proposed mine plan and mining methods; dilution and extraction recoveries; processing method and rates and production rates; projected metallurgical recovery rates; infrastructure requirements; capital, operating and sustaining cost estimates; the projected life of mine and other expected attributes of the Project; the net present value (NPV) and internal rate of return (IRR) and payback period of capital; capital; future metal prices; the timing of the environmental assessment process; changes to the Project configuration that may be requested as a result of stakeholder or government input to the environmental assessment process; government regulations and permitting timelines; estimates of reclamation obligations; requirements for additional capital; environmental risks; and general business and economic conditions.
All forward-looking statements in this Report are necessarily based on opinions and estimates made as of the date such statements are made and are subject to important risk factors and uncertainties, many of which cannot be controlled or predicted. Material assumptions regarding forward-looking statements are discussed in this Report, where applicable. In addition to, and subject to, such specific assumptions discussed in more detail elsewhere in this Report, the forward-looking statements in this Report are subject to the following assumptions:
• There being no signification disruptions affecting the development and operation of the Project
• The availability of certain consumables and services and the prices for power and other key supplies being approximately consistent with assumptions in the Report
• Labor and materials costs being approximately consistent with assumptions in the Report
• Permitting and arrangements with stakeholders being consistent with current expectations as outlined in the Report
• All environmental approvals, required permits, licenses and authorizations will be obtained from the relevant governments and other relevant stakeholders
• Certain tax rates, including the allocation of certain tax attributes, being applicable to the Project

El Quevar Project Salta Province, Argentina
NI 43-101 Technical Report on Preliminary Economic Assessment
Page 22-2
October 2018 Project Number: 196410
• The availability of financing for Golden Mineral’s planned development activities
• The timelines for exploration and development activities on the Project
• Assumptions made in Mineral Resource estimate and the financial analysis based on that estimate, including, but not limited to, geological interpretation, grades, commodity price assumptions, extraction and mining recovery rates, hydrological and hydrogeological assumptions, capital and operating cost estimates, and general marketing, political, business and economic conditions.
The production schedules and financial analysis annualized cash flow table are presented with conceptual years shown. Years shown in these tables are for illustrative purposes only. If additional mining, technical, and engineering studies are conducted, these may alter the Project assumptions as discussed in this Report and may result in changes to the calendar timelines presented.
The economic analysis is partly based on Inferred Mineral Resources that are considered too speculative geologically to have the economic considerations applied to them that would enable them to be categorized as Mineral Reserves, and there is no certainty that the PEA based on these Mineral Resources will be realized.
22.2 Methodology Used
Samuel Engineering has prepared a discounted cash flow analysis of the El Quevar Project. Technical and cost inputs for the economic model were developed by Samuel Engineering with specific inputs provided by Golden Minerals. These inputs have been reviewed in detail by Samuel Engineering and are accepted as reasonable.
The discounted cash flow analysis was performed on a stand-alone project basis with annual cash flows discounted on an end-of-year basis. The economic evaluation used a real discount rate of 5% and was performed at commencement of construction (denoted as Year -2 of the El Quevar Project) using Q2 2018, US dollars.
All costs prior to the start of construction are considered as “sunk costs” and not considered in the economic analysis.
This economic analysis is a direct result of the capital cost estimate and is therefore considered to have the same level of accuracy (±25%).
22.3 Financial Model Parameters
Technical-economic parameters used in the model are summarized in the following sections. Table 22-1 presents the model inputs used in the economic analysis based on 2Q 2018 US dollars.

El Quevar Project Salta Province, Argentina
NI 43-101 Technical Report on Preliminary Economic Assessment
Page 22-3
October 2018 Project Number: 196410
Table 22-1: Model Input
Area Description Units Values
Construction period Years 2
Mine life (after preproduction) Years 6
Avg. annual process production rate silver 000 oz 4,837
Metal pricing Silver price US$/oz 16.66
Cost criteria
Estimate basis US$ second quarter 2018
Inflation/currency fluctuation None
Leverage % equity 100
Income tax Argentina corporate % profit 25
Salta mining % mine mouth 3
Royalties / payments Castor royalty % 0.5
Cannon payment US$/a 100,000
Transportation, smelting, and refining charges
Shipping, handling and fees US$/wmt concentrate 255
Insurance % concentrate value 0.2
Concentrate treatment charge US$/dmt concentrate 110
Metal refining charge US$/oz payable silver 1.10
Arsenic, antimony and bismuth penalty
US$/dmt concentrate 237
22.3.1 Mineral Resource, Mineral Reserve, and Mine Life
The Mineral Resource estimate is provided in Section 14 of the Report. A subset of these Mineral Resources is used in the PEA mine plan (refer to Section 22.4).
Mineral Resource Engineering provided a 1,200 t/d mine production schedule on an annualized basis, assuming a post-pillar cut-and-fill mining method.
The process schedule was prepared on an annualized basis by Samuel Engineering. It includes the mine production with silver grade from the mine production plan and adds plant processing data. The product for sales is reported as the concentrate production tonnage with concentrate silver grade. The table uses recoveries from the metallurgical testwork from Section 13, and payables from expected payment terms outlined in Section 19.1.
El Quevar Project Salta Province, Argentina
NI 43-101 Technical Report on Preliminary Economic Assessment
Page 22-4
October 2018 Project Number: 196410
22.3.2 Smelting and Refining Terms
The smelting and refining terms assumed in the financial analysis are included in Table 22-1.
22.3.3 Metal Price
Metal pricing is as outlined in Section 19.2.
22.3.4 Capital Costs
The capital cost estimate basis is provided in Section 21.1. A summary of the sustaining costs was provided in Table 21-6. A summary of pre-production capital costs was provided in Table 21-7.
22.3.5 Operating Costs
The operating cost estimate basis is provided in Section 21.2. A summary of the costs is provided in Table 21-16.
22.3.6 Working Capital
Working capital is the amount of funds required during the initial operating period to offset expenses prior to the cumulative revenue offsetting the cumulative expenses; that is, when the operation becomes self-sustaining in its cash flow. Working capital is recovered at the end of a project’s operating life.
The working capital is estimated for use in the economic model as three months of operating expenses.
22.3.7 Taxes and Royalties
Information on Argentinean taxes and royalties payable is summarized from Espeche (2018).
Federal Taxes
Income Tax
Argentinean-incorporated entities such as Silex Argentina are subject to income tax on their worldwide income. Non-resident companies are subject to income taxation on their Argentinean source income.
Argentinean entities can deduct business expenses needed to generate, maintain and preserve taxable income. Few exceptions on deductions exist. Depreciation is generally computed on a straight-line basis over an asset’s useful life.

El Quevar Project Salta Province, Argentina
NI 43-101 Technical Report on Preliminary Economic Assessment
Page 22-5
October 2018 Project Number: 196410
Net Operating Losses
The period for income tax loss carry forward (net operating losses or NOLs) is five years before expiration, and no extensions of time can be granted.
Corporate Tax Rate
Recent tax reform has dropped the corporate tax rate to 25% beginning in 2020. A 30% corporate tax rate applies in 2018 and 2019.
Withholding Tax
A withholding tax on dividends paid has been introduced: the rate is 7% on dividend distributions from income in 2018 and 2019, increasing to 13% in 2020. Dividend withholding tax does not apply for the purposes of this PEA; the PEA only considers taxes at the Project level.
Depreciation
Depreciation deductions under Mining Investment Law that may be applicable include:
Depreciation deductions under Mining Investment Law that may be applicable include:
• Exploration costs and amounts invested in special studies, mineralogical, metalogical, pilot plants, research tests and other works to determine technical and economic feasibility can currently be 100% deducted, and additionally depreciated over five years from the start of production (in effect, a double deduction for these costs)
• Infrastructure capital expenditures (including fixed plant) may be depreciated over three years: 60% in year one and 20% in each of the next two years
• All other equipment, machinery, vehicles and installations may be depreciated using three-year straight line
• Alternatively, assets can be depreciated following normal accounting rules which allow for depreciation over the useful life of the asset (assumed seven years for most mining, machinery, and other equipment, five years for light vehicles and computer equipment, and 20 years for buildings and other permanent infrastructure). Units of production (UOP) depreciation based on the life of the mine can also be selected for any or all assets
• Companies can choose different depreciation methods for different asset categories to minimize any net operating losses that might be foregone due to the relatively quick expiration of NOLs (five years).
El Quevar Project Salta Province, Argentina
NI 43-101 Technical Report on Preliminary Economic Assessment
Page 22-6
October 2018 Project Number: 196410
Value-Added Tax
Value-added tax (VAT) is levied on sales of products, services and rentals, and on import of goods and services. VAT does not apply to labor costs. The general VAT rate is 21%. Certain specific items are subject to a 27% or 10.5% rate. Other considerations could include:
• Companies qualifying under the Mining Investment Law are entitled to a refund of VAT after 12 months for VAT paid on exploration activities
• The export of concentrates from Argentina is exempt from VAT
• The Company is also entitled to a refund of all VAT paid, once production begins, up to an amount of VAT based on the VAT tax rate (21%) applied to the value of export sales on a cumulative basis. Thus, VAT becomes a working capital item for purposes of the PEA that is recovered over time after production begins
• Tax reform provides for an expedient VAT recovery mechanism for VAT credit balances on certain infrastructure and investments in capital goods, to the extent that companies have not been able to recover the VAT within six months.
Social Security
A corporate employer must deposit social security taxes. Both the employer (contributions) and the employee (withholding by employer) must make social security and health care scheme payments. As from March 2018, the employer must pay between 23.5% and 26.7% of the employee’s salary.
In 2022 the rate will be set at 25.5% for all employers. In Salta, approximately 10% of the employer’s social security payment is creditable against VAT. The creditable amount will decrease until 2022, when the credit system will be eliminated. This tax should be included in the cost of labor for the PEA.
Since February 2018, a non-taxable amount of AR$2,400 per employee is established for purposes of the employer contribution to the Social Security System referred to above. Therefore, AR$2,400 from each employee´s compensation is non-taxable.
In addition to the increase in employer contributions to 25.5% as of January 2022, the non-taxable amount will increase each year and will reach AR$12,000 per employee as of January 2022. The referred amount will be updated by the inflation rate (Consumer Price Index). Import/Export Taxes
Argentina eliminated export duties for the mining industry in 2016 for companies such as Silex Argentina that qualify under the Mining Investment Law. Export duties were re-

El Quevar Project Salta Province, Argentina
NI 43-101 Technical Report on Preliminary Economic Assessment
Page 22-7
October 2018 Project Number: 196410
imposed in September, 2018, on a temporary basis, are due to expire at the end of 2020, and do not now affect the El Quevar Project as foreseen in this PEA.
Shareholder Tax – Wealth Tax
An annual net wealth tax applies at a rate of 0.25% of net equity. A company has the right to request reimbursement from shareholders.
Tax on Credits and Debits
A tax on financial transactions is levied on debits and credits to current accounts, at a rate of 0.6% per transaction on bank accounts.
Transactions made in banks without using a bank account and any disposal of one’s own funds or the funds of a third party are subject to a tax rate of 1.2%. According to the recent Decree 409/2018, 33% of the total tax is creditable against Income Tax. The Federal Government is expected to increase this to 100% by 2022.
Fuel Tax
Liquid fuel tax (LFT) and carbon dioxide tax (CDT) are levied by a fixed amount per fuel liter. Fixed amounts are updated by inflation using the Consumer Price Index as a base. Mining companies can credit 45% of the LFT on Gasoil purchases used on machinery owed by the mining company toward income tax payments.
Tax on Minimum Presumed Income
This tax will be revoked as of 2019. The tax currently does not apply to Silex Argentina.
Salta Province Taxes
Actividades Economicas Tax
Salta Provincial levies a Turnover Tax; however, mining companies are exempted from this tax.
Salta Mining Royalty
The tax is assessed as 3% of the value of the minerals at the mine mouth, which is computed by taking the gross value from the sale of minerals and deducting all treatment and refining costs, including freight, insurance and other marketing costs, milling and other processing costs, and an allocation of other site G&A and infrastructure costs related to milling and processing.

El Quevar Project Salta Province, Argentina
NI 43-101 Technical Report on Preliminary Economic Assessment
Page 22-8
October 2018 Project Number: 196410
Canon Payment
The Mining Code requires payment of an annual fee per granted mining area. To maintain all El Quevar concessions, Silex Argentina paid a canon amount of approximately $0.1 million per year in 2016 and 2017.
Stamp Duty
Mining activity is exempt from payment of stamp duties.
Tasas Retributivas (Capital Contributions Tax)
Salta Province charges a 0.3% tax on the amount of increase to the capital account.
Cooperadoras Asistenciales Tax
This tax would not apply to the PEA.
Salta Mining Promotions Law
Provincial Law 6.026 outlines a tax benefit for mining activities. Tax exemptions for future and current provincial taxes for a 15-year period may be available to a mining company upon request.
Municipal Taxes
Municipal taxes could be applied on a range of taxable bases in various jurisdictions as compensation for services provided by the municipality. These taxes do not apply to the PEA.
NSR Royalty
There are no specific Argentina royalties that apply. Silex Argentina is required to pay a 1% net smelter return royalty on:
• 50% of the minerals extracted from the Castor concession (this covers the majority of the Yaxtché zone, and the area of the Mineral Resource estimate)
• 100% of the minerals extracted from the El Quevar II concession.
Silex Argentina can purchase one half of these royalties for $1 million within the first two years of production.
22.3.8 Closure Costs
Closure costs were estimated by Mineral Resource Engineering at about US$3.7 million.
El Quevar Project Salta Province, Argentina
NI 43-101 Technical Report on Preliminary Economic Assessment
Page 22-9
October 2018 Project Number: 196410
22.3.9 Salvage Value
A salvage value was assigned of US$5.1 million, approximately.
22.3.10 Financing
The financial model presents an unlevered case where no financing is assumed.
22.3.11 Inflation
Inflation is not included in the financial model or the capital and operating cost estimates.
22.4 Economic Analysis
22.4.1 PEA Results
The El Quevar Project’s after-tax economic results for the PEA evaluation are summarized in Table 22-2 and show an after-tax net present value (NPV) of $45 million at a 5% discount rate, an internal rate of return (IRR) of 16.9% and a 3.4-year payback after project start-up on initial capital expenditures of $97 million.
Table 22-3 presents the Project cash flow on an annualized basis. Table 22-4 summarizes key unit assumptions in the plan.
22.4.2 Cash Costs
The financial results include:
• Post start-up cash cost: $9.10/oz payable Ag
• Post start-up all-in sustaining costs (AISC): $9.45/oz payable Ag.
The cash cost per payable silver ounce is a non-generally-accepted accounting practice (GAAP) financial measure calculated by Golden Minerals and may not be comparable to similar measures reported by other companies. Cash cost includes all direct and indirect costs associated with the physical activities that would generate concentrate products for sale to customers, including mining to gain access to mineralized materials, mining of mineralized materials and waste, milling, third-party related treatment, refining and transportation costs, on-site administrative costs and royalties. Cash cost does not include depreciation, depletion, amortization, exploration expenditures, reclamation and remediation costs, financing costs, income taxes, or corporate general and administrative costs not directly or indirectly related to El Quevar. Cash cost is divided by the number of payable silver ounces generated by the plant for the period to arrive at the cash costs per payable ounce of silver.
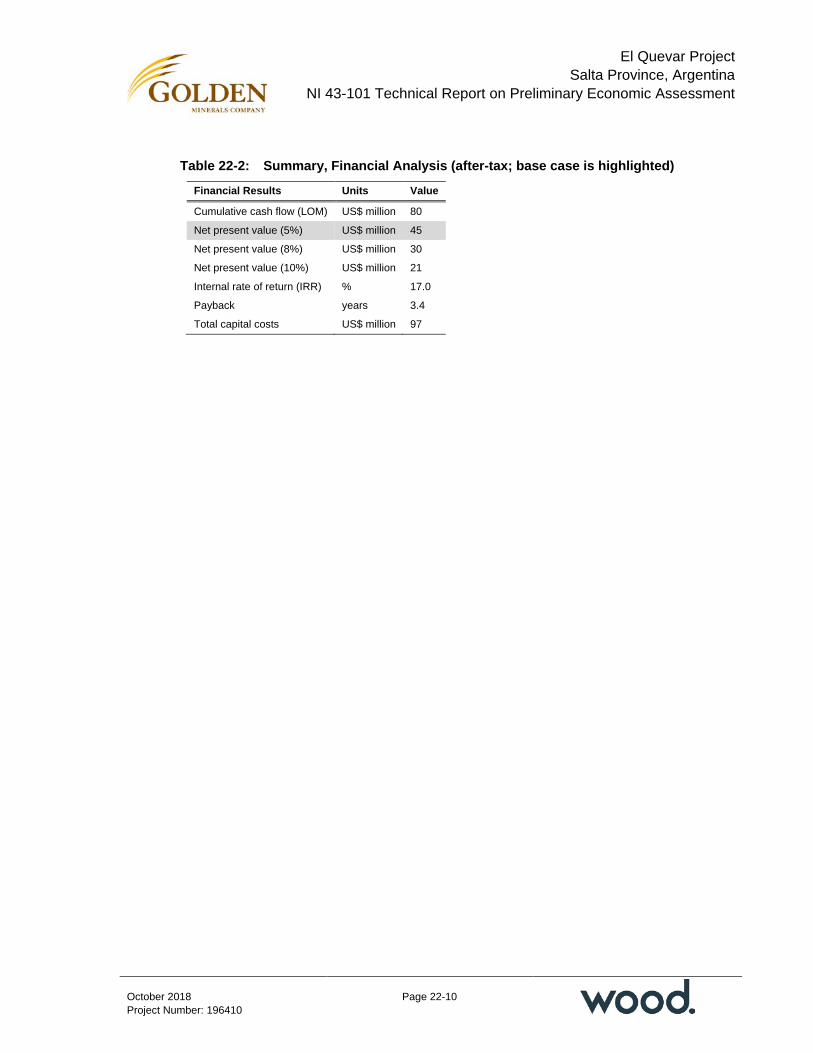
El Quevar Project Salta Province, Argentina
NI 43-101 Technical Report on Preliminary Economic Assessment
Page 22-10
October 2018 Project Number: 196410
Table 22-2: Summary, Financial Analysis (after-tax; base case is highlighted)
Financial Results Units Value
Cumulative cash flow (LOM) US$ million 80
Net present value (5%) US$ million 45
Net present value (8%) US$ million 30
Net present value (10%) US$ million 21
Internal rate of return (IRR) % 17.0
Payback years 3.4
Total capital costs US$ million 97

El Quevar Project Salta Province, Argentina
NI 43-101 Technical Report on Preliminary Economic Assessment
Page 22-1
October 2018 Project Number: 196410
Table 22-3: Annualized Cash Flow
Units
LOM Total or LOM Average
Production Years Closure Period
-2 -1 1 2 3 4 5 6 7 8
Production Summary
Mine ROM Delivery Indicated kt 2,186 324 365 417 409 396 275 0 0
Mine ROM Grade Indicated % Ag 413.4 413.4 413.4 413.4 413.4 413.4 413.4 0 0
Mine ROM Delivery Inferred kt 261 22 55 3 11 24 145 0 0
Mine ROM Grade Inferred % Ag 374.6 374.6 374.6 374.6 374.6 374.6 374.6 0 0
Silver concentrate kt (dry) 78 0 0 11 13 13 13 13 13 0 0
kt (wet) 87 0 0 12 15 15 15 15 15 0 0
Silver mined kozs 32,192 4,578 5,513 5,578 5,569 5,552 5,401
Silver recovery % 90.2 89.3 90.3 90.3 90.3 90.3 90.3
Silver in concentrate kozs 29,023 4,088 4,978 5,037 5,029 5,014 4,877
Percentage of mineralized material from Castor claim % 83 82.5 82.5 82.5 82.5 82.5 82.5
Gross income from mining
Market price
Silver $/oz 16.66 0 0 16.66 16.66 16.66 16.66 16.66 16.66
Payable metals
Silver kozs 27,572 0 0 3,884 4,729 4,785 4,777 4,763 4,633 0 0
Silver $000s 459,351 0 0 64,700 78,793 79,721 79,590 79,354 77,193 0 0
NSR calculations
Concentrate handling & transportation
Site packaging/handling $000s 1,740 0 0 246 299 299 299 299 299 0 0
Land freight to Antofagasta, Chile $000s 8,699 0 0 1,232 1,493 1,493 1,493 1,493 1,493 0 0
Antofagasta port handling charges $000s 1,740 0 0 246 299 299 299 299 299 0 0
Freight to Asian smelter $000s 8,699 0 0 1,232 1,493 1,493 1,493 1,493 1,493 0 0
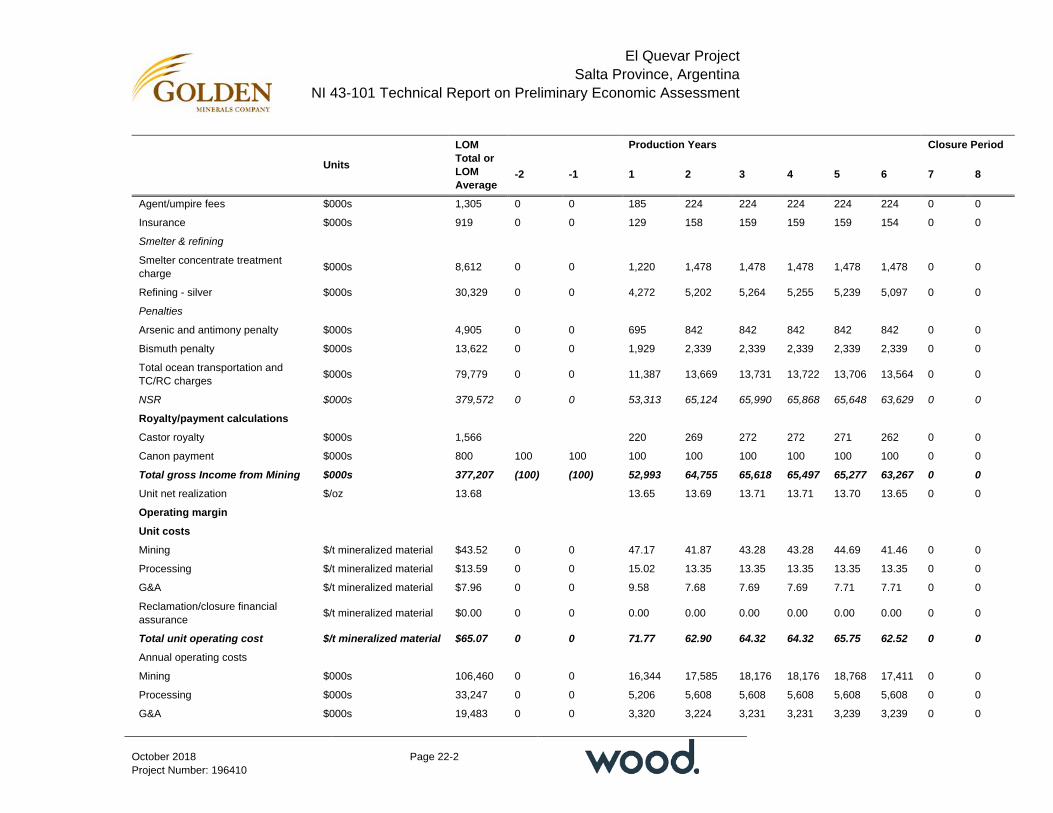
El Quevar Project Salta Province, Argentina
NI 43-101 Technical Report on Preliminary Economic Assessment
Page 22-2
October 2018 Project Number: 196410
Units
LOM Total or LOM Average
Production Years Closure Period
-2 -1 1 2 3 4 5 6 7 8
Agent/umpire fees $000s 1,305 0 0 185 224 224 224 224 224 0 0
Insurance $000s 919 0 0 129 158 159 159 159 154 0 0
Smelter & refining
Smelter concentrate treatment charge $000s 8,612 0 0 1,220 1,478 1,478 1,478 1,478 1,478 0 0
Refining - silver $000s 30,329 0 0 4,272 5,202 5,264 5,255 5,239 5,097 0 0
Penalties
Arsenic and antimony penalty $000s 4,905 0 0 695 842 842 842 842 842 0 0
Bismuth penalty $000s 13,622 0 0 1,929 2,339 2,339 2,339 2,339 2,339 0 0
Total ocean transportation and TC/RC charges $000s 79,779 0 0 11,387 13,669 13,731 13,722 13,706 13,564 0 0
NSR $000s 379,572 0 0 53,313 65,124 65,990 65,868 65,648 63,629 0 0
Royalty/payment calculations
Castor royalty $000s 1,566 220 269 272 272 271 262 0 0
Canon payment $000s 800 100 100 100 100 100 100 100 100 0 0
Total gross Income from Mining $000s 377,207 (100) (100) 52,993 64,755 65,618 65,497 65,277 63,267 0 0
Unit net realization $/oz 13.68 13.65 13.69 13.71 13.71 13.70 13.65 0 0
Operating margin
Unit costs
Mining $/t mineralized material $43.52 0 0 47.17 41.87 43.28 43.28 44.69 41.46 0 0
Processing $/t mineralized material $13.59 0 0 15.02 13.35 13.35 13.35 13.35 13.35 0 0
G&A $/t mineralized material $7.96 0 0 9.58 7.68 7.69 7.69 7.71 7.71 0 0
Reclamation/closure financial assurance $/t mineralized material $0.00 0 0 0.00 0.00 0.00 0.00 0.00 0.00 0 0
Total unit operating cost $/t mineralized material $65.07 0 0 71.77 62.90 64.32 64.32 65.75 62.52 0 0
Annual operating costs
Mining $000s 106,460 0 0 16,344 17,585 18,176 18,176 18,768 17,411 0 0
Processing $000s 33,247 0 0 5,206 5,608 5,608 5,608 5,608 5,608 0 0
G&A $000s 19,483 0 0 3,320 3,224 3,231 3,231 3,239 3,239 0 0
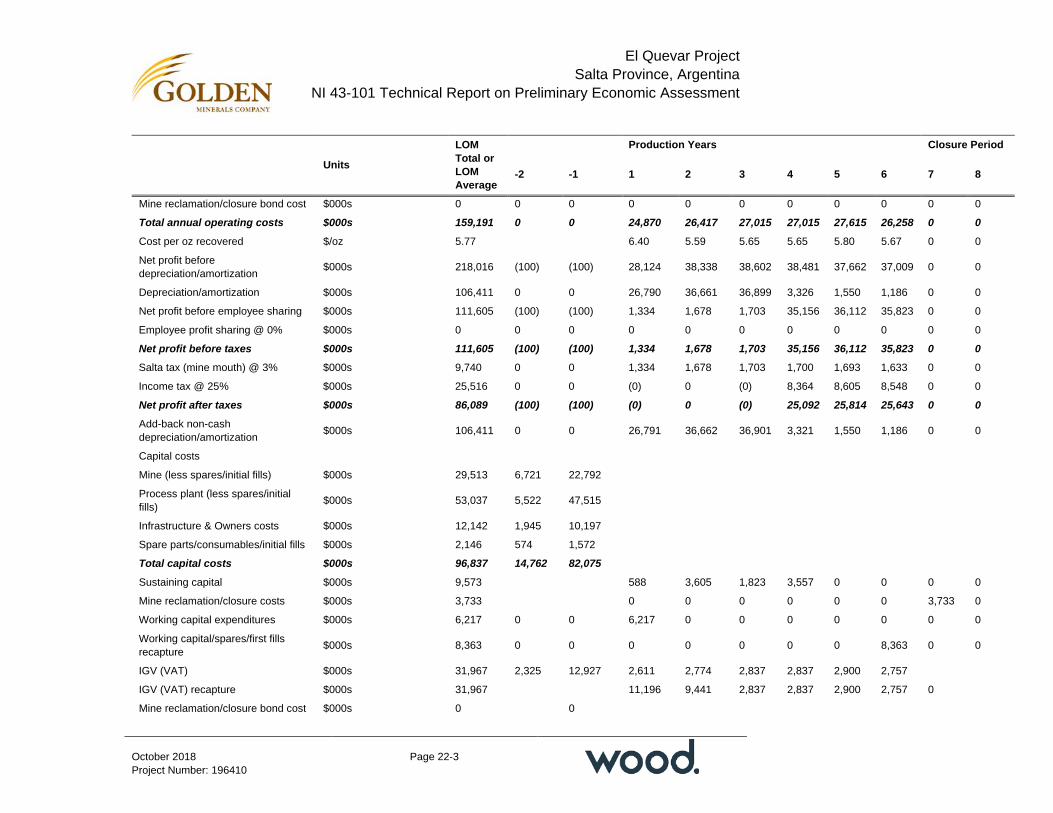
El Quevar Project Salta Province, Argentina
NI 43-101 Technical Report on Preliminary Economic Assessment
Page 22-3
October 2018 Project Number: 196410
Units
LOM Total or LOM Average
Production Years Closure Period
-2 -1 1 2 3 4 5 6 7 8
Mine reclamation/closure bond cost $000s 0 0 0 0 0 0 0 0 0 0 0
Total annual operating costs $000s 159,191 0 0 24,870 26,417 27,015 27,015 27,615 26,258 0 0
Cost per oz recovered $/oz 5.77 6.40 5.59 5.65 5.65 5.80 5.67 0 0
Net profit before depreciation/amortization $000s 218,016 (100) (100) 28,124 38,338 38,602 38,481 37,662 37,009 0 0
Depreciation/amortization $000s 106,411 0 0 26,790 36,661 36,899 3,326 1,550 1,186 0 0
Net profit before employee sharing $000s 111,605 (100) (100) 1,334 1,678 1,703 35,156 36,112 35,823 0 0
Employee profit sharing @ 0% $000s 0 0 0 0 0 0 0 0 0 0 0
Net profit before taxes $000s 111,605 (100) (100) 1,334 1,678 1,703 35,156 36,112 35,823 0 0
Salta tax (mine mouth) @ 3% $000s 9,740 0 0 1,334 1,678 1,703 1,700 1,693 1,633 0 0
Income tax @ 25% $000s 25,516 0 0 (0) 0 (0) 8,364 8,605 8,548 0 0
Net profit after taxes $000s 86,089 (100) (100) (0) 0 (0) 25,092 25,814 25,643 0 0
Add-back non-cash depreciation/amortization $000s 106,411 0 0 26,791 36,662 36,901 3,321 1,550 1,186 0 0
Capital costs 1.00
Mine (less spares/initial fills) $000s 29,513 6,721 22,792
Process plant (less spares/initial fills) $000s 53,037 5,522 47,515
Infrastructure & Owners costs $000s 12,142 1,945 10,197
Spare parts/consumables/initial fills $000s 2,146 574 1,572
Total capital costs $000s 96,837 14,762 82,075
Sustaining capital $000s 9,573 588 3,605 1,823 3,557 0 0 0 0
Mine reclamation/closure costs $000s 3,733 0 0 0 0 0 0 3,733 0
Working capital expenditures $000s 6,217 0 0 6,217 0 0 0 0 0 0 0
Working capital/spares/first fills recapture $000s 8,363 0 0 0 0 0 0 0 8,363 0 0
IGV (VAT) $000s 31,967 2,325 12,927 2,611 2,774 2,837 2,837 2,900 2,757
IGV (VAT) recapture $000s 31,967 11,196 9,441 2,837 2,837 2,900 2,757 0
Mine reclamation/closure bond cost $000s 0 0

El Quevar Project Salta Province, Argentina
NI 43-101 Technical Report on Preliminary Economic Assessment
Page 22-4
October 2018 Project Number: 196410
Units
LOM Total or LOM Average
Production Years Closure Period
-2 -1 1 2 3 4 5 6 7 8
Salvage value $000s 5,076 0 0 0 0 0 0 0 0 5,076 0
Annual cash flow $000s 79,838 (17,187) (95,102) 28,568 39,723 35,076 24,861 27,364 35,192 1,343 0
Cumulative cash flow $000s 79,838 (17,187) (112,289) (83,721) (43,998) (8,922) 15,939 43,303 78,495 79,838 79,838
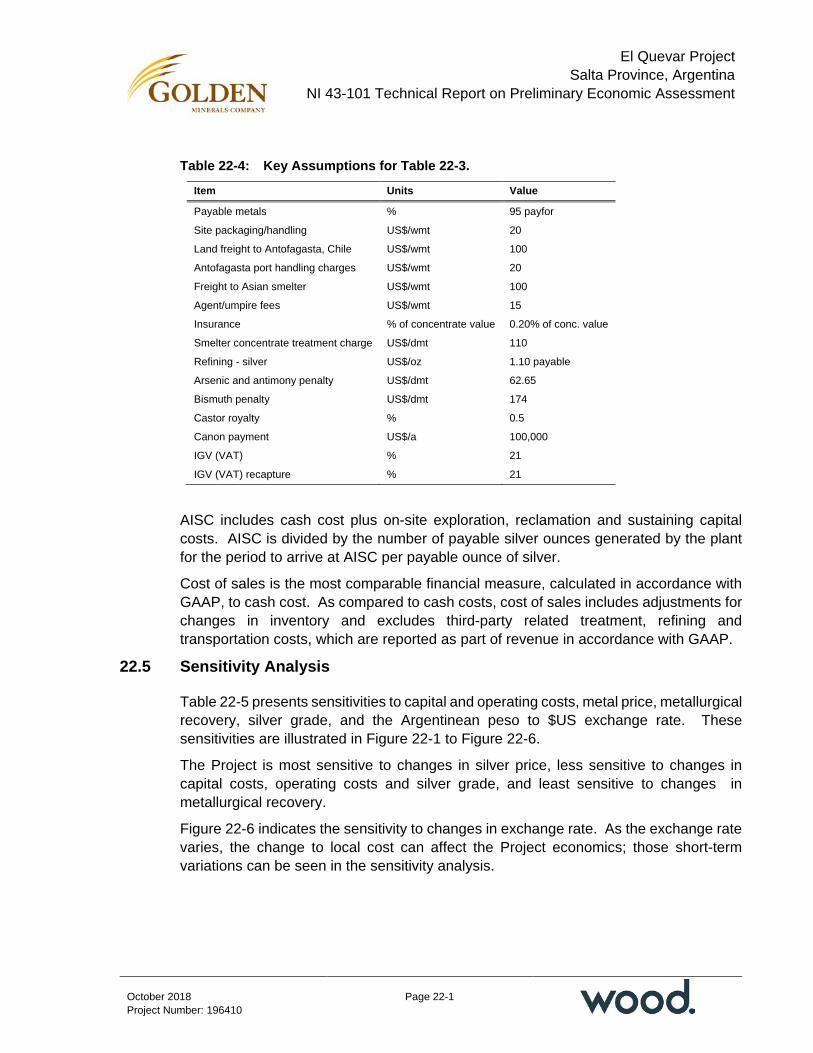
El Quevar Project Salta Province, Argentina
NI 43-101 Technical Report on Preliminary Economic Assessment
Page 22-1
October 2018 Project Number: 196410
Table 22-4: Key Assumptions for Table 22-3.
Item Units Value
Payable metals % 95 payfor
Site packaging/handling US$/wmt 20
Land freight to Antofagasta, Chile US$/wmt 100
Antofagasta port handling charges US$/wmt 20
Freight to Asian smelter US$/wmt 100
Agent/umpire fees US$/wmt 15
Insurance % of concentrate value 0.20% of conc. value
Smelter concentrate treatment charge US$/dmt 110
Refining - silver US$/oz 1.10 payable
Arsenic and antimony penalty US$/dmt 62.65
Bismuth penalty US$/dmt 174
Castor royalty % 0.5
Canon payment US$/a 100,000
IGV (VAT) % 21
IGV (VAT) recapture % 21
AISC includes cash cost plus on-site exploration, reclamation and sustaining capital costs. AISC is divided by the number of payable silver ounces generated by the plant for the period to arrive at AISC per payable ounce of silver.
Cost of sales is the most comparable financial measure, calculated in accordance with GAAP, to cash cost. As compared to cash costs, cost of sales includes adjustments for changes in inventory and excludes third-party related treatment, refining and transportation costs, which are reported as part of revenue in accordance with GAAP.
22.5 Sensitivity Analysis
Table 22-5 presents sensitivities to capital and operating costs, metal price, metallurgical recovery, silver grade, and the Argentinean peso to $US exchange rate. These sensitivities are illustrated in Figure 22-1 to Figure 22-6.
The Project is most sensitive to changes in silver price, less sensitive to changes in capital costs, operating costs and silver grade, and least sensitive to changes in metallurgical recovery.
Figure 22-6 indicates the sensitivity to changes in exchange rate. As the exchange rate varies, the change to local cost can affect the Project economics; those short-term variations can be seen in the sensitivity analysis.
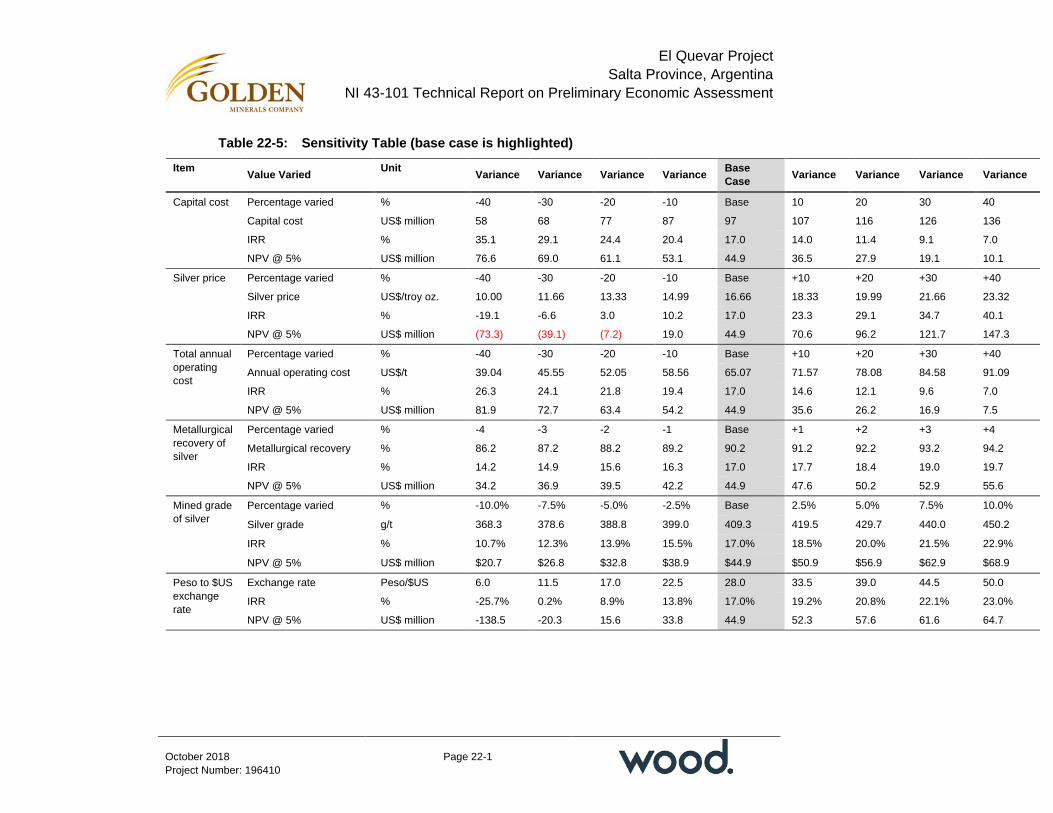
El Quevar Project Salta Province, Argentina
NI 43-101 Technical Report on Preliminary Economic Assessment
Page 22-1
October 2018 Project Number: 196410
Table 22-5: Sensitivity Table (base case is highlighted)
Item Value Varied Unit Variance Variance Variance Variance Base Case Variance Variance Variance Variance
Capital cost Percentage varied % -40 -30 -20 -10 Base 10 20 30 40
Capital cost US$ million 58 68 77 87 97 107 116 126 136
IRR % 35.1 29.1 24.4 20.4 17.0 14.0 11.4 9.1 7.0
NPV @ 5% US$ million 76.6 69.0 61.1 53.1 44.9 36.5 27.9 19.1 10.1
Silver price Percentage varied % -40 -30 -20 -10 Base +10 +20 +30 +40
Silver price US$/troy oz. 10.00 11.66 13.33 14.99 16.66 18.33 19.99 21.66 23.32
IRR % -19.1 -6.6 3.0 10.2 17.0 23.3 29.1 34.7 40.1
NPV @ 5% US$ million (73.3) (39.1) (7.2) 19.0 44.9 70.6 96.2 121.7 147.3
Total annual operating cost
Percentage varied % -40 -30 -20 -10 Base +10 +20 +30 +40
Annual operating cost US$/t 39.04 45.55 52.05 58.56 65.07 71.57 78.08 84.58 91.09
IRR % 26.3 24.1 21.8 19.4 17.0 14.6 12.1 9.6 7.0
NPV @ 5% US$ million 81.9 72.7 63.4 54.2 44.9 35.6 26.2 16.9 7.5
Metallurgical recovery of silver
Percentage varied % -4 -3 -2 -1 Base +1 +2 +3 +4
Metallurgical recovery % 86.2 87.2 88.2 89.2 90.2 91.2 92.2 93.2 94.2
IRR % 14.2 14.9 15.6 16.3 17.0 17.7 18.4 19.0 19.7
NPV @ 5% US$ million 34.2 36.9 39.5 42.2 44.9 47.6 50.2 52.9 55.6
Mined grade of silver
Percentage varied % -10.0% -7.5% -5.0% -2.5% Base 2.5% 5.0% 7.5% 10.0%
Silver grade g/t 368.3 378.6 388.8 399.0 409.3 419.5 429.7 440.0 450.2
IRR % 10.7% 12.3% 13.9% 15.5% 17.0% 18.5% 20.0% 21.5% 22.9%
NPV @ 5% US$ million $20.7 $26.8 $32.8 $38.9 $44.9 $50.9 $56.9 $62.9 $68.9
Peso to $US exchange rate
Exchange rate Peso/$US 6.0 11.5 17.0 22.5 28.0 33.5 39.0 44.5 50.0
IRR % -25.7% 0.2% 8.9% 13.8% 17.0% 19.2% 20.8% 22.1% 23.0%
NPV @ 5% US$ million -138.5 -20.3 15.6 33.8 44.9 52.3 57.6 61.6 64.7

El Quevar Project Salta Province, Argentina
NI 43-101 Technical Report on Preliminary Economic Assessment
Page 22-1
October 2018 Project Number: 196410
Figure 22-1: Capital Cost Sensitivity
Note: Figure prepared by Samuel Engineering, 2018.
Figure 22-2: Silver Price Sensitivity
Note: Figure prepared by Samuel Engineering, 2018.

El Quevar Project Salta Province, Argentina
NI 43-101 Technical Report on Preliminary Economic Assessment
Page 22-2
October 2018 Project Number: 196410
Figure 22-3: Operating Cost Sensitivity
Note: Figure prepared by Samuel Engineering, 2018.
Figure 22-4: Metallurgical Recovery Sensitivity
Note: Figure prepared by Samuel Engineering, 2018.

El Quevar Project Salta Province, Argentina
NI 43-101 Technical Report on Preliminary Economic Assessment
Page 22-3
October 2018 Project Number: 196410
Figure 22-5: Silver Grade Sensitivity
Note: Figure prepared by Samuel Engineering, 2018.
Figure 22-6: Silver Grade Sensitivity
Note: Figure prepared by Samuel Engineering, 2018.

El Quevar Project Salta Province, Argentina
NI 43-101 Technical Report on Preliminary Economic Assessment
Page 22-4
October 2018 Project Number: 196410
22.6 Comments on Section 22
Under the assumptions set out in this Report, the Project presents a positive after-tax cash flow.
On September 4, 2018, Argentina announced the imposition of an export tax on precious metals in concentrate form equal to three pesos per US dollar on the value of any concentrates exported. The tax is effective immediately and is set to expire at the end of 2020. At the current approximate exchange rate of 40 Argentine pesos to the US dollar, that tax rate would amount to 7.5%. The tax rate in US dollar terms will vary based on the future Argentine peso exchange rate. A tax credit against export taxes exists for Salta Province that would lower the new export tax by 2.5%, resulting in an export tax of approximately 5% at the current Argentine peso exchange rate. The new export tax has not been considered in the PEA because it is set to expire prior to the projected start of production.

El Quevar Project Salta Province, Argentina
NI 43-101 Technical Report on Preliminary Economic Assessment
Page 23-1
October 2018 Project Number: 196410
23.0 ADJACENT PROPERTIES
This section is not relevant to this Report.
El Quevar Project Salta Province, Argentina
NI 43-101 Technical Report on Preliminary Economic Assessment
Page 24-1
October 2018 Project Number: 196410
24.0 OTHER RELEVANT DATA AND INFORMATION
24.1 Opportunities
24.1.1 Exploration
The Yaxtché deposit remains open along strike and several zones adjacent to the resource estimate area have returned significant silver intercepts. With additional testwork, including drilling, there may be potential for these areas to support resource estimates that could be incorporated into the PEA mine plan.
Additional potential remains in the greater Quevar South project area, where previous exploration has identified styles of mineralization, alteration, and lithologies similar to those at Yaxtché. These areas warrant additional evaluation.
24.1.2 Mining
Greater rock strength than modeled could allow for larger underground openings with less pillar support and consequently greater recovery of the mineralized material.
Infill and step-out drilling toward the northwest end of the deposit may identify additional mineralization that could support resource estimates. The is also potential for a reduction in the development drifting assumed in the PEA mine plan if additional mineralization that could support resource estimates is identified.
24.2 Risks
24.2.1 Mining
Rock mechanics results may not be representative of the entire deposit. In areas of weaker rock strength, if they exist, additional ground support would be required which could reduce the recovery of the mineralized material.
24.2.2 Process Plant
The major risks associated with the process plant are:
• Variations in the mineralogy of silver mineralization between the three Yaxtché zones which could negatively impact silver recovery and/or concentrate grade
• Higher concentrate impurities from arsenic, antimony and/or bismuth which could:
− Increase the smelting charges and/or − Increase the penalties and/or − Cause the silver concentrate to be undesirable and possibly unmarketable.

El Quevar Project Salta Province, Argentina
NI 43-101 Technical Report on Preliminary Economic Assessment
Page 24-2
October 2018 Project Number: 196410
24.2.3 Taxation
The PEA does not include considerations of the newly-imposed export tax, as it is currently set to expire prior to the projected start of production. If the tax is extended beyond 2020, there could be a future impact on the Mineral Resource estimate and the financial analysis.
24.2.4 Exchange Rates
Argentina is currently experiencing a period of rapid inflation and related peso devaluation with respect to the US dollar and other currencies. Section 22.5 indicates that the portion of the Project costs that are denominated in pesos, which are mostly labor costs, food, and locally-sourced consumables, have been conservatively estimated in the current study but will likely become more expensive in US dollar terms as inflation works its way through the wage and cost structure.

El Quevar Project Salta Province, Argentina
NI 43-101 Technical Report on Preliminary Economic Assessment
Page 25-1
October 2018 Project Number: 196410
25.0 INTERPRETATION AND CONCLUSIONS
25.1 Introduction
The QPs note the following interpretations and conclusions in their respective areas of expertise, based on the review of data available for this Report.
25.2 Mineral Tenure, Surface Rights, Water Rights, Royalties, Agreements
Legal opinion provided supports that Golden Minerals currently holds an indirect 100% interest in the El Quevar Project through its subsidiary Silex Argentina.
The AMC sets out rules under which surface rights and easements can be granted for a mining operation. In instances where no agreement can be reached with the landowner, the AMC provides the mining right holder with the right to expropriate the required property.
Water use rights may be acquired by permit, by concession, and, under laws enacted in some Provinces, through authorization.
Golden Minerals is required to pay a 1% NSR royalty on the value of all minerals extracted from the El Quevar II concession and a 1% NSR royalty on one-half of the minerals extracted from the Castor concession. Golden Minerals can purchase one half of the combined royalty interests for US$1 million during the first two years of production.
Golden Minerals may also be required to pay a 3% royalty to the Salta Province based on the mine mouth value of minerals extracted from any of the concessions unless new legislation is enacted by the Argentine Federal Congress that will allow Salta Province to levy up to 3% royalty of the gross revenue accrued in a year.
Information provided by Silex Argentina supports that the required environmental permits have been granted or are under application. All previous work was completed under fully-authorized permits.
25.3 Geology and Mineralization
Mineralization at the Yaxtché deposit is high-sulfidation in style.
The geological setting, mineralization style, and structural and stratigraphic controls are sufficiently well understood to provide useful guides to exploration and Mineral Resource estimation.
El Quevar Project Salta Province, Argentina
NI 43-101 Technical Report on Preliminary Economic Assessment
Page 25-2
October 2018 Project Number: 196410
25.4 Exploration, Drilling and Analytical Data Collection in Support of Mineral Resource Estimation
Exploration completed to date has resulted in delineation of the Yaxtché deposit and a number of exploration targets.
No drilling has been undertaken on the Project since 2013.
Drilling equipment and procedures since 2007 are consistent with industry standards and are adequate to support Mineral Resource estimation.
The quantity and quality of the lithological, recovery, collar and downhole survey data collected are consistent with industry standards and are adequate to support Mineral Resource estimation.
Due to the nature of the mineralization occurring as shoots and veins, the true width of the mineralization will vary both along strike and in the down dip direction. In areas where the strike and dip of the mineralization are well established, a true width for the mineralized intersection may be estimated. However, in areas of poor surface exposure or where there is no drilling or poor drilling, the true width of the mineralization cannot be estimated.
Sampling methods for core and underground samples are consistent with industry practices and adequate to support Mineral Resource estimation.
Sample preparation and analytical procedures since 2007 are consistent with typical industry practices at the time the samples were prepared and are adequate to support Mineral Resource estimation.
Density determinations are acceptable to support Mineral Resource estimation.
Sample security procedures met industry standards at the time the samples were collected. Current sample storage procedures and storage areas are consistent with industry standards.
Data verification was undertaken in support of technical reports on the Project by external consultants SRK (2009), Chlumsky, Armbrust & Meyer, LLC (2009, 2010), Micon (2010) and Pincock, Allen and Holt (2012). These consultants concluded, at the time of their examination, that the data were suitable to support Mineral Resource estimation.
Data verification completed by external consultants in the period 2009–2012 indicated the data at the time of each review was suitable to support Mineral Resource estimates.
Wood reviewed the QA/QC data supplied by Golden Minerals during 2018. The review focused on results obtained for standards, duplicates and blanks. There were no significant issues noted with the duplicate or blank QA/QC results. However, the SRMs
El Quevar Project Salta Province, Argentina
NI 43-101 Technical Report on Preliminary Economic Assessment
Page 25-3
October 2018 Project Number: 196410
used between 2006 and 2013 were a combination of CRMs and six SRMs created from material collected from the Quevar site (likely drill core reject material). The SRMs were noted to be well below the 150 g/t Ag grades used to constrain the 2018 resource model and are not considered by Wood to be appropriate for the current resource model. In Wood’s opinion, the site-specific SRMs were not created using industry-accepted practices, and thus should not be considered as reference materials. Wood traveled to the site in mid-2018 to supervise and assist in the collection, shipping and re-assaying of a representative set of pulps within the Mineral Resource estimate area. A total of 472 samples (including CRMs and blanks) were submitted to ALS for analysis. Results of the re-sampling study showed that the assays of the re-sampled pulps results agreed very closely to the original assays.
Wood audited collar survey, downhole survey, assays, density, lithology and redox tables. The data are considered acceptable to support Mineral Resource estimates.
25.5 Metallurgical Testwork
Metallurgical testwork was completed over a five-year period from 2008 to 2012 on composite samples from the Yaxtché deposit. The objectives of the metallurgical tests were to develop technical parameters and inputs for design of the process plant including:
• Process flow sheet
• Design criteria
• Consumables
• Material and water balances
• Optimizing processing results.
The results of this work identified six conceptual flowsheets that may have potential to treat mineralized silver material. Testwork results completed by DML and JKTech were used as the basis for the design of the process plant. The sample composites from Yaxtché were denoted by their location – east, central and west. High variabilities in silver recovery by flotation were noted going from the west (93%) to the central (60%) and east (88%) zones indicating changes in silver mineralogy. There also appears to be a change in hardness and abrasiveness of the mineralized material that should be further investigated.
The currently preferred flowsheet is selective flotation to produce a bulk silver concentrate as most of the mineralization consists of sulfide in the west zone. Conventional unit processes would be used to treat 1,200 t/d of mineralized silver material from the underground mine for the production of a bulk silver concentrate by conventional crushing (two stages), grinding (single stage) and flotation (rougher [two

El Quevar Project Salta Province, Argentina
NI 43-101 Technical Report on Preliminary Economic Assessment
Page 25-4
October 2018 Project Number: 196410
stages] and cleaners [five stages]) techniques. The process plant would treat 1,200 t/d of mineralized material from the underground mine at a 90.2% recovery for the production of a bulk silver concentrate with an average grade of 11.5 kg/t Ag.
The results of DML’s 2012 locked cycle flotation testwork was the primary data source. This testwork included only two cleaner stages for producing the bulk silver concentrate. The mass balance for the process plant was modelled to include five cleaner stages in order to produce a high-grade bulk silver concentrate of about 11.5 kg/t Ag. Based on the metallurgical testwork and modeling, a LOM average silver recovery of 90.2% is estimated for the production of 78,288 dry tonnes of bulk silver concentrate. The bulk silver concentrate from the fifth cleaner stage would be the final silver concentrate which would be packaged in one tonne super sacks for shipment.
Based on current testwork results, the bulk silver concentrate could contain arsenic, antimony and bismuth impurities, which could potentially result in higher concentrate treatment charges and penalties.
25.6 Mineral Resource Estimates
Mineral Resource estimation was performed by Wood staff. Mineral Resources have an effective date of 26 February 2018. They have been estimated using the PACK methodology. Silver is the only commodity considered to have reasonable prospects of eventual economic extraction using a room-and-pillar underground mining method.
A number of factors were noted that may affect the Mineral Resource estimate, including: commodity price assumptions; changes in local interpretations of mineralization geometry and continuity of mineralization zones; changes to geotechnical, hydrogeological, and metallurgical recovery assumptions; density and domain assignments; changes to assumed mining method which may change block size and orientation assumptions used in the resource model; input factors used to assess reasonable prospects for eventual economic extraction; assumptions as to social, permitting and environmental conditions; and additional infill or step out drilling or results obtained from extending the exploration decline.
25.7 Mine Plan
The assumed production rate is 1,200 t/d. Mining will be conducted using a post-pillar cut-and-fill method. This mining method relies on using 5 m x 5 m rooms and 5 m x 5 m square pillars. The pillars of one level are planned to align vertically with the next mining level to provide support. Mining starts at the lowest elevation in a mining area and is completed working upward. Some pillars can be extracted when they occur in an area of the stope where there will be no mining above.

El Quevar Project Salta Province, Argentina
NI 43-101 Technical Report on Preliminary Economic Assessment
Page 25-5
October 2018 Project Number: 196410
Backfill in the stope areas will be accomplished by hauling material from development or internal stope waste headings to the area requiring fill, and by backhauling crushed/sized backfill from the surface.
Ventilation will be via use of raises.
Dewatering will use pumps. All mine water will be pumped to a decantation pond that will be located on the surface near the mine portal.
Many of the required facilities needed to support underground operations were constructed with the initial Project trial mining development in 2010. These existing facilities have been well maintained and are ready for use.
Year -1 will be used to complete the required pre-production physical development, year 1 will be the ramp-up to production of 1,200 t/d of mill feed material, and the sustaining development. Year 2 to year 5 will have sustained production at 1,200 t/d, with sustaining development at 939 m/a. Year 6 sustains production at 1,200 t/d, with all development completed by the end of year 6. Mine production assumes producing 1,200 t/d for 350 d/a, from two active stope areas.
Underground equipment will be conventional to the industry, and will include jumbos, 7 yd3 LHD units, blasting and haulage trucks, and rammer units.
25.8 Recovery Plan
The processing facility flowsheet was developed to recover silver from the Yaxtché sulfide deposit. The current design basis is set to process 1,200 t/d of mineralized silver material from the underground mine for the production of a bulk silver concentrate by conventional crushing (two stages), grinding (single stage), flotation (rougher [two stages] and cleaners [five stages]) techniques.
Testwork completed by DML and JKTech was used as the basis for the design of the process plant. The results of DML’s 2012 locked cycle flotation testwork was the primary data source. This testwork included only two cleaner stages for producing the bulk silver concentrate. The mass balance for the process plant was modeled to include five cleaner stages in order to produce a high-grade bulk silver concentrate of about 11.5 kg/t Ag. The bulk silver concentrate from the fifth cleaner stage would be the final silver concentrate which would be packaged in one tonne super sacks for shipment. Testwork indicates the silver concentrate would contain elevated levels of arsenic, bismuth and antimony.
Reagents would be added to the ball mill, rougher flotation cells, conditioners and each cleaner stage. The tailings from the first cleaner stage would be sent to cleaner scavenger flotation with the scavenger concentrate returned to the ball mill and the scavenger tailings to the tailings thickener. The tailings from the second rougher stage would be combined with the cleaner scavenger tailings as the final plant tailings which
El Quevar Project Salta Province, Argentina
NI 43-101 Technical Report on Preliminary Economic Assessment
Page 25-6
October 2018 Project Number: 196410
would be pumped to the tailings thickener. The final plant tailings in the thickener underflow would be pumped to the proposed tailings impoundment location, a distance of about 670 m.
25.9 Infrastructure
The majority of the required surface infrastructure is in place.
The Project camp facilities are reached using a company-built 4.1 km access from state route RP 27. Existing camp accommodations will provide offices, dining and lodging accommodations for the pre-development and building construction phase. The current camp provides room and board for 100 workers. Plans call for expanding the camp bedrooms, kitchen and ancillary services to 350-person capacity.
The Project power will be supplied using natural gas generators with gas provided from a major natural gas line that is located about 2 km from the El Quevar camp.
Stockpile requirements will be minimal. There are no permanent waste storage facilities designed for the Project as part of this PEA. Waste will be stored underground as fill.
The TSF design assumes that the TSF will be constructed in two phases; Phase I will be constructed in year -1 and Phase II will be constructed during year 3 for operation in year 4.
Silex Argentina has a well permit and is able to pump water from the El Quevar Sud stream for mining purposes.
25.10 Environmental, Permitting and Social Considerations
The Project is situated within two Protected Areas.
Ausenco Vector prepared an environmental baseline study report in 2010, which was accepted by the relevant authorities. In March 2018, a Stage IIA environmental impact report was submitted to the relevant authorities to support surface exploration activities, including project reviews and 1:2,000 scale geological mapping. The Stage IIA report was approved in May 2018.
A number of baseline studies were completed in support of the trial mining program in 2010–2011.
Exploration and trial mining were conducted under the required permits for those activities. Any future mining activity will require an EIA and EIS, and sectorial permit grants for aspects such as fuel storage, communications, explosives handling, waste management, chemicals and reagents management, and water usage.
Community consultations were undertaken between August 2006 and February 2013. Key community concerns raised included job opportunities, workforce training
El Quevar Project Salta Province, Argentina
NI 43-101 Technical Report on Preliminary Economic Assessment
Page 25-7
October 2018 Project Number: 196410
opportunities, upgrading of school facilities, and provision of school supplies. Additional community consultations would be required as part of the EIS.
25.11 Markets and Contracts
The El Quevar Project would produce a single silver-bearing concentrate assaying about 11.5 kg/t Ag from the on-site process plant. This concentrate would be loaded into one tonne super sacks at the process plant and trucked to the Chilean port of Antofagasta for export to foreign smelters for treatment (smelting) and refining.
The marketing strategy for the El Quevar concentrate will focus on Golden Minerals progressing the Project forward into development and production. Golden Minerals has not entered into any discussions for concentrate sales contracts or terms and has not committed any tonnages of concentrate with potential buyers or consumers. The metal concentrate market is forecasted to be in a deficit in the future when there exists the potential for the El Quevar Project to be placed into production. As part of future engineering work and studies, it is recommended that Golden Minerals pursue discussions with potential concentrate buyers and traders in both the Asian and European markets. The cost to on-site package the silver concentrate, truck to the Antofagasta port in Chile, and ocean-ship to Asian smelters for treatment is estimated at US$255/dry t concentrate, US$1.10/oz of payable silver, and an insurance fee of 0.2% of the concentrate value.
The silver payfor is estimated at 95% based on the concentrate assays from metallurgical testwork and plant material balances. Metallurgical testwork indicates elevated levels of impurities for bismuth, arsenic and antimony in the concentrate, which would result in penalties estimated at US$236.65/dry t concentrate. The commodity price for silver used for the economic analysis is US$16.66/oz Ag based on the three-year rolling average from July 1, 2015 to June 30, 2018. No marketing studies for El Quevar concentrate have been completed by Golden Minerals or its consultants.
Golden Minerals has no current contracts for property development, mining, concentrating, smelting, refining, transportation, handling, sales and hedging, forward sales contracts or arrangements
25.12 Capital Cost Estimates
Capital cost estimates were prepared by Mineral Resources Engineering and Samuel Engineering, and are reflective of a PEA level of accuracy. Contingency is included in each discipline area.
The overall capital costs total US$96.8 million. This cost includes the following provisions:
• Mining: US$28.1 million
El Quevar Project Salta Province, Argentina
NI 43-101 Technical Report on Preliminary Economic Assessment
Page 25-8
October 2018 Project Number: 196410
• Process: US$32 million
• General and infrastructure: US$10.8 million
• EPCM: US$10.0 million
• Contingency: US$16.0 million.
25.13 Operating Cost Estimates
Capital cost estimates were prepared by Mineral Resources Engineering and Samuel Engineering, and are reflective of a PEA level of accuracy.
Operating costs are estimated at US$5.77/oz Ag recovered. This equates to US$159.2 million over the LOM, and an average cost per tonne of mineralized material mined of US$65.07.
By area, over the LOM, the total costs are estimated at:
• Mining: US$106.5 million
• Processing: US$33.2 million
• General and administrative: US$19.5 million.
By US dollars per tonne of mineralized material over the LOM, the costs are estimated at:
• Mining: US$43.52/t mineralized material
• Processing: US$13.59 mineralized material
• General and administrative: US$7.96 mineralized material.
25.14 Economic Analysis
The economic analysis is partly based on Inferred Mineral Resources that are considered too speculative geologically to have the economic considerations applied to them that would enable them to be categorized as Mineral Reserves, and there is no certainty that the PEA based on these Mineral Resources will be realized.
The discounted cash flow analysis was performed on a stand-alone project basis with annual cash flows discounted on an end-of-year basis. The economic evaluation used a real discount rate of 5% and was performed at commencement of construction (denoted as Year -2 of the El Quevar Project) using Q2 2018 US dollars.
All costs prior to the start of construction are considered as “sunk costs” and not considered in the economic analysis.
El Quevar Project Salta Province, Argentina
NI 43-101 Technical Report on Preliminary Economic Assessment
Page 25-9
October 2018 Project Number: 196410
This economic analysis is a direct result of the capital cost estimate and is therefore considered to have the same level of accuracy (±25%).
The summarized PEA results include:
• After-tax net present value (NPV): US$45 million at a 5% discount rate
• After-tax internal rate of return (IRR): 17.0%
• After-tax payback period: 3.4 years
• Total pre-production capital cost: $97 million, including $16 million contingency
• Pre-production development time: two years
• Life of mine (LOM): six years, based on the subset of the Mineral Resource estimate in the PEA mine plan
• LOM free cash flow $80 million
• LOM payable silver production 29 Moz
• LOM average silver grade 409 g/t Ag
• Post start-up cash cost $9.10 per payable ounce of silver
• Post start-up all-in sustaining costs (AISC) $9.45/oz payable Ag.
The Project is most sensitive to changes in silver price, less sensitive to changes in capital costs, operating costs, and silver grade, and least sensitive to changes in metallurgical recovery.
25.15 Risks and Opportunities
25.15.1 Opportunities
The Yaxtché deposit remains open along strike and several zones adjacent to the resource estimate area have returned significant silver intercepts. With additional testwork, including drilling, there may be potential for these areas to support resource estimates that could be incorporated into the PEA mine plan.
Additional potential remains in the greater Quevar South project area, where previous exploration has identified styles of mineralization, alteration, and lithologies similar to those at Yaxtché. These areas warrant additional evaluation.
Greater rock strength than modeled could allow for larger underground openings with less pillar support and consequent greater recovery of the mineralized material.
Infill and step-out drilling toward the northwest end of the deposit may identify additional mineralization that could support resource estimates. The is also potential for a

El Quevar Project Salta Province, Argentina
NI 43-101 Technical Report on Preliminary Economic Assessment
Page 25-10
October 2018 Project Number: 196410
reduction in the development drifting assumed in the PEA mine plan if additional mineralization that could support resource estimates is identified.
25.15.2 Risks
Rock mechanics results may not be representative of the entire deposit. In areas of weaker rock strength, if they exist, additional ground support would be required which could reduce the recovery of the mineralized material.
The major risks associated with the process plant are:
• Variations in the mineralogy of silver mineralization between the three Yaxtché zones which could negatively impact the silver recovery and/or concentrate grade
• Higher concentrate impurities from arsenic, antimony and/or bismuth which could:
− Increase the smelting charges and/or − Increase the penalties and/or − Cause the silver concentrate to be undesirable and possibly unmarketable.
The PEA does not include considerations of the newly-imposed export tax, as it is currently set to expire prior to the projected start of production. If the tax is extended beyond 2020, there could be a future impact on the Mineral Resource estimate and the financial analysis.
Argentina is currently experiencing a period of rapid inflation and related peso devaluation with respect to the US dollar and other currencies. Section 22.5 indicates that the portion of Project costs that are denominated in pesos, which are mostly labor costs, food, and locally-sourced consumables, have been conservatively estimated in the current study but will likely become more expensive in US dollar terms as inflation works its way through the wage and cost structure.
25.16 Conclusions
Under the assumptions set out in this Report, the Project has a positive economic outcome.

El Quevar Project Salta Province, Argentina
NI 43-101 Technical Report on Preliminary Economic Assessment
Page 26-1
October 2018 Project Number: 196410
26.0 RECOMMENDATIONS
26.1 Introduction
Recommendations have been broken into two phases. Phase 1 recommendations are made in relation to exploration activities, geological data, database auditability, Mineral Resource estimation, and metallurgical testwork.
Recommendations proposed in Phase 2 are suggestions for additional data collection and data support for future mining studies. A portion of the Phase 2 work is dependent on completion of the Phase 1 recommendations.
Phase 1 is estimated at about US$1.22 million to US$1.32 million. Phase 2 is budgeted at approximately US$510,000 to US$765,000.
26.2 Phase 1
26.2.1 Exploration
Additional exploration in the Quevar South area is recommended to follow up on areas that remain potentially open along strike to the northwest and southeast of the Yaxtché resource estimate area. The program should also follow up on numerous previous intercepts that show elevated silver grades, particularly where those intercepts are currently not included in the Mineral Resource estimate. There are also several geophysical targets with characteristics similar to those of the Yaxtché deposit that have not been drill tested. Core from three to four of the drill holes may be used to provide additional material for metallurgical testwork purposes (see Section 26.2.5).
A 4,000 m core drill program is recommended. The budget estimate for the program totals about US$1 million (Table 26-1).
26.2.2 Geology
Consideration should be given to completion of a structural study to confirm the deposit structural setting, and preferred vein orientations to confirm the assumptions used in the geological model. Depending on whether the work is performed internally or contracted out to a specialist structural consultant, the budget may range from $40,000 to $60,000.
A review of the database should be undertaken to determine which drill intercepts returned penalty element assay values that were above the tolerances for the analytical method used. Those intervals should be re-assayed to determine the exact penalty element values. The budget estimate is dependent on the number of samples that would need to be submitted for reassay. Wood has assumed that 200 samples may need to be re-assayed, for a total program cost of $6,000.
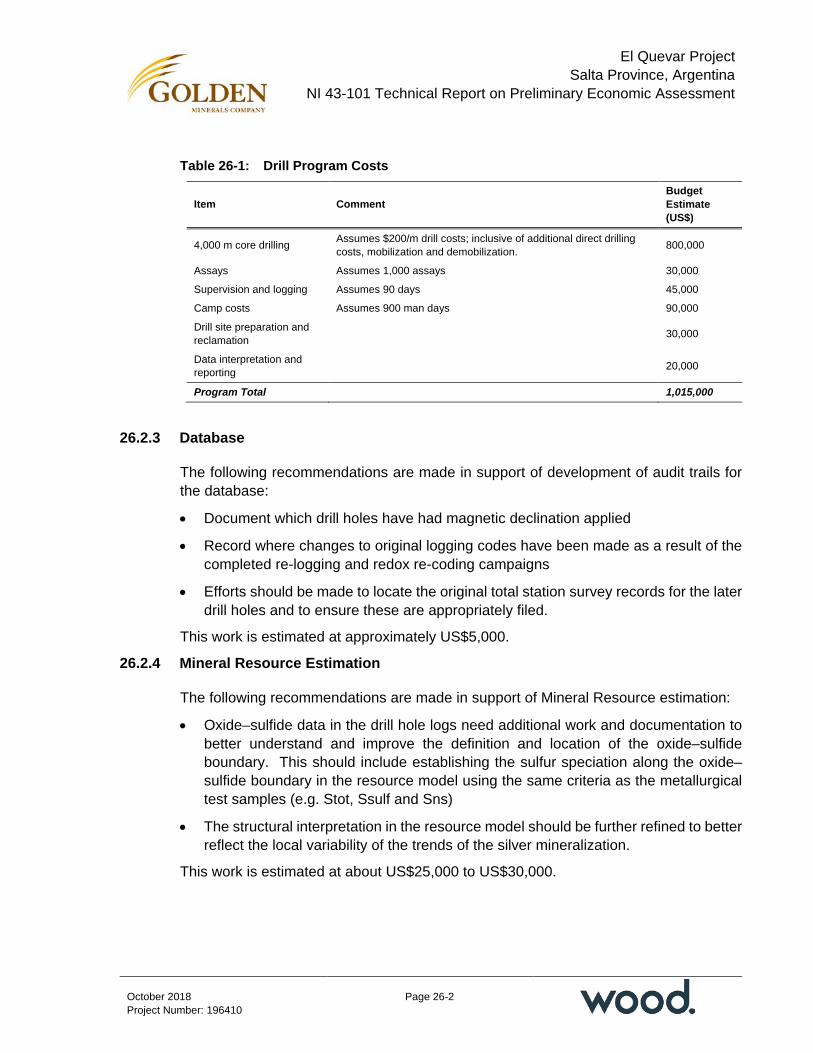
El Quevar Project Salta Province, Argentina
NI 43-101 Technical Report on Preliminary Economic Assessment
Page 26-2
October 2018 Project Number: 196410
Table 26-1: Drill Program Costs
Item Comment Budget Estimate (US$)
4,000 m core drilling Assumes $200/m drill costs; inclusive of additional direct drilling costs, mobilization and demobilization. 800,000
Assays Assumes 1,000 assays 30,000
Supervision and logging Assumes 90 days 45,000
Camp costs Assumes 900 man days 90,000
Drill site preparation and reclamation 30,000
Data interpretation and reporting 20,000
Program Total 1,015,000
26.2.3 Database
The following recommendations are made in support of development of audit trails for the database:
• Document which drill holes have had magnetic declination applied
• Record where changes to original logging codes have been made as a result of the completed re-logging and redox re-coding campaigns
• Efforts should be made to locate the original total station survey records for the later drill holes and to ensure these are appropriately filed.
This work is estimated at approximately US$5,000.
26.2.4 Mineral Resource Estimation
The following recommendations are made in support of Mineral Resource estimation:
• Oxide–sulfide data in the drill hole logs need additional work and documentation to better understand and improve the definition and location of the oxide–sulfide boundary. This should include establishing the sulfur speciation along the oxide–sulfide boundary in the resource model using the same criteria as the metallurgical test samples (e.g. Stot, Ssulf and Sns)
• The structural interpretation in the resource model should be further refined to better reflect the local variability of the trends of the silver mineralization.
This work is estimated at about US$25,000 to US$30,000.
El Quevar Project Salta Province, Argentina
NI 43-101 Technical Report on Preliminary Economic Assessment
Page 26-3
October 2018 Project Number: 196410
26.2.5 Metallurgy and Process
The following recommendations are presented in support of further metallurgical testwork:
• Existing metallurgical studies have shown significant variabilities in silver recovery by flotation in the deposit zones going from the west (93%) to the central (60%) and east (88%) zones. These data should be further reviewed to guide the most representative core drill hole intercepts through the zones which could be used for further metallurgical studies. It is assumed that three to four of the exploration drill holes proposed in Section 26.2.1 will be used for both exploration and metallurgical purposes
• The currently-preferred flowsheet would use selective rougher and cleaner flotation to produce a bulk silver concentrate. Although the implementation of cyanide leaching was not considered in this Project analysis, it is recommended that economic trade-off studies be completed examining various production options.
The metallurgical work is estimated to cost between US$125,000 to US$200,000.
26.3 Phase 2
26.3.1 Mineral Resources
The following recommendation is made in support of the Mineral Resource model:
• Once the metallurgical testwork data are available from the Phase 1 work programs recommended, the resulting metallurgical domains should be added to the resource model.
This work is estimated at US$10,000 to US$15,000.
26.3.2 Mining
A trial mining program should be undertaken to extend the decline to the core deposit area to provide additional geotechnical information.
A review should be undertaken of the estimated grade of deleterious elements in the resource model to determine if a mine scheduling/blending program can be devised to minimize the arsenic, bismuth and/or antimony in the mill feed and thereby diminish the total penalties for those elements currently assumed to apply to payable amounts from concentrate sales.
This work is estimated at US$500,000 to US$750,000.

Company Logo
Name of Project Location of Project (Province/State/Department, Country)
NI 43-101 Technical Report
Page 27-1
October 2018 Project Number: 196410
27.0 REFERENCES
Baker Mackenzie, 2013: Doing Business in Argentina: https://www.healyconsultants.com/wp-content/uploads/2013/11/Argentina-Baker-McKenzie-Doing-business-in-Argentina.pdf
Baker Mackenzie, 2018: Doing Business in Argentina 2018: https://www.bakermckenzie.com/-/media/files/insight/publications/2018/04/buadms3652163v1doingbusinessinargentina2018.pdf?la=en
Barnard, F., and Sandefur, R.L., 2010: NI 43-101 Technical Report Mineral Resource Estimate Update Yaxtché Silver Deposit El Quevar Project Salta Province, Argentina: report prepared by Chlumsky, Armbrust & Meyer, LLC for Golden Minerals Company, effective date 14 January, 2010.
Barnard, F., and Sandefur, R.L., 2009a: NI 43-101 Technical Report Mineral Resource Estimate Yaxtché Silver Deposit El Quevar Project Salta Province, Argentina: report prepared by Chlumsky, Armbrust & Meyer, LLC for Golden Minerals Company, effective date 12 October, 2009.
Barnard, F., and Sandefur, R.L., 2009b: Mineral Resource Estimate Yaxtché Central Zone Silver Deposit El Quevar Project Salta Province, Argentina: report prepared by Chlumsky, Armbrust & Meyer, LLC for Golden Minerals Company, effective date 15 August, 2009.
Camuti, K., 2009: Mineralogy – XRD & PIMA, 8 Drill Hole Samples From QVD 036 & QVD 041: report to Silex Exploration, report SLX0901.
Canadian Institute of Mining, Metallurgy and Petroleum (CIM), 2003: Estimation of Mineral Resources and Mineral Reserves, Best Practice Guidelines: Canadian Institute of Mining, Metallurgy and Petroleum, November 23, 2003.
Canadian Institute of Mining, Metallurgy and Petroleum (CIM), 2014: CIM Standards for Mineral Resources and Mineral Reserves, Definitions and Guidelines: Canadian Institute of Mining, Metallurgy and Petroleum, May, 2014.
Canadian Securities Administrators (CSA), 2011: National Instrument 43-101, Standards of Disclosure for Mineral Projects, Canadian Securities Administrators; Instrument and Companion Policy as updated in 2016.
Card, D., 2018: Report on Geophysical Data Analysis: IP, Resistivity, 3D Inversions, El Quevar Project, Argentina: report prepared by EarthEx Geophysical Solutions for Golden Minerals.

Company Logo
Name of Project Location of Project (Province/State/Department, Country)
NI 43-101 Technical Report
Page 27-2
October 2018 Project Number: 196410
Coote, A., 2010: Petrological Studies of Diamond Core from the Quevar Silver and Base Metal Deposit, Salta, Argentina: internal report for Silex Argentina SA. Project No. 54002.
Corbett, G.J., 2009: Comments on the Geology and Exploration Potential of the Quevar Project, Salta, Argentina: report to Silex Exploration.
Corbett, G.J., 2012: Comments on the Geology and Exploration Potential of the Quevar Project, northern Argentina: report to Silex Exploration.
Cumming, G., 2010: Memorandum: Stratigraphic Framework for Quevar Sur: report to Silex Argentina SA.
Dawson Metallurgical Laboratories, Inc., 2008: Report Describing Preliminary Cyanidation and Flotation Testing of Several Composite Samples from the El Quevar Project: report prepared for Apex Silver Mines, July 2, 2008, 57 p.
Dawson Metallurgical Laboratories, Inc., 2009: Results of Bulk Sulfide Flotation and Subsequent Cyanidation of Ultra-Finely Ground Concentrate on a Sample from the El Quevar Project: report prepared for Golden Minerals Company, September 21, 2009.
Dawson Metallurgical Laboratories, Inc., 2010: Results of Cyanide Leach and Sulfide Test Work on Silver/Copper Ore Samples from the Central West, Central, and East Ore Deposits of the El Quevar Project in Argentina: report prepared for Golden Minerals Company, January 21, 2010.
Dawson Metallurgical Laboratories, Inc., 2011: Results of Initial Flotation and Cyanidation Testing on the El Quevar Silver/Copper YWMC-2010 Composite: report prepared for Golden Minerals Company, February 18, 2011, 41 p.
Dawson Metallurgical Laboratories, Inc., 2012: Results of Continued Flotation and Cyanidation Testing on the El Quevar Silver/Copper YWMC-2010 Composite, also Results of Flotation of a Bulk Sample Received May 17: report prepared for Golden Minerals Company, October 1, 2012, 42 p.
Espeche Estudio Contable, 2018: Argentina Taxation 2018 – El Quevar PEA: memorandum prepared for Golden Minerals Company, July 17, 2018, 8 p.
Fraser Institute, 2018: Survey of Mining Companies, 2017: Fraser Institute publication, https://www.fraserinstitute.org/studies/annual-survey-of-mining-companies-2017
Gates, P.A. and Horlacher, C.F., 2012: NI 43-101 Technical Report for Resources Yaxtché Silver Deposit, El Quevar Property, Salta Province, Argentina: technical report prepared by Pincock, Allen and Holt for Golden Minerals Company, effective date 8 June, 2012

Company Logo
Name of Project Location of Project (Province/State/Department, Country)
NI 43-101 Technical Report
Page 27-3
October 2018 Project Number: 196410
Golden Minerals, 2018: Golden Minerals Announces New Resource Estimate at El Quevar’s Yaxtché Deposit: news release prepared by Golden Minerals, 26 February 2018.
Hardy, M.P. and Agapito, J.F.T.,1975: Pillar Design in Underground Oil Shale Mines: in Design Methods in Rock Mechanics, Proc. 16th U. S. Symp. Rock Mech. 22 Sep 1975, Minneapolis, ed. C. Fairhurst and S. L. Crouch, ASCE: New York. pp 257–266.
Hazen Research Inc., 2010: Comminution Testing: report prepared for Bob Blakestad, Golden Minerals Company, May 28, 2010, 20 p.
Heredia, F., Lede Pizzurno, M.L., and Olcese, M., 2017: Getting the Deal Through: Mining, Argentina: https://gettingthedealthrough.com/area/22/jurisdiction/4/mining-argentina/
JKTech Pty Ltd., 2010: SMC Test Report on Three Samples from Minera El Quevar SA Project (tested at Hazen Research Inc., Golden, Colorado, USA): report prepared for Minera El Quevar SA, April 2010, 29 p.
Lewis, W.J., and San Martin, A.J., 2010: NI 43-101 Technical Report and Updated Mineral Resource Estimate for the Yaxtché Silver Deposit El Quevar Project Salta Province, Argentina: report prepared by Micon International for Golden Minerals Company, effective date 10 August, 2010.
Mach, L., Hollenbeck, P., Bair, D., Kuestermeyer, A., 2009: NI 43-101 Technical Report on Resources Apex Silver Mines Corporation El Quevar Project Argentina: report prepared by SRK Consulting for Apex Silver, effective date January 31, 2009.
Mineral Resources Engineering, 2018: El Quevar Preliminary Random Room and Pillar Mine Plan: internal report from Mineral Resources Engineering to Golden Minerals, March 2018.
Nicholas, D.E., 1976: Underground Mine Pillar Design Utilizing Rock Mass Properties, Marble Peak, Pima County, Arizona: MSc thesis, University of Arizona, https://repository.arizona.edu/handle/10150/566480.
Norini, G., Baez, W., Becchio, R., Viramonte, J., Giordano, G., Arnosio, M., Pinto, A., and Groppelli, G., 2013: The Calama-Olacapato-El Toro fault system in the Puna Plateau, Central Andes: Geodynamic Implications and Stratovolcanoes Emplacement: Tectonophysics, 2013.
Parravicini, D., 2014: Mining in Argentina: Overview: report posted to https://content.next.westlaw.com/Document/I7f851a6c038511e498db8b09b4f043e0
Company Logo
Name of Project Location of Project (Province/State/Department, Country)
NI 43-101 Technical Report
Page 27-4
October 2018 Project Number: 196410
Queens University, 2018: MineWiki, Queen's Mine Design Project Wiki: http://minewiki.engineering.queensu.ca/mediawiki/index.php/Main_Page.
Radouane, N., Boukelloul, M., and Fredj, M., 2015: Stability Analysis of Underground Mining and their Application on the Mine Chaabte El Hamra, Algeria: Procedia Earth and Planetary Science, Volume 15, 2015, pp. 237–243.
Rideout, M., Unger, N., Langer, K., and Torres, S., 2008: Geophysical Report on: 3D Off-set Pole Dipole Survey at El Quevar Project, Salta Province, Argentina: report prepared by Quantec Geoscience Argentina SA for Silex Argentina, SA, report No. QGA-249.
Robert J. Loewen & Associates, 2010: Prefeasibility Study Market Assumptions: El Quevar Silver Concentrates, June 23, 2010, 3 p.
Seibel, G., Colquhoun, W., and Rehn, W, 2018: El Quevar Project, Salta Province, Argentina, NI 43-101 Technical Report on Updated Mineral Resource Estimate: technical report prepared by Amec Foster Wheeler for Golden Minerals Company, effective date 26 February, 2018
Sillitoe, R., 1975: Lead-Silver, Manganese, and Native Sulfur Mineralization within a Stratovolcano, El Queva, Northwest Argentina: Economic Geology, Vol. 70 pp. 1190–1201.
Sillitoe. R.H., and Hedenquist, J.W., 2003: Linkages Between Volcanotectonic Settings, Ore Fluid Compositions, and Epithermal Precious Metal Deposits: Society of Economic Geologists Special Publication 10, pp. 315–343.
Simmons, S.F., White, N.C., and John, D.A., 2005: Geological Characteristics of Epithermal Precious and Base Metals Deposits: Economic Geology 100th Anniversary Volume, pp. 485–522.
Spurney, J.C., Chacon, J.C., and Serna, G., 2013: Exploration Opportunities and Potential Drill Targets, El Quevar Epithermal Silver Project, Salta Province, Argentina: report for Golden Minerals Company.
Stacey, T.R. and Page, C.H., 1986: Practical Handbook for Underground Rock Mechanics: Trans Tech, 1986, vol 12 of series, 144 p.
Williams, N.C., and Davidson, G.J., 2004: Possible Submarine Advanced Argillic Alteration at the Basin Lake Prospect, Western Tasmania, Australia: Economic Geology v. 99, pp. 987–1002.