Large-scale purification and characterisation of pea globulins
Upload
independentCategory
view
3download
0
M. Le Gall, L. Quillien, B. Sève, J. Guéguen and J. P. Lallèslectin and albumin pea albumin 2
Weaned piglets display low gastrointestinal digestion of pea ( Pisum sativum L.)
published online June 12, 2007J ANIM SCI
http://jas.fass.org/content/early/2007/06/12/jas.2006-795.citationlocated on the World Wide Web at:
The online version of this article, along with updated information and services, is
www.asas.org
by guest on May 18, 2011jas.fass.orgDownloaded from
1
Running title: Resistance to digestion of pea protein1
2
Weaned piglets display low gastrointestinal digestion of pea (Pisum sativum L.) lectin 3
and albumin pea albumin 214
5
M. Le Gall,†*2 L. Quillien,‡ B. Sève,† J. Guéguen,* and J. P. Lallès†6
7
†INRA, UMR 1079, Systèmes d’Elevage, Nutrition Animale et Humaine, Domaine de la 8
Prise, 35590 Saint-Gilles, France; *INRA, Unité de Recherche Biopolymères, Interactions, 9
Assemblages, Rue de la Géraudière, 44072 Nantes, France; and ‡INRA, Unité de 10
Recherche Génétique et Ecophysiologie des Légumineuses à graines, Domaine d’Epoisses, 11
Bretenières, 21065 Dijon, France12
13
1Financial support for this study was provided by the Regions of Bretagne and Pays 14
de la Loire (Pôle Agronomique Ouest), France. The authors thank P. Touanel for care of 15
experimental animals.16
2Corresponding author: [email protected]
Page 1 of 35 Journal of Animal Science
Published Online First on June 12, 2007 as doi:10.2527/jas.2006-795 by guest on May 18, 2011jas.fass.orgDownloaded from

2
ABSTRACT: A study was conducted to investigate the biochemistry of digestion of field 18
pea (Pisum sativum L.) albumins and globulins in the stomach and along the small 19
intestine of weaned piglets with a particular emphasis on the respective roles of these 20
compartments in pea protein digestion. Twenty four piglets were weaned at 28 d of age. 21
They were allocated to 2 diets (control and pea) and 3 slaughter times (3, 6, or 9 h after the 22
last meal) in a 2 x×3 factorial arrangement of treatments in a randomized complete block 23
design. Pea flour provided 30% of total dietary protein in the pea diet. The diets were fed 24
for 2 wk after weaning. After slaughter, gastrointestinal tract compartments were weighed, 25
digesta collected, and pH measured. Digesta from the stomach and proximal, mid, and 26
distal small intestine (SI) were extracted for soluble proteins and analyzed for specific pea 27
proteins using SDS-PAGE, immunoblotting, and mass spectrometry. Tissue weight of the 28
whole gastrointestinal tract (GIT; P = 0.015), cecum (P < 0.001), and colon (P < 0.001) 29
was greater in the pea diet. Digesta pH in the stomach and distal SI was lower (P = 0.02) in 30
the pea diet than the control diet. In the stomach, vicilin, lectin, and pea albumin 2 (PA2) 31
were not digested, while legumin was only partly digested. Legumin and vicilin were 32
totally digested in the SI in less than 3 h. A resistant peptide of 15 kDa located at the N-33
terminus of PA2 was transiently detected at 3 h. A protein band at 20 kDa was consistently 34
identified as lectin. It was present in high intensity in intestinal digesta of pea-fed piglets at 35
all times after the meal compared with those fed the control diet (P < 0.001). Various 36
proteins of, presumably, endogenous origin, displayed differential digestion patterns 37
between the control and the pea-fed piglets (P < 0.05). In conclusion, differences in 38
digestion between specific pea proteins were observed along the GIT of piglets. They 39
could be partly explained by differences in protein digestion in the stomach.40
Key words: albumin, digestion, globulin, pea protein, pig41
Page 2 of 35Journal of Animal Science
by guest on May 18, 2011jas.fass.orgDownloaded from

3
INTRODUCTION42
Field peas can be an alternative to soybean meal in diets for nonruminant animals. 43
However, diets with high levels of incorporation of field peas (Pisum sativum L.) usually 44
depress growth performance, especially in young animals (Gatel et al., 1994). Field peas 45
are rich in Lys but deficient in sulfur AA and Trp. Moreover, the digestibility of plant 46
protein has often been regarded to be lower than that of animal protein, which has 47
generally been attributed to the presence of anti-nutritional factors, including lectins, 48
protease inhibitors, and tannins (Lallès and Jansman, 1998). Field peas contain the trypsin-49
chymotrypsin inhibitors of the Bowman-Birk family, which have 14 cysteine residues, all 50
involved in disulfide bridges (Ferrasson et al., 1995). Protease inhibitors (PI) form a 51
complex with pancreatic proteases and inactivate them. These proteases are also resistant 52
to digestion, an observation that may contribute to explain the lower digestibility of sulfur 53
AA in pigs (Mariscal-Landin et al., 2002).54
Protein hydrolysis of field peas also is influenced by the protein structure. They fall 55
within 2 categories, namely globulins (55 to 65% of CP) and albumins (20 to 25% CP). 56
They are soluble in saline solutions of low ionic strength and water, respectively. 57
Globulins include legumin, vicilin, and convicilin. The albumin fraction consists of lectin, 58
pea albumin 1 and 2 (PA1 and PA2), PI, and lipoxygenases. Globulins seem to be more 59
digestible than albumins in various animal species (Carbonaro et al., 2000; Crevieu et al., 60
1997; Rubio et al., 1991). The consumption of field peas increases the ileal output of 61
endogenous proteins in pigs (Le Gall et al., 2005a). 62
However, little is known on the time-course of protein digestion along the 63
gastrointestinal tract (GIT), a factor that might contribute to differences in the degree of 64
hydrolysis among proteins at the ileal level. Therefore, we conducted a study to investigate 65
the post-prandial changes in pea protein digestion along the GIT in weaned piglets.66
Page 3 of 35 Journal of Animal Science
by guest on May 18, 2011jas.fass.orgDownloaded from

4
MATERIALS AND METHODS67
Diets68
Two diets were formulated and their composition is given in Table 1. The control 69
(C) diet contained a mixture of skim-milk powder and fish soluble protein concentrate as 70
the sources of CP. Thirty percent of CP from this mixture was replaced by field pea flour 71
in the pea diet (P). The seeds were ground using a hammer mill prior to being incorporated 72
into the feed. The diets were balanced for CP, indispensable amino acids, with appropriate 73
DL-Met, L-Thr, and L-Trp supplements and NE values (Sève, 1994). The Baccara spring 74
pea cultivar was chosen because of its low content in trypsin inhibitors (Grosjean et al., 75
2000). It was produced locally at INRA (Station d'Amélioration des Plantes, Le Rheu, 76
France). 77
Animals and Feeding78
The experiment was conducted under the guidelines of the French Ministry of 79
Agriculture for animal research. The experimental design was a randomized complete 80
block design with a 2 × 3 factorial arrangement of 2 diets (control vs. pea) and 3 slaughter 81
times after the last meal (3, 6, and 9 h). Four litters of crossbred piglets [ Pietrain ×82
(Landrace × Large White)] were weaned at 28 d of age. Four blocks of 6 littermates were 83
formed on the basis of piglet BW, regardless of gender. The initial BW of the piglets in the 84
control and pea group was 8.0 ± 0.8 kg and 8.1 ± 0.9 kg, respectively. They were randomly 85
assigned to treatments within litters, housed in individual cages, and fed either of the 286
diets for 2 wk after weaning. The feed was given as a mash (meal to water ratio of 2:1 by 87
weight) twice daily (0900 and 1530) at a rate of 650 kJ · (BW in kg)0.75. Body weights 88
were recorded weekly, and feeding schedules were adjusted accordingly. The piglets had 89
free access to water. The piglets from 2 litters were slaughtered on d 13 and the piglets 90
from the 2 other litters on d 14 after weaning. Each day the slaughter h was randomly 91
Page 4 of 35Journal of Animal Science
by guest on May 18, 2011jas.fass.orgDownloaded from

5
assigned within litters. It took place at 3, 6, or 9 h after the morning meal. The piglets were 92
killed by electronarcosis and exsanguination. 93
Digesta Collection94
Immediately after slaughter, the GIT was removed, dissected, and divided into 795
segments: stomach, 3 equal parts in length of the small intestine (SI; proximal, mid, and96
distal), cecum, and first and second halves in length of the colon. Each segment was 97
weighed and emptied. The total amount of digesta in each segment was collected, mixed 98
thoroughly, and the pH was measured. A solution of preservatives [15 mM EDTA, 1 mM99
sodium azide, and 2 mM phenylmethylsulfonyl fluoride] was then mixed with the digesta 100
to limit enzyme and bacterial activities. The digesta were then frozen at -20°C, and101
subsequently freeze-dried, weighed, finely ground, and stored at 4°C until analysis.102
Chemical and Biochemical Analyses103
The diets were analyzed for DM, minerals, N, and AA as previously described (Le 104
Gall et al., 2005a). The freeze-dried digesta samples were analyzed for DM and N 105
contents. Protein was extracted from the diets and the stomach content by stirring in 16 106
mM Tris-HCl buffer containing 140 mM SDS with pH 8 for 90 min at room temperature 107
(10 g diet/L buffer; 50 g gastric digesta/L buffer). Protein was extracted from the digesta 108
from each part of SI by stirring in 100 mM H3BO3, 150 mM NaCl with pH 8 for 90 min at 109
room temperature (200 g digesta/L buffer). These buffers were previously shown to 110
maximize the solubilization of proteins (Bush et al., 1992). The samples were then 111
centrifuged at 12,000 × g for 10 min at room temperature. The supernatants were collected 112
and stored at -20°C until SDS-PAGE analysis and immunoblotting. Protein in the 113
supernatants was determined by the bichinchonimic acid micromethod (Pierce, Rockford, 114
IL).115
SDS-PAGE Electrophoresis, Densitometry, and Immunoblotting116
Page 5 of 35 Journal of Animal Science
by guest on May 18, 2011jas.fass.orgDownloaded from

6
The SDS-PAGE procedures used were previously described in detail (Le Gall et al., 117
2005a). Protein extracts from gastric digesta, anterior intestinal digesta (proximal and mid118
SI), and posterior intestinal digesta (distal SI) were diluted 10-, 3-, and 2-fold, respectively, 119
with appropriate buffers. The amounts of protein loaded on the gels were 20, 50, and 200 120
µg per well for the CP extracts, gastric , and SI digesta extracts, respectively. Gels with 121
blue-stained proteins from SI digesta were scanned. Densitometry measurements were 122
performed using image analysis (Amount One, version 4.1, Biorad Laboratories, Hercules, 123
CA) and analyzed as described by Salgado et al. (2002). Densitometry profiles were 124
converted into arbitrary density unit (DU) and were expressed in DU/g of digesta protein 125
corresponding to the amount of protein, which was deposited on each track on the gel.126
Because SDS-PAGE patterns of proteins were generally similar among the 4 piglets fed a 127
given diet and slaughtered at the same time after the meal, only 1 representative illustration 128
is given on the figures. However, densitometry analysis was performed for all the 129
individual digesta at each site of the SI.130
Prior to immunoblotting, proteins separated by SDS-PAGE were electro-transferred 131
onto nitrocellulose membranes and were probed with rabbit antibodies for detecting 132
specifically pea legumin, vicilin, lectins, and PA2, as previously described (Le Gall et al., 133
2005a). Rabbit antibodies were detected with an anti-rabbit IgG antibody conjugated with 134
an enzyme. The membrane was incubated with the enzyme substrate.135
Immunoprecipitation and Sequencing of Indigested PA2 Polypeptides136
The protein A technology for purifying proteins using specific antibodies (Ghose et 137
al., 2005) was applied for concentrating digestion polypeptides from PA2 in anterior 138
intestinal digesta (distal SI). Briefly, some components of digesta that interacted 139
nonspecifically with protein A were removed after incubating protein A beads (20333; 140
Pierce) with soluble proteins from distal SI digesta (prepared as explained above) for 2 h at 141
Page 6 of 35Journal of Animal Science
by guest on May 18, 2011jas.fass.orgDownloaded from

7
4°C under gentle rotation and then centrifugation. The supernatant was incubated 142
overnight at 4°C with the anti-PA2 antibodies (also used for immunoblotting) for PA2-143
anti-PA2 antibody complex formation. Then the protein A beads were added to the mixture 144
and incubated for further 2 h at 4°C under gentle rotation. The resulting PA2-antibody 145
complex adsorbed on the beads was washed extensively with ice-cold phosphate buffer 146
saline (pH 7.4; 136 mM NaCl, 2.68 mM KCl, 1.46 mM KH2PO4, and 8.1 mM Na2HPO4). 147
The complex was eluted in the SDS-PAGE sample loading buffer prior to being separated 148
by SDS-PAGE and revealed by immunoblotting as described above for digesta samples. 149
After transfer to nitrocellulose membranes, the indigested PA2 polypeptides were detected 150
in 1 lane using the same anti-PA2 antibodies. The polypeptide chains from the anti-PA2 151
antibodies were revealed in an adjacent lane with a goat anti-rabbit IgG antibodies 152
conjugated to horseradish peroxidase (170 6515; Biorad Laboratories, Hercules, CA) and 153
addition of the peroxidase staining mixture (2.2 M 4-chloro-naphtol and 0.02% hydrogen 154
peroxide in 1:10 methanol, and phosphate saline buffer). The specific PA2 bands were then 155
identified on the SDS-PAGE gels and sequenced using liquid chromatography-mass 156
spectrometry/mass spectrometry (LC-MS/MS) as previously reported (Le Gall et al., 157
2005a). Briefly, bands of interest were excised from blue-stained gel. Then, they were 158
submitted to digestion with trypsin. Extracted peptides were separated by reverse phase 159
chromatography and analyzed after fragmentation in MS-MS to be consistent. Mass data 160
collected during LC-MS/MS analysis were processed with Protein Lynx Global Server 161
software (Waters; Milford, MA). Protein identification was performed by searching the 162
peptide masses and MS/MS sequence stretches against the Swiss-Prot (Swiss Institute of 163
Bioinformatics, Switzerland) and National Center for Biotechnology Information 164
(Bethesda, MD) non-redundant sequence databank.165
Statistical Analysis166
Page 7 of 35 Journal of Animal Science
by guest on May 18, 2011jas.fass.orgDownloaded from

8
The experimental unit was the piglet. The data were analyzed as a randomized 167
complete block design using the GLM procedure (SAS Inst. Inc., Cary, NC). Variance 168
analysis was performed for testing the effects of diet, time after the last meal, litter, and 169
interaction between diet and time after the meal. Orthogonal contrasts were used to test 170
linear and quadratic effects of time, and the interaction was partitioned into a linear effect 171
of time × diet and a quadratic effect of time x diet.172
RESULTS173
All the piglets were in good health throughout the experiment. The diets were well 174
consumed. No difference in feed intake or BW gain was observed among treatments during 175
the experimental period (Table 2).176
The whole GIT was heavier in the piglets fed the pea diet compared to the control 177
(P = 0.015; Table 3). The difference was accounted for by the weight of the cecum (P < 178
0.001) and the large intestine (P < 0.001).179
The residual DM present in the stomach of piglets at slaughter decreased linearly (P180
< 0.001) and quadratically with time (P = 0.05; Table 4). Three hours after the meal, 51 181
and 56% of DM intake was emptied from the stomach and 15 and 12% of DM intake was 182
still present in the stomach 9 h after the last meal for control and pea groups, respectively. 183
No interaction between the type of diet and the digestion time was observed, and there was 184
no effect of the diet. In contrast, gastric pH was decreased in the pea than with the control 185
diet (P = 0.02). It decreased linearly (P < 0.001) with time. There was a tendency (P = 186
0.06) for a time × diet interaction for digesta pH in the proximal SI, which was caused by a 187
sharp decrease with time in the control group compared with the pea group (linear effect of 188
time × diet, P = 0.02). The pH in the mid SI was more variable and not affected by the 189
tested factors. Digesta pH in the distal SI was decreased with the pea as compared to the190
Page 8 of 35Journal of Animal Science
by guest on May 18, 2011jas.fass.orgDownloaded from

9
control diet (P = 0.02) without effect of time.191
SDS-PAGE, Densitometry, and Immunoblotting Analyses of Digesta192
Digestion in the Stomach. The SDS-PAGE gels stained for proteins showed quite 193
different banding patterns between the control and the pea diets (Figure 1A). Low numbers 194
of protein bands were detected in gastric digesta after 9 h as compared to those present in 195
the diet extract. Many of them were not present in the feed, so they were most probably 196
hydrolyzed dietary proteins or of endogenous origin.197
Western blotting showed the presence of vicilin and convicilin in the pea diet, but 198
not in the control (Figure 1Ba). Vicilin proteins of molecular weight (MW) of 50 and 33 199
kDa, and smaller vicilin polypeptides were transiently observed at 3 h, but not afterward. 200
The band of convicilin was still present at 3 h in the digesta of some pigs, but it 201
disappeared thereafter. Legumin was revealed in the pea diet as 2 major bands (α-major 202
and β polypeptides) of MW of 40 and 20 kDa, respectively (Figure 1Bb). These bands and 203
a cleaved α-polypeptide were still clearly observed in gastric digesta 3 h after the meal. By 204
6 h, only legumin polypeptides of MW equal to or smaller than 30 kDa were detected. 205
These were no longer present at 9 h after the meal. Only the β subunit of pea lectin was 206
seen at a MW of 17 kDa in the pea diet and in gastric digesta 3 h after the meal but not 207
thereafter (Figure 1Bc). The α subunit of lectin was not detected by antibodies. Pea 208
albumin 2 was detected at a MW of 26 kDa in the pea diet and corresponding digesta at 3 h 209
after the meal but not thereafter (Figure 1Bd). Cleaved PA2 peptides of MW between 17 210
and 25 kDa were transiently observed at 3 h. 211
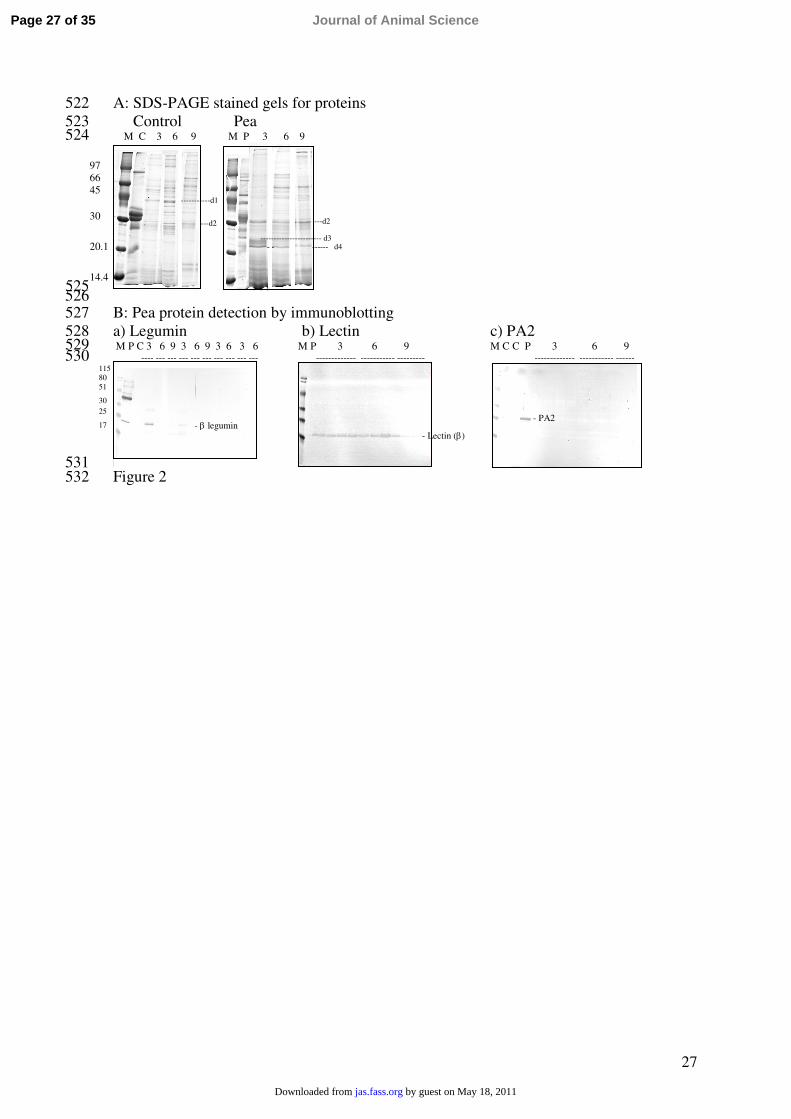
Digestion in the Small Intestine. The patterns of proteins observed in the proximal 212
SI were characterized by a high number of protein bands (Figure 2A). Densitometry data213
with statistically significant effects of time or diet or both are presented in Table 5. At 214
proximal SI, the density of 4 bands (noted d1 to d4) was affected by the diet. The density 215
Page 9 of 35 Journal of Animal Science
by guest on May 18, 2011jas.fass.orgDownloaded from

10
of band d1 was decreased (P = 0.003), while band d2 was greater in the pea group 216
compared to the control (P = 0.006) without effect of time. Band d3 was virtually absent in 217
the control piglets regardless of time, while its density decreased sharply between 3 and 6 h 218
over time in the pea-fed piglets (time linear × diet, P = 0.002; time quadratic × diet, P = 219
0.036). Band d4 was absent in the control group while its density was high in the pea group220
(P = 0.001) regardless of time. The resistance of lectin to digestion in the proximal SI was 221
confirmed by immunoblotting (Figure 2Bb). Legumin was detected as the β-polypeptide 222
only at 3 h and only in one piglet (Figure 2Ba). Pea albumin 2 was not evidenced by 223
immunoblotting in the proximal SI (Figure 2Bc). Finally, vicilin or digestion fragments 224
were not detected in the proximal SI (data not shown). 225
After SDS-PAGE of proteins in digesta of the mid SI, 6 protein bands (noted j1 to 226
j6; Table 5) with visually contrasted staining densities (Figure 3A) had their intensity227
influenced by the diet. An effect of time was noted for bands j4 and j5 (P = 0.023 and P = 228
0.054, respectively). The intensity decreased linearly from 3 to 9 h for band j4 (P = 0.024), 229
but the variation was quadratic with a greater value at 6 h for j5 (P = 0.07). The protein 230
band j6 was identified by immunoblotting as being lectin (Figure 3Aa). There was a time ×231
diet interaction in band j6 intensity (time linear × diet, P = 0.011; time quadratic × diet, P = 232
0.031), which was caused by the absence of this band in digesta from the control diet and 233
by its high intensity at 3 and 6 h after the meal and a decrease between 6 and 9 h in the pea 234
diet. Immunoblotting of digesta from the mid SI confirmed the presence of lectin at all 235
times (3, 6, and 9 h) after the meal in the pea-fed piglets (Figure 3Ba; Table 5). The whole 236
PA2 molecule was not detected but a polypeptide of MW of 15 kDa was revealed at 3 h 237
(Figure 3Bb). Neither vicilin nor legumin were detected in the digesta of the mid-SI (data 238
not shown). 239
Page 10 of 35Journal of Animal Science
by guest on May 18, 2011jas.fass.orgDownloaded from
11
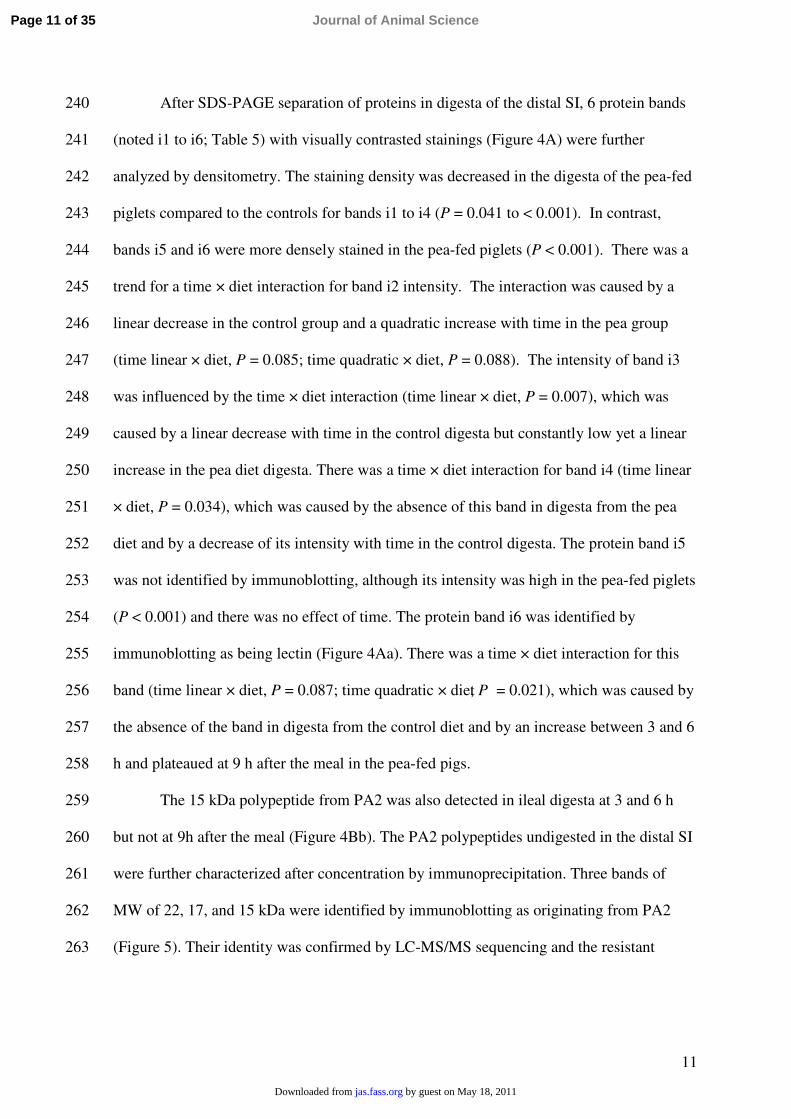
After SDS-PAGE separation of proteins in digesta of the distal SI, 6 protein bands 240
(noted i1 to i6; Table 5) with visually contrasted stainings (Figure 4A) were further 241
analyzed by densitometry. The staining density was decreased in the digesta of the pea-fed 242
piglets compared to the controls for bands i1 to i4 (P = 0.041 to < 0.001). In contrast, 243
bands i5 and i6 were more densely stained in the pea-fed piglets (P < 0.001). There was a 244
trend for a time × diet interaction for band i2 intensity. The interaction was caused by a 245
linear decrease in the control group and a quadratic increase with time in the pea group 246
(time linear × diet, P = 0.085; time quadratic × diet, P = 0.088). The intensity of band i3 247
was influenced by the time × diet interaction (time linear × diet, P = 0.007), which was 248
caused by a linear decrease with time in the control digesta but constantly low yet a linear 249
increase in the pea diet digesta. There was a time × diet interaction for band i4 (time linear250
× diet, P = 0.034), which was caused by the absence of this band in digesta from the pea 251
diet and by a decrease of its intensity with time in the control digesta. The protein band i5 252
was not identified by immunoblotting, although its intensity was high in the pea-fed piglets253
(P < 0.001) and there was no effect of time. The protein band i6 was identified by 254
immunoblotting as being lectin (Figure 4Aa). There was a time × diet interaction for this 255
band (time linear × diet, P = 0.087; time quadratic × diet, P = 0.021), which was caused by 256
the absence of the band in digesta from the control diet and by an increase between 3 and 6 257
h and plateaued at 9 h after the meal in the pea-fed pigs.258
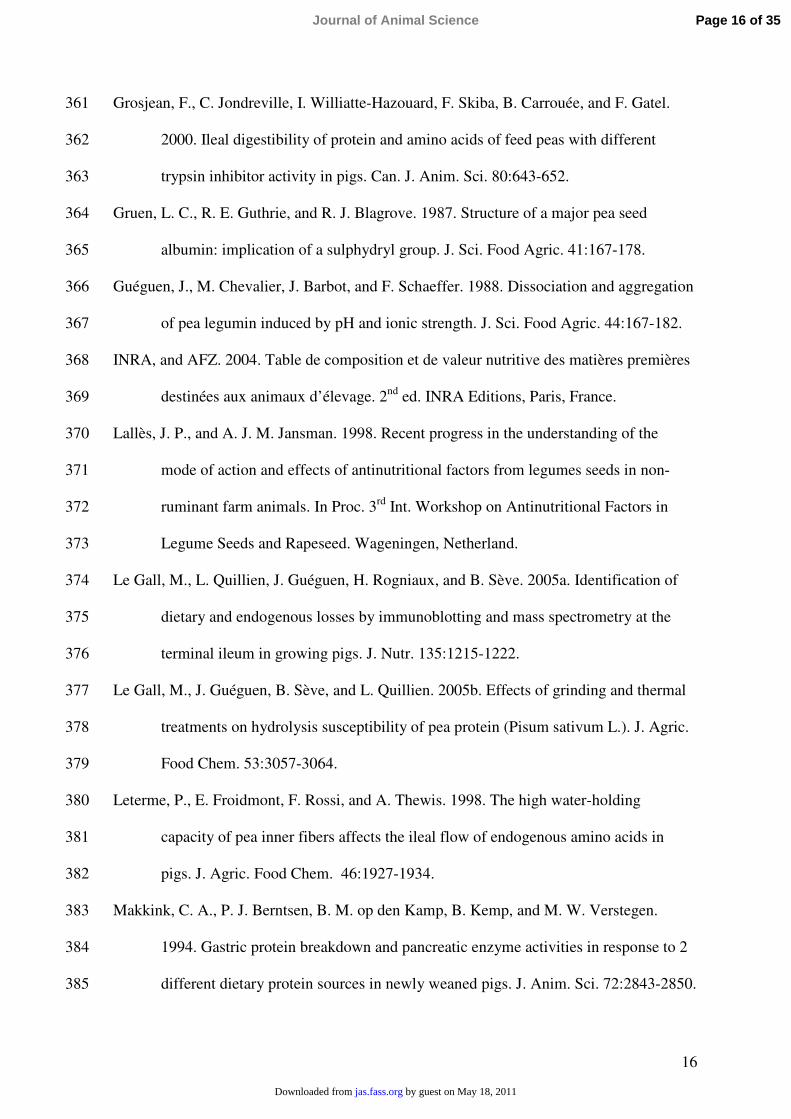
The 15 kDa polypeptide from PA2 was also detected in ileal digesta at 3 and 6 h 259
but not at 9h after the meal (Figure 4Bb). The PA2 polypeptides undigested in the distal SI 260
were further characterized after concentration by immunoprecipitation. Three bands of 261
MW of 22, 17, and 15 kDa were identified by immunoblotting as originating from PA2 262
(Figure 5). Their identity was confirmed by LC-MS/MS sequencing and the resistant 263
Page 11 of 35 Journal of Animal Science
by guest on May 18, 2011jas.fass.orgDownloaded from

12
peptides of PA2 were essentially localized on the AA sequence of the PA2 molecule in the 264
N- terminus (data not shown).265
DISCUSSION266
The present results confirm our previous observations in growing pigs: 1) pea 267
globulins are well digested, 2) PA2 is only partially digested, 3) a PA2 resistant 268
polypeptide of MW of 15 kDa is present, and 4) lectin is totally resistant to GIT digestion 269
(Le Gall et al., 2005a). The major point of this work is that such differences in intestinal 270
digestion between pea proteins originate in the stomach. 271
Digestion of Pea Protein along the Gastrointestinal Tract of Piglets272
The gastric digestion seems to be the important step for the pea protein hydrolysis, 273
in accordance with the results obtained after in vitro hydrolysis of different pea cultivars274
(Perrot et al., 1999). Indeed, peptides from PA2 digestion were detected in intestinal 275
digesta a short time (less than 3 h) after the meal. During this short period, gastric pH did 276
not seem to be adequate for protein digestion. It was high (pH > 4.5) compared to the 277
optimal pH for pepsin action (pH 2 to 4; Beynon and Bond, 1989). This may reflect the 278
fact that gastric pH of piglets soon after weaning is greater than in older pigs (Makkink et 279
al., 1994). The amounts of gastric secretion are the greatest only 1.5 to 2.5 h after the meal280
(Cranwell, 1985), and the inefficiency of pepsin hydrolysis may be responsible for the low 281
digestion of pea proteins. Indeed, the dissociation-association behavior of the polypeptides 282
from pea legumin is influenced by pH. Between pH 3.5 and 5.8, most of the protein is in 283
the form of aggregates preventing pepsin access. Below pH 3.4, legumin is completely 284
dissociated and its polypeptide chains are unfolded (Guéguen et al., 1988). These 285
conditions were met after 6 h of gastric digestion, and the β-polypeptides forming the 286
hydrophobic core of legumin were not protected. Their greater resistance to hydrolysis 287
Page 12 of 35Journal of Animal Science
by guest on May 18, 2011jas.fass.orgDownloaded from

13
compared to that of the α-polypeptides may also be due to their highly ordered structure288
(Subirade et al., 1994) and greater hydrophobicity. 289
Convicilin is easily hydrolyzed by pepsin, even at pH > 4.5, but vicilin is resistant 290
under these conditions. This differential susceptibility to hydrolysis between convicilin and 291
vicilin, shown in vitro (Le Gall et al., 2005b), is also observed in the chicken (Crevieu et 292
al., 1997). In the present study, vicilin had disappeared after 6 h of gastric digestion. In the 293
digesta collected 3 h after the meal, vicilin was probably quite insoluble due to the greater294
pH (5.0-6.0; Rangel et al., 2003). Then, it may have become totally soluble during the 295
gastric phase at pH < 3.0. Consequently, vicilin may have been more easily emptied from 296
the stomach with the liquid phase and would no longer be detected in the stomach. 297
Pea protein digestion in the SI seemed to be more efficient in pigs than in other 298
animal species. Indeed, in rats and chicken, only the α-polypeptides of legumin were 299
degraded, the β-polypeptides being totally resistant (Aubry et al., 1986; Crevieu et al., 300
1997). The albumin PA2 was shown to resist trypsin hydrolysis in vitro (Gruen et al., 301
1987; Perrot et al., 1999) and SI digestion in chickens (Crevieu et al., 1997). In young 302
piglets used in the present study and growing pigs used in an earlier study (Le Gall et al. , 303
2005a), we observed a cleaved peptide of MW 15 kDa in digesta of the mid and distal SI. 304
These data indicate that a part of PA2 is susceptible to digestion in the gut of mammals, as 305
opposed to birds. 306
Endogenous Protein307
Many proteins present in GIT digesta are of endogenous origin and mainly consist 308
of enzymes and antibodies according to the literature. These proteins themselves could be 309
partly or totally degraded and reabsorbed during the digestion process. Proteins of greater310
MW may correspond to glucoamylase or pancreatic alpha-amylase, or both, as previously 311
identified at the terminal ileum of growing pigs (Le Gall et al. , 2005a). Proteins of 312
Page 13 of 35 Journal of Animal Science
by guest on May 18, 2011jas.fass.orgDownloaded from

14
intermediary MW may be fragments of antibodies (Le Gall et al., 2005a) and proteins of 313
the pancreatic serine protease family (trypsin and chymotrypsin; Salgado, et al., 2002).314
Surprisingly, many of these endogenous proteins were present less in digesta after pea 315
consumption, but this may be explained by our analytical method. Indeed, the same 316
amount of indigestible soluble protein was deposited in each track of gels. Therefore, a 317
lower proportion of endogenous protein in the digesta did not indicate that the ileal flow of 318
endogenous protein was lower. A greater proportion of dietary undigested protein, like 319
lectins in the pea digesta, will result in a lower proportion of endogenous protein. Indeed, 320
based on the published tables (INRA-AFZ, 2004), the ileal digestibility of pea protein 321
seems to be lower than of milk and fish protein. These differences are due to the presence 322
of PI and lectin, which are known to increase the ileal flow of dietary protein, while the 323
same components and fiber increase the endogenous losses. At the ileum, only 1 band (i5) 324
was present in digesta after pea consumption. This band was previously identified as 325
corresponding to proteins of the pancreatic serine protease family (Salgado et al., 2002). 326
Greater endogenous losses with pea-based diets have been ascribed to cotyledon cell-wall 327
fiber displaying a high water holding capacity (Leterme et al., 1998).328
In this study, the major storage pea proteins, vicilin and legumin, were rapidly 329
broken down in the stomach and were subsequently digested in the SI of piglets. Lectin 330
remained virtually intact throughout the stomach and SI. The pea albumin PA2 transiently 331
survived as a 15 kDa peptide located at the N-terminus of the molecule. This may 332
contribute to the lower digestibility and availability of sulfur AA in pigs fed diets based on 333
field peas because pea albumins are rich in these AA. To improve the use of field peas in 334
pig diets, cultivars with a high globulin to albumin ratio should be used.335
Page 14 of 35Journal of Animal Science
by guest on May 18, 2011jas.fass.orgDownloaded from

15
LITERATURE CITED336
Aubry, M., and P. Boucrot. 1986. Comparative study on the digestion of radiolabelled 337
vicilin, legumin, and lectin of Pisum sativum in the rat. Ann. Nutr. Metab. 30:175-338
182.339
Beynon, R. J., and J. S. Bond. 1989. Proteolytic Enzymes. A Practical Approach. IRL 340
Press, Oxford, UK.341
Bush, R. S., R. Toullec, I. Caugant, and P. Guilloteau. 1992. Effects of raw pea flour on 342
nutrient digestibility and immune response in the preruminant calf. J. Dairy Sci. 343
75:3539-3552.344
Carbonaro, M., G. Grant, M. Cappelloni, and A. Pusztai. 2000. Perspectives into factors 345
limiting in vivo digestion of legume proteins: antinutritional compounds or storage 346
proteins? J. Agric. Food Chem. 48:742-749.347
Cranwell, P. D. 1985. The development of acid and pepsin (EC 3.4.23.1) secretory 348
capacity in the pig; the effects of age and weaning. 1. Studies in anaesthetized pigs. 349
Br. J. Nutr. 54:305-320.350
Crevieu, I., B. Carre, A. M. Chagneau, L. Quillien, J. Guéguen, and S. Berot. 1997. 351
Identification of resistant pea (Pisum sativum L) proteins in the digestive tract of 352
chickens. J. Agric. Food Chem. 45:1295-13.353
Ferrasson, E., L. Quillien, and J. Guéguen. 1995. Amino acid sequence of a Bowman-Birk 354
proteinase inhibitor from pea seeds. J. Protein Chem. 14:467-475.355
Gatel, F. 1994. Protein quality of legume seeds for non-ruminant animals: a literature 356
review. Anim. Feed Sci. Technol. 45:317-348.357
Ghose, S., M. Allen, B. Hubbard, C. Brooks, and S. M. Cramer. 2005. Antibody variable 358
region interactions with Protein A: implications for the development of generic 359
purification processes. Biotechnol. Bioeng. 92:665-73.360
Page 15 of 35 Journal of Animal Science
by guest on May 18, 2011jas.fass.orgDownloaded from
16
Grosjean, F., C. Jondreville, I. Williatte-Hazouard, F. Skiba, B. Carrouée, and F. Gatel. 361
2000. Ileal digestibility of protein and amino acids of feed peas with different 362
trypsin inhibitor activity in pigs. Can. J. Anim. Sci. 80:643-652.363
Gruen, L. C., R. E. Guthrie, and R. J. Blagrove. 1987. Structure of a major pea seed 364
albumin: implication of a sulphydryl group. J. Sci. Food Agric. 41:167-178.365
Guéguen, J., M. Chevalier, J. Barbot, and F. Schaeffer. 1988. Dissociation and aggregation 366
of pea legumin induced by pH and ionic strength. J. Sci. Food Agric. 44:167-182.367
INRA, and AFZ. 2004. Table de composition et de valeur nutritive des matières premières 368
destinées aux animaux d’élevage. 2nd ed. INRA Editions, Paris, France.369
Lallès, J. P., and A. J. M. Jansman. 1998. Recent progress in the understanding of the 370
mode of action and effects of antinutritional factors from legumes seeds in non-371
ruminant farm animals. In Proc. 3rd Int. Workshop on Antinutritional Factors in 372
Legume Seeds and Rapeseed. Wageningen, Netherland.373
Le Gall, M., L. Quillien, J. Guéguen, H. Rogniaux, and B. Sève. 2005a. Identification of 374
dietary and endogenous losses by immunoblotting and mass spectrometry at the 375
terminal ileum in growing pigs. J. Nutr. 135:1215-1222.376
Le Gall, M., J. Guéguen, B. Sève, and L. Quillien. 2005b. Effects of grinding and thermal 377
treatments on hydrolysis susceptibility of pea protein (Pisum sativum L.). J. Agric. 378
Food Chem. 53:3057-3064.379
Leterme, P., E. Froidmont, F. Rossi, and A. Thewis. 1998. The high water-holding 380
capacity of pea inner fibers affects the ileal flow of endogenous amino acids in 381
pigs. J. Agric. Food Chem. 46:1927-1934.382
Makkink, C. A., P. J. Berntsen, B. M. op den Kamp, B. Kemp, and M. W. Verstegen. 383
1994. Gastric protein breakdown and pancreatic enzyme activities in response to 2384
different dietary protein sources in newly weaned pigs. J. Anim. Sci. 72:2843-2850.385
Page 16 of 35Journal of Animal Science
by guest on May 18, 2011jas.fass.orgDownloaded from

17
Mariscal-Landin, G., Y. Lebreton, and B. Sève. 2002. Apparent and standardised true ileal 386
digestibility of protein and amino acids from faba bean, lupin and pea, provided as 387
whole seeds, dehulled or extruded in pig diets. Anim. Feed Sci. Technol. 97:183-388
198.389
Perrot, C., L. Quillien, and J. Guéguen. 1999. Identification by immunoblotting of pea 390
(Pisum sativum L.) proteins resistant to in vitro enzymatic hydrolysis. Sci. Alim. 391
19:377-390.392
Rangel, A., G. B. Domont, C. Pedrosa, and S. T. Ferreira. 2003. Functional properties of 393
purified vicilins from cowpea (Vigna unguiculata) and pea (Pisum sativum), and 394
cowpea protein isolate. J. Agric. Food Chem. 51:5792-5797.395
Rubio, L. A., G. Grant, S. Bardocz, P. Dewey, and A. Pusztai. 1991. Nutritional response 396
of growing rats to faba beans (Vicia faba L., minor) and faba bean fractions. Br. J.397
Nutr. 66:533-542.398
Salgado, P., L. Montagne, J. P. Freire, R. B. Ferreira, A. Teixeira, O. Bento, M. C. Abreu, 399
R. Toullec, and J. P. Lallès. 2002. Legume grains enhance ileal losses of specific 400
endogenous serine-protease proteins in weaned pigs. J. Nutr. 132:1913-1920.401
Sève, B. 1994. Alimentation du porc en croissance: intégration des concepts de protéine 402
idéale, de disponibilité digestive des acides aminés et d'énergie nette. INRA Prod.403
Anim. 7:275-291.404
Subirade, M., J. Guéguen, and M. Pezolet. 1994. Conformational changes upon dissociation 405
of a globular protein from pea: a Fourier transform infrared spectroscopy study. 406
Biochim. Biophys. Acta. 1205:239-247.407
Page 17 of 35 Journal of Animal Science
by guest on May 18, 2011jas.fass.orgDownloaded from

18
Table 1. Composition of diets, as-fed basis408
Diet
_____________________
Control1 Pea2
Ingredient, g/kg
Field peas 0.00 350.00
Maltodextrin3 561.90 324.50
Fish soluble protein concentrate4 117.90 77.60
Skim milk powder 280.00 184.60
Sunflower oil 0.00 18.00
CaCO3 9.20 12.20
CaHPO4, H2O 22.90 23.20
Vitamin/microelements mixture5 5.00 5.00
DL-Met 1.55 2.60
L-Thr 1.03 1.55
L-Trp 0.52 0.75
Analyzed chemical composition
DM, % 91.23 88.77
CP, % (N x 6.25), DM basis 21.5 21.9
Lys, DM basis 1.39 1.33
Minerals, DM basis 6.53 6.77
Calculated NE, MJ/kg 10.54 10.531 Contained (g per kilogram as-fed basis, analyzed): Met, 6.46; Cys, 1.42; Lys, 13.95; Thr, 8.12; Trp, 2.37; Arg,409
9.17; Ile, 7.90; Leu, 14.46; Val, 9.34; His, 4.33; and Phe, 7.66.4102 Contained (g per kilogram as-fed basis, analyzed): Met, 6.31; Cys, 1.41; Lys, 13.31; Thr, 8.13; Trp, 2.40; Arg,411
10.89; Ile, 7.46; Leu, 13.37; Val, 8.60; His, 4.18; and Phe, 7.71.4123 Provided by Cargill, France. Reference: C*Dry MD 01904; D. E.: 3.5 to 6.5 analyzed by Luff-Schoorl. 4134 Contained (g per kilogram as-fed basis, analyzed): CP, 800; ether extract, 100; ash, 60; and water solubility, 80%. 414
Provided by the Coopérative de traitement des produits de la pêche, Concarneau, France.4155 Providing the following amount of vitamins and minerals per kilogram as fed basis: calcium carbonate 416
(excipients) 550.69; Zn (ZnO), 100 mg; Cu (CuSO4), 20 mg; Mn (MnO), 40 mg; Fe (FeSO4), 100 mg; I (KI), 1 mg; Co417(CoSO4), 2 mg; Se (Na 2SeO3), 0.3 mg; vitamin A, 15,000 IU; vitamin D3, 3,000 IU; vitamin E, 40 IU; vitamin B1, 2 mg; 418vitamin B2, 10 mg; pantothenic acid, 15 mg; vitamin B6, 10 mg; vitamin B12, 0.05 mg; vitamin PP, 30 mg; folic acid, 2 mg; 419vitamin K3, 2 mg; biotin, 0.2 mg; choline chloride, 800 mg; and vitamin C, 100 mg. Provided by Centralys, Trappes, France.420
421422423424
Page 18 of 35Journal of Animal Science
by guest on May 18, 2011jas.fass.orgDownloaded from

19
Table 2. Performance data for piglets fed the control and the pea diet425426
Diet1
__________________________________
Control Pea
SEMP-value
BW at weaning, kg 8.0 8.1 0.2 0.81
BW gain, g/d 158 162 15 0.82
G:F 0.59 0.60 0.05 0.59
ADFI, g/kg BW0.75 53.4 54.7 0.8 0.541Twelve pigs per treatment.427
428429
Page 19 of 35 Journal of Animal Science
by guest on May 18, 2011
jas.fass.orgD
ownloaded from
20
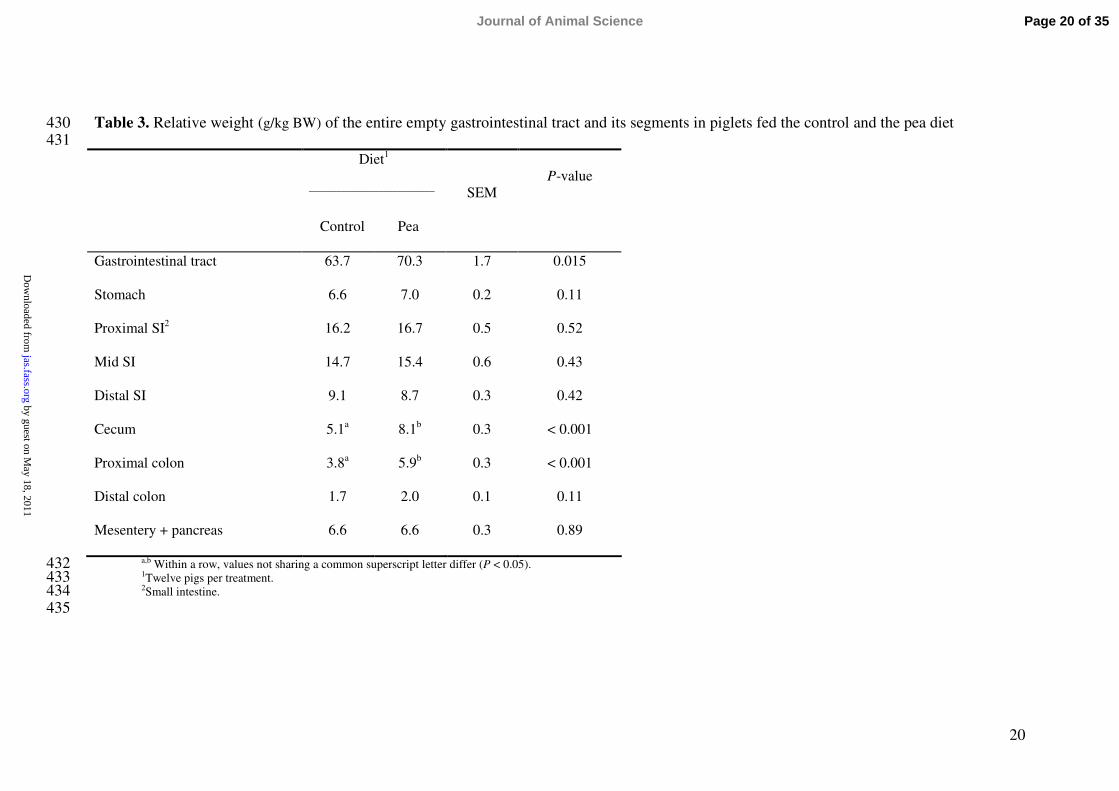
Table 3. Relative weight (g/kg BW) of the entire empty gastrointestinal tract and its segments in piglets fed the control and the pea diet430431
Diet1
___________________________
Control Pea
SEMP-value
Gastrointestinal tract 63.7 70.3 1.7 0.015
Stomach 6.6 7.0 0.2 0.11
Proximal SI2 16.2 16.7 0.5 0.52
Mid SI 14.7 15.4 0.6 0.43
Distal SI 9.1 8.7 0.3 0.42
Cecum 5.1a 8.1b 0.3 < 0.001
Proximal colon 3.8a 5.9b 0.3 < 0.001
Distal colon 1.7 2.0 0.1 0.11
Mesentery + pancreas 6.6 6.6 0.3 0.89
a,b Within a row, values not sharing a common superscript letter differ (P < 0.05). 4321Twelve pigs per treatment.4332Small intestine.434
435
Page 20 of 35Journal of Animal Science
by guest on May 18, 2011
jas.fass.orgD
ownloaded from

21
Table 4. Residual DM in the stomach and pH of digesta contents in piglets fed the control or the pea diet436
Time after the meal, h
Diet1
__________________________________________________________
Control Pea
3 6 9 3 6 9
SEM
P-value
________________________________________________________
T2 T linear T quadratic D3 T × D4 T linear × D T quadractic × D
Residual DM in the
stomach, %551 25 15 56 17 12 7 < 0.001 < 0.001 0.05 0.69 0.61 0.54 0.45
Digesta pH
Stomach 4.71 3.88 2.87 4.58 2.92 2.18 0.27 < 0.001 < 0.001 0.44 0.02 0.31 0.31 0.26
Proximal SI6 7.62 7.61 7.23 7.46 7.56 7.39 0.06 0.001 0.002 0.009 0.76 0.06 0.02 0.71
Mid SI 6.66 6.76 6.86 6.80 6.64 6.74 0.15 0.79 0.65 0.62 0.79 0.62 0.41 0.61
Distal SI 7.14 7.25 7.35 6.97 6.69 7.10 0.16 0.28 0.29 0.23 0.02 0.45 0.79 0.23
1Twelve pigs per treatment.4372Time.4383Diet.4394Time by diet interaction.4405Percentage of DM intake at the last meal before slaughter.4416Small intestine.442
Page 21 of 35 Journal of Animal Science
by guest on May 18, 2011
jas.fass.orgD
ownloaded from

22
Table 5. Densitometry of protein bands in digesta of the first, second, and third segment of the small intestine (DU1 · g-1 protein)443
Time after the meal, h
Diet2
______________________________________________________________________
Control Pea 3 6 9 3 6 9
SEM
P-value
T3 T linear T quadratic D4 T × D5 T linear × D T quadractic × D
Proximal SI6,7
d1, 45 kDa 0.255 0.317 0.347 0.059 0.096 0.148 0.067 0.459 0.223 0.943 0.003 0.980 0.977 0.845d2, 28 kDa 0.138 0.221 0.040 0.474 0.620 0.515 0.145 0.612 0.854 0.334 0.006 0.901 0.654 0.983d3, 25 kDa 0.000 0.000 0.008 0.806 0.069 0.088 0.092 0.002 0.002 0.033 0.001 0.002 0.002 0.036d4, 20 kDa, lectin 0.000 0.000 0.018 0.566 0.753 0.233 0.143 0.230 0.262 0.171 0.001 0.275 0.311 0.192
Mid SI8
j1, 90 kDa 0.302 0.534 0.333 0.110 0.000 0.000 0.104 0.631 0.711 0.383 0.001 0.285 0.508 0.153j2, 68 kDa 0.320 0.318 0.607 0.067 0.092 0.043 0.101 0.756 0.505 0.750 0.043 0.63 0.432 0.591j3, 55 kDa 3.470 2.250 1.710 0.650 2.380 0.750 0.594 0.191 0.179 0.210 0.024 0.072 0.139 0.068j4, 28 kDa 0.530 0.540 0.240 0.310 0.370 0.150 0.090 0.023 0.024 0.810 0.045 0.788 0.497 0.987j5, 26 kDa 0.094 0.374 0.175 0.044 0.073 0.067 0.059 0.054 0.886 0.070 0.006 0.117 0.812 0.479j6, 20 kDa, lectin 0.000 0.000 0.000 1.510 1.700 0.600 0.157 0.007 0.011 0.030 < 0.001 0.007 0.011 0.031
Distal SI9
i1, 90 kDa 0.714 0.748 0.794 0.317 0.730 0.366 0.154 0.356 0.681 0.174 0.041 0.36 0.922 0.161i2, 68 kDa 0.727 0.630 0.574 0.194 0.619 0.421 0.104 0.283 0.727 0.126 0.015 0.062 0.088 0.085i3, 55 kDa 4.37 3.92 1.03 0.108 0.424 0.658 0.625 0.071 0.041 0.262 < 0.001 0.017 0.007 0.293i4, 35 kDa 0.687 0.451 0.263 0.000 0.000 0.000 0.091 0.098 0.034 0.881 < 0.001 0.099 0.034 0.881i5, 28 kDa 0.371 0.501 0.449 2.130 2.860 3.070 0.389 0.394 0.211 0.609 < 0.001 0.539 0.286 0.804i6, 20 kDa, lectin 0.000 0.000 0.000 1.780 3.480 2.770 0.270 0.022 0.087 0.021 < 0.001 0.022 0.087 0.021
1Densitometric unit.4442Twelve pigs per treatment.4453Time.4464Diet.4475Time by diet interaction.4486Small intestine.4497Duodenal protein band number 1 to 4, molecular weight in kDa.4508Jejunal protein band number 1 to 6, molecular weight in kDa.4519Ileal protein band number 1 to 6, molecular weight in kDa.452
Page 22 of 35Journal of Animal Science
by guest on May 18, 2011
jas.fass.orgD
ownloaded from

23
FIGURE CAPTION453454
Figure 1. Protein digestion in the stomach of piglets fed a control diet (C) or a diet 455
containing pea (P) as revealed by (A) SDS-PAGE in reducing conditions and Coomassie 456
blue staining, and (B) immunoblotting with antibodies against pea vicilin (a), legumin (b), 457
lectin β subunit (c), and albumin PA2 (d) for the diet extracts and the digesta extracts from 458
the piglets fed the pea diet (no antibody reacted with proteins in the controls). The digesta 459
were collected by the slaughter technique at 3, 6, and 9 h after the meal and extracted for 460
proteins before analysis. Individual tracks represent individual samples. M: molecular 461
mass markers in kDa on the left.462
463
Figure 2. Protein digestion in the proximal small intestine (SI1) of piglets fed a control diet 464
(C) or a diet containing pea (P) as revealed by (A) SDS-PAGE in reducing conditions and 465
Coomassie blue staining, and (B) immunoblotting with antibodies against (a) pea legumin, 466
(b) lectin β subunit, and (c) albumin PA2 for the diet extracts and the digesta extracts from 467
the piglets fed the pea diet (no antibody reacted with proteins in the controls). The digesta 468
were collected by the slaughter technique at 3, 6, and 9 h after the meal and extracted for 469
proteins before analysis. Individual tracks represent individual samples. M: molecular 470
mass markers in kDa on the left. The numbered bands in A refer to those further analyzed 471
by densitometry.472
473
Figure 3. Protein digestion in the mid small intestine (SI2) of piglets fed a control diet (C) 474
or a diet containing pea (P) as revealed by (A) SDS-PAGE in reducing conditions and 475
Coomassie blue staining, and (B) immunoblotting with antibodies against (a) lectin β476
subunit and (b) albumin PA2 for the diet extracts and the digesta extracts from the piglets 477
fed the pea diet (no antibody reacted with proteins in the controls). The digesta were 478
Page 23 of 35 Journal of Animal Science
by guest on May 18, 2011jas.fass.orgDownloaded from

24
collected by the slaughter technique at 3, 6, and 9 h after the meal and extracted for 479
proteins before analysis. Individual tracks represent individual samples. M: molecular 480
mass markers in kDa on the left. The numbered bands in A refer to those further analyzed 481
by densitometry.482
483
Figure 4. Protein digestion in the distal small intestine (SI3) of piglets fed a control diet (C) 484
or a diet containing pea (P) as revealed by (A) SDS-PAGE in reducing conditions and 485
Coomassie blue staining, and (B) immunoblotting with antibodies against (a) lectin β486
subunit and (b) albumin PA2 for the diet extracts and the digesta extracts from the piglets 487
fed the pea diet (no antibody reacted with proteins in the controls). The digesta were 488
collected by the slaughter technique at 3, 6, and 9 h after the meal and extracted for 489
proteins before analysis. Individual tracks represent individual samples. M: molecular 490
mass markers in kDa on the left. The numbered bands in A refer to those further analyzed 491
by densitometry.492
493
Figure 5. Separation by SDS-PAGE (A) and identification by immunoblotting (B) of pea 494
albumin PA2 in the pea flour (P) and of PA2 polypeptides present in ileal (SI3) digesta of 495
piglets fed the pea diet. These undigested polypeptides were first immuno-precipitated 496
from digesta using protein A technology. Track 1: molecular weight markers in kDa. Track 497
2: pea proteins (A) and PA2 (B) in the pea flour extract. Track 3: Rabbit IgG antibodies 498
(Ac) specific for PA2. Track 4: immuno-precipitated (Immunoprec.) proteins including the 499
anti-PA2 rabbit antibodies and the undigested PA2 polypeptides (A) and immunoblotting 500
revelation with the anti-PA2 antibodies. Track 5: similar to track 4 for (A) and revelation 501
with an anti-rabbit IgG antibody alone (5). The undigested PA2 polypeptides specifically 502
detected and analyzed by mass spectrometry were obtained by difference between the band 503
Page 24 of 35Journal of Animal Science
by guest on May 18, 2011jas.fass.orgDownloaded from
25
patterns present on track 4 and those present on track 5 of the immunoblot (B). They are 504
identified with black arrowheads on panel A.505
Page 25 of 35 Journal of Animal Science
by guest on May 18, 2011jas.fass.orgDownloaded from

26
A: SDS-PAGE stained gels for proteins506
Control Pea507 M C 3 6 9 M P 3 6 9508
509510
B: Pea protein detection by immunoblotting511a) Vicilin b) Legumin 512M C P 3 C 3 6 M C P 3 6 9513
---- ---------- --------------- -------------- ----------- -------514
515c) Lectin d) PA2 516M C P 3 6 9 M C P 3 6 9517
------------- ----------- ----- --------------- ---------- -----518
519520
Figure 1521
9766
45
30
20.1
14.4
1158051
30
25
17
1158051
3025
17
- Convicilin- Vicilin 50- Vicilin 33 - α major
- α- cleaved
-β
- PA2
- Lectin (β)
Page 26 of 35Journal of Animal Science
by guest on May 18, 2011jas.fass.orgDownloaded from
27
A: SDS-PAGE stained gels for proteins522Control Pea523
M C 3 6 9 M P 3 6 9524
525526
B: Pea protein detection by immunoblotting527a) Legumin b) Lectin c) PA2 528 M P C 3 6 9 3 6 9 3 6 3 6 M P 3 6 9 M C C P 3 6 9 529
---- --- --- --- --- --- --- --- --- --- ------------- ----------- --------- ------------- ----------- ------530
531Figure 2532
1158051
3025
17
976645
30
20.1
14.4
---d2
----------------------- d3- - ------ d4
-----------d1
---d2
- Lectin (β)
- PA2- β legumin
Page 27 of 35 Journal of Animal Science
by guest on May 18, 2011jas.fass.orgDownloaded from

28
A: SDS-PAGE stained gels for proteins533Control Pea534
M C 3 6 9 M P 3 6 9 535
536537
B: Pea protein detection by immunoblotting538a) Lectin b) PA2 539M P 3 6 9 M P 3 6 9540
----------- ----------- -------- --------- ------------ -------------541
542543
Figure 3544
-j1-j2-j3
-j4-j5
-j6
976645
30
20.1
14.4
-j1-j2-j3
-j4
1158051
3025
17 - Lectin
- PA2
- Cleaved PA2
Page 28 of 35Journal of Animal Science
by guest on May 18, 2011jas.fass.orgDownloaded from

29
A: SDS-PAGE stained gels for proteins545
Control Pea546 M C 3 6 9 M P 3 6 9 547
548549
B: Pea protein detection by immunoblotting550a) Lectin b) PA2551M P 3 6 9 M P 3 6 9552
----------- ----------- --------- --------------- ------------ --------553
554555
Figure 4556
-i1
-i2-i3
-i4
-i5
-i6
-i1
-i2-i3
-i4
-i5
976645
30
20.1
14.4
1158051
3025
17 - Lectin (β) - Cleaved PA2
Page 29 of 35 Journal of Animal Science
by guest on May 18, 2011jas.fass.orgDownloaded from

30
557
558
559560
Figure 5.561
1 2 3 4 5 1 2 3 4 5M P Ac Immunoprec. M PA2 Ac PA2 Ac
+Ac
MW A: SDS-PAGE gel B: Immunoblotting
115 80
51
30
25
17
12
345
Antibodies
PA2
Degraded antibodies
Page 30 of 35Journal of Animal Science
by guest on May 18, 2011jas.fass.orgDownloaded from

A: SDS-PAGE stained gels for proteins Control Pea M C 3 6 9 M P 3 6 9
B: Pea protein detection by immunoblottinga) Vicilin b) Legumin M C P 3 C 3 6 M C P 3 6 9
---- ---------- --------------- -------------- ----------- -------
c) Lectin d) PA2 M C P 3 6 9 M C P 3 6 9
------------- ----------- ----- --------------- ---------- -----
Figure 1
9766
45
30
20.1
14.4
1158051
30
25
17
1158051
3025
17
- Convicilin- Vicilin 50- Vicilin 33 - α major
- α- cleaved
-β
- PA2
- Lectin (β)
Page 31 of 35 Journal of Animal Science
by guest on May 18, 2011jas.fass.orgDownloaded from

A: SDS-PAGE stained gels for proteins Control Pea
M C 3 6 9 M P 3 6 9
B: Pea protein detection by immunoblotting a) Legumin b) Lectin c) PA2 M P C 3 6 9 3 6 9 3 6 3 6 M P 3 6 9 M C C P 3 6 9 ---- --- --- --- --- --- --- --- --- --- ------------- ----------- --------- ------------- ----------- ------
Figure 2
115 80 51
30
25
17
97
66 45 30 20.1 14.4
---d2 ----------------------- d3
- - ------ d4
-----------d1
---d2
- Lectin (β)
- PA2 - β legumin
Page 32 of 35Journal of Animal Science
by guest on May 18, 2011jas.fass.orgDownloaded from

A: SDS-PAGE stained gels for proteins Control Pea
M C 3 6 9 M P 3 6 9
B: Pea protein detection by immunoblotting a) Lectin b) PA2 M P 3 6 9 M P 3 6 9
----------- ----------- -------- --------- ------------ -------------
Figure 3
-j1
-j2 -j3
-j4 -j5
-j6
97 66 45 30 20.1 14.4
-j1
-j2 -j3
-j4
115 80 51
30
25
17 - Lectin
- PA2
- Cleaved PA2
Page 33 of 35 Journal of Animal Science
by guest on May 18, 2011jas.fass.orgDownloaded from

A: SDS-PAGE stained gels for proteins Control Pea
M C 3 6 9 M P 3 6 9
B: Pea protein detection by immunoblotting a) Lectin b) PA2 M P 3 6 9 M P 3 6 9
----------- ----------- --------- --------------- ------------ --------
Figure 4
-i1
-i2 -i3
-i4
-i5
-i6
-i1
-i2 -i3 -i4
-i5
97 66 45 30 20.1 14.4
115 80 51
30
25
17 - Lectin (β) - Cleaved PA2
Page 34 of 35Journal of Animal Science
by guest on May 18, 2011jas.fass.orgDownloaded from

1
2
34
Figure 55
1 2 3 4 5 1 2 3 4 5M P Ac Immunoprec. M PA2 Ac PA2 Ac
+Ac
MW A: SDS-PAGE gel B: Immunoblotting
115 80
51
30
25
17
12
345
Antibodies
PA2
Degraded antibodies
Page 35 of 35 Journal of Animal Science
by guest on May 18, 2011jas.fass.orgDownloaded from

Citations
rarticleshttp://jas.fass.org/content/early/2007/06/12/jas.2006-795.citation#otheThis article has been cited by 2 HighWire-hosted articles:
by guest on May 18, 2011jas.fass.orgDownloaded from
Copyright © 2022 FDOKUMEN