Discrimination and emission of different key-peck durations in the pigeon

Journal of Sustainable Society
Vol. 2, No. 1, 2013, 36-48
DOI: 10.11634/216825851302360
ISSN 2168-2585 Print/ ISSN 2168-2593 Online World Scholars; http://worldscholars.org
Assessment of Nutrient and Biomass Yield of Medium and Long Duration
Pigeon Pea in a Pigeon Pea-Groundnut Intercropping System in Malawi
Austin Tenthani Phiri1, 3*
, John J. Msaky1, Jerome Mrema
1, George Yobe Kanyama-Phiri
2 and Rebbie
Harawa4
1
Sokoine University of Agriculture, Morogoro, Tanzania 2University of Malawi, Bunda College of Agriculture, Lilongwe, Malawi
3Bvumbwe Agricultural Research Station, Limbe, Blantyre, Malawi 4Alliance for a Green Revolution in Africa, Nairobi, Kenya
Preliminary assessment of the performance of the medium and long duration pigeon pea in a pigeon pea-
groundnut intercropping system was conducted at Chitedze Agricultural Research Station (S 130 59’ 23.2”,
E0330 38’ 36.8”) in the 2011/2012 cropping season. An experiment involving eight treatments replicated three
times in a randomized complete block design was established. Two pigeon pea varieties, long (ICEAP 04000)
and medium duration (ICEAP 00557) and groundnut (CG 7) were grown as monocultures and intercrops. The
intercrops involved planting either of the pigeon pea varieties with groundnut. Baseline soil data indicate that
the soil pH was acid to moderately acid both in the top (mean=5.4-5.7) and the sub soil (mean=5.4-5.6) in all the
treatment plots, with mostly low to marginally adequate total nitrogen content both in the top (mean=0.08-
0.14%) and the sub soil (mean=0.09-0.13%). The soil organic carbon content was medium in the top soil
(mean=0.9-1.6%) as well as sub soil (mean=1.1-1.6%) across the treatment plots. At the same time soil
phosphorus was low to marginally adequate in the top soil (mean=16.8-27.6 mg kg-1) and marginally adequate
in the sub soil (mean=20.8-25.6 mg kg-1), suggesting low soil fertility. The assessment of the above ground
groundnut biomass indicate a mean yield range of 479-656 kg ha-1. While the assessment of the total biomass
yield of the pigeon pea varieties indicate a mean yield range of 2,034-2,593 kg ha-1. In terms of estimated
nitrogen yields returned to the soil, the medium duration pigeon pea-groundnut intercrop (mean=50.6 kg N ha-1)
and the long duration pigeon pea-groundnut intercrop (mean=49.6 kg N ha-1) gave significantly (p<0.05) higher
yields than by the monocultures of long duration pigeon pea (mean=41.1 kg N ha-1) and medium duration
pigeon pea (mean=41.0 kg N ha-1). Statistically (p<0.05), the lowest amount of estimated nitrogen yield was
generated by the groundnut sole crop (mean=12.8 kg N ha-1). Overall, the intercrops showed yield advantage
(total LER >1.0) compared with the monoculture on equal land area. For the Malawian smallholder farmers, this
suggests that mineral N supplementation in a legume-cereal rotation system for enhanced crop productivity
might be less in the double legume-cereal rotation mode than in a legume monoculture-cereal rotation system.
Keywords: Maize, pigeon pea and rotation groundnut, intercrop
Introduction
The smallholder agricultural sector in Malawi is
characterized by low productivity and land
constraints (Phiri et al., 2012). The latter constraint
has been aggravated by population increase. For
instance the population grew from 9,933,868 in
1998 to 13,066,320 in 2008, representing an
increase of 32 percent (NSO, 2008). This is
exerting pressure on the already limited arable land
for the smallholder farmers, which by the year 2000
had fallen from 1.53 ha per household in 1968 to
0.80 ha per household (GoM, 2001). This has led to
continuous cropping principally of maize, the main
cereal crop, without rotation of crops resulting into
low soil fertility and productivity in most of the
farmers’ fields (Phiri et al., 2012). The noted trend
*Corresponding author
necessitates the generation of agricultural
technologies, that will allow for the optimal use of
the limited arable land for increasing crop
production while at the same time rejuvenating and
maintaining soil fertility. One of such technologies
is intercropping pigeon pea with groundnut in
rotation with maize. Intercropping is often thought
to be more stable interms of soil fertility, yield and
financial returns than monocropping. The stability
under intercropping can be attributed to the partial
restoration of diversity that is lost under
monocropping (Machado, 2009).Thus intercropping
provides high insurance against crop failure,
particularly in places prone to extreme weather
conditions such as drought and floods. Worth
noting is the fact that intercropping accords greater
financial stability for farmers, making it appropriate
for the Malawian labor-intensive smallholder farms.
In the event that a crop fails because of

37 A. T. Phiri et al.
unfavourable weather conditions farmers reduce
their risk for total crop failure by growing more
than one crop in their field (Clawson, 1985). This
makes intercropping much less risky than
monocropping. Intercropping with legumes is an
excellent practice for controlling soil erosion and
sustaining crop production (El-Swaify et al., 1988).
For instance in a pigeon pea groundnut
intercropping system, the deep roots of the pigeon
pea can penetrate far into the soil breaking up
hardpans and use moisture and nutrients from
deeper layers in the soil. While the shallow roots of
the groundnut can bind the soil at the surface and
thereby help to reduce erosion. Other advantages of
the system include weed suppression, and reduced
damage from pests and diseases (Machado, 2009).
On the other hand, annual crop legumes grown in
rotation with cereal crops can improve yields of the
cereals and contribute to the total soil N pool.
Reported yield responses to previous legume crops
are in the range of 50-80% increases over yields in
cereal-cereal sequence (Hayat, 2005). Benefits of
legumes have also been attributed to control of
cereal diseases and insect pests and improvements
in soil structure.
This study was conducted to (i) assess the
effect of intercropping medium and long duration
pigeon pea with groundnut on pigeon pea growth
rate and (ii) assess the effect of intercropping on the
yield components of the legumes. This was done
inorder to establish if significant competition for
above and below ground growth resources exists in
the system and provide a basis for quantifying the
contribution of the legumes of biologically fixed N
to the soil N pools in the pigeon pea-groundnut
maize rotation system.
Materials and Methods
Study site
The study was conducted on station at Chitedze
Agricultural Research Station (S 130 59’ 23.2”,
E0330 38’ 36.8”) in Lilongwe, Malawi. The site
falls within the Lilongwe plain and receives an
average annual rainfall of 875 mm. The rainy
season starts in November and ends in April.
During the 2011/2012 growing season, a total of
870 mm was recorded. The site has an acid soil
with low N, marginally adequate P and low organic
carbon. The soil has a good soil structure as it has a
sandy clay loam texture.
Materials
A photo and thermo insensitive medium duration
pigeon pea variety (ICEAP 00557, potential yield is
up to 2.5 t ha-1
) which matures in 5-6 months, a
long-duration pigeon pea variety (ICEAP 04000,
potential yield is 1.6-2 t ha-1
) maturing in 8-9
months, groundnut (CG 7, potential yield is 3 t ha-
1), early maturing maize variety (SC 403 potential
yield is 6 t ha-1
) and Triple Super Phosphate (TSP).
Experimental design
The experiment was laid out in a randomized
complete block design replicated three times. The
treatments were as follows: 1) Sole maize (control);
2) Medium duration pigeon pea (control); 3) Long
duration pigeon pea (control); 4) Sole groundnut
(control); 5) Medium duration pigeon pea +
groundnut; 6) Long duration pigeon pea +
groundnut; 7) Medium duration pigeon pea +
groundnut; and 8) Long duration pigeon pea +
groundnut. The medium duration pigeon pea-
groundnut and long duration pigeon pea-groundnut
intercrop was repeated (treatment 7 and 8)
purposively. In the second season, the biomass in all
the plots having the legumes, except plots with
treatment 7, 8 and 1 (sole maize) will have their
biomass ploughed into the soil. All the plots will
then be planted with maize. As such this will allow
for the comparison of the performance of maize
between the plots with legume biomass
incorporated into the soil and the plots with legume
biomass removed from the field plus a plot where a
cereal was grown without incorporating its biomass
into the soil.
Treatment plot description
The gross plot size was 20 m x 10 m. Ridges were
spaced at 75 cm apart. In the intercrop three pigeon
pea seeds were planted per station at 90 cm apart
while the groundnut was planted in between the
pigeon pea planting hills at 15 cm apart, with one
seed per station. In the pure stands three pigeon pea
seeds were planted per station at 90 cm apart while
the groundnut was planted at 15 cm apart, with one
seed per station. Maize was planted on the ridges at
25 cm between planting hills with one seed per
planting station. This was done in January 2012.
Application Triple Super Phosphate
At planting, all the treatment plots except where
maize was planted were treated with Triple Super
Phosphate (TSP) at the rate of 25 kg P ha-1
to offset
limitation in N fixation by the legumes due to
inadquate soil phosphorus. At planting time, except
for the pigeon pea sole crop treatment plot all the
ridges were split open to a depth of 5 cm and 93.3 g
of TSP was evenly spread on each ridge. While in
the sole pigeon pea treatment 8.4 g of TSP was
applied per planting station. This was done to
achieve the rate of 25 kg P ha-1
for the enhancement
of nitrogen fixation and the growth and productivity
of the legumes.
Journal of Sustainable Society 38
Data collection and analysis
Soil sample collection
The trial field was demarcated into three block each
having eight plots. Top (0 -20 cm) and sub (20 - 40
cm) soils were sampled at random before treatment
application to plots (Okalebo et al., 2000). Samples
(4 borings from each plot) were taken. A
composite sample was made for each plot. The
samples were air dried at Chitedze Agricultural
Research Laboratory and then passed through a 2
mm sieve in preparation for soil physical and
chemical analysis.
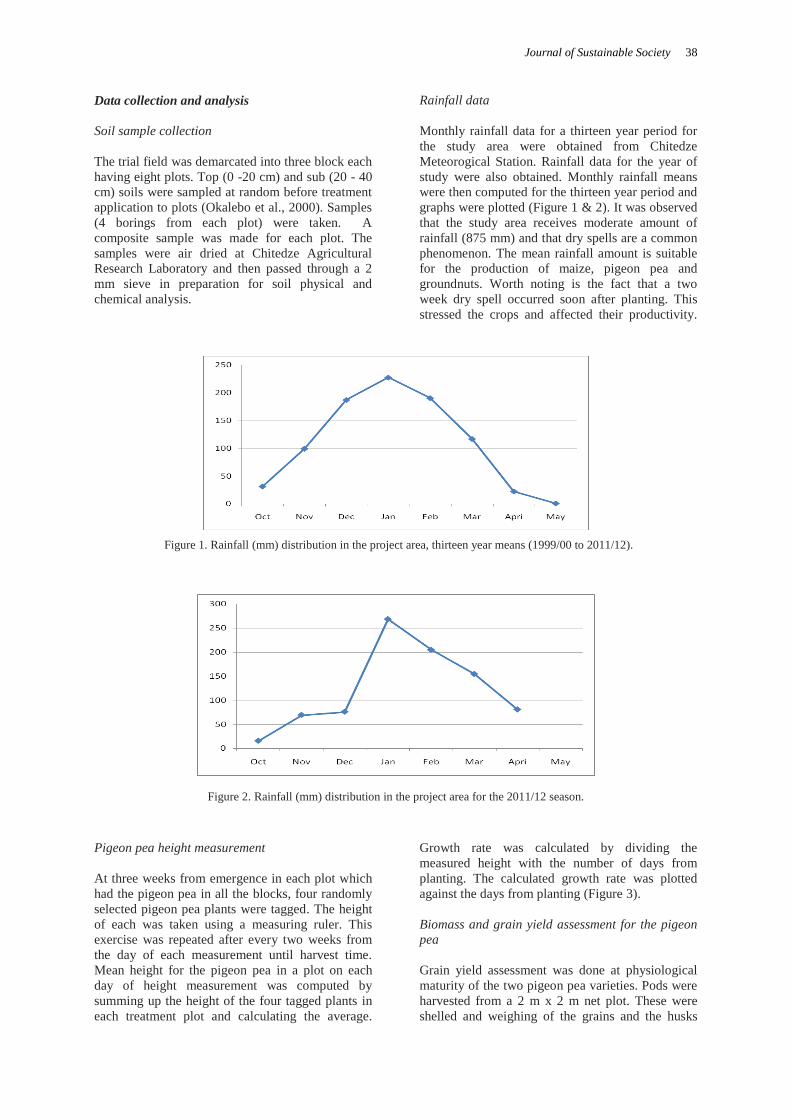
Rainfall data
Monthly rainfall data for a thirteen year period for
the study area were obtained from Chitedze
Meteorogical Station. Rainfall data for the year of
study were also obtained. Monthly rainfall means
were then computed for the thirteen year period and
graphs were plotted (Figure 1 & 2). It was observed
that the study area receives moderate amount of
rainfall (875 mm) and that dry spells are a common
phenomenon. The mean rainfall amount is suitable
for the production of maize, pigeon pea and
groundnuts. Worth noting is the fact that a two
week dry spell occurred soon after planting. This
stressed the crops and affected their productivity.
Figure 1. Rainfall (mm) distribution in the project area, thirteen year means (1999/00 to 2011/12).
Figure 2. Rainfall (mm) distribution in the project area for the 2011/12 season.
Pigeon pea height measurement
At three weeks from emergence in each plot which
had the pigeon pea in all the blocks, four randomly
selected pigeon pea plants were tagged. The height
of each was taken using a measuring ruler. This
exercise was repeated after every two weeks from
the day of each measurement until harvest time.
Mean height for the pigeon pea in a plot on each
day of height measurement was computed by
summing up the height of the four tagged plants in
each treatment plot and calculating the average.
Growth rate was calculated by dividing the
measured height with the number of days from
planting. The calculated growth rate was plotted
against the days from planting (Figure 3).
Biomass and grain yield assessment for the pigeon
pea
Grain yield assessment was done at physiological
maturity of the two pigeon pea varieties. Pods were
harvested from a 2 m x 2 m net plot. These were
shelled and weighing of the grains and the husks
39 A. T. Phiri et al.
was done. This was conducted in September, 2012.
To assess the amount of litter for each treatment
plot, the litter was collected from the ground on one
planting station (90 cm x 75 cm). This was done in
October, 2012. Fresh leaves and twigs were also
weighed from the 2 m x 2 m net plot. These were
oven dried for 24 hours at 70 oC to a constant
weight. In the field the pigeon pea was then
ratooned at a height of 30 cm.
Biomass and grain yield assessment for the
groundnut
Grain yield assessment was conducted at
physiological maturity of the groundnut in June,
2012. Pods were dug from a 2 m x 2 m net plot.
The pods were shelled and weighing of the grains
and the husks was done. These were later oven
dried for 24 hours at 70 oC to a constant weight.
Estimation of the mean number of pods per plant
was done by counting the total number pods from
the net plot and dividing by the number of planting
stations in the net plot to get the mean. Groundnut
haulms were also weighed in the field and their dry
weight measured after oven drying at 70oC for 24
hours. Agronomic data was collected for the maize
plant which include maize grain and stover yield.
Evaluation of the productivity of the intercropping
systems
The Land Equivalent Ratio (LER) was used to
evaluate the productivity of the doubled up legume
intercrops against the monocultures. The LER is a
measure of the yield advantage obtained by
growing two or more crops or varieties as an
intercrop compared to growing the same crops or
varieties as a collection of separate monocultures
(Andrews and Kassam, 1976). The LER is
calculated using the formula LER= ∑ (Ypi/Ymi),
where Yp is the yield of each crop or variety in the
intercrop or polyculture, and Ym is the yield of
each crop or variety in the sole crop or
monoculture. For each crop (i) a ratio is calculated
to determine the partial LER for that crop, then the
partial LERs are summed to give the total LER for
the intercrop. An LER value of 1.0 indicates no
difference in yield between the intercrop and the
collection of monocultures (Mazaheri & Oveysi,
2004). Any value greater than 1.0 indicates a yield
advantage for intercrop. A LER of 1.2 for example,
indicates that the area planted to monocultures
would need to be 20% greater than the area planted
to intercrop for the two to produce the same
combined yields
Data analysis
Soil analysis was done in order to characterize soil
properties. Soil samples were analyzed for Bulk
density, Texture, OC, total N, available P,
exchangeable K, Mg, Ca and soil pH (H2O). Soil
analysis for P, K, Mg and Ca was done using
Mehlich 3 extraction procedures (Mehlich, 1984)
while OC was determined using the colorimetric
method (Schumacher, 2002) and total N was
determined using Kjeldahl method (Amin &
Flowers, 2004). All the soil and agronomic data
were analyzed using Genstat statistical package and
were subjected to analysis of variance at 95% level
of confidence.
Results
Soil characterization of the study site
Baseline physical and chemical properties of soil
used during the study
Laboratory analytical results indicated that the soil
texture was predominantly sandy clay loam with
the mean bulk density value both in the top and sub
soil in all treatment plots being less than 1.6 g/cc.
This suggested that root growth and development of
crops was not restricted under this soil environment
(McKenzie et al., 2004). The mean soil pH was
acid to moderately acid both in the top (mean=5.4-
5.7) and the sub soil (mean=5.4-5.6) in all the
treatment plots. At this range of soil reaction the
macro nutrients were likely less available to an
extent compared to the micronutrients (Akinrinde,
2006).
The mean total nitrogen content was largely
low to marginally adequate both in the top
(mean=0.08-0.14%) and the sub soil (mean=0.09-
0.13%) with mean medium level of soil organic
carbon content in the top soil (mean=0.9-1.6%) and
sub soil (mean=1.1-1.6%) across the treatment
plots. At the same time the mean soil phosphorus
was low to marginally adequate in the top soil
(mean=16.8-27.6 mg kg-1
) and marginally adequate
in the sub soil (mean=20.8-25.6 mg kg-1
). This
suggested that P supply for crop uptake was low.
The crops under study were nodulating legumes
which require high supply of P to enhance
biological nitrogen fixation (Singh & Oswalt,
1995). As such the low and variable level of soil P
necessitated the external supply of the nutrient for
enhanced yield. Mean soil potassium in the top soil
(mean=0.10-0.29%) and sub soil (mean=0.13-
0.35%) was adequate across the treatment plots
with low magnesium content for both the top soil
(mean=0.30-0.48 cmol kg-1) and sub soil
(mean=0.16-0.37 cmol kg-1). Calcium was marginally
adequate both in the top soil (mean=3.04-3.87 cmol
kg-1
) and sub soil (mean=2.8-4.4 cmol kg-1).
Tables 1 summarize baseline physical and
chemical properties of soil used during the study.

Journal of Sustainable Society 40
Table 1. Baseline soil data
Treatment BD g/cc 0-20 cm
BD g/cc 20-40 cm
pHH2O
0-20 cm
pHH2O
20-40 cm
Total N% 0-20 cm
Total N% 20-40 cm
OC% 0-20 cm
OC% 20-
40cm
P (mg/kg) 0-20 cm
P (mg/kg) 20-40 cm
% K 0-20cm
%K 20-
40cm
Mg cmol kg
-1
0-20 cm
Mg cmol kg
-1
20-40 cm
Ca cmol kg
-1
0-20 cm
Ca cmol kg-1
20-40 cm
Sole Maize 1.2 1.2 5.5 5.4 0.12 0.12 1.4 1.4 27.6 22.7 0.26 0.17 0.32 0.34 3.30 3.2
Medium duration pigeon pea 1.2 1.3 5.4 5.5 0.10 0.12 1.1 1.4 18.8 20.9 0.13 0.16 0.38 0.36 3.10 4.4
Long duration pigeon pea 1.1 1.2 5.6 5.5 0.08 0.10 0.9 1.1 16.8 20.8 0.16 0.17 0.35 0.28 3.20 3.0
Sole groundnut 1.2 1.2 5.5 5.4 0.14 0.13 1.6 1.5 17.6 23.4 0.10 0.21 0.48 0.52 3.04 3.4
Medium duration pigeon pea + Groundnut
1.3 1.3 5.4 5.4 0.12 0.09 1.4 1.1 18.9 21.3 0.25 0.13 0.30 0.31 3.13 2.8
Long duration pigeon pea
+ Groundnut
1.2 1.1 5.7 5.5 0.12 0.12 1.4 1.4 22.1 20.4 0.13 0.35 0.34 0.34 3.52 3.3
Medium duration pigeon pea + groundnut
1.3 1.2 5.6 5.6 0.12 0.12 1.4 1.4 26.6 21.4 0.29 0.20 0.42 0.37 3.87 3.1
Long duration pigeon pea
+ Groundnut
1.2 1.2 5.6 5.5 0.14 0.13 1.6 1.6 23.4 25.6 0.26 0.20 0.42 0.16 3.32 3.8
CV% 11.7 14.2 4.40 3.70 25.5 26.9 25.5 26.9 18.7 18.2 47.1 38.3 35.4 35.5 22 20.6
LSD0.05 0.23 0.30 0.43 0.35 0.05 0.05 0.06 1.40 7.02 7.2 0.22 0.40 0.23 0.21 1.3 1.2
BD= BD= Bulk density

41 A. T. Phiri et al.
Growth rate for the long duration and medium
duration pigeon pea
Figure 3 below shows the growth rate of long and
medium duration pigeon pea for both intercrops and
pure stands. For the first forty days after planting,
medium duration pigeon pea intercropped with
groundnut had the fastest growth rate. This was
followed by the long duration pigeon pea-
groundnut intercrop, long duration pigeon pea in
the pure stand and medium duration pigeon pea in
the pure stand. Beyond the fortieth day generally
growth rate in all the stands slowed down with the
medium duration pigeon pea-groundnut intercrop
registering a marked reduction in the rate of growth.
This contrasted sharply with the observation made
in the medium duration pure stand in which growth
rate slowed down gradually. Between the fortieth to
the sixty seventh day from planting, intriguingly,
though at a slower rate, the long duration pigeon
pea-groundnut intercrop registered a slightly higher
growth rate than the long duration pigeon pea in the
pure stand. After this phase growth rate increased
sharply in the pure stand and eventually slowed
down, while in the intercrop growth rate reduced
slowly.
Figure 3. Growth rate of long and medium duration pigeon pea in intercrops and pure stands.
The table 2 shows the mean nutrient concentration
in the litter, leaves and twigs for the pigeon pea in
the long and medium duration pigeon pea. In the
treatments where biomass was incorporated into the
soil, no significant differences (p>0.05) were
observed in the mean concentration of nitrogen (N),
phosphorus (P) and potassium (K) across the
treatments. For N, this ranged from 0.59% to 0.72%
for the litter, while for the fresh leaves, this ranged
from 2.4% to 3.4%. In the twigs, the concentration
of N ranged from 2.0% to 2.6%.
For P in these treatments, the mean
concentration ranged from 0.18% to 0.30% in the
litter, while for the fresh leaves, this ranged from
0.15% to 0.33%. In the twigs, the mean
concentration of P ranged from 0.14% to 0.19%.
While for K, this ranged from 0.25% to 0.31% in
the litter, while for the fresh leaves and twigs, the
mean concentration ranged from 0.78% to 1.51%.
For calcium (Ca) no significant differences were
observed in the mean tissue concentration in the
litter and twigs. This ranged from 1.21% to 1.64%
in the litter and 1.3% to 1.9% in the twigs.
However, significant differences (p>0.05) of mean
Ca concentration in the fresh leaves were recorded.
The highest mean was registered by the medium
duration pigeon pea grown in the pure stand (2.9%)
while the lowest mean concentration of Ca (2.0%)
was observed in the long duration pigeon pea-
groundnut intercrop. For magnesium (Mg), no
significant differences in the mean tissue
concentration were observed in the litter, fresh
leaves and twigs across the treatments. For the
litter, this ranged from 0.31% to 0.36%, while for
the fresh leaves this ranged from 6.4% to 8.3%. The
mean tissue concentration of Mg in the twigs
ranged from 6.6% to 7.2%.

Journal of Sustainable Society 42
Table 2. Nutrient concentration in pigeon pea biomass: Litter, Fresh Leaves and Twigs.
Treatment %N (L)
%N (F)
%N (T)
%P (L)
%P (F)
%P (T)
%K (L)
%K (F)
%K ( T)
%Ca (L)
%Ca (F)
%Ca (T)
%Mg (L)
%Mg (F)
%Mg (T)
1. Sole Maize - - - - - - - - - - - - - - -
2. Medium duration
Pigeon pea
0.65 2.4ab 2.4ab 0.20 0.33 0.15 0.25 1.51 1.04 1.21 2.6ab 1.3 0.35 6.4 6.6
3. Long duration Pigeon
pea
0.69 2.9ab 2.0b 0.18 0.15 0.17 0.31 1.04 0.78 1.40 2.7ab 1.9 0.31 7.9 6.9
4. Sole Groundnut - - - - - - - - - - - - - - -
5. Medium duration
Pigeon pea + Groundnut
0.59 3.1ab 2.6ab 0.30 0.19 0.14 0.28 0.87 0.93 1.64 2.9a 1.5 0.36 6.9 6.9
6. Long duration Pigeon pea + Groundnut
0.72 3.4a 2.3ab 0.18 0.25 0.19 0.29 0.78 1.51 1.64 2.0b 1.8 0.35 8.3 7.2
7. Medium duration Pigeon pea + Groundnut
0.78 2.9ab 3.2a 0.17 0.16 0.15 0.29 0.69 0.87 1.33 2.0b 2.0 0.35 7.7 11.5
8. Long duration Pigeon
pea + Groundnut
0.71 2.4b 2.4ab 0.17 0.26 0.21 0.28 0.93 0.69 1.53 2.6ab 1.7 0.34 7.7 7.2
CV % 36.2 15.5 25.7 20.9 47.7 40.1 32.4 40.5 40.5 18.00 9.4 30.8 9.33 11.8 4.4
LSD 0.45 0.81 1.2 0.08 0.20 0.12 0.17 0.99 0.99 0.48 0.42 0.95 0.06 1.9 25.9
Means with different superscripts within a column are significantly different p<0.05; Number of replicates (N) = 3, L=Litter, F=Fresh leaves, T=Twigs.

43 A. T. Phiri et al.
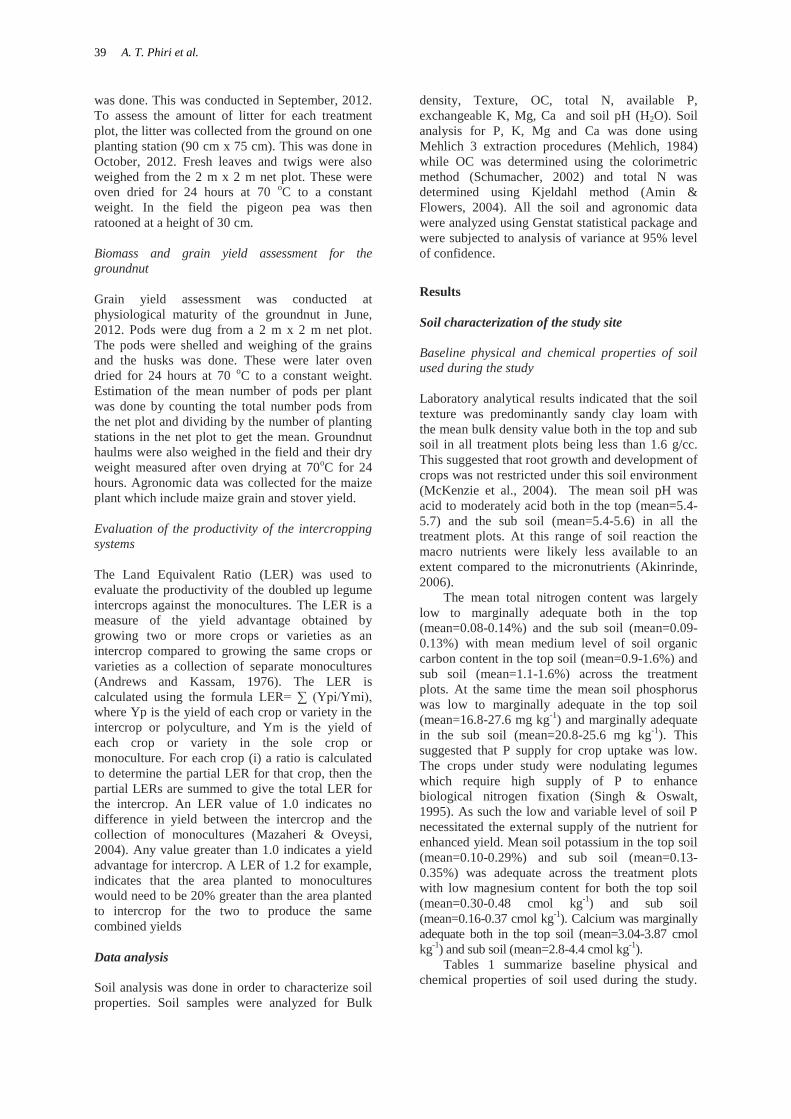
Pigeon pea biomass and nutrient yield: Litter,
Fresh Leaves and Twigs
Table 3 shows the mean pigeon pea biomass and
nutrient yield for the litter, fresh leaves and the
twigs on a hectare basis. It is worthwhile to state
that grain yield for the pigeon pea has not been
reported as this was extremely low across the
treatment. This was due to flower abortion and poor
podding. No significant differences were observed
in the mean biomass yield for the litter and fresh
leaves across the treatments. For the litter, this
ranged from 1,047 kg ha-1
to 1,753 kg ha-1
in the
treatments where biomass was incorporated into the
soil. While for the twigs the mean yield ranged
from 332 kg ha-1
to 553 kg ha-1
. Significant
differences (p<0.05) were observed in the mean yield
of twigs with the sole crop of long (861 kg ha-1
) and
medium duration pigeon pea (654 kg ha-1
) registering
the highest mean yield. The long duration pigeon
pea-groundnut intercrop (494 kg N ha-1
) and the
medium duration pigeon pea-groundnut intercrop
(370 kg ha-1
) gave the lowest mean yield.
For these treatments, no significant differences
were observed in the mean N yield for the litter and
fresh leaves across the treatments. This ranged from
7.7 kg N ha-1
to 11.6 kg N ha-1
for the litter, while for
the fresh leaves this ranged from 11.7 kg N ha-1
to
16.1 kg N ha-1
. While for the twigs, significant mean
yield differences were obtained across the
treatments. The sole crop of medium duration (19.8
kg N ha-1
) and long duration pigeon pea (17.5 kg N
ha-1
) gave the highest mean yield while the long
duration-groundnut intercrop (12.7 kg N ha-1
) and the
medium duration pigeon pea-groundnut intercrop
(11.6 kg N ha-1
) yielded the lowest.
For the mean P yield, no significant differences
were observed across the treatments in the litter,
fresh leaves and twigs. This ranged from 2.2 kg P
ha-1
to 3.2 kg P ha-1
for the litter, while for the fresh
leaves, this ranged from 0.77 kg P ha-1
to 0.97 kg P
ha-1
. In the twigs, the mean yield of P ranged from
0.91 kg P ha-1
to 1.7 kg P ha-1
.
For the mean yield of K, no significant
differences were observed across the treatments in
the litter and fresh leaves. This ranged from 9.7 kg
K ha-1
to 12.3 kg K ha-1
for the litter, while for the
fresh leaves, this ranged from 3.8 kg K ha-1
to 6.5
kg K ha-1
. Significant differences in the mean yield
of K in the twigs were observed. The highest yield
of K was obtained in the sole crop for the long
duration pigeon pea (5.2 kg K ha-1
) followed by the
sole crop for the medium duration pigeon pea (4.5
kg K ha-1
), long duration pigeon pea-groundnut
intercrop (3.6 kg K ha-1
) and medium duration
pigeon pea-groundnut intercrop (2.4 kg K ha-1
).
For the mean Ca and Mg yield, no significant
differences were observed across the treatments in
the litter, fresh leaves and twigs. Mean calcium
yield in the litter ranged from 20.1 kg Ca ha-1
to
26.5 kg Ca ha-1
. While in the fresh leaves this was
6.9 kg Ca ha-1
to 12.3 kg Ca ha-1
. For the twigs this
ranged from 7.0 kg Ca ha-1
to 11.5 kg Ca ha-1
.
For Mg the mean yield in the litter ranged from
5.1 kg Mg ha-1
to 7.1 kg Mg ha-1, while in the leaves
this ranged from 26.2 kg Mg ha-1 to 39.3 kg Mg ha
-1.
For the twigs this ranged from 29.9 kg Mg ha-1
to 49.5
kg Mg ha-1
.
Concentration of nutrients in groundnut pods,
haulms and grain
Table 4 shows nutrient concentration in the pods,
haulms and grains for the groundnut in different
treatments. No significant differences (p>0.05)
were observed in the mean concentration of N for
the treatments in which biomass was incorporated
into the soil. This ranged from 0.61% to 1.04% for
the pods, while for the haulms, this ranged from
2.4% to 3.2%. In the grain, the mean concentration
of N ranged from 4.6% to 6.5%.
For P in these treatments, the mean
concentration in the haulms and grains was
statistically the same, but statistically different in the
pods. Higher mean P concentration was detected in
the pods of the groundnut intercropped with medium
duration pigeon pea (0.12%), sole cropped groundnut
(0.10%) and groundnut intercropped with long
duration pigeon pea (0.10%) in the eighth treatment.
The lower mean P concentration for the pods was
given by the groundnut intercropped with long
duration pigeon pea (0.09%) in treatment six. For the
haulms P concentration ranged from 0.15% to 0.30%
while for the grain this ranged from 0.81% to 0.92%.
No significant differences (p>0.05) were observed
in the mean concentration of K in the pods, haulms
and grains. This ranged from 0.99% to 1.47% for
the pods, while for the haulms it ranged from
0.33% to 0.59%. In the grains the mean K
concentration ranged from 0.84% to 1.02%.
For calcium (Ca) no significant differences
were observed in the mean tissue concentration for
the pods and the haulms. This ranged from 0.44%
to 0.66% in the pods and 0.74% to 1.08% in the
haulms. However significant differences (p<0.05)
of Ca concentration in the grain were recorded. The
highest mean was registered by the sole groundnut
treatment (0.84%) while the other treatments had
statistically similar mean concentration of Ca.
For magnesium (Mg), no significant differences
in the mean tissue concentration were observed for
the pods and the haulms. This ranged from 1.5% to
1.7% in the pods and 0.11% to 0.14% in the haulms.
However significant differences (p>0.05) of Mg
concentration in the grain were recorded. The highest
mean was registered by the sole groundnut treatment
(0.31%) and groundnut in the medium duration pigeon
pea-groundnut intercrop (0.28%). The groundnut in
the long duration pigeon pea-groundnut intercrop had
the lowest mean concentration of Mg (0.23%).
Journal of Sustainable Society 44
Table 3. Pigeon pea biomass and nutrient yield: Litter, Fresh Leaves and Twigs.
Treatment Yield
L kg ha-1
Yield
F kg ha-1
Yield T
kg ha-1
N
kg ha-1
(L)
N
kg ha-1
(F)
N
kg ha-1
(T)
P
kg ha-1
(L)
P
kg ha-1
(F)
P
kg ha-1
(T)
K
kg ha-1
(L)
K
kg ha-1
(F)
K
kg ha-1
(T)
Ca
kg ha-1
(L)
Ca
kg ha-1
(F)
Ca
kg ha-1
(T)
Mg
kg ha-1
(L)
Mg
kg ha-1
(F)
Mg
kg ha-1
(T)
1. Sole Maize - - - - - - - - - - - - - - - - - -
2. Medium duration
Pigeon pea
1,047 531a 654ab 7.7 13.5abc 19.8a 2.4 0.97a 1.5b 9.7 5.8 4.5b 23.5 10.6a 9.8 6.3 36.8 42.6
3. Long duration
Pigeon pea
1,235 479ab 861a 8.0 15.6ab 17.5ab 2.2 0.82a 1.7b 11.7 3.8 5.2a 26.5 12.3a 11.5 5.6 35.07 49.5
5. Medium duration
Pigeon pea + Groundnut
1,753 460ab 370bc 8.9 16.1a 11.6b 3.2 0.80a 1.06b 10.7 4.8 2.4d 20.1 12.0a 7.0 5.1 39.3 29.9
6. Long duration
Pigeon pea + Groundnut
1,620 332ab 494bc 11.6 11.7abc 12.7b 2.9 0.77a 0.91b 12.3 6.5 3.6c 26.4 6.9ab 8.7 7.1 26.2 40.6
7. Medium duration
Pigeon pea +
Groundnut
1,467 217bc 275c 10.7 6.5bc 10.6b 2.6 0.42ab 1.06b 9.0 2.1 1.9e 16.3 5.2b 11.2 3.3 18.4 40.2
8. Long duration
Pigeon pea +
Groundnut
2,114 123c 760a 12.0 6.2c 25.4a 3.6 0.35b 3.9a 9.5 3.0 2.8d 17.4 4.7b 13.5 3.9 13.95 57.3
CV % 48.9 37.1 29.8 32.7 35.4 23.8 43.1 38.3 35.8 22.06 33.2 44.1 37.7 33.7 20.01 37.8 34.98 29.5
LSD 1,370 255.1 327.3 5.9 9.3 8.5 2.07 0.61 1.30 4.2 3.3 0.5 14.9 6.6 4.5 4.5 22.4 28.2
Means with different superscripts within a column are significantly different p<0.05; Number of replicates (N) = 3, L=Leaves, F=Fresh leaves and T=Twigs
Table 4. Concentration of nutrients in groundnut pods, haulms and grain.
Treatment %N
(P)
%N
(H)
%N
(G)
%P
(P)
%P
(H)
%P
(G)
%K
(P)
%K
(H)
%K
(G)
%Ca
(P)
%Ca
(H)
%Ca
(G)
%Mg
(P)
%Mg
(H)
%Mg
(G)
1. Sole Maize - - - - - - - - - - - - - - -
2. Medium duration Pigeon pea - - - - - - - - - - - - - - -
3. Long duration Pigeon pea - - - - - - - - - - - - - - -
4. Groundnut 0.93 2.4 4.6 0.10ab 0.30 0.82 1.30 0.33 0.87 0.44 0.86 0.84a 1.5 0.11 0.31a
5. Medium duration pigeon pea +
Groundnut
0.84 3.2 6.1 0.12a 0.24 0.87 1.47 0.43 0.91 0.47 0.81 0.45b 2.0 0.14 0.26bc
6. Long duration pigeon pea +
Groundnut
0.61 2.4 5.5 0.09b 0.17 0.81 0.99 0.59 0.86 0.52 1.08 0.44b 1.3 0.12 0.23c
7. Medium duration Pigeon pea +
Groundnut
0.86 2.9 6.5 0.12a 0.17 0.92 1.16 0.42 1.02 0.57 0.93 0.47b 1.7 0.13 0.28ab
8. Long duration pigeon pea +
Groundnut
1.04 2.7 5.0 0.10ab 0.15 0.85 1.12 0.48 0.84 0.66 0.74 0.44b 1.7 0.12 0.25c
CV % 39.6 21.1 27.4 15.0 48.9 7.34 41.7 28.8 30.3 18.7 34.4 9.31 27.4 17.8 10.9
LSD 0.64 1.10 2.90 0.03 0.19 0.12 0.95 0.24 0.51 0.18 0.57 0.08 0.86 0.04 0.05
Means with different superscripts within a column are significantly different p<0.05; Number of replicates (N) = 3, P=Pods, H=Haulms and G=grain

45 A. T. Phiri et al.
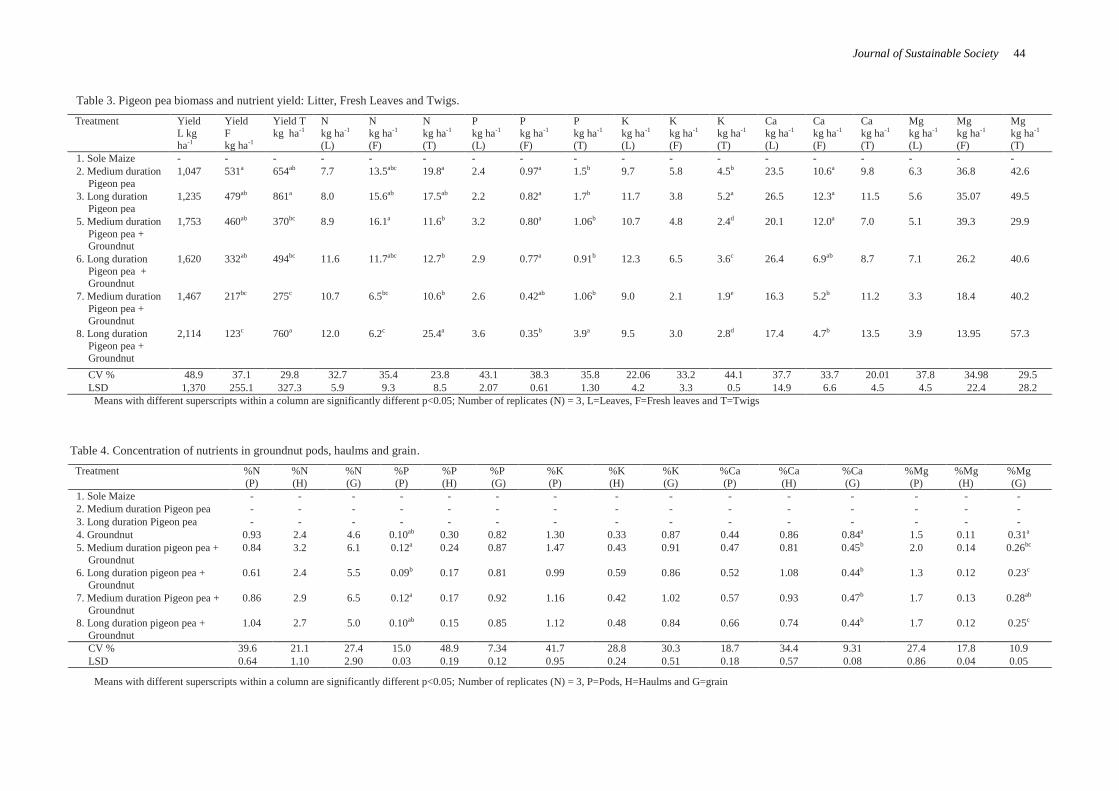
Groundnut pod, haulms, grain and nutrient yield
The table 5 below shows the groundnut biomass
and nutrient yield for the pods, haulms and the
grain on a hectare basis. No significant differences
were observed in the mean biomass yield for the
pods, haulms and grain across the treatments. This
suggests that intercropping did not depress these
yield components of the groundnut. For the pods,
this ranged from 136 kg ha-1
to 619 kg ha-1
. While
for the haulms this ranged from 413 kg ha-1
to 656
kg ha-1
. The mean grain yield ranged from 549 kg
ha-1
to 873 kg ha-1
.
For the mean N yield, significant differences
were observed for the pods across the treatments in
which biomass was incorporated. Higher mean N
yield was observed in the groundnut pods in the
sole groundnut (2.4 kg ha-1
) and in the fifth
treatment (Long duration pigeon pea-groundnut
intercrop-1.8 kg ha-1
). This was followed by the
sixth treatment (Long duration pigeon pea-
groundnut intercrop-0.98 kg ha-1
).
For the mean P yield, no significant differences
were observed across the treatments in the pods,
haulms and grains. This ranged from 0.15 kg P ha-1
to 0.20 kg P ha-1
for the pods. For the haulms
statistically higher mean P yields were obtained in
all the treatments except the eighth treatment (0.6
kg P ha-1
). In the grain no significant differences
were obtained and this ranged from 4.7 kg P ha-1
to
6.7 kg P ha-1
.
For the mean K yield, no significant
differences were observed across the treatments in
the pods, haulms and grain. This ranged from 1.9
kg K ha-1
to 2.8 kg K ha-1
for the pods, while for the
haulms, this ranged from 2.0 kg K ha-1
to 3.5 kg K
ha-1
. In the grain this ranged from 4.3 kg K ha-1
to
7.1 kg K ha-1
.
Significant differences in the mean yield of K
in the twigs, was observed. The highest yield of K
was obtained in the sole crop for the long duration
pigeon pea (5.2 kg K ha-1
) followed by the sole crop
for the medium duration pigeon pea (4.5 kg K ha-1
),
long duration pigeon pea-groundnut intercrop (3.6
kg K ha-1
) and medium duration pigeon pea-
groundnut intercrop (2.4 kg K ha-1
).
For the mean Ca yield, no significant
differences were observed across the treatments in
the pods. The mean calcium yield in the litter
ranged from 20.1 kg Ca ha-1
to 26.5 kg Ca ha-1
.
While in the fresh leaves this was 6.9 kg Ca ha-1
to
12.3 kg Ca ha-1
. For the twigs this ranged from 7.0
kg Ca ha-1
to 11.5 kg Ca ha-1
.
For Mg the mean yield in the litter ranged from
5.1 kg Mg ha-1
to 7.1 kg Mg ha-1
, while in the
leaves this ranged from 26.2 kg Mg ha-1
to 39.3 kg
Mg ha-1
. For the twigs this ranged from
29.9 kg Mg ha-1
to 49.5 kg Mg ha-1
.
Estimated nitrogen and phosphorus yield returned
to the soil
Table 6 below indicates the estimated mean
nitrogen and phosphorus yield returned to the soil
after biomass incorporation in each treatment that
had the biomass buried into the soil. Estimated
yield for N and P returned to the soil for the
intercrops was obtained by summing up the
respective yield from the pigeon pea and groundnut.
The medium duration pigeon pea-groundnut
intercrop (50.6 kg N ha-1
) and the long duration
pigeon pea-groundnut intercrop (49.6 kg N ha-1
)
gave statistically higher mean yield than the long
duration pigeon pea sole crop (41.1 kg N ha-1
) and
the medium duration pigeon pea sole crop (41.0 kg
N ha-1
). Low mean N yield was generated by the
groundnut sole crop (12.8 kg N ha-1
).
Significant differences were obtained in the
mean yield of P across the treatments. For the
treatments that had the biomass buried treatment
five, medium duration pigeon pea-groundnut
intercrop (6.5 kg P ha-1
) gave the highest yield, this
was followed by treatment six, long duration pigeon
pea-groundnut intercrop (5.4 kg P ha-1
), medium
duration pigeon pea sole crop (4.9 kg P ha-1
), long
duration pigeon pea sole crop (4.7 kg P ha-1
) and
groundnut sole crop (1.9 kg P ha-1
).
Journal of Sustainable Society 46
Table 5. Groundnut pod, haulms, grain and nutrient yield.
Treatment Pods
yield kg ha-1
Haulms
yield kg ha-1
Grain
yield kg ha-1
N
kg ha-1
(P)
N
kg ha-1
(H)
N
kg ha-1
(G)
P
kg ha-1
(P)
P
kg ha-1
(H)
P
kg ha-1
(G)
K
kg ha-1
(P)
K
kg ha-1
(H)
K
kg ha-1
(G)
Ca
kg ha-1
(P)
Ca
kg ha-1
(H)
Ca
kg ha-1
(G)
Mg
kg ha-1
(P)
Mg
kg ha-1
(H)
Mg
kg ha-1
(G)
1. Sole Maize - - - - - - - - - - - - - - - - - -
2. Medium duration
Pigeon pea
- - - - - - - - - - - - - - - - - -
3. Long duration Pigeon
pea
- - - - - - - - - - - - - - - - - -
4. Groundnut 188 656 647 2.4a 12.8 29.0 0.17 1.87a 5.3 2.8 3.5 4.3 1.10 5.7a 9.7 4.6 0.74a 1.8
5. Medium duration pigeon pea + Groundnut
619 612 569 1.8ab 13.6 27.7 0.15 1.41ab 4.7 2.1 2.8 5.7 0.72 1.4c 11.4 2.1 0.83a 1.4
6. Long duration pigeon
pea + Groundnut
182 479 691 0.98b 11.5 38.12 0.16 0.81ab 6.07 2.1 2.0 7.1 1.10 4.0b 7.7 2.9 0.58b 1.9
7. Medium duration Pigeon pea + Groundnut
136 498 549 1.3b 14.0 29.59 0.19 0.86ab 4.7 1.9 2.7 5.3 0.64 4.7ab 9.7 1.8 0.64a
b 1.6
8. Long duration pigeon
pea + Groundnut
240 413 873 2.5a 10.9 39.53 0.20 0.60b 6.7 2.0 2.2 6.6 1.10 3.1b 12.5 4.4 0.50
b
2.0
CV % 61.0 9.9 50.7 30.2 22.03 29.85 45 56 36.1 27.9 32.3 36.7 32.3 19.9 21.9 47.3 17.7 25.4
LSD 732.6 732.6 636.1 1.02 5.2 18.43 0.15 1.18 3.7 1.2 1.61 4.0 0.55 1.7 4.2 2.8 0.22 0.84
Means with different superscripts within a column are significantly different p<0.05; Number of replicates (N) = 3,
NB: The maize control plot yielded a mean grain yield of 646 kg ha-1 and a mean stover yield of 327 kg ha-1
Table 6. Estimated nitrogen and phosphorus yield returned to the soil.
Treatment N kg ha-1
(PP/L)
N kg ha-1
(PP/F)
N kg ha-1
(PP/T)
N kg ha-1
(GN/P)
N kg ha-1
(GN/H)
N kg ha-1
(GN/G)
N returned to
soil kg ha-1
P kg ha-1
(PP/L)
P kg ha-1
(PP/F)
P kg ha-1
(PP/T)
P kg ha-1
(GN/P)
P kg ha-1
(GN/H)
P kg ha-1
(GN/G)
P returned to
soil kg ha-1
1.Sole Maize - - - - - - - - - - - - - -
2. Medium duration Pigeon pea 7.7 13.5ab 19.8a - - - 41.0b 2.4 0.97a 1.5a - - - 4.9c
3. Long duration Pigeon pea 8.0 15.6ab 17.5ab - - - 41.1b 2.2 0.82ab 1.7a - - - 4.7d
4. Groundnut only - - - 2.4a 12.8 29.0 12.8c - - - 0.17 1.9 5.3 1.9e
5. Medium duration Pigeon pea +
Groundnut
8.9 16.1a 11.6b 1.8ab 14.0 27.7 50.6a 3.2 0.80ab 1.1b 0.15 1.41 4.7 6.5a
6. Long duration Pigeon pea + Groundnut
11.6 11.7ab 12.7b 0.98b 13.6 38.1 49.6a 2.9 0.77ab 0.91b 0.16 0.81 6.1 5.4b
CV % 32.7 35.4 23.8 30.2 22.03 29.9 2.71 43.1 38.3 35.8 45 56 36.1 1.86
LSD 5.9 9.3 8.5 1.02 5.2 18.43 2.0 2.07 0.61 1.28 0.15 1.18 3.7 0.2
Means with different superscripts within a column are significantly different p<0.05; Number of replicates (N) = 3, PP/L= Pigeon pea litter, PP/F= Pigeon pea fresh leaves. PP/T= Pigeon pea twigs. GN/P= Groundnut pods,
GN/H= Groundnut haulms and GN/G= Groundnut grain
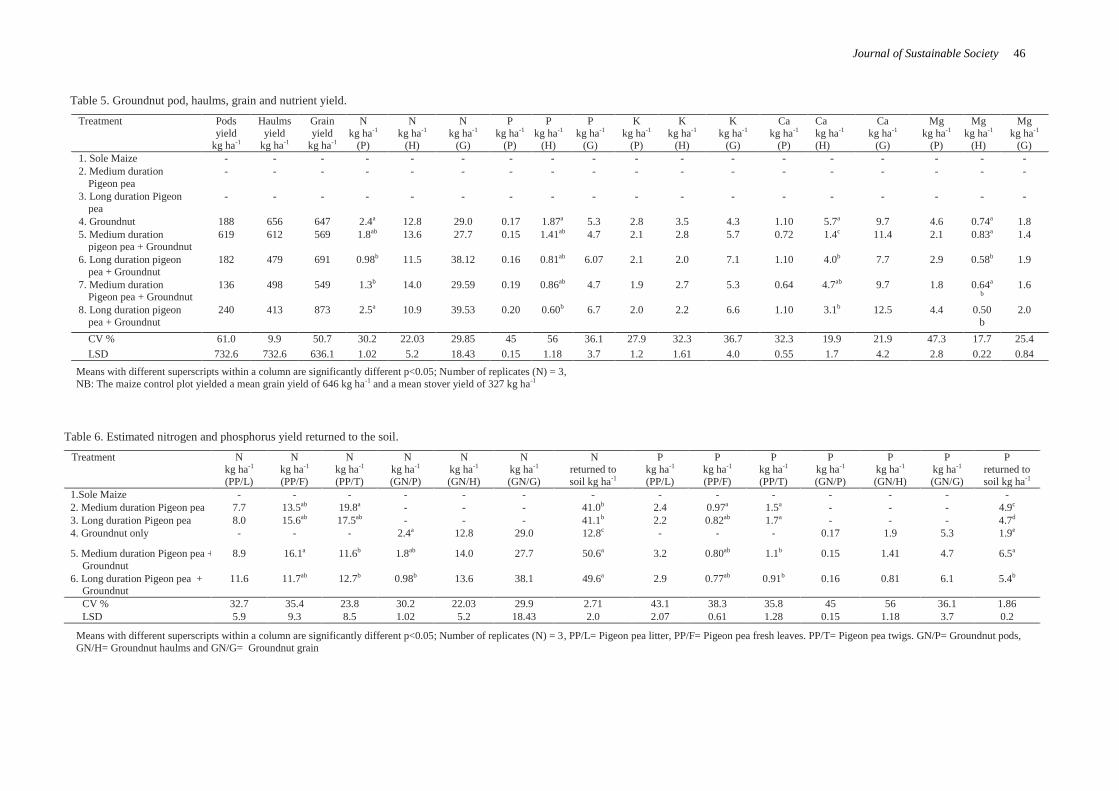
47 A. T. Phiri et al.
Table 7 shows the evaluation of the productivity of
the intercrops using the LER on the basis of biomass
production. In general all intercrops registered a
yield advantage above the monocultures of both the
pigeon pea and groundnut. The higher yield
advantage over the monocultures was registered by
the medium duration pigeon pea-groundnut
intercrop.
Table 7. Evaluation of the productivity of the intercrop against the monocultures: Biomass.
Treatment Total Pigeon pea biomass (leaves
plus twigs)
Groundnut Haulms
(kg/ha-1)
Partial LER= ∑ (Ypi/Ymi)-
Pigeon pea
Partial LER= ∑ (Ypi/Ymi)
Groundnut
LER= ∑ (Ypi/Ymi)
1.Sole Maize - - - - -
2. Medium duration Pigeon pea 2,034 - - - -
3. Long duration Pigeon pea 2,636 - - - -
4. Groundnut only - 656a - - -
5. Medium duration Pigeon pea + Groundnut 2,245 612a 1.10 0.93 2.03
6. Long duration Pigeon pea + Groundnut 2,593 479b 0.98 0.73 1.71
CV% 29.2 9.9 - - -
LSD0.05 1,322 98.9 - - -
Means with different superscripts within a column are significantly different p<0.05; Number of replicates (N) = 3; LER=Land equivalent ratio.
Discussion
Growth rate of medium and long duration pigeon
pea in sole stands and intercrops
In general, for the first forty days after planting, the
medium duration pigeon pea intercropped with
groundnut had the faster growth rate. This was
followed by the long duration pigeon pea
intercropped with groundnut, long duration pigeon
pea in the pure stand and medium duration pigeon
pea in the pure stand. Beyond this, generally,
growth rate in all the stands slowed down with the
medium duration pigeon pea-groundnut intercrop
registering a marked reduction in the rate of growth.
This contrasted vividly with the observation made
in the medium duration pure stand in which a
gradual slowing down of the growth rate was
noticed. The observed trend could be attributed to
increased competition for growth factors in the
intercrop between the pigeon pea and groundnut.
The competition effect might have been less
pronounced in the medium duration pigeon pea
pure stand hence the gradual slowing down of the
growth rate. Between the fortieth to the sixty
seventh day from planting, intriguingly, though at a
slower rate, the long duration pigeon pea-groundnut
intercrop registered a slightly higher growth rate
than the long duration pigeon pea in the pure stand.
After this phase growth rate increased sharply in the
pure stand and eventually slowed down, while in
the intercrop growth rate reduced slowly.
The effect of intercropping on the yield components
of the pigeon pea and groundnut
The evaluation of the intercrops against the
monocultures (Table 5) on LER basis revealed that,
intercropping of the two legumes is more productive
than growing each of the crops separately. This was
in agreement with the findings of other researchers
(Schilling & Gibbons, 2002, Phiri et al., 2013). This
yield advantage was not only observed at cropping
system level but also at the yield component level of
the crops in the cropping system (Tables 2b and 3b).
The advantage of the pigeon pea-groundnut double
legume intercropping system over the monocultures
of either of the legumes was fortified further by the
estimated yield of nitrogen obtain from the system.
Both the medium duration and long duration pigeon
pea-groundnut intercrop gave statistically similar
estimated mean nitrogen yield (Table 4). This was
higher than the estimated mean yield of nitrogen
that was generated by the monocultures of the two
legumes with the groundnut sole crop generating
the lowest estimated yield of nitrogen. It is
worthwhile to note that the estimated mean nitrogen
yield for the pigeon pea monocultures and the
pigeon pea-groundnut intercrop could have been
slightly higher given the fact that mean nitrogen
yield estimate in the roots and stems of the legume
was not conducted hence this was not included in
the assessment. The legume biomass was
incorporated into the soil. However, going by the
estimated mean yield of nitrogen both for the
monocultures and the intercrops, it is evident that
external supplement of nitrogen will be required for
the succeeding maize crop if yield is to be
enhanced. The question that might require
investigation however is, after incorporation of the
legume biomass into the soil how much of this
external nitrogen will be required to optimize yield
while reducing the cost accrued by purchasing the
external source of nitrogen.
The mean yield of phosphorus across the
treatments was very low. As such partial supply of
phosphorus requirements to the succeeding maize
crop using the legume biomass alone is not
possible. This has been further aggravated by the
prevailing soil reaction which tends to increase the
fixation of the nutrient. Use of external mineral

Journal of Sustainable Society 48
source of phosphorus on the subsequent maize crop
is therefore indispensable.
Conclusion
The study revealed that the soil on which the trial
was mounted had soil texture that was predominantly
sandy clay loam, with variable pH. The soil reaction
ranged from acid to moderately acid. This range of
soil reaction might have reduced the availability of
the macronutrients for crop uptake. This was further
compounded by the inherently low soil nitrogen,
marginally adequate soil phosphorus, calcium and
low magnesium content. Though phosphorus was
externally supplied through TSP to make up for the
shortfall, the rate used might not have been high
enough to offset a possible high phosphorus fixation
capacity of the soil, going by the soil reaction values.
This could have had a net effect of depressing a
phosphorus response in the crops.
The study however has confirmed the viability
of the pigeon pea-groundnut intercropping system,
discounting the observed low grain yield of the
groundnut and extremely low grain yield of the
pigeon pea. This was explainable interms of late
planting, a prolonged dry spell soon after the
emergence of the crops and soil fertility factors. Not
with standing this it was observed that the other yield
components of the crops in the system were not
compromised. Over and above, the nitrogen yields
for the cropping system were deemed to be
reasonably high. Employing this system in rotation
with maize might reduce to an extent the amount and
hence the cost of mineral fertilizer required for maize
production. The reduction in the amount of mineral
fertilizer will come about not only due to the
mineralization of the organically bound nitrogen but
also due to the buffering effect that the organic
residues have on the soil pH and the potential to
increase the cation exchange capacity of the soil.
However the question that might need to be
answered empirically is, how much of this external
nitrogen will be required to optimize yield while
reducing the cost accrued by purchasing the external
source of nitrogen.
Acknowledgement
The authors would like to thank the Alliance for Green Revolution in Africa (AGRA) through Sokoine University of
Agriculture, Tanzania for funding the work. We are also deeply
thankful for the Ministry of Agriculture and Food Security in Malawi who through the Department of Agricultural Research
Services provided the requisite material and moral support for
the execution of the project. This support came inform provision
of experimental land at Chitedze Agricultural Research Station, access to laboratory facilities at Bvumbwe and Chitedze
Agricultural Research Stations and support staff.
References
Amin, M., & Flowers, T. H. (2004). Evaluation of the Kjeldahl
Digestion Method. Journal of Research (Science)15
(2):159-179. Andrews, D.J., & Kassam, A.H. (1976). The importance of
multiple cropping is increasing world food supplies. Am. Soc. Agron., 27, 1-10.
Clawson, D. L. (1985). Harvest security and intraspecific
diversity in traditional tropical agriculture. Econ Bot , 39:56-67.
El-Swaify, S.A., Lo A.K.F., Joy, R., Shinshiro, L., & Yost R.S.
(1988). Achieving conservation effectiveness in the tropics using legume-intercrops. Soil Technol 1:1-12.
GoM (Government of Malawi), (2001). State of Environment
Report for Malawi 2001, Lilongwe: Ministry of Natural Resources and Environmental Affairs
Hayat, R. (2005). Sustainable legume-cereal cropping system
through management of biological nitrogen fixation in Pothwar. PhD thesis, University of Arid Agriculture,
Rawalpindi.
Machado, S. (2009). Does intercropping have a role in modern agriculture? Journal of Soil and Water Conservation 64: 2.
Mazaheri, D. & Oveysi, M. (2004). Effects of intercropping of
two corn varieties at various nitrogen levels. Iranian Journal of Agronomy. 7: 71-76.
McKenzie N.J., Jacquier D.J., Isbell R.F., & Brown K.L.
(2004). Australian Soils and Landscapes an Illustrated Compendium. CSIRO Publishing: Collingwood, Victoria.
Mehlich, A. (1984). Mehlich 3 soil test extractant: A
modification of mehlich 2 extractant. Community of Soil Science & Plant Analysis, 15(12), 1409-1416.
NSO (National Statistical Office), (2002). Statistical yearbook
2002. Zomba: National Statistical Office. Okalebo, J.R., Pal, C.A., Lekasi, J.K., Nandwa S.M., Othieno
C.O., Waigwa M., & Ndungu K.W. (2000). Use of organic
and inorganic resources to increase maize yields in some Kenyan infertile soils: A five-year experience.
Phiri A.T., Mhango W.G., Njoloma J.P., Kanyama-Phiri G.Y. &
Lowole M.W. (2012). Farmers’ evaluation of integrated soil fertility management methods in Northern Kasungu
Central Malawi, Journal of Agricultural Extension and
Rural Development ,4(11), 340-346, 27 June, 2012. Phiri A.T., Njoloma J.P., Kanyama-Phiri G.Y., Sieglinde S. &
Lowole M.W. (2013). Effects of intercropping systems and
the application of Tundulu Rock phosphate on groundnut grain yield in Central Malawi. International Journal of
Plant and Animal Sciences, 1 (1), 011-020.
Schillings, R. & Gibbons, R. (2002). Groundnut London and Oxford: Macmillan Education Ltd. p. 146.
Schumacher B.A., (2002). Method for the determination of total
organic carbon (TOC) in soils and sediments. United States Environmental Protection Agency Environmental
Sciences Division National Exposure Research Laboratory,
Las Vegas. Singh, F. & Oswalt, D.L. (1995). Groundnut production
practices. Skill Development Series no.3 Retrieved from: www.icrisat.org
.
Copyright © 2022 FDOKUMEN