Color Indicator Film From Butterfly Pea (Clitoria Ternatea L ...
13
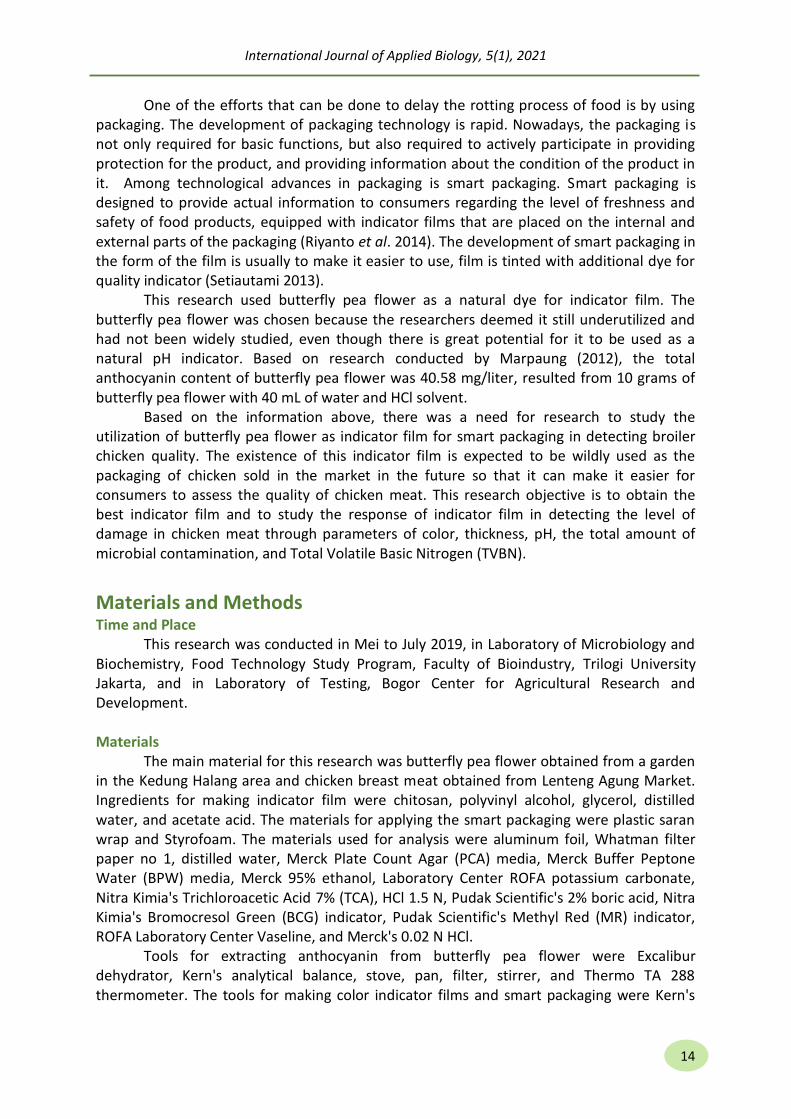
CONTACT : HERMAWAN SEFTIONO [email protected] 13 Abstract Broiler chicken is one of the poultry products that are very susceptible to damage due to exposure to microbes, temperature, and light. In these conditions, indicators are needed to play a role in informing related changes in the product quality. The butterfly pea can be used as an indicator because it contains anthocyanin which can change color due to the influence of pH. The objective of this study was to obtain the best indicator film formulation and to determine the film response in detecting the level of damage of the chicken meat through parameters of color change, thickness, pH, TPC, and TVBN. The methods in this research were the extraction of butterfly pea, making indicator films, and applying the film to chicken meat, and physical and chemical analysis of the product. Anthocyanin was applied to the indicator film with levels of PVA and chitosan 20:80 with the addition of 5 mL of dye. The change in color of the indicator could be seen at the 24-hour mark, which was a yellowish-green color. The pH value of broiler chicken meat had entered the post-rigor stage at 24 hours with a pH value of 6.595±0.049. The TVBN regression value showed that broiler chicken meat was not safe for consumption after being stored for 4 hours and 23 minutes of 40 mgN/100 g. The TPC test that has been performed in chicken meat showed that the chicken meat was not safe for consumption in storage between 0 to 8 hours at 5.598±0.068 log CFU/g to 8.322± 0.053 log CFU/g. ISSN : 2580-2410 eISSN : 2580-2119 Color Indicator Film From Butterfly Pea (Clitoria Ternatea L.) as Smart Packaging in Broiler Chicken Meat Hermawan Seftiono 1* , Della Ayu Pramesti 1 , Inanpi Hidayati Sumiasih 1 1 Food Technology Study Program, Faculty of Bioindustry, Trilogi University, Jakarta, Indonesia Introduction The production of broiler chicken in Indonesia had been increasing each year. Based on statistical data, the production of broiler chicken in 2018 was 2.144.013 tons, an increase compared to 2014 which was 1.544.379 tons (Center Bureau of Statistic 2018). The increase in broiler chicken production indicates that there is a high level of public consumption of chicken meat due to its relatively affordable price, it can be obtained easily to obtain, and its high nutritional content (Winda 2016). Its high nutritional content causes broiler chicken meat to easily degraded because it is a good medium for microorganisms (Barus et al. 2017). Furthermore, the decomposition of protein by microorganisms resulted in foul- smelling compounds such as indole, skatole, H2S, and NH3 which accelerate the rotting process of chicken meat (Warsiki et al. 2012). OPEN ACCESS International Journal of Applied Biology Keyword Anthocyanin, Discoloration, pH indicator, TVBN Article History Received 31 March 2021 Accepted 03 July 2021 International Journal of Applied Biology is licensed under a Creative Commons Attribution 4.0 International License, which permits unrestricted use, distribution, and reproduction in any medium, provided the original work is properly cited.
-
Upload
khangminh22 -
Category
Documents
-
view
0 -
download
0
Transcript of Color Indicator Film From Butterfly Pea (Clitoria Ternatea L ...
CONTACT : HERMAWAN SEFTIONO [email protected]
13
Abstract Broiler chicken is one of the poultry products that are very susceptible to damage due to exposure to microbes, temperature, and light. In these conditions, indicators are needed to play a role in informing related changes in the product quality. The butterfly pea can be used as an indicator because it contains anthocyanin which can change color due to the influence of pH. The objective of this study was to obtain the best indicator film formulation and to determine the film response in detecting the level of damage of the chicken meat through parameters of color change, thickness, pH, TPC, and TVBN. The methods in this research were the extraction of butterfly pea, making indicator films, and applying the film to chicken meat, and physical and chemical analysis of the product. Anthocyanin was applied to the indicator film with levels of PVA and chitosan 20:80 with the addition of 5 mL of dye. The change in color of the indicator could be seen at the 24-hour mark, which was a yellowish-green color. The pH value of broiler chicken meat had entered the post-rigor stage at 24 hours with a pH value of 6.595±0.049. The TVBN regression value showed that broiler chicken meat was not safe for consumption after being stored for 4 hours and 23 minutes of 40 mgN/100 g. The TPC test that has been performed in chicken meat showed that the chicken meat was not safe for consumption in storage between 0 to 8 hours at 5.598±0.068 log CFU/g to 8.322± 0.053 log CFU/g.
ISSN : 2580-2410 eISSN : 2580-2119
Color Indicator Film From Butterfly Pea (Clitoria Ternatea L.) as Smart Packaging in Broiler Chicken Meat
Hermawan Seftiono1*, Della Ayu Pramesti1, Inanpi Hidayati Sumiasih1
1Food Technology Study Program, Faculty of Bioindustry, Trilogi University, Jakarta, Indonesia
Introduction
The production of broiler chicken in Indonesia had been increasing each year. Based on statistical data, the production of broiler chicken in 2018 was 2.144.013 tons, an increase compared to 2014 which was 1.544.379 tons (Center Bureau of Statistic 2018). The increase in broiler chicken production indicates that there is a high level of public consumption of chicken meat due to its relatively affordable price, it can be obtained easily to obtain, and its high nutritional content (Winda 2016). Its high nutritional content causes broiler chicken meat to easily degraded because it is a good medium for microorganisms (Barus et al. 2017). Furthermore, the decomposition of protein by microorganisms resulted in foul-smelling compounds such as indole, skatole, H2S, and NH3 which accelerate the rotting process of chicken meat (Warsiki et al. 2012).
OPEN ACCESS International Journal of Applied Biology
Keyword Anthocyanin, Discoloration, pH indicator, TVBN
Article History Received 31 March 2021 Accepted 03 July 2021
International Journal of Applied Biology is licensed under a Creative Commons Attribution 4.0 International License, which permits unrestricted use, distribution, and reproduction in any medium, provided the original work is properly cited.
International Journal of Applied Biology, 5(1), 2021
14
One of the efforts that can be done to delay the rotting process of food is by using packaging. The development of packaging technology is rapid. Nowadays, the packaging is not only required for basic functions, but also required to actively participate in providing protection for the product, and providing information about the condition of the product in it. Among technological advances in packaging is smart packaging. Smart packaging is designed to provide actual information to consumers regarding the level of freshness and safety of food products, equipped with indicator films that are placed on the internal and external parts of the packaging (Riyanto et al. 2014). The development of smart packaging in the form of the film is usually to make it easier to use, film is tinted with additional dye for quality indicator (Setiautami 2013).
This research used butterfly pea flower as a natural dye for indicator film. The butterfly pea flower was chosen because the researchers deemed it still underutilized and had not been widely studied, even though there is great potential for it to be used as a natural pH indicator. Based on research conducted by Marpaung (2012), the total anthocyanin content of butterfly pea flower was 40.58 mg/liter, resulted from 10 grams of butterfly pea flower with 40 mL of water and HCl solvent.
Based on the information above, there was a need for research to study the utilization of butterfly pea flower as indicator film for smart packaging in detecting broiler chicken quality. The existence of this indicator film is expected to be wildly used as the packaging of chicken sold in the market in the future so that it can make it easier for consumers to assess the quality of chicken meat. This research objective is to obtain the best indicator film and to study the response of indicator film in detecting the level of damage in chicken meat through parameters of color, thickness, pH, the total amount of microbial contamination, and Total Volatile Basic Nitrogen (TVBN).
Materials and Methods Time and Place
This research was conducted in Mei to July 2019, in Laboratory of Microbiology and Biochemistry, Food Technology Study Program, Faculty of Bioindustry, Trilogi University Jakarta, and in Laboratory of Testing, Bogor Center for Agricultural Research and Development.
Materials
The main material for this research was butterfly pea flower obtained from a garden in the Kedung Halang area and chicken breast meat obtained from Lenteng Agung Market. Ingredients for making indicator film were chitosan, polyvinyl alcohol, glycerol, distilled water, and acetate acid. The materials for applying the smart packaging were plastic saran wrap and Styrofoam. The materials used for analysis were aluminum foil, Whatman filter paper no 1, distilled water, Merck Plate Count Agar (PCA) media, Merck Buffer Peptone Water (BPW) media, Merck 95% ethanol, Laboratory Center ROFA potassium carbonate, Nitra Kimia's Trichloroacetic Acid 7% (TCA), HCl 1.5 N, Pudak Scientific's 2% boric acid, Nitra Kimia's Bromocresol Green (BCG) indicator, Pudak Scientific's Methyl Red (MR) indicator, ROFA Laboratory Center Vaseline, and Merck's 0.02 N HCl.
Tools for extracting anthocyanin from butterfly pea flower were Excalibur dehydrator, Kern's analytical balance, stove, pan, filter, stirrer, and Thermo TA 288 thermometer. The tools for making color indicator films and smart packaging were Kern's
International Journal of Applied Biology, 5(1), 2021
15
analytical balance, Thermo TA 288 thermometer, beaker, Stuart hot plate, magnetic stirrer, measuring cup, and plastic mold 12x12 cm in size. The tools for analysis were Agilent Technologies pH meter, screw micrometer, TCR 200 chromameter, petri dish, Memmert's oven, Erlenmeyer, test tube, burner, mortar and pestle, Memmert's incubator, micropipette, UV-Vis spectrophotometer, Conway dish, Hirayama autoclave, vortex ZX3, burette, stative, and pipette.
Experimental Methods Butterfly Pea Flower Extraction (Sinha et al. 2012 with modification)
Butterfly pea flower that had been clean, dried using dehydrator at 60 oC for 1 hour (modification). Next, 5 grams of the dried flower was mixed with 250 mL distilled water and heated at 80 oC for 5 to 10 minutes. After heating, the mixture was then cooled and filtered. The filtrate was used for the next step.
Making Color Indicator Film (Warsiki et al. 2013 with modification)
Polyvinyl alcohol was dissolved in distilled water at 80 oC for 30 minutes using a hot plate. Then the chitosan was dissolved using 1% acetic acid, then distilled water was added and heated at 80 oC for 30 minutes. Polyvinyl alcohol solution was mixed with the chitosan-acetate solution according to the ratio (100: 0), (80:20), (60:40), (40:60), (20:80).
The next step was to add 1% glycerol, then homogenization was carried out by stirring. Next, butterfly pea flower extract was added as the natural dyes. The technique for staining the film was done by mixing it directly into the film solution before molding. The amount of butterfly pea flower extracts added were 5, 10, 15, and 20 ml. The homogeneous solution was molded with a plastic mold measuring 12x12 cm. Modifications were made to the temperature and drying time of the indicator film, the film was dried at room temperature of 25 oC for 48 hours.
Application of Indicator Film on Chicken Meat (Octavia 2015 with modification)
The application of indicator film was conducted using a method developed by Octavia (2015) with modifications. The modifications were the temperature and testing time. Indicator film applied to the chicken meat by placing the indicator film sized 3 x 3 cm on the upper side of the packaging. The chicken meat was measured to be 60 grams, put on the Styrofoam, and wrapped using plastic saran wrap which has previously been affixed with indicator film. Nest, chicken meat was stored at room temperature of 25 ºC, RH of 50% for 48 hours. The observations were conducted at hours 0, 8, 24,32, and 48 to see the changes in indicator film.
Analytical Method
The main experiments in this research included the pH test and the anthocyanin content of butterfly pea flower extract (Less & Francis 1972 in Nofrida 2013), indicator film thickness test (Nofrida 2013), color analysis of indicator film (Hunter 1958 in Octavia 2015; Nofrida 2013), analysis of quality degradation of meat, including pH test of chicken meat (Mega et al. 2009), Total Plate Count test (TPC) (BSN 2008), Total Volatile Basic Nitrogen (TVBN) (BSN 2009).

International Journal of Applied Biology, 5(1), 2021
16
Results and Discussion Chemical characteristics of Butterfly Pea Flower Extract
Extraction aims to obtain the chemical compound of material using certain solvents (Santoso & Estiasih 2014). The extraction method used in this research was hot maceration with a temperature of 80 oC for 5 to 10 minutes. According to Rahmawati (2017), the best heating process to prevent anthocyanin degradation was by using high temperatures for a short period. The pH value of the butterfly pea flower extract in this study was 5.838 which resulted in a purplish-blue color. The presence of a purplish-blue color in the butterfly pea flower extract indicates the presence of natural pigments. Natural pigments that give butterfly pea flowers their purplish-blue color is delphinidin anthocyanins (Change 2018).
The analysis result of anthocyanin in butterfly pea flower was 218.232 mg/kg. The anthocyanin level obtained was lower than the research result by Vankar & Srivastava (2010) which was 227.42 mg/kg. The difference was due to different extraction methods, the solvent used, butterfly pea variety, and time of harvest. The extraction process of anthocyanin by Vankar & Srivastava (2010) used the cold maceration method by keeping the solution at room temperature, in the dark, for 2 to 3 hours, using methanol and 0.1% HCl as the solvent. While in this research, the extraction method used was hot maceration at 80 oC for 5 to 10 minutes with water as the solvent.
Other than extraction method and solvent, the different anthocyanin levels from each research were could also because of different butterfly pea variety used and harvest time. This was supported by Ahmadiani et al. (2014), that the different varieties could result in different concentrations of anthocyanin, and the longer the harvest time, the lower the anthocyanin level.
Determination of Best Formulation
The experiment was to obtain the best formulation of indicator film based on the ratio of PVA, chitosan, and natural dye from butterfly pea flower extract to detect the degradation level of broiler chicken meat in storage. In this research, there were 5 formulations tested, namely F1, F2, F3, F4, and F5 and the addition of butterfly pea flower extract of 5, 10, 15, and 20 ml.
The best formulation was determined by the intensity of color change during storage. The intensity of color change from 5 formulations with the addition of 5 ml butterfly pea flower extract was shown in Figure 1. The formulation of F5 with the addition of 5 ml butterfly pea flower extract was chosen as the best formulation because the film changed its color from greenish blue to yellowish-green. The change in indicator film was due to the protein degradation process in chicken meat that produced basic volatile compounds (Rahardjo & Simon 2015). The chosen formulation was then used as an indicator film that would be applied to the smart packaging.
Figure 1 Color changes in indicator film formulations with addition of 5 ml natural dye during storage
F1 F2 F3 F4 F5
International Journal of Applied Biology, 5(1), 2021
17
Notes: F1= Polyvinyl alcohol:Chitosan (100:0), F2= Polyvinyl alcohol:Chitosan (80:20), F3= Polyvinyl alcohol:Chitosan (60:40), F4= Polyvinyl alcohol:Chitosan (40:60), F5= Polyvinyl alcohol:Chitosan (20:80).
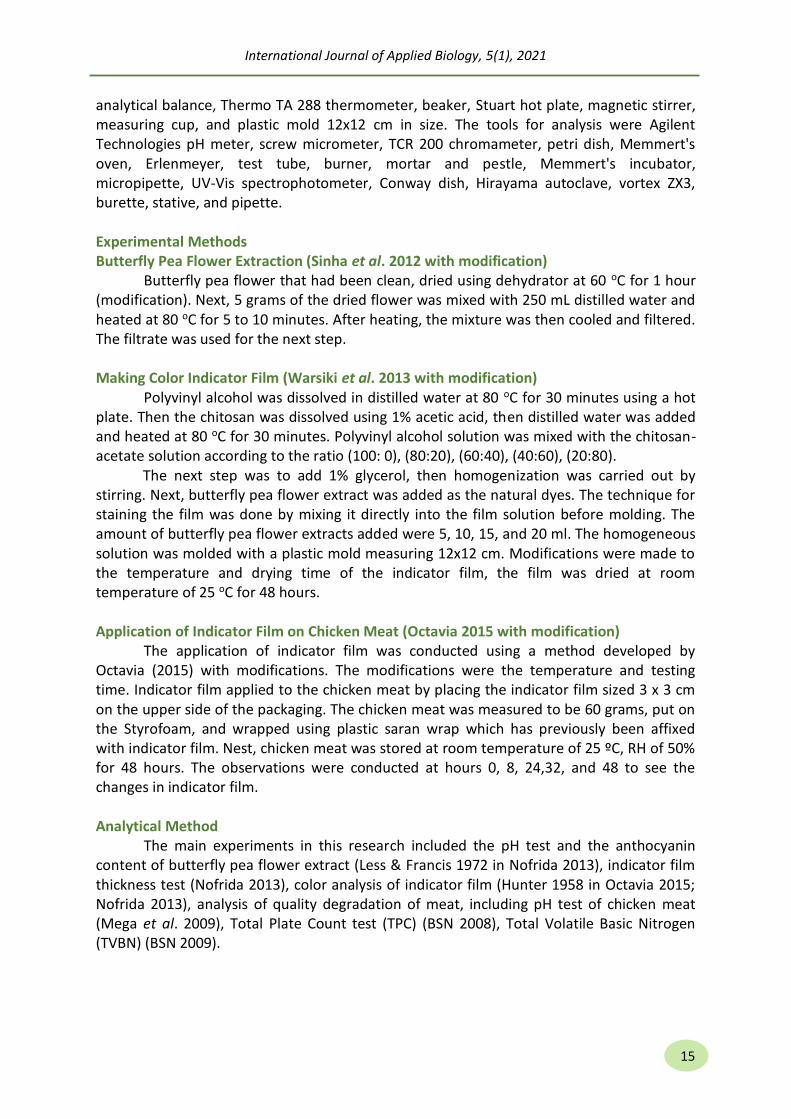
The Color of Indicator Film During Storage
The color change in indicator film provides information to the consumers about the degradation of the product or food. The color change occurs due to the interaction of volatile bases produced during the deterioration of chicken meat with the indicator film. The resulting color showed that the range of °hue value of indicator film during 48 hours of storage was in the second quadrant area which shows a yellowish-green color. According to Hasnedi (2009), the change in color of the indicator film occurs due to the interaction between the functional groups possessed by anthocyanins and volatile base compounds resulting from rotting chicken meat, so that the interaction involves the OH (hydroxyl) groups of anthocyanins and NH3 (ammonia) from volatile base compounds. This causes volatile base compounds such as amines, diethylamine, and triethylamine to be bound to the hydroxyl group so that the indicator film changes color from green to yellowish-green. The color change is due to the loss of protons (deprotonation) in the butterfly pea flower dye as the environmental conditions around the film become alkaline. Table 2 Color changes of indicator film during storage
Storage Duration (hour)
°Hue Value Smart Packaging Indicator film
0 173.93 ± 5.76
8 162.56 ± 2.82
24 151.99 ± 1.01
32 149.32 ± 1.75
International Journal of Applied Biology, 5(1), 2021
18
48 147.39 ± 1.21
The value of °hue of indicator film decreased during 48 hours of storage. The
decrease of °hue value from 0 to 48 hours was from 173.94±5.76o to 147.39±1.21o which was around green color to yellowish-green color. The result showed that the °hue value of butterfly pea flower indicator film before storage was higher than after storage. It was because the yellow degree of b value increased while the green degree of a value stable, so it affected the °hue value.
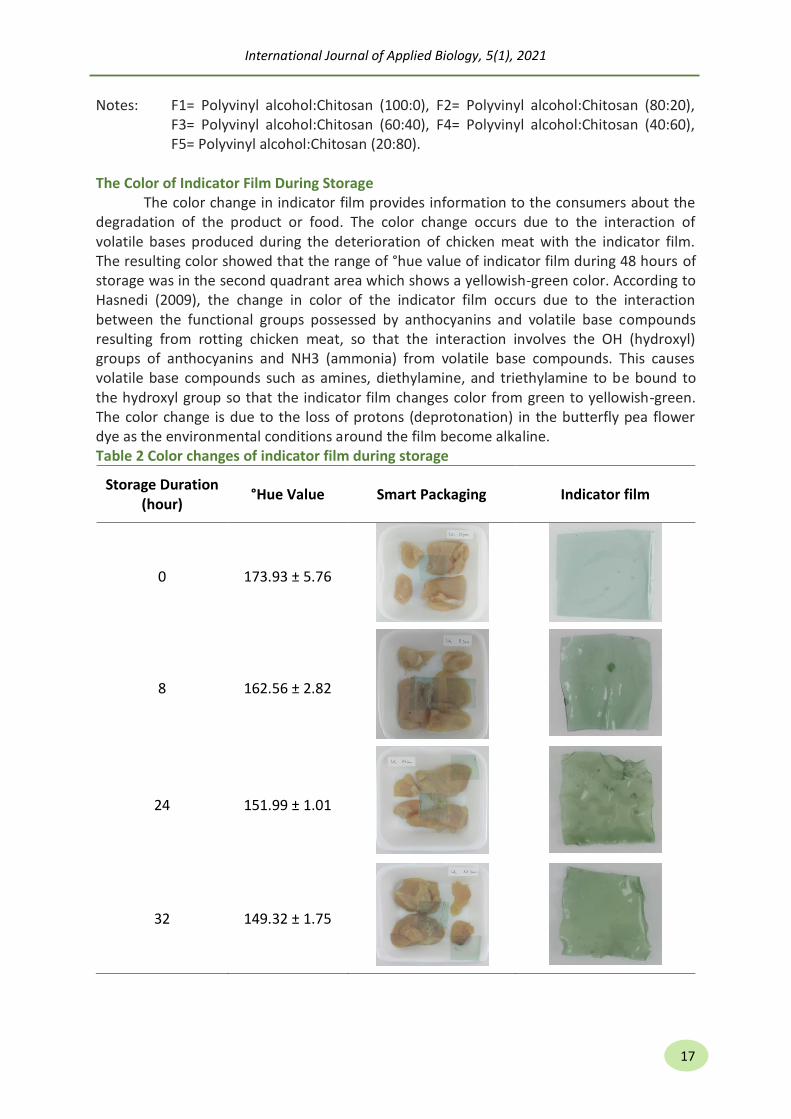
The indicator film °hue value regression equation was y= -0.5395x+169.13 with a strong correlation value (R2) of 0.8593. This showed that storage duration was correlated with a color change in indicator film. The slope value was negative, meaning that the regression model had a negative correlation. The longer storage duration, the lower °hue value, and this showed in the regression curve from 0 to 48 hours in Figure 2.
Figure 2 The °hue value of indicator film during storage
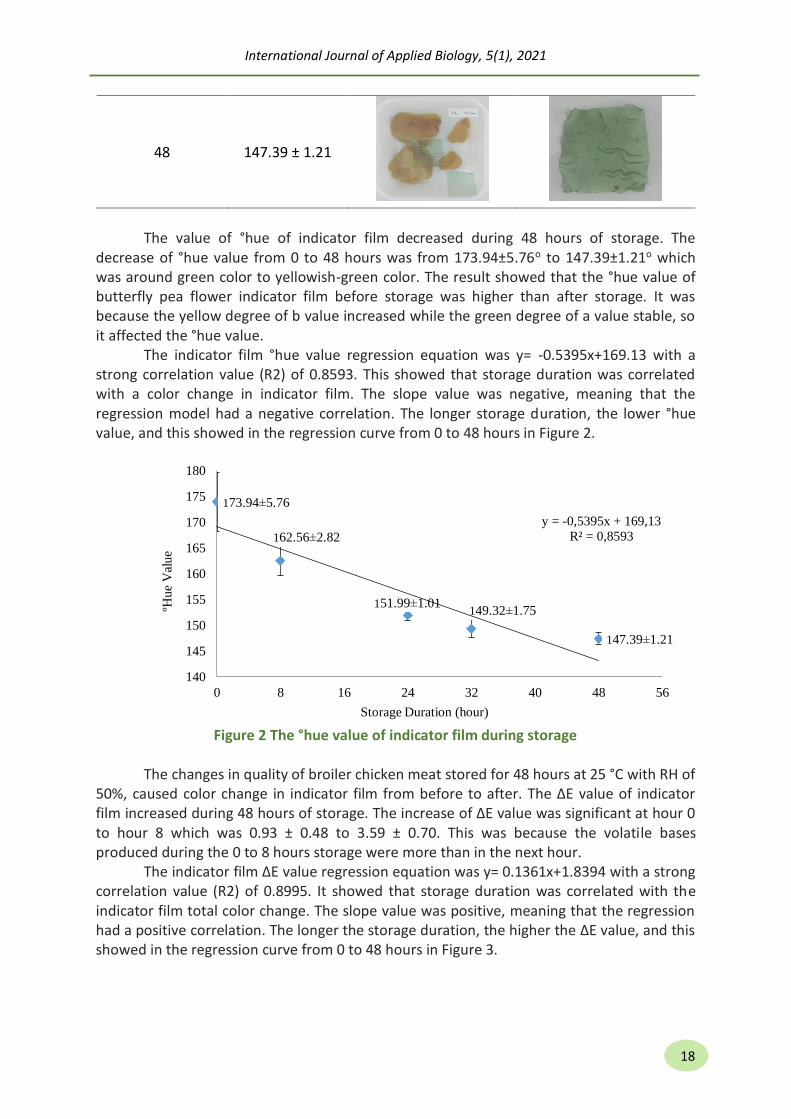
The changes in quality of broiler chicken meat stored for 48 hours at 25 °C with RH of
50%, caused color change in indicator film from before to after. The ∆E value of indicator film increased during 48 hours of storage. The increase of ∆E value was significant at hour 0 to hour 8 which was 0.93 ± 0.48 to 3.59 ± 0.70. This was because the volatile bases produced during the 0 to 8 hours storage were more than in the next hour.
The indicator film ∆E value regression equation was y= 0.1361x+1.8394 with a strong correlation value (R2) of 0.8995. It showed that storage duration was correlated with the indicator film total color change. The slope value was positive, meaning that the regression had a positive correlation. The longer the storage duration, the higher the ∆E value, and this showed in the regression curve from 0 to 48 hours in Figure 3.
173.94±5.76
162.56±2.82
151.99±1.01149.32±1.75
147.39±1.21
y = -0,5395x + 169,13
R² = 0,8593
140
145
150
155
160
165
170
175
180
0 8 16 24 32 40 48 56
ºHue
Val
ue
Storage Duration (hour)
International Journal of Applied Biology, 5(1), 2021
19
Figure 3 Indicator film ∆E value during storage
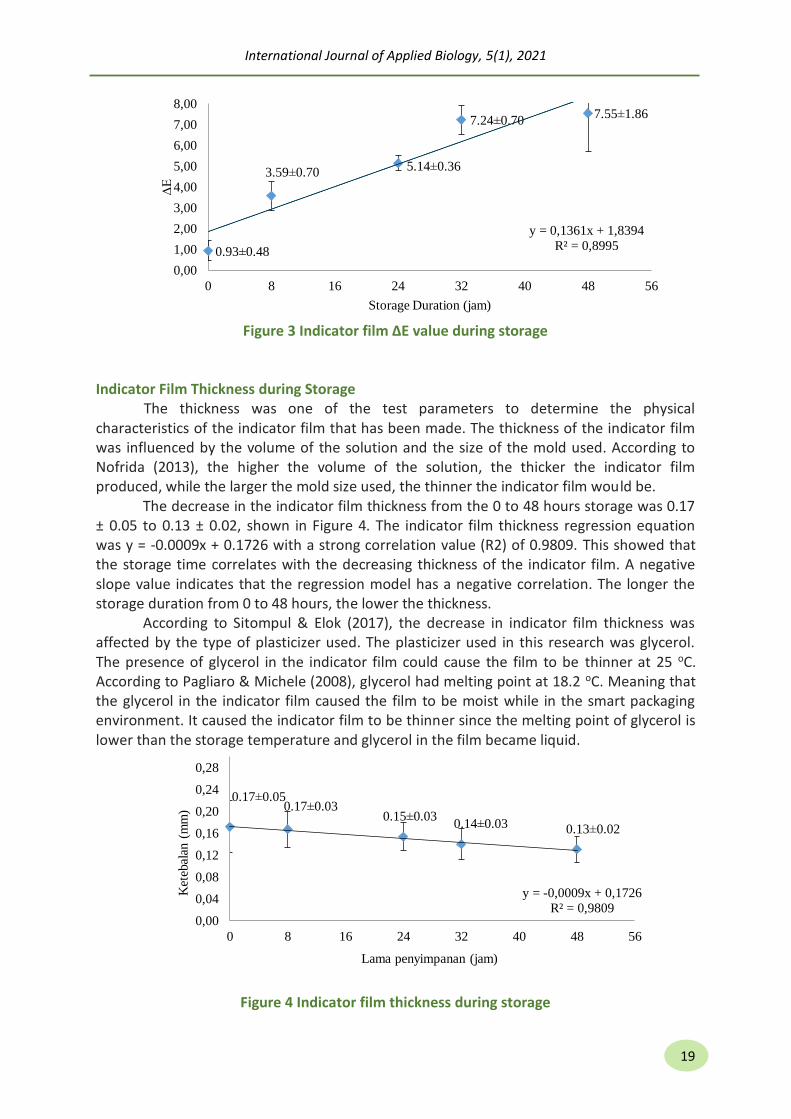
Indicator Film Thickness during Storage The thickness was one of the test parameters to determine the physical
characteristics of the indicator film that has been made. The thickness of the indicator film was influenced by the volume of the solution and the size of the mold used. According to Nofrida (2013), the higher the volume of the solution, the thicker the indicator film produced, while the larger the mold size used, the thinner the indicator film would be.
The decrease in the indicator film thickness from the 0 to 48 hours storage was 0.17 ± 0.05 to 0.13 ± 0.02, shown in Figure 4. The indicator film thickness regression equation was y = -0.0009x + 0.1726 with a strong correlation value (R2) of 0.9809. This showed that the storage time correlates with the decreasing thickness of the indicator film. A negative slope value indicates that the regression model has a negative correlation. The longer the storage duration from 0 to 48 hours, the lower the thickness.
According to Sitompul & Elok (2017), the decrease in indicator film thickness was affected by the type of plasticizer used. The plasticizer used in this research was glycerol. The presence of glycerol in the indicator film could cause the film to be thinner at 25 oC. According to Pagliaro & Michele (2008), glycerol had melting point at 18.2 oC. Meaning that the glycerol in the indicator film caused the film to be moist while in the smart packaging environment. It caused the indicator film to be thinner since the melting point of glycerol is lower than the storage temperature and glycerol in the film became liquid.
Figure 4 Indicator film thickness during storage
0.93±0.48
3.59±0.70 5.14±0.36
7.24±0.707.55±1.86
y = 0,1361x + 1,8394
R² = 0,8995
0,00
1,00
2,00
3,00
4,00
5,00
6,00
7,00
8,00
0 8 16 24 32 40 48 56
∆E
Storage Duration (jam)
0.17±0.050.17±0.03
0.15±0.030.14±0.03 0.13±0.02
y = -0,0009x + 0,1726
R² = 0,98090,00
0,04
0,08
0,12
0,16
0,20
0,24
0,28
0 8 16 24 32 40 48 56
Ket
ebal
an (
mm
)
Lama penyimpanan (jam)
International Journal of Applied Biology, 5(1), 2021
20
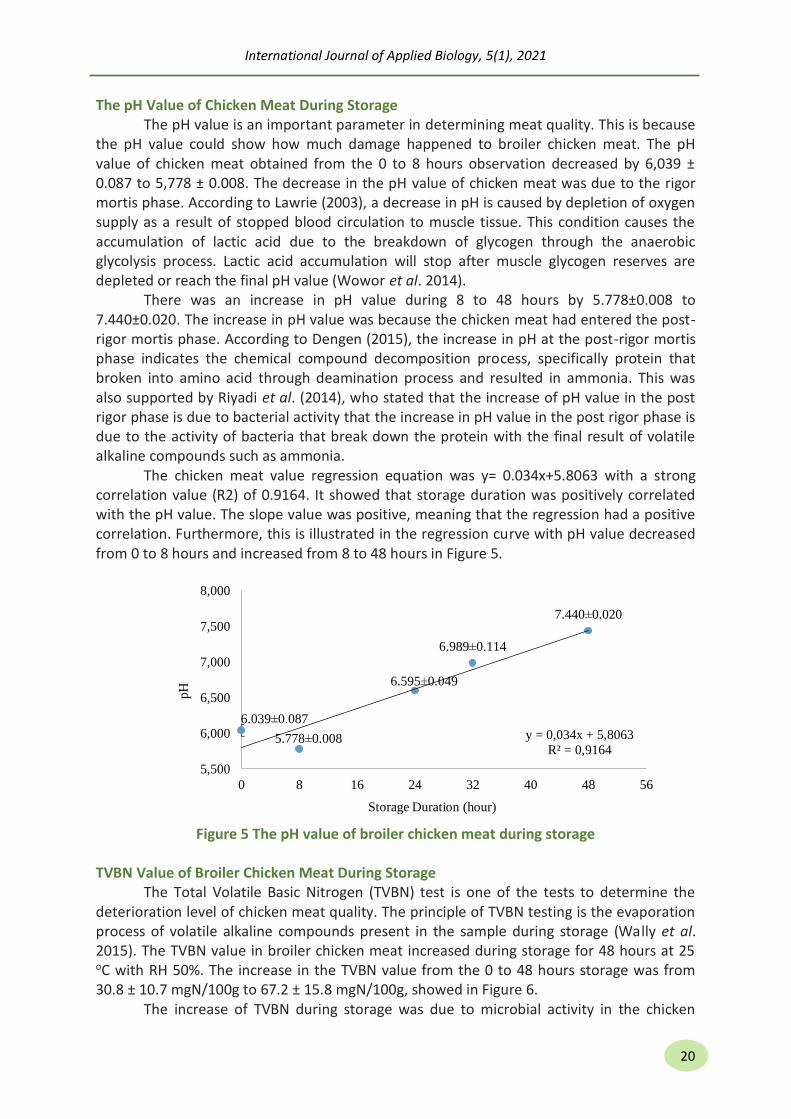
The pH Value of Chicken Meat During Storage The pH value is an important parameter in determining meat quality. This is because
the pH value could show how much damage happened to broiler chicken meat. The pH value of chicken meat obtained from the 0 to 8 hours observation decreased by 6,039 ± 0.087 to 5,778 ± 0.008. The decrease in the pH value of chicken meat was due to the rigor mortis phase. According to Lawrie (2003), a decrease in pH is caused by depletion of oxygen supply as a result of stopped blood circulation to muscle tissue. This condition causes the accumulation of lactic acid due to the breakdown of glycogen through the anaerobic glycolysis process. Lactic acid accumulation will stop after muscle glycogen reserves are depleted or reach the final pH value (Wowor et al. 2014).
There was an increase in pH value during 8 to 48 hours by 5.778±0.008 to 7.440±0.020. The increase in pH value was because the chicken meat had entered the post-rigor mortis phase. According to Dengen (2015), the increase in pH at the post-rigor mortis phase indicates the chemical compound decomposition process, specifically protein that broken into amino acid through deamination process and resulted in ammonia. This was also supported by Riyadi et al. (2014), who stated that the increase of pH value in the post rigor phase is due to bacterial activity that the increase in pH value in the post rigor phase is due to the activity of bacteria that break down the protein with the final result of volatile alkaline compounds such as ammonia.
The chicken meat value regression equation was y= 0.034x+5.8063 with a strong correlation value (R2) of 0.9164. It showed that storage duration was positively correlated with the pH value. The slope value was positive, meaning that the regression had a positive correlation. Furthermore, this is illustrated in the regression curve with pH value decreased from 0 to 8 hours and increased from 8 to 48 hours in Figure 5.
Figure 5 The pH value of broiler chicken meat during storage
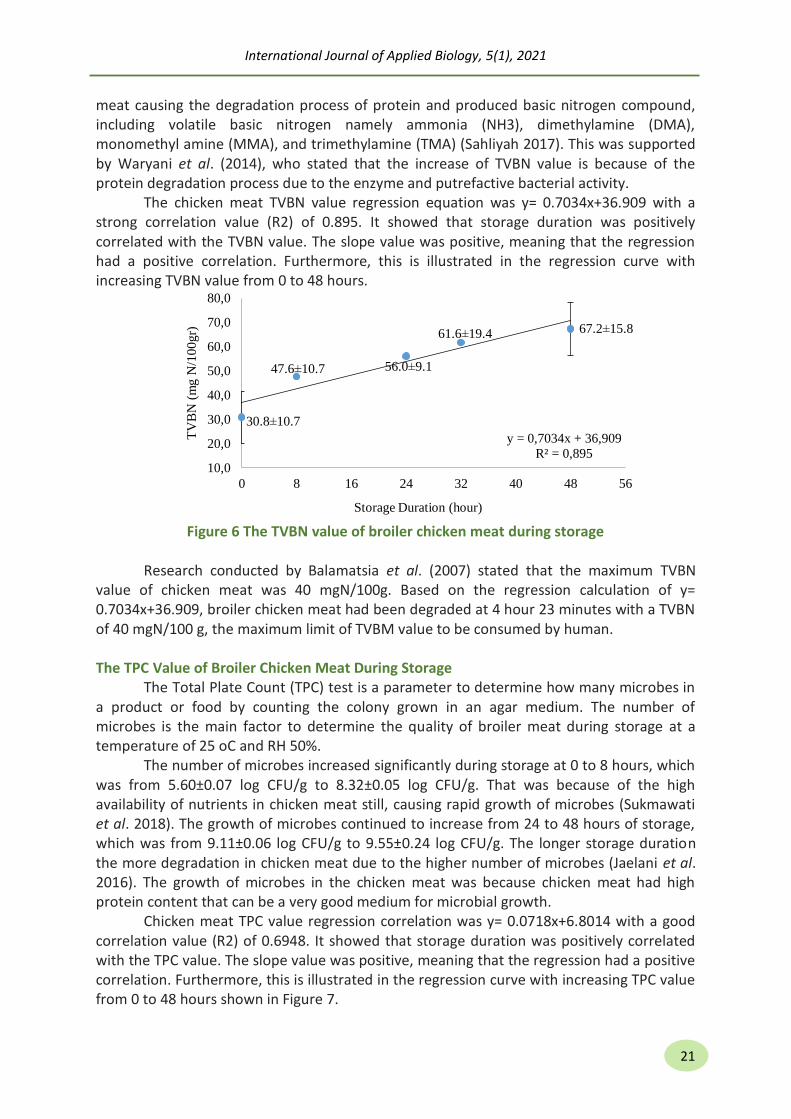
TVBN Value of Broiler Chicken Meat During Storage
The Total Volatile Basic Nitrogen (TVBN) test is one of the tests to determine the deterioration level of chicken meat quality. The principle of TVBN testing is the evaporation process of volatile alkaline compounds present in the sample during storage (Wally et al. 2015). The TVBN value in broiler chicken meat increased during storage for 48 hours at 25 oC with RH 50%. The increase in the TVBN value from the 0 to 48 hours storage was from 30.8 ± 10.7 mgN/100g to 67.2 ± 15.8 mgN/100g, showed in Figure 6.
The increase of TVBN during storage was due to microbial activity in the chicken
6.039±0.087
5.778±0.008
6.595±0.049
6.989±0.114
7.440±0.020
y = 0,034x + 5,8063
R² = 0,9164
5,500
6,000
6,500
7,000
7,500
8,000
0 8 16 24 32 40 48 56
pH
Storage Duration (hour)
International Journal of Applied Biology, 5(1), 2021
21
meat causing the degradation process of protein and produced basic nitrogen compound, including volatile basic nitrogen namely ammonia (NH3), dimethylamine (DMA), monomethyl amine (MMA), and trimethylamine (TMA) (Sahliyah 2017). This was supported by Waryani et al. (2014), who stated that the increase of TVBN value is because of the protein degradation process due to the enzyme and putrefactive bacterial activity.
The chicken meat TVBN value regression equation was y= 0.7034x+36.909 with a strong correlation value (R2) of 0.895. It showed that storage duration was positively correlated with the TVBN value. The slope value was positive, meaning that the regression had a positive correlation. Furthermore, this is illustrated in the regression curve with increasing TVBN value from 0 to 48 hours.
Figure 6 The TVBN value of broiler chicken meat during storage
Research conducted by Balamatsia et al. (2007) stated that the maximum TVBN
value of chicken meat was 40 mgN/100g. Based on the regression calculation of y= 0.7034x+36.909, broiler chicken meat had been degraded at 4 hour 23 minutes with a TVBN of 40 mgN/100 g, the maximum limit of TVBM value to be consumed by human.
The TPC Value of Broiler Chicken Meat During Storage
The Total Plate Count (TPC) test is a parameter to determine how many microbes in a product or food by counting the colony grown in an agar medium. The number of microbes is the main factor to determine the quality of broiler meat during storage at a temperature of 25 oC and RH 50%.
The number of microbes increased significantly during storage at 0 to 8 hours, which was from 5.60±0.07 log CFU/g to 8.32±0.05 log CFU/g. That was because of the high availability of nutrients in chicken meat still, causing rapid growth of microbes (Sukmawati et al. 2018). The growth of microbes continued to increase from 24 to 48 hours of storage, which was from 9.11±0.06 log CFU/g to 9.55±0.24 log CFU/g. The longer storage duration the more degradation in chicken meat due to the higher number of microbes (Jaelani et al. 2016). The growth of microbes in the chicken meat was because chicken meat had high protein content that can be a very good medium for microbial growth.
Chicken meat TPC value regression correlation was y= 0.0718x+6.8014 with a good correlation value (R2) of 0.6948. It showed that storage duration was positively correlated with the TPC value. The slope value was positive, meaning that the regression had a positive correlation. Furthermore, this is illustrated in the regression curve with increasing TPC value from 0 to 48 hours shown in Figure 7.
30.8±10.7
47.6±10.7 56.0±9.1
61.6±19.4 67.2±15.8
y = 0,7034x + 36,909
R² = 0,89510,0
20,0
30,0
40,0
50,0
60,0
70,0
80,0
0 8 16 24 32 40 48 56
TV
BN
(m
g N
/100gr)
Storage Duration (hour)

International Journal of Applied Biology, 5(1), 2021
22
Figure 7 Broiler chicken meat TPC value during storage
Based on Indonesian National Standard 7388:2009 about the maximum microbial
contamination of food, state that the maximum total of microbial contamination on fresh chicken meat for consumption is no more than 1x10⁶ colony/g or equal to 6 log CFU/g. Meaning broiler chicken meat in this research storage condition was not safe for consumption at 8 hours with a TPC of 8.23 log CFU/g, because it exceeded the maximum limit of safe microbial contamination.
Conclusions Butterfly pea flower extract could be used as coloring dye in indicator film because it
is sensitive to pH changes. The best formulation for indicator film that can detect the damage in broiler chicken meat was polyvinyl alcohol: chitosan ratio of 20:80 with the addition of 5 ml anthocyanin extract from butterfly pea flower. The color change of indicator film from green to yellowish-green on hour 24, showed that the chicken meat was not safe for consumption anymore. The color change in indicator film was correlated with pH, TVBN, and TPC value of broiler chicken meat. Based on data obtained, the pH value of chicken broiler meat had entered the post-rigor mortis phase at hour 24 with a pH of 6.595. If using TVBN regression value, it stated that broiler chicken meat could no longer be consumed after being stored for 4 hours 23 minutes, while in the TPC test, chicken meat is not suitable for consumption at storage between the 0 and 8 hours when TPC value of 5,598 log CFU g became 8,322 log CFU / g.
References Ahmadiani N, Rebecca JR, Thomas MC, Monica GM. 2014. Anthocyanins contents, profiles,
and color characteristics of red cabbage extracts from different cultivars and maturity stages. Journal of Agricultural and Food Chemistry. 62: 7524─7531.
Balamatsia CC, Apostolos P, Michael GK, Ioannis NS. 2007. Possible role of volatile amines as quality-indicating metabolites in modified atmosphere-packaged chicken fillets:Correlation with microbiological and sensory attributes. Journal Food Chemistry.104(4): 1622─1628.
5.60±0.07
8.32±0.05
9.11±0.069.46±0.16
9.55±0.24
y = 0,0718x + 6,8014
R² = 0,69485,00
5,50
6,00
6,50
7,00
7,50
8,00
8,50
9,00
9,50
10,00
0 8 16 24 32 40 48 56
TP
C(C
FU
/g)
Storage Duration (hour)
International Journal of Applied Biology, 5(1), 2021
23
[BSN] Badan Standarisasi Nasional. 2008. SNI 01-2897-2008. Tentang metode pengujian cemaran mikroba dalam daging, telur dan susu, serta hasi olahannya. Jakarta (ID): Badan Standarisasi Nasional.
______. 2009b. SNI 01-2354-2009. Tentang Cara Uji Kimia-bagian 8: Penentuan Kadar TVB Pada Produk Prikanan. Jakarta (ID): Badan Standarisasi Nasional.
Badan Pusat Statistik. 2018. Rata-Rata Konsumsi Per Kapita Seminggu Beberapa Macam Bahan Makanan Penting Tahun 2007-2018. [Internet]. [diunduh 2019 September 15]. Tersedia pada https://www.bps.go.id.
Barus JG. 2017. Pengaruh lama perendaman dengan menggunakan larutan daun salam (Szygium Polyanthum) sebagai pengawet terhadap total plate count dan salmonella daging broiler [skripsi]. Bandar Lampung (ID): Universitas Lampung.
Change MJ. 2018. Pengolahan Bunga Telang (Clitoria ternatea L.) sebagai serbuk pewarna alami menggunakan enkapsulan maltodekstrin dan soy protein isolate dengan metode pengeringan cabinet drying dan freeze drying [skripsi]. Semarang (ID): Universitas Katolik Soegijapranata Semarang.
Dengen PMR. 2015. Perbandingan uji pembusukan dengan menggunakan metode uji postma, uji eber, uji H2S dan pengujian mikroorganisme pada daging babi di pasar tradisional sentral Makassar [skripsi]. Makassar (ID). Universitas Hasanuddin.
Hasnedi YW. 2009. Pengembangan kemasan cerdas (Smart Packaging) dengan sensor berbahan dasar chitosan-asetat polivinil alkohol dan pewarna indikator bromthymol blue sebagai pendeteksi kebusukan fillet ikan nila [skripsi] Bogor (ID): Institut Pertanian Bogor.
Jaelani A, Siti D, Bahrin N. 2016. Pengaruh lama penyimpanan daging itik alabio dalam refrigerator terhadap kualitas mikrobiologi pH dan organoleptik. Jurnal Ziraa’ah. 41(1): 145─155.
Lawrie RA. 2003. Ilmu daging. Parakkasi A, penerjemah. Jakarta (ID): Universitas Indonesia Press. Terjemahan dari Meat Science.
Marpaung AM. 2012. Optimasi proses ekstraksi antosianin pada bunga telang (Clitoria Ternatea L.) dengan metode permukaan tanggap [skripsi]. Bogor (ID): Institut Pertanian Bogor.
Mega O, Warnoto W, Dewi BC. 2009. Pengaruh pemberian jahe merah (Zingiber officinale Rosc) terhadap karakteristik dendeng daging ayam petelur afkir. J Sain Peternakan Indonesia. 4(2): 106─112.
Nofrida R. 2013. Film indikator warna daun erpa (Aerva sanguinolenta) sebagai kemasan cerdas untuk produk rentan suhu dan cahaya [skripsi]. Bogor (ID): Institut Pertanian Bogor.
International Journal of Applied Biology, 5(1), 2021
24
Octavia R. 2015. Pembuatan label cerdas pendeteksi Staphylococcus aureus pada daging [skripsi]. Bogor (ID): Institut Pertanian Bogor.
Oktaviani VVD. 2016. Pengaruh konsentrasi asap cair dan lama perendaman terhadap karakteristik daging ayam [skripsi]. Bandung (ID): Universitas Pasundan.
Pagliaro M, Michele R. 2008. The Future of Glycerol: New Uses of a Versatile Raw Material. Cambridge (GB): RSC Green Chemistry Book Series.
Rahardjo Karina KE dan Simon BW. 2015. Biosensor ph berbasis antosianin stroberi dan klorofil daun suji sebagai pendeteksi kebusukan fillet daging ayam. Jurnal Pangan dan Agroindustri. 3(2): 333─344.
Rahmawati HS, Arianty S, Harianti. 2017. Ekstrak bunga mawar merah (Rose damascene) sebagai pewarna alami dalam pembuatan es krim rumput laut (Eucheuma spinosum). Jurnal Balik Diwa. 8(1): 13─22.
Riyadi NH, Windi A, Arinta H. 2014. Aplikasi ekstrak daun salam (Syzygium polyanthum) dan ekstrak biji pinang (Areca catechu L.) sebagai pengawet daging ayam broiler giling selama proses penyimpanan. Jurnal Teknologi Hasil Pertanian. 7(1): 48─58.
Riyanto R, Irma H, Singgih W. 2014. Karakteristik plastik indikator sebagai tanda peringatan dini tingkat kesegaran ikan dalam kemasan plastik. JPB Perikanan. 9(2): 153─163.
Sahliyah AR. 2017. Kemunduran mutu dan pembentukan formaldehid alami pada ikan kembung (Rastrelliger sp.) selama penyimpanan suhu chilling [skripsi]. Bogor (ID): Institut Pertanian Bogor.
Setiautami A. 2013. Pembuatan kemasan cerdas indikator warna dengan pewarna bit (B. vulgaris L.var cicla L.) [skripsi]. Bogor (ID): Institut Pertanian Bogor.
Sinha K, Papita DS, Siddhartha D. 2012. Natural blue dye from (Clitoria Ternatea) extraction and analysis methods. RJTA. 16(2): 34─38.
Sitompul Alfredo JWS dan Elok Z. 2017. Pengaruh jenis dan konsentrasi plasticizer terhadap sifat fisik edible film kolang kaling (Arenga pinnata). Jurnal Pangan dan Agroindustri. 5(1): 13─25.
Sukmawati, Ratna, Ahmad F. 2018. Analisis cemaran mikroba pada daging ayam broiler di kota makassar. Jurnal Scripta Biologica. 5(1): 51─53.
Vankar PS, Srivastava J. 2010. Evalution of anthocyanin content in red and blue flowers. International Journal of Food Engineering. 6(4):1─11.
Wally E, Feny M, Roike IM. 2015. Kajian mutu ikan cakalang (Katsuwonus pelamis L.) asap (fufu) selama penyimpanan suhu ruang dan suhu dingin. Jurnal Media Teknologi Hasil Perikanan. 3(1): 7─12.
Warsiki E, Citra Dewi WP. 2012. Pembuatan label/film indikator warna dengan pewarna alami dan sintetis. J Agroindustri. 1(2): 82─87.
International Journal of Applied Biology, 5(1), 2021
25
Warsiki E, Rini N, Indah Y. 2013. Pemanfaatan ekstrak daun erpa (Aerva sanguinolenta) untuk label cerdas indikator warna. J Ilmu Pertanian Indonesia. 18(1): 15─19.
Waryani SW, Rika S, Farida H. 2014. Pemanfaatan kitosan dari cangkang bekicot (Achatina fulica) sebagai pengawet ikan kembung (Rastrelliger sp) dan ikan lele (Clarias batrachus). Jurnal Teknik Kimia. 3(4): 51─57.
Winda A. 2016. Pola konsumsi daging ayam broiler berdasarkan tingkat pengetahuan dan pendapatan kelompok mahasiswa fakultas peternakan universitas padjadjaran [skripsi]. Sumedang (ID). Universitas Padjadjaran.
Wowor AKY, Ransaleleh TA, Tamasoleng M, Komansilan S. 2014. Lama penyimpanan pada suhu dingin daging broiler yang diberi air perasan jeruk katsuri (Citrus madurensis Lour). Jurnal Zootek. 34(2): 148─158.