Normative barriers to imitation: social complexity of core competences in a mutual fund industry
Upload
khangminh22Category
view
3download
0
PHYSICOCHEMICAL PROPERTIES OF SOY- AND PEA-BASED
IMITATION SAUSAGE PATTIES ______________________________________________________
A Thesis presented to
the Faculty of the Graduate School at the University of Missouri
_______________________________________________________
In Partial Fulfillment of the Requirements for the Degree
Master of Science
_____________________________________________________
by
CHIH-YING LIN
Dr. Fu-hung Hsieh, Thesis Supervisor
MAY 2014
brought to you by COREView metadata, citation and similar papers at core.ac.uk
provided by University of Missouri: MOspace

The undersigned, appointed by the dean of the Graduate School, have examined the thesis entitled
PHYSICOCHEMICAL PROPERTIES OF SOY- AND PEA-BASED
IMITATION SAUSAGE PATTIES
presented by Chih-ying Lin
a candidate for the degree of Master Science,
and hereby certify that, in their opinion, it is worthy of acceptance.
Dr. Fu-hung Hsieh, Department of Biological Engineering & Food Science
Dr. Andrew Clarke, Department of Food Science
Dr. Gang Yao, Department of Biological Engineering

ii
ACKNOWLEDGEMENTS
On the way to acquiring my master degree, many friends, professors, faculty
and laboratory specialists gave me a thousand hands toward the completion of
my academic research.
First of all, I would like to thank Dr. Fu-hung Hsieh and Senior Research
Specialist Harold Huff, who supported and offered me the most when
conducting the experiment. I would like to thank Dr. Andrew Clarke and Dr.
Gang Yao being my committee members and gave suggestion and help during
my study. I would like to have a further thank to Dr. Mark Ellersieck for his
statistical assistance. I am thankful and appreciate Carla Roberts and Starsha
Ferguson help on editing and proofreading my thesis.
I especially would like to thank my parents and friends whose encouragement
and advice helped me stay the course during my two-years of graduate studies
dedicated to attaining the Master of Science degree.

iii
TABLE OF CONTENTS
ACKNOWLEDGEMENTS ............................................................................................ ii
LIST OF FIGURES ..................................................................................................... xi
LIST OF TABLES ................................................................................................... …xii
ABSTRACT ........................................................................................................... …xiii
Chapter
1. INTRODUCTION…………………………………..………………….…….1
1.1 Background……………………………………..……………………...1
1.2 Motivation and Objectives……………………………….……………3
1.2.1 Motivations……...…………………………..………..………… 3
1.2.2 Objectives…………………….………….……...….....…..…… 4
2. LITERATURE REVIEW…………………………………………….....…..5
2.1 Driving Forces Behind Meat Analog………………………………...5
2.2 Meat Analog Ingredients……………………………………...............8
2.2.1 Textured Vegetable Proteins………………………………….9
2.2.1.1.1 Manufacture and Use Instruction of TVP………...10
2.2.1.1.2 Limitations of TVP……………………………….…10
2.2.1.1.3 Applications of TVP…….…………………………..11
2.2.2 Non-textured Vegetable Proteins…………..……………......11

iv
2.2.2.1.1 Soybean……………………..…...……………..….12
2.2.2.1.2 Health Benefits of Soybean……..……………….13
2.2.2.1.3 Anti-nutrient and Sensory Issues of Soybean…14
2.2.2.1.4 Applications of Soy Protein Derivatives………..14
2.2.2.2.1 Split Pea……………………………..…………….15
2.2.2.2.2 Health Benefits of Split Pea……………………...16
2.2.2.2.3 Applications of Pea Protein Derivatives…….......17
2.2.3 Starch……………………….………………………………….....17
2.2.4 Tofu Powder, Oatmeal and Fibers……………………….….....17
2.2.5 Carrageenan………………………………………….................19
2.2.6 Binding Agents…………………………...………………….…..20
2.3 Other Classified Meat Analogs………………….……………………..20
2.3.1 Mycoproteins…….…………..……………..……….……………..20
2.3.2 Seitan………….………………………………………..………….21
2.4 Mushrooms.……………………………………………….….…………..22
2.4.1 Edible Mushrooms and King Oyster Mushrooms.….…………..22
2.4.2 Consumption and Sale Trend of Mushrooms….....…………….21
2.4.3 Nutrition of Mushrooms…………....………..…….…..…..………23
2.4.4 Health Benefits of Mushrooms………..…….……………………23
2.4.5 Applications on Meat Products………...……………...………….24
2.5 Physicochemical Properties Measurement………........………………...…24
2.5.1 Textural Properties……..….…..…….……...……………………...24
3. MATERIALS AND METHODS…………………...……………….…………..26

v
3.1 Ingredients………..………..……………………….…………..………….26
3.2 Design of Experiments………………….………………………………..27
3.3 Processing of Soy- and Pea-based Imitation Sausage Patties……....27
3.4 Methods……………...………...…………………………………..……...29
3.4.1 Cooking Yield and Cooking Loss…..……...……………………29
3.4.2 Color Measurement.….…………..………………………………29
3.4.3.Texture Profile Analysis (TPA)….....……….……………………29
3.4.4 Water Activity………………………..……………..…..………….30
3.4.5 pH Value……....…………………………………………………..31
3.4.6 Cooking Shrinkage……...……..…………………………………31
3.4.7 Water holding/hydration capacity (WHC) of TSP and TPP..…31
3.4.8 Water holding/hydration capacity (WHC) of product…….…....32
3.5 Statistical Analysis………………………………………….……………32
4. RESULTS AND DISCUSSION……..………...………………………………..33
4.1 Preliminary Tests……………………………………………………33
4.1.1 The Very First Formulation…………………………………..33
4.1.2 Formula Modification…………………………………..….…33
4.1.3 Final Formulation…………………………………….….…...34
4.2 Effect on Product Properties…………………….………….………35
4.2.1 Effect on Cooking Yield of the Plant Protein-based
Imitation Products………………………….………….……...35
4.2.1.1 Soy-based Imitation Products………………...…..38
4.2.1.2 Pea-based Imitation Products…………………….38

vi
4.2.1.3 Further Discussion on Cooking Properties………39
4.2.2 Effect on Color of the Products……………………….……40
4.2.2.1 The L and b Values of Soy-based Imitation Products.………………………………………...…...43
4.2.2.2 The L and b Values of Pea-based Imitation Products………………………………………….…..43
4.2.2.3 Further Discussion on the L and b Value……...…43
4.2.2.4 a Value of Soy- and Pea-based Imitation Products……………………………………………..44
4.2.3 Effect on Texture Profile of the Products……….…….….....45
4.2.3.1 Hardness of Plant Protein-based Products….........45
4.2.3.1.1 Hardness of Soy-based Imitation Products…………………………….……45
4.2.3.1.2 Hardness of Pea-based Imitation Products…………………………...….…..46
4.2.3.1.3 Further Discussion on Hardness………..47
4.2.3.2 Adhesiveness of Plant Protein-based Products…...48
4.2.3.3 Springiness of Plant-protein-based Products………51
4.2.3.3.1 Springiness of Soy-based Imitation Products……………………….……….....51
4.2.3.3.2 Springiness of Pea-based Imitation Products………………………….…….....51
4.2.3.4 Cohesiveness of Plant Protein-based products…....53
4.2.3.4.1 Cohesiveness of Soy-based Imitation Products…………………………………..53
4.2.3.4.2 Cohesiveness of Pea-based Imitation Products………………………...……..….55
4.2.3.5 Gumminess of Plant Protein-based Products………55

vii
4.2.3.5.1 Gumminess of Soy-based Imitation Products…………………….…………...55
4.2.3.5.2 Gumminess of Pea-based Imitation Products………………………….….…...57
4.2.3.6 Chewiness of Plant Protein-based Products……58
4.2.3.6.1 Chewiness of Soy-based Imitation Products………………………………….58
4.2.3.6.2 Chewiness of Pea-based Imitation Products……………………….…….…..59
4.2.3.7 Resilience of Plant Protein-based Products…….60
4.2.3.7.1 Resilience of Soy-based Imitation Products…………………………………..60
4.2.3.7.2 Resilience of Pea-based Imitation Products………………………….....…….62
4.2.4 Effect on Water Activity of Plant Protein-based Imitation Products……...…………………………………………….....62
4.2.4.1 Water Activity of Soy- and Pea-based Imitation Products……………………………………..64
4.2.5 Effect on pH value of Plant Protein-based Products….....64
4.2.5.1The pH value of Soy- and Pea-based Imitation Products……………………………………………....64
4.2.6 Effect on Cooking Shrinkage of Plant Protein-based Products………………………………………………………67
4.2.6.1 Cooking Shrinkage of Soy-based Imitation Products……………………………………………..67
4.2.7 Effect on Water Holding Capacity (WHC) of Plant Protein-based Products……………………….…….69
4.2.7.1 Water Holding Capacity (WHC) of Soy-based Imitation Products………………………………..….70
4.2.7.2 Water Holding Capacity (WHC) of Pea-based

viii
Imitation Products………………………………..….71
4.2.7.3 Further Discussion on Water Holding Capacity (WHC)……………………………………………..….72
5. CONCLUSIONS……………………………………….…………………..74
5.1 Conclusions………………………………………………….….……..74
5.2 Further Research…………………………………………………..….76
REFERENCES………………………………………………………………………77
APPENDICES……………………………………………………………………….100

xi
LIST OF FIGURES
Figure Page
4.2.1.1 Average values of cooking loss percentage for each combination of king oyster mushrooms and soy protein isolate (a) and pea protein isolate (b)…………..…………...……………………………………37
4.2.2.1 Average values of color index L(a) and b(b) value for each combination of king oyster mushrooms and soy protein isolate………..41
4.2.2. 2 Average values of color index L(a) and b(b) value for each combination of king oyster mushrooms and pea protein isolate…….…42
4.2.3.2.1 Average values of adhesiveness (Ns) for each combination of king oyster mushrooms and soy protein isolate (a) and pea protein isolate (b)………………………………………………………..…..……..….50
4.2.3.4.1 Average values of cohesiveness for each combination of king oyster mushrooms and soy protein isolate (a) and pea protein isolate (b)………………………………………………………………….…..54
4.2.3.7.1 Average values of resilience for each combination of king oyster mushrooms and soy protein isolate (a) and pea protein isolate (b)………………………………………………………………….…..61
4.2.4.1 Average values of water activity for each combination of king oyster mushrooms and soy protein isolate (a) and pea protein isolate (b)……………………………..……………………………………….63
4.2.5.1 Average values of pH value for each combination of king oyster mushrooms and soy protein isolate (a) and pea protein
isolate (b)…………………………………..………………………..……..….66
4.2.6.1 Average values of cooking shrinkage percentage for each combination of king oyster mushrooms and soy protein isolate (a) and pea protein isolate (b)........................…………………………......68

xii
LIST OF TABLES
Table Page
2.2.1 Typical meat analog ingredients……………………….………..……...…..9
3.1. Total amount of water added in imitation patties formulation……………………………………..………………………..…..29
4.2.1.1 Average values of cooking yield percentage for each combination of king oyster mushrooms and soy protein isolate (a) or pea protein
isolate (b)…………………………………………………………………….36 4.2.2.2.1 Average values of a value for each combination of king oyster
Mushrooms and soy protein isolate (a) or pea protein isolate (b)……………………………………………………………………………44
4.2.3.1.1 Average values of hardness (N/cm2) for each combination of king oyster mushrooms and soy protein isolate (a) or pea protein isolate (b)……………………………………………………..48
4.2.3.3.1 Average values of springiness (cm) for each combination of king oyster mushrooms and soy protein isolate (a) or
pea protein isolate (b)……………………………………………………...52
4.2.3.5.1 Average values of gumminess (N/cm2) for each combination of king oyster mushrooms and soy protein isolate (a) or pea
protein isolate (b)…………………………………………………………..57
4.2.3.6.1 Average values of chewiness (N/cm) for each combination of king oyster mushrooms and soy protein isolate (a) or
pea protein isolate (b)……………………………………………………..59
4.2.7.1 Average values of water holding capacity for each combination of king oyster mushrooms and soy protein isolate (a) or pea protein isolate (b)…………………………………………………………....70

xiii
PHYSICOCHEMICAL PROPERTIES OF SOY- AND PEA-BASED IMITATION SAUSAGE PATTIES
Chih-ying Lin Dr. Fu-hung Hsieh, Thesis Supervisor
ABSTRACT
The objective of this thesis is to better understand how changing levels of soy
or pea protein isolates (SPI)(PPI) ( 3%, 6% and 9%) and king oyster mushrooms
(KOM) (0%, 3.5% and 7%) affect the physicochemical properties of imitation
sausage patties using textured soy or pea proteins as the main base ingredient.
After all materials were blended evenly and formed into circular patties, the raw
patties were then fried on the pan with corn oil for 5 minutes on each side.
Samples from each blend were done in triplicate and conducted the
measurements on the same day. Cooking and textural properties, Hunter color,
pH value, water activity and water holding capacity were considered to evaluate
the contributions of the main ingredients.
Altering the SPI or PPI level did not decrease the cooking yield; however,
KOM did lower the yield. Lightness and yellowness of the meatless sausage were
attributed to the addition of SPI or PPI but these properties were not affected by
KOM. Combining KOM and a high level of soy or peat protein created redness
and showed the greatest value. Texture profile parameters, excluding
adhesiveness, showed higher value when both 3.5% and 7% KOM were
combined with 9% SPI; when 3% PPI mixture without KOM. Water activity, pH
value and cooking shrinkage did not differ significantly on dependent interactions.

xiv
SPI or PPI did not affect shrinkage percentage. Water holding capacity decreased
as the amount of KOM and SPI or PPI increased.

1
CHAPTER 1
INTRODUCTION
1.1 Background
In 1999, the United States Food Drug Administration (FDA) recognized the
benefits of using soy in food products allowing manufacturers to attach a label
saying: “Consuming 25 grams of soy protein a day as part of a diet low in
saturated fat and cholesterol may reduce the risk of heart disease (NSRL 2014).
With this statement from FDA, manufacturers increased attempts to develop
soy-based protein or to include soy protein products as ingredients of products
(Hollingsworth 2002). Following the FDA approval of soy foods, as a health
benefit, the Soyfoods Association of North America (SANA) reported that the
sales and consumption of soybean and its products had increased over a 15 year
period to 2011 (SANA 2011). A survey (Soyatech 2012) covering 2010 to 2011,
reported an increase of 1.1% in total sales of soy products reaching $5.17 billion
in sales, while the sale of meat alternatives increased 2.0% in 2011 after a 4.2%
increase in 2010. Moreover, SANA also reported that 42% of Americans
consumed soyfood or soy beverages once a month or more in 2013, compared to
30% in 2006 (SANA 2013). According to Northern Pulse Growers Association,
2012 US Pulse Quality Survey, production of yellow pea were increased two-fold
compared to 2011 (USA Dry Pea Lentil Council 2012). On the other hand, during
the 2011 to 2012, on study of Economic Research Service (ERS), in line with

2
higher production, the per capita use of all mushrooms rose 4.4% to 3.99 pounds
(USDA 2012).
The National Soybean Research Laboratory (NSRL) at the University of Illinois
refers to soybean plants as Edamame stating that they are among the few plant
foods that provide a complete protein; hence, that they have all the essential
amino acids human beings require. With no cholesterol and very little saturated
fat, Edamame are low in sodium with RDA percentages that are generally high in
vitamin C, K, manganese and folate. They are also a good source of dietary fiber,
iron, calcium, thiamin, magnesium, phosphorus and copper (NSRL 2014).
Peas, usually yellow peas, also known as split peas, are legumes and often
referred to as “pulses”, are rich in protein (20-30%) and an excellent source of
dietary fiber, low molecular weight carbohydrates, essential amino acids,
polyunsaturated fatty acids, and a range of micronutrients (US Pulse Quality
Survey 2012). They are also low in fat. Yellow peas have a milder flavor than
green peas and are an excellent source of Vitamin B and several minerals
essential for human health.
As for king oyster mushrooms’ properties, the characteristics of insoluble
dietary fiber gives the chewability and firmness of mouth-feel (Kasabian and
Kasabian 2005) due to the fiber arrangement (Ogawa and others 2012) and
mechanical strength (Ogawa and others 2012). There are also meaty, umami
flavor (Mau and others 1998; Zhang and others 2013) after cooked due to their
MSG-like amino acids such as aspartic acid, glutamic acid ,5’-guanosine
monophosphate (5’-GMP), 5’-inosine monophosphate (5’-IMP), and 5’-xanthosine

3
monophosphate (5’-XMP) (Sommer 2008a) . Considerable evidence had
confirmed and reported the health benefits of consuming mushrooms. Like many
other mushrooms, king oyster mushrooms also might help to reduce the risk of
cancer, heart disease, blood cholesterol problems, control hyperglycemia and
boost our immune system (Rop and others 2009; Alam and others 2011; Kang
and others 2012; Zeng and others 2012; Chen and others 2013; Liang and others
2013; Yang and others 2013; Lin and others 2014).
1.2 Motivations and objectives
1.2.1 Motivations
When this research began its work on developing plant-protein-based
imitation sausage patties, it was determined that the current sausage analogs
lacked the consistency of mouth-feel products. Both the soy bean and yellow spilt
pea are high in protein and low in fat with no lactose, gluten or GM ingredients.
These are the main advantages of their use as a material in meatless patties, and
they can both deter risks of heart-related disease when the recommended daily
intake (RDI) is followed by consumers. Mushrooms are considered to be one
ingredient that enhances mouth-feel (Kasabian and Kasabian 2005) of
plant-protein-based imitation sausage patties based on its nutritional benefits and
meat-like chewing properties. King oyster mushrooms provide high protein and
fiber content, low fat, they also provide umami flavor (Mau and others 1998; Kim
and others 2011; Zhang and others 2013). Umami is a Japanese word, which
describes a meaty or savory taste. Dr. Kikunae Ikeda discovered umami in 1908

4
calling it the fifth taste joining the four traditional flavors of sour, sweet, salty and
bitter.
Combining edible mushrooms with plant derived protein of the products may
begin a new the trend in the United States.
1.2.2 Objectives
This literature survey found most of the vegetable proteins, either soy or pea,
were used as fillers or extenders to enhance the texture, stability of emulsion,
replace the fat and to lower the cost. So far, there were abundant reviews show
the development of the best acceptable ratio of meat to replacers or
texture-improving agents in reduced/ low fat meat products but very little research
has been undertaken on the use of textured soy proteins (TSP) and textured pea
proteins (TPP) as main ingredient in processing imitation sausage patties. More
research could be conducted on their physical properties and more non-company
related tests should be made by researchers free from any conflict of interest.
The objectives of this research were to gain an understanding of the
physicochemical properties of adding rehydrated king oyster mushroom and soy
or pea protein isolate as the variances in soy- or pea-based imitation sausage
patties. For this purpose, tests were conducted adding dried king oyster
mushroom and protein isolate to the soy mixture and then measuring cooking
yield, cooking loss, color, water activity (Aw), pH value, texture profile analysis
(TPA), water holding capacity (WHC) of textured soy protein (TSP) and textured
pea protein (TPP), of the final product and cooking shrinkage.

5
CHAPTER 2
LITERATURE REVIEW
2.1 Driving Forces Toward Meat Analog
Meat has enjoyed its popularity as a foodstuff for a long time; however, a
number of adverse impacts on human health, environmental quality and animal
welfare have growing concerns to consumers (New Harvest 2013). Moreover, as
the global populations continue to increase, food supply would gaining more
attention around the world. Plant proteins offer hope for countries where food is in
short supply if cost can be controlled and production technology transferred to
those who are willing to promote meatless products as a way to feed and provide
jobs for the impoverished masses.
Health concerns over the connection of meat over-consumption to
cardiovascular diseases (Sacks and others 2006), blood cholesterol levels,
obesity and other diseases (FDA 1993) have prompted consumers to be more
aware of the risks linked to high-fat and high-caloric diet. These heart diseases
are now responsible for a third of global mortality (WHO 2001). Over-consumption
of meat may be responsible for a quarter of all ischemic heart disease, or 1.8
million deaths, annually (Key and others 1999; WHO 2001). According to Barnard
and others (1995), the annual medical costs related to over-consumption of meat
are believed to be between 30 and 60 billion dollars. In light of these implications,
disadvantages of eating excessive meat and meat products, the World Health
Organization (WHO) has drawn up the following nutritional recommendations: fat

6
should provide between 15 and 30% of the calories in the diet; saturated fat
should provide not more than 10% of these calories, and cholesterol intake should
be limited to 300 mg/day (WHO 2003). The American Heart Association’s (AHA)
Dietary Guidelines for Americans also emphasize the importance of consuming a
variety of fiber sources to obtain the different types of fibers found in foods rather
than supplements (Krauss and others 2000).
So far, meatless products (also known as meat analogs) not only satisfy
nutrition concerns but also boost our sense of well-being as we see its
development work towards the reduction of animal slaughter and carbon dioxide
emission. According to the Livestock, Environment and Development Initiative,
livestock production accounts for 18 percent of global greenhouse gas emissions,
including 9 percent of carbon dioxide and 37 percent of methane gas emissions
worldwide (Brooks 2006; FAO 2006). Moreover, the Nutrition and Forestry
reported (1997) that 1.4 billion tons of farm animal wastes are produced in the
United States annually (United States Senate Committee on Agriculture 1997). de
Haan and others (1997) also reported that together with animal feed production,
meat production is responsible for the emissions of nitrogen and phosphorus,
pesticide contamination of water, heavy metal contamination of soil, and acid rain
from ammonia emissions.
Pimentel and Pimentel (1996) mentioned that given the inputs required to
house, transport, and slaughter animals; transport and process feed grains; and
transport and process meat, intensive meat production is only 25% as energy

7
efficient as soybean production. Plant protein ingredients usually cost less than
the muscle proteins due their accessibility and energy efficiency.
Foodborne pathogens and diseases are usually found in meats and cause
the illness, such as Salmonella, Campylobacter, pathogenic E. coli, avian
influenza, and Bovine spongiform encephalopathy (BSE). Mead and others (1999)
concluded that foodborne diseases -the most common causes of which are
contaminated meats - are responsible for over 76 million episodes of illness,
325,000 hospitalizations, and 5,000 deaths each year. Animal diseases, like Mad
Cow Disease is a persistent threat despite efforts to prevent such outbreaks from
happening. Animal diseases and fear of genetically modified animals have
become driving forces behind an increased demand for vegetable proteins to
replace animal proteins in the world’s food supply.
FAO (2002) reported 75% of existing fishing stocks are either fully- or
over-exploited. National Agricultural Statistics Service also reported (2003) that 9
billion farm animals are killed each year in the United States to produce meat and
60 billion are killed worldwide, not including unaccounted marine life (USDA
2003).
Islam population has been increasing rapidly around the world. Halal food
regulations allow the consumption of some meat, if it is properly slaughtered, but it
does not allow consumption of pork, which opens up a potential market for
meatless products including imitation sausage patties.
In summary, the major forces driving consumers to buy meatless products
and the reasons why soy or pea protein ingredients have received such great

8
acceptance are due to the following concerns: 1) global demands for foods, 2)
nutrition-related diseases, 3) environmental pollutions, 4) efficient and cheaper
protein sources, 5) foodborne pathogens, 6) animal welfare and 7) religious diet
restrictions. That awareness created a demand for low-fat and low-caloric food
without changing taste and eating habits significantly. To balance the health
concerns of those consumers who want to cut or reduce their meat intake, high
protein, high fiber and low fat foods are believed to become a potential market in
United States and even around the world. Furthermore, Oberbeil (1999)
mentioned that plant proteins are easily converted to amino acids and are up to
60 percent more bioactive than the protein in pork, beef or ground meat due to the
acids in vegetable products stimulate the secretion of stomach acid to break down
proteins to amino acids (Gallagher and Schugt 2012).
2.2 Meat Analog Ingredients
Typical meat analog ingredients and fillers or extenders in food industries are
summarized in the following table (Table 2.2.1).

9
Table 2.2.1 Typical meat analog ingredients. Ingredients References
Textured vegetable proteins
Deliza and others 2002; Gujral and others 2002; Kassama and others 2003; Rentfrow and others 2004; Kayayama and Wilson 2008; Qammar and others 2010
Non-textured vegetable proteins
Yang and others 1995; Cofrades and others 2000; Taylor and Walsh 2002; Parmer and others 2004; Lee and Chin 2009; Rehrah and others 2009; Walsh and Carpenter 2009
Surimi Cavestany and others 1994; Fátima Henriques Lourenço and others 2012
Plant starches/ flours Reitmeier and Prussa 1991; Mohammadi and Oghabi 2012 Fibers Cengiz and others 2005; Campagnol and others 2012 Water Claus and Hunt 1991; Egbert and Borders 2006 Carbohydrates or hydrocolloids
Mittal and Barbut 1993; Chin and others 2000; Pietrasik and Duda 2000; Lin and Huang 2003; Kumar and Sharma 2004; Cierach and others 2009; Jiménez-Colmenero and others 2012 ; Jiménez-Colmenero and others 2013
Fats/oil Gujral and others 2002 Binding agents, Carballo and others 1996; Gujral and others 2002; Modi and
others 2003; Ahmed and others 2007 Flavoring agents and coloring agents.
Deliza and others 2002
2.2.1 Textured Vegetable Proteins
Textured vegetable proteins were made from defatted soy or pea flour, which
is extracted from soybean or split pea or other plant proteins. Little to no fat, high
protein and dietary fiber are the health benefits of meatless products. Textured
vegetable proteins are an economical and high protein quality (Hamdy 1974;
Egbert and Borders 2006) source which has been applied in school lunch
programs and in prison lunch programs to balance the demand of nutrition.
The United States Department of Agriculture (USDA) has defined textured
vegetable protein products for use in school lunch program as “ food products
made from edible protein sources and characterized by having a structural
integrity and identifiable structure which allows each unit to withstand hydration

10
and cooking, as well as other procedures used in preparing the food for
consumption” (USDA 1971).
2.2.1.1 TVP Manufacturing and Use Instruction
Textured vegetable proteins, derived from soybean or pea, are usually made
by cleaning, heating, cracking the seed, dehulling and removing the oil with
hexane. This is the process which produce the white flakes needed to go on to the
next step of processing. The processing steps, needed to obtain textured soy
protein and textured pea protein also include extraction by alkali and acid,
extrusion and drying. Extruded products can be made into any shape depending
on the type of die used. These shapes include irregular granules, flakes, cubes
chunks, nuggets, grains, fibers and strips. Colored and nutrition fortified textured
soy or pea proteins are also widely used in food industry. Finished textured
vegetable proteins present no allergic components such as peanuts, tree nut, milk
and gluten. Throughout the various steps of processing including rehydration
(Guy 2001), cooking and other processes, a meatless product could retain its
structural integrity, texture and mouth-feel properties (Egbert and Borders 2006).
2.2.1.2 Limitations of TVP
. Up to 30% of soy materials were incorporated into the U.S. school lunch
program by the United States Department of Agriculture (USDA) (Riaz 2001;
USDA 1971; Edmondson and Graham 1975). USDA notice 219 permitted the use
of maximum of 30% of dehydrated TVP in meat dishes served to approximately
25 million children (Edmondson and Graham 1975). In food industries, the
incorporation of textured soy proteins or textured pea proteins into meat products

11
usually as an extender (Wilding 1974; Ali and others1982; Orcutt and others 2006)
and thus reduce costs (Singh and others 2008). When textured vegetable proteins
are used as a binder, they improve cooking yield, and when used as an emulsifier
they enhance stability of the products. The overall acceptance of low-fat products
has ranged from 10% to 30% (Deliza and others 2002; Gujral and others 2002;
Rentfrow and others 2004; Kilic and others 2010).
2.2.1.3 Applications of TVP
Soy products have better yields, easier handling, better yields, and lower
transportation, and preservation costs (Singh and others 2008) as compared to
meat (Kadane 1979). A textured vegetable protein diet (Riaz 2004) is
economically feasible and the high protein ingredients provide a variety of
choices.
Combined theTVP into meat patties (Deliza and others 2002; Kassama and
others 2003) or other meat products (Gujral and others 2002; Rentfrow and others
2004; Kilic and others 2010) were the most common approaches in food
industries. Kayayama and Wilson (2008) use textured soy protein (TSP) and
vegetable-based flavors to produce consumer acceptable “chicken” or “shrimp”
flavored TSP using heat application processes. Qammar and others (2010) use
chicken flavored TSP substitution for chicken meat in pizza toppings.
2.2.2 Non-textured Vegetable Proteins
Vegetable proteins usually refer to soybeans, but can also apply to cotton
seeds, peas, wheat or oats, all of which are utilized in processing textured
products (Strahm 2006) or are processed directly to form various products. Plant

12
protein isolates (Egbert and Payne 2009) can be used as a textured modifier via
protein-polysaccharide interaction and form complexes where electrostatic
complexation of oppositely charged protein and polysaccharide occurs
(Akseowan 2002; Shahiri Tabarestani and Mazaheri Tehrani 2012).
Beverages, meat analogs, energy bars, snacks, cereals and other low-fat
products are common applications of non-textured plant proteins in United States
(SANA 2013).
2.2.2.1.1 Soybean
Soybean and its products have been consumed for many years in Eastern
countries (Barrett 2006) like Japan, Taiwan, Korea, China and Southern Asian
countries as traditional foods; these foods include soybean milk (Fukushima
1994), tofu (Fukushima 1981), and fermented produce (Fukushima 1981), like
tempeh, miso and soy sauce. In contrast to the eating history of Eastern countries,
Western countries have utilized soybeans within their diet dramatically, especially
after the approval of food-labeling health claim for soy proteins in the prevention
of coronary heart disease by the US FDA in 1999.
As more nutritional characteristics about soybean understood, the soybean
contains almost little or no in cholesterol, fat or lactose, which gives consumers a
healthy diet and serves as alternatives to animal proteins. According to the US
Soybean Export Council (USSEC), Quality Report for 2013 (Naeve and others
2013): “US soybean meal had lower protein content than Brazilian soybean meal,
but better quality of protein – higher concentrations of essential amino acids (Park
and Hurburgh 2002; Thakur and Hurburgh 2007; Bootwalla 2009). Although

13
soybeans from the US are generally lower in crude protein, both US soybeans
and soybean meal contained higher concentrations of essential amino acids
(Thakur and Hurburgh 2007), thus making their protein fraction of higher quality”.
2.2.2.1.2 Health Benefits of Soybean
Unlike other legume proteins, soy proteins’ health benefits reach far beyond
just providing amino acids (NSRL 2014). The US Food and Drug Administration
(FDA) has claimed in 1999 that the consumption of 25g of soy protein a day, as
part of a diet low in saturated fat and cholesterol can reduce the risk of heart
disease (FDA 2013). Friedman and Brandon (2001) and Zhan and Ho (2005)
have also mentioned the health benefits and the importance of consuming plant
proteins, focusing on their effect on soy-induced lowering of serum total
cholesterol, LDL cholesterol, against obesity, diabetes and others. Another benefit
includes the reduced recurrence and death rate of breast cancer (Shu and others
2009; Guha and others 2009; He and Chen 2013).
Soy protein have good functional characteristics in food products providing the
good digestibility (Kiers and others 2000; Hong and others 2004; Wang and
others 2009; Teng and others 2012), after either by chemical or enzymatic
processing of raw soy. Soy proteins have a protein quality (DuPont Nutrition &
Health 2011) comparable to eggs. According to this study, soy protein has a
protein digestibility-corrected amino acid score (PDCAAS) of 1.00, meaning it is a
high-quality protein that meets the needs of both children and adults. Eggs, dairy
and meat proteins also have a PDCAAS score of 1.0. However, soy protein is the

14
only widely available high-quality plant-based protein that achieves this score
(DuPont Nutrition & Health 2011).
2.2.2.1.3 Anti-nutrient and Sensory Issues of Soybean
The anti-nutritional factors, mainly trypsin and chymotrypsin (Jiao and others
1992) and lectins were reduced after processing although not entirely (Foley and
others 2013) which in turn of aids digestibility (Kiers and others 2000; Hong and
others 2004; Wang and others 2009). Potential disadvantages of soybean
products such as beany flavor, lacks of the consistency in mouth-feel, and high
purine content (Havlik and others 2010) became the issues to be addressed.
Off-flavor could be controlled by blanching or lipoxygenase-2 to reduce its beany
flavor (Matoba and others 1985) or by lactic acid fermentation (Schindler and
others 2012) or by genetic modification (Fukushima 2004). Grinding soybeans at
high temperature is effective to control lipoxygenase activities and results in a
reduction of off-flavor generation and maximizes protein extraction (Wilkens and
others 1967).
2.2.2.1.4 Applications of Soy Protein Derivatives
The literature search begins in 1970 with a review of various soy protein
products, their preparation and use by the meat industry is reported by Rakosky,
who defined soy protein isolates (Rakosky 1970) as edible isolated soy protein
(ISP) produced by extracting a white flake with water or mild alkali (Meyer 1966).
Soy protein isolates (Rakosky 1970; Bookwalter 1978; Welsh 1979; Campbell
1981; Ledward and Lawrie 1984; Ahn and others 1999; Liu 2000; Egbert and
Borders 2006; Walsh and Carpenter 2009; Ahmad and others 2010) and soy

15
protein concentrates’ (Rakosky 1970; Bookwalter 1978; Welsh 1979; Campbell
1981; Liu 2000; Tömösközi and others 2001; Egbert and Borders 2006) properties
were widely discussed and investigated in reduced- fat meat and meat analog
products.
Soy protein being an economical source of food proteins has been used
extensively in meat products as a binder for improving yield, as a gelling agent to
enhance emulsion stability and as a meat replacement to reduce costs (Das and
others 2008). Ahn and others (1999) also showed soy proteins, especially soy
protein isolates (SPI) additives incorporated into comminuted meat products for
their water and fat binding ability, enhancement of emulsion stability, and
increased yield. Addition of soy protein isolates can change the texture
(Akesowan 2002), juiciness and color of buffalo meat sausage emulsion, which
was confirmed by Ahmad and others (2010). Exemptions of the incorporation or
application of soy derivatives had also been shown through many studies (Quass
1979; Kotula and Berry 1986; Chin and others 2000; Pietrasik and others 2000;
Cengiz and others 2005; Das and other 2008; Akesowan 2010; Nantapatavee
and others 2011).
2.2.2.2.1 Pea
According to Northern Pulse Growers Association, 2012 US Pulse Quality
Survey, yellow pea acreage and production was 344,596 acres and 294,802
metric tons, respectively, in 2012 compared to total acreage of 190,650 acres and
production 142,276 metric tons in 2011 (USA Dry Pea Lentil Council 2012).

16
Peas (Pisum sativum) are good sources of protein and are increasingly
recommended as part of the diet in order to promote general well-being and
reduce the risks of diseases. Additionally they are low in sodium while offering an
excellent source of soluble and insoluble fiber, complex carbohydrates, B vitamins
and minerals, such as calcium, iron and potassium (Nutralys® 2008). Pea
proteins, with its light, fluffy texture and slightly sweet taste, are highly digestible
(Rubio and others 2013), has a low-potential for allergic response
(Nowak-Wegrzyn and others 2003; Natural Food Benefits), low level of
anti-nutritional factors and phytosteroids (Nutralys® 2008) and also low cost
(Plummer 2012). They are also low glycemic index (GI) food and have been
shown to improve glucose and lipid levels in people with diabetes (USA Dry Pea
Lentil Council 2012).
2.2.2.2.2 Health Benefits of Split Pea
Yellow split peas are highly digestible (Rubio and others 2013) and contain
low phytosteroids or isoflavones; which reduce possible estrogenic effects
(Nutralys® 2008). Later, Agboola and others (2010) reported some moieties of
polyphenols obtained from the extraction responsible to the antioxidant and
antihypertensive actives. More currently, some studies also demonstrated that
pea protein derivatives are capable of stabilizing blood sugar levels (Li and others
2011), improving the arterial function and serum cholesterol levels (Zahradka and
others 2013) to maintain heart health in animal and human.

17
2.2.2.2.3 Applications of Pea Protein Derivatives
Pea protein isolates (Tömösközi and others 2001; Fukushima 2004; Watson
2009; Aluko and others 2009; Osen and others 2012) and pea protein
concentrates’ (Watson 2009) properties were widely researched and applied to
manufacture reduced- fat meat and meat analog products. Tabarestani and
Tehrani (2012) utilized split pea flour as part of fat replacer system in low-fat
burger. The application of pea protein derivatives in meat analog still limited
compared to soy protein derivatives.
2.2.3 Starch
Starches (Skrede 1989; Brewer 2012), in either their native form or in a
modified form, often serve as filler, fat-replacers and texture-enhancing agents in
formulation. Tabarestani and others (2012) showed that soy flour in combination
with starch leads to an increase in cooking yield and addition of split-pea flour in
mixed formula decreases shrinkage while improving texture properties. Shewry
and Tatham (2000) also claimed that starches and flours have been studied
extensively as potential fat replacers because of their ability to bind and retain
moisture.
2.2.4 Tofu Powder, Oatmeal and Fibers
Tofu powder, oatmeal (Kerr and others 2004; Yang and others 2007; Yang
and others 2010) and fibers (Cengiz and others 2005; Campagnol and others
2012) have been added in low-fat meat products. Yang and others’ results (2006)
showed that dried tofu powder reduce the fat content which increases protein
contents but weaken the internal texture of meat products.

18
Oats, a great source of soluble fiber, have been applied to several food
products based on their excellent functional and physiology effect. The main
purpose of adding hydrated oatmeal was to improve water holding capacity,
cooking loss, texture, moisture adsorption capacity, and sensory evaluation of the
final products. Kerr and others (2005) showed that up to 15% hydrated oat in
low-fat sausage can be made to improved flavor and texture as compared to
control without oat. Yang and others (2007) showed that the decrease in
hardness of oatmeal-added sausage products may be due to the higher
water-retention properties of oatmeal in response to heat treatment. They also
demonstrated that an acceptable low-fat pork sausage can be made where pork
is replaced with up to 25% hydrated oatmeal (Yang and others 2007) as
textured-modifying agents in low fat pork sausages. Later, Yang and others (2010)
showed the addition of 10% hydrated oatmeal as a fat substitute was more
effective for decreasing hardness and increasing cooking yield of beef meat than
pork and chicken. Altering textural properties by decreasing the hardness of a
product was also shown by tests that focused on the addition of oatmeal
(Pszczola 1991; Dawkins and others 2001).
Fibers have proven capable of holding the water content while cooking
because of their ability to retain moisture and prevent meat from drying when
cooked. Campagnol and others (2012) reported that fermented sausages with
healthier characteristics can be produced without quality loss by reducing fat from
15 to 10% and by adding 1% soy fiber. Cengiz and Gokoglu (2005) reported the

19
frankfurter-type sausages did not have significant difference between sausages
treated with citrus fiber and those with soy protein concentrate.
2.2.5 Carrageenan
Carrageenan, are linear sulfated high molecular weight polysaccharides,
extracted from certain type of red algae, could enhance water-holding capacity,
cooking loss, juiciness and slicing properties and also acts as a gelling and
thickening agent of various food products (Imeson 2000). It is classified as GRAS
by the United States Food and Drug Administration (FDA 1973) .In the food
industry, many other hydrocolloids are also applied, such as guar gum, cellulose
gum, gum Arabic, xanthan gum and konjac (Chin and others 2000; Lin and Huang
2003) to enhance the cooking properties of products or as fat replacements.
Hydrocolloids also improve the hardness, cohesiveness, chewiness, gumminess,
sliceability, water holding capacity, binding ability, emulsification stability, and
juiciness of meat products. They also lower the weight loss, cooking loss and
shrinkage of low-fat products (Egbert and others 1991; Barbut and Mittal 1992;
Bater and others 1992; Brewer and others 1992; Trius and Sebranek 1996; Xiong
and others 1999; Hsu and Chung 2001; Candogan and Kolsarici 2003; Kumar
and Sharma 2004; Ayadi and others 2009; Cierach and others 2009; Modi and
others 2009). Concluded from those studies, around 0.5% carrageenan were
considered as optimum level due to the best cooking properties, overall
acceptable and textural changes; however, study from Hsu and Chung (2001)
claimed less than 2% addition had significantly affected the cooking and textural
properties to low-fat emulsified meatballs.

20
2.2.6 Binding Agents
Widely used binders in meat-based or meatless products include legume flour
(Modi and others 2003), sodium caseinate, whey protein concentrate, liquid whole
egg (Gujral and others 2002), egg white powder (Ahmed and others 2007) and
egg white (Carballo and others 1996). Processing technology also enhances the
binding ability of ingredients; e.g. high pressure restructuring meat is more
effective than binders (Hong and others 2006).
2.3 Other Classified Meat Analogs
2.3.1 Mycoproteins
In the United Kingdom (UK), mycoprotein, a high-quality imitation protein is the
main ingredient in Quorn food products, and its popularity lies in the fact that it is
free from cholesterol, low in fat and saturates and contains no trans-fats. It also
contains all nine essential amino acids making it a first class protein (Marlow
Foods Ltd. 2008). “Quorn” was developed by Marlow Foods in Stokesley, North
Yorkshire, UK. It has a texture which resembles the texture of meat and is
recognized by the Food and Drug Administration as Generally Recognized as
Safe (GRAS) (FDA 2001). Danny and others (2009) showed that mycoprotein is a
high protein ingredient with high fiber and low-fat food materials fermented from
the filamentous fungus Fusarium venenatum.
Asgar and others (2010) reported that 120 to 140 grams mycoprotein can
reduce cholesterol by about 10%. Amounts required to acquire the promising
health benefits (Asgar and others 2010; Marlow food 2008) have not been
recommended. However, Turnball and Ward (1995) issued a test meal of 20 g

21
mycoprotein per day along with a control meal to 19 healthy adults to investigate
the glycemic response. The meals were given in random order with a 7-day
washout period between the two meals (Marlow Foods 2009). Turnball and Ward
(1995) observed that the serum glucose response was lower throughout the entire
120 min post-prandial period following the mycoprotein meal compared to the
control. The insulin response was also lower. Furthermore, the only nutritional
difference between the test meals was that the mycoprotein meal contained 11.2
g more dietary fiber; hence, the viscous polysaccharides were given credit for
reducing postprandial glycemia and insulinemia. Turnbill and others also
attributed lower cholesterol to mycoprotein-based Quorn (Turnbill and others
1992). Despite Marlow Food’s extensive coverage of their products’ benefits,
origin and process, many people still not familiar with mycoprotein as an
alternative protein source to which can serve as a substitute for meat when
combined with other ingredients (Rodger 2001). Disadvantages, such as a long
culture time, and high costs for media component (Danny and others 2008) have
led some consumers to find other vegetarian products although Quorn is popular
in Europe, Canada and the U.S.
2.3.2 Seitan
Seitan, also called gluten or wheat meats, is derived from the protein portion
of wheat. When simmered in a traditional broth of soy sauce or tamari, ginger,
garlic, and kombu (seaweed), it is the so called seitan (Nussinow 1996). Though it
considered as one of the good vegetarian foods source, it is an allergic food for
some wheat allergy consumers (FARE 2013).

22
2.4 Mushrooms
2.4.1 Edible Mushrooms and King Oyster Mushrooms
Edible mushrooms include many species, such as shiitake (Lentinula edodes),
oyster mushroom (Pleurotus ostreatus), black polar mushroom (Agrocybe aegrita
Singer), beech mushroom (Lyophyllum ulmarium), button mushroom (Agricus
bisporus), king oyster mushroom (Pleurotus eryngii), enokitake (Flammulina
velutipes), black mushroom (Auricularia auricular judae).
King oyster mushroom (Pleruotus eryngii), also known as king trumpet
mushroom, French horn mushroom, king brown mushroom, boletus of the
steppes and trumpet royale, is an edible mushroom native to the Mediterranean
regions of Europe, Asia, the Middle East and North Africa. It has a trumpet-like tan
cap and a thick, meaty white stem and as the largest species, a king oyster
mushroom can have up to an 8-inch stem.
2.4.2 Consumption and Sale Trend of Mushrooms
Mushrooms has been consumed in Asian countries and Mediterranean
regions of Europe for many decades for their nutritional values, nutraceutical
values and for medical purposes (Chang and Miles 2004; Dikeman and others
2005). Production of mushrooms gradually increases over time, with China being
the largest producer (Aida and others 2009) and consumer (USITC 2010) of
mushrooms with a market share of 47 % (Harsh and Joshi 2008). According to
Economic Research Service (ERS), from 1960s to 2000s, the per capita use of
mushrooms has waned due to consumers’ economic, social and demographic
characteristics (Lucler and others 2003). From 2011 to 2012, the ERS reported in

23
line with higher production, that the per capita use of all mushrooms rose 4.4% to
3.99 pounds (USDA 2012).
2.4.3 Nutrition of Mushrooms
Mushrooms are rich in protein with little or no fat. They are rich in essential
amino acids (EAA) and fibers (Reis and others 2012). Well known for their
excellent nutritional content, mushrooms provide vitamins, B1, B2, B12, C, D and
E and selenium, potassium (Duyff 2006; Mushroom Council, CA) , which
classifies them as nutraceuticals. The health properties of mushroom are
especially helpful to diabetics (Deshmukh 2013), but they also provide benefits for
all consumers with low calories, high protein, and little or no fat (Ranogajec and
others 2010). They are also cholesterol-free, and they have been reported to
lower the risk of gout (Lyu 2003; Choi 2004; Choi 2010; Chuang 2011). They are
also very low in sodium (Tong and others 2008; CSIRO 2012).
2.4.4 Health Benefits of Mushrooms
For the medical properties, according to the International Society for
Mushroom Science (ISMS) and Agriculture Marketing Resource Center (AgMRC),
benefits of mushrooms include antitumor, anti-cancer attributes. The ISMS and
AgMRC also report that they boost the immune system and help in digestion.
They also reduce hypertension and other therapeutic properties, which are
well-known benefits of consuming mushrooms (Harsh and Joshi 2008). These
potential benefits are attributed to the content of β-glucans, ergothioneine and
lovastatin in the king trumpet mushroom (Dikeman and others 2005). The health
benefits of mushrooms can be documented by several studies (Mallavadhani and

24
others 2006; Rop and others 2009; Alam and others 2011; Zeng and others 2012;
Kang and others 2012; Chen and others 2013; Liang and others 2013; Yang and
others 2013) and had reported the components and the validity of health benefits
mentioned above.
2.4.5 Applications on Meat Products
Wan Rosli and others (2011) utilized oyster mushrooms in chicken patties for
its proximate composition and sensory evaluation. In the work of Cha and others
(2012), white jelly mushroom (Tremella fuciformis) served as meat substitute to
reduce greasy and oily issues in pork patty formulation.
2.5 Physicochemical Properties Measurement
2.5.1 Textural Properties
Texture is considered one of the vital properties by which the food industry and
customers render both quality and acceptability of food products. The term
“texture” includes a variety of kinesthetic sensory characteristics: those perceived
prior to mastication (particle size, oiliness), those perceived during mastication
(tenderness, juiciness) and those perceived after mastication (fibrous, residue,
mouth coating) (Brewer 2012). Food texture could be attributed to and associated
with the entire food processing chain, so called “From Farm to Table”, which
includes all the steps leading to the harvest procedures and ending with the
processing operation. Food internal properties, such as water, fat and protein are
content, also associated with the texture (Drewnowski 1987; Shieh and others
2004) of foods.
25
Instrumental tests have been used in research and the food industry to assess
food texture of the products, and different probes are used to sense the sample
depending on the form, shape, and its own properties. Texture profile analysis
(Bourne 1978; Chen and Opara 2013) is the most common method to qualify the
properties, which hardness, cohesiveness, adhesiveness, springiness,
fracturability, chewiness, gumminess, and resilience, of meat analogs or low- or
reduced-fat meat products.

26
CHAPTER 3 MATERIALS AND METHODS
3.1 Ingredients
Textured soy protein (unflavored, caramel colored and minced 180, Code:
165-218, ADM, Decatur, IL, USA) and textured pea protein (unflavored, uncolored,
irregular granules, University of Missouri, Columbia, MO, USA) were used to
provide the water binding ability, the texture or mouth-feel, the protein source and
the insoluble fiber of the product (Egbert and Borders 2006). Other ingredients
such as corn oil, salt, fresh egg white, mushroom soy sauce, sesame oil, sugar,
and onion powder were purchased from local grocery stores (HyVee). Garlic
powder (Dehydrated garlic powder, Silva, Momence, IL, USA) was added to
enhance the flavor of imitation patties. Potato starch (Bob’s Red Mill Natural
Foods, Milwaukie, OR, USA) served as fillers of the imitation sausage patties.
Kappa -carrageenan (Grindsted ® Meatline 1725, Danisco, DuPont Nutrition and
Health, St. Louis, MO, USA) was added to bind water, reduce cooking loss of
imitation patties and also served as an emulsifier (Egbert and Borders 2006).
Dried king oyster mushroom (Ivory Portabella, Woodland Foods, Waukegan, IL,
USA) were used to provide chewability and fiber source to imitation patties. Soy
protein isolates (Solae, St. Louis, MO, USA) and pea protein isolates (Roquette,
New Bern, NC, USA) were employed as a part of binders, emulsifier and
nutritional enhancer (Egbert and Borders 2006).

27
3.2 Experimental Design
A full experimental design containing two independent variables, each had
three different levels, was used. The two independent variables were soy or pea
protein isolates (3, 6 and 9%) and dried king oyster mushrooms (0, 3.5 and 7%).
The level of textured soy or pea proteins were fixed at 15% based on preliminary
tests. Other ingredients were corn oil, fresh egg white, carrageenan, potato starch,
salt, sesame oil, soy sauce, sugar, onion powder and garlic powder, were kept
constant at 4, 7, 0.5, 0.5, 0.3, 0.3, 0.3, 0.2 and 0.2%, respectively (Appendix 9).
Table 3.1 shows the total amount of water needed to be added. Total amount of
water minus the hot water used to rehydrate textured vegetable protein are the
amount of water added into mixture. One hundred percent minus all the
ingredients mentioned above is the amount of potato starch. With one exception,
the 7% king oyster mushrooms mixed with 9% soy protein isolates, which the
amount of egg white is 2.7% instead of 7%. The levels for each independent
variable and textured soy or pea proteins were determined based on the results
from the preliminary tests.
3.3 Processing of soy- and pea-based Imitation Sausage Patties
The percentages of various ingredients were based on the percentage of the
final weight of imitation sausage patties, approximately 45 gram of each. Dried
king oyster mushrooms were 0, 3.5 and 7%; soy and pea protein isolates were 3,
6 and 9%. Dried king oyster mushrooms were washed without soaking in excess
water and then cut into small pieces (approximately 0.5 cm long x 0.3 cm wide).
The percentage of textured soy protein (TSP) (Nutrition fact: moisture 9% max,

28
protein 53%, fat 3%, total dietary fiber 18%, carbohydrates 32% and 270 calories
per 100g) and textured pea protein (TPP) in the formulation were fixed at 15%.
Due to differences in size, shape and moisture content they had different
requirements of hot water for rehydration (Guy 2001). From the results of
preliminary tests, the ratios of hot water to textured soy protein (TSP) and
textured pea protein (TPP) were 2.5:1 and 1.5:1, respectively. Other ingredients
were corn oil, fresh egg white, carrageenan, salt, seasoning (sesame oil,
mushroom flavor soy sauce and sugar), garlic powder and onion powder were
kept identical to 4, 7, 0.5, 0.5, 0.9 ( 0.3 of each), 0.2 and 0.2%, respectively
(Appendix 9). The total amount of water, includes hot water used to rehydrate
TVP, added in the imitation patties was shown in Table 3.1. The potato starch
was used, in addition to other ingredients listed above, to make up 100% of
imitation patties. At 7% king oyster mushroom and at 9% soy protein isolate, only
2.7% fresh egg white were added due to minimum solubility requirement of the
ingredients to maintain the quality of formed raw patties. Each treatment was
mixed manually in a stainless steel bowl until the mixture was uniform. The
mixtures were then formed into patties with an acrylic circular mold (63 mm in
diameter and 12mm in height). The molded imitation patties were cooked in a
pan with a medium heat for 5 minutes on each side. Samples from each
treatment were prepared in triplicate and tested on the same day.

29
Table 3.1.Total amount of water added in Imitation patties formulation.
Dried king oyster mushroom(%)
1
SPI or PPI(%) 12
TSP 12
TPP 12
Water(%)1
0
3 51.0 43.0
6 54.0 46.0
9 57.0 49.0
3.5
3 52.5 44.5
6 55.5 47.5
9 58.5 50.5
7
3 54.0 46.0
6 57.0 49.0
9 60.0 52.0 1 The percentage of soy- or pea-based imitation sausage patties.
2 SPI, soy protein isolates; PPI, pea protein isolates; TSP, textured soy protein; TPP, textured
pea protein.
3.4 Methods 3.4.1 Cooking Yield and Cooking Loss
The weight of each imitation patty sample was measured before and after
cooking to determine cooking yield and cooking loss. Cooking yield and cooking
loss were calculated as follows.
Cooking yield (%) = (weight after cooking / weight before cooking) x100% Eq.1
Cooking loss= [(weight before cooking- weight before cooking)/weight before
cooking] x100% Eq. 2
3.4.2 Color Measurement
The surface color of cooked patties was measured by a Konica Minolta’s
CR-410 Chroma Meter (Sensing Inc., Japan) after standardized with a white tile.
Two measurements, turned 90 degree after the first measurement, were taken for
each sample and three samples were used from each treatment. The averages of
L, a and b values were reported. L are lightness with values ranging from 0 (black)
to 100 (white), while a and b means redness and yellowness, respectively.

30
3.4.3. Texture Profile Analysis (TPA)
For texture profile analysis (TPA), a TA-HDi texture analyzer (Texture
Technologies, Crop, New York) was used to measure the hardness,
adhesiveness, springiness, cohesiveness, gumminess, chewiness and resilience.
Three imitation sausage patties from each treatment were used. They were cut
into two cubic samples (2.5x2.5x1.2 cm). A 50.98 mm cylindrical probe was used
with the following testing conditions: pre-test speed, test speed and post-test
speed was 5.00 mm/s, 1.00mm/s and 1.00mm/s, respectively and each sample
was compressed to 50% of initial height (1.2cm); using a 5 kg load cell. The
following parameters were determined: hardness( N/cm2), the peak force at the
first compression and the force needed to deform the sample; springiness(cm),
the ability of a sample to recover its original form after a deforming force is
removed; cohesiveness, the extent to which a sample could be deformed before
rupturing; adhesiveness(N s), the force needed to pull the compressing plunger
away from the sample; gumminess( N/cm2), the force needed to conform a
sample for swallowing; chewiness( N/cm), the force needed to chew the sample
before swallowing; and resilience, how well a product regains its original position
after measurement.
3.4.4 Water Activity
Water activity was determined by a water activity meter (Decagon’s AquaLab
CX-2, Pullman, WA, USA), which uses the dew point method to determine water
activity. The sample cup was filled to slightly less than its half capacity with the
sample. Test results were acquired from the CX-2 meter screen after several

31
minutes. Every sample’s water activity value and temperature (oC) were recorded
in triplicate for each treatment.
3.4.5 pH Value
The pH value of imitation sausage patties was determined by mixing 10 g of
sample with 90 mL of distilled water for one minute using a hand blender
(Hamilton Beach Model 59762, Southern Pines, NC, USA). The pH of the
suspension was recorded by a glass electrode with a digital pH meter (Meridian,
MR-10, Denver Instruments). Three samples were used for each treatment and
the average was reported.
3.4.6 Cooking Shrinkage
Shrinkage test was conducted by determining the difference in diameter
between raw (mold diameter) and cooked imitation patties using a six-inch digital
caliper (Pittsburgh, China). Three samples were taken for each treatment and
each sample was measured twice, rotating 90⁰ after the first measurement and
the average was reported.
3.4.7 Water holding/hydration capacity (WHC) of textured soy protein (TSP)
and textured pea protein (TPP)
Water holding capacity (WHC) was determined by adding 30 g TSP or TPP
into a 400-mL beaker with 150 mL of 4oC water. Samples were refrigerated for 1 h.
The beaker was emptied onto a mesh screen and titled 25∘angle and allowed to
drain for 3 min. A paper towel was used to remove excess water before the
samples were weighed (Troy and Lawrence 2001). WHC was calculated by:

32
WHC (%) = [(hydrated sample weight-dry sample weight)/ dry sample weight]
x 100%. Eq. 3
3.4.8 Water holding/hydration capacity (WHC) of product
The WHC modified AACC (56-30.01) (2000) procedure and the Dagbjartsson
and Solberg WHC method (1972) were applied as follows. Five grams of samples
were mixed with 10 mL of water, and then placed in a 50 mL centrifuge tube,
weighed, vortexed for 1 min, and centrifuged for 10 min (2000g, 15oC; Centrifuge,
Model J2-21M/E, BECKMAN, USA). After removing the supernatant, the residue
weight was determined. WHC of samples was calculated as follows:
WHC%= [(weight of sample after centrifuging- weight of sample before
centrifuging)/ weight of the sample before centrifuging] x100% Eq. 4
The retained weight was expressed as the amount of water absorbed per
gram of sample on dry weight basis. Three samples were taken from each
treatment.
3.5 Statistical Analysis:
All experimental data were expressed as a mean of at least three
measurements. Analysis of Variance (ANOVA) and Least Squares Means were
used to determine the significance of the independent variable (SAS, version 9.3,
Gary, NC, USA). Significance of results were determined at the P<0.05 level for
all data analyses. All data was used to generate the 3D plot using the Sigma Plot
(Systat software Inc. version 12.0, San Jose, CA, USA).

33
CHAPTER 4
RESULTS AND DISCUSSION 4.1 Preliminary Tests
4.1.1 Initial Formulation
The very first formulation of the soy-based imitation sausage patties was
developed and designed from the patents (Coöperatie Koninklijke Cebeco Groep
U.A. 2000; Hargarten and others 2004). The first patent used dried champignons,
pea protein, wheat fiber, chicken egg protein, oil, salt carrageenan seasoning and
textured pea protein to make sausage. The second patent used water, vegetable
protein products, vital wheat gluten, soy/canola salad oil, modified starch B990,
dextrose, methylcellulose, spice and color to make emulsion based meat
analogue.
Based on these two formulas, textured soy protein, vital wheat gluten, king
oyster mushroom, corn oil, fresh egg white, salt, carrageenan, seasoning, garlic
powder, onion powder and water were used as the initial soy-based imitation
sausage patties formulation.
4.1.2 Formula Modification
Considering the food allergy problems in United States, even though vital
wheat glutens helped providing chewability and texture for the imitation sausage
patties, they were replaced by soy protein isolates in soy-based imitation sausage
patties. In addition, textured pea protein and pea protein isolates were used in
pea-based imitation sausage patties. By doing so, all the ingredients in

34
formulation were gluten free in the production of plant-protein-based imitation
sausage patties.
Textured soybean or pea proteins usually undergo processes like extrusion
and drying, which had been developed to retain a fibrous and spongy structure
thereby boosting the juiciness and succulence of the end-product by certain
degrees. However, excessive use of textured vegetable proteins, where they take
up 20% to 30% of total weight reduced the texture properties and acceptability.
The negative effects include off-flavor (Rentfrow and others 2004; Katayama and
Wilson 2008) and hard texture (Heywood and others 2002; Deliza and others
2002), though it could improve cooking properties (Kilic and others 2010).
Therefore, this research set the textured soy and pea proteins at 15% of total
weight.
King oyster mushrooms were added to enhance the fibers content, digestion
and improve mouth-feel. However, up to 8% of king oyster mushroom weakens
the binding ability and integrity of mixture; hence, the maximum king oyster
mushroom was 7%.
4.1.3 Final Formulation
The goal was to determine the influences of additional soy or pea protein
isolates and king oyster mushrooms on the properties of imitation sausage patties.
Therefore, the two independent variables were soy or pea protein isolates (3, 6
and 9%) and dried king oyster mushrooms (0, 3.5 and 7%). The level of textured
soy or pea proteins were fixed at 15% based on preliminary tests. From the
results of preliminary tests, the ratios of hot water to textured soy protein (TSP)

35
and textured pea protein (TPP) were was 2.5:1 and 1.5:1, respectively. Other
ingredients were corn oil, fresh egg white, carrageenan, salt, sesame oil, soy
sauce, sugar, onion powder and garlic powder, were kept constant at 4, 7, 0.5, 0.5,
0.3, 0.3, 0.3, 0.2 and 0.2%, respectively. The amount of cold water (Table 3.1)
added in imitation patties formulation came from a series trials to acquire dough
integrity and good solubility among ingredients. The potato starch was used, in
addition to other ingredients listed above, to make up 100% of imitation patties.
With one exception, the 7% king oyster mushrooms mixed with 9% soy protein
isolates, where the amount of egg white is 2.7% instead of 7%.
4.2 Effect on Product Properties
4.2.1 Effect on Cooking Yield or Cooking Loss of the Products
Animal meat loses water during heat treatment and thus has a lower cooking
yield or high cooking loss in the end-products. This is because water exists within
animal tissues and cannot be held under thermal treatment. However, this is not
the case with meatless produce and protein-protein-based products due to
different patterns structured to keep water within vegetable additives. Cooking
loss and cooking yield show the degrees of water evaporated or released during
heat treatment and are widely used as the indicators to determine what degree of
water can be retained within structure of imitation sausage patties.
Statistical results showed a significant difference (p<0.05) between soy-based
and pea-based imitation sausage patties. Different shape and minced degree
lead to different capacities for binding water, or for interacting with other
ingredients; hence, different percentages of water are forced out when heating at

36
different temperatures. Kilic and others (2010) presented the ability of textured
vegetable protein to decrease cooking loss and evaporative loss in meat products.
Differences between soy-based and pea-based imitation sausage patties also
related to the results of water holding capacity (WHC) of textured vegetable
proteins. WHC of textured soy proteins and textured pea proteins were 2.72 and
0.68, respectively.
Table 4.2.1.1: Average values of cooking yield percentage for each combination of king oyster mushrooms and soy protein isolates (a); and pea protein isolates (b). (a)
Soy protein isolate (%)1
King oyster mushroom (%)1
0 3.50 7
3 94.22A
a 94.15A
a 93.07A
b
6 94.82A
a 94.45A
a 93.64AB
b
9 94.48A
a 94.45A
a 94.00B
a 1
The percentage of soy-based imitation sausage patties. Sample mean with at least one superscript letter in common among columns or subscript
letter in common among rows (within the same box) are not significantly different at 5% level by Fischer’s protected LSD test.
(b)
Pea protein isolate (%)1
King oyster mushroom (%)1
0 3.50 7.00
3 94.08A
a 92.75A
a 92.67A
b
6 94.38A
a 93.56B
b 91.48B
c
9 94.00A
a 92.90AB
b 91.70B
c 1
The percentage of pea-based imitation sausage patties. Sample mean with at least one superscript letter in common among columns or subscript
letter in common among rows (within the same box) are not significantly different at 5% level by Fischer’s protected LSD test.

37
. (a)
(b)
Fig 4.2.1.1: Average values of cooking loss percentage for each combination of king oyster mushrooms and soy protein isolates (a); and pea protein isolates (b).

38
4.2.1.1 Soy-based Imitation Products
For the soy-based imitation sausage patties shown in Table 4.2.1.1(a) and Fig
4.2.1.1(a), 0 and 3.5% king oyster mushroom groups were not significantly
different (p>0.05) with increased level of soy protein isolates; however, the level of
statistical significance were significantly increased (p<0.05) between 3% and 9%
soy protein isolates as 7% king oyster mushroom incorporated. The higher
significance is thought to be due to a higher percentage of soy protein isolates
added into the formulation, leading to a compact and firm structure and a higher
cooking yield compared with others within the 7% king oyster mushroom group.
The 3 and 6% soy protein isolate groups showed a significant decrease
(p<0.05) in cooking yield as the level of king oyster mushrooms increased to 7%,
but not when 9% soy protein isolates were combined with 7% king oyster
mushrooms. Improvement in statistical significance had a direct connection to the
combination containing the highest amount of king oyster mushrooms and soy
protein isolates. This combination slightly reduced the amount of water forced out
during heat treatment.
4.2.1.2 Pea-based Imitation Products
For the pea-based imitation sausage patties (Table 4.2.1.1 (b); Fig 4.2.1.1
(b)), it did not make significant differences (p>0.05) in cooking yield without king
oyster mushrooms. The level of statistical significance were significantly
increased (p<0.05) only between 3% and 6% pea protein isolates as 3.5% king
oyster mushroom incorporated. The 7% king oyster mushroom group showed a
significant decrease (p<0.05) in cooking yield as the 6% and with 9% pea protein

39
isolates were mixed individually. It is possible that the pea protein isolates lessen
the strength of structure.
All three pea protein isolate groups showed decreased significance (p<0.05) in
cooking yield with boosted level of king oyster mushrooms, with the exception
wherein 3% pea protein isolate combined with 7% king oyster mushrooms.
4.2.1.3 Further Discussion on Cooking Properties
Under the highest amount of king oyster mushrooms and soy protein isolates
seemed to slightly increase the yield; and pea protein isolates seem slightly
decrease the yield. All these findings contribute to the body of knowledge on
textured soy or pea proteins as discussed by Gujral and others (2002) and
Kasssm and Emara (2010). The research also adds to the body of knowledge on
soy or pea protein isolates (Kotula and Berry 1986; Akesowan 2010; Kilic and
others 2010; Silva and others 2011; Shahiri Tabarestani and Mazaheri Tehrani
2012), potato starch (Carballo and others 1995; Pietrasik 1999; Shewry and
Tatham 2000) and carrageenan (Brewer and others 1992; Bater and others 1992;
Xiong and others 1999; Hsu and Chung 2001; Candogan and Kolsarici 2003;
Kumar and Sharma 2004; Cierach and others 2009; Garcia and others 2013), all
of whom were interested in how to better retain or bind the water within the
vegetable structures when looking for high cooking yield or low cooking loss, high
rigidity and low degree of expressible water. Cha and others (2012) found that
addition of grinded white jelly mushrooms had significant higher cooking yield and
oil binding capacity than control, which had different result to this study. The
40
possible reason would be the size of mushrooms added to formulation causes the
differences on cooking yield.
4.2.2 Effect on Color of the Products
Color plays as an indicator to judge the acceptance and also influences food
products marketing strategy based on first impressions of consumers. Food
manufacturers want to know if the added king oyster mushrooms and different
levels of soy and pea protein isolate could cause any changes to its color or
appearance, which is why measuring the surface color by a colorimeter or other
techniques are widely applied by food manufacturers. Color depends on prior
mixing with other ingredients, in addition to the textured soy proteins and textured
pea proteins, which are brown and light yellow, respectively. Other ingredients
that affect the color index are soy protein isolates, pea protein isolates and potato
starches, which are ivory-white with slightly yellow, pale-yellow and white,
respectively. Frying and the addition of spices are two possible factors that
produce different colors of end-products after heat treatment.

41
(a)
(b)
Fig. 4.2.2.1: Average values of color index, L (a) and b (b) value, for each combination of king oyster mushrooms and soy protein isolates. L value indicates lightness: 0 yields black and 100 indicate diffuse white and b value indicates yellowness when positive and blueness when negative.

42
(a)
(b) Fig. 4.2.2.2: Average values of color index, L (a) and b (b) value, for each combination of king oyster mushrooms and pea protein isolate. L value means lightness: 0 yields black and 100 indicates diffuse white and b value means yellowness when positive and blueness when negative.

43
.4.2.2.1 The L and b Value of Soy-based Imitation Products
The L and b values were not significantly different (p>0.05) for both soy-based
and pea-based imitation sausage patties. However, 0% king oyster mushroom
group had significantly (p<0.05) higher lightness, and 3% soy protein isolate
group had significantly lower lightness in soy-based imitation sausage patties (Fig.
4.2.2.1 (a); Appendix 1(a)) independently.
The three soy protein isolate groups had significantly different yellow values
when compared to each other (p<0.05) and the three king oyster mushroom
groups did not show significantly different (p>0.05) yellow value in soy-based
imitation sausage patties (Fig. 4.2.2.1 (b); Appendix 1(b)) independently.
4.2.2.2 The L and b Value of Pea-based Imitation Products
For pea-based imitation sausage patties (Fig. 4.2.2.2 (a) and (b)), three pea
protein isolate groups were significantly different (p<0.05) in both yellowness and
lightness when compared to each group independently; and the three king oyster
mushroom groups did not show a significantly different (p>0.05) color
independently.
4.2.2.3 Further Discussion on the L and b Value
Conclusions can be drawn that king oyster mushrooms slightly increased the
lightness but not significantly (p>0.05) after cooking; nevertheless, soy or pea
protein isolates significantly (p<0.05) increased the lightness and yellowness in
most of cases. These results were similar to other works (Ahmad and others 2010;
Shahiri Tabarestani and Mazaheri Tehrani 2012) but the finding Pietrasik and
Duda (2000) and Akesowan (2010).

44
Table 4.2.2.1: Average values of a value for each combination of king oyster mushrooms and soy protein isolates (a); and pea protein isolates (b). (a)
Soy protein isolate (%)1
King oyster mushroom (%) 1
0 3.50 7
3 3.81A
a 5.56A
b 5.11A
c
6 4.30B
a 4.60B
b 5.56B
c
9 4.19B
a 5.99C
b 5.85C
b 1
The percentage of soy-based imitation sausage patties. Sample means with at least one superscript letter in common among columns or subscript letter in common among rows (within the same box) are not significantly different at 5% level by Fischer’s protected LSD test. a value indicates redness when positive and greenness when negative.
(b)
Pea protein isolate (%)1
King oyster mushroom (%) 1
0 3.50 7
3 7.50A
a 7.17A
b 7.43A
ab
6 7.11B
a 7.19A
a 8.06B
b
9 7.66A
a 7.55B
a 8.16B
b 1
The percentage of pea-based imitation sausage patties. Sample means with at least one superscript letter in common among columns or subscript letter in common among rows (within the same box) are not significantly different at 5% level by Fischer’s protected LSD test. a value indicates redness when positive and greenness when negative.
4.2.2.4 The a Value of Soy- and Pea-based Imitation Products
Excluding two exceptions, 0% king oyster mushroom mixed with 9% soy
protein isolates and 9% soy protein isolates incorporating 7% king oyster
mushrooms, redness was significantly (p<0.05) different but with no trend in each

45
formulation of the soy-based meat sausage patties (Table 4.2.2.2.1 (a); Appendix
2(a)) .
For pea-based imitation sausage patties (Table 4.2.2.2.1 (b); Appendix 2 (b)),
the amount of pea protein isolates did not seem to correlate with the redness
without king oyster mushroom; however, at the3.5 and 7% king oyster mushroom
groups significantly (p<0.05) increased the redness with increased amount of pea
protein isolates.
A possible explanation of the redness would be the Maillard reaction during
cooking on pan. The Maillard reaction is not a single reaction, but a complex
series of reactions between amino acids and reducing sugars, usually at
increased temperatures (FOOD-INFO 2013). Increased amounts of king oyster
mushrooms (Reis and others 2012) and of soy or pea protein isolates (Shahiri
Tabarestani and Mazaheri Tehrani 2012) render a color change. Other
explanations for the color would be the effect of spices or the after effect of
thermal treatment involving textured soy or pea proteins.
4.2.3 Effect on Texture Profile of the Products
4.2.3.1 Hardness of Plant Protein-based Imitation Products
4.2.3.1.1 Hardness of Soy-based Imitation Products
Textural properties defined the character of the products and also referenced
the mouth-feel to some degree. Table 4.2.3.1.1 (a) shows the hardness of the
soy-based imitation sausage patties. At 0%, the king oyster mushroom group’s
hardness decreased not significantly (p>0.05), but increased significantly (p<0.05)
at 3.5% and 7% king oyster mushroom group, especially when 9% soy protein

46
isolates are incorporated, causing the meatless sausage patties to attain their
highest hardness.
As the level of king oyster mushrooms increased, hardness declined
significantly (p<0.05) both at 3% and 6% soy protein isolate group. However, the
hardness increased significantly (p <0.05) at 9% soy protein isolate group, which
is 1606.974, 1916.676 and 2005.966 N/cm2, respectively.
For soy-based imitation sausage patties (Table 4.2.3.1.1 (a)), soy protein
isolates play a certain role in strength hardness. On the other hand, king oyster
mushroom lowered the hardness as combined with 3 and 6% SPI individually.
The highest level of soy protein isolates and the fair to highest amount of king
oyster mushrooms combined exhibited the highest hardness of soy-based
Imitation sausage patties.
4.2.3.1.2 Hardness of Pea-based Imitation Products
As for the pea-based imitation sausage patties (Table 4.2.3.1.1 (b)), hardness
waned (p<0.05) significantly with increased pea protein isolates besides the
formulation mixed with 9% pea protein isolates only. In the case of the pea protein
isolate mixtures of 3, 6 and 9%, hardness also decreased (p<0.05) significantly
and the highest value were recorded when the 3% pea protein isolates’ mixture
was not made up of king oyster mushrooms. For pea-based imitation sausage
patties, both pea protein isolates and king oyster mushrooms weaken the
hardness of pea-based imitation sausage patties.

47
4.2.3.1.3 Further Discussion on Hardness
Recent research has favored soy or pea protein isolates and starches for
texture improvement according to the literature (Das and others 2008; Ahmad and
others 2010; Matos and others 2014). Shahiri Tabarestani and Mazaheri Tehrani
(2012) reported that higher hardness was attributed to firm texture of hydrated
flours and starch in low-fat burger, which corresponds to the result of 3% soy or
pea protein isolate without king oyster mushroom due to higher amount of potato
starch mixed in formulation. Chung and others (2010) showed that fish paste
added with king oyster mushroom paste had significant decrease on hardness,
which corresponds to some part of result of this study. Matos and others (2014)
also reported the muffins containing pea protein isolates were softer. Studies
have also shown how carrageenan can enhance the texture of meat and meatless
products (Barbut and Mittal 1992; Trius and Sebranek 1996; Xiong and others
1999; Hsu and Chung 2001; Ayadi and others 2009; Cierach and others 2009).
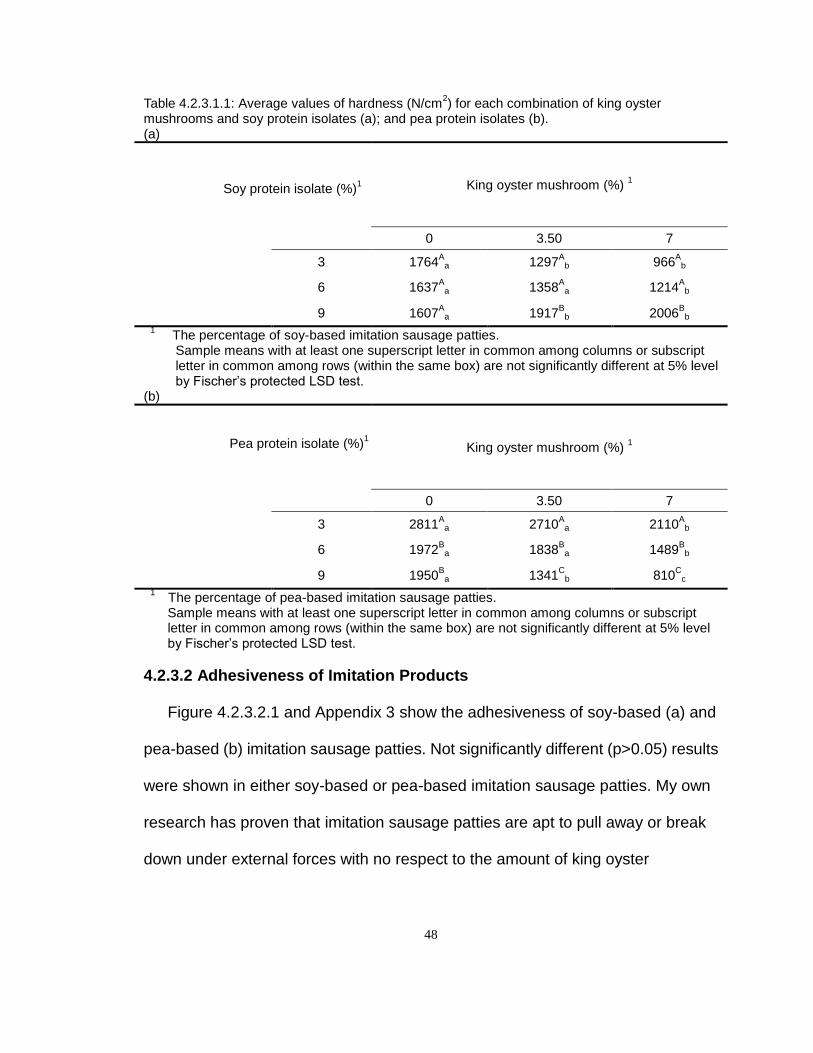
48
Table 4.2.3.1.1: Average values of hardness (N/cm2) for each combination of king oyster
mushrooms and soy protein isolates (a); and pea protein isolates (b). (a)
Soy protein isolate (%)1
King oyster mushroom (%) 1
0 3.50 7
3 1764A
a 1297A
b 966A
b
6 1637A
a 1358A
a 1214A
b
9 1607A
a 1917B
b 2006B
b 1
The percentage of soy-based imitation sausage patties. Sample means with at least one superscript letter in common among columns or subscript letter in common among rows (within the same box) are not significantly different at 5% level by Fischer’s protected LSD test.
(b)
Pea protein isolate (%)1
King oyster mushroom (%) 1
0 3.50 7
3 2811A
a 2710A
a 2110A
b
6 1972B
a 1838B
a 1489B
b
9 1950B
a 1341C
b 810C
c 1
The percentage of pea-based imitation sausage patties. Sample means with at least one superscript letter in common among columns or subscript letter in common among rows (within the same box) are not significantly different at 5% level by Fischer’s protected LSD test.
4.2.3.2 Adhesiveness of Imitation Products
Figure 4.2.3.2.1 and Appendix 3 show the adhesiveness of soy-based (a) and
pea-based (b) imitation sausage patties. Not significantly different (p>0.05) results
were shown in either soy-based or pea-based imitation sausage patties. My own
research has proven that imitation sausage patties are apt to pull away or break
down under external forces with no respect to the amount of king oyster

49
mushrooms and soy or pea protein isolates. This is a problem that has to be
overcome in future research.

50
(a)
(b)
Fig. 4.2.3.2.1: Average values of adhesiveness (Ns) for each combination of king oyster mushrooms and soy protein isolates (a); and pea protein isolates (b).

51
4.2.3.3 Springiness of Plant Protein-based Imitation Products
4.2.3.3.1 Springiness of Soy-based Imitation Products
According to Table 4.2.3.3.1 (a), soy-based imitation sausage patties were
significantly different (p<0.05) in springiness only between 3% and 6% soy protein
isolates mixed without king oyster mushrooms individually. The springiness
significantly increased (p<0.05) with a king oyster mushroom content of 3.5% and 7%
especially significant at the 7% king oyster mushroom rate, with an increased amount
of soy protein isolates.
As the king oyster mushroom amount increased, the 3% soy protein isolate
group showed a significant decrease in springiness (p<0.05); the 6% soy protein
isolate group’s springiness was significantly decrease (p<0.05) only between 0 and
3.5% king oyster mushroom were incorporated. The 9% soy protein isolate group had
significant improvement (p<0.05) in springiness between control (0% king oyster
mushrooms) and other mixtures (3.5% and 7% king oyster mushrooms showed good
results). When a mixture of 9% soy protein isolates added 7% addition king oyster
mushrooms, springiness of soy-based imitation sausage patties were at their best.
Past research (Trius and Sebranek 1996; Das and others 2008; Cierach and others
2009; Ahmad and others 2010; Chung and others 2010; Shahiri Tabarestani and
Mazaheri Tehrani 2012) had confirmed the texture improving ability of soy protein
isolates, king oyster mushrooms, starch and carrageenan.
4.2.3.3.2 Springiness of Pea-based Imitation Products
For pea-based imitation sausage patties (Table 4.2.3.3.1 (b)), a significantly
decreased (p<0.05) springiness was shown in all levels of variances. Proper

52
explanation would be that both pea protein isolates and king oyster mushrooms did
no helps on springiness of pea-based imitation sausage patties. The studies (Trius
and Sebranek 1996; Cierach and others 2009; Chung and others 2010; Shahiri
Tabarestani and Mazaheri Tehrani 2012) verified the texture altering and improving
ability of pea protein isolates, king oyster mushrooms, starch and carrageenan.
However, springiness was not affected by the pea protein isolates, which contradict
with the study from Matos and others (2014).
Table 4.2.3.3.1: Average values of springiness (cm) for each combination of king oyster mushrooms and soy protein isolates (a); and pea protein isolates (b). (a)
Soy protein isolate (%)1
King oyster mushroom (%)1
0 3.50 7
3 0.628A
a 0.503A
b 0.405A
c
6 0.541B
a 0.485A
b 0.531B
ab
9 0.592AB
a 0.752B
b 0.735C
b 1
The percentage of soy-based imitation sausage patties. Sample means with at least one superscript letter in common among columns or subscript letter
in common among rows (within the same box) are not significantly different at 5% level by Fischer’s protected LSD test.
(b)
Pea protein isolate (%)1
King oyster mushroom (%) 1
0 3.50 7
3 0.770A
a 0.737A
a 0.676A
b
6 0.657B
a 0.587B
b 0.531B
c
9 0.547C
a 0.460C
b 0.349C
c 1
The percentage of pea-based imitation sausage patties. Sample means with at least one superscript letter in common among columns or subscript letter
in common among rows (within the same box) are not significantly different at 5% level by Fischer’s protected LSD test.
53
4.2.3.4 Cohesiveness of Plant Protein-based Imitation products
4.2.3.4.1 Cohesiveness of Soy-based Imitation Products
Cohesiveness indicates the ability of samples to deform before finalization.
Statistical results pointed out the cohesiveness of three king oyster mushroom
groups increasing significantly (p<0.05) when soy protein isolates were added up to
9%, though the lowest value was reported with 6% soy protein isolates combined
without king oyster mushrooms.
Increased king oyster mushroom amounts showed a decreased (p<0.05) trend as
3% and 6% soy protein isolate mixed individually, but not at 9%. A mix of 9% soy
protein isolates and 7% king oyster mushrooms gave higher (p<0.05) values in
cohesiveness of soy-based meat free sausage (Fig. 4.2.3.4.1 (a); Appendix 4 (a)).
Previous research (Xiong and others 1999; Chin and others 2000; Gujral and
others 2002; Kassama and others 2003; Ayadi andf others 2009; Cierach and others
2009; Shahiri Tabarestani and Mazaheri Tehrani 2012) has verified texture
ameliorating ability of soy protein isolates, textured vegetable proteins and
carrageenan.

54
(a)
(b)
Fig. 4.2.3.4.1: Average values of cohesiveness for each combination of king oyster mushrooms and soy protein isolates (a); and pea protein isolates (b).

55
4.2.3.4.2 Cohesiveness of Pea-based Imitation Products
Pea-based imitation sausage patties, Fig. 4.2.3.4.1 (b) and Appendix 4 (b),
presented a significantly decreased (p<0.05) value of cohesiveness despite
increased amounts of king oyster mushrooms. Slightly different from results for
soy-based imitation sausage patties, both the pea protein isolates and king oyster
mushrooms weakened the cohesiveness of pea-based imitation sausage patties,
though carrageenan was present. Tabarestani and Tehrani (2012) shed light on
utilizing pea protein as an ingredient or main material for manufacturing their
end-products or serving an enhancement agents to low fat burger.
4.2.3.5 Gumminess of Plant-protein-based Imitation Products
Gumminess characterizes the force necessary to destroy a sample for swallowing.
Ability of binders to maintain the integrity and completeness of imitation sausage
patties after frying define gumminess. Components of tertiary structure, textured
vegetable proteins, vegetable-based protein isolates, hydrocolloids, potato starches
and fresh egg whites, could influence the textural, gel-forming ability when denatured.
Table 4.2.3.5.1 (a) and (b) show the gumminess of soy-based and pea-based
imitation sausage patties, respectively.
4.2.3.5.1 Gumminess of Soy-based Imitation Products
Increased amounts of soy protein isolate presented an upside curve trend of
gumminess both at 0% and 3.5% king oyster mushroom content. However, at 7%
king oyster mushroom content, gumminess showed an ascending straight line as
amounts of soy protein isolates were added. Although no significant difference was
noticeable (p>0.05) between 3% and 6% soy protein isolates combination.

56
On the other hand, gumminess decreased significantly (p<0.05) in 3% and 6%
soy protein isolates group when the 7% king oyster mushroom content was realized,
but this did not occur in the 9% soy protein isolates group. This exception shows an
increased trend of gumminess at increased king oyster mushroom levels, though not
significantly different (p>0.05) between the 3.5 and 7% king oyster mushrooms levels.
A combination of 9% soy protein isolates and 7% king oyster mushrooms showed the
highest (p<0.05) gumminess of all.
Potato starches, soy protein isolates and textured soy proteins can form a fine
strength structure when aided with binders and gums (Xiong and others 1999; Chin
and others 2000; Hsu and Chung 2001; Kumar and Sharma 2004; Das and others
2008; Ayadi and others 2009; Cierach and others 2009; Ahmad and others 2010;
Shahiri Tabarestani and Mazaheri Tehrani 2012), but the strengthen ratios begin
changing as different ratio of the soy protein isolates, king oyster mushrooms and
potato starch are subjected to experiments.

57
Table 4.2.3.5.1: Average values of gumminess (N/cm2) for each combination of king oyster
mushrooms and soy protein isolates (a); and pea protein isolates (b). (a)
Soy protein isolate (%)1
King oyster mushroom (%) 1
0 3.50 7
3 821.196A
a 479.737A
b 322.488A
b
6 622.787A
a 448.634A
ab 401.820A
b
9 673.445A
a 828.329B
a 1089.351B
b 1
The percentage of soy-based imitation sausage patties. Sample means with at least one superscript letter in common among columns or subscript letter in common among rows (within the same box) are not significantly different at 5% level by Fischer’s protected LSD test.
(b)
Pea protein isolate (%)1
King oyster mushroom (%) 1
0 3.50 7
3 1655.370A
a 1367.259A
b 938.586A
c
6 1021.879B
a 807.323B
b 574.920B
c
9 813.958C
a 478.644C
b 224.196C
c 1
The percentage of pea-based imitation sausage patties. Sample means with at least one superscript letter in common among columns or subscript letter in common among rows (within the same box) are not significantly different at 5% level by Fischer’s protected LSD test.
4.2.3.5.2 Gumminess of Pea-based Imitation Products
For pea-protein imitation sausage patties, Table 4.2.3.5.1 (b), gumminess
significantly decreased (p<0.05) with increase of both king oyster mushroom levels
and pea protein isolates. This supports the results from Tabarestani and Tehrani
(2012) and are similar to others studies (Trius and Sebranek 1996; Kumar and
Sharma 2004; Cierach and others 2009). In general, pea protein isolates lowered the

58
gumminess more obviously than soy protein isolates did since different interaction
degree of ingredients. King oyster mushrooms also lessened the gumminess clearly
in pea-based imitation sausage patties, more so than in soy-based products.
4.2.3.6 Chewiness of Plant Protein-based Imitation Products Chewiness (N/cm) is the work needed to chew the sample for swallowing. The
intent of this study was to improve the lack of the consistency in mouth-feel and to
provide the chewability of the soy-based (Table 4.2.3.6.1 (a)) and pea-based
(Table4.2.3.6.1 (b)) imitation sausage patties by adding king oyster mushrooms.
4.2.3.6.1 Chewiness of Soy-based Imitation Products
Increased soy protein isolate amounts did not have significantly different (p>0.05)
without king oyster mushrooms. However, chewiness significantly increased (p<0.05)
when 3.5% and 7% king oyster mushroom mixed with 9% soy protein isolate
individually.
Chewiness decreased (p<0.05) when 3% soy protein isolate was incorporated;
but did not differ significantly (p>0.05) when 6% soy protein isolate was added;
nevertheless, a significantly increased (p<0.05) occurred when 9% soy protein
isolate combined, with raised levels of king oyster mushrooms.
This result indicated that the chewiness had a significant correlation with the
combination of high level soy protein isolates (Das and others 2008; Akesowan 2010;
Tabarestani and Tehrani 2012), carrageenan (Cierach and others 2009) and high
amount king oyster mushrooms (Ogawa and others 2012).

59
Table 4.2.3.6.1: Average values of chewiness (N/cm) for each combination of king oyster mushrooms and soy protein isolates (a); and pea protein isolates (b). (a)
Soy protein isolate (%)1
King oyster mushroom (%) 1
0 3.50 7
3 521.855A
a 245.782A
b 131.794A
b
6 340.088A
a 219.762A
a 215.254A
a
9 402.357A
a 625.002B
b 833.164B
c 1
The percentage of soy-based imitation sausage patties. Sample means with at least one superscript letter in common among columns or subscript letter in common among rows (within the same box) are not significantly different at 5% level by Fischer’s protected LSD test.
(b)
Pea protein isolate (%)1
King oyster mushroom (%) 1
0 3.50 7
3 1279.149A
a 1014.613A
b 639.966A
c
6 677.162B
a 486.189B
b 306.346B
b
9 455.921C
a 223.144C
b 83.902C
b 1
The percentage of pea-based imitation sausage patties. Sample means with at least one superscript letter in common among columns or subscript letter in common among rows (within the same box) are not significantly different at 5% level by Fischer’s protected LSD test.
4.2.3.6.2 Chewiness of Pea-based Imitation Products
As pea-based imitation sausage patties (Table 4.2.3.6.1 (b)), showed a
significantly lower (p<0.05) trend with increased pea protein isolate levels. Significant
differences (p<0.05) were reported between control, no king oyster mushrooms were
mixed, and the addition of king oyster mushrooms within each pea protein isolate
group.

60
Showing the interactions of pea protein isolates (Tabarestani and Tehrani 2012;
Matos and others 2014), the addition of king oyster mushrooms, and other
ingredients include potato starch and carrageenan (Carballo and others 1995;
Cierach and others 2009) did little helps on the chewiness of pea-based imitation
sausage patties.
4.2.3.7 Resilience of Plant Protein-based Imitation Products
4.2.3.7.1 Resilience of Soy-based Imitation Products
The formulation without king oyster mushrooms showed an upside curve trend,
meaning high amounts of potato starches and low levels soy protein isolates formed
a relative higher resilience (p<0.05) as levels of soy protein isolates increased.
Though 3.5% and 7% king oyster mushroom groups also presented an upside curve
trend as the control groups, the highest (p<0.05) resilience appears in 9% soy protein
isolates.
Resilience decreased (p<0.05) significantly with increased amount of king oyster
mushrooms in the 3% and 6% soy protein isolate group; however, an increased trend
was reported in the 9% soy protein isolate group, which increased significant (p<0.05)
when results were combined with 7% king oyster mushrooms results. With a
combination of 9% soy protein isolates and 7% king oyster mushrooms, we were able
to render the highest resilience, indicating that both ingredients boosted the
resilience of soy-based imitation sausage patties ( Fig. 4.2.3.7.1 (a); Appendix 5 (a))
well.

61
(a)
(b)
Fig. 4.2.3.7.1: Average values of resilience for each combination of king oyster mushrooms and soy protein isolates (a); and pea protein isolates (b).

62
4.2.3.7.2 Resilience of Pea-based Imitation Products
Fig. 4.2.3.7.1 (b) and Appendix 5 (b) show the obvious results of pea-based
imitation sausage patties where resilience decreased significantly (p<0.05) with
increased pea protein isolates in three groups of king oyster mushrooms. Changing
the amounts of king oyster mushroom lowered the resilience significantly (p<0.05) in
three groups of pea protein isolates as well. It goes without saying that the pea
protein isolates and king oyster mushrooms did little to help on in adding resilience to
the imitation sausage patties.
4.2.4 Effect on Water Activity of Plant-protein-based Imitation Products
Intrinsic property, as it relates to water activity refers to the ratio of water vapor
pressure in equilibrium with a food to the saturation vapor pressure of water at the
same temperature. Water activity describes the degree to which water is bound in the
food, the energy status in food, and its availability to act as a solvent and participate
in chemical or biochemical reactions and growth of microorganisms (Labuza 1977).
Hence, it was widely used as an indicator of stability and food safety with respect to
microbial growth, rate of deterioration, and chemical or physical properties. Basically,
water has one water activity, for fresh meat, fruit, meat and their produce which have
0.96 to 0.99 water activity; bread has 0.96 water activity; flour has 0.72 water activity,
and intermediate moisture food has 0.65 to 0.85 water activity. High water activity is
usually related to high incidence of non-enzymatic browning, lipid oxidation, vitamin
degradation, enzymatic reactions, and protein denaturation. Texture also depends on
water activity.

63
(a)
(b)
Fig. 4.2.4.1 Average values of water activity for each combination of king oyster mushrooms and soy protein isolates (a); and pea protein isolates (b).

64
4.2.4.1 Water Activity of Soy- and Pea-based Imitation Products
According to the results from water activity measurement, neither soy-based (Fig.
4.2.4.1 (a); Appendix 6 (a)) nor pea-based (Fig. 4.2.4.1 (b); Appendix 6 (b)) imitation
sausage patties were differed significantly (p>0.05) dependently.
The 9%soy protein isolate group presented a significantly decreased (p<0.05) in
water activity, not shown in figures, but showed no significant differences (p>0.05)
within the three pea protein isolate groups. All three of the king oyster mushroom
groups did not pose significant differences (p>0.05) in both soy-based and
pea-based imitation sausage patties. Soy protein isolates probably played a slightly
influential role in the pH value of soy-based imitation sausage patties.
Generally, all data located around 0.930 to 0.975 water activity, indicate a
relatively low stability and lack of safety under improper storage and consumer abuse.
Therefore, water activity serves as a reference to the labeling instructions on the
package and storage temperature requirement in retail stores or in the home.
4.2.5 Effect on pH value of Plant Protein-based Imitation Products
4.2.5.1The pH value of Soy- and Pea-based Imitation Products
The pH value of soy-based (Fig. 4.2.5.1 (a); Appendix 7 (a)) and of pea-based
(Fig. 4.2.5.1(b); Appendix 7 (b)) imitation sausage patties did not present a significant
difference (p>0.05) in dependent interaction. Though, soy-based imitation sausage
patties had a lower average pH and had similar trends, as different levels of king
oyster mushrooms and soy or pea protein isolates mixed, to pea-based imitation
sausage patties.

65
On independent point of view, not shown in the figures relates to the fact that-
three groups of soy protein isolates or of pea protein isolates did not affect the pH
significantly (p>0.05), while of the king oyster mushrooms did influence the pH
significantly (p<0.05).
Addition of soy protein isolates did not increase the pH significantly compared to
control samples (Porcella and others 2001); on the other hand, adding king oyster
mushrooms did run down the pH value significantly (p<0.05). Though Ahmad and
others (2010) showed pH slightly affected by SPI in buffalo meat emulsion sausage.
Concerning the food safety point, both soy-based and pea-based imitation
sausage patties are subjected to microorganisms, such as mold, yeast and bacteria,
easily due to the pH value deterioration under proper temperature and consumer
abuse.

66
(a)
(b)
Fig. 4.2.5.1: Average values of pH value for each combination of king oyster mushrooms and soy protein isolates (a); and pea protein isolates (b).

67
4.2.6 Effect on Cooking Shrinkage of Plant Protein-based Imitation Products
Cooking treatment usually induces liquid and soluble materials loss in meat
products, known as the cooking loss. Heat-induced protein denaturation occurs when
heating products, causing less water to be entrapped within the structure. Serdaroglu
and Degirmencioglu (2004) reported that fat level affected the shrinkage of
hamburger and recommended decreasing fat levels. Figure 4.2.6.1 and Appendix 8
show the shrinkage percentage of soy-based (Fig. 4.2.6.1 (a); Appendix 8 (a)) and
pea-based (Fig.4.2.6.1 (b); Appendix 8 (b)) imitation sausage patties.
4.2.6.1 Cooking Shrinkage of Soy-based Imitation Products
No significant differences (p>0.05) were recorded for either both soy-based or
pea-based imitation sausage patties, indicating that the diameter did not reduce or
defect dramatically due to the addition of soy or pea protein isolates and king oyster
mushrooms.
Many researchers (Bater and others 1992; Kotula and Berry 1986; Carballo and
others 1995; Shewry and Tatham 2000; Gujral and others 2002; Candogan and
Kolsarici 2003; Kumar and Sharma 2004; Akesowan 2010; Tabarestani and Tehrani
2012) have reported anti-shrinkage ingredients, including textured soy or pea
proteins, soy or pea protein isolates, carrageenans, potato starches and egg whites,
which when applied in this research were able to prevent shrinkage.
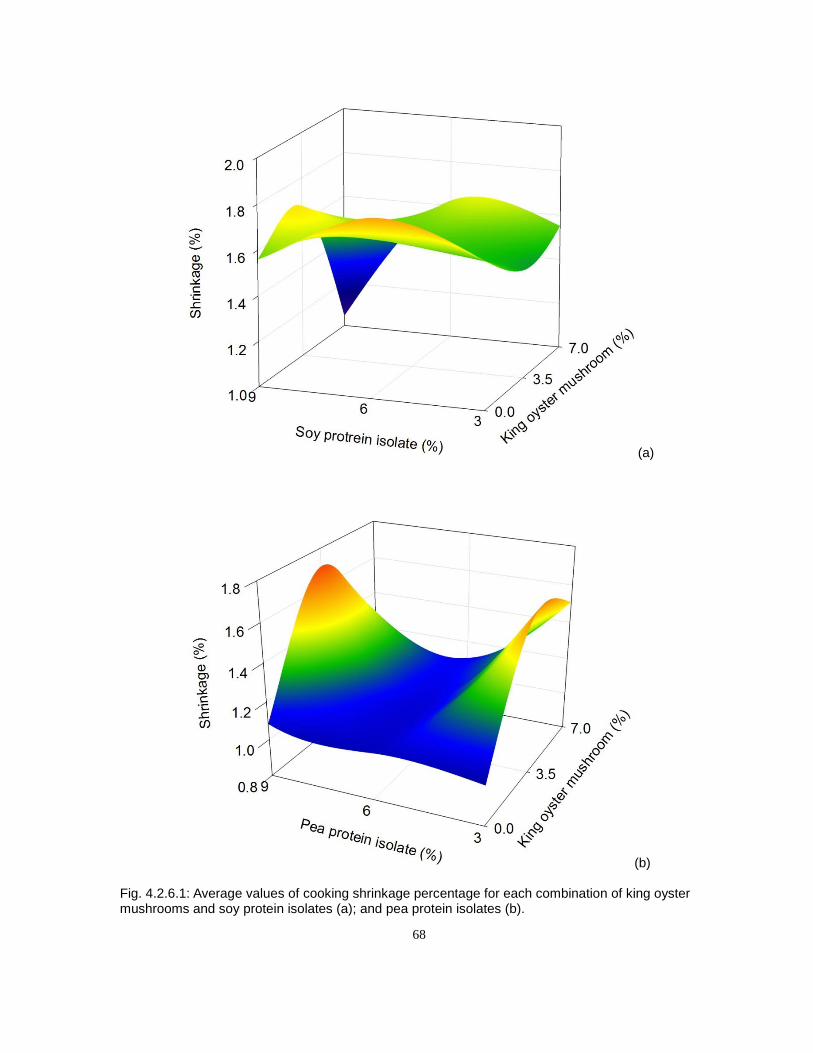
68
(a)
(b)
Fig. 4.2.6.1: Average values of cooking shrinkage percentage for each combination of king oyster mushrooms and soy protein isolates (a); and pea protein isolates (b).

69
4.2.7 Effect on Water Holding Capacity (WHC) of Plant-protein-based Imitation
Products
Protein is well-known for its ability to hold oil and water and form a stable
emulsion due to the lipophilic and hydrophilic groups in the same polymer chain.
Physical and chemical properties, such as size, shape, amino acid composition and
sequence, net charges, hydrophobicity to hydrophilicity ratio, structures, molecular
flexibility and the ability to interact with other components, govern protein functionality.
Hydrodynamic and surface-related properties render the functionality of protein. For
imitation sausage patties, protein hydration, solubility, emulsification and gelation are
the most important characteristics needed to qualify the stability and acceptance of
end products. However, owing to the product’s required heat procedure of product,
these characteristics can undergo functionality changes throughout the heating
processes. The three-dimensional structure of proteins can be altered by
denaturation, leading to changes of water holding capacity for plant proteins like soy,
pea and others (Egbert and Payne 2009; Brewer 2012). Textured vegetable protein
also contributes greatly toward water holding capacity because of their fibrous
structure and capacity to absorb liquid.
From the preliminary test, water holding capacity of textured soy protein and
textured pea protein was 2.72 and 0.68, respectively. Higher value is linked with
greater water holding capacity of the sample. Soy-based (Table 4.2.7.1 (a)) and
pea-based (Table 4.2.7.1 (b)) shows the water holding capacity (WHC) of imitation
sausage patties.

70
Table 4.2.7.1: Average values of water holding capacity for each combination of king oyster mushrooms and soy protein isolates (a); and pea protein isolates (b). (a)
Soy protein isolate (%)1
King oyster mushroom (%) 1
0 3.50 7
3 0.75A
a 0.49A
b 0.37A
c
6 0.64B
a 0.56B
b 0.27B
c
9 0.49C
a 0.34C
b 0.31AB
b 1
The percentage of soy-based imitation sausage patties. Sample means with at least one superscript letter in common among columns or subscript letter in common among rows (within the same box) are not significantly different at 5% level by Fischer’s protected LSD test.
(b)
Pea protein isolate (%)1
King oyster mushroom (%) 1
0 3.50 7
3 0.58A
a 0.48A
b 0.41A
b
6 0.52A
a 0.42A
b 0.36A
b
9 0.51A
a 0.35B
b 0.21B
c 1
The percentage of pea-based imitation sausage patties. Sample means with at least one superscript letter in common among columns or subscript letter in common among rows (within the same box) are not significantly different at 5% level by Fischer’s protected LSD test.
4.2.7.1 Water Holding Capacity (WHC) of Soy-based Imitation Products
From Table 4.2.7.1 (a), water holding capacity of 0% and 3.5% king oyster
mushroom group significantly decreased (p<0.05) as increased amounts of soy
protein isolates were added, indicating that the three dimensional structure weaken
when the amount of potato starch decreased. For the 7% king oyster mushroom

71
group, water holding capacity show a significant decrease (p<0.05) only between 3%
and 6% soy protein isolates mixed.
With increased amounts of king oyster mushrooms, all three groups of soy protein
isolate show significantly decreased (p<0.05) water holding capacity.
Good water holding capacity needs the efforts of high level potato starch
(Carballo and others 1995; Shewry and Tatham 2000) to strengthen the tertiary
structure; and soy protein isolates play a minor role in boosting water holding
capacity of soy-based imitation sausage patties. Pietrasik and Duda (2000) reported
lower fat content is usually accompanied by a significant reduction in WHC Das and
others (2008) reported nuggets with soy paste had significantly higher expressible
water content, indicating a lower WHC than that of the control groups and nuggets
with soy granules had higher water content due to the protein and water interaction. A
slightly different scenario was set up by other researchers (Kotula and Berry 1986;
Ahmad and others 2010; Tabarestani and Tehrani 2012), who applied soy proteins in
low- or reduced-fat meat products to improve WHC; meanwhile carrageenan utilized
to enhance water holding capacity successfully of fat reduction meat products
(Egbert and others 1991; Barbut and Mittal 1992; Bater and others 1992; Trius and
Sebranek 1996; Candogan and Kolsarici 2003; Kumar and Sharma 2004; Verbeken
and others 2005; Ayadi and others 2009).
4.2.7.2 Water Holding Capacity (WHC) of Pea-based Imitation Products
Table 4.2.7.1 (b) presents the water holding capacity of pea-based imitation
sausage. In contrast to the 0% king oyster mushrooms group of soy-based imitation
sausage patties, water holding capacity did not differ significantly (p>0.05) as pea

72
protein isolates were increased. This means the ratio of potato starches and pea
protein isolates did not pose great influence on the ability of vegetable structures to
retain water. For 3.5% and 7% king oyster mushrooms groups, water holding
capacity lowered significantly (p<0.05) as 9% pea protein isolates were incorporated.
This research also reported a significant decrease (p<0.05) between 0% king oyster
mushroom and additional king oyster mushroom combination in all three pea protein
isolate groups.
Water holding capacity due to high level potato starches (Carballo and others
1995; Pietrasik 1999; Shewry and Tatham 2000) strengthened the structure of
soy-based imitation sausage patties; however, the WHC was not noticeable when
altering the ratio of potato starches and pea protein isolates. Other researchers have
reported that pea proteins improve the WHC of low-fat products (Tabarestani and
Tehrani 2012; Osen and others 2014). Other research has confirmed that pea
proteins improve the water holding capacity of low-fat products. Research has also
shown how carrageenan enhances the ability of food mixtures to retain water (Egbert
and others 1991; Barbut and Mittal 1992; Bater and others 1992; Trius and Sebranek
1996; Candogan and Kolsarici 2003; Kumar and Sharma 2004; Verbeken and others
2005; Ayadi and others 2009). Though carrageenan used in this research did not
show as excellent WHC as in low-fat meat products.
4.2.7.3 Further Discussion on Water Holding Capacity (WHC)
From a broad point of view, structures were strengthened from rehydrated
textured soy or pea proteins, potato starch and carrageenan but they were slightly
weakened as soy or pea protein isolates and king oyster mushrooms added.

73
Although previous studies utilized soy or pea protein to enhance the ability of
materials to hold water in reduced- or low-fat meat products, additional soy or pea
protein isolates in this study did not improve the water holding capacity after cooking.
King oyster mushrooms could absorb the water and provide chewy mouth-feel of
imitation sausage patties; nevertheless, it somehow creates “holes” for water to be
forced out during heat treatment. All the data were above zero. Although not high, the
data showed that imitation sausage patties still had a fair ability to retain water
against heat-induced mass loss.

74
CHAPTER 5
CONCLUSIONS
5.1 Conclusions
Physicochemical properties can change when adding different levels of plant
protein isolates and king oyster mushrooms to imitation sausage patties; therefore,
cooking properties, color measurement, texture profile analysis, pH value, water
activity, shrinkage percentage and water holding capacity were considered to
evaluate the contributions of the variances. Cooking properties, cooking yield or
cooking loss did not differ significantly (p>0.05) in most of formulations as plant
protein isolates were increased; however, soy-based imitation sausage patties
presented significantly higher (p<0.05) average cooking yield than pea-based one.
King oyster mushrooms decreased the cooking properties of imitation sausage
patties as a result. Color index, L, a and b value, of imitation sausage patties were
influenced by the ingredients. Lightness and yellowness, L and b, increased as soy
protein isolates or pea protein isolates were added independently ;and did not
influenced the meatless sausage dramatically when king oyster mushrooms were
incorporated independently. Redness, a value, changed greatly as increased king
oyster mushroom amounts and highest levels of soy protein isolates or pea protein
isolates were added together. Highest hardness occurred in the highest percentage
of soy protein isolates and king oyster mushrooms formulation and in the lowest
percentage of pea protein isolates and king oyster mushrooms formulation.
Specifically, soy protein isolates interaction with king oyster mushrooms somehow

75
increased (p<0.05) the hardness, while pea protein isolates and king oyster
mushrooms alone decreased (p<0.05) the hardness. Adhesiveness had no
significant (p>0.05) influence on imitation sausage patties. Greatest springiness
appeared when highest soy protein isolates amounts and fair-to-highest king oyster
mushrooms levels interacted together, and when lowest levels of pea protein isolate
and lowest amounts of king oyster mushrooms interacted together. Cohesiveness
reached highest value as highest soy protein isolates amounts and fair to highest
king oyster mushrooms levels interacted together, and as lowest levels of pea protein
isolates and lowest amounts of king oyster mushrooms interacted together.
Gumminess, chewiness and resilience showed highest value as the highest levels of
soy protein isolates and medium to highest amounts of king oyster mushroom
combinations worked together; and as lowest levels of pea protein isolates and
lowest levels of king oyster mushrooms interacted together. Water activity did not
differ significantly (p>0.05) dependently. Nevertheless, from an independent point of
view, the highest amounts of soy protein isolates had lower (p<0.05) than average
water activity; pea protein isolates and king oyster mushrooms had no relationship
with the values. The pH values did not differ significantly (p>0.05) dependently.
Cooking shrinkage did not differ significantly in all soy- and pea-based formulations.
Increased levels of king oyster mushrooms led to a declined trend of water holding
capacity. Increased soy protein isolates or pea protein isolates rendered lower water
holding capacity of imitation sausage patties due to less potato starches to build a
compacted structure.

76
5.2 Further Research
Future development could conduct a microbiological, organoleptic and nutritional
analysis to further understand the storage stability and market acceptance of
imitation sausage patties. Further research should use other legume or plant sources
as ingredients to enhance the textural properties and water holding capacity, which
are promising alternative approaches to open up a wider range of gluten-free,
soy-free and GM-free vegetarian products to meet the various consumer demands.
Other further study could use different cooking treatments such as steam cooking,
deep frying, baking or grilling to optimize best mouth-feel and physicochemical
properties of imitation sausage patties.

77
References
AACC (American Association of Cereal Chemists). 2000. Approved methods of The American Association of Cereal Chemists. 10th ed. Methods 56-30.01.
AACC International, St. Paul, MN, USA.
Agboola SO, Mofolasayo OA, Watts BM, Aluko RE. 2010. Functional properties of yellow field pea (Pisum sativum L.) seed flours and the in vitro bioactive properties of their polyphenols. Food Res Int 43(2): 582-588.
Ahmad S, Rizawi JA, Srivastava PK. 2010. Effect of soy protein isolate incorporation on quality characteristics and shelf-life of buffalo meat emulsion sausage. J Food Sci Tech. 47(3): 290-294.
Ahmed ME, Anjaneyulu ASR,Sathu T, Thomas R, Kondaiah N. 2007. Effect of different binders on the quality of enrobed buffalo meat cutlets and theirs shelf life at refrigeration storage (4±1oC). Meat Sci 75: 451- 459.
Ahn H, Hsieh F, Clark AD, Huff HE. 1999. Extrusion for producing low-fat pork and its use in sausage as affected by soy protein isolate. J Food Sci 64:267-271.
Aida FMNA,Shuhaimi M, Yazid M, Maaruf AG. 2009. Mushroom as a potential source of prebiotics: a review. Trend Food Sci Tech 20:567-575.
Akesowan A. 2002. Reduced fat, added konjac gel pork sausages as affected by chopping times. J Int Soc Southeast Asian Agr Sci 7:17-30.
Akesowan A. 2010. Quality characteristics of light pork burgers fortified with soy protein isolate. J Food Sci Biotechnol 19(5): 1143-1149.
Alam N, Yoon KN, Lee KR, Lee JS, Lee TS. 2011. Phenolic compounds concentration and appraisal of antioxidant and antityrosinase activities from the fruiting bodies of Pleurotus eryngii. Adv Environ Biol 5(6): 1104-1113.
Alamanou S, Bloukas JG,Paneras ED, Doxastakis G.1996. Influence of protein isolate from Lupin seed (Lupinus albus ssp. Graecus) on processing and quality characteristics of frankfurters. Meat Sci 42:79-93.

78
Ali FS, Perry AK, Van Duyne FO. 1982. Soybeans vs. textured soy proteins as meat extenders. Cooking losses, palatability, and thiamin content of freshly cooked and frozen meat loaves. J Am Diet Assoc 81(4): 439-444.
Aluko RE, Mofolasayo OA, Watts BM. 2009. Emulsifying and foaming properties of commercial yellow pea (Pisum sativum L.) seed
flours. J Agr Food Chem 57:9793‐9800.
Anderson ET, Beny BW. 2000. Sensory, shear and cooking properties of low-fat beef patties made with inner pea fiber. J Food Sci 655:805.
Asgar MA, Fazilah A, Huda N, Bhat R, Karim AA. 2010. Nonmeat protein alternatives as meat extenders and meat analogs. Comprhensive review in food science and food safety 9(5): 513-529.
Ayadi M A., Kechaou A, Makni I, Attia H. 2009. Influence of carrageenan addition on turkey meat sausages properties. J Food Eng 93: 278-283.
Barbut S, Mittal GS 1992. Use of carrageenans and xanthan gum in reduced fat breakfast sausages. Food Sci Tech 25(6): 509-513.
Barnard ND, Nicholson A, Howard JL. 1995.The medical costs attributable to meat consumption. Prev Med 24, 646.
Barrett JR. 2006. The science of soy: what do we really know?. Environ Health Perspect. 114(6):A352-A358.
Bater B, Descamps O, Maurer A.J 1992. Quality characteristics of hydrocolloid-added oven-roasted turkey breasts. J Food Sci 57(5):1068-1070.
Bookwalter GN. 1978. Soy protein utilization in food systems. Adv Exp Med Biol 105:749-766.

79
Bootwalla S. 2009. Apparent metabolizable energy and amino acid variation in soybean meal and its implication on feed formulation. American Soybean Association Technical Bulletin AN38 Bootwalla pdf. Available at: http://www.asaimsea.com/index.php?language=en&screenname=_docs_Technical Bulletins|AnimalNutrition.
Bourne MC. 1978. Texture profile analysis. Food Tech 32: 62–66.
Brewer MS, McKeith FK, Britt K. 1992. Fat, soy and carrageenan effects on sensory and physical characteristics of ground beef patties. J Food Sci 57: 1051-1055.
Brewer MS. 2012. Reducing the fat content in ground beef without sacrificing quality: a review. Meat Sci 91: 385-395.
Brooks C.2004. Consequences of increased global meat consumption on the global environment -- trade in virtual water, energy & nutrients. Available from: https://woods.stanford.edu/environmental-venture-projects/consequences-increased-global-meat-consumption-global-environment
Campagnol PCB, Santos BAD, Wagner R, Terra NN, Pollonio MAP.2012. The effect of soy fiber addition on the quality of fermented sausage at low-fat content. J Food Qual 36(1):41-50.
Campbell MF. 1981. Processing and product characteristics for textured soy flours, concentrates and isolates. J Am Oil Chem Soc 58(3): 336-338.
Candogan K, Kolsarici N. 2003. The effects of carrageenan and pectin on some quality characteristics of low-fat beef frankfurters. Meat Sci 64(2):199-206.
Carballo J, Frrnandez P, Barreto G, Solas MT, Colmenero JF. 1996. Morphology and texture of bologna sausage as related to content of fat, starch and egg white. J Food Sci 61:652-655.
Carballo J, Baretto G, Colmenero FJ. 1995. Starch and egg white influence on properties of bologna sausage as related to fat content. J Food Sci 604:673-677.
80
Cavestany M, Jimenez C F, Solas M, Carballo J. 1994.Incorporation of sardine surimi to bologna sausage containing different fat level. Meat Sci 38:27–37.
Cengiz E, Gokoglu N. 2005. Changes in energy and cholesterol contents of frankfurter-type sausages with fat reduction and fat replacer addition. Food Chem 91(3): 443-447.
Cha MH, Heo JY, Lee C, Lo Y M , Moon B. 2012. Quality and sensory characterization of white jelly mushroom (Tremella fuciformis) as a meat substitute in pork patty formulation. J. Food Process Preserv PRES 2012. Wiley Periodicals, Inc. Publishing.
Chang ST, Miles PG. 2004. Mushroom: cultivation, nutritional value, medicinal effect, and environment impact. Second edition. CRC Press, Boca Raton, FL,USA.
Chen L, Opara UL. 2013. Texture measurement approaches in fresh and processed foods- A review. Food Res Int 51:823-835.
Chen J, Yong Y, Xing M, Gu Y, Zhang Z, Zhang S, Lu L.2013. Characterization of polysaccharides with marked inhibitory effect on lipid accumulation in Pleurotus eryngii. Carbohydr Polym 97(2):604-613.
Chin KB, Keeton JT, Miller RK, Longnecker MT, Lamkey JW. 2000. Evaluation of konjac blends and soy protein isolate as fat replacements in low-fat bologna. J Food Sci 65(5): 756-763.
Choi HK, Atkinson K, Karlson EW, Williett W, Curhan G. 2004. Purine-rich foods, dairy and protein intake, and the risk of gout in men. New Engl J Med 350: 1093-1103.
Choi HK 2010. A prescription for lifestyle change in patients with hyperuricemia and gout. Curr Opin Rheumatol 22: 165-172.
Chuang SY, Lee SC, Hsieh YT, Pan WH.2011. Trends in hyperuricemia and gout prevalence: Nutrition and Health Survey in Taiwan from 1993-1996 to 2005-2008. Asia Pac J Clin Nutr 29 (2): 301-308.

81
Chung SI, Kim SY, Nam YJ, Kang MY. 2010. Development of surimi gel from king oyster mushroom and cuttlefish meat paste. J Food Sci Biotechnol 19(1): 51-56.
Cierach M, Modzelewska-Kapituła M, Szaciło K. 2009. The influence of carrageenan on the properties of low-fat frankfurters. Meat Sci 82(3):295-299
Claus JR, Hunt MC. 1991. Low-fat, high added-water bologna formulated with texture-modifying ingredients. J Food Sci 56:643–652.
Cofrades S, Guerra MA, Carballo J, Fernández-Martín F, Jiménez Colmenero F. 2000. Plasma protein and soy fiber content effect on bologna sausage properties as influenced by fat level. J Food Sci 65(2): 281-287.
Commonwealth Scientific and Industrial Research Organization. 2012. Mushrooms and Health CSIRO report-Executive Summary. Available from: http://www.mushroomsandhealth.com/mushrooms-health-report/executive-summary/
Coöperatie Koninklijke Cebeco Groep U.A. 2000. Semifinished product for the preparation of meat substitute. European patent 1205114A1.
Dawkins NL, Gager J, Cornillon JP, Kim Y, Howard H, Phelps O. 2001. Comparative studies on the physicochemical properties and hydration behavior of oat gum and oat trim in meat-based patties. J Food Sci 66: 1276–1282.
Dagbjartsson B, Solberg M. 1972. A simple method to determine the water -holding capacity of muscle foods. J Food Sci 37(2): 499-500.
Deshmukh AS. 2013. Exploration of treasure of wild edible mushroom in the last decade. Asian J Microbiol Biotechnol Environ Sci15 (3): 539-545.
de Haan C., Steinfeld H., Blackburn H. 1997. Livestock and the environment: finding a balance. Food and Agriculture Organization of the United Nations, World Bank, and U.S. Agency for International Development.

82
Danny A, Aisbitt B, Lumn J. 2009. Review: mycoprotein and health. British Nutrition Foundation Nutr Bull 33:298-310.
Das AK, Anjaneyulu ASR, Gadekar YP, Singh RP, Pragati H. 2008. Effect of full-fat soy paste and textured soy granules on quality and shelf-life of goat meat nuggets in frozen storage. Meat Sci 80(3):607-614.
Deliza R, Saldivar SOS, Germani R, Benassi VT, Cabral LC. 2002. The effects of colored textured soybean protein (TSP) on sensory and physical attributes of ground beef patties. J Sensory Stud 17(2):121-132.
Dikeman CL, Bauer LL, Flickinger EA, Fahey GC Jr. 2005. Effects of stage of maturity and cooking on the chemical composition of select mushroom varieties. J Agr Food Chem 53:1130-1138.
Drewnowski A. 1987. Human food preferences: fats and food texture. In: Moskowitz, editor. CRC Press. p.269.
Duyff R. 2006. American Dietetic Association’s Complete Food and Nutrition Guide. Third Addition. Wiley & Sons. NJ.
DuPont Nutrition & Health.2011. Soy is on top as a high-quality plant protein. Available from: http://www.dupont.com/products-and-services/food-ingredients/soy-protein/press-releases/soy-quality-protein.html
Edmondson JE, Graham DM. 1975. Animal protein- substitutes and extenders. J Anim Sci 41:698-702.
Egbert WR, Huffman DL, Chen CM, Dylewski DP. 1991. Development of low-fat ground beef. Food Tech 45: 64-67.
Egbert R, Borders C. 2006. Achieving success with meat analogs. Food Tech 60(1): 28-34. Also available from: http://www.ift.org/food-technology/past-issues/2006/january.aspx Institute of Food Technologists (IFT).

83
Emel C, Nalan G. 2005. Changes in energy and cholesterol contents of frankfurter-type sausages with fat reduction and fat replacer addition. Food Chem 91:443-447.
FAO. 2006. Livestock’s long shadow – environmental issues and options. Steinfeld H, Gerber P, Wassenaar T, Castel V, Rosales M, de Haan C. Food and Agriculture Organization of the United Nations.
FAO. 2006. Livestock impacts on the environment. Food and Agriculture Organization of the United Nations. Available from: http://www.fao.org/ag/magazine/0612sp1.htm
FAO. 2002. The State of World Fisheries and Aquaculture 2002, Rome: FAO, 2002, Part 1, p. 23. Food and Agriculture Organization of the United Nations.
FARE. 2013. Wheat allergy. About the food allergies. Food Allergy Research & Education, McLean, VA. Available from: https://www.foodallergy.org/allergens/wheat-allergy
Fátima Henriques Lourenço L, Santos Galvão GC, Conceição Amaral Ribeiro S, Fátima Amaral Ribeiro C, Park KJ. 2012. Fat substitutes in processing of sausages using piramutaba waste. J. Food Sci. Tech. Springer-Verlag Publishing.
FDA: Food and Drug Administration.2013. Health claims: Soy protein and risk of coronary heart disease (CHD). FDA Code of Federal Regulations 21(2): PART 101E Sec 82.
FDA: Food and Drug Administration.2001. GRAS notification for mycoprotein. GRAS Notice No. GRN 000091. Available from: http://www.accessdata.fda.gov/scripts/fcn/gras_notices/grn000091.pdf
FDA: Food and Drug Administration. 1993. Health claims: fruits, vegetables, and grain products that contain fiber, particularly soluble fiber, and risk of coronary heart disease. FDA Code of Federal Regulations 21(2): PART 101E SEC 77.

84
FDA: Food and Drug Administration.1973. Database of Select Committee on GRAS Substances (SCOGS) Reviews - Carrageenan. FDA Code of Federal Regulations 172.620.
Feng J, Xiong YL. 2002. Interaction of myofibrillar and preheated soy proteins. J Food Sci 67: 2851–2856.
Foley JJ, Rosentrater KA, Lamsal Bb, Poovaiah N. 2013. Processing approaches to improve functionality and value of soybean products. American Society of Agricultural and Biological Engineers (ASABE) Annual International Meeting Kansas City, MO; United States, 21-24 July 2013. American Society of Agricultural and Biological Engineers.
FOOD-INFO.2013. Maillard reactions. Available from: http://www.food-info.net/uk/colour/maillard.htm
Friedman M, Brandon DL. 2001. Nutritional and health benefits of soy proteins. J Agr Food Chem 49(3):1069-86.
Fukushima D. 1981. Soy proteins for foods centering around soy sauce and tofu. J Am. Oil Chem Soc 58: 346-354.
Fukushima D. 1994. Recent progress on biotechnology of soybean proteins and soybean protein food products. Food Biotechol 8:83-135.
Fukushima D. 2004. Soyprotein. In: Yada RY (editor). Proteins in food processing. England: Woodhead Publishing Limited. p 123-145.
Garcia CER, Yamashita F, Youssef EY, Prudencio SH, Shimokomaki M. 2013. Effect of carrageenan addition on the yield and functional properties of charqui (Jerked Beef). Braz arch biol technol 56 (2): 311. Available from: http://www.scielo.br/scielo.php?pid=S1516-89132013000200017&script=sci_arttext

85
Gallagher C, Schugt B. 2012. The animal protein myth. In: Gallagher C, Schugt B, editors. Veggie Power Burgers. eBook. Available from: http://books.google.com.tw/books?id=DZBbGkpBNSUC&pg=PT12&lpg=PT12&dq=10+Years+Younger+in+30+Days.+plant+proteins+are+easily+converted+to+amino+acids&source=bl&ots=vykYeS2v0U&sig=GdHRPlIKRENx8Aq9rrV74haqu7k&hl=zh-TW&sa=X&ei=giUiU-_8IsfK2AXlioA4&ved=0CCsQ6AEwAA#v=onepage&q=10%20Years%20Younger%20in%2030%20Days.%20plant%20proteins%20are%20easily%20converted%20to%20amino%20acids&f=false
Guha N, Kwan ML, Quesenberry CP Jr, Weltzien EK, Castillo AL, Caan BJ. Soy isoflavones and risk of cancer recurrence in a cohort of breast cancer survivors: the life after cancer epidemiology study. Breast Cancer Research and Treatment: 118(2):395-405.
Gujral HS, Kaur A, Singh N, Sodhi NS. 2002. Effect of liquid whole egg, fat and textured soy protein on the textural and cooking properties of raw and baked patties from goat meat. J Food Eng 63(4):377-385.
Guy R. 2001. Extrusion Cooking: Technology and Applications. Guy Robin ed. CRC Press, Cambridge, England.
Hamdy MM.1974. Nutritional aspects in textured soy proteins. J Am Oil Chem Soc 51(1): 85A-90A.
Hargarten PG,Joehnke J, Cacallini V. 2004. Vegetable protein meat analogue. European paten1493337A2.
Harsh NSK, Joshi K. 2008. Mushrooms: the vegetable of the future. India, Science and Technology: S & T for Rural India and Inclusive growth.
Havlik J, Plachy V, Fernandez J, Rada V. 2010. Dietary purines in vegetarian meat analogues. J Sci Food Agr 90(14):2352-2357.
He FJ, Chen JQ. 2013. Consumption of soybean, soy foods, soy isoflavones and breast cancer incidence: Differences between Chinese women and women in Western countries and possible mechanisms. Food Sci Hum Wellness 2(4): 146–161.

86
Heywood AA, Myers DJ, Bailey TB, Johnson LA. 2002. Effect of value-enhanced texturized soy protein on the sensory and cooking properties of beef patties. J Am Oil Chem Soc 79(7): 703-707.
Hollingsworth P. 2002. Veggie burgers swerve into the mainstream. Food Tech 56(1): 18.
Hong KJ, Lee CH, Kim SW. 2004. Aspergillus oryzae GB-107 fermentation improves nutritional quality of food soybeans and feed soybean meals. J Med Food 7(4): 430-435.
Hong GP, Park SH, Kim JY, Min SG. 2006. The effects of high pressure and various binders on the physico-chemical properties of restructured pork meat. Asian-Australasian J animal Sci 19(10):1484-1489.
Hsu SY, Chung H. 2001.Effects of k-carrageenan, salt, phosphates and fat on qualities of low fat emulsified meatballs. J Food Eng 47(2):115-121.
Imeson AP. 2000.Carrageenan. In: Phillips GO, Williams PA(Eds.), Handbook of Hydrocolloids. Woodhead Publishing Ltd., Cambridge, pp. 88-102.
Jiao JA, Yee BC, Kobrehel K, Buchanan BB. 1992. Effect of thioredoxin-linked reduction on the activity and stability of the Kunitz and Bowman-Birk soybean trypsin inhibitor proteins. J Agr Food Chem 40(12):2333-2336.
Jiménez-Colmenero F, Cofrades S, Herrero AM, Fernández-Martín F, Rodríguez-Salas L, Ruiz-Capillas C. 2012.Konjac gel for fat analogue for use in meat products: Comparison with pork fats. Food hydrocoll 26:63-72.
Jiménez-Colmenero F, Triki M, Herrero AM, Rodríguez-Salas L, Ruiz-Capillas C. 2013. Healthy oil combination stabilized in a konjac matrix as pork fat replacement in low-fat, PUFA-enriched, dry fermented sausages. LWT-Food Sci Technol 51:158-163.
Kadane VV, 1979 .Vegetable proteins in cooked and/or fermented sausages. J Am Oil Chem Soc 56, 3:330-333.

87
Kang MY, Rico CW, Lee SC. 2012. In vitro antioxidative and antimutagenic activities of oak mushroom (Lentinus edodes) and king oyster mushroom (Pleurotus eryngii) byproducts. J Food Sci Biotechnol 21(1): 167-173.
Kasabian D, Kasabian A. 2005. The Fifth Taste: Cooking with Umami. New York: Universe Publishing.
Kassama LS, Ngadi MO, Raghavan GSV.2003. Structural and instrumental textural properties of meat patties containing soy protein. Int J Food Prop 6(3):519-529.
Kassem MAG, Emara MMT. 2010. Quality and acceptability of value-added beef burger. World J. Dairy Food Sci 5(1): 14-20.
Katayama M, Wilson LA. 2008. Utilization of soybeans and their components through the development of textured soy protein foods. J Food Sci 73:158-164.
Kerr WL, Wang X, Choi SG. 2005. Physical and sensory characteristics of low-fat Italian sausage prepared with hydrated oat. J Food Qual 28:62-77.
Key TJ, Davey GK, Appleby PN. 1999. Health benefits of a vegetarian diet. Proc Nutr Soc 58(2):271-275.
Kiers JL,Van Laeken AE, Rombouts FM, Nout MJ. 2000. In vitro digestibility of bacillus fermented soya bean. Int J Food Microbiol 60(2-3): 163-169.
Kilic B, Kankaya T, Ekici YK, Orhan H. 2010. Effect of textured soy protein on quality characteristics of low fat cooked kofte (Turkish Meatball). J Anim Vet Adv 9(24):3048-3054.
Kim K, Choi B, Lee I, Lee H, Kwon S, Oh K, Kim AY. 2011. Bioproduction of mushroom mycelium of Agaricus bisporus by commercial submerged fermentation for the production of meat analogue. J Sci Food Agr 91(9):1561-1568.

88
Kotula AW, Berry BW. 1986. Addition of soy proteins to meat products (Chapter 7). Comstock MJ, Series Editor .Plant proteins: Applications, biological effects, and chemistry. American Chemical Society symposium (ACS) 312:74-89.
Krauss RM, Eckel RH, Howard B, Appel LJ, Daniels SR, Deckelbaum RJ, Erdman JW, Erdman JW Jr, Kris-Etherton P, Goldberg IJ, Kotchen TA, Lichtenstein AH, Mitch WE, Mullis R, Robinson K, Wylie-Rosett J, St. Jeor S, Suttie J, Tribble DL, Bazzarre TL. 2000. AHA dietary guidelines: revision 2000: a statement for healthcare professionals from the Nutrition Committee of the American Heart Association. Stroke 31: 2751-2766.
Kumar M, Sharma BD. 2004. The storage stability and textural, physico-chemical and sensory quality of low-fat ground pork patties with carrageenan as fat replacer. Int J Food Sci and Tech 39: 31-42.
Labuza TP. 1977. The properties of water in relationship to water binding in foods: a review. J. Food Process Preserv 1:167-190.
Lee HC, Chin KB. 2009. Physicochemical, textural, and sensory properties of low-fat/reduced-salt sausages as affected by salt levels and different type and level of milk proteins. J Food Sci Biotechnol 18(1): 36-42.
Li H, Prairie N, Udenigwe CC, Adebiyi AP, Tappia PS, Aukema HM, Jones PJH, Aluko RE. 2011. Blood pressure lowering effect of a pea protein hydrolysate in hypertensive rats and humans. J. Agr Food Chem 59 (18):9854–9860.
Liang CH, Ho KJ, Huang LY, Tsai CH, Lin SY, Mau JL. 2013. Antioxidant properties of fruiting bodies, mycelia, and fermented products of the culinary-medicinal king oyster mushroom, Pleurotus eryngii (higher Basidiomycetes), with high ergothioneine content. Int J Med Mushrooms 15(3):267-275.
Lin KW, Huang HY. 2003. Konjac/gellan gum mixed gels improve the quality of reduced-fat frankfurters. Meat Sci 65:749-755.
Lin JT, Liu CW, Chen YC, Hu CC, Juang LD, Shiesh CC, Yang DJ. 2014. Chemical composition, antioxidant and anti-inflammatory properties for ethanolic extracts from Pleurotus eryngii fruiting bodies harvested at different time. LWT-Food Sci Tech 55(1): 374-382.

89
Liu K. 2000. Expanding soybean food utilization. Food Tech 54(7): 46-58.
Lyu LC, Hsu CY, Yeh CY, Lee MS, Huang SH, Chen CL. 2003. A case-control study of the association of diet and obesity with gout in Taiwan. Am J Clin Nutr 78: 690-701.
Lucler G, Allshouse J, Lin BH. 2003. Factors affecting U.S. mushroom consumption. United States Department of Agriculture, Economic Research Service (ERS). Outlook Report No. VGS 295-01.
Mayer EW. 1966. Proc Int. Conf. on Soybean Protein Foods, Peoria, IL., ARS-71-35, p. 142-154. U.S. Department of Agriculture, Wahsington,D.C, October.
Mallavadhani UV, Sudhakar AVS, Satyanarayana K, Mahapatra A, Li M, Vanbreemen RB. 2006. Chemical analytical screening of some edible mushrooms. Food Chem 95(1): 58-64.
Marlow Foods. 2008. What is mycoprotein. Marlow food Ltd. Stokesley, North Yorkshire, UK. Available from: http://www.mycoprotein.org/assets/ALFT_V2_2.pdf
Marlow Foods. 2009. Nutritional profile of Quorn™ mycoprotein. Marlow food Ltd. Stokesley, North Yorkshire, UK. Available from: http://www.mycoprotein.org/assets/Nutritional_profile_of_Quorn.pdf
Matoba T, Hidaka H, Narita H, Kitamura K, Kaizuma N, Kito M. 1985. Lipoxygenase-2 isozyme is responsible for generation of hexanal in soybean homogenate. J Agr Food Chem 33: 852–855.
Matos ME, Sanz T, Rosell CM. 2014. Establishing the function of proteins on the rheological and quality properties of rice based gluten free muffins. Food Hydrocoll 35:150-158.
Mau JL, Lin YP, Chen PT, Wu YH, Peng JT.1998. Flavor compounds in king oyster mushrooms Pleurotus eryngii. J Agr Food Chem 46(11): 4587-4591.

90
Mead P, Slutsker L, Dietz A, McCaig L, Bresee J, Shapiro C, Griffin P, Tauxe R. 1999. Food-related illness and death in the United States. Emerging Infectious Diseases 5, 607.
Mittal GS, Barbut S. 1993. Effects of various cellulose gums on the quality parameters of low-fat breakfast sausage. Meat Sci 35:93–103.
Modi VK, Mahendrakar NS, Narasimha Rao D, Sachindra NM. 2003. Quality of buffalo meat burger containing legume flours as binders. Meat Sci 66: 143-149.
Modi VK, Yashoda KP, Mahendrakar NS. 2009. Low-fat mutton kofta prepared by using carrageenan as fat replacer: Quality changes in cooked product during storage. J Food Sci Tech 46 (4): 316-319.
Mohammadi M, Oghabi F. 2012. Development of low-fat and low-calorie beef sausage using modified starch as fat replacement agent. J Sci Food Agric 92(6): 1291-1296.
Mushroom Council. Nutrition benefits. Available from: http://www.mushroominfo.com/benefits/
Naeve SL, Orf JH, Wwidenbenner NH. 2013. United States Soybean Quality Annual Report: 2013. United States Soybean Export Council’s Soy Outlook Conferences.
Nantapatavee P, Jangchud A, Jangchud K, Lin J, Harnsilawat T. 2011. Effect of the physical properties on consumer preference of nuggets. Thai J Agr Sci 44(5):519-525.
Natural food benefits. Grains-split peas. Available from : http://www.naturalfoodbenefits.com/display.asp?CAT=6&ID=107
New Harvest. 2013. What’s meat alternatives? Available from: http://www.new-harvest.org/meat-substitutes/

91
Nowak-Wegrzyn A, Sampson HA, Wood RA, Sicherer SH.2003. Food protein-induced enterocolitis syndrome caused by solid food proteins. Pediatr 111(4): 829-835.
NSRL. 2014. Edanane and Garden soy. In: Bernard R, author. University of Illinois .National Soybean Research Laboratory. Available from: http://www.nsrl.illinois.edu/general/multimedia/Edamame%20and%20Gardensoy.pdf
Nussinow J. 1996. Seitan - The vegetarian wheat meat. The Vegetarian Resource Group, Baltimore, MD. Available from: http://www.vrg.org/recipes/vjseitan.htm
NUTRALYS® . 2008. Pea protein-the good-for-you protein. ROQUETTE FRERES. Available from: http://www.am-fe.ift.org/pdfs/innovation/PeaCrispNutrition.pdf
Oberbeil K. 1999. 10 Years Younger in 30 Days. Klaus Oberbeil Publishing.
Ogawa Y, Miyazawa A, Yamamoto N, Suzuki A. 2012. Compression properties of the fruit body of king oyster mushroom Pleurotus eryngii. Int J Food Sci Tech 47(12): 2487-2492.
Orcutt MW, McMindes MK, Chu H, Mueller IN, Bater B, Orcutt AL. 2006. Textured soy protein utilization in meat and meat analog products. In: Riaz MN (editor). Soy applications in food. New York: CRC Press. P 155-184.
Osen R, Toelstede S, Wild F, Eisner P, Schweiggert-Weisz U 2014. High moisture extrusion cooking of pea protein isolates: Raw material characteristics, extruder responses, and texture properties. J Food Eng 127:67-74.
Park HS, Hurburgh CR. 2002. Improving the US position in world soybean meal trade. MATRIC working paper 02-MWP7. Available at: http://www.card.iastate.edu/publications/DBS/PDFFiles/02mwp7.pdf
Parmer Jr. EL, Wang B, Aglan HA, Mortley D. 2004. Physicochemical properties of texturized meat analog made from peanut flour and soy protein isolate with a single-screw extruder. J Texture Stud 35(4): 371-382.

92
Pietrasik Z. 1999. Effect of content of protein, fat and modified starch on binding textural characteristics and colour of comminuted scalded sausage. Meat Sci 51:17-25.
Pietrasik Z, Jarmoluk A, Shand PJ. 2007. Effect of non-meat proteins on hydration and textural properties of pork meat gels enhanced with microbial transglutaminase. LWT-Food Sci Tech 40: 915-920.
Pietrasik Z, Duda Z. 2000. Effect of fat content and soy protein/carrageenan mix on the quality characteristics of comminuted, scalded sausages. Meat Sci 56(2):181-188.
Pimentel D, Pimentel M. 1996. Energy use in livestock production. In Pimentel D, Pimentel M, eds. Food, Energy, and Society. Niwot, CO: University Press of Colorado, pp. 77-84.
Plummer J. 2012. An in-depth, behind-the-scenes look at sports nutrition products. Muscle & Fitness, Roquette.p176-182. Available from: http://www.roquette-food.com/media/deliacms/media//78/7865-11c8a7.pdf
Porcella MI, Sanchez G, Vaudagna SR,Zenelli ML, Descalzo AM, Meichtri LH, Lasta JA. 2001. Soy protein isolate added to vacuumed-packaged chorizos: Effect on drip loss, quality characterization and stability during refrigerated storage. Meat Sci 57:437-443.
Pszczola DE. 1991. Oat-bran based ingredient blend replaces fat in ground and pork sausage. Food Tech 45: 60–66.
Qammar G, Mohy-ud-Din G, Huma N, Sameen A, Khan MI. 2010. Textured soy protein (TSP) as pizza topping. Nutr Food Sci 40(6): 551-556.
Quass W. 1979. Use of spun soy protein in meat systems. J Am Oil Chem Soc 56(3):341-343.
Rakosky JJ. 1970. Soy products for the meat industry. J Agr Food Chem 18: 1005–1009.

93
Ranogajec A, Beluhan S, Smit Z. 2010. Analysis of nucleosides and monophosphate nucleotides from mushrooms with reversed-phase HPLC. J Sep Sci 33(8): 1024-1033.
Rehrah D, Ahmedna M, Goktepe I, Yu J. 2009. Extrusion parameters and consumer acceptability of a peanut-based meat analogue. Int J Food Sci Tech 44(10):2075-2084.
Reis FS, Barros L, Martins A, Ferreira IC. 2012. Chemical composition and nutritional value of the most widely appreciated cultivated mushrooms: an inter-species comparative study. Food Chem Toxicol 50(2):191-197.
Reitmeier CA, Prussa KI. 1991. Composition, cooking loss, color and compression of ground pork with dry-and wet-milled corn germ meals. J Food Sci 56: 216–219.
Rentfrow G, Weingartner K, Brewer MS, Carr T, McKeith F. 2004. The use of non-solvent extracted soy protein in ground beef, fresh and smoked pork sausage, and frankfurters. (Sensory characteristics of beef and pork processed meats containing non-solvent extracted textured soy protein). J Muscle Foods 15(4):225-234.
Riaz MN. 2001. Textured soy protein and its uses. Textured soy protein and its uses. Agro-Food-Industry Hi-Tech 12(5): 28-31.
Riaz MN. 2004. Textured soy protein as an ingredient. In: Yada RY( editor). Proteins in food processing. England: Woodhead Publishing Limited. pp. 517-557.
Rodger G.2001. Production and properties of mycoprotein as a meat alternative. Food Tech-Chicago 55:36-41.
Rop O, Micek J, Jurikova T. 2009. Beta-glucans in higher fungi and their health effects. Nutrition Reviews 67: 624-631.
Rubio LA, Pérez A, Ruiz R, Guzmán MÁ , Aranda-Olmedo I, Clemente A. 2014. Characterization of pea (Pisum sativum) seed protein fractions. J Sci Food Agr 94(2):280-287.

94
Sacks FM, Lichtenstein A, Horn LV, Harris W, Kris-Etherton P, Winston M. 2006. Soyprotein, isoflavones, and cardiovascular health. An American Heart Association Science Advisory for Professionals From the Nutrition Committee. Circulation 113: 1034-1044.
SANA.2013. Soyfoods Association of North America. Sales and Trends: sales data. Available from: http://www.soyfoods.org/soy-products/sales-and-trends
Schindler S; Zelena K; Krings U; Bez J; Eisner P; Berger RG. 2012. Improvement of the Aroma of Pea (Pisum sativum) Protein Extracts by Lactic Acid Fermentation. Food Biotechnol 26(1), S. 58-74
Serdaroglu M, Degirmencioglu O. 2004. Effects of fat level 5%, 10%, 20% and corn flour 0%.2%,4% on some properties of Turkish type meatballs koefte. Meat Sci 68:291-296.
Shewry PR, Tatham AS. 2000. Wheat gluten. Shewry PR, Tatham AS, editors. Royal Society of Chemistry 261: 500-548.
Shieh CJ, Chang CY, Chen CS. 2004. Factors influencing texture. In: Kilcast D, McKenna BM, editors. Texture in food: Solid foods (Volume 2). Woodhead Publishing.pp.504.
Shu XO, Zheng Y, Cai H, Gu K, Chen Z, Zheng W, Lu W. 2009. Soy food intake and breast cancer survival. JAMA 302(22):2437-2443.
Silva PHDGJDe, Kalubowila A, Lalantha N. 2011. Plant protein sources as an ingredient in ready to eat veggie burgers: nutritional, sensory and physicochemical properties evaluation. J Anim Vet Adv 10(15):2043-2046.
Singh P, Kumar R, Sabapathy SN, Bawa AS. 2008. Functional and edible uses of soy protein products. CRFSFS 7:14-28.
Skrede G.1989. Comparison of various type of starch when used in meat sausages. Meat Sci 25:21-36.

95
Sommer I. 2008 a. Effect of gamma irradiation on selected compounds of fresh mushrooms. Wien: Uniwien, 0105517.
Soytech. 2012.Soyfoods: The U.S. market 2012. Published by Soyatech, Inc. and powered by SPINS, Inc. data.
Strahm B. 2006. Meat alternatives. In: Riaz MN (editor). Soy application in food. New York: CRC Press. pp.135-154.
Strazzulla G. Piazzini M, Guazzelli R. 1983. Textured vegetable proteins in the weight control of obesity. Curr Ther Res Clin E 33(2): 219-224.
Shahiri Tabarestani H, Mazaheri Tehrani M. 2012. Optimization of physicochemical properties of low-fat hamburger formulation using blend of soy flour, split-pea flour and wheat starch as part of fat replacer system. J Food Process PRES 2012. Wiley Periodicals, Inc. Publishing
Thakur M, Hurburgh CR. 2007. Quality of US soybean meal compared to the quality of soybean meal from other origins. J Am Oil Chem Soc 84:835-843.
Taylor BJ, Walsh MK. 2002. Development and sensory analysis of a textured whey protein meatless patty. J Food Sci 67(4): 1555-1558.
Teng D, Gao M, Yang Y, Liu B, Tian Z, Wang J. 2012. Bio-modification of soybean meal with Bacillus subtilis or Aspergillus oryzae. Bio-catalysis and Agr. Biotechnol 1(1): 32-38.
Tömösközi S, Lásztity R, Haraszi R, Baticz O.2001. Isolation and study of the functional properties of pea proteins. Nahrung 45(6):399-401.
Tong MH, Chien PJ, Chang HH, Tsai MJ, Sheu F. 2008. High processing tolerances of immunomodulatory proteins in Enoki and Reishi mushrooms. J Agr Food Chem 56: 3160-3166.
Trius A, Sebranek JG. 1996. Carrageenans and their use in meat products. Crit Rev Food Sci Nutr 36(1-2):69-85.

96
Troy WC, Lawrence AJ. 2001. Twin-screw extrusion texturization of extruded-expelled soybean flour. J Am Oil Chem Soc 78 (8):781-786.
Turnbull and Ward.1995. Mycoprotein reduces glycemia and insulinemia when taken with an oral-glucose-tolerance test, Am J Clin Nutr 52:646-50.
Turnbull WH, Leeds AR, Edwards DG. 1992.Mycoprotein reduces blood lipds in free-living subjects, Am J Clin Nutr 55:415-9.
United States International Trade Commission (USITC). 2010. Mushrooms: industry and trade summary. United States International Trade Commission Publication ITS-07. Control No. 2010002. Available from: http://www.usitc.gov/publications/332/ITS_7.pdf
US pulse quality survey. 2012 According to Northern Pulse Growers Association. Available from: http://www.northernpulse.com/uploads/resources/857/2012-u-s--pulse-quality-survey.pdf
USA Dry Pea Lentil Council. 2012. Available from: http://www.pea-lentil.com/
USDA, ARS. 1971. Textured vegetable protein products (B-1), FNS Notice 219.
USDA. 2012. Vegetables and pulses outlook. In: Thornsbury S, Jerardo A, Wells HF, authors. Economic Research Service(ERS), United States Department of Agriculture. VGS-351. Available from: http://www.ers.usda.gov/media/922639/vgs351.pdf
USDA- National Agricultural Statistics Service. 2003. Livestock and poultry slaughter, 2003 summaries. Available from: http://usda.mannlib.cornell.edu/reports/nassr/livestock/pls—bban/lsan0304.txt and http://usda.mannlib.cornell.edu/reports/nassr/poultry/ppy—bban/pslaan04.txt , Accessed on 29 June 2004.
United States Senate Committee on Agriculture- Nutrition and Forestry. 1997. Animal Waste. 105th Congress, 1st Session. Pollution in America: An Emerging National Problem. Report compiled for Senator Tom Harkin.

97
Verbeken D, Neirinck N, Meeren PVD, Dewettinck K. 2005. Influence of k-carrageenan on the thermal gelation of salt-soluble meat proteins. Meat Sci 70: 161-166.
Walsh MK, Carpenter CE . 2009. Whey protein-based meat analogs. In: Onwulata CI, Huth PJ, editor. Whey Processing, Functionality and Health Benefits. Wiley-Blackwell, Oxford, UK.ch8, pp. 185-199.
Wan Rosli WI, Solihah MA, Mohsin SSJ. 2011. On the ability of oyster mushroom (Pleurotus sajor-caju) conferring changes in proximate composition and sensory evaluation of chicken patty. Int. Food Res J 18(4):1463-1469.
Wang H, Faris RJ, Wang T, Spurlock ME, Gabler N. 2009. Increased in vitro and in vivo digestibility of soy proteins by chemical modification of disulfide bonds. J Am Oil Chem Soc 86(11):1093-1099.
Watson E. 2009. 19. Pea protein could challenge soy as meat analogue. Food Manufact (9). Available from: http://www.foodmanufacture.co.uk/Business-News/Pea-protein-could-challenge-soy-as-meat-analogue
Welsh TL. 1979. Meat and dairy analogs from vegetable proteins. J Am Oil Chem Soc 56(3): 404-406.
WHO (World Health Organization) .2003. Diet, nutrition and the prevention of chronic diseases. WHO Technical Report Ser. 916.
WHO (World Health Organization). 2001. Global burden of disease estimates for by region and sub—region. Available from: http://www3.who.int/whosis/menu.cfm?path=evidence,burden , Accessed on 15 April, 2004.
Wilding MD. 1974. Textured proteins in meats and meat-like products. J Am Oil Chem Soc 51(1): 128A-130A.
Wilkens WE, Mattick LR, Hand BD. 1967. Effect of processing methods on oxidative off-flavour of soybean milk. Food Tech 21:16-30.

98
Yang A, Trout GR, Barry BJ. 1995. Evaluation of carrageenan, isolated soy protein and a modified starch in low-fat frankfurters. In Proceeding of the 41st international congress of meat science and technology, San Antonio, TX : 435–436.
Xiong YL, Noel DC, Moody WG. 1999. Textural and sensory properties of low-fat beef sausages with added water and polysaccharides as affected by pH and salt. J Food Sci 64(): 550-554.
Yang HS, Choi SG, Jeon JT, Park GB, Joo ST. 2007. Textural and sensory properties of low fat pork sausages with added hydrated oatmeal and tofu as texture-modifying agents. Meat Sci 75:283-289.
Yang HS, Kim GD, Choi SG, Joo ST. 2010. Physical and sensory properties of low fat sausage amended with hydrated oatmeal and various meats. Korean J Food Sci Ani Resour 30(3):365-372.
Yang Z, Xu J, Fu Q, Shu T, Bi Y, Song B. 2013. Antitumor activity of a polysaccharide from Pleurotus eryngii on mice bearing renal cancer. Carbohydr Polym 95(2):615-620.
Zeng X, Suwandi J, Fuller J, Doronila, Ng K. 2012. Antioxidant capacity and mineral contents of edible wild Australian mushrooms. Food Sci Technol Int 18(4):367-379.
Zhan S, Ho SC. 2005. Meta-analysis of the effects of soy protein containing isoflavones on the lipid profile. Am J Clin Nutr 81(2):397- 408.
Zhang Y, Venkitasamy C, Pan Z, Wang W. 2013. Recent developments on umami ingredients of edible mushrooms - a review. Trends Food Sci Tech 33(2): 78-92.
Zahradka P, Wright B, Weighell W, Blewett H,Baldwin A, O K, Guzman RP, Taylor CG. 2013. Daily non-soy legume consumption reverses vascular impairment due to peripheral artery disease. Atherosclerosis. 230(2): 310-314.

99
Appendices:
1. Average values of L value for each combination of king oyster mushrooms and soy protein isolates (a); and pea protein isolates (b). (a)
Soy protein isolate (%)1
King oyster mushroom (%)1
0 3.50 7
3 39.61A
a 37.55A
a 37.31A
a
6 43.20A
a 42.92A
a 41.55A
a
9 44.87A
a 40.68A
a 39.44A
a 1
The percentage of soy-based imitation sausage patties. Sample mean with at least one superscript letter in common among columns or subscript letter in
common among rows (within the same box) are not significantly different at 5% level by Fischer’s protected LSD test.
(b)
Pea protein isolate (%)1
King oyster mushroom (%)1
0 3.50 7.00
3 41.40A
a 43.64A
a 43.07A
a
6 44.79A
a 45.41A
a 43.51A
a
9 46.28A
a 46.42A
a 44.70A
a 1
The percentage of pea-based imitation sausage patties. Sample mean with at least one superscript letter in common among columns or subscript letter in
common among rows (within the same box) are not significantly different at 5% level by Fischer’s protected LSD test.

100
2. Average values of b value for each combination of king oyster mushrooms and soy protein isolates (a); and pea protein isolates (b). (a)
Soy protein isolate (%)1
King oyster mushroom (%)1
0 3.50 7
3 10.84A
a 12.02A
a 11.41A
a
6 12.68A
a 13.60A
a 13.76A
a
9 13.97A
a 14.01A
a 13.48A
a 1
The percentage of soy-based imitation sausage patties. Sample mean with at least one superscript letter in common among columns or subscript letter in
common among rows (within the same box) are not significantly different at 5% level by Fischer’s protected LSD test.
(b)
Pea protein isolate (%)1
King oyster mushroom (%)1
0 3.50 7.00
3 13.77A
a 14.85A
a 14.92A
a
6 15.04A
a 15.62A
a 15.92A
a
9 16.24A
a 16.65A
a 16.72A
a 1
The percentage of pea-based imitation sausage patties. Sample mean with at least one superscript letter in common among columns or subscript letter in
common among rows (within the same box) are not significantly different at 5% level by Fischer’s protected LSD test.

101
3. Average values of adhesiveness for each combination of king oyster mushrooms and soy protein isolates (a); and pea protein isolates (b). (a)
Soy protein isolate (%)1
King oyster mushroom (%)1
0 3.50 7
3 -0.394A
a -0.814A
a -1.959A
a
6 -0.976A
a 0.000A
a -0.991A
a
9 -0.179A
a -0.515A
a -1.093A
a
1 The percentage of soy-based imitation sausage patties.
Sample mean with at least one superscript letter in common among columns or subscript letter in common among rows (within the same box) are not significantly different at 5% level by Fischer’s protected LSD test.
(b)
Pea protein isolate (%)1
King oyster mushroom (%)1
0 3.50 7.00
3 -0.987A
a -0.811A
a -2.020A
a
6 -2.409A
a -1.562A
a -0.543A
a
9 -0.229A
a -0.784A
a -1.266A
a 1
The percentage of pea-based imitation sausage patties. Sample mean with at least one superscript letter in common among columns or subscript letter in
common among rows (within the same box) are not significantly different at 5% level by Fischer’s protected LSD test.

102
4. Average values of cohesiveness for each combination of king oyster mushrooms and soy protein isolates (a); and pea protein isolates (b). (a)
Soy protein isolate (%)1
King oyster mushroom (%)1
0 3.50 7
3 0.465A
a 0.371A
b 0.326A
c
6 0.379B
a 0.328B
b 0.330A
b
9 0.418C
a 0.433C
a 0.523B
b 1
The percentage of soy-based imitation sausage patties. Sample mean with at least one superscript letter in common among columns or subscript letter in
common among rows (within the same box) are not significantly different at 5% level by Fischer’s protected LSD test.
(b)
Pea protein isolate (%)1
King oyster mushroom (%)1
0 3.50 7.00
3 0.590A
a 0.505A
b 0.443A
c
6 0.517B
a 0.435B
b 0.386B
c
9 0.415C
a 0.357C
b 0.275C
c 1
The percentage of pea-based imitation sausage patties. Sample mean with at least one superscript letter in common among columns or subscript letter in
common among rows (within the same box) are not significantly different at 5% level by Fischer’s protected LSD test.

103
5. Average values of resilience for each combination of king oyster mushrooms and soy protein isolates (a); and pea protein isolates (b). (a)
Soy protein isolate (%)1
King oyster mushroom (%)1
0 3.50 7
3 0.181A
a 0.137A
b 0.117A
c
6 0.140B
a 0.116B
b 0.113A
b
9 0.153B
a 0.158C
a 0.209B
b 1
The percentage of soy-based imitation sausage patties. Sample mean with at least one superscript letter in common among columns or subscript letter in
common among rows (within the same box) are not significantly different at 5% level by Fischer’s protected LSD test.
(b)
Pea protein isolate (%)1
King oyster mushroom (%)1
0 3.50 7.00
3 0.270A
a 0.216A
b 0.179A
c
6 0.207B
a 0.165B
b 0.143B
c
9 0.153C
a 0.125C
b 0.094C
c 1
The percentage of pea-based imitation sausage patties. Sample mean with at least one superscript letter in common among columns or subscript letter in
common among rows (within the same box) are not significantly different at 5% level by Fischer’s protected LSD test.

104
6. Average values of water activity for each combination of king oyster mushrooms and soy protein isolates (a); and pea protein isolates (b). (a)
Soy protein isolate (%)1
King oyster mushroom (%)1
0 3.50 7
3 0.971A
a 0.969A
a 0.947A
a
6 0.973A
a 0.960A
a 0.959A
a
9 0.955A
a 0.953A
a 0.948A
a 1
The percentage of soy-based imitation sausage patties. Sample mean with at least one superscript letter in common among columns or subscript letter in
common among rows (within the same box) are not significantly different at 5% level by Fischer’s protected LSD test.
(b)
Pea protein isolate (%)1
King oyster mushroom (%)1
0 3.50 7.00
3 0.963A
a 0.961A
a 0.934A
a
6 0.963A
a 0.955A
a 0.948A
a
9 0.957A
a 0.955A
a 0.953A
a 1
The percentage of pea-based imitation sausage patties. Sample mean with at least one superscript letter in common among columns or subscript letter in
common among rows (within the same box) are not significantly different at 5% level by Fischer’s protected LSD test.
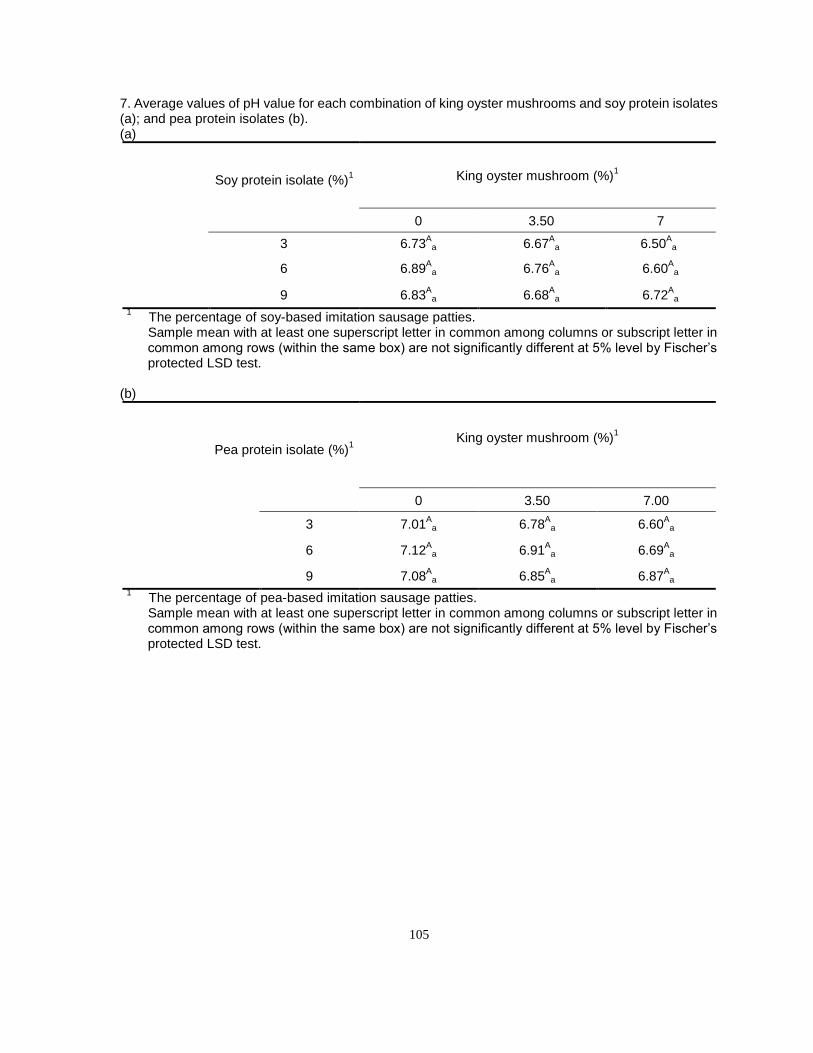
105
7. Average values of pH value for each combination of king oyster mushrooms and soy protein isolates (a); and pea protein isolates (b). (a)
Soy protein isolate (%)1
King oyster mushroom (%)1
0 3.50 7
3 6.73A
a 6.67A
a 6.50A
a
6 6.89A
a 6.76A
a 6.60A
a
9 6.83A
a 6.68A
a 6.72A
a 1
The percentage of soy-based imitation sausage patties. Sample mean with at least one superscript letter in common among columns or subscript letter in
common among rows (within the same box) are not significantly different at 5% level by Fischer’s protected LSD test.
(b)
Pea protein isolate (%)1
King oyster mushroom (%)1
0 3.50 7.00
3 7.01A
a 6.78A
a 6.60A
a
6 7.12A
a 6.91A
a 6.69A
a
9 7.08A
a 6.85A
a 6.87A
a 1
The percentage of pea-based imitation sausage patties. Sample mean with at least one superscript letter in common among columns or subscript letter in
common among rows (within the same box) are not significantly different at 5% level by Fischer’s protected LSD test.

106
8. Average values of cooking shrinkage (%) for each combination of king oyster mushrooms and soy protein isolates (a); and pea protein isolates (b). (a)
Soy protein isolate (%)1
King oyster mushroom (%)1
0 3.50 7
3 1.65A
a 1.48A
a 1.55A
a
6 1.78A
a 1.55A
a 1.62A
a
9 1.56A
a 1.68A
a 1.05A
a 1
The percentage of soy-based imitation sausage patties. Sample mean with at least one superscript letter in common among columns or subscript letter in
common among rows (within the same box) are not significantly different at 5% level by Fischer’s protected LSD test.
(b)
Pea protein isolate (%)1
King oyster mushroom (%)1
0 3.50 7.00
3 1.01A
a 1.62A
a 1.51A
a
6 1.05A
a 1.09A
a 1.10A
a
9 1.08A
a 1.71A
a 1.08A
a 1
The percentage of pea-based imitation sausage patties. Sample mean with at least one superscript letter in common among columns or subscript letter in
common among rows (within the same box) are not significantly different at 5% level by Fischer’s protected LSD test.

107
9. The formulations of soy-based (a) and pea-based (b) imitation sausage patties. (a)
(b)
All the components are in gram of soy- or pea-based imitation sausage patties (total weight: 45g of each sample). The first number in the first rows means the percentage of king oyster mushrooms and the second number in the first rows means the percentage of soy or pea protein isolates. TSP, textured soy proteins; TPP, textured pea proteins; SPI, soy protein isolates; PPI, pea protein isolates; KOM, king oyster mushrooms. Hot water was used to rehydrate TSP or TPP. Seasoning includes sugar, soy sauce and sesame oil. The first number in the first rows means the percentage of king oyster mushrooms and the second number in the first rows means the percentage of soy or pea protein isolates.
Soy-based products 0,3 0,6 0,9 3.5,3 3.5,6 3.5,9 7,3 7,6 7,9
TSP 6.75 6.75 6.75 6.75 6.75 6.75 6.75 6.75 6.75
Hot water 16.88 16.88 16.88 16.88 16.88 16.88 16.88 16.88 16.88
KOM 0.00 0.00 0.00 1.58 1.58 1.58 3.15 3.15 3.15
Corn oil 1.80 1.80 1.80 1.80 1.80 1.80 1.80 1.80 1.80
Fresh egg white 3.15 3.15 3.15 3.15 3.15 3.15 3.15 3.15 1.22
SPI 1.35 2.70 4.05 1.35 2.70 4.05 1.35 2.70 4.05
Carraggenan 0.23 0.23 0.23 0.23 0.23 0.23 0.23 0.23 0.23
Potato starch 7.97 5.27 2.57 5.72 3.02 0.32 3.47 0.77 0.00
Salt 0.23 0.23 0.23 0.23 0.23 0.23 0.23 0.23 0.23
Seasioning 0.41 0.41 0.41 0.41 0.41 0.41 0.41 0.41 0.41
Onion powder 0.09 0.09 0.09 0.09 0.09 0.09 0.09 0.09 0.09
Garlic powder 0.09 0.09 0.09 0.09 0.09 0.09 0.09 0.09 0.09
Water 6.08 7.43 8.78 6.75 8.10 9.45 7.43 8.78 10.13
Pea-based products 0,3 0,6 0,9 3.5,3 3.5,6 3.5,9 7,3 7,6 7,9
TPP 6.75 6.75 6.75 6.75 6.75 6.75 6.75 6.75 6.75
Hot water 10.13 10.13 10.13 10.13 10.13 10.13 10.13 10.13 10.13
KOM 0.00 0.00 0.00 1.58 1.58 1.58 3.15 3.15 3.15
Corn oil 1.80 1.80 1.80 1.80 1.80 1.80 1.80 1.80 1.80
Fresh egg white 3.15 3.15 3.15 3.15 3.15 3.15 3.15 3.15 3.15
PPI 1.35 2.70 4.05 1.35 2.70 4.05 1.35 2.70 4.05
Carraggenan 0.23 0.23 0.23 0.23 0.23 0.23 0.23 0.23 0.23
Potato starch 11.57 8.87 6.17 9.32 6.62 3.92 7.07 4.37 1.67
Salt 0.23 0.23 0.23 0.23 0.23 0.23 0.23 0.23 0.23
Seasioning 0.41 0.41 0.41 0.41 0.41 0.41 0.41 0.41 0.41
Onion powder 0.09 0.09 0.09 0.09 0.09 0.09 0.09 0.09 0.09
Garlic powder 0.09 0.09 0.09 0.09 0.09 0.09 0.09 0.09 0.09
Water 9.23 10.58 11.93 9.90 11.25 12.60 10.58 11.93 13.28

108
10. Proximate analysis of soy- (a) and pea-based (b) imitation sausage patties. (a)
(b)
Data was calculated based on the following proximate data table and the weight of soy- and pea-based imitation sausage patty is 45 gram of each. The first number in the first rows means the percentage of king oyster mushrooms and the second number in the first rows means the percentage of soy or pea protein isolates. Data was calculated by Genesis R&D Product Development and Labeling Software (Elizabeth Stewart Hands and Associates Inc., version 9.7.0, Salem, OR, USA). Proximate data.
TSP, textured soy proteins; TPP, textured pea proteins; SPI, soy protein isolates; PPI, pea protein isolates; KOM, king oyster mushrooms. The data was based on 100 gram of each ingredient.
Soy-based products 0,3 0,6 0,9 3.5,3 3.5,6 3.5,9 7,3 7,6 7,9
Protein(g) 4.89 6.23 7.39 5.12 6.28 7.44 5.17 6.33 7.30
Carbohydrate (g) 22.68 20.42 18.17 20.92 18.67 16.42 19.13 16.92 16.26
Dietary fiber (g) 1.32 1.32 1.32 1.37 1.37 1.37 1.42 1.42 1.42
Fat (g) 4.58 4.63 4.81 4.72 4.81 4.80 4.72 4.76 4.72
Ash(g) 0.84 0.89 0.94 0.82 0.87 0.93 0.81 0.86 0.92
Pea-based products 0,3 0,6 0,9 3.5,3 3.5,6 3.5,9 7,3 7,6 7,9
Protein (g) 4.92 6.29 7.48 6.69 7.71 8.92 6.64 7.79 8.98
Carbohydrate (g) 17.22 16.98 16.74 17.12 16.88 16.64 17.02 16.78 16.54
Dietary fiber (g) 1.32 1.32 1.32 1.37 1.37 1.37 1.41 1.41 1.41
Fat (%) 4.57 4.61 4.65 4.58 4.62 4.66 4.60 4.61 4.65
Ash(g) 0.84 0.87 0.91 0.82 0.86 0.90 0.81 0.85 0.89
TSP TPP KOM Corn oil Fresh egg white SPI PPI Carrageenan
Protein (g) 50 50 3 0 9.8 86 88 0
Carbohydrate (g) 32 32 8 0 1.05 0 2 90
Dietary fiber (g) 18 18 3 0 0 0 0 30
Fat (g) 3 3 1 100 0 4 3 0
Ash (g) 6 6 0 0 0.6 5 4 0
Salt Sugar Soy sauce Sesame oil Onion powder Garlic powder Potato starch
Protein (g) 0 0 6.67 0 9.5 15.3 0
Carbohydrate (g) 0 100 33.33 0 82 74.1 83.3
Dietary fiber (g) 0 0 0 0 17.3 17.9 0
Fat (g) 0 0 0 93.3 0.4 4 0
Ash (g) 99.8 0.5 17.78 0 3.98 3.91 0.5
Copyright © 2022 FDOKUMEN