Comparison of theoretical proteomes: identification of COGs with conserved and variable pI within...
12
BioMed Central Page 1 of 12 (page number not for citation purposes) BMC Genomics Open Access Research article Comparison of theoretical proteomes: Identification of COGs with conserved and variable pI within the multimodal pI distribution Soumyadeep Nandi †1 , Nipun Mehra †1 , Andrew M Lynn 1 and Alok Bhattacharya* 2,1 Address: 1 Centre for Computational Biology and Bioinformatics, School of Information Technology, Jawaharlal Nehru University, New Delhi 110067, India and 2 School of Life Sciences, Jawaharlal Nehru University, New Delhi 110067, India Email: Soumyadeep Nandi - [email protected]; Nipun Mehra - [email protected]; Andrew M Lynn - [email protected]; Alok Bhattacharya* - [email protected] * Corresponding author †Equal contributors Abstract Background: Theoretical proteome analysis, generated by plotting theoretical isoelectric points (pI) against molecular masses of all proteins encoded by the genome show a multimodal distribution for pI. This multimodal distribution is an effect of allowed combinations of the charged amino acids, and not due to evolutionary causes. The variation in this distribution can be correlated to the organisms ecological niche. Contributions to this variation maybe mapped to individual proteins by studying the variation in pI of orthologs across microorganism genomes. Results: The distribution of ortholog pI values showed trimodal distributions for all prokaryotic genomes analyzed, similar to whole proteome plots. Pairwise analysis of pI variation show that a few COGs are conserved within, but most vary between, the acidic and basic regions of the distribution, while molecular mass is more highly conserved. At the level of functional grouping of orthologs, five groups vary significantly from the population of orthologs, which is attributed to either conservation at the level of sequences or a bias for either positively or negatively charged residues contributing to the function. Individual COGs conserved in both the acidic and basic regions of the trimodal distribution are identified, and orthologs that best represent the variation in levels of the acidic and basic regions are listed. Conclusion: The analysis of pI distribution by using orthologs provides a basis for resolution of theoretical proteome comparison at the level of individual proteins. Orthologs identified that significantly vary between the major acidic and basic regions maybe used as representative of the variation of the entire proteome. Background A protein's Isoelectric point (pI) – the pH at which a pro- tein has no net charge – is the basis for its isolation using isoelectric focussing and along with Molecular Mass (Mr) is exploited in two dimensional gel electrophoresis used to seperate a cell's protein content. Bjellquist [1,2] has shown that a the pI of a denatured linear protein can be calculated with high accuracy using the pK values of the amino acids responsible for charge. Using these calcula- tions, it is posible to create an image of an organisms Published: 09 September 2005 BMC Genomics 2005, 6:116 doi:10.1186/1471-2164-6-116 Received: 09 March 2005 Accepted: 09 September 2005 This article is available from: http://www.biomedcentral.com/1471-2164/6/116 © 2005 Nandi et al; licensee BioMed Central Ltd. This is an Open Access article distributed under the terms of the Creative Commons Attribution License (http://creativecommons.org/licenses/by/2.0 ), which permits unrestricted use, distribution, and reproduction in any medium, provided the original work is properly cited.
Transcript of Comparison of theoretical proteomes: identification of COGs with conserved and variable pI within...

BioMed CentralBMC Genomics
ss
Open AcceResearch articleComparison of theoretical proteomes: Identification of COGs with conserved and variable pI within the multimodal pI distributionSoumyadeep Nandi†1, Nipun Mehra†1, Andrew M Lynn1 and Alok Bhattacharya*2,1Address: 1Centre for Computational Biology and Bioinformatics, School of Information Technology, Jawaharlal Nehru University, New Delhi 110067, India and 2School of Life Sciences, Jawaharlal Nehru University, New Delhi 110067, India
Email: Soumyadeep Nandi - [email protected]; Nipun Mehra - [email protected]; Andrew M Lynn - [email protected]; Alok Bhattacharya* - [email protected]
* Corresponding author †Equal contributors
AbstractBackground: Theoretical proteome analysis, generated by plotting theoretical isoelectric points(pI) against molecular masses of all proteins encoded by the genome show a multimodal distributionfor pI. This multimodal distribution is an effect of allowed combinations of the charged amino acids,and not due to evolutionary causes. The variation in this distribution can be correlated to theorganisms ecological niche. Contributions to this variation maybe mapped to individual proteins bystudying the variation in pI of orthologs across microorganism genomes.
Results: The distribution of ortholog pI values showed trimodal distributions for all prokaryoticgenomes analyzed, similar to whole proteome plots. Pairwise analysis of pI variation show that afew COGs are conserved within, but most vary between, the acidic and basic regions of thedistribution, while molecular mass is more highly conserved. At the level of functional grouping oforthologs, five groups vary significantly from the population of orthologs, which is attributed toeither conservation at the level of sequences or a bias for either positively or negatively chargedresidues contributing to the function. Individual COGs conserved in both the acidic and basicregions of the trimodal distribution are identified, and orthologs that best represent the variationin levels of the acidic and basic regions are listed.
Conclusion: The analysis of pI distribution by using orthologs provides a basis for resolution oftheoretical proteome comparison at the level of individual proteins. Orthologs identified thatsignificantly vary between the major acidic and basic regions maybe used as representative of thevariation of the entire proteome.
BackgroundA protein's Isoelectric point (pI) – the pH at which a pro-tein has no net charge – is the basis for its isolation usingisoelectric focussing and along with Molecular Mass (Mr)is exploited in two dimensional gel electrophoresis used
to seperate a cell's protein content. Bjellquist [1,2] hasshown that a the pI of a denatured linear protein can becalculated with high accuracy using the pK values of theamino acids responsible for charge. Using these calcula-tions, it is posible to create an image of an organisms
Published: 09 September 2005
BMC Genomics 2005, 6:116 doi:10.1186/1471-2164-6-116
Received: 09 March 2005Accepted: 09 September 2005
This article is available from: http://www.biomedcentral.com/1471-2164/6/116
© 2005 Nandi et al; licensee BioMed Central Ltd. This is an Open Access article distributed under the terms of the Creative Commons Attribution License (http://creativecommons.org/licenses/by/2.0), which permits unrestricted use, distribution, and reproduction in any medium, provided the original work is properly cited.
Page 1 of 12(page number not for citation purposes)
BMC Genomics 2005, 6:116 http://www.biomedcentral.com/1471-2164/6/116
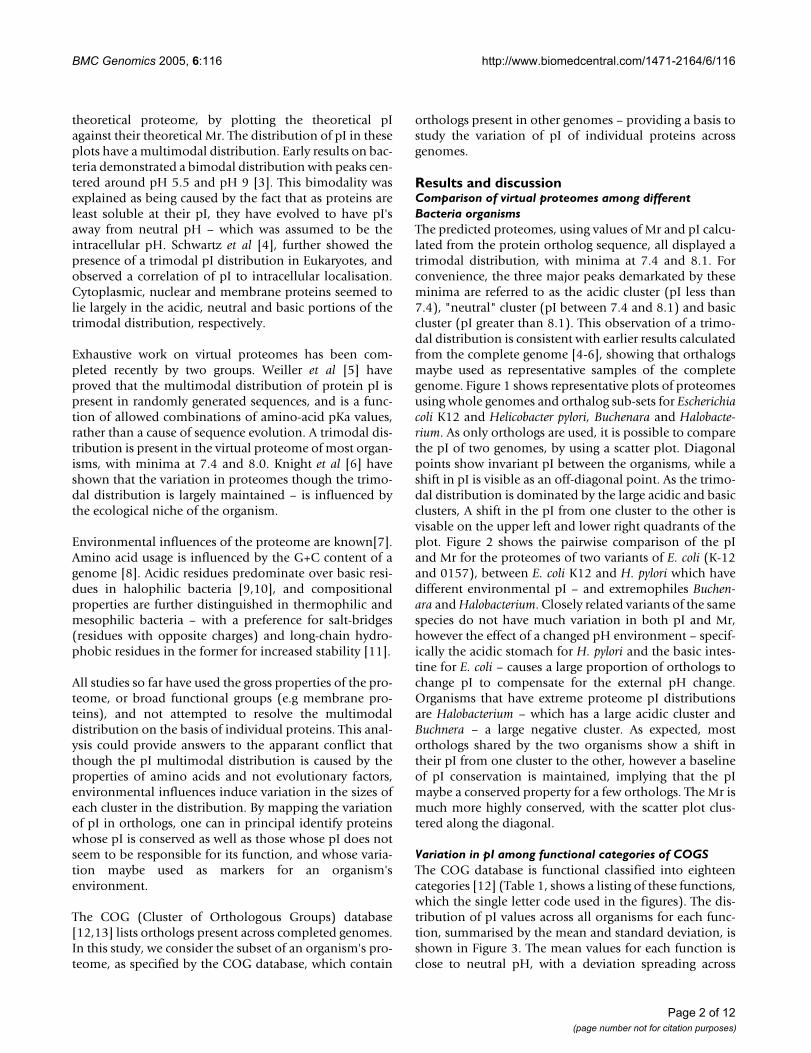
theoretical proteome, by plotting the theoretical pIagainst their theoretical Mr. The distribution of pI in theseplots have a multimodal distribution. Early results on bac-teria demonstrated a bimodal distribution with peaks cen-tered around pH 5.5 and pH 9 [3]. This bimodality wasexplained as being caused by the fact that as proteins areleast soluble at their pI, they have evolved to have pI'saway from neutral pH – which was assumed to be theintracellular pH. Schwartz et al [4], further showed thepresence of a trimodal pI distribution in Eukaryotes, andobserved a correlation of pI to intracellular localisation.Cytoplasmic, nuclear and membrane proteins seemed tolie largely in the acidic, neutral and basic portions of thetrimodal distribution, respectively.
Exhaustive work on virtual proteomes has been com-pleted recently by two groups. Weiller et al [5] haveproved that the multimodal distribution of protein pI ispresent in randomly generated sequences, and is a func-tion of allowed combinations of amino-acid pKa values,rather than a cause of sequence evolution. A trimodal dis-tribution is present in the virtual proteome of most organ-isms, with minima at 7.4 and 8.0. Knight et al [6] haveshown that the variation in proteomes though the trimo-dal distribution is largely maintained – is influenced bythe ecological niche of the organism.
Environmental influences of the proteome are known[7].Amino acid usage is influenced by the G+C content of agenome [8]. Acidic residues predominate over basic resi-dues in halophilic bacteria [9,10], and compositionalproperties are further distinguished in thermophilic andmesophilic bacteria – with a preference for salt-bridges(residues with opposite charges) and long-chain hydro-phobic residues in the former for increased stability [11].
All studies so far have used the gross properties of the pro-teome, or broad functional groups (e.g membrane pro-teins), and not attempted to resolve the multimodaldistribution on the basis of individual proteins. This anal-ysis could provide answers to the apparant conflict thatthough the pI multimodal distribution is caused by theproperties of amino acids and not evolutionary factors,environmental influences induce variation in the sizes ofeach cluster in the distribution. By mapping the variationof pI in orthologs, one can in principal identify proteinswhose pI is conserved as well as those whose pI does notseem to be responsible for its function, and whose varia-tion maybe used as markers for an organism'senvironment.
The COG (Cluster of Orthologous Groups) database[12,13] lists orthologs present across completed genomes.In this study, we consider the subset of an organism's pro-teome, as specified by the COG database, which contain
orthologs present in other genomes – providing a basis tostudy the variation of pI of individual proteins acrossgenomes.
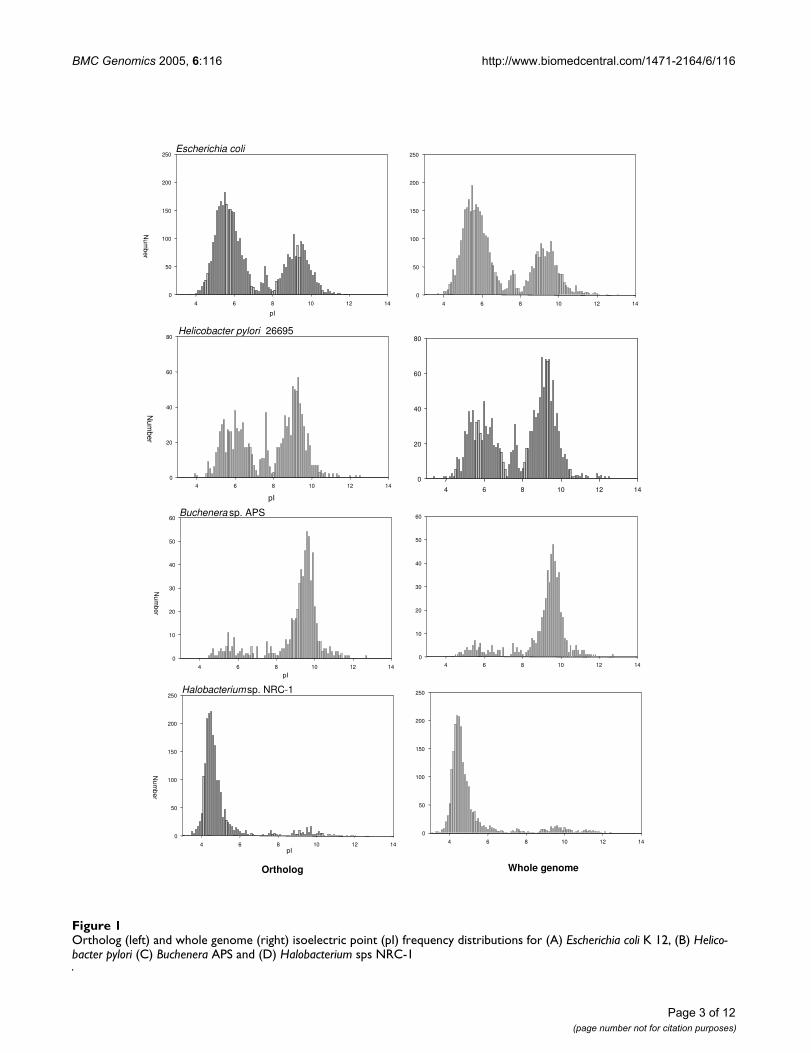
Results and discussionComparison of virtual proteomes among different Bacteria organismsThe predicted proteomes, using values of Mr and pI calcu-lated from the protein ortholog sequence, all displayed atrimodal distribution, with minima at 7.4 and 8.1. Forconvenience, the three major peaks demarkated by theseminima are referred to as the acidic cluster (pI less than7.4), "neutral" cluster (pI between 7.4 and 8.1) and basiccluster (pI greater than 8.1). This observation of a trimo-dal distribution is consistent with earlier results calculatedfrom the complete genome [4-6], showing that orthalogsmaybe used as representative samples of the completegenome. Figure 1 shows representative plots of proteomesusing whole genomes and orthalog sub-sets for Escherichiacoli K12 and Helicobacter pylori, Buchenara and Halobacte-rium. As only orthologs are used, it is possible to comparethe pI of two genomes, by using a scatter plot. Diagonalpoints show invariant pI between the organisms, while ashift in pI is visible as an off-diagonal point. As the trimo-dal distribution is dominated by the large acidic and basicclusters, A shift in the pI from one cluster to the other isvisable on the upper left and lower right quadrants of theplot. Figure 2 shows the pairwise comparison of the pIand Mr for the proteomes of two variants of E. coli (K-12and 0157), between E. coli K12 and H. pylori which havedifferent environmental pI – and extremophiles Buchen-ara and Halobacterium. Closely related variants of the samespecies do not have much variation in both pI and Mr,however the effect of a changed pH environment – specif-ically the acidic stomach for H. pylori and the basic intes-tine for E. coli – causes a large proportion of orthologs tochange pI to compensate for the external pH change.Organisms that have extreme proteome pI distributionsare Halobacterium – which has a large acidic cluster andBuchnera – a large negative cluster. As expected, mostorthologs shared by the two organisms show a shift intheir pI from one cluster to the other, however a baselineof pI conservation is maintained, implying that the pImaybe a conserved property for a few orthologs. The Mr ismuch more highly conserved, with the scatter plot clus-tered along the diagonal.
Variation in pI among functional categories of COGSThe COG database is functional classified into eighteencategories [12] (Table 1, shows a listing of these functions,which the single letter code used in the figures). The dis-tribution of pI values across all organisms for each func-tion, summarised by the mean and standard deviation, isshown in Figure 3. The mean values for each function isclose to neutral pH, with a deviation spreading across
Page 2 of 12(page number not for citation purposes)
BMC Genomics 2005, 6:116 http://www.biomedcentral.com/1471-2164/6/116
Ortholog (left) and whole genome (right) isoelectric point (pI) frequency distributions for (A) Escherichia coli K 12, (B) Helico-bacter pylori (C) Buchenera APS and (D) Halobacterium sps NRC-1Figure 1Ortholog (left) and whole genome (right) isoelectric point (pI) frequency distributions for (A) Escherichia coli K 12, (B) Helico-bacter pylori (C) Buchenera APS and (D) Halobacterium sps NRC-1
Buchenera sp. APS
pI
4 6 8 10 12 14
Nu
mber
0
10
20
30
40
50
60
Halobacteriumsp. NRC-1
pI4 6 8 10 12 14
Nu
mber
0
50
100
150
200
250
4 6 8 10 12 14
0
10
20
30
40
50
60
4 6 8 10 12 14
0
50
100
150
200
250
Helicobacter pylori 26695
pI4 6 8 10 12 14
Num
ber
0
20
40
60
80
4 6 8 10 12 14
0
20
40
60
80
Escherichia coli
pI
4 6 8 10 12 14
Nu
mber
0
50
100
150
200
250
4 6 8 10 12 14
0
50
100
150
200
250
Ortholog Whole genome
Page 3 of 12(page number not for citation purposes)

BMC Genomics 2005, 6:116 http://www.biomedcentral.com/1471-2164/6/116
Pairwise comparison of isoelectric point and molecular mass of orthologsFigure 2Pairwise comparison of isoelectric point and molecular mass of orthologs. (A) Escherichia coli K12 and 0517; (B) Escherichia coli K12 and Helicobacter pylori (C) Halobacterium sps NCR-1 and Buchnera sps APS
Molecular Mass (Mr) x 103
0 20 40 60 80 100 120 140 160 180
Mol
ecul
ar M
ass
(Mr)
x 10
3
0
20
40
60
80
100
120
140
160
180
Molecular Mass (Mr) x 103
0 20 40 60 80 100 120 140 160 180
Mol
ecul
ar M
ass
(Mr)
x 10
3
0
20
40
60
80
100
120
140
160
180
Molecular Mass (Mr) x 103
0 20 40 60 80 100 120 140 160 180
Mol
ecul
ar M
ass
(Mr)
x 10
3
0
20
40
60
80
100
120
140
160
180
E.coli K12 vs E.coli 0157
Isoelectric point
2 4 6 8 10 12 14
Isoe
lect
ric p
oint
2
4
6
8
10
12
14
E.coli K12 vs H.pylori 26695
Isoelectric point2 4 6 8 10 12 14
Isoe
lect
ric p
oint
2
4
6
8
10
12
14
Halobacterium sp NCR-1 vs Buchnera sp. APS
Isoelectric point2 4 6 8 10 12 14
Isoe
lect
ric p
oint
2
4
6
8
10
12
14
A
B
C
Page 4 of 12(page number not for citation purposes)

BMC Genomics 2005, 6:116 http://www.biomedcentral.com/1471-2164/6/116
both clusters. Again the use of orthologs provides themeans to correlate conservation of pI between pairs oforganisms. The mean pairwise-correlation of ortholog pIcorresponding to each function was also computed (Fig-ure 4A), along with the corresponding pairwise correla-tion of ortholog Mr (Figure 4B). We have used Kruskal-Wallis multiple comparison testing [14] to identify groupsthat significantly deviate from the expected distribution.Five functional groups deviate significantly, three towardsthe basic cluster and two towards the acidic cluster (Table1).
Membrane proteins are known to have a preference forthe basic cluster, caused by the larger proportion of basiccharged residues to compensate for the negatively chargedmembrane bilayer [4,6]. A functional requirement foreither basic or acidic charges could thus influence the pro-tein's pI. Orthologs, by definition, perform the same func-tion in different organisms, and if preference for eitherbasic or acidic charged residues is related to this function,this should be reflected in the protien's pI having a biasfor the respective cluster. However, the conservation of pImaybe accidental, especially if the proteins are highly con-served. We have calculated the pairwise distance of all pro-teins within a COG as a measure of their sequencesimilarity. The distributions of distance for each func-tional group is shown in Figure 4C.
Proteins associated with the group "J", involved withtranslation, ribosomal structure and biogenesis, are dom-inated by highly conserved ribosomal proteins – and thishigh level of conservation and intolerance to mutation isreflected in an invariance of pI. This conservation is alsoreflected in the higher correlation for this group ofproteins in their Mr. Other groups which are polarised toeither the acidic or basic modes of the pI distribution donot show such a high level of conservation, and pI conser-vation is dictated by the nature of their function.
Analysis of pI variation for individual COGSThe general function of a group of proteins and their levelof conservation may dictate a preference for a specificrange of pI, as had been shown earlier for membrane pro-teins, and for functional groups of COGs in the previoussection of this paper. Individual proteins maybe identifiedthat have a preference for either the acidic or basic cluster.The scatter plot of the pI of all ortholog proteins used inthis analysis is sorted by COG mean pI and plotted in Fig-ure (5). The allowed trimodal regions are clearly visable.However at both the left and right extremes, the scatterplot show that COGs do exist with a preference for theacidic or basic cluster respectively. We have computed thefrequency distribution for each COG in the acidic, neutraland basic clusters. On analysis, no COG is conserved inthe neutral cluster, the largest frequency being 0.5 for
Table 1: Variation in pI in functionally classified groups of COGs. The table lists functional groups of COGs as defined in the COG website [22] along with the results of the Dunn Multiple Comparison test. Ri – mean rank for the group, Rt – mean rank for sample representing the complete distribution. Significant values are those where |Rt - Ri| > 467.35 which is calculated for α = 0.2
Ri Ri - RtMetabolismC Energy production and conversion 2563.72 276.96E Amino acid transport and metabolism 2792.99 47.69F Nucleotide transport and metabolism 2191.12 649.56G Carbohydrate transport and metabolism 2958.98 -118.3H Coenzyme metabolism 2736.4 104.28I Lipid metabolism 2587.87 252.81Q Secondary metabolism biosynthesis, transport and catabolism 2479.07 361.62Information storage and processingJ Translation, ribosomal structure and biogenesis 3399.31 -558.63K Transcription 2977.93 -137.25L DNA replication, recombination and repair 3530.56 -689.88Cellular processM Cell Envelope biogenesis, Outer membrane 3287.13 -446.45N Cell motility and secretion 2722.08 118.6O Post translation modification, protein turnover, chaperones 2445.01 395.67P Inorganic ion transport and metabolism 3482.93 -642.25T Signal transduction mechanisms 2219.23 621.45D Cell devision and chromosome partitioning 2836.43 4.25Poorly characterizedR General function prediction only 3189.18 -348.5S Function unknown 2918.88 -78.2
Rt = 2840.68
Page 5 of 12(page number not for citation purposes)

BMC Genomics 2005, 6:116 http://www.biomedcentral.com/1471-2164/6/116
COGs 1689, 3016, 3783 and 3801, however their fre-quency of occurance among all organisms is less than tenpercent. This is an expected result as the pI distribution iscaused by an interplay of acidic and basic residues whichacount for the large acidic and basic clusters. The "neutral"cluster is not caused by the absense or balance of chargedresidues but because allowed pK combinations of chargedresidues are minimum at pH 7.1 and 8.4 [5].
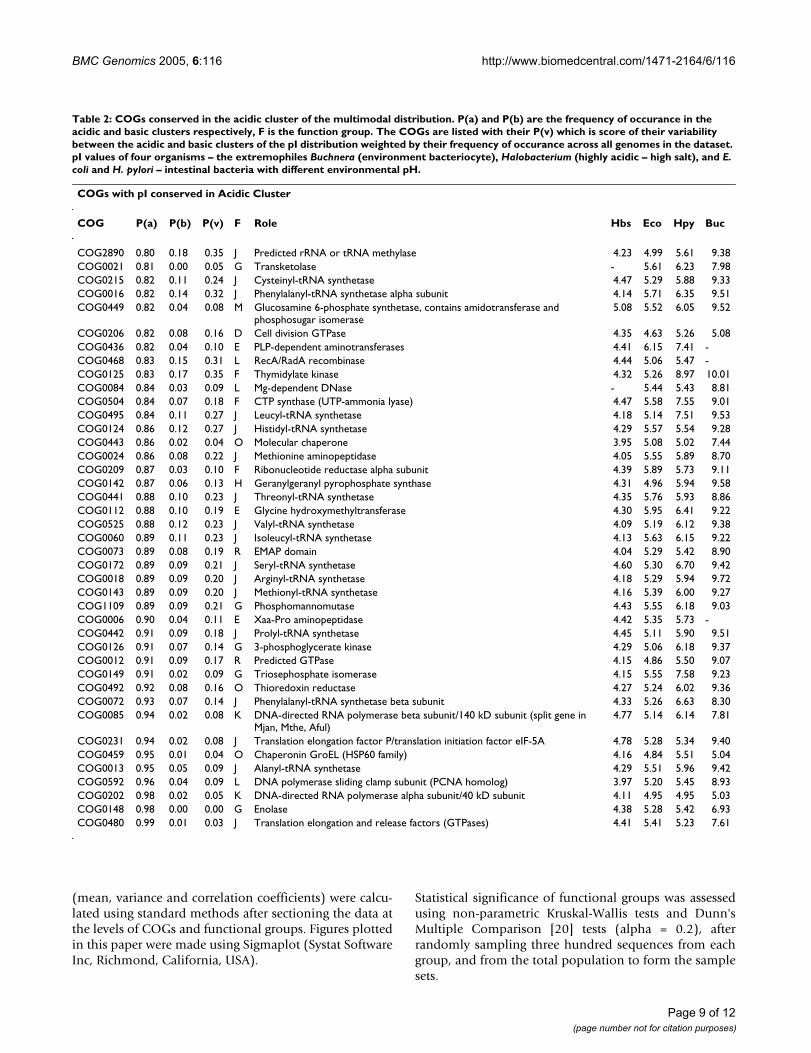
Proteins conserved in the acidic and basic clusters how-ever have a preponderance of acidic and basic residuesrespectively, which maybe required for their function. Acomplete list of COGs whose protein pI are conserved inthese clusters is listed as an additional file. We have scaledthe frequency of conservation by the frequency of occur-ance, so that only COGs which are maximally representedacross the organisms in the dataset are used as markers ofeach cluster. These are listed in Table 2 and Table 3 respec-tively. The dominant groups of proteins which seem torequire an acidic pI are the amino acid tRNA synthetases.Among those proteins whose pI is highly conserved in thebasic cluster are a large number of ribosomal proteins.
Although highly conserved and intolerant to mutation,ribosomal proteins interweave with negatively chargedRNA to form the ribosome, and being positively chargedwill be a requirement for strong electrostatic interactions.
A majority of COGs however show distributions acrossboth the basic and acidic clusters. Knight et al, haveshown a correlation to a change in proteome patternswith the organism's ecological niche. Since the proteomealways exists in a trimodal distribution, it will only varyfrom organism to organism in the relative amounts ofproteins which are present in each of the three clusters ofthe pI distribution. We have computed the probability ofbeing in both the acidic and basic clusters weighted by thefrequency of occurance in the organisms under considera-tion in order to identify COGs which are highly repre-sented and show no particular preference for eithercluster. This list of COGs, with a joint probability greaterthan a cutoff value of 0.6 is tabulated in table 4. Forreference, the individual values of genes corresponding tothe four organisms is also listed, and in a majority of casesshow good agreement with the shift in an organism's total
Frequency distribution for COG mean pI (grey vertical bars)Figure 3Frequency distribution for COG mean pI (grey vertical bars). The variation of pI (mean and standard deviation) for functionally classified groups of COGs is overlayed. Functional groups denoted by single letters is expanded in Table 1
pI2 4 6 8 10 12 14
Num
ber
of pro
tein
s
0
20
40
60
80
100
120
140
2 4 6 8 10 12 14
Fu
nctio
ns
C
D
E
F
G
H
I
J
K
L
M
N
O
P
Q
R
S
T
Page 6 of 12(page number not for citation purposes)

BMC Genomics 2005, 6:116 http://www.biomedcentral.com/1471-2164/6/116
theoretical proteome towards either the basic or acidicclusters. Except for some ribosomal proteins, whichappear on the list because of their high frequency of occur-ance, all other COGs are membrane based proteins, whichwould have direct contact with the external environment.These COGs best represent an organism's shift fromexpected levels of the acidic and basic clusters of the mul-timodal distribution, and it is possible that they maybeused as markers to predict an organisms ecological niche,with particular reference to its environmental pH in freeliving microorganisms.
Extrapolating results obtained from using the theoreticalproteome must be viewed with caution as predicted pIvalues are for unfolded proteins obtained from sequenceand not the native folded proteins in the cellularmicroenvironment, which remain unknown. We haveresisted attempting to correlate observations of anortholog's thoeretical pI with its function, unless clearlyobvious, for this reason. The theoretical proteome is alsogenerated from the total set of proteins present in anorganism's genome, while only a subset maybe expressedat any given time and will vary in response to externalstimuli. An organism may also respond to evolutionarypressure such as environmental pH by increasing thenumber of copies of a charged protein, a ploy frequentlyadopted in drug resistance. The effect of a shift in the rel-ative levels of the acidic and basic peaks maybe replicatedby an increase in copy number of proteins belonging tothe relevant cluster. As theoretical proteome studies arenot weighted by the copy number of the individual pro-teins, for lack of relevant data related to the quantity ofindividual proteins for the entire proteome, these obser-vations are impossible to make.
ConclusionAnalysis of ortholog pI across forty two microorganismgenomes which contain reprentatives of free living archeaand bacteria are analysed to identify orthologs which areinvariant in pI as well as those amenable to changes in pI.Orthologs with a high frequency of occurance andvariation in pI are shortlisted, and maybe used as markersin future studies which attempt to map proteome proper-ties to variation in the organisms ecological niche.
MethodsGenome sequences and the COG database generated with43 organisms with sequences and alignments weresourced from NCBI [15]. Sacharomyces cerevisae wasremoved from the dataset so that it contained onlyarcheae and bacteria which were single-celled organisms.This was intentionally to include only genomes of organ-isms which would have their membrane directly in con-tact with the external environment and included a rangeof organisms with diverse ecological niches.
Mean correlation of pI (A), Mr (B) and sequence distance (C) for all organism pairs for the functional groups of COGSFigure 4Mean correlation of pI (A), Mr (B) and sequence distance (C) for all organism pairs for the functional groups of COGS. Functional groups are denoted by single letters, expanded in Table 1
A
0.0
0.2
0.4
0.6
0.8
1.0
C D E F G H I J K L M N O P Q R S T
0.0
0.2
0.4
0.6
0.8
1.0
1.2
B
C
C D E F G H I J K L M N O P Q R S T
0
1
2
3
4
5
C D E F G H I J K L M N O P Q R S T
Page 7 of 12(page number not for citation purposes)

BMC Genomics 2005, 6:116 http://www.biomedcentral.com/1471-2164/6/116
The isoelectric point is determined from an equation sub-tracting the sum of all negative charges (of all acidic resi-dues) from the sum of all positive charges (of all basicresidues), by varying the pH by bisectional nesting ofintervals on the pH scale until the interval is smaller thana given level (0.001), as described in [2]. Fixed values forpK are considered to calculate the isoelectric point, andare the same as used in the molecular weight/isoelectricpoint program at http://www.expasy.org[16].
The molecular weights and isoelectric point of all the pre-dicted open reading frames from the completed genomesof a number of prokaryotes were generated. All ORFs thatare classified by respective COG identities and assigned toone of the 18 functional groups [12] were used in compar-itive analysis between genomes.
Correlation of molecular weights and pI were performed,using scripts written in house, for all COGs classified to aparticular function for each pair of organisms. Pairwisedistances were calculated for all pairs of proteinsbelonging to the specified COG. Sequences assigned toeach COG were aligned with ClustalW [17] using defaultparameters, and the resulting multiple alignment used togenerate a distance matrix with the program PROTDIST,using default parameters (Jones-Taylor-Thornton model,where the distance is scaled in units of the expected frac-tion of amino acids changed), from the Phylip package[18]. Perl scripts used to automate this protocol were writ-ten using BioPerl Modules [19].
Individual molecular weight and isoelectric point alongwith pairwise distances were stored in a MySQL databasev 4.1.9, running on a Fedora Core Linux dual Xeon Server,to enable easy retrieval. Statistical properties on the data
Isoelectric point distribution of orthologs sorted by mean isoelectric point valueFigure 5Isoelectric point distribution of orthologs sorted by mean isoelectric point value. Black dot – mean value for COG, grey bar – standard deviation for COG, red point – pI value of individual genes classified under the COG. The sorted list of COG's used for the X-axis is available as an additional file.
Page 8 of 12(page number not for citation purposes)
BMC Genomics 2005, 6:116 http://www.biomedcentral.com/1471-2164/6/116
(mean, variance and correlation coefficients) were calcu-lated using standard methods after sectioning the data atthe levels of COGs and functional groups. Figures plottedin this paper were made using Sigmaplot (Systat SoftwareInc, Richmond, California, USA).
Statistical significance of functional groups was assessedusing non-parametric Kruskal-Wallis tests and Dunn'sMultiple Comparison [20] tests (alpha = 0.2), afterrandomly sampling three hundred sequences from eachgroup, and from the total population to form the samplesets.
Table 2: COGs conserved in the acidic cluster of the multimodal distribution. P(a) and P(b) are the frequency of occurance in the acidic and basic clusters respectively, F is the function group. The COGs are listed with their P(v) which is score of their variability between the acidic and basic clusters of the pI distribution weighted by their frequency of occurance across all genomes in the dataset. pI values of four organisms – the extremophiles Buchnera (environment bacteriocyte), Halobacterium (highly acidic – high salt), and E. coli and H. pylori – intestinal bacteria with different environmental pH.
COGs with pI conserved in Acidic Cluster
COG P(a) P(b) P(v) F Role Hbs Eco Hpy Buc
COG2890 0.80 0.18 0.35 J Predicted rRNA or tRNA methylase 4.23 4.99 5.61 9.38COG0021 0.81 0.00 0.05 G Transketolase - 5.61 6.23 7.98COG0215 0.82 0.11 0.24 J Cysteinyl-tRNA synthetase 4.47 5.29 5.88 9.33COG0016 0.82 0.14 0.32 J Phenylalanyl-tRNA synthetase alpha subunit 4.14 5.71 6.35 9.51COG0449 0.82 0.04 0.08 M Glucosamine 6-phosphate synthetase, contains amidotransferase and
phosphosugar isomerase5.08 5.52 6.05 9.52
COG0206 0.82 0.08 0.16 D Cell division GTPase 4.35 4.63 5.26 5.08COG0436 0.82 0.04 0.10 E PLP-dependent aminotransferases 4.41 6.15 7.41 -COG0468 0.83 0.15 0.31 L RecA/RadA recombinase 4.44 5.06 5.47 -COG0125 0.83 0.17 0.35 F Thymidylate kinase 4.32 5.26 8.97 10.01COG0084 0.84 0.03 0.09 L Mg-dependent DNase - 5.44 5.43 8.81COG0504 0.84 0.07 0.18 F CTP synthase (UTP-ammonia lyase) 4.47 5.58 7.55 9.01COG0495 0.84 0.11 0.27 J Leucyl-tRNA synthetase 4.18 5.14 7.51 9.53COG0124 0.86 0.12 0.27 J Histidyl-tRNA synthetase 4.29 5.57 5.54 9.28COG0443 0.86 0.02 0.04 O Molecular chaperone 3.95 5.08 5.02 7.44COG0024 0.86 0.08 0.22 J Methionine aminopeptidase 4.05 5.55 5.89 8.70COG0209 0.87 0.03 0.10 F Ribonucleotide reductase alpha subunit 4.39 5.89 5.73 9.11COG0142 0.87 0.06 0.13 H Geranylgeranyl pyrophosphate synthase 4.31 4.96 5.94 9.58COG0441 0.88 0.10 0.23 J Threonyl-tRNA synthetase 4.35 5.76 5.93 8.86COG0112 0.88 0.10 0.19 E Glycine hydroxymethyltransferase 4.30 5.95 6.41 9.22COG0525 0.88 0.12 0.23 J Valyl-tRNA synthetase 4.09 5.19 6.12 9.38COG0060 0.89 0.11 0.23 J Isoleucyl-tRNA synthetase 4.13 5.63 6.15 9.22COG0073 0.89 0.08 0.19 R EMAP domain 4.04 5.29 5.42 8.90COG0172 0.89 0.09 0.21 J Seryl-tRNA synthetase 4.60 5.30 6.70 9.42COG0018 0.89 0.09 0.20 J Arginyl-tRNA synthetase 4.18 5.29 5.94 9.72COG0143 0.89 0.09 0.20 J Methionyl-tRNA synthetase 4.16 5.39 6.00 9.27COG1109 0.89 0.09 0.21 G Phosphomannomutase 4.43 5.55 6.18 9.03COG0006 0.90 0.04 0.11 E Xaa-Pro aminopeptidase 4.42 5.35 5.73 -COG0442 0.91 0.09 0.18 J Prolyl-tRNA synthetase 4.45 5.11 5.90 9.51COG0126 0.91 0.07 0.14 G 3-phosphoglycerate kinase 4.29 5.06 6.18 9.37COG0012 0.91 0.09 0.17 R Predicted GTPase 4.15 4.86 5.50 9.07COG0149 0.91 0.02 0.09 G Triosephosphate isomerase 4.15 5.55 7.58 9.23COG0492 0.92 0.08 0.16 O Thioredoxin reductase 4.27 5.24 6.02 9.36COG0072 0.93 0.07 0.14 J Phenylalanyl-tRNA synthetase beta subunit 4.33 5.26 6.63 8.30COG0085 0.94 0.02 0.08 K DNA-directed RNA polymerase beta subunit/140 kD subunit (split gene in
Mjan, Mthe, Aful)4.77 5.14 6.14 7.81
COG0231 0.94 0.02 0.08 J Translation elongation factor P/translation initiation factor eIF-5A 4.78 5.28 5.34 9.40COG0459 0.95 0.01 0.04 O Chaperonin GroEL (HSP60 family) 4.16 4.84 5.51 5.04COG0013 0.95 0.05 0.09 J Alanyl-tRNA synthetase 4.29 5.51 5.96 9.42COG0592 0.96 0.04 0.09 L DNA polymerase sliding clamp subunit (PCNA homolog) 3.97 5.20 5.45 8.93COG0202 0.98 0.02 0.05 K DNA-directed RNA polymerase alpha subunit/40 kD subunit 4.11 4.95 4.95 5.03COG0148 0.98 0.00 0.00 G Enolase 4.38 5.28 5.42 6.93COG0480 0.99 0.01 0.03 J Translation elongation and release factors (GTPases) 4.41 5.41 5.23 7.61
Page 9 of 12(page number not for citation purposes)

BMC Genomics 2005, 6:116 http://www.biomedcentral.com/1471-2164/6/116
To score the COGs both for variation and conservation,probabilities were estimated from frequencies in the data-set. The frequency of occurance of a COG i, F(i), calcu-lated as
Where no is the number of organisms in which the COGis present and nt is the number of organisms in the sampledataset (42).
where i is the cog, j is the cluster – either acidic, neutral orbasic, and r the range corresponding to the cluster – 0–7.4for acidic, 7.4–8.1 for basic, and 7.4–14 for basic. nr is thenumber of proteins in the given cluster, ni total number ofproteins corresponding to i. Pi (j) is the conservation scorefor the cluster j, and is the joint probabiity of conservationand occurance of the COG i.
Table 3: COGs conserved in the Basic cluster of the multimodal distribution. Table headers are the same as in Table 2.
COGs with pI conserved in Basic Cluster
COG P(a) P(b) P(v) F Role Hbs Eco Hpy Buc
COG0101 0.11 0.82 0.27 J Pseudouridylate synthase (tRNA psi55) 5.52 8.68 9.74 9.66COG0582 0.05 0.83 0.12 L Integrase 5.31 9.70 9.61 -COG0080 0.15 0.85 0.30 J Ribosomal protein L11 3.72 9.64 9.55 10.01COG0477 0.09 0.87 0.20 E Permeases of the major facilitator superfamily 6.54 9.32 9.14 9.65COG0477 0.09 0.87 0.20 E Permeases of the major facilitator superfamily 6.54 9.32 9.14 9.65COG0477 0.09 0.87 0.20 E Permeases of the major facilitator superfamily 6.54 9.32 9.14 9.65COG0477 0.09 0.87 0.20 E Permeases of the major facilitator superfamily 6.54 9.32 9.14 9.65COG0541 0.07 0.88 0.19 N Signal recognition particle GTPase 4.27 9.52 9.40 9.82COG0255 0.09 0.89 0.21 J Ribosomal protein L29 4.69 9.98 9.70 10.45COG0092 0.07 0.93 0.14 J Ribosomal protein S3 3.87 10.27 10.25 10.40COG0198 0.07 0.93 0.14 J Ribosomal protein L24 4.37 10.21 9.86 10.57COG0051 0.04 0.93 0.11 J Ribosomal protein S10 5.15 9.68 9.30 9.85COG0089 0.02 0.95 0.07 J Ribosomal protein L23 4.13 9.94 10.00 10.00COG0256 0.05 0.95 0.09 J Ribosomal protein L18 5.13 10.42 10.16 10.94COG0087 0.02 0.98 0.05 J Ribosomal protein L3 5.57 9.90 10.24 10.60COG0088 0.02 0.98 0.05 J Ribosomal protein L4 4.83 9.72 9.43 10.19COG0091 0.02 0.98 0.05 J Ribosomal protein L22 5.08 10.23 11.26 10.85COG0098 0.02 0.98 0.05 J Ribosomal protein S5 4.92 10.11 9.90 10.51COG0185 0.02 0.98 0.05 J Ribosomal protein S19 5.20 10.52 10.36 10.73COG0200 0.02 0.98 0.05 J Ribosomal protein L15 4.85 11.19 10.52 11.62COG0201 0.02 0.98 0.05 N Preprotein translocase subunit SecY 5.56 9.89 9.87 9.72COG0049 0.02 0.98 0.04 J Ribosomal protein S7 5.51 10.37 10.17 10.33COG0081 0.02 0.98 0.04 J Ribosomal protein L1 4.13 9.64 9.61 9.86COG0094 0.02 0.98 0.04 J Ribosomal protein L5 4.66 9.49 9.74 9.89COG0096 0.02 0.98 0.04 J Ribosomal protein S8 4.85 9.44 9.79 9.74COG0097 0.02 0.98 0.04 J Ribosomal protein L6 4.20 9.71 9.77 10.07COG0099 0.02 0.98 0.04 J Ribosomal protein S13 4.52 10.78 10.23 10.54COG0100 0.02 0.98 0.04 J Ribosomal protein S11 5.72 11.33 10.33 11.18COG0102 0.02 0.98 0.04 J Ribosomal protein L13 4.50 9.91 9.82 9.93COG0184 0.02 0.98 0.04 J Ribosomal protein S15P/S13E 4.83 10.40 10.00 10.17COG0186 0.02 0.98 0.04 J Ribosomal protein S17 4.75 9.64 10.01 10.14COG0522 0.02 0.98 0.04 J Ribosomal protein S4 and related proteins 4.81 10.05 10.08 10.00COG0199 0.02 0.98 0.04 J Ribosomal protein S14 5.86 11.16 11.01 11.38COG0048 0.00 1.00 0.00 J Ribosomal protein S12 9.91 10.88 10.70 11.09COG0090 0.00 1.00 0.00 J Ribosomal protein L2 9.51 10.93 10.36 10.77COG0093 0.00 1.00 0.00 J Ribosomal protein L14 9.60 10.43 10.45 10.43COG0103 0.00 1.00 0.00 J Ribosomal protein S9 9.39 10.94 10.70 11.40COG0197 0.00 1.00 0.00 J Ribosomal protein L16/L10E 9.28 11.23 10.44 10.88
F in
no
t( ) .=
P jn
nF ii
r
i( ) ( ( ))=
⋅
Page 10 of 12(page number not for citation purposes)

BMC Genomics 2005, 6:116 http://www.biomedcentral.com/1471-2164/6/116
Table 4: Highly occuring COGs with pI varying across both the acidic and basic clusters. Table headers are the same as in Table 2.
COG P(a) P(b) P(v) F Role Hbs Eco Hpy Buc
COG0760 0.29 0.31 0.60 O Parvulin-like peptidyl-prolyl isomerase - 6.83 9.04 9.65COG0725 0.31 0.29 0.60 P ABC-type molybdate transport system, periplasmic component 4.90 7.53 9.70 -COG0042 0.44 0.25 0.60 R Predicted TIM-barrel enzymes, possibly dehydrogenases, nifR3 family 4.82 6.04 9.20 -COG0275 0.28 0.46 0.60 M Predicted S-adenosylmethionine-dependent methyltransferase - 5.92 8.99 9.93COG0258 0.69 0.30 0.61 L 5'-3' exonuclease (including N-terminal domain of PolI) 4.06 5.74 9.06 9.59COG0640 0.38 0.28 0.61 K Predicted transcriptional regulators 4.49 8.48 - -COG0444 0.37 0.27 0.61 E ABC-type dipeptide/oligopeptide/nickel transport system, ATPase componen 4.36 6.64 8.29 -COG0009 0.61 0.30 0.61 J Putative translation factor (SUA5) 4.43 5.36 - 9.52COG0226 0.39 0.30 0.62 P ABC-type phosphate transport system, periplasmic component 4.04 8.37 - -COG1475 0.41 0.26 0.62 K Predicted transcriptional regulators 4.46 6.78 8.39 -COG0190 0.51 0.30 0.62 H 5,10-methylene-tetrahydrofolate dehydrogenase/Methenyl tetrahydrofolate
cyclohydrolase4.36 5.61 8.74 9.70
COG1057 0.31 0.33 0.62 H Nicotinic acid mononucleotide adenylyltransferase - 5.38 8.80 9.68COG0482 0.42 0.28 0.62 J Predicted tRNA methyltransferase, contains the PP-loop ATPase domain - 4.89 8.82 9.50COG1121 0.29 0.35 0.62 P ABC-type Mn/Zn transport systems, ATPase component 4.61 9.44 - 9.21COG0359 0.31 0.48 0.62 J Ribosomal protein L9 - 5.82 8.80 10.29COG0858 0.46 0.29 0.62 J Ribosome-binding factor A - 5.58 7.55 9.88COG0356 0.30 0.25 0.62 C F0F1-type ATP synthase a subunit - 6.18 6.34 7.64COG0501 0.29 0.41 0.63 O Zn-dependent protease with chaperone function 7.18 7.10 7.86 6.91COG0350 0.31 0.46 0.64 L Methylated DNA-protein cysteine methyltransferase 5.67 7.13 9.38 -COG1136 0.53 0.29 0.64 R ABC-type transport systems, involved in lipoprotein release, ATPase
components6.85 6.66 9.03 7.53
COG0816 0.26 0.36 0.64 L Predicted endonuclease involved in recombination - 6.21 9.05 9.81COG1159 0.36 0.26 0.64 R GTPases - 6.54 8.86 9.78COG0712 0.31 0.29 0.65 C F0F1-type ATP synthase delta subunit (mitochondrial oligomycin sensitivity
protein)- 4.92 7.56 9.83
COG1160 0.33 0.46 0.65 R Predicted GTPases - 5.62 9.15 9.92COG0463 0.31 0.55 0.66 M Glycosyltransferases involved in cell wall biogenesis 4.80 8.55 8.87 -COG0324 0.34 0.30 0.66 J tRNA delta(2)-isopentenylpyrophosphate transferase - 5.58 9.56 9.58COG0617 0.32 0.36 0.66 J tRNA nucleotidyltransferase/poly(A) polymerase - 7.84 9.14 9.35COG1385 0.35 0.32 0.67 S Uncharacterized BCR - 6.80 9.08 9.71COG1825 0.34 0.34 0.67 J Ribosomal protein L25 (general stress protein Ctc) - 9.60 9.41 9.91COG0358 0.63 0.30 0.67 L DNA primase (bacterial type) 4.35 5.62 8.97 9.48COG0593 0.42 0.32 0.69 L ATPase involved in DNA replication initiation - 6.97 8.35 9.55COG0052 0.64 0.33 0.69 J Ribosomal protein S2 4.06 6.38 6.82 9.61COG0616 0.49 0.32 0.69 N Periplasmic serine proteases (ClpP class) 4.93 7.44 9.41 9.66COG0212 0.39 0.35 0.70 H 5-formyltetrahydrofolate cyclo-ligase 4.42 6.10 9.98 -COG0470 0.59 0.34 0.70 L ATPase involved in DNA replication 4.47 6.46 8.70 9.39COG1132 0.33 0.44 0.70 Q ABC-type multidrug/protein/lipid transport system, ATPase component 4.43 6.91 9.23 9.60COG0750 0.33 0.52 0.71 M Predicted membrane-associated Zn-dependent proteases 1 4.91 6.41 9.18 -COG0341 0.36 0.40 0.71 N Preprotein translocase subunit SecF 4.53 5.46 8.73 -COG0475 0.35 0.32 0.71 P Kef-type K+ transport systems, membrane components - 5.13 9.12 -COG0566 0.43 0.35 0.72 J rRNA methylases - 7.15 9.18 -COG0438 0.35 0.46 0.73 M Predicted glycosyltransferases 4.96 8.21 8.66 -COG0223 0.43 0.36 0.73 J Methionyl-tRNA formyltransferase - 6.01 8.87 9.80COG0237 0.60 0.36 0.74 H Dephospho-CoA kinase 1 4.59 5.64 8.91 10.26COG0668 0.36 0.42 0.76 M Small-conductance mechanosensitive channel 5.29 7.56 8.87 9.50COG0532 0.57 0.34 0.77 J Translation initiation factor 2 (GTPase) 4.33 5.76 6.93 9.38COG0484 0.35 0.41 0.82 O Molecular chaperones (contain C-terminal Zn finger domain) 4.54 7.94 8.12 9.17COG0164 0.39 0.44 0.83 L Ribonuclease H 4.41 6.91 8.95 -COG0020 0.38 0.47 0.85 I Undecaprenyl pyrophosphate synthase 5.11 6.29 8.97 9.45COG0681 0.41 0.49 0.86 N Signal peptidase 4.99 6.46 8.34 9.51COG0244 0.40 0.53 0.87 J Ribosomal protein L10 3.80 9.04 9.36 9.98COG0130 0.45 0.43 0.88 J Pseudouridine synthase 5.37 5.59 - 9.74
Mean 4.76 6.64 8.75 9.47Standard Deviation 0.7 1.14 0.73 0.69
Page 11 of 12(page number not for citation purposes)

BMC Genomics 2005, 6:116 http://www.biomedcentral.com/1471-2164/6/116
We estimate the joint probability of variation between theacidic and basic clusters for a COG i, Pi(v), as the proba-bility of variation into its frequency of occurance calcu-lated as
where na and nb are the number of proteins belonging tothe COG i in the acidic and basic cluster of the distribu-tion respectively, ni being the total number of proteinsclassified under COG i .
Membrane proteins were predicted using TOPPRED [21].
Authors' contributionsMr Soumyadeep Nandi did all computation and databasework, Mr. Nipun Mehra started this work, and generatedpreliminary results, Dr. Andrew Lynn guided the imple-mentation of the project and wrote the manuscript, Prof.Alok Bhattacharya provided overall guidance and inter-pretation of results.
Additional material
AcknowledgementsThe authors thank Department of Biotechnology, Government of India for financial support.
References1. Bjellqvist B, Hughes GJ, Pasquali C, Paquet N, Ravier F, Sanchez JC,
Frutiger S, Hochstrasser D: The focusing positions of polypep-tides in immobilized pH gradients can be predicted fromtheir amino acid sequences. Electrophoresis 1993,14(10):1023-31.
2. Altland K, Becher P, Rossmann U, Bjellqvist B: Isoelectric focusingof basic proteins: the problem of oxidation of cysteines. Elec-trophoresis 1988, 9(9):474-85.
3. Van Bogelen RA, Schiller EE, Thomas JD, Neidhardt FC: Diagnosisof cellular states of microbial organisms using proteomics.Electrophoresis 1999, 20:2149-2159.
4. Schwartz R, Ting CS, King J: Whole proteome pI values corre-late with subcellular localization of proteins for organismswithin the three domains of life. Genome Res 2001, 11:703-709.
5. Weiller GF, Caraux G, Sylvester N: The modal distribution ofprotein isoelectric points reflects amino acid propertiesrather than sequence evolution. Proteomics 2004, 4(4):943-9.
6. Knight CG, Kassen R, Hebestreit H, Rainey PB: Global analysis ofpredicted proteomes: functional adaptation of physicalproperties. Proc Natl Acad Sci U S A 2004, 101(22):8390-5.
7. Brocchieri L: Environmental signatures in proteomeproperties. Proc Natl Acad Sci 2004, 101(22):8257-8258.
8. Tekaia F, Yeramian E, Dujon B: Amino acid composition ofgenomes, lifestyles of organisms, and evolutionary trends: aglobal picture with correspondence analysis. Gene 2002,297(1–2):51-60.
9. Kennedy SP, Ng WV, Salzberg SL, Hood L, DasSarma S: Under-standing the adaptation of Halobacterium species NRC-1 toits extreme environment through computational analysis ofits genome sequence. Genome Res 2001, 11(10):1641-50.
10. Karlin S, Brocchieri L, Trent J, Blaisdell BE, Mrazek J: Heterogeneityof genome and proteome content in bacteria, archaea, andeukaryotes. Theor Popul Biol 2002, 61(4):367-90.
11. Kumar S, Nussinov R: How do thermophilic proteins deal withheat? Cell Mol Life Sci 2001, 58(9):1216-33.
12. Tatusov RL, Koonin EV, Lipman DJ: A Genomics Perspactive onProtein Families. Science 1997, 278(5338):631-7.
13. Tatusov RL, Fedorova ND, Jackson JD, Jacobs AR, Kiryutin B, KooninEV, Krylov DM, Mazumder R, Mekhedov SL, Nikolskaya AN, Rao BS,Smirnov S, Sverdlov AV, Vasudevan S, Wolf YI, Yin JJ, Natale DA: TheCOG database: an updated version includes eukaryotes.BMC Bioinformatics 2003, 4(1):41.
14. Kruskal WH, Wallis WA: Use of ranks in one-criterion varianceanalysis. Journal of the American Statistical Association 1952,47:583-621. Addendum 1953, 48:907–911
15. FTP sites for COG and Genome data used in this analysis. .[ftp://ftp.ncbi.nih.gov/pub/COG/] and [ftp://ftp.ncbi.nih.gov/genomes]
16. Compute pI/MW tool at ExPASy proteomics server of theSwiss Institute of Bioinformatics [http://www.expasy.org/tools/pi_tool.html]
17. Thompson JD, Higgins DG, Gibson TJ: CLUSTAL W: improvingthe sensitivity of progressive multiple sequence alignmentthrough sequence weighting, position-specific gap penaltiesand weight matrix choice. Nucleic Acids Research 1994,22(22):4673-4680.
18. Felsenstein J: PHYLIP: Phylogeny inference package. Cladistics1989, 5:164-166.
19. Stajich JE, Block D, Boulez K, Brenner SE, Chervitz SA, Dagdigian C,Fuellen G, Gilbert JGR, Korf I, Lapp H, Lehväslaiho H, Matsalla C,Mungall CJ, Osborne BI, Pocock MR, Schattner P, Senger M, Stein LD,Stupka E, Wilkinson MD, Birney E: The Bioperl Toolkit: PerlModules for the Life Sciences. Genome Research 2002,12(10):1611-1618.
20. Dunn DJ: Multiple Comparisons Using Rank Sums. Technomet-rics 1964, 5:241-252.
21. Claros MG, von Heijne G: TopPred II: an improved software formembrane protein structure predictions. Comput Appl Biosci1994.
22. COG help file showing functional categories of orthologs[http://www.ncbi.nlm.nih.gov/COG/old/COGhelp.html#function_code]
Additional file 1List of COGS sorted by mean pI. File with rows containing COG, mean, standard deviation and pI of individual ortholog proteins that were used in the calculation described in this paper. The rows are sorted by mean pI (column 2) and used to plot figure 5 of the manuscript. The file is tab-delimited and will open in any spreadsheet program.Click here for file[http://www.biomedcentral.com/content/supplementary/1471-2164-6-116-S1.CSV]
Additional file 2COGs with pI conserved in acid and basic clusters. Text file containing the comprehensive list of COGs which are conserved in either the acidic or basic cluster of the multimodal distribution.Click here for file[http://www.biomedcentral.com/content/supplementary/1471-2164-6-116-S2.txt]
P vn n
nF ii
a b
i( ) ( ( ))= −
−
⋅1
Page 12 of 12(page number not for citation purposes)
http://www.ncbi.nlm.nih.gov/entrez/query.fcgi?cmd=Retrieve&db=PubMed&dopt=Abstract&list_uids=8125050
http://www.ncbi.nlm.nih.gov/entrez/query.fcgi?cmd=Retrieve&db=PubMed&dopt=Abstract&list_uids=8125050
http://www.ncbi.nlm.nih.gov/entrez/query.fcgi?cmd=Retrieve&db=PubMed&dopt=Abstract&list_uids=8125050
http://www.ncbi.nlm.nih.gov/entrez/query.fcgi?cmd=Retrieve&db=PubMed&dopt=Abstract&list_uids=3243245
http://www.ncbi.nlm.nih.gov/entrez/query.fcgi?cmd=Retrieve&db=PubMed&dopt=Abstract&list_uids=3243245
http://www.ncbi.nlm.nih.gov/entrez/query.fcgi?cmd=Retrieve&db=PubMed&dopt=Abstract&list_uids=9381173
http://www.ncbi.nlm.nih.gov/entrez/query.fcgi?cmd=Retrieve&db=PubMed&dopt=Abstract&list_uids=9381173
http://www.ncbi.nlm.nih.gov/entrez/query.fcgi?cmd=Retrieve&db=PubMed&dopt=Abstract&list_uids=7984417
http://www.ncbi.nlm.nih.gov/entrez/query.fcgi?cmd=Retrieve&db=PubMed&dopt=Abstract&list_uids=7984417
http://www.ncbi.nlm.nih.gov/entrez/query.fcgi?cmd=Retrieve&db=PubMed&dopt=Abstract&list_uids=7984417
http://www.ncbi.nlm.nih.gov/entrez/query.fcgi?cmd=Retrieve&db=PubMed&dopt=Abstract&list_uids=7704669