HIV-1 Replication and the Cellular Eukaryotic Translation Apparatus
Upload
independentCategory
view
0download
0
Disordered Patterns in Clustered Protein Data Bank andin Eukaryotic and Bacterial ProteomesMichail Yu. Lobanov, Oxana V. Galzitskaya*
Group of Bioinformatics, Institute of Protein Research Russian Academy of Sciences, Pushchino, Moscow Region, Russia
Abstract
We have constructed the clustered Protein Data Bank and obtained clusters of chains of different identity inside eachcluster, http://bioinfo.protres.ru/st_pdb/. We have compiled the largest database of disordered patterns (141) from theclustered PDB where identity between chains inside of a cluster is larger or equal to 75% (version of 28 June 2010) by usingsimple rules of selection. The results of these analyses would help to further our understanding of the physicochemical andstructural determinants of intrinsically disordered regions that serve as molecular recognition elements. We have analyzedthe occurrence of the selected patterns in 97 eukaryotic and in 26 bacterial proteomes. The disordered patterns appearmore often in eukaryotic than in bacterial proteomes. The matrix of correlation coefficients between numbers of proteinswhere a disordered pattern from the library of 141 disordered patterns appears at least once in 9 kingdoms of eukaryotaand 5 phyla of bacteria have been calculated. As a rule, the correlation coefficients are higher inside of the consideredkingdom than between them. The patterns with the frequent occurrence in proteomes have low complexity (PPPPP,GGGGG, EEEED, HHHH, KKKKK, SSTSS, QQQQQP), and the type of patterns vary across different proteomes, http://bioinfo.protres.ru/fp/search_new_pattern.html.
Citation: Lobanov MY, Galzitskaya OV (2011) Disordered Patterns in Clustered Protein Data Bank and in Eukaryotic and Bacterial Proteomes. PLoS ONE 6(11):e27142. doi:10.1371/journal.pone.0027142
Editor: Niall James Haslam, University College Dublin, Ireland
Received June 28, 2011; Accepted October 11, 2011; Published November 4, 2011
Copyright: � 2011 Lobanov, Galzitskaya. This is an open-access article distributed under the terms of the Creative Commons Attribution License, which permitsunrestricted use, distribution, and reproduction in any medium, provided the original author and source are credited.
Funding: The work was supported by the Russian Foundation for Basic Research (grant Nº- 11-04-00763), Russian Academy of Sciences (programs ‘‘Molecular andCell Biology’’ (01200959110) and ‘‘Fundamental Sciences to Medicine’’), as well as a grant from the Federal Agency for Science and Innovations (#02.740.11.0295)and a grant from the Federal Agency for Science and Innovations (Nº-16.512.11.2204). The funders had no role in study design, data collection and analysis,decision to publish, or preparation of the manuscript.
Competing Interests: The authors have declared that no competing interests exist.
* E-mail: [email protected]
Introduction
Intrinsically disordered regions serve as molecular recognition
elements, and play an important role in the control of many
cellular processes and signaling pathways [1–6]. It is useful to be
able to predict positions of disordered regions in protein chains.
Prediction methods are aimed at identifying disordered regions
through the analysis of amino acid sequences using mainly the
physicochemical properties of amino acids [7–16] or evolutionary
conservation [17–20].
Many examples of proteins with intrinsically disordered regions
which exhibit coupling between folding and binding have been
described in the literature [4–6,21–23]. Nevertheless, the univer-
sality of this phenomenon and functional importance of many
disordered regions remain unclear.
A database of continuous protein fragments (Molecular
Recognition Features or MORFs) was compiled from the Protein
Data Bank which includes short protein chains (with fewer than 70
residues) bound to larger proteins [24,25]. It has been argued that
MORFs participate in the coupling of binding and folding, a
hypothesis that was supported by the analysis of the composition
and predicted disorder of MORF segments. As a result of studying
the subtle structural differences of the same proteins in bound
(Complex) and unbound (Single) states in relation to their intrinsic
disorder the database of protein structures (ComSin) has been
constructed [26].
Recently several computational tools for identifying Linear
motifs [27] and minimotifs in protein-protein interactions [28]
have been published. Linear motifs are short segments of multi-
domain proteins that provide regulatory functions independently
of protein tertiary structure [27] but minimotifs are short
functional peptide sequences obtained after analysis of known
protein-protein interactions [28].
Low-complexity regions attract our attention since they are
regions of a protein in which a particular amino acid, or a small
number of different amino acids, are enriched. Single amino acid
repeats (homorepeats) belong to these regions. It turned out that
homorepeats play important roles in some biological process [29]
and may play a more important role in human diseases than it was
previously recognized.
In the current study we search for sequence patterns consisting
of a number of consecutive residues along the polypeptide chain
that are nearly always associated with disordered segments. It has
been found that two types of patterns appear to be recurrent: a
proline-rich pattern and a positively or negatively charged pattern
[30]. It should be noted that the old and new versions of our libraries
include patterns enriched by proline and charged residues [31].
The statistical analysis of disordered residues was done
considering 34 464 unique protein chains taken from the PDB
database. In this database, 4.95% of residues are disordered (i.e.
invisible in X-ray structures) [31]. The statistics was obtained
separately for the N- and C-termini as well as for the central part of
the protein chain. It has been shown that frequencies of occurrence
of disordered residues of 20 types at the termini of protein chains
differ from the ones in the middle part of the protein chain [31,32].
PLoS ONE | www.plosone.org 1 November 2011 | Volume 6 | Issue 11 | e27142

It is necessary to construct a clustered PDB because this
simplifies the filtering process of protein structures under their
analysis and searches general structural characteristics among non-
identical proteins. It is necessary to construct a clustered PDB
which is important for the analysis of actualized data.
In this work we constructed a clustered PDB and used clusters of
protein chains where identity between chains inside of the cluster
exceeds 75% (version of 28 June 2010). Combining the motif
discovery and disorder protein segment identification in the
clustered PDB allows us to create the largest library of disordered
patterns [31]. At present the library includes 141 disordered
patterns. Such an approach is new and promising for further
studying and understanding the functional role of the obtained
patterns in different proteomes. Taking into consideration the
library of disordered patterns will help one improve accuracies of
predictions for residues to be structured or unstructured inside the
given region. The previous version of the library includes 109
disordered patterns and has restrictions on the minimal length of the
patterns. Using more simple rules without restriction on the pattern
length and clustered PDB of the same version we constructed the
largest library of disordered patterns.
The patterns occur more often as short fragments. Patterns of
four-six residues long occur more frequently (105 out of 141) among
the disordered patterns of the library. It should be noted that six
residue patches affect the folding/aggregation features of proteins,
and they are important ‘‘words’’ for the understanding of protein
dynamics [33]. Moreover, nucleation sites are constrained by patches
of approximately six residues [34,35]. There is evidence that the
minimum length necessary for a peptide to elicit an allergenic
response and molecular mimicry (a patch of a protein eliciting an
immune response equivalent to the entire protein) is about six [36].
All these facts suggest the existence of a fragment of biologically
meaningful information located along approximately six residues
[33].
With the library of disordered patterns taken into account, it
would be easier to improve accuracy of prediction of ordered/
disordered residues inside the given region.
Proteome-wide calculations are a great way to place our work in a
larger, evolutionary frame. In this paper of interest is the occurrence
of 141 disordered patterns in 97 eukaryotic proteomes, since
eukaryotic proteomes include more disordered regions than other
proteomes [17,37,38], and for comparison, in 26 bacterial pro-
teomes. A comparative analysis of the number of proteins containing
the 141 disordered selected patterns in these proteomes has been
performed. The disordered patterns with the most frequent occur-
rence in eukaryotic and bacterial proteomes have low complexity.
It should be noted that each proteome has a specific set of
disordered patterns, and this results in different correlation coef-
ficients between numbers of proteins where a disordered pattern
appears at least one time. We came to some important observations
of a higher correlation coefficient within a kingdom or a phylum
than across kingdoms or phyla after analysis of occurrence of dis-
ordered patterns in 123 proteomes. The disordered patterns appear
more often in eukaryotic than in bacterial proteomes. One can sug-
gest that such short similar motifs are responsible for common func-
tions for nonhomologous, unrelated proteins from different organisms.
Materials and Methods
Construction of clustered PDBWe have considered all protein structures determined by X-ray
analysis with a resolution better than 3 A, and the size of protein is
larger than or equal to 40 amino acid residues, published in the
PDB (version of June 28, 2010); the structures contain 116 997
protein chains (51 048 PDB entries). At the first step these 116 997
chains can be divided into 34 464 classes. We call these classes as
clusters with 100% identity. This means that the chains from the
same cluster have the same amino acid sequences, the sequences of
chains from different classes are different i.e. they differ at least at
one position. In total these 34 464 different sequences contain
9 085 893 residues. At the second step we created clusters of
chains with identity inside each cluster $75%.
Identity is calculated by using equation:
Id~I
L1zL2{I|100% ð1Þ
where I is the number of identical residues, L1 and L2 are the
numbers of amino acid residues in each considered protein. For
calculation of Identity we used BLAST with default parameters
[39].
At the beginning a pair of chains with maximal identity was
combined, then another pair of chains or a chain with the cluster
again with maximal identity, etc. If the combining of a chain with
the cluster or combining of clusters occurred, then the average
identity of gathering was considered. If identity of at least a pair of
chains from different clusters was less than 75%, then the clusters
were not combined. The procedure was repeated until there were
clusters which could be combined. At the second step of grouping
of chains, we obtained 18775 clusters of chains with identity inside
each cluster $75%. Then the clusters C75 have been combined
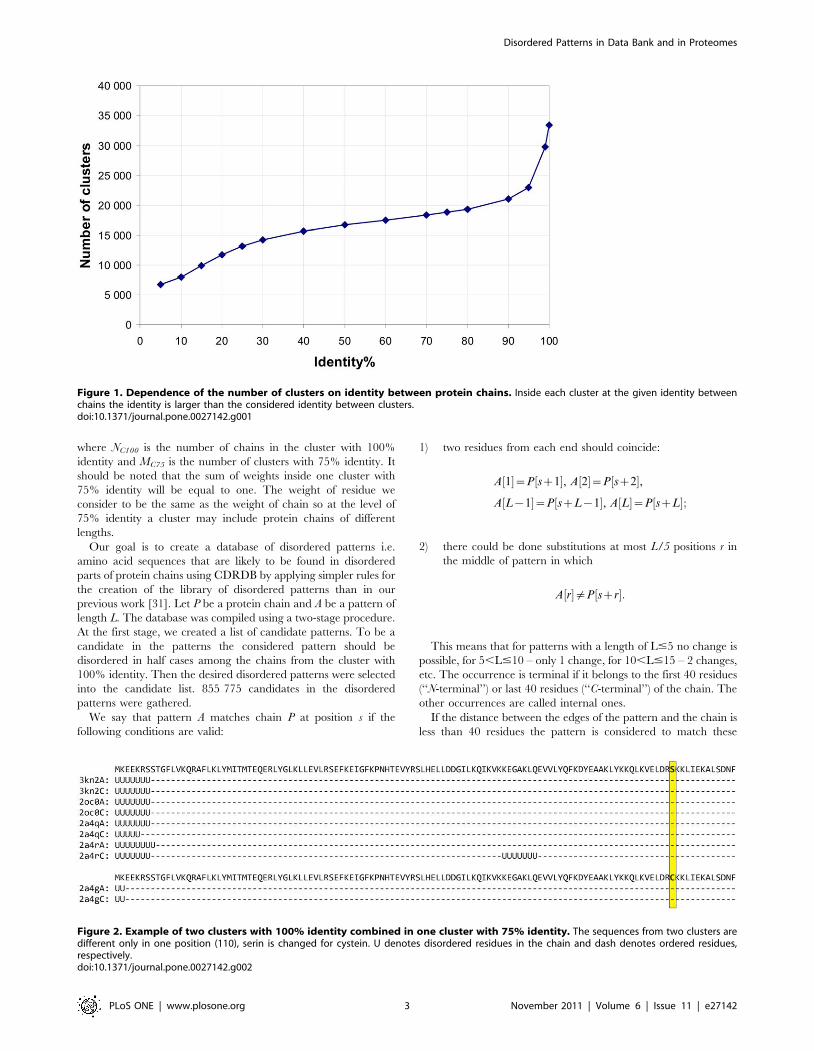
into clusters with identity Id$50%, etc. Figure 1 demonstrates the
dependence of the number of clusters on identity between chains
inside the cluster. Further we consider the identity of 75% because
the general grouping has occurred below 90% identity.
Construction of the library of disordered patternsAmong 116 997 chains, approximately 4.5% of their residues
are disordered, i.e. are not resolved by X-ray analysis. To reveal
such residues, we compared (for each protein chain) records
SEQRES and records ATOM in the corresponding PDB-file.
Residues which were present in record SEQRES, but their
coordinates were absent in record ATOM (namely, the coordi-
nates of the Ca-atom were absent in record ATOM), were
considered as unstructured ones. We considered the residues as
disordered if there were not coordinates of Ca atoms.
Below we consider only clusters with $75% identities between
any pair of chains inside each cluster because the general grouping
has occurred below 90% identity. Considering this level of
identity, we have created the Clustered Disordered Residues Data
Base (CDRDB), its elements are 18 775 clusters of protein chains.
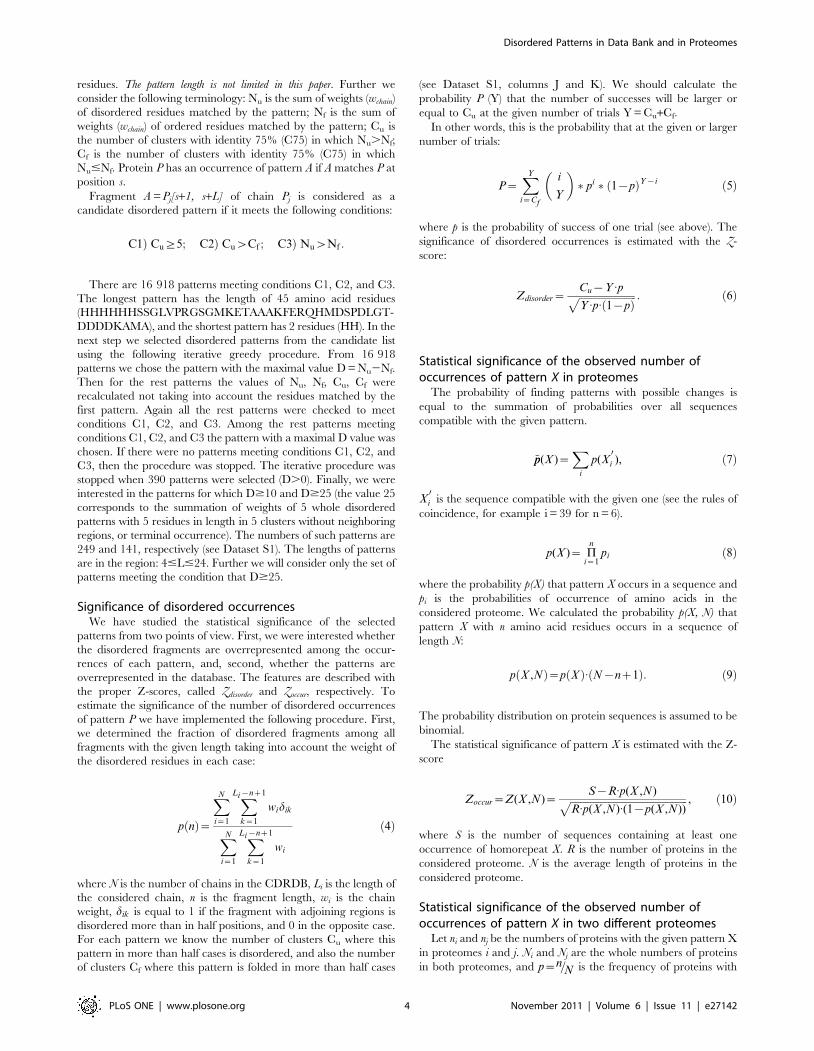
Figure 2 illustrates two clusters with 100% identity combined in
one cluster with 75% identity. One can see that the sequences
from two clusters are different in one position 110, serin is changed
for cystein, and the weight of the chain from the first cluster is
w3kn2A~w2a4rC~1
NC100|MC75
~1
8|2, ð2Þ
and the weight of the chain from the second cluster is
w2a4gA~1
2|2, respectively. Analogously the weight of each chain
from any cluster is calculated by using equation:
wchain~1
NC100|MC75, ð3Þ
Disordered Patterns in Data Bank and in Proteomes
PLoS ONE | www.plosone.org 2 November 2011 | Volume 6 | Issue 11 | e27142
where NC100 is the number of chains in the cluster with 100%
identity and MC75 is the number of clusters with 75% identity. It
should be noted that the sum of weights inside one cluster with
75% identity will be equal to one. The weight of residue we
consider to be the same as the weight of chain so at the level of
75% identity a cluster may include protein chains of different
lengths.
Our goal is to create a database of disordered patterns i.e.
amino acid sequences that are likely to be found in disordered
parts of protein chains using CDRDB by applying simpler rules for
the creation of the library of disordered patterns than in our
previous work [31]. Let P be a protein chain and A be a pattern of
length L. The database was compiled using a two-stage procedure.
At the first stage, we created a list of candidate patterns. To be a
candidate in the patterns the considered pattern should be
disordered in half cases among the chains from the cluster with
100% identity. Then the desired disordered patterns were selected
into the candidate list. 855 775 candidates in the disordered
patterns were gathered.
We say that pattern A matches chain P at position s if the
following conditions are valid:
1) two residues from each end should coincide:
A 1½ �~P sz1½ �, A 2½ �~P sz2½ �,
A L{1½ �~P szL{1½ �, A L½ �~P szL½ �;
2) there could be done substitutions at most L/5 positions r in
the middle of pattern in which
A r½ �=P szr½ �:
This means that for patterns with a length of L#5 no change is
possible, for 5,L#10 – only 1 change, for 10,L#15 – 2 changes,
etc. The occurrence is terminal if it belongs to the first 40 residues
(‘‘N-terminal’’) or last 40 residues (‘‘C-terminal’’) of the chain. The
other occurrences are called internal ones.
If the distance between the edges of the pattern and the chain is
less than 40 residues the pattern is considered to match these
Figure 1. Dependence of the number of clusters on identity between protein chains. Inside each cluster at the given identity betweenchains the identity is larger than the considered identity between clusters.doi:10.1371/journal.pone.0027142.g001
Figure 2. Example of two clusters with 100% identity combined in one cluster with 75% identity. The sequences from two clusters aredifferent only in one position (110), serin is changed for cystein. U denotes disordered residues in the chain and dash denotes ordered residues,respectively.doi:10.1371/journal.pone.0027142.g002
Disordered Patterns in Data Bank and in Proteomes
PLoS ONE | www.plosone.org 3 November 2011 | Volume 6 | Issue 11 | e27142
residues. The pattern length is not limited in this paper. Further we
consider the following terminology: Nu is the sum of weights (wchain)
of disordered residues matched by the pattern; Nf is the sum of
weights (wchain) of ordered residues matched by the pattern; Cu is
the number of clusters with identity 75% (C75) in which Nu.Nf;
Cf is the number of clusters with identity 75% (C75) in which
Nu#Nf. Protein P has an occurrence of pattern A if A matches P at
position s.
Fragment A = Pj[s+1, s+L] of chain Pj is considered as a
candidate disordered pattern if it meets the following conditions:
C1Þ Cu§5; C2Þ CuwCf ; C3Þ NuwNf :
There are 16 918 patterns meeting conditions C1, C2, and C3.
The longest pattern has the length of 45 amino acid residues
(HHHHHHSSGLVPRGSGMKETAAAKFERQHMDSPDLGT-
DDDDKAMA), and the shortest pattern has 2 residues (HH). In the
next step we selected disordered patterns from the candidate list
using the following iterative greedy procedure. From 16 918
patterns we chose the pattern with the maximal value D = Nu2Nf.
Then for the rest patterns the values of Nu, Nf, Cu, Cf were
recalculated not taking into account the residues matched by the
first pattern. Again all the rest patterns were checked to meet
conditions C1, C2, and C3. Among the rest patterns meeting
conditions C1, C2, and C3 the pattern with a maximal D value was
chosen. If there were no patterns meeting conditions C1, C2, and
C3, then the procedure was stopped. The iterative procedure was
stopped when 390 patterns were selected (D.0). Finally, we were
interested in the patterns for which D$10 and D$25 (the value 25
corresponds to the summation of weights of 5 whole disordered
patterns with 5 residues in length in 5 clusters without neighboring
regions, or terminal occurrence). The numbers of such patterns are
249 and 141, respectively (see Dataset S1). The lengths of patterns
are in the region: 4#L#24. Further we will consider only the set of
patterns meeting the condition that D$25.
Significance of disordered occurrencesWe have studied the statistical significance of the selected
patterns from two points of view. First, we were interested whether
the disordered fragments are overrepresented among the occur-
rences of each pattern, and, second, whether the patterns are
overrepresented in the database. The features are described with
the proper Z-scores, called Zdisorder and Zoccur, respectively. To
estimate the significance of the number of disordered occurrences
of pattern P we have implemented the following procedure. First,
we determined the fraction of disordered fragments among all
fragments with the given length taking into account the weight of
the disordered residues in each case:
p nð Þ~
XN
i~1
XLi{nz1
k~1
widik
XN
i~1
XLi{nz1
k~1
wi
ð4Þ
where N is the number of chains in the CDRDB, Li is the length of
the considered chain, n is the fragment length, wi is the chain
weight, dik is equal to 1 if the fragment with adjoining regions is
disordered more than in half positions, and 0 in the opposite case.
For each pattern we know the number of clusters Cu where this
pattern in more than half cases is disordered, and also the number
of clusters Cf where this pattern is folded in more than half cases
(see Dataset S1, columns J and K). We should calculate the
probability P (Y) that the number of successes will be larger or
equal to Cu at the given number of trials Y = Cu+Cf.
In other words, this is the probability that at the given or larger
number of trials:
P~XY
i~Cf
i
Y
� �� pi � 1{pð ÞY{i ð5Þ
where p is the probability of success of one trial (see above). The
significance of disordered occurrences is estimated with the Z-
score:
Zdisorder~Cu{Y :pffiffiffiffiffiffiffiffiffiffiffiffiffiffiffiffiffiffiffiffiffiffiffiY :p: 1{pð Þ
p : ð6Þ
Statistical significance of the observed number ofoccurrences of pattern X in proteomes
The probability of finding patterns with possible changes is
equal to the summation of probabilities over all sequences
compatible with the given pattern.
~pp(X )~X
i
p(X0i ), ð7Þ
X0i is the sequence compatible with the given one (see the rules of
coincidence, for example i = 39 for n = 6).
p(X )~ Pn
i~1pi ð8Þ
where the probability p(X) that pattern X occurs in a sequence and
pi is the probabilities of occurrence of amino acids in the
considered proteome. We calculated the probability p(X, N) that
pattern X with n amino acid residues occurs in a sequence of
length N:
p X ,Nð Þ~p Xð Þ: N{nz1ð Þ: ð9Þ
The probability distribution on protein sequences is assumed to be
binomial.
The statistical significance of pattern X is estimated with the Z-
score
Zoccur~Z(X ,N)~S{R:p(X ,N)ffiffiffiffiffiffiffiffiffiffiffiffiffiffiffiffiffiffiffiffiffiffiffiffiffiffiffiffiffiffiffiffiffiffiffiffiffiffiffiffiffiffiffiffiffiffiffi
R:p(X ,N):(1{p(X ,N))p , ð10Þ
where S is the number of sequences containing at least one
occurrence of homorepeat X. R is the number of proteins in the
considered proteome. N is the average length of proteins in the
considered proteome.
Statistical significance of the observed number ofoccurrences of pattern X in two different proteomes
Let ni and nj be the numbers of proteins with the given pattern X
in proteomes i and j. Ni and Nj are the whole numbers of proteins
in both proteomes, and p~n=N is the frequency of proteins with
Disordered Patterns in Data Bank and in Proteomes
PLoS ONE | www.plosone.org 4 November 2011 | Volume 6 | Issue 11 | e27142

the given pattern. s~ffiffinp
Nis the standard deviation. Li and Lj are the
average length of proteins in the considered proteomes i and j. The
scoring function is:
Zdiff ,ij~
pi=Li{pj
�Ljffiffiffiffiffiffiffiffiffiffiffiffiffiffiffiffiffiffiffiffiffiffiffiffiffiffiffiffiffiffiffiffiffiffiffiffiffiffi
si=Li
� �2
z sj�Lj
� �2r ð11Þ
We consider that the difference is significant if its Z-score exceeds
the proper value with absolute meaning 3 and 5. These values
correspond to the probabilities 3*1023 and 6*1027, respectively.
The correlation coefficient (r) was calculated using the equation:
r~
1
n
Xn
i~1
(xi{�xx)(yi{�yy)
sx sy
ð12Þ
where Sx and Sy are standard deviations for variables x and y.
Database of proteomesWe considered 3279 proteomes from the EBI site (ftp://ftp.ebi.
ac.uk/pub/databases/SPproteomes/uniprot/proteomes/). Since
the patterns with the frequent occurrence in proteomes have low
complexity we did a preliminary analysis. The analysis showed
that the number of proteins with at least one occurrence of
homorepeats of 6 residues long is less than 500 for proteomes with
an overall number of residues below 2500000. Even so, only 22
proteomes out of 3156 have more than 100 proteins with at least
one occurrence of 6-residue homorepeats. The data gave grounds
for our research involving only proteomes with an overall number
of residues exceeding 2500000.
We obtained 123 proteomes taking into account the length of
proteomes representing 9 kingdoms of eukaryotes and 5 phyla of
bacteria (see Table 1 and Dataset S2). Unfortunately, only three
kingdoms of eukaryotes (Metazoa, Viridiplantae, and Fungi) are
given at http://www.ncbi.nlm.nih.gov/Taxonomy/. In other
cases, the rank of kingdom is missing. In such situations, we chose
the highest taxonomic category proceeding from the subkingdom
of eukaryotes instead of the kingdom. We chose 97 out of 120
eukaryotic proteomes, and a small number of bacterial proteomes.
The smallest eukaryotic proteome belongs to Hemiselmis andersenii,
class Cryptophyta. It is evident that 498 proteins with an overall
number of 167452 of amino acid residues are not sufficient for
reliable statistics. Historically, the superkingdom of bacteria is
divided into phyla but not kingdoms. We preferred to consider
such phyla separately.
Among 97 eukaryotic proteomes, 17 belong to the kingdom of
Metazoa or animals: Homo sapiens (51778 protein sequences), Bos
Taurus (18405), Mus musculus (42120), Rattus norvegicus (28166),
Gallus gallus (12954), Danio rerio (21576), and Tetraodon nigroviridis
(27836) belong to Chordata phylum, Drosophila melanogaster (15101),
Drosophila pseudoobscura (16000), Aedes aegypti (16042), Anopheles
darlingi (11437), and Anopheles gambiae (12455) to arthropods, and
Caenorhabditis briggsae (18531), Caenorhabditis elegans (23817), Loa loa
(16271), and Trichinella spiralis (16040) belong to nematodes,
Nematostella vectensis (24435) belongs to cnidaria phylum.
Results and Discussion
Library of disordered patternsFollowing the procedure described in the Materials and
Methods section, we constructed the clustered PDB (CDRDB) at
the level identity of 75% (http://bioinfo.protres.ru/st_pdb/) and
obtained a library of disordered patterns. The dataset includes 141
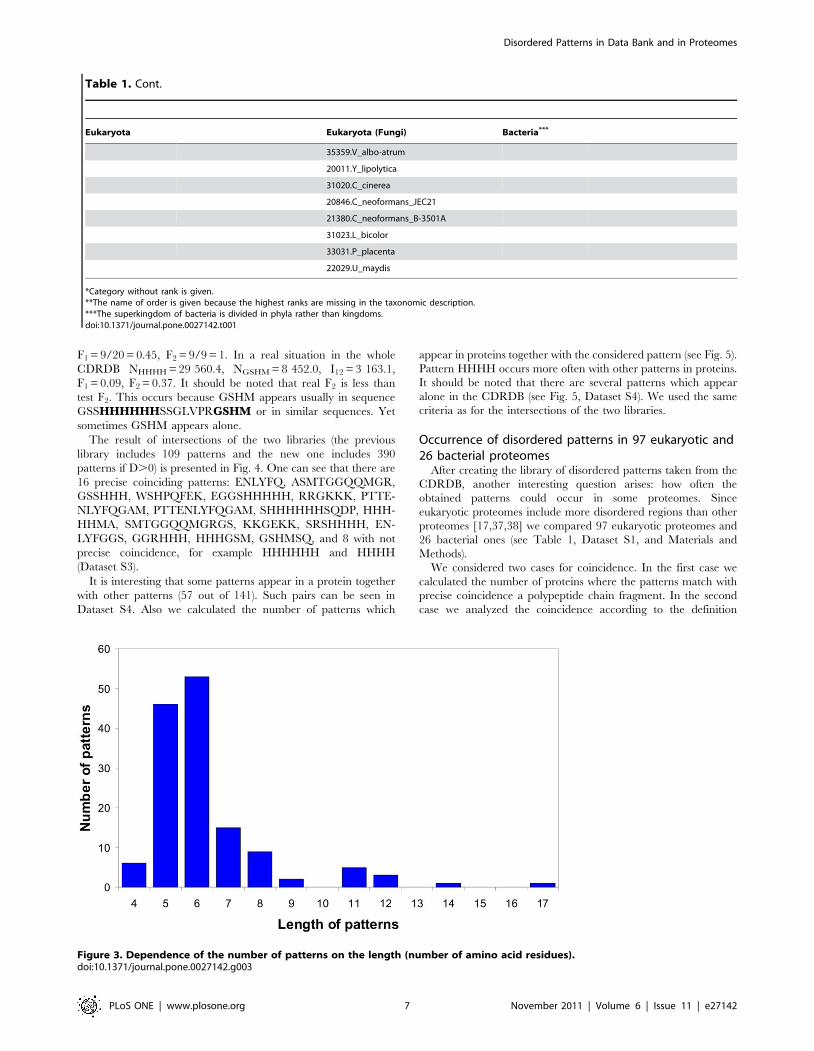
patterns (see Dataset S1). Figure 3 demonstrates the distribution of
the patterns according to their lengths. The patterns occur more
frequently as short fragments (105 out of 141 are patterns of 4–6
residues long). The largest pattern with condition D$25 consists of
17 amino acid residues (HHHHHHSSGLEVLFQGP). It is
interesting that the strong pattern is HHHH, but not HHHHHH
as in the last version of the library [31]. We suggest that the
residues matched by these patterns will be disordered in new
protein chains because more than half of residues in these patterns
are disordered (see conditions C2 and C3 in the Materials and
Methods section).
The statistical significance of disordered occurrences in the
selected patterns was estimated with the Z-score (see Materials and
Methods). We calculated the probability that the number of
successes will be larger or equal to Cu at the given number of
Cu+Cf (for each pattern we know the number of clusters Cu where
this pattern in more than half cases is disordered, and also the
number of clusters Cf where this pattern is ordered in more than
half cases). This probability for all 141 disordered patterns is less
than 7N1025.
All 141 patterns have Zdisorder.6.4 that corresponds to the P-
value of 7N1025, which is in good agreement with the procedure of
the disordered patterns determination. The worst variant is Cu = 5,
Cf = 4, and the length of patterns is 6. We have four such cases:
SVAESS, ASIGQA, PPSGSP, and DSDVSL (see Dataset S1,
columns O and P).
Comparison of the new and the previous libraries ofdisordered patterns
After construction of the new library the question about
similarity of two databases (previous and new) arises. For this
purpose the previous patterns matched the clustered pdb
(CDRDB) and the sum of weights was calculated analogously to
the new patterns. Then we calculated the sum of weights for
residues matching both the previous and the new patterns
(intersections, I12). The number of clusters with identity of 75%
in which there were new and previous patterns was calculated, as
well as the number of intersections. The degree of coincidence was
calculated using equations (13) and (14):
F1~I12= N1zN2{I12ð Þ ð13Þ
F2~I12=min N1, N2ð Þ ð14Þ
where I12 is the sum of weights for intersections (coincidences), and
N is the weight of a single pattern. We considered only pairs where
F2.0.1, F2(C75).0.1, I12$3, and the number of clusters where
two patterns appear together, C12$3 (see Dataset S3). The
measure F1 points to the coincidence between two considered
patterns. At the same time the measure F2 demonstrates a level of
inclusion of the pattern with smaller N into a larger one. Large
difference between N1 and N2 results in a wide difference between
F1 and F2.
For example, the sequence GSSHHHHHHSSGLVPRGSHMoccurs in 393 clusters on the N-termini, where it is disordered
more than half in 387 clusters. This sequence is matched by
pattern GSHM, and its beginning is matched by the HHHH
pattern. If we have a test database with one protein where there is
such a sequence at the N-end, then NGSHM = 20. N is the weight of
a pure pattern with the neighboring part, in this case this is the
length of the whole N-terminal fragment, NHHHH = 9, I12 = 9,
Disordered Patterns in Data Bank and in Proteomes
PLoS ONE | www.plosone.org 5 November 2011 | Volume 6 | Issue 11 | e27142
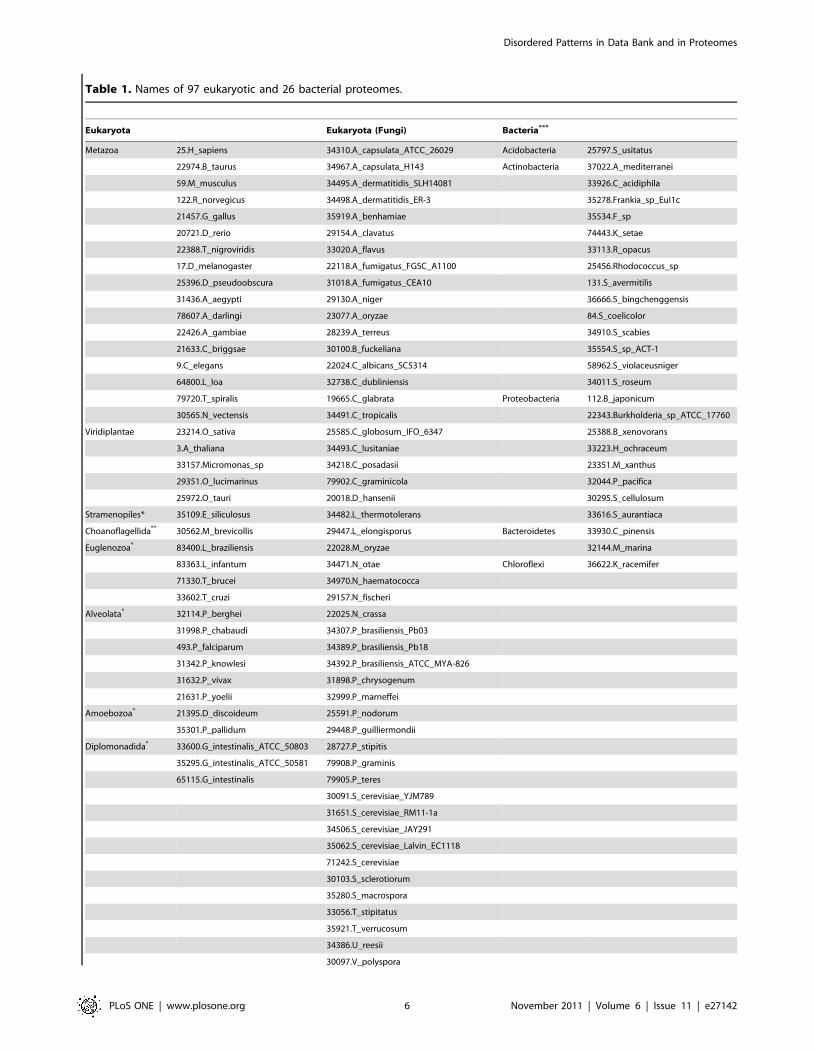
Table 1. Names of 97 eukaryotic and 26 bacterial proteomes.
Eukaryota Eukaryota (Fungi) Bacteria***
Metazoa 25.H_sapiens 34310.A_capsulata_ATCC_26029 Acidobacteria 25797.S_usitatus
22974.B_taurus 34967.A_capsulata_H143 Actinobacteria 37022.A_mediterranei
59.M_musculus 34495.A_dermatitidis_SLH14081 33926.C_acidiphila
122.R_norvegicus 34498.A_dermatitidis_ER-3 35278.Frankia_sp_EuI1c
21457.G_gallus 35919.A_benhamiae 35534.F_sp
20721.D_rerio 29154.A_clavatus 74443.K_setae
22388.T_nigroviridis 33020.A_flavus 33113.R_opacus
17.D_melanogaster 22118.A_fumigatus_FGSC_A1100 25456.Rhodococcus_sp
25396.D_pseudoobscura 31018.A_fumigatus_CEA10 131.S_avermitilis
31436.A_aegypti 29130.A_niger 36666.S_bingchenggensis
78607.A_darlingi 23077.A_oryzae 84.S_coelicolor
22426.A_gambiae 28239.A_terreus 34910.S_scabies
21633.C_briggsae 30100.B_fuckeliana 35554.S_sp_ACT-1
9.C_elegans 22024.C_albicans_SC5314 58962.S_violaceusniger
64800.L_loa 32738.C_dubliniensis 34011.S_roseum
79720.T_spiralis 19665.C_glabrata Proteobacteria 112.B_japonicum
30565.N_vectensis 34491.C_tropicalis 22343.Burkholderia_sp_ATCC_17760
Viridiplantae 23214.O_sativa 25585.C_globosum_IFO_6347 25388.B_xenovorans
3.A_thaliana 34493.C_lusitaniae 33223.H_ochraceum
33157.Micromonas_sp 34218.C_posadasii 23351.M_xanthus
29351.O_lucimarinus 79902.C_graminicola 32044.P_pacifica
25972.O_tauri 20018.D_hansenii 30295.S_cellulosum
Stramenopiles* 35109.E_siliculosus 34482.L_thermotolerans 33616.S_aurantiaca
Choanoflagellida** 30562.M_brevicollis 29447.L_elongisporus Bacteroidetes 33930.C_pinensis
Euglenozoa* 83400.L_braziliensis 22028.M_oryzae 32144.M_marina
83363.L_infantum 34471.N_otae Chloroflexi 36622.K_racemifer
71330.T_brucei 34970.N_haematococca
33602.T_cruzi 29157.N_fischeri
Alveolata* 32114.P_berghei 22025.N_crassa
31998.P_chabaudi 34307.P_brasiliensis_Pb03
493.P_falciparum 34389.P_brasiliensis_Pb18
31342.P_knowlesi 34392.P_brasiliensis_ATCC_MYA-826
31632.P_vivax 31898.P_chrysogenum
21631.P_yoelii 32999.P_marneffei
Amoebozoa* 21395.D_discoideum 25591.P_nodorum
35301.P_pallidum 29448.P_guilliermondii
Diplomonadida* 33600.G_intestinalis_ATCC_50803 28727.P_stipitis
35295.G_intestinalis_ATCC_50581 79908.P_graminis
65115.G_intestinalis 79905.P_teres
30091.S_cerevisiae_YJM789
31651.S_cerevisiae_RM11-1a
34506.S_cerevisiae_JAY291
35062.S_cerevisiae_Lalvin_EC1118
71242.S_cerevisiae
30103.S_sclerotiorum
35280.S_macrospora
33056.T_stipitatus
35921.T_verrucosum
34386.U_reesii
30097.V_polyspora
Disordered Patterns in Data Bank and in Proteomes
PLoS ONE | www.plosone.org 6 November 2011 | Volume 6 | Issue 11 | e27142
F1 = 9/20 = 0.45, F2 = 9/9 = 1. In a real situation in the whole
CDRDB NHHHH = 29 560.4, NGSHM = 8 452.0, I12 = 3 163.1,
F1 = 0.09, F2 = 0.37. It should be noted that real F2 is less than
test F2. This occurs because GSHM appears usually in sequence
GSSHHHHHHSSGLVPRGSHM or in similar sequences. Yet
sometimes GSHM appears alone.
The result of intersections of the two libraries (the previous
library includes 109 patterns and the new one includes 390
patterns if D.0) is presented in Fig. 4. One can see that there are
16 precise coinciding patterns: ENLYFQ, ASMTGGQQMGR,
GSSHHH, WSHPQFEK, EGGSHHHHH, RRGKKK, PTTE-
NLYFQGAM, PTTENLYFQGAM, SHHHHHHSQDP, HHH-
HHMA, SMTGGQQMGRGS, KKGEKK, SRSHHHH, EN-
LYFGGS, GGRHHH, HHHGSM, GSHMSQ, and 8 with not
precise coincidence, for example HHHHHH and HHHH
(Dataset S3).
It is interesting that some patterns appear in a protein together
with other patterns (57 out of 141). Such pairs can be seen in
Dataset S4. Also we calculated the number of patterns which
appear in proteins together with the considered pattern (see Fig. 5).
Pattern HHHH occurs more often with other patterns in proteins.
It should be noted that there are several patterns which appear
alone in the CDRDB (see Fig. 5, Dataset S4). We used the same
criteria as for the intersections of the two libraries.
Occurrence of disordered patterns in 97 eukaryotic and26 bacterial proteomes
After creating the library of disordered patterns taken from the
CDRDB, another interesting question arises: how often the
obtained patterns could occur in some proteomes. Since
eukaryotic proteomes include more disordered regions than other
proteomes [17,37,38] we compared 97 eukaryotic proteomes and
26 bacterial ones (see Table 1, Dataset S1, and Materials and
Methods).
We considered two cases for coincidence. In the first case we
calculated the number of proteins where the patterns match with
precise coincidence a polypeptide chain fragment. In the second
case we analyzed the coincidence according to the definition
Eukaryota Eukaryota (Fungi) Bacteria***
35359.V_albo-atrum
20011.Y_lipolytica
31020.C_cinerea
20846.C_neoformans_JEC21
21380.C_neoformans_B-3501A
31023.L_bicolor
33031.P_placenta
22029.U_maydis
*Category without rank is given.**The name of order is given because the highest ranks are missing in the taxonomic description.***The superkingdom of bacteria is divided in phyla rather than kingdoms.doi:10.1371/journal.pone.0027142.t001
Table 1. Cont.
Figure 3. Dependence of the number of patterns on the length (number of amino acid residues).doi:10.1371/journal.pone.0027142.g003
Disordered Patterns in Data Bank and in Proteomes
PLoS ONE | www.plosone.org 7 November 2011 | Volume 6 | Issue 11 | e27142

suggested here and in the paper [31]. According to the rule
mentioned in the Materials and Methods section for patterns with
a length of L#5 no change may occur, for 5,L#10 – only 1
change may take place, for 10,L#15 – 2 changes, etc.
Among 141 disordered patterns 17 occur (with precise
coincidence) only in the PDB but are very sparse in 123 proteomes
(see Dataset S5). Such patterns as RASQPELAPEDPED,
SMTGGQQMGRGS, SHHHHHHSQDP, PTTENLYFQGAM,
HHHHHHSSGLEVLFQGP, EQKLISEEDLN, and ASMTG-
GQQMGR do not appear in the analyzed proteomes even in two
cases (precise coincidence and exact coincidence of two terminal
residues and no coincidence in L/5 positions) (see Figure 6). This
suggests that such patterns are an artificial addition to proteins from
the CDRDB for their better purifications.
From Figure 6 it is evident that the homorepeats occur very
often in eukaryotic proteomes. The patterns with the most
frequent occurrence in the eukaryotic proteomes have low
complexity: PPPPP, GGGGG, EEEED, HHHH, KKKKK,
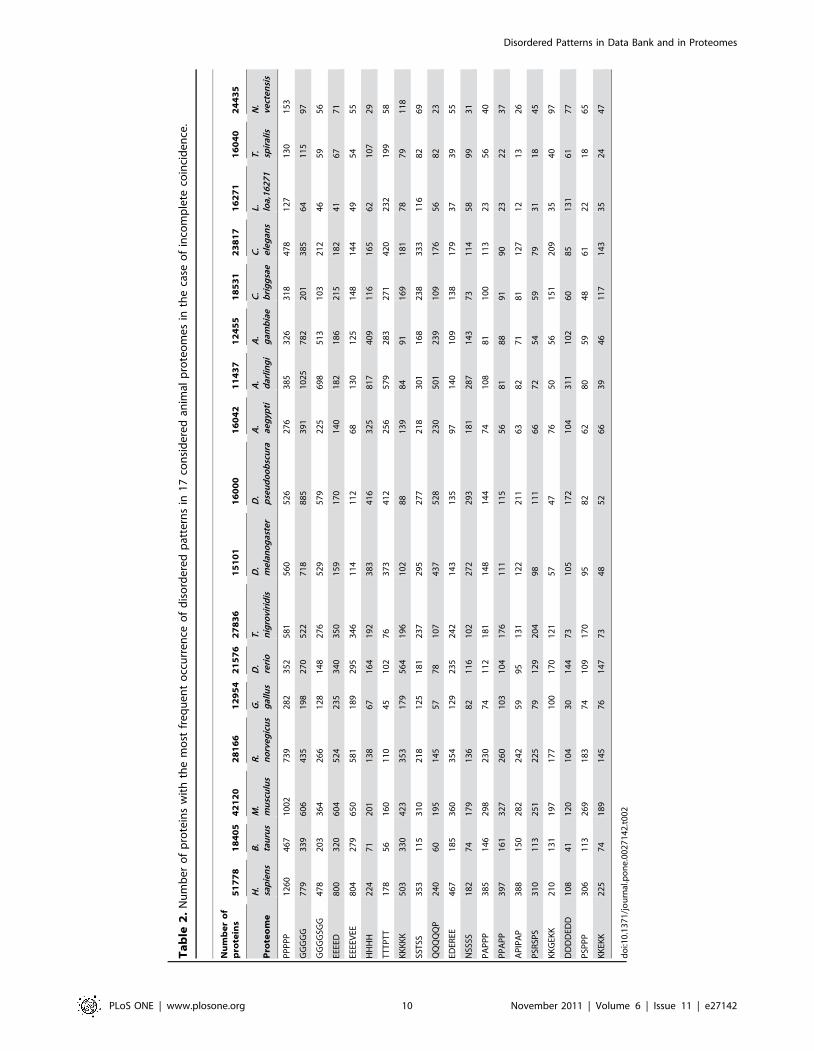
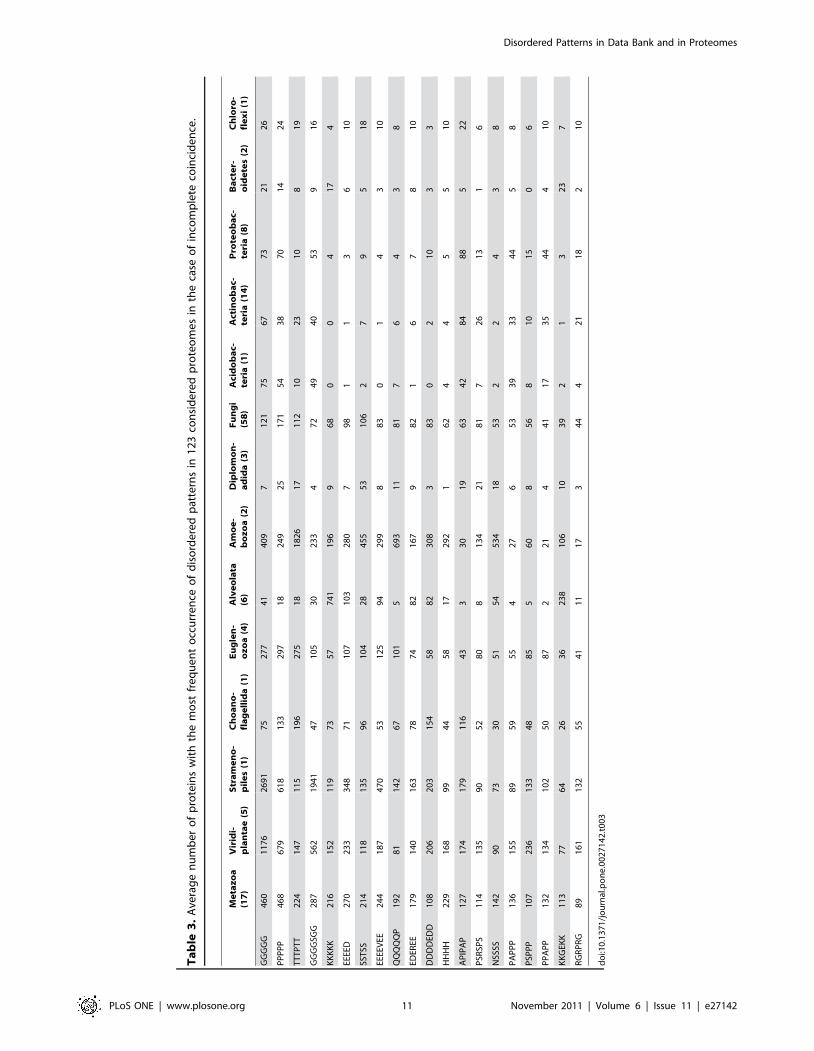
SSTSS, and QQQQQP. From Tables 2 and 3 it is evident that
the disordered patterns with the most frequent occurrence in the
eukaryotic and even in bacterial proteomes are patterns with low
complexity GGGGG, PPPPP, TTTPTT, GGGGSGG, KKKKK,
etc.
According to work [31] we suggest that these patterns will be
disordered in most cases. It should be noted that low-complexity
regions can additionally include ordered structural proteins or
proteins with strong structural propensity, like collagens, coiled-
coils or fibrous proteins [40]. Recently, it has been demonstrated
that an increased number of perfect tandem repeats correlates
with their stronger tendency to be unstructured [41]. Moreover,
strong association between homorepeats and unstructured regions
was shown elsewhere [42]. Such patterns as GGGGSGG,
EEEEVEE, EDEREE, APIPAP, and PSRSPS (see Table 2) often
occur in the considered 17 animal proteomes.
It should be noted that poly H fragments are artificial parts of
proteins in the PDB which have been added for better purification
of proteins, but in eukaryotic proteomes such a repeat is likely to
have a biological function. The locations of poly-H fragments can
Figure 4. Dependence of the number of coinciding patterns between previous and new libraries of disordered patterns at the givenlevel of coincidence (F1). The measure F1 points to the coincidence of protein regions covered by the considered patterns.doi:10.1371/journal.pone.0027142.g004
Figure 5. Number of patterns with which the given pattern appears together in the same protein in the clustered PDB. Pattern HHHHappears 45 times together with some other patterns from the library and 84 patterns appear alone in the clustered PDB.doi:10.1371/journal.pone.0027142.g005
Disordered Patterns in Data Bank and in Proteomes
PLoS ONE | www.plosone.org 8 November 2011 | Volume 6 | Issue 11 | e27142

be found in different proteomes from our site, http://bioinfo.
protres.ru/fp/search_new_pattern.html.
We calculated the statistical significance of the observed
patterns in 123 proteomes by using equation (10) (see Materials
and Methods). It should be noted that the average length of
proteins in considered proteomes is larger (about 400 residues)
than the average length of the protein in the PDB database (about
260 residues). On the one hand, Zoccur#0, varies from 40 patterns
for the human proteome to 91 ones for the bacterial proteome B.
xenovorans. On the other hand, Zoccur.5 varies from 65 patterns in
the rice proteome (O. sativa) to 8 patterns in the bacterial proteome
B. xenovorans. Several examples deserve our attention. For instance,
the appearance of pattern GGSGGGGSGGG varies from 7 cases
in T. spiralis (the expected occurrence is 0.0004) to 149 cases in
humans (the expected occurrence is 0.013), but the Zoccur value is
353 and 1291, respectively. Such patterns as MSLN and SNAM
appear more sparsely in comparison with the expected value
(Zoccur,0) for all considered 17 animal proteomes. Although the
first pattern occurs 100 times (that is not rare) in the human
proteome, and the second pattern appears 61 times, correspond-
ingly. At the same time pattern HHHH appears more often than
expected (from 10 for the human to 4 for the actinia (N.vectensis)),
but Z is 68 and 12, respectively.
We calculated the frequencies of occurrence of 141 disordered
patterns in 123 proteomes. To make a statement that the given
pattern X occurs more often in the i proteome than in the j one we
introduced the scoring function for such difference between
occurrences of the pattern in two proteomes (by using equation
(11), see Materials and Methods). This scoring function should
have a normal distribution according to the central limit theorem.
We considered the difference occurrence of 141 patterns in some
pairs of proteomes (see Dataset S5) and illustrated here the
example for eukaryota and bacteria superkingdoms. It turns out
that the appearances of 55 patterns in the two superkingdoms do
not differ significantly at the level of 1027. The negative value of
the scoring function points out that the frequency of appearance of
the given pattern is higher in bacteria than in eukaryota
superkingdoms. For example pattern APIPAP occurs 1.5 times
more frequently in 26 bacterial proteomes than in 97 eukaryotic
proteomes (Zdiff = 220.4). It should be added, that HHHH and
QQQQQP patterns occur in Arthropoda’s proteomes more often
than in the Chordata proteomes (Zdiff = 238.4 and 234.7,
correspondingly) (see Table 2 and Dataset S5).
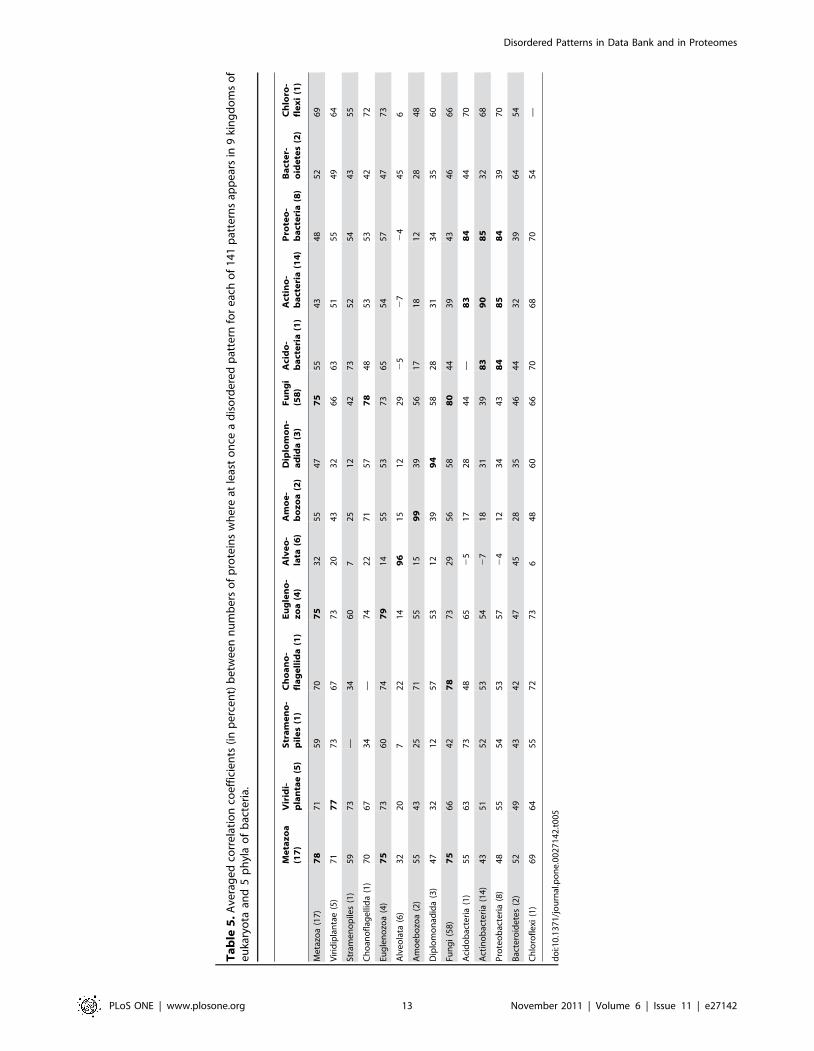
For each proteome we calculated a set of 141 values reflecting
the number of proteins containing at least one disordered pattern
for each of the 141 patterns from the library. Then considering all
possible pairs of proteomes, the correlation coefficients between
the 141 values have been calculated resulting in the matrix of
correlation coefficients. The correlation coefficient was calculated
for each pair of proteomes separately (see Table 4), and then
averaging has been done inside each kingdom and phylum (see
Table 5). As a rule, the correlation coefficients are higher inside
the studied kingdom and phylum than between them.
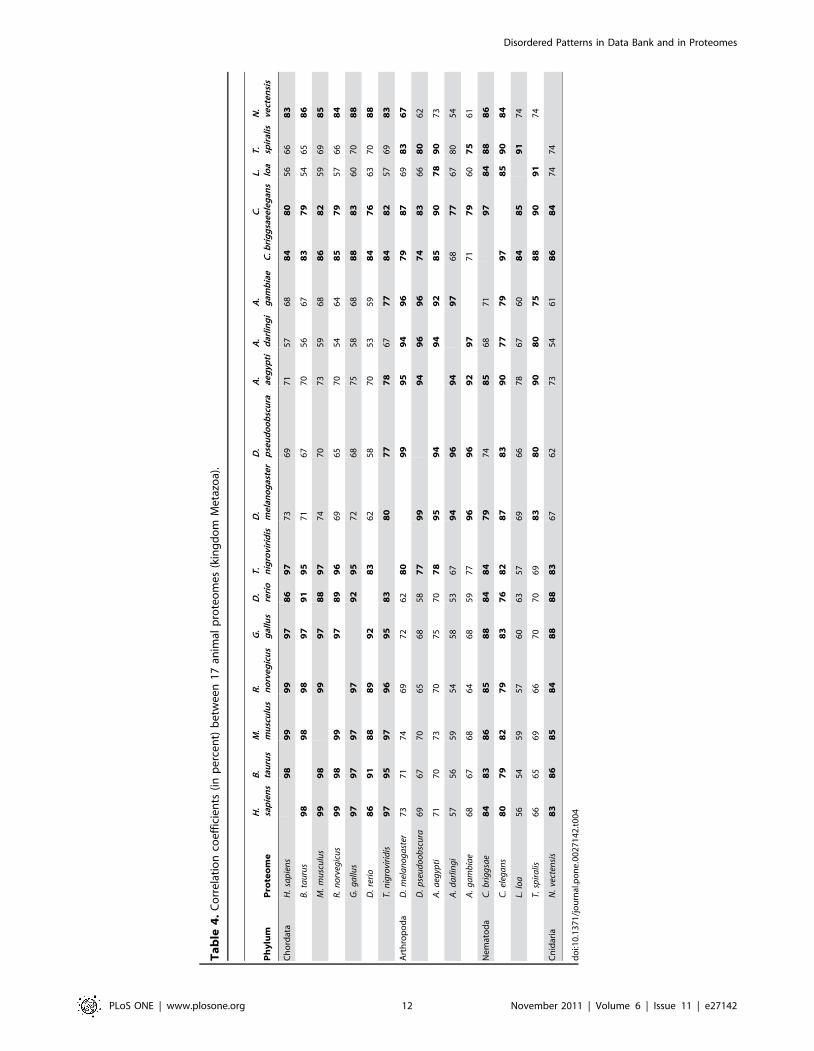
From Table 4 four clusters can be selected with a high
correlation coefficient between the numbers of proteins where all
considered patterns appear for all pairs between 17 animal
proteomes. The first cluster corresponds to phylum Chordata (7
proteomes), the second corresponds to Arthropoda (5 proteomes),
the third to Nematoda (4 proteomes), and the fourth to Cnidaria
(only 1 proteome). In Tables 4 and 5, bold formatting is used to
show a correlation higher than 75%, normal size of numbers to
show the correlation from 50% to 75%, and smaller size of
numbers to show the correlation smaller than 50%. From Table 4
it is evident that the number of proteins from the human proteome
Figure 6. Occurrence of disordered patterns in four proteomes. (A) H. sapiens, Chordata phylum; (B) D. Melanogaster, Arthropoda phylum;(C) C. elegans, Nematoda phylum; (D) N. vectensis, Cnidaria phylum. The blue color corresponds to precise coincidence of the considered patternswith the fragment of polypeptide chains, the aqua color corresponds to exact coincidence of two terminal residues from both termini andincomplete coincidence in the L/5 positions.doi:10.1371/journal.pone.0027142.g006
Disordered Patterns in Data Bank and in Proteomes
PLoS ONE | www.plosone.org 9 November 2011 | Volume 6 | Issue 11 | e27142
Ta
ble
2.
Nu
mb
er
of
pro
tein
sw
ith
the
mo
stfr
eq
ue
nt
occ
urr
en
ceo
fd
iso
rde
red
pat
tern
sin
17
con
sid
ere
dan
imal
pro
teo
me
sin
the
case
of
inco
mp
lete
coin
cid
en
ce.
Nu
mb
er
of
pro
tein
s5
17
78
18
40
54
21
20
28
16
61
29
54
21
57
62
78
36
15
10
11
60
00
16
04
21
14
37
12
45
51
85
31
23
81
71
62
71
16
04
02
44
35
Pro
teo
me
H.
sap
ien
sB
.ta
uru
sM
.m
usc
ulu
sR
.n
orv
eg
icu
sG
.g
allu
sD
.re
rio
T.
nig
rovi
rid
isD
.m
ela
no
gas
ter
D.
pse
ud
oo
bsc
ura
A.
aeg
ypti
A.
dar
lin
gi
A.
gam
bia
eC
.b
rig
gsa
eC
.e
leg
ans
L. loa,
16
27
1T
.sp
iral
isN
.ve
cte
nsi
s
PP
PP
P1
26
04
67
10
02
73
92
82
35
25
81
56
05
26
27
63
85
32
63
18
47
81
27
13
01
53
GG
GG
G7
79
33
96
06
43
51
98
27
05
22
71
88
85
39
11
02
57
82
20
13
85
64
11
59
7
GG
GG
SGG
47
82
03
36
42
66
12
81
48
27
65
29
57
92
25
69
85
13
10
32
12
46
59
56
EEEE
D8
00
32
06
04
52
42
35
34
03
50
15
91
70
14
01
82
18
62
15
18
24
16
77
1
EEEE
VEE
80
42
79
65
05
81
18
92
95
34
61
14
11
26
81
30
12
51
48
14
44
95
45
5
HH
HH
22
47
12
01
13
86
71
64
19
23
83
41
63
25
81
74
09
11
61
65
62
10
72
9
TT
TP
TT
17
85
61
60
11
04
51
02
76
37
34
12
25
65
79
28
32
71
42
02
32
19
95
8
KK
KK
K5
03
33
04
23
35
31
79
56
41
96
10
28
81
39
84
91
16
91
81
78
79
11
8
SST
SS3
53
11
53
10
21
81
25
18
12
37
29
52
77
21
83
01
16
82
38
33
31
16
82
69
QP
24
06
01
95
14
55
77
81
07
43
75
28
23
05
01
23
91
09
17
65
68
22
3
EDER
EE4
67
18
53
60
35
41
29
23
52
42
14
31
35
97
14
01
09
13
81
79
37
39
55
NSS
SS1
82
74
17
91
36
82
11
61
02
27
22
93
18
12
87
14
37
31
14
58
99
31
PA
PP
P3
85
14
62
98
23
07
41
12
18
11
48
14
47
41
08
81
10
01
13
23
56
40
PP
AP
P3
97
16
13
27
26
01
03
10
41
76
11
11
15
56
81
88
91
90
23
22
37
AP
IPA
P3
88
15
02
82
24
25
99
51
31
12
22
11
63
82
71
81
12
71
21
32
6
PSR
SPS
31
01
13
25
12
25
79
12
92
04
98
11
16
67
25
45
97
93
11
84
5
KK
GEK
K2
10
13
11
97
17
71
00
17
01
21
57
47
76
50
56
15
12
09
35
40
97
DD
DD
EDD
10
84
11
20
10
43
01
44
73
10
51
72
10
43
11
10
26
08
51
31
61
77
PSP
PP
30
61
13
26
91
83
74
10
91
70
95
82
62
80
59
48
61
22
18
65
KK
EKK
22
57
41
89
14
57
61
47
73
48
52
66
39
46
11
71
43
35
24
47
do
i:10
.13
71
/jo
urn
al.p
on
e.0
02
71
42
.t0
02
Disordered Patterns in Data Bank and in Proteomes
PLoS ONE | www.plosone.org 10 November 2011 | Volume 6 | Issue 11 | e27142
Ta
ble
3.
Ave
rag
en
um
be
ro
fp
rote
ins
wit
hth
em
ost
fre
qu
en
to
ccu
rre
nce
of
dis
ord
ere
dp
atte
rns
in1
23
con
sid
ere
dp
rote
om
es
inth
eca
seo
fin
com
ple
teco
inci
de
nce
.
Me
taz
oa
(17
)V
irid
i-p
lan
tae
(5)
Str
am
en
o-
pil
es
(1)
Ch
oa
no
-fl
ag
ell
ida
(1)
Eu
gle
n-
oz
oa
(4)
Alv
eo
lata
(6)
Am
oe
-b
oz
oa
(2)
Dip
lom
on
-a
did
a(3
)F
un
gi
(58
)A
cid
ob
ac-
teri
a(1
)A
ctin
ob
ac-
teri
a(1
4)
Pro
teo
ba
c-te
ria
(8)
Ba
cte
r-o
ide
tes
(2)
Ch
loro
-fl
ex
i(1
)
GG
GG
G4
60
11
76
26
91
75
27
74
14
09
71
21
75
67
73
21
26
PP
PP
P4
68
67
96
18
13
32
97
18
24
92
51
71
54
38
70
14
24
TT
TP
TT
22
41
47
11
51
96
27
51
81
82
61
71
12
10
23
10
81
9
GG
GG
SGG
28
75
62
19
41
47
10
53
02
33
47
24
94
05
39
16
KK
KK
K2
16
15
21
19
73
57
74
11
96
96
80
04
17
4
EEEE
D2
70
23
33
48
71
10
71
03
28
07
98
11
36
10
SST
SS2
14
11
81
35
96
10
42
84
55
53
10
62
79
51
8
EEEE
VEE
24
41
87
47
05
31
25
94
29
98
83
01
43
10
QP
19
28
11
42
67
10
15
69
31
18
17
64
38
EDER
EE1
79
14
01
63
78
74
82
16
79
82
16
78
10
DD
DD
EDD
10
82
06
20
31
54
58
82
30
83
83
02
10
33
HH
HH
22
91
68
99
44
58
17
29
21
62
44
55
10
AP
IPA
P1
27
17
41
79
11
64
33
30
19
63
42
84
88
52
2
PSR
SPS
11
41
35
90
52
80
81
34
21
81
72
61
31
6
NSS
SS1
42
90
73
30
51
54
53
41
85
32
24
38
PA
PP
P1
36
15
58
95
95
54
27
65
33
93
34
45
8
PSP
PP
10
72
36
13
34
88
55
60
85
68
10
15
06
PP
AP
P1
32
13
41
02
50
87
22
14
41
17
35
44
41
0
KK
GEK
K1
13
77
64
26
36
23
81
06
10
39
21
32
37
RG
RP
RG
89
16
11
32
55
41
11
17
34
44
21
18
21
0
do
i:10
.13
71
/jo
urn
al.p
on
e.0
02
71
42
.t0
03
Disordered Patterns in Data Bank and in Proteomes
PLoS ONE | www.plosone.org 11 November 2011 | Volume 6 | Issue 11 | e27142
Ta
ble
4.
Co
rre
lati
on
coe
ffic
ien
ts(i
np
erc
en
t)b
etw
ee
n1
7an
imal
pro
teo
me
s(k
ing
do
mM
eta
zoa)
.
Ph
ylu
mP
rote
om
eH
.sa
pie
ns
B.
tau
rus
M.
mu
scu
lus
R.
no
rve
gic
us
G.
gal
lus
D.
reri
oT
.n
igro
viri
dis
D.
me
lan
og
aste
rD
.p
seu
do
ob
scu
raA
.ae
gyp
tiA
.d
arli
ng
iA
.g
amb
iae
C.b
rig
gsa
eC
.e
leg
ans
L. loa
T.
spir
alis
N.
vect
en
sis
Ch
ord
ata
H.
sap
ien
s9
89
99
99
78
69
77
36
97
15
76
88
48
05
66
68
3
B.
tau
rus
98
98
98
97
91
95
71
67
70
56
67
83
79
54
65
86
M.
mu
scu
lus
99
98
99
97
88
97
74
70
73
59
68
86
82
59
69
85
R.
no
rveg
icu
s9
99
89
99
78
99
66
96
57
05
46
48
57
95
76
68
4
G.
ga
llus
97
97
97
97
92
95
72
68
75
58
68
88
83
60
70
88
D.
reri
o8
69
18
88
99
28
36
25
87
05
35
98
47
66
37
08
8
T.n
igro
viri
dis
97
95
97
96
95
83
80
77
78
67
77
84
82
57
69
83
Art
hro
po
da
D.
mel
an
og
ast
er7
37
17
46
97
26
28
09
99
59
49
67
98
76
98
36
7
D.
pse
ud
oo
bsc
ura
69
67
70
65
68
58
77
99
94
96
96
74
83
66
80
62
A.
aeg
ypti
71
70
73
70
75
70
78
95
94
94
92
85
90
78
90
73
A.
da
rlin
gi
57
56
59
54
58
53
67
94
96
94
97
68
77
67
80
54
A.
ga
mb
iae
68
67
68
64
68
59
77
96
96
92
97
71
79
60
75
61
Ne
mat
od
aC
.b
rig
gsa
e8
48
38
68
58
88
48
47
97
48
56
87
19
78
48
88
6
C.
eleg
an
s8
07
98
27
98
37
68
28
78
39
07
77
99
78
59
08
4
L.lo
a5
65
45
95
76
06
35
76
96
67
86
76
08
48
59
17
4
T.sp
ira
lis6
66
56
96
67
07
06
98
38
09
08
07
58
89
09
17
4
Cn
idar
iaN
.ve
cten
sis
83
86
85
84
88
88
83
67
62
73
54
61
86
84
74
74
do
i:10
.13
71
/jo
urn
al.p
on
e.0
02
71
42
.t0
04
Disordered Patterns in Data Bank and in Proteomes
PLoS ONE | www.plosone.org 12 November 2011 | Volume 6 | Issue 11 | e27142
Ta
ble
5.
Ave
rag
ed
corr
ela
tio
nco
eff
icie
nts
(in
pe
rce
nt)
be
twe
en
nu
mb
ers
of
pro
tein
sw
he
reat
leas
to
nce
ad
iso
rde
red
pat
tern
for
eac
ho
f1
41
pat
tern
sap
pe
ars
in9
kin
gd
om
so
fe
uka
ryo
taan
d5
ph
yla
of
bac
teri
a.
Me
taz
oa
(17
)V
irid
i-p
lan
tae
(5)
Str
am
en
o-
pil
es
(1)
Ch
oa
no
-fl
ag
ell
ida
(1)
Eu
gle
no
-z
oa
(4)
Alv
eo
-la
ta(6
)A
mo
e-
bo
zo
a(2
)D
iplo
mo
n-
ad
ida
(3)
Fu
ng
i(5
8)
Aci
do
-b
act
eri
a(1
)A
ctin
o-
ba
cte
ria
(14
)P
rote
o-
ba
cte
ria
(8)
Ba
cte
r-o
ide
tes
(2)
Ch
loro
-fl
ex
i(1
)
Me
tazo
a(1
7)
78
71
59
70
75
32
55
47
75
55
43
48
52
69
Vir
idip
lan
tae
(5)
71
77
73
67
73
20
43
32
66
63
51
55
49
64
Stra
me
no
pile
s(1
)5
97
3—
34
60
72
51
24
27
35
25
44
35
5
Ch
oan
ofl
age
llid
a(1
)7
06
73
4—
74
22
71
57
78
48
53
53
42
72
Eug
len
ozo
a(4
)7
57
36
07
47
91
45
55
37
36
55
45
74
77
3
Alv
eo
lata
(6)
32
20
72
21
49
61
51
22
92
52
72
44
56
Am
oe
bo
zoa
(2)
55
43
25
71
55
15
99
39
56
17
18
12
28
48
Dip
lom
on
adid
a(3
)4
73
21
25
75
31
23
99
45
82
83
13
43
56
0
Fun
gi
(58
)7
56
64
27
87
32
95
65
88
04
43
94
34
66
6
Aci
do
bac
teri
a(1
)5
56
37
34
86
52
51
72
84
4—
83
84
44
70
Act
ino
bac
teri
a(1
4)
43
51
52
53
54
27
18
31
39
83
90
85
32
68
Pro
teo
bac
teri
a(8
)4
85
55
45
35
72
41
23
44
38
48
58
43
97
0
Bac
tero
ide
tes
(2)
52
49
43
42
47
45
28
35
46
44
32
39
64
54
Ch
loro
fle
xi(1
)6
96
45
57
27
36
48
60
66
70
68
70
54
—
do
i:10
.13
71
/jo
urn
al.p
on
e.0
02
71
42
.t0
05
Disordered Patterns in Data Bank and in Proteomes
PLoS ONE | www.plosone.org 13 November 2011 | Volume 6 | Issue 11 | e27142

correlates with that from chicken and fish lesser than with bovine,
rat, and mouse proteomes. At the same time, the correlation
between the number of proteins from proteomes from the
Chordata phylum is high for such proteomes as C. briggsae and C.
elegans. High correlation coefficients also are observed for such
pairs as T. spiralis for the Arthropoda proteomes, and N. vectensis for
the Chordata proteomes.
Combining the motif discovery and disorder protein segment
identification in the clustered PDB allows us to create the largest
library of the disordered patterns. At present the library includes
141 disordered patterns. Such an approach is promising for
further studying and understanding the functional role of the
obtained patterns in different proteomes. We came to some
general conclusions after analysis of 123 proteomes. The
disordered patterns appear more often in eukaryotic than in
bacterial proteomes. We can conclude that the occurrence of
disordered patterns is more monotonous within the same kingdom
(phylum) than between kingdoms (phyla). One can suggest that
such short similar motifs are responsible for common functions for
nonhomologous, unrelated proteins from different organisms.
Supporting Information
Dataset S1 List of 141 disordered patterns.
(XLS)
Dataset S2 Number of proteins and residues for each out of 123
proteomes.
(XLS)
Dataset S3 Comparison of the new and the previous libraries of
disordered patterns.
(XLS)
Dataset S4 Pairs of patterns which appear in the same protein
from the whole clustered PDB.
(XLS)
Dataset S5 Occurrence of disordered patterns in 97 eukaryotic
and 26 bacterial proteomes in the cases of precise and imcomplete
coincidence.
(XLS)
Author Contributions
Conceived and designed the experiments: OVG. Performed the exper-
iments: MYL. Analyzed the data: MYL OVG. Contributed reagents/
materials/analysis tools: OVG. Wrote the paper: OVG. Designed the
software used in analysis: MYL OVG.
References
1. Finn RD, Mistry J, Tate J, Coggill P, Heger A, et al. (2010) The Pfam protein
families database. Nucleic Acids Res 38(Database issue): D211–222.
2. Hunter S, Apweiler R, Attwood TK, Bairoch A, Bateman A, et al. (2009)
InterPro: the integrative protein signature database. Nucleic Acids Res
37(Database issue): D211–215.
3. Sigrist CJ, Cerutti L, de Castro E, Langendijk-Genevaux PS, Bulliard V, et al.
(2010) PROSITE, a protein domain database for functional characterization
and annotation. Nucleic Acids Res 38(Database issue): D161–166.
4. Tompa P (2002) Intrinsically unstructured proteins. Trends Biochem Sci 27:
527–533.
5. Wright PE, Dyson HJ (1999) Intrinsically unstructured proteins: re-assessing the
protein structure-function paradigm. J Mol Biol 293: 321–331.
6. Dyson HJ, Wright PE (2005) Intrinsically unstructured proteins and their
functions. Nat Rev Mol Cell Biol 6: 197–208.
7. Linding R, Russell RB, Neduva V, Gibson TJ (2003) GlobPlot: Exploring
protein sequences for globularity and disorder. Nucleic Acids Res 31:
3701–3708.
8. Lobanov My, Galzitskaya OV (2011) The Ising model for prediction of
disordered residues from protein sequence alone. Phys Biol 8: 035004.
9. Dosztanyi Z, Csizmok V, Tompa P, Simon I (2005) IUPred: web server for the
prediction of intrinsically unstructured regions of proteins based on estimated
energy content. Bioinformatics 21: 3433–3434.
10. Coeytaux K, Poupon A (2005) Prediction of unfolded segments in a protein
sequence based on amino acid composition. Bioinformatics 21: 1891–1900.
11. Galzitskaya OV, Garbuzynskiy SO, Lobanov MY (2006) FoldUnfold: web
server for the prediction of disordered regions in protein chain. Bioinformatics
22: 2948–2949.
12. Galzitskaya OV, Garbuzynskiy SO, Lobanov MY (2006) Prediction of
amyloidogenic and disordered regions in protein chains. PLoS Comput Biol 2:
e177.
13. Schlessinger A, Punta M, Rost B (2007) Natively unstructured regions in proteins
identified from contact predictions. Bioinformatics 23: 2376–2384.
14. Peng K, Radivojac P, Vucetic S, Dunker AK, Obradovic Z (2006) Length-
dependent prediction of protein intrinsic disorder. BMC Bioinformatics 7: 208.
15. Obradovic Z, Peng K, Vucetic S, Radivojac P, Dunker AK (2005) Exploiting
heterogeneous sequence properties improves prediction of protein disorder.
Proteins 61 Suppl 7: 176–182.
16. Obradovic Z, Peng K, Vucetic S, Radivojac P, Brown CJ, et al. (2003)
Predicting intrinsic disorder from amino acid sequence. Proteins 53 Suppl 6:
566–572.
17. Ward JJ, Sodhi JS, McGuffin LJ, Buxton BF, Jones DT (2004) Prediction and
functional analysis of native disorder in proteins from the three kingdoms of life.
J Mol Biol 337: 635–645.
18. Hecker J, Yang JY, Cheng J (2008) Protein disorder prediction at multiple levels
of sensitivity and specificity. BMC Genomics 9 Suppl 1: S9.
19. Su CT, Chen CY, Ou YY (2006) Protein disorder prediction by condensed
PSSM considering propensity for order or disorder. BMC Bioinformatics 7: 319.
20. Yang ZR, Thomson R, McNeil P, Esnouf RM (2005) RONN: the bio-basisfunction neural network technique applied to the detection of natively
disordered regions in proteins. Bioinformatics 21: 3369–3376.
21. Sugase K, Dyson HJ, Wright PE (2007) Mechanism of coupled folding and
binding of an intrinsically disordered protein. Nature 447: 1021–1025.
22. Bordelon T, Montegudo SK, Pakhomova S, Oldham ML, Newcomer ME
(2004) A disorder to order transition accompanies catalysis in retinaldehydedehydrogenase type II. J Biol Chem 279: 43085–43091.
23. Shoemaker BA, Portman JJ, Wolynes PG (2000) Speeding molecular recognition
by using the folding funnel: the fly-casting mechanism. Proc Natl Acad Sci U S A
97: 8868–8873.
24. Cheng Y, Oldfield CJ, Meng J, Romero P, Uversky VN, et al. (2007) Miningalpha-helix-forming molecular recognition features with cross species sequence
alignments. Biochemistry 46: 13468–13477.
25. Mohan A, Oldfield CJ, Radivojac P, Vacic V, Cortese MS, et al. (2006) Analysis
of molecular recognition features (MoRFs). J Mol Biol 362: 1043–1059.
26. Lobanov MYu, Shoemaker BA, Garbuzynskiy SO, Fong GH, Panchenko AR,
et al. (2010) ComSin: Database of protein structures in bound (Complex) andunbound (Single) states in relation to their intrinsic disorder. Nucleic Acids Res
38: D283–D287.
27. Rajasekaran S, Merlin JC, Kundeti V, Mi T, Oommen A, et al. (2011) A
computational tool for identifying minimotifs in protein-protein interactions andimproving the accuracy of minimotif predictions. Proteins 79: 153–164.
28. Gould CM, Diella F, Via A, Puntervoll P, Gemund C, et al. (2010) ELM:
the status of the 2010 eukaryotic linear motif resource. Nucleic Acids Res.
D167–D180.
29. Karlin S, Burge C (1996) Trinucleotide repeats and long homopeptides in genesand proteins associated with nervous system disease and development. Proc Natl
Acad Sci U S A 93: 1560–1565.
30. Lise S, Jones DT (2005) Sequence patterns associated with disordered regions in
proteins. Proteins 58: 144–150.
31. Lobanov MY, Furletova EI, Bogatyreva NS, Roytberg MA, Galzitskaya OV
(2010) Library of disordered patterns in 3D protein structures. PLoS ComputBiol 6: e1000958.
32. Lobanov MY, Garbuzynskiy SO, Galzitskaya OV (2010) Statistical analysis of
unstructured amino-acid residues in protein structures. Biochemistry (Moscow)
75: 236–246.
33. Zbilut JP, Chua GH, Krishnan A, Bossa C, Colafranceschi M, et al. (2006)Entropic criteria for protein folding derived from recurrences: six residues patch
as the basic protein word. FEBS Lett 580: 4861–4864.
34. Galzitskaya OV (2008) Search for folding initiation sites from amino acid
sequence. J Bioinform Comput Biol 6: 681–691.
35. Nikiforovich GV, Frieden C (2002) The search for local native-like nucleation
centers in the unfolded state of beta -sheet proteins. Proc Natl Acad Sci USA 99:10388–10393.
36. Hemmer B, Kondo T, Gran B, Pinilla C, Cortese I, et al. (2000) Minimal
peptide length requirements for CD4(+) T cell clones–implications for molecular
mimicry and T cell survival. Int. Immunol 12: 375–383.
Disordered Patterns in Data Bank and in Proteomes
PLoS ONE | www.plosone.org 14 November 2011 | Volume 6 | Issue 11 | e27142
37. Bogatyreva NS, Finkelstein AV, Galzitskaya OV (2006) Trend of amino acid
composition of proteins of different taxa. J Bioinform Comput Biol 4: 597–608.38. Dunker AK, Obradovic Z, Romero P, Garner EC, Brown CJ (2000) Intrinsic
protein disorder in complete genomes. Genome Inform Ser Workshop Genome
Inform 11: 161–171.39. Altschul SF, Madden TL, Schaffer AA, Zhang J, Zhang Z, et al. (1997) Gapped
BLAST and PSI-BLAST: a new generation of protein database searchprograms. Nucleic Acids Res 25: 3389–3402.
40. Dosztanyi Z, Meszaros B, Simon I (2010) Bioinformatical approaches to
characterize intrinsically disordered/unstructured proteins. Brief Bioinform 11:
225–243.
41. Jorda J, Xue B, Uversky VN, Kajava AV (2010) Protein tandem repeats - the
more perfect, the less structured. FEBS J 277: 2673–2682.
42. Simon M, Hancock JM (2009) Tandem and cryptic amino acid repeats
accumulate in disordered regions of proteins. Genome Biol 10: R59.
Disordered Patterns in Data Bank and in Proteomes
PLoS ONE | www.plosone.org 15 November 2011 | Volume 6 | Issue 11 | e27142
Copyright © 2022 FDOKUMEN