Effect of Silver Nanoparticles on Growth of Eukaryotic Green ...
Upload
khangminh22Category
view
0download
0
Faculty for Biosciences, Fisheries and Economics
Department for Arctic and Marine Biology
Sequence-Based Analysis of Eukaryotic Protein Evolution
—Mathias BockwoldtA dissertation for the degree of Philosophiae Doctor – July 2018


Sequence-Based Analysis of EukaryoticProtein Evolution
Mathias Bockwoldt
A dissertation for the degree of Philosophiae Doctor
July 2018
UiT The Arctic University of NorwayFaculty of Biosciences, Fisheries and Economics
Department of Arctic and Marine BiologyMicroorganisms and Plants Group

The cover image shows two server racks of the high performance computing server Stalloonwhichmost of the computations in this thesis were carried out.The picture was taken byJulien Hollmann. On the side, the PPT tree from Paper II and parts of the mRNA sequenceencoding the enzyme NamPRT from Paper III were added.

I was told bioinformatics is just about pressing <Enter>.This turned out to be wrong…


Contents
Acknowledgements V
Abstract VII
List of publications IX
Abbreviations XI
I Thesis 1
1 Introduction 31.1 Evolution . . . . . . . . . . . . . . . . . . . . . . . . . . . . . . . . . . . . . 3
1.1.1 Macroscopic evolution . . . . . . . . . . . . . . . . . . . . . . . . . 31.1.2 Molecular evolution . . . . . . . . . . . . . . . . . . . . . . . . . . 4
1.1.2.1 The neutral and nearly neutral theory of molecular evo-lution . . . . . . . . . . . . . . . . . . . . . . . . . . . . . 5
1.1.2.2 Genetic drift . . . . . . . . . . . . . . . . . . . . . . . . . 51.1.3 Measures derived from molecular evolution . . . . . . . . . . . . . 6
1.1.3.1 Evolutionary rate . . . . . . . . . . . . . . . . . . . . . . 61.1.3.2 Nucleotide diversity . . . . . . . . . . . . . . . . . . . . . 71.1.3.3 Effective population size . . . . . . . . . . . . . . . . . . 71.1.3.4 Distribution of fitness effects . . . . . . . . . . . . . . . . 71.1.3.5 McDonald-Kreitman test . . . . . . . . . . . . . . . . . . 8
1.1.4 Phylogenetic reconstruction . . . . . . . . . . . . . . . . . . . . . . 81.2 Plastid phosphate transporters . . . . . . . . . . . . . . . . . . . . . . . . . 10
1.2.1 Plastids . . . . . . . . . . . . . . . . . . . . . . . . . . . . . . . . . 101.2.2 Plant phylogeny . . . . . . . . . . . . . . . . . . . . . . . . . . . . 101.2.3 Phosphate transporters . . . . . . . . . . . . . . . . . . . . . . . . . 11
1.2.3.1 The triose phosphate/phosphate translocator (TPT) . . . 121.2.3.2 The phosphoenolpyruvate/phosphate translocator (PPT) 141.2.3.3 The glucose 6-phosphate/phosphate translocator (GPT) . 141.2.3.4 The xylulose 5-phosphate/phosphate translocator (XPT) 15
1.3 Nicotinamide adenine dinucleotide (NAD) . . . . . . . . . . . . . . . . . . 151.3.1 Physiological roles of NAD . . . . . . . . . . . . . . . . . . . . . . 151.3.2 Biosynthesis of NAD . . . . . . . . . . . . . . . . . . . . . . . . . . 18
III

Contents
2 Results and discussion 212.1 Selective features in human disordered protein regions . . . . . . . . . . . 21
2.1.1 Evolutionary forces acting on disordered regions . . . . . . . . . . 222.1.2 The amount of positive selection is likely an underestimate . . . . 232.1.3 Disordered state information helps to find positive selection . . . . 242.1.4 Positive selection in disordered regions in the real world . . . . . . 25
2.2 Phylogeny of plastid phosphate transporters . . . . . . . . . . . . . . . . . 252.2.1 Sequence-based phylogeny . . . . . . . . . . . . . . . . . . . . . . 262.2.2 Structure of the pPT genes . . . . . . . . . . . . . . . . . . . . . . . 292.2.3 Embedding the pPT phylogeny in the early plant evolution . . . . 30
2.3 Phylogeny of NAD salvage and consumption . . . . . . . . . . . . . . . . . 312.3.1 Phylogenetic distribution of enzymes of interest . . . . . . . . . . . 312.3.2 Mathematical modelling of NAD consumption and recycling . . . 342.3.3 Experimental evidence for the modelling results . . . . . . . . . . . 352.3.4 Modelling the role of NADA . . . . . . . . . . . . . . . . . . . . . . 36
2.4 About the phylogenetic methods used . . . . . . . . . . . . . . . . . . . . . 362.5 Other phylogenetic analyses . . . . . . . . . . . . . . . . . . . . . . . . . . 39
2.5.1 NAD salvage in thermophilic bacteria and archaea . . . . . . . . . 392.5.2 Circadian clocks . . . . . . . . . . . . . . . . . . . . . . . . . . . . 402.5.3 The mTOR network . . . . . . . . . . . . . . . . . . . . . . . . . . . 40
3 Conclusions and future perspectives 43
4 Bibliography 45
II Publications 63
Author contributions 65
Paper I Selective features in disordered protein regions 67
Paper II Phylogeny of plastid phosphate translocators 103
Paper III Phylogeny of NAD salvage pathways 145
IV

AcknowledgementsI would like to thank my supervisors Ines Heiland, Toni Gossmann, and Thomas Ratteifor their support and supervision. Ines, you were almost always available. Thank you forgiving me the opportunity to travel to collaborators, visit conferences and workshops andthank you for good company.Thank you, Toni and your group, for allowing me to visit youin Sheffield. We had extremely helpful discussions often over a beer during long evenings.Thank you, Thomas and your group, for my very informative visit at your lab in Vienna atthe beginning of my PhD. You were always answering my mails in high speed with highquality. Thank you, David Hazlerigg, for a good start in biological rhythms.
This work would not have been possible without the financial and administrative sup-port of UiT The Arctic University of Norway.
During my time as PhD candidate, I shared the office with many people in the oldbuilding. Thank you, Stian, Alex, Julien, Lena, and all the other short-term office mates.Thank you, Jø̈rn and Roland, for sharing the office with me in the new building. We hada lot of funny, complicated, inspiring, and fruitful discussions, not to mention the hack-ing contests and gaming nights. Thank you everyone in the “Microorganisms and Plants”group (formerly known as “Molecular Environments Group”) for your support, retreats,and cakes. Thank you, Nicolai, for your work with me as Master student.
Every theoretical work has to seek support in the real world. I would like to thank allcollaborators, especially Mathias Ziegler’s group in Bergen and Kathrin Thedieck’s groupin Groningen for your close collaboration that resulted in several papers. The commonretreats with Mathias Ziegler’s group were always intense and always a pleasure. Thankyou, Sascha Schäuble and Karsten Fischer, for being motivating and bringing publicationsforward.
During my PhD, I was a member of the Norwegian national research school in bioin-formatics, biostatistics, and systems biology, Norbis. Thank you for exciting meetings andcourses and for providing a diverse network.
During the last year, I could work part time with the national high performance clustersFram and Stallo at the Section for Digital Research Services at the Department of Informa-tion Technology at UiT. Thank you, all there, for a very positive working environment andthe chance to try out a new field of work.
Thank you, Anniken and Helmut, for your support in all the years and for enabling meto travel the world. Thank you, Juliane, for being there, helping me wherever possible, andfor marrying me. Thank you, all my friends and family, who visited me in the High Northand made my life better.
V


AbstractAll life on Earth has its genetic information, the blueprint of its working, stored as nu-cleic acid macromolecules, DNA or RNA. This information consists of long strings of fourdifferent bases that together define the shape and function of each individual from thesmallest bacterium to the greatest blue whale. Parts of the nucleic acid macromolecules,the genes, are mostly translated to proteins that fulfil various functions in the single cellbut also across the whole body of an organism. Mutations are changes in these nucleicacid strings that are inherited to the offspring, changing its properties slightly comparedto the parents, until after many generations, a new species may be spawned. Roughly, thegreater the evolutionary distance between two species, the more mutations one can findin the genes.
The goal of this thesis was to comprehend evolutionary patterns in different contexts. Toget a broad spectrum of methods, three projects were included of which one is publishedand two are in preparation. In the first project, we looked into the fate of new mutationsin protein regions that do not have a defined three-dimensional structure. Generally, thefate of a new mutation is governed by selection that can be either purifying, neutral, orpositive. We could show that disordered protein regions tend to be under more positiveand less purifying selection.
For the second project, we looked at four different transporter proteins that are local-ised in the inner plastid membrane. Plastids are organelles that are found in plants andsome closely related species. The best-known type of plastids is the chloroplast, wherephotosynthesis takes place. The four transporter proteins shuttle phosphorylated carboncompounds across the inner membrane to allow an exchange of the products of photosyn-thesis and other metabolic processes to be shared between the plastids and the host cell.In our work, comparing the sequences of those transporters from various plants and algae,we could identify a new subgroup of transporters.
In the third project, we tried to understand the distribution of enzymes that regener-ate the ubiquitous metabolite NAD from its breakdown product nicotinamide. There aretwo pathways that synthesise NAD from nicotinamide. Additionally, nicotinamide can bemethylated and subsequently excreted. We found two predominant patterns in the distri-bution of these pathways in eukaryotes and could explain them with mathematical modelsand cell culture experiments.
All three projects included sequences from extraordinarily many species. The compre-hensive analyses gave insight into the evolution of the respective proteins and pathwaysand highlight the possibilities of phylogenetic analyses.
VII


List of publications
Authors who contributed equally are indicated by an asterisk (*).
Publications included in this thesis
Paper I
Arina Afanasyeva*, Mathias Bockwoldt*, Christopher R. Cooney, Ines Heiland, and ToniI. Gossmann: Human intrinsically long disordered protein regions are frequent targets ofpositive selection. Genome Research 2018 28(7):975–982. doi: 10.1101/gr.232645.117
Paper II
Mathias Bockwoldt, Ines Heiland, and Karsten Fischer: The phylogeny of the plastid phos-phate translocator family. In preparation for Planta
Paper III
Mathias Bockwoldt, Dorothée Houry, Marc Niere, Toni I. Gossmann, Mathias Ziegler, andInes Heiland: NamPRT and NNMT – evolutionary and kinetic drivers of NAD-dependentsignalling. In preparation
Other publications not included in this thesis
Sascha Schäuble*, Anne-Kristin Stavrum*, Mathias Bockwoldt*, Pål Puntervoll, and InesHeiland: SBMLmod: a Python-based web application and web service for efficient dataintegration and model simulation. BMC Bioinformatics 2017 18:314. doi: 10.1186/s12859-017-1722-9
Alexander Martin Heberle*, Judith Elisabeth Simon*, Miriam Langelaar-Makkinje, BjornBakker, Michael Schubert, Ahmed Sadik, Marti Cadena-Sandoval, Wietske Pieters, JanaDeitersen, Björn Stork,Mathias Bockwoldt, Ines Heiland, Christiane A. Opitz, Floris Foijer,and Kathrin Thedieck: Methionine controls cell growth and autophagy via the PRMT5-mTORC1 signaling axis. In preparation for Nature
IX

List of publications
Mirja Tamara Prentzell, Ineke van ’t Land-Kuper, Friederike Reuter, Stefan Pusch, UlrikeBosch, Birgit Holzwarth, Bianca Berdel, Katharina Kern, Laura Corbett, Mathias Bock-woldt, Andreas von Deimling, Ines Heiland, Saskia Trump, Ralf Baumeister, ChristianeA. Opitz*, and KathrinThedieck*: G3BP1 is a subunit of the tuberous sclerosis protein com-plex and acts as its lysosomal tether. In preparation for Nature Cell Biology
Mathias Bockwoldt, Øyvind Strømland, Jörn L. F. Dietze, Mathias Ziegler, and Ines Hei-land: Comparison of NAD salvage in extremophiles and mesophiles. In preparation
X

AbbreviationsSI units, derived units, and unit prefixes as well as element symbols are not listed here.
Molecules2-PGA 2-phosphoglycerate3-PGA 3-phosphoglycerateADP adenosine diphosphateADPR ADP riboseAMP adenosine monophosphateAsp aspartateATP adenosine triphosphatecADPR cyclic ADP riboseDHAP dihydroxyacetone phosphateDNA deoxyribonucleic acidDOX5P 1-deoxy-d-xylulose 5-phosphateEry4P erythrose 4-phosphateG3P glyceraldehyde 3-phosphateGlc6P glucose 6-phosphateGln glutamineGlu glutamateMNam 1-methylnicotinamidemRNA messenger RNANA nicotinic acid/nicotinateNAD nicotinamide adenine dinucleotideNADP NAD phosphateNam nicotinamideNAMN nicotinate mononucleotideNMN nicotinamide mononucleotideNAAD nicotinate adenine dinucleotideNAADP NAAD phosphateOA oxaloacetatePEP phosphoenolpyruvatePi inorganic phosphatePPi inorganic pyrophosphatePRPP phosphoribosyl pyrophosphateQA quinolinic acid
XI

Abbreviations
RNA ribonucleic acidRu5P ribulose 5-phosphateSAC S-adenosyl l-homocysteineSAM S-adenosyl l-methionineTCA tricarboxylic acidTP triose phosphatetRNA transfer RNATrp tryptophanXul5P xylulose 5-phosphate
ProteinsAIF apoptosis-inducing factorDEPTOR DEP domain-containing mTOR-interacting proteinDio2 type II iodothyronine deiodinase EC 1.21.99.4FOXO forkhead box protein OG3BP1 Ras GTPase-activating protein-binding protein 1 EC 3.6.4.12 and 3.6.4.13GAPDH glyceraldehyde 3-phosphate dehydrogenase EC 1.2.1.12GPT glucose 6-phosphate/phosphate translocatorIL21 interleukin 21LAMP lysosome-associated membrane glycoproteinmART mono-ADP-ribosyltransferase EC 2.4.2.31mTOR mechanistic target of rapamycin EC 2.7.11.1mTORC mTOR complexNADA nicotinamide deamidase EC 3.5.1.19NADK NAD kinase EC 2.7.1.23NADS NAD synthase EC 6.3.1.5 and 6.3.5.1NamPRT nicotinamide phosphoribosyltransferase EC 2.4.2.12NAPRT nicotinate phosphoribosyltransferase EC 2.4.2.11NG NADP-glyceraldehyde 3-phosphate dehydrogenase EC 1.2.1.13NMNAT NMN/NAMN adenylyltransferase EC 2.7.7.1 and 2.7.7.18NNMT nicotinamide-N-methyltransferase EC 2.1.1.1PARP poly-(ADP-ribose) polymerase EC 2.4.2.30PGC1α peroxisome proliferator-activated receptor gamma coactivator 1-αPGK phosphoglycerate kinase EC 2.7.2.3PPT phosphoenolpyruvate/phosphate translocatorPRMT5 protein arginine N-methyltransferase 5 EC 2.1.1.320QAPRT quinolinic acid phosphoribosyltransferase EC 2.4.2.19RuBisCo ribulose-1,5-bisphosphate carboxylase/oxygenase EC 4.1.1.39SAMTOR SAM sensor upstream of mTORC1Sir silent information regulator EC 3.5.1.-SIRT sirtuin EC 3.5.1.-
XII

Abbreviations
TPT triose phosphate/phosphate translocatorTRPT tRNA 2’-phosphotransferase EC 2.7.1.160TSHR thyrotropin receptorXPT xylulose 5-phosphate/phosphate translocator
SpeciesA. thaliana Arabidopsis thalianaA. trichopoda Amborella trichopodaB. hygrometrica Boea hygrometricaC. merolae Cyanidioschyzon merolaeC. paradoxa Cyanophora paradoxaD. melanogaster Drosophila melanogasterE. coli Escherichia coliG. sulphuraria Galdieria sulphurariaG. theta Guillardia thetaK. flaccidum Klebsormidium flaccidumN. crassa Neurospora crassaN. nucifera Nelumbo nuciferaS. cerevisiae Saccharomyces cerevisiaeS. elongatus Synechococcus elongatus
Other abbreviationsaa amino acidBlast Basic Local Alignment Search ToolBlastp protein BlastCPU central processing unitDFE distribution of fitness effectsdicot dicotyledone-value expectation valueER endoplasmic reticulumfa fatty acidindel insertions and deletionsMARylation mono-ADP-ribosylationMCMC Markov chain Monte CarloMK test McDonald-Kreitman testmonocot monocotyledonMRCA most recent common ancestorNCBI National Center for Biotechnology InformationNLS nucleotide localisation signal
XIII

Abbreviations
NST nucleotide sugar transporterOPPP oxidative pentose phosphate pathwayPAR poly-(ADP-ribose)PCR polymerase chain reactionpPT plastid phosphate translocatorredox reduction and oxidationSNP single nucleotide polymorphismTSC tuberous sclerosis protein complexUV ultraviolet
XIV

Part I
Thesis


1 Introduction
This thesis is about evolution; more specifically about the evolution of proteins. The workis divided into three papers, listed on page IX. All papers deal with phylogenies, the evo-lutionary relationships among species or genes. Paper I deals with the selective featuresassociated with intrinsically disordered protein regions in humans. We screened all hu-man proteins for disordered regions and compared the selective features of ordered anddisordered regions. Paper II and Paper III are both about smaller, more specific phylogenies.In Paper II, we created the first published phylogenetic overview of the four known plas-tid phosphate transporters in plants and algae. In Paper III, we analysed the phylogeneticdistribution of the two NAD recycling pathways and found strong evidence for functionalco-evolution.
This chapter starts with a general introduction of the very basic concepts of evolutionthat leads to concepts and measures of the field of population genetics that are importantbackground for Paper I. The evolutionary section closes with the basics of phylogeneticreconstructions that are among the core methods used in all papers. Following, an intro-duction to plastid phosphate transporters explains the biological background of Paper II.The last section finally gives the biological background of NADmetabolism that is the topicof Paper III.
1.1 EvolutionAfter a general introduction to evolution, this chapter will give the theoretical backgroundfor Paper I. The final part about phylogenetic reconstruction on page 8 is essential for thewhole thesis as it describes the methods used in all papers to create phylogenetic trees.
1.1.1 Macroscopic evolutionShortly after Charles Darwin published his famous book On the Origin of Species in 1859,the idea of evolution spread throughout the Western world. Although the concept of se-lection as a fundamental mechanism of evolution had been highly disputed for almost acentury, the basic idea that species could evolve from other species was accepted ratherquickly. Today, evolutionary biology intertwines with all other biological fields [Kutscheraand Niklas, 2004].
On a phenotypic scale, the popular understanding of evolution is that random changesin the genotype may change phenotypic traits that may lead to a change in fitness of thatindividual, which will affect the individual’s ability to survive and generate offspring. In-dividuals with a diminished fitness will, on average, produce fewer offspring, by which
3

1 Introduction
the deleterious trait will likely be eradicated from the population. Individuals with an in-creased fitness will, on average, producemore offspring.This does not imply that beneficialtraits will always spread. Especially when the trait is new and only few individuals possessit, there is a chance that these individuals die by chance without generating offspring.
In general, a population of higher organisms will adapt to its environment by randomintroduction and proliferation of traits that increase fitness. Individuals may also adapt totheir environment by transient changes in the DNA, such as methylation. These changesmay affect gene expression and are part of the field of epigenetics [Dupont et al., 2009].Although epigenetic changes may be inherited [Peters, 2014], they are not considered inthis thesis.
1.1.2 Molecular evolutionBesides environmental and, for higher animals, social factors, every known living organismis defined by its genetic information in the form of DNA. Parts of the DNA encode forproteins or functional RNAs and may be transcribed into RNAs and, if coding for a protein,translated into proteins by the ribosomal machinery. Three DNA bases may form a codonthat encodes for one amino acid in the protein. As there are four different DNA bases, thereare 43 = 64 codons. With the twenty canonical amino acids and three stop codons, thereare about three times more possible codons than amino acids. Consequently, many aminoacids are encoded by more than one codon. This means that there is more informationcontained in DNA than in protein sequences and that DNA may change without changingthe encoded protein.
The only process that can produce new genetic information is mutation, the irreversiblealteration of DNA. Such alterations can occur by random chemical reactions in the DNAbase, possibly boosted, for example, by UV light or chemical agents. Mutations can alsobe introduced by enzymes while copying the DNA to prepare for a cell division or by en-zymes that try to repair DNA after a strand break. The de novo germline mutation rate µ isestimated to be around µ ≈ 5 · 10−10 mutations per base pair per year in humans [Scally,2016]. Mutations can be classified roughly as either advantageous, detrimental, or neutral,meaning without any effect to the fitness of the organism. Mutations are only passed on tothe next generation if they occur in the germ line. After fertilization and the first mitosis,mutations can be mixed by homologous recombination, a process, in which the chromo-somes of both parents exchange genetic material. As humans have pairs of chromosomes,every gene normally exists in two copies, the alleles, unless one parent lost or gained acopy. If both alleles are identical, the cell or organism is described as homozygous on thatallele, whereas different alleles make the cell or organism heterozygous.
In Paper I, we investigated the selective features associated with disordered proteinregions and found evidence for a widespread role of positive selection in these regions.For this investigation, several theoretical models and derived measures from the field ofmolecular evolution and population genetics were applied. Population genetics was intro-duced in the early 20th century, often attributed to Fisher [1930] and Wright [1931], anddeals with the causes of genome-wide variability in biological populations [Charlesworth,2010]. In very broad terms, population genetics is the science of genetic variation within
4

1.1 Evolution
a species, while the field of molecular evolution investigates genetic differences betweenspecies.
1.1.2.1 The neutral and nearly neutral theory of molecular evolution
The concept of Darwinian evolution was adapted to molecular evolution. The commonnotion was that DNA mutations are either beneficial or detrimental and will hence beeither fixed or removed from the population after a sufficient number of generations. Still,scientists were puzzled by the observation that a change in the genome through amutationmay not be visible phenotypically at all and that the impact of a mutation may not haveany influence on the fitness.
This neutrality of mutations was recognised and emphasised with the neutral theoryof molecular evolution [Kimura, 1968; King and Jukes, 1969]. Kimura, King, and Jukes ar-gued that the evolutionary pressure on populations would be too high given the estimatedmutation ratewhen considering only positive or negative selection. If most of themeasuredmutations would be non-neutral, the number of offspring would be too low to maintain astable population as the number of juvenile deaths and infertility would increase [Haldane,1957]. They concluded that most mutations would be either detrimental or effectively neu-tral, but only very few beneficial. Beneficial mutations, according to theory, would be sorare that they are not needed to be considered to model the sequence evolution properly.Detrimental mutations would, as in macroscopic evolution, quickly be removed from thepopulation. Neutral mutations would not have any effect on the fitness. Their fate would,according to the theory, be determined by genetic drift (see below).
Shortly after, the nearly neutral theory of evolution was proposed by Ohta [1973]. Thistheory allows for slightly deleterious (nearly neutral) mutations that may, depending onthe effective population size, still be fixed in the population although they are deleterious.Thereby, the theory also allows for a continuous distribution of fitness effects of mutations.If nearly neutral mutations are relatively common, there is a negative correlation betweenevolutionary rate and population size that is in contrast to absolutely neutral mutationsthat are independent of population size [Ohta and Gillespie, 1996].
1.1.2.2 Genetic drift
Genetic drift describes the change of the frequency of a mutation by random samplingof organisms. If a mutation has no influence on the fitness of the particular individual,the fate of the mutation will only be determined by pure chance. The frequency of thatmutation in the offspring generation is entirely determined by random sampling of theparental generation.
A mutation on gene A1 will lead to the allele (i.e. a variant of a gene) A2. The mutationis considered fixed in a population when all its individuals possess only the allele A2 butnotA1. Given that no other mutations occur, the alleleA2 will eventually either be fixed orlost. This is in contrast to the Hardy-Weinberg law. This law was independently proposedby Hardy [1908] andWeinberg [1908] and states that the number of alleles in a sufficiently(infinitely) large population stays constant. Real life populations have a limited size and
5

1 Introduction
the assumption of panmixia (random mating) is not met. The expected time until fixationof an allele was estimated to be directly proportional to the effective population size de-scribed below [Kimura and Ohta, 1969]. Genetic drift must not be confused with geneticdraft where a change in allele frequency is due to close-by non-neutral genes that have aninfluence on fitness [Gillespie, 2001; Smith and Haigh, 1974].
1.1.3 Measures derived from molecular evolution1.1.3.1 Evolutionary rate
To get an estimate of the influence of purifying selection, genetic drift and positive selec-tion, the evolutionary rate ω may be used. It is a measure of sequence divergence and canbe estimated in various ways. In Paper I, we use ω as the ratio of non-synonymous tosynonymous substitution rates (denoted as dN and dS , respectively). It has been shownthat the way to estimate ω is less important if enough data is available [Kosakovsky Pondand Frost, 2005]. As described above, there are more codons than amino acids. This meansthat the DNA can be changed without changing the encoded amino acid. In protein-codinggenes, a change in DNA that does not change the protein is called synonymous and maybe considered neutral for the sake of evolutionary rate. An example might be a mutationfrom the codon TAT to TAC, which are both translated to tyrosine. Likewise, all DNAchanges that lead to a change in the protein are considered non-synonymous and, hence,non-neutral [Yang, 2014, p. 47].
The evolutionary rate ω = dN/dS can be calculated for coding regions of genomes,single genes, or parts of genes. One may choose to calculate ω among a whole gene orspecies tree or only on a specific branch of a tree. In Paper I, we used a site-specific evo-lutionary rate model in a maximum likelihood framework that estimates ω for the samesites among all species in the tree. In our case, we used three types of sites; ω = 1, ω < 1,and ω > 1. This demands very good sequence alignments in order to compare the correctsite of each species.
When looking at the site-specific evolutionary rate,ω ≈ 1means that the site is evolvingneutrally and that amino acid-changing mutations reach fixation at the same rate as synon-ymous mutations. In other words, there is no detectable advantage or disadvantage to keepor change the amino acid at that site. If ω < 1, the site is under purifying selection.The sitetends to keep its amino acid. An amino acid change at that site may have adverse effectssuch as reduced or unspecific binding, diminished activity, or failure to fold properly. Thisis the usual result for an analysis of evolutionary rate in protein coding genes of higherorganisms, as normally, most changes of amino acids in a protein will have adverse effects.If ω > 1, the site is under diversifying selection. It tends to change its amino acid, as thiswill likely increase the fitness of the protein. Genes of the immune system, for example,have been shown to evolve particularly rapidly due to positive selection [Elhanati et al.,2014; Vatsiou et al., 2016].
6

1.1 Evolution
1.1.3.2 Nucleotide diversity
A measure of genetic variation within a population is the nucleotide diversity π. If all se-quences in a sample are compared pairwise, nucleotide diversity is the average numberof nucleotide differences for each site. Originally, this measure was used to estimate thegenetic variation within a population [Nei and Li, 1979], but it was later adopted to inter-species use [Lynch and Crease, 1990]. In Paper I, we estimate the nucleotide diversity atsynonymous (πS) and non-synonymous (πN ) sites for various proteins among mammalianspecies. The rate ratio πN/πS can indicate the efficacy of purifying selection [Chen et al.,2017]. The value tends to become larger under less efficient purifying selection, becausenon-synonymous mutations accumulate relative to synonymous mutations.
1.1.3.3 Effective population size
An important measure of population genetics used in many other methods is the effectivepopulation size, often abbreviated as Ne, with the census population size being N . Theeffective population size estimates how large an idealised population would have to be toshow the same rate of loss of genetic diversity as measured in the real population [Charles-worth, 2009]. It was introduced in the early days of population genetics to allow calculatingthe importance of genetic drift [Wright, 1931]. Together with Fisher, Wright proposed anidealised population now known as the Wright-Fisher population. It has a constant size,the individuals are hermaphrodites that mate randomly, and generations are not overlap-ping [Akashi et al., 2012]. For a real population, many of the strong assumptions definingan ideal population can be accounted for by the effective population size.
A common way to estimate the effective population size of diploid organisms¹ is Ne =π/(4µ), where π is the nucleotide diversity and µ is the mutation rate, given in nucleotidemutations per generation [Gossmann et al., 2012a]. Othermethods were reviewed byWanget al. [2016].
1.1.3.4 Distribution of fitness effects
The three types of mutation, deleterious, (nearly) neutral, and advantageous, are oftenregarded as three distinct groups. In real life, the effect of a given mutations lies on a con-tinuum ranging from highly deleterious to highly advantageous. When looking at multiplemutations, the strength of selection of each mutation is placed on this continuum. This iscalled the distribution of fitness effects (DFE) [Eyre-Walker and Keightley, 2007].
The fitness, also called the effectiveness of selection in this context, is often expressedas the productNes, whereNe is the effective population size and s is the strength of selec-tion. This selection strength (sometimes called selection coefficient) denotes the selectiveadvantage of a new allele over the already existing alleles in general [Kimura, 1968] or overthe predominant wildtype allele [Yang, 2014, p. 391]. The higher the strength of selection,the more advantageous the mutation is and the more likely it is that the mutation becomesfixed. Negative values of s mark deleterious mutations that are very unlikely to become
¹Ne = π/(2µ) for haploid organisms
7

1 Introduction
fixed. The effective population sizeNe is important because, as described above, mutationshave a higher chance of becoming fixed in a small population size, so the fitness of a muta-tion is dependent on its strength of selection and the effective population size. Practically,the DFE is often only shown for negative selection, because the number of mutations un-der positive selection is usually very low. Conventionally, when reporting Nes, actuallythe absolute value is given (|Nes|).
For mutations with Nes ≫ 1, the fate of the mutation is mostly governed by naturalselection. If Nes is close to zero (Nes ≪ 1), the mutation is neutral or nearly neutral andits fate dominated by genetic drift [Eyre-Walker and Keightley, 2007].
1.1.3.5 McDonald-Kreitman test
Substitutions are mutations that became fixed within a species but differ from closely re-lated species. Polymorphisms are mutations that occur within a species and are not fixed.Hence, substitutions can only be detected between species, but not within.
The McDonald-Kreitman (MK) test compares fixed substitutions with segregating poly-morphisms at non-synonymous and synonymous sites [McDonald and Kreitman, 1991].It was originally conceived to test the neutral theory. In a neutral substitution, the ratioof non-synonymous to synonymous substitutions and polymorphisms would be at parity.If there were more fixed substitutions than expected from the observed polymorphisms,they would have to stem from adaptive fixation. This is because a mutation that becomesfixed by selection will become fixed faster than a mutation that is dependent on geneticdrift. Hence, an adaptive mutation will less likely appear as a polymorphism than a neu-tral mutation, but will be visible in an interspecies comparison [McDonald and Kreitman,1991].
The amount of positive selection can be quantified in an MK test framework and is usu-ally denoted as α, the proportion of fixed substitutions that were driven by positive selec-tion relative to genetic drift [Gossmann et al., 2010]. Formally, α = 1− (DSPN)/(DNPS),where D is the relative rate of (non)-synonymous substitutions and P the rate of (non)-synonymous polymorphisms. A derivative is ωa, which is the ratio of the rate of adaptivenon-synonymous substitutions and synonymous substitutions. This derivative is impor-tant when the number of neutral non-synonymous substitutions varies among the samples[Gossmann et al., 2010]. Both, α and ωa are measures of the role of positive selection.
The metrics described so far are all used in Paper I to assess the selective features ofdisordered protein regions.
1.1.4 Phylogenetic reconstruction
Phylogenetic reconstruction is the common method used in the three papers of this thesis.It is used to infer the pathways of evolutionary change that led to the current species, genes,and proteins [De Bruyn et al., 2014]. Although there aremethods to infer the phylogeny (i.e.the historical relation between species or genes) from phenotypic features, phylogeneticreconstructions based on DNA or protein sequence information were used for this work.
8

1.1 Evolution
Thefirst step for a phylogentic reconstruction based on sequences is always the retrievalof sequences. In Paper I, we used MobiDB [Piovesan et al., 2018] and the RefSeq databaseof the American National Center for Biotechnology Information (NCBI); in Paper II andPaper III, we use the non-redundant protein database of the NCBI. Sequences were identi-fied or, at least, classified in all papers using the Basic Local Alignment Search Tool (Blast)[Altschul et al., 1990]. This heuristic algorithm can compare a given sequence against ahuge database in relatively short time. This lets the user find similar sequences to the se-quence of interest in databases.
The second step is the alignment of sequences. Insertions and deletions (indels) can com-plicate an alignment up to the point that it becomes impossible to align sequences withhigh confidence. There are several classes of algorithms and a plethora of implementationsto align multiple sequences efficiently. In Paper I, we used a whole workflow of severalalignment programs and quality control algorithms, including MSAProbs [Liu et al., 2010],Zorro [Wu et al., 2012], Gblocks [Castresana, 2000], and Muscle [Edgar, 2004]. In Paper II,the tool of choice was BAli-Phy [Suchard and Redelings, 2006], a tool that uses likelihood-based evolutionary models to align sequences and to create phylogenetic trees from thealignment. It uses a Bayesian inference framework in which the inferred trees serve asinput for the next iteration of sequence alignment and subsequent tree generation. Afterseveral thousand iterations (optimally after the parameters have converged), a consensusalignment and tree are generated based on the posterior probabilities. Blast was the ma-jor tool used in Paper III. In addition, sequence alignments between sequence pairs werecreated using the classic Needleman-Wunsch algorithm [Needleman and Wunsch, 1970],a deterministic algorithm that guarantees an optimal global alignment but that is slowand scales poorly (quadratically) with the sequence lengths and is therefore not efficientenough for large-scale alignments.
All alignment tools need parameters to determine alignment quality. These parametersusually include a scoring matrix determining how “good” a match or how “bad” a mis-match is. To handle indels, the parameters also need penalties for gaps in the alignment,often divided in gap opening and gap extending penalties. More sophisticated algorithmsuse maximum likelihood-based matrices or hidden Markov models based on evolutionarymodels.
After an alignment was created, a phylogenetic tree can be estimated. Such a tree showsa likely evolutionary relationship between the sequences. As with sequence alignments,there are various tree generation algorithms and software applications available. An ex-tensive overview of available algorithms was written by Yang [2014]. The more sophist-icated tools use maximum likelihood or Bayesian inference to estimate a tree based onvarious evolutionary models. Such models include a base frequency for every DNA base aswell as transition probabilities between the states [Felsenstein and Churchill, 1996]. Phylo-genetic trees are necessary for many subsequent analyses and are a clear overview of therelationships of the aligned sequences.
Themethods described here, were used in all three papers to generate phylogenetic trees.Their use in this work is further discussed on page 36.
9

1 Introduction
1.2 Plastid phosphate transportersPaper II deals with the phylogeny of plastid phosphate transporters of Archaeplastida, aclade containing land plants, green algae, Rhodophyta (red algae), and glaucophytes. Inthis chapter, the biological background for the paper is explained. After an introduction toplastids and plant phylogeny, the chapter closes with a thorough presentation of the fourplastid phosphate transporters.
1.2.1 PlastidsPlant cells in the wider sense possess a special organelle, the plastid. Similarly to mitochon-dria and contrary to other organelles, the plastids originated from cyanobacteria that weretaken up by a host cell. The first who realised that chloroplasts are not primeval parts oftheir host cell was probably Schimper [1883]. He noted that plastids divide on their own,independently of their host cells and that the nature of plastids remind of symbionts. Basedon these findings, the “symbiogenesis”, now known as primary endosymbiosis, was postu-lated byMereschkowsky [1905, 1910]. Today, this theory is supported bymany findings forboth plastids and mitochondria [Archibald, 2015]. In addition, there are various examplesof secondary endosymbiosis, where an organism that already had an endosymbiont wasengulfed by another eukaryotic cell. This process happened several times leading to vari-ous algae taxa like Cryptophyta, Dinophyta, and Apicomplexa, reviewed for example byGentil et al. [2017].
The cyanobacteria have undergone many changes on their way to chloroplasts and thetransformation is probably ongoing [Huang et al., 2003]. About 90% to 95% of the genes,for example, have been lost or transferred from the plastid genome to the host genome[Martin et al., 2002].
The metabolism has also changed substantially. Plastids depend on metabolites fromtheir hosts. As they are surrounded by two membranes, the transport of molecules andions has to be facilitated by transport proteins in the membranes. The outer membranepossesses many porins that act as channels that allow passive diffusion of molecules andions up to around 10 kD through the membrane [Flügge and Benz, 1984]. The inner mem-brane is the real barrier of permeability between cytosol and stroma (content of plastids).It contains many different specialised transporters of which the plastid phosphate trans-porters (pPTs) are just one group that is explained in more detail further below.
Besides the membrane transporters of which the genes were identified, there are manyplastid membrane transporters predicted based on the localization of metabolic pathways.Some transport activity was also measured without knowing the corresponding proteinor gene. For an overview of plastid transporters, see Fischer [2011] and Weber and Linka[2011]. For more details on ion transporters, see Finazzi et al. [2015].
1.2.2 Plant phylogenyThe basal taxon of all plants in a wider sense are the Archaeplastida that emerged with thefirst uptake of a photosynthetically active cyanobacterium by a host cell. Shortly after, the
10

1.2 Plastid phosphate transporters
Glaucophyta, a group of microscopic freshwater algae, split off the main branch. Later, thebranch divided into red algae and the “green lineage” Viridplantae. Red algae are known formultiple occasions of higher order endosymbiosis, where a eukaryotic cell took up another,photosynthetically active eukaryotic cell. The Viridplantae were split into green algae andCharophyta that shortly after split into Klebsormidiophyceae and Embryophyta, the landplants. So far, the only sequenced member of the Klebsormidiophyceae is Klebsormidiumflaccidum, giving it a special role as a species in the transition between green algae and landplants. Early in the evolution, the land plants separated intomosses (Embryophyta) and theseed-possessing Spermatophyta, which can be further divided into gymnosperms (contain-ing for example conifers and Ginkgo) and angiosperms [Yoon et al., 2004]. The two largegroups of angiosperms are the monocots and the dicots. Monocots contain for exampleorchids, grasses (Poaceae), and lilies. They comprise most of the major agricultural plants.Dicots are a paraphyletic group that is comprised of several small groups that contain forexample spinach (Spinacia oleracea) or lotus (Nelumbo nucifera) and two large groups, therosids, containing besides many others the famous model plant Arabidopsis thaliana, andthe asterids that contain, for example, tobacco and tomato [Ruhfel et al., 2014]. A thoroughoverview is given in Singh [2010].
Independent of the general plant phylogeny, several different systems for carbon fix-ation have evolved. In C3 plants, ribulose-1,5-bisphosphate carboxylase/oxygenase (Ru-BisCo) fixates carbon dioxide directly from the air to produce 3-phosphoglycerate (a mo-lecule with three carbon atoms) that is then further processed in the Calvin cycle. In C4
plants, carbon fixation happens in two different cell types. In mesophyll cells, carbon di-oxide is bound to molecules, yielding organic acids with four carbon atoms. These organicacids are then shuttled to the bundle sheath cells, where the carbon dioxide is releasedagain. RuBisCo finally introduces the carbon dioxide into the Calvin cycle. This processprovides a higher carbon dioxide partial pressure in the bundle sheath cells, such that Ru-BisCo works more efficiently and does not fixate oxygen, a detrimental process that occursmore often, the warmer it is [Kellogg, 2013]. C4 plants also lose less water than C3 plants.The correlation of higher temperatures with RuBisCo oxygenase activity and water lossmakes C4 carbon fixation more advantageous for plants in dry, warm areas, despite thenecessary sophisticated transport machinery [Kellogg, 2013]. About 5% of plant speciesare C4 plants. The C4 fixation system emerged independently several times [Heckmannet al., 2013]. It is wide spread among important crop species and can be mainly found inPoales, Caryophyllales, and some smaller clades. The distribution of C4 plants was compre-hensively reviewed by Sage [2016].
1.2.3 Phosphate transportersAll plants and algae possess plastid phosphate transporters. These membrane proteins areantiporters that transport inorganic phosphate and phosphorylated organic carbon com-pounds in a ping-pong mechanism [Flügge, 1992]. As all substrates contain a phosphateresidue, the phosphate homeostasis between cytosol and stroma is ensured. All pPTs act ashomodimers [Weber and Linka, 2011]. While lower plants and algae only possess few dif-ferent pPTs, most higher plants possess a full repertoire of four different transporters, some
11

1 Introduction
in multiple copies [Weber et al., 2006]. These transporters differ in the specificity for phos-phorylated organic carbon compounds. The major compounds and respective transportersthat transport those compounds (in brackets) are triose-phosphate and phosphoglycerate(TPT), phosphoenolpyruvate (PPT)², glucose 6-phosphate (GPT), and xylulose 5-phosphate(XPT). All four transporters likely share a single common ancestor, a host nucleotide sugartransporter [Colleoni et al., 2010; Weber et al., 2006].
1.2.3.1 The triose phosphate/phosphate translocator (TPT)
The triose phosphate/phosphate translocator shuttles triose phosphates (TPs), 3-phospho-glycerate (3-PGA), or inorganic phosphate between chloroplast and cytosol [Flügge andHeldt, 1984]. TPs is a collective term used for glyceraldehyde 3-phosphate (G3P) and di-hydroxyacetone phosphate (DHAP) that are reversibly interconverted by the triose phos-phate isomerase. All phosphorylated carbohydrates are products of the plastid Calvin cycleand the plastid and cytosolic glycolysis and gluconeogenesis (fig. 1). Consequently, the TPTis mainly expressed in photosynthetically active tissues and responsible for carbon exportfrom chloroplasts [Schulz et al., 1993]. TPs in the cytosol can be used for sucrose, aminoacid, and cell wall biosynthesis. They can also be converted into 3-PGA by two possiblepathways to generate ATP and NAD(P)H. TPs may either be directly converted by NADP-glyceraldehyde phosphate dehydrogenase (NG), thereby reducing NADP+ to NADPH; orthey may first be oxidised by glyceraldehyde 3-phosphate dehydrogenase (GAPDH) to1,3-diphosphoglycerate and subsequently dephosphorylated by phosphoglycerate kinase(PGK) to 3-PGA.The second pathway produces one NADH from NAD+ and one ATP fromADP.
TPT is the most abundant transporter in chloroplasts of C3 plants. In C4 plant chloro-plasts, TPT is not only expressed in bundle sheath cells, where the Calvin cycle is localised,but also in mesophyll cells (fig. 1C). Due to the limited activity of photosystem II in bundlesheath cells, and the resulting low levels of NADPH, the reduction of 3-PGA to TPs occursin mesophyll cell chloroplasts [Majeran et al., 2008; Meierhoff and Westhoff, 1993]. TPT isalso expressed in non-photosynthetic proplastids of cauliflower. As in C4 bundle sheathcell chloroplasts, the transporter is probably necessary for the indirect transport of redoxequivalents into the plastids [Bräutigam and Weber, 2009].
In the red algae Galdieria sulphuraria, the TPT does not transport 3-PGA [Linka et al.,2008], but probably exports TPs to provide carbon for the synthesis of a starch-like storagepolymer in the cytosol during daytime. When light is absent, TPs are imported into theplastids to supply carbon while CO2 assimilation is disabled [Linka et al., 2008; Viola et al.,2001].
The cryptomonad Guillardia theta has a secondary plastid with four membranes. It pos-sesses two known variants of the TPT that apparently transport TPs and phosphoenol-pyruvate (PEP), but not 3-PGA [Haferkamp et al., 2006]. One variant, TPT1, is expressedduring the night while the other, TPT2, is expressed during the day. The hypothesis is thatthe TPT2 is localised in the inner membranes to export TPs that are produced in the Calvin
²The nomenclature may be confusing: pPT is the abbreviation for all plastid phosphate transporters,whereas PPT is specifically the phosphoenolpyruvate phosphate transporter.
12

1.2 Plastid phosphate transporters
Figure 1 – The role of the four classes of plastid phosphate transporters in plant cells. Fordetails, see text. Arrowheads indicate the net flux under normal physiological conditions, al-though most reactions are reversible. Inorganic phosphate, ATP, and enzyme names are notshown. A) Autotrophic C3 cell B) Heterotrophic cell. Some heterotrophic cells (e.g. in cauli-flower) may in addition express the TPT to transport redox equivalents into plastids. C) Bundlesheath cell and mesophyll cell of a C4 plant. For simplicity, only the processes necessary forcarbon fixation are shown.3-PGA: 3-phosphoglycerate, AA: amino acid synthesis, Ery4P: erythrose 4-phosphate, FA:fatty acid synthesis, Glc6P: glucose 6-phosphate, GPT: Glc6P/phosphate translocator, NADPH:nicotinamide adenine dinucleotide phosphate, OA: oxaloacetate, OPPP: oxidative pentosephosphate pathway, PEP: phosphoenolpyruvate, PPT: PEP/phosphate translocator, TCA: tri-carboxylic acid, TP: triose phosphate, TPT: TP/phosphate translocator, XPT: Xul5P/phosphatetranslocator, Xul5P: xylulose 5-phosphate.
13

1 Introduction
cycle, to the periplastid, the space between the second and third membrane, where starchsynthesis occurs. Under dark conditions, starch is degraded again to TPs and the TPT1 isexpressed and brought to the outer membranes of the plastid. The TPT1 may then exportTPs to the cytosol where they are used to generate ATP and redox equivalents [Haferkampet al., 2006].
1.2.3.2 The phosphoenolpyruvate/phosphate translocator (PPT)
The phosphoenolpyruvate/phosphate translocator enables the transport of PEP, 2-PGA,and inorganic phosphate [Fischer et al., 1997]. The PPT is most abundant in chloroplastmembranes of mesophyll cells of C4 plants. They were also found in C3 plants, includingnon-green tissues (fig. 1).
As chloroplasts, in contrast to most other types of plastids, do not possess phosphogly-cerate mutase or enolase, they are unable to synthesise PEP from 3-PGA and depend onPEP supply from the cytosol [Borchert et al., 1993; Prabhakar et al., 2009]. PEP is, as partof glycolysis, dephosphorylated to pyruvate. Plastids do not possess the citric acid cyclebut need pyruvate for the synthesis of the branched amino acids valine, leucine, and iso-leucine and for the synthesis of fatty acids. In addition, PEP is, together with erythrose4-phosphate (Ery4P) from the Calvin cycle, a substrate for the shikimate pathway. Theshikimate pathway is located in plastids and leads to the synthesis of folates and the aro-matic amino acids phenylalanine, tyrosine, and tryptophan [Schmid and Amrhein, 1995].These are used either for protein synthesis or for the biosynthesis of alkaloids, flavonoids,lignin, and other compounds of the secondary metabolism [Herrmann, 1995; Herrmannand Weaver, 1999]. In root plastids of C3 plants, PEP synthesis from 3-PGA is possible.Nevertheless, PPT is present and probably used to export excess PEP to the cytosol foruse in the citric acid cycle [Staehr et al., 2014]. The PPT of the red algae G. sulphurariais also an antiporter of PEP and inorganic phosphate and its function is similar to that inchloroplasts of C3 plants [Weber and Linka, 2011].
In C4 plants, the export of PEP from chloroplasts is an important step in C4 metabolism.PEP is synthesised in the mesophyll cell plastids from pyruvate, whereas the primary fixa-tion of CO2 happens in the cytosol by adding carbonic acid to PEP by the PEP carboxylase.This reaction releases a phosphate molecule that can be used as counter molecule for thePEP transport via PPT. In green tissues of C3 plants, PPT imports PEP to plastids, whereasin non-green tissues and C4 plants, PPT exports PEP to the cytosol.
1.2.3.3 The glucose 6-phosphate/phosphate translocator (GPT)
The glucose 6-phosphate/phosphate translocator has a broad substrate specificity. It ac-cepts the eponymous glucose 6-phosphate (Glc6P), xylulose 5-phosphate (Xul5P), 3-PGA,TPs, and inorganic phosphate [Kammerer et al., 1998]. The GPT is only expressed in non-green tissues and is required to provide the plastids with Glc6P as substrate for starch bio-synthesis and production of redox equivalents in the oxidative pentose phosphate pathway(OPPP) for glutamate and fatty acid biosynthesis and the reduction of nitrite (fig. 1B). Car-bohydrates are delivered to the heterotrophic cell via the phloem, where they are processed
14

1.3 Nicotinamide adenine dinucleotide (NAD)
and phosphorylated to Glc6P, which is then transported into the plastids. The counter sub-strate is either inorganic phosphate released during starch biosynthesis or TPs from theOPPP [Kammerer et al., 1998; Niewiadomski et al., 2005]. Heterotrophic plastids often lackthe fructose 1,6-bisphosphatase and are not capable to synthesise starch and hexose phos-phates from TPs [Neuhaus et al., 1993].
In the red algae G. sulphuraria, a transporter was identified as GPT by sequence simi-larity, but experiments with reconstituted GPT displayed no measurable Glc6P transportactivity [Linka et al., 2008; Weber et al., 2004].
1.2.3.4 The xylulose 5-phosphate/phosphate translocator (XPT)
The xylulose 5-phosphate/phosphate translocator accepts mainly Xul5P, TPs, and inor-ganic phosphate (fig. 1A and B). Ribulose 5-phosphate (Ru5P) and Ery4P are also acceptedas substrate but with a very low affinity, which makes it unlikely that they are transpor-ted in high amounts under physiological conditions [Eicks et al., 2002]. It was proposedthat XPT connects the cytosolic and plastid pentose phosphate pathways [Flügge et al.,2003]. XPT is needed to supply pentose phosphates to the plastid Calvin cycle and OPPP. Inmany plants, the cytosolic OPPP lacksmost of the non-oxidative part because transketolaseand transaldolase are missing. Hence, the OPPP stops after synthesising Xul5P, which isshuttled to the plastids, where the pathway is completed [Kruger and von Schaewen, 2003].XPT seems to occur only in vascular plants [Weber and Linka, 2011]. Both XPTs and GPTscan transport Xul5P, but XPT is more efficient, because it is not competitively inhibitedby Glc6P [Eicks et al., 2002]. Another proposed function is the import of 1-deoxy-d-xylu-lose 5-phosphate (DOX5P) into plastids. DOX5P is part of the deoxyxylulose phosphatepathway [Flügge and Gao, 2005] that is located in plastids and produces terpenoids andisoprenoids.
A detailed overview of the phylogeny of these four pPTs was analysed to our knowledgefor the first time in Paper II.
1.3 Nicotinamide adenine dinucleotide (NAD)Paper III shows and explains the remarkable phylogenetic distribution of the three enzymesthat consume nicotinamide (Nam), Nam phosphoribosyltransferase (NamPRT), Nam-N-methyltransferase (NNMT), and Nam deamidase (NADA). Nicotinamide is the degrada-tion product of NAD signalling reactions and major precursor for NAD in human. In thissection, the manifold roles of NAD signalling that all produce Nam are introduced. Thesecond part of the section deals with the recycling pathways from Nam to NAD and theNam excretion.
1.3.1 Physiological roles of NADNicotinamide adenine dinucleotide (NAD) is a molecule abundant in all taxonomic do-mains and all cells [VanLinden et al., 2015]. It acts as cofactor in more than 20% of all
15

1 Introduction
Figure 2 – Structure and redox reaction of NAD and NADP. NAD can be phosphorylated atthe lower ribose moiety to yield NADP. Redox reactions act on the nicotinamide moiety. Theinvolved hydrogen atoms are shown in red.
known reactions in the Kyoto Encyclopedia of Genes and Genomes³ [Kanehisa and Goto,2000]. NAD can be phosphorylated by NAD kinase to NAD phosphate (NADP; fig. 2). Both,NAD and NADP, function as cofactors in redox reactions and have an equal standard redoxpotential⁴ [Berg et al., 2010, p. 529]. The oxidised forms, NAD+ and NADP+, are electrondonors for various enzymes, especially dehydrogenases. The reduced forms are denotedNADH and NADPH, respectively (fig. 2) and are electron acceptors. Probably the mostfamous example of an NAD redox cycle is the tricarboxylic acid (TCA) cycle and the oxida-tive phosphorylation. NAD+ is reduced to NADH by three enzymes in the TCA cycle. Thisreduction potential is then used in complex I of the oxidative phosphorylation to reduceubiquinone and pump H+ ions out of the mitochondrial matrix to eventually produce ATPfrom ADP. The ratios of oxidised and reduced forms differ among cell types, but generallyNAD is prevalent in its oxidised form while NADP is prevalently found in its reduced form[e.g. Veech et al., 1969; Williamson et al., 1967]. The average concentration of NAD(P) ineukaryotic cells ranges from 0.2mM to 2mM, where about 80% to 90% are in a bound form[Belenky et al., 2007; Blinova et al., 2005; Yang et al., 2007]. As a rule of thumb, NAD redoxreactions are mainly involved in ATP production, whereas NADP is involved in anabolismand maintenance of the cellular redox status [Oka et al., 2012].
Besides the well-known role as partner in redox reactions, NAD and NADP are impor-tant in cell signalling. The common pattern is that the oxidised form, NAD+ or NADP+,is cleaved to Nam and ADP ribose or 2’-phopho-ADP-ribose, respectively [Berger et al.,2004]. NAD-consuming enzymes are sensitive to the available NAD+ concentration [Rug-gieri et al., 2015]. A diminished biosynthesis of NAD quickly leads to a strong decline of
³http://www.genome.jp/kegg/reaction; update from 01.04.2018; accessed 14.05.2018⁴E′
0 = −320mV [Berg et al., 2010, p. 529]
16

1.3 Nicotinamide adenine dinucleotide (NAD)
the NAD concentration [Buonvicino et al., 2018], emphasising the importance of NAD-consuming reactions.
NAD is necessary for the ADP-ribosylation of proteins. This post-translational modi-fication comes either as poly-(ADP-ribosyl)ation (PARylation) or mono-ADP-ribosylation(MARylation). MARylation is mostly observed for cell surface proteins, particularly onimmune cells, and facilitates cell-cell communication [Bütepage et al., 2015]. PARylationplays an important role in DNA repair. The poly-(ADP-ribose) polymerase 1 (PARP1) isrecruited to DNA single strand breaks and catalyses PARylation of proteins that are at-tached to the DNA close to the strand break, including itself. This modification leads toa decreased affinity of the proteins to the DNA, detaching the proteins from the DNA tomake space for the repair machinery. PARylation itself also recruits DNA repair enzymes[De Vos et al., 2012]. Too high concentrations of poly-(ADP-ribose) may lead to apoptosisvia the release of the apoptosis-inducing factor (AIF) [Hong et al., 2004]. If the PARylationgets too extensive, even necrosis may be induced by the low NAD concentration [Ha andSnyder, 1999].
The enzymes PARP1, PARP2, and tankyrase 1 and 2 show only PARylation activity [DeVos et al., 2012]. All other PARPs show MARylation activity [Vyas et al., 2014]. PARP3and PARP10 show both, MARylation and PARylation activity [Rouleau et al., 2007; Yuet al., 2005]. PARP9 shows MARylation of ubiquitin [Yang et al., 2017] and is, togetherwith PARP14, involved in macrophage activation [Iwata et al., 2016]. PARP16 modifieskaryopherin-β1, a protein responsible for shuttling proteins with a nuclear localizationsignal [Di Paola et al., 2012]. It can also localise to the endoplasmic reticulum and regulatethe unfolded protein response [Jwa and Chang, 2012]. Other PARPs are poorly analysed.Mono-ADP-ribosyltransferases (mARTs) are an enzyme group similar to PARPs. In con-trast to PARPs, mARTs are secreted and catalyse MARylation of cell surface proteins suchas integrins and defensins [Corda and Di Girolamo, 2003].
Protein acetylation is a common post-translational modification, especially in histonesand enzymes of the intermediate metabolism [Zhao et al., 2010]. The second major role ofNAD consumption is the specific protein deacetylation and deacylation by sirtuins, namedafter the first member found in yeast, silent information regulator 2 (Sir2), responsible forcellular regulation [North and Verdin, 2004]. In contrast to NAD-independent deacetylases,sirtuins do not release acetate, but the acetyl (or acyl) moiety is transferred to the ADPribose, yielding O-acetyl-ADP-ribose, which can itself serve as messenger molecule to en-hance the reduction of reactive oxygen species [Tong and Denu, 2010]. The seven humansirtuins differ in subcellular localization and substrate specificity. Commonly, they candeacetylate proteins at their lysine moieties [Osborne et al., 2016].
Human SIRT1 is the most extensively analysed sirtuin. It is present in the nucleus andthe cytosol and is active in regulation of gene expression (via deacetylation of histones),DNA damage response (via p53), mitochondrial gene expression (via PGC1α), lipid andglucose metabolism, and stress response (via FOXO) [Cantó and Auwerx, 2012]. The otherwell-known sirtuin is SIRT3, the major mitochondrial deacetylase. It plays an importantrole in metabolic homeostasis, by activating several enzymes of the tricarboxylic acid cycleand the oxidative phosphorylation [Houtkooper et al., 2012; Rardin et al., 2013b]. SIRT2 ismostly present in the cytosol and involved in gluconeogenesis and adipogenesis [Jiang
17

1 Introduction
et al., 2011; Jing et al., 2007]. SIRT4 is special in that it shows ADP-ribosyltransferase activ-ity and thereby blocks amino acid-induced insulin secretion [Haigis et al., 2006]. SIRT4is also active in the regulation of lipid catabolism [Nasrin et al., 2010]. SIRT5 is local-ised in mitochondria and shows regulatory activity in detoxification of ammonia [Nak-agawa et al., 2009]. In addition, it has been shown that SIRT5 can not only deacetylate butalso deacylate proteins, particularly removing succinyl, malonyl, and glutaryl moieties.These deacylations regulate various metabolic pathways, including fatty acid oxidationand ketone body production [Rardin et al., 2013a]. SIRT6 regulates histone acetylation andglucose homeostasis [Michishita et al., 2008; Zhong et al., 2010]. It also acts as mono-ADP-ribosyltransferase and modifies PARP1, helping in DNA repair [Van Meter et al., 2016].SIRT7 is active in transcription control and probably energy metabolism [Zhang et al.,2017].
Another NAD-consuming enzyme is ADP-ribosyl cyclase or CD38. This enzyme re-leases cyclic ADPR (cADPR) or nicotinate-adenine dinucleotide phosphate (NAADP) [Lee,2012]. Both molecules are important agents mobilising calcium for intracellular calciumsignalling [Clapham, 2007]. Calcium homeostasis via CD38 or PARPs, protein deacetyla-tion via sirtuins, ATP depletion via PARPs, and effects of enzymes using NAD as redoxpartner can also influence autophagy [Zhang et al., 2016].
A part of tRNA biogenesis is the splicing of introns [Abelson et al., 1998]. One enzymeinvolved in this process is the tRNA 2’-phosphotransferase (TRPT). This enzyme transfersthe 2’-phosphate from the splicing junction to the ADP ribose from NAD, releasing Nam[Hu et al., 2003; Sawaya et al., 2005].
1.3.2 Biosynthesis of NADIn 18ᵗʰ century Europe, a huge outbreak of pellagra occurred, a disease that comes withdermatitis, diarrhoea, dementia, and eventually death. There was another extensive out-break in the USA in the early 20th century. In both outbreaks, the disease was widespreadamong poor people. After many years, it was recognised that pellagra is not an infectiousdisease, but a disease caused by malnutrition. The poor man’s meal at that time was corn,which is low in bioavailable niacin. In 1937, Conrad Elvehjem found that the canine ver-sion of pellagra, the black-tongue disease, could be cured by giving niacin [Koehn andElvehjem, 1937]. Niacin (nicotinic acid, NA) and Nam are together called vitamin B3 andare predominantly found in meat, fish, wheat, and nuts [Rolfe, 2014].The outbreaks werestopped by a change of diet towards a more varied diet including niacin [Sydenstricker,1958].
The biosynthesis pathway of NAD first discovered was the Preiss-Handler pathway [Pre-iss and Handler, 1958a,b]. It starts from NA that is phosphoribosylated by the NA phos-phoribosyltransferase (NAPRT) to nicotinate mononucleotide (NMN), which is further pro-cessed by the NMN/NAMN adenylyltransferase (NMNAT) to nicotinate adenine dinucle-otide (NAAD) and finally amidated by the NAD synthase (NADS) to NAD (fig. 3). Thephylogeny of the de novo biosynthesis was analysed by Ternes and Schönknecht [2014].
There are two classes of NADS, an ammonia-dependent, present in most prokaryotes,and a glutamine-dependent class, present in eukaryotes and some bacteria, for exampleMy-
18

1.3 Nicotinamide adenine dinucleotide (NAD)
Figure 3 – Eukaryotic pathway overview of NAD de novo synthesis, signalling, and salvagepathways. A schematic structure is shown for each major metabolite. Metabolites on the leftside possess a nicotinic acid group (blue), whereas metabolites on the right side possess a nic-otinamide group (brown). Entities marked with a yellow star are commonly imported by cells.MNam can be secreted. For details, see text. For simplicity, the signalling reactions are notshown for NADP, but only for NAD.ADP: adenosine diphosphate, ADPR: ADP ribose, AMP: adenosine monophosphate, Asp: as-partate, ATP: adenosine triphosphate, Gln: glutamine, Glu: glutamate, mART: mono-ADP-ribosyltransferase,MNam: 1-methyl-Nam, NA: nicotinic acid, NAAD:NA adenine dinucleotide,NAD: Nam adenine dinucleotide, NADA: Nam deamidase, NADK: NAD kinase, NADP: NADphosphate, NADS: NAD synthase, Nam: nicotinamide, NAMN: NA mononucleotide, NamPRT:Nam phosphoribosyltransferase, NAPRT: NA phosphoribosyltransferase, NMN: Nam mono-nucleotide, NMNAT: NMN/NAMN adenylyltransferase, NNMT: Nam-N-methyltransferase,PARP: poly-(ADP-ribose) polymerase, (P)Pi: inorganic (pyro)phosphate, PRPP: phosphoribosylpyrophosphate, QA: quinolinic acid, QAPRT: QA phosphoribosyltransferase, R: substituent de-pending on signalling reaction, SAC: S-adenosyl l-homocysteine, SAM: S-adenosyl l-methion-ine, Trp: tryptophan, TRPT: tRNA 2’-phosphotransferase.
cobacterium tuberculosis and Synechocystis sp. [Bellinzoni et al., 2002; Gerdes et al., 2006].The C-terminal NADS domain, the actual synthase domain, is common to both classes andneeds ammonia. The N-terminal domain of glutamine-dependent NADS releases ammoniafrom glutamine, which is subsequently transported along a molecular tunnel to the C-ter-minal domain and NAAD [Wojcik et al., 2006]. Glutamine-dependent NADS may also useammonia, although glutamine is preferred [Magni et al., 2004].
The human NMNAT exists in three isoforms. They are located to the nucleus, the Golgicomplex, and mitochondria, respectively. All three isoforms possess a structurally unre-solved loop that is catalytically inactive and specific for each isoform [Lau et al., 2010].NMNAT is the only enzyme common to all de novo and salvage pathways (fig. 3).
NAD can be synthesised de novo from tryptophan or aspartate. Higher eukaryotes, yeast,and very few bacteria (e.g. Polaribacter filamentus [Kurnasov et al., 2003]) use tryptophanin the five-reaction kynurenine pathway to synthesise quinolinic acid (QA). In plants and
19

1 Introduction
most bacteria, aspartate is oxidised to iminoaspartate, which is subsequently processed toQA. In all organisms capable of de novo synthesis of NAD, the QA phosphoribosyltrans-ferase (QAPRT) adds phosphoribosyl to QA, yielding NAMN, which then continues thePreiss-Handler pathway to NAD (fig. 3).
There are two pathways that recycle Nam from signalling reactions. In the longer one,mostly known from yeast, Nam is deamidased by the NADA, yielding NA, which thenfollows the Preiss-Handler pathway. In humans and other higher eukaryotes, NADA ismissing and Nam recycling follows the salvage pathway. Nam is phosphosribosylated byNamPRT to NMN and further processed to NAD by NMNAT (fig. 3). There are secretedforms of NamPRT, called pre-B-cell colony enhancing factor or visfatin [Wang et al., 2006].NamPRT can efficiently be inhibited by the compound FK866 [Hasmann and Schemainda,2003]. In higher eukaryotes, Nam can also be methylated by NNMT to 1-methyl-Nam(MNam, fig. 3) [Aksoy et al., 1994; Gossmann et al., 2012b]. In the past decade, MNamhas been recognised as compound with cardioprotective effects, although the mechanismsremain unclear [Nejabati et al., 2018]. Generally, MNam is oxidised and secreted. It hasalso been recognised as marker metabolite for cancer [Okamura et al., 1998].
The phylogenetic distribution of these three enzymes that consume Nam, being NADA,NamPRT, and NNMT, is analysed in Paper III.
20

2 Results and discussionIn this chapter, the results of the three papers included in this thesis are presented anddiscussed. In the fourth part, the phylogenetic methods used in the papers are collectivelydiscussed. Furthermore, other projects are shortly presented that were pursued during thefour years of this thesis but that were not included in the main part.
2.1 Selective features in human disordered proteinregions
In Paper I, we investigated the selective features associated with intrinsically disorderedprotein regions in humans. The work is completely theoretical, building on the nearly neu-tral theory of molecular evolution.
Disordered protein regions do not show a defined three-dimensional structure, althoughthey may perform a function. In our paper, we defined intrinsically disordered regions inaccordance with MobiDB [Piovesan et al., 2018]. MobiDB aggregates structural informa-tion from various sources with experimental evidence, mainly DisProt [Sickmeier et al.,2007] and PDB [Rose et al., 2013]. Sequence-based order predictors are only included withvery low confidence, such that the database is mostly based on actual structural informa-tion. For Paper I, we referred to all regions that are not disordered as ordered regions. Thissimplistic definition does not consider ambiguous positions, but we focused on properlydefining disordered regions.
We could confirm some expected or already shown properties of disordered regions.Theregions tend to be short compared to the protein length and are involved in DNA, RNA,or protein binding [Peng et al., 2014; Ward et al., 2004]. As the protein surface offers morethree-dimensional space and has less steric effects, it was not surprising to find that dis-ordered regions are more common on surfaces than in the protein cores [Gunasekaranet al., 2003]. Disease-associated single nucleotide polymorphisms (SNP) occur less in dis-ordered regions. The only exception are SNPs associated with musculoskeletal diseasesthat are enriched in disordered regions. An explanation may be that proteins associatedwith musculoskeletal diseases tend to be long with large intrinsically disordered regionslike titin, but also biomineralising proteins that are important for bone growth tend to bedisordered [Boskey and Villarreal-Ramirez, 2016].
We used 90 mammalian genomes to investigate interspecies evolutionary patterns. Thelarge amount ofmammalian sequences allowed us to exclude sequences that aligned poorlyand still have enough data for adequate statistics. As the computational steps for our ana-lyses were rather time-consuming, we randomly sampled sequences from 30 mammalianspecies for every gene, always including the human sequence. To justify this step, we tested
21

2 Results and discussion
whether we could see a significantly different likelihood for three evolutionary hypotheseswith a different amount of randomly sampled sequences. When using more than 20 se-quences, the three hypotheses could be distinguished by a significantly different likelihood(Paper I, suppl. fig. S10). By using the safety margin of ten more sequences, our conclusionsshould be well justified, although we did not use all 90 available genomes for every gene.
For intraspecific analyses, we used 46 human genomes of the people of Yoruba in Ibadan,Nigeria, provided by the 1000 Genomes Project. In contrast to other people, African peoplein general did only experience amild population bottleneck compared to people from othercontinents. In addition, the Yoruba show a high level of variant sites, of which only few arerare compared to other human populations [The 1000 Genomes Project Consortium, 2015].Due to these properties, the Yoruba became the standard people in population genetics.
To align all orthologs of one protein, we used a whole alignment workflow. We star-ted by aligning the sequences with MSAProbs [Liu et al., 2010] as this program had beenshown to have a high sensitivity [Katoh and Standley, 2016]. In addition, we tried differ-ent alignment programs and MSAProbs was the best compromise of quality and speedfor disordered regions. The result was analysed with Zorro [Wu et al., 2012] and Gblocks[Castresana, 2000], based on which we removed poorly aligned columns. Gblocks was cri-ticised to hide positive selection [Jordan and Goldman, 2012], but we could not reproducethe criticism, possibly because of the combination of Gblocks with Zorro that adds an-other filter for the alignment.The truncated sequences were re-alignedwithMuscle [Edgar,2004]. Muscle was used because it gives reasonably good results while being extremely fast[Pais et al., 2014]. Only disordered regions of which the Muscle alignments of truncatedsequences were in agreement with the truncated MSAProbs alignment of whole sequenceswere accepted for further analysis.
2.1.1 Evolutionary forces acting on disordered regions
We estimated the evolutionary rates (ω = dN/dS) to be significantly higher in disorderedregions than in the ordered regions of the same protein (Paper I, fig. 1). Assuming that thesynonymous substitution rate (dS) is used as a proxy for the local mutation rate, the localmutation rate in disordered regions is almost the same as in ordered regions. Hence, toexplain the higher evolutionary rates in disordered regions, their non-synonymous substi-tution rate must be higher.
A site-specific analysis with a nearly neutral model without positive selection revealedhigher evolutionary rates in non-neutral sites (i.e. sites under purifying selection) of dis-ordered regions, pointing to less intense purifying selection (Paper I, fig. 2). The analysisalso estimated a higher proportion of neutral sites in disordered regions, indicating moregenetic drift. In a second site-specific analysis testing positive selection, the number ofgenes with evidence for positive selection was estimated to be much higher in disorderedregions than in ordered regions (377 and 252, respectively).
Another indicator for less effective purifying selection is the increased estimated ratio ofnon-synonymous to synonymous diversity (πN/πS) in disordered regions (Paper I, fig. 4A).Given that the synonymous nucleotide diversity (πS) is not significantly different between
22

2.1 Selective features in human disordered protein regions
the two groups, an increased value means that more non-synonymous diversity exists,hinting that purifying selection is less effective to remove such variation [Chen et al., 2017].
To further scrutinise the role of the three evolutionary forces, we estimated the distribu-tion of fitness effects (DFE) in disordered and ordered regions of human proteins (Paper I,fig. 4B). There are two striking differences between disordered and ordered regions. 23% ofnon-synonymous mutations in disordered regions are effectively neutral, compared to 12%for ordered regions. This points to a more prominent genetic drift in disordered regions.At the other end of the scale, only 48% of non-synonymous mutations have strong selec-tive effects in disordered regions, compared to 63% for ordered regions, which means thatstrong purifying selection is less pronounced in disordered regions. Overall, the DFE sug-gests that the evolutionary rate in disordered regions is higher due to a shift from stronglydeleterious to slightly deleterious or effectively neutral mutations. Generally, this meansthat evolution of disordered regions is more influenced by fluctuations in the effective pop-ulation size, as the probability of nearly neutral (slightly deleterious) mutations being fixedis dependent on the effective population size. This influence was supported by Khan et al.[2015].
As final test for selective pressure acting on disordered sites, we conducted a variantof the McDonald-Kreitman test that corrects for slightly deleterious mutations. The testrevealed a higher proportion of adaptive mutation (α) in disordered regions, supportingthe hypothesis of more positive selection. However, the estimation of α can be misleadingif the proportion of effectively neutral non-synonymous mutations and substitutions isdifferent, as it was in our case. To correct for the difference, we estimated ωa, which is ameasure for positive selection similar to the MK test α that takes fixation events of neutraland slightly deleterious mutations into account [Gossmann et al., 2010]. The estimationof ωa supported the notion of more pronounced positive selection in disordered regionscompared to ordered regions (Paper I, fig. 4C). Although disordered regions show lesspurifying and more positive selection, there is still a dominance of purifying selection.This means that disordered regions are still generally constrained.These constrains may befunctional but also structural, because the regions might need to stay disordered [Ahrenset al., 2016].
In summary, elevated evolutionary rates in disordered protein regions are due to relaxedpurifying selection, intensified genetic drift, and positive selection.
2.1.2 The amount of positive selection is likely an underestimate
We could show increased positive selection in disordered regions. Still, the strength of pos-itive selection may have been an underestimate. The power to detect positive selection isdependent on the sequence length [Anisimova et al., 2001]. As the disordered parts of pro-teins are usuallymuch shorter than the ordered parts, the power to detect positive selectionis lower in disordered parts.This would mean that there might be more sites under positiveselection in disordered regions than estimated by us. To test this hypothesis, we randomlysampled the same amount of sites from disordered and ordered regions and repeated thesite-specific dN/dS analysis. Instead of roughly 1.5-fold more genes with evidence for pos-
23

2 Results and discussion
itive selection in disordered compared to ordered genes in the original analysis, the ratiochanged to almost tenfold in the analysis with regions of the same length (Paper I, table 1).
We ran simulations to assess how good our estimations of proteins under positive se-lection were. We simulated the sequence evolution of all genes with evidence for positiveselection and 250 randomly chosen genes. The simulated sequences were analysed in thesameway as the real sequences, but as the data were simulated, we could exactly determinewhether the classification as positively selected was correct. We found that approximately10% of the genes classified to be under positive selection were false positives and that 10%of the genes classified not to be under positive selection were false negatives (Paper I, suppl.fig. S3). Although there were false positives and false negatives, the conclusions in the pa-per still hold, as 10% (or even 20%) error in any direction should not change the evidencequalitatively. In addition, this analysis of simulated data was not corrected for multipletesting, so background detection can be expected, increasing false positives.
The simulations also indicated that proteins with ordered and disordered regions underpositive selection showed substantially more false positives than proteins with only dis-ordered regions under positive selection. This may hint to wrong boundaries of disorderedregions. Another possibility is that short disordered regions were not acknowledged by thealgorithm of MobiDB and hence defined as ordered. Those short disordered regions wouldwrongly account for ordered regions under positive selection, supporting our notion thatthe amount of positive selection in disordered regions is an underestimate.
The regionsmost difficult to align are indel regions, which occur frequently in disorderedregions. To verify our alignment workflow, we simulated different indel rates and ran thecomplete alignment workflow as well as the site-specific dN/dS analysis. Indels generallyproduce gaps in the alignment that are not considered by the analysis. This decreases thepower of detecting positive selection, because the effective sequence length decreases withan increasing amount of gaps. As indels are common when comparing genes across themammalian tree [see e.g. Chen et al., 2009] and particularly common in disordered regions[Khan et al., 2015], we expected that we lost some power to detect positive selection andthat the amount of positive selection is, again, an underestimate (Paper I, suppl. fig. S4).Thealignment simulation supported a decrease of power of detection upon increased indel rate.
2.1.3 Disordered state information helps to find positive selectionBesides analysing disordered and ordered regions separately, we also conducted analysesof whole proteins. As the ordered regions tend to constitute the majority of a protein, theresults of analyses on whole proteins in turn tended to resemble the results of orderedregions. In our site-specific analysis of evolutionary rate, we found 377 genes with evi-dence for positive selection in disordered regions and 363 such genes for a joint analysisconsidering whole genes. Although the numbers look similar, 240 genes found with dis-ordered regionswere not found in the joint analysis. In those 240 genes, the ordered regions(without positive selection) obscured the signal such that they were not found to be underpositive selection in the joint analysis.
The same pattern is visible in the distribution of fitness effects and the MK test (Paper I,fig. 4). Selective effects in disordered regions are masked by being outnumbered by ordered
24

2.2 Phylogeny of plastid phosphate transporters
regions in whole proteins. We would therefore advise researchers interested in positiveselection to use a-priori knowledge about the disordered state of a protein or protein regionto get a better estimate of proteins or sites under positive selection.
2.1.4 Positive selection in disordered regions in the real worldWe wanted to find out more about proteins with positive selection in disordered regions.We used the String database [Szklarczyk et al., 2015] to see whether proteins with positiveselection in disordered regions are clustered in any particular function.We could show thatmost such proteins form a single large cluster with a general function in transcriptionalor translational regulation (Paper I, suppl. fig. S5A). This fits well into the picture thatexpression control is a highly complex function that needs to adapt permanently to stay inequilibrium [Prud’homme et al., 2007]. Changes in one part of the regulatory machineryhave to be balanced by changes in other parts to prevent dysregulation. This interactionis also known as the regulatory arms race. Proteins with ordered regions under positiveselection fall into several small clusters (Paper I, suppl. fig. S5B), most of which are part ofthe immune system, a function with another kind of arms race, in this case the competitionof the immune system against pathogens [tenOever, 2016]. Pathogens evolve permanentlyto evade the immune system, which in turn has to adapt to the constant changes.
We looked for proteins with resolved structure and evidence for positive selection inthe disordered region. As disordered regions by definition lack a rigid three-dimensionalstructure, it is not surprising that we found only one such protein, interleukin 21 (IL21), animportant protein of the immune system [Yi et al., 2010]. A molecular dynamics analysisshowed that the three sites with evidence for positive selection are in a region of increaseddisorder as measured by the calculated B factor (Paper I, fig. 3B), a number proportionalto the square of the root-mean-square deviation of the atomic positions of the α-carbonsof the protein. The higher the B factor, the higher the disorder. In close proximity to theannotated disordered region in IL21, we detected a short region with elevated B factorsthat was not annotated as disordered. This may demonstrate either that the boundaries ofthe disordered region are not well defined or that the unrecognised region is too small tobe an acknowledged disordered region.
Taken together, we could confirm that disordered regions in human proteins evolvemorerapidly than in other protein parts. We found strong evidence for frequent occurrences ofpositive selection and less pronounced purifying selection in disordered regions.
2.2 Phylogeny of plastid phosphate transportersPlastid phosphate transporters are among the most abundant plastid transporters and in-volved in many of the core metabolic pathways of plants. Still, surprisingly little is knownabout them. We wanted to explore the phylogeny of these transporters to pave a way forfurther investigations. Other research groups already did phylogenetic analyses of pPTs[e.g. Colleoni et al., 2010; Eicks et al., 2002], but Paper II is by far the most comprehen-sive phylogenetic analysis done to date with more than 600 sequences from more than
25

2 Results and discussion
100 species. Our results allow to pinpoint key species in the development of pPTs for fur-ther experimental analysis. Another highlight is the recognition of a new TPT subgroup.
2.2.1 Sequence-based phylogenyThemost extensively analysed pPTs are, as so often in plants, those from A. thaliana. Thereare two known PPTs and GPTs as well as one known TPT and XPT in A. thaliana. We triedto find homologues in other plants and algae by blasting the A. thaliana sequences againstthe NCBI non-redundant protein database. As it is known that there are many pseudo-genes of pPTs in A. thaliana [Knappe et al., 2003a], we manually curated the results toremove truncated pseudo-genes. Based on the protein sequence alone, the functionalityand expression of each protein cannot be guaranteed. Hence, there might have been a fewfalse positives in the results. Another general problem is the quality of the genomes. Itis hard to determine whether a genome is complete and whether the assembly workedcorrectly. Especially in species with many gene copies, it might be a problem that similargenes are not recognised as two distinct genes but combined to one gene.This problemwilllead to (slight) underestimates of the gene copy number in a given species. After curation,we found more than 600 sequences from more than 100 species, divided in 75 land plants(Embryophyta) and 16 algae (for a detailed list, see Paper II, suppl. table S1).
We estimated the phylogeny with the program BAli-Phy, an implementation of a Bayes-ian phylogenetic reconstruction algorithm discussed later on page 36. Branches with aposterior probability of less than 25% were merged. To get an overview, we estimated thephylogeny of all pPTs of ten Embryophyta. As expected from the literature [e.g. Eicks et al.,2002], the transporters clustered into three major groups, TPT, PPT, and GPT/XPT, wherethe GPTs and XPTs established two clearly separated subclusters (Paper II, fig. 1). Only theGPT of K. flaccidum was placed in between the two subclusters of GPT and XPT. We thenestimated the phylogenies separately for each of the four transporters using sequencesfrom all Embryophyta (Paper II, fig. 2). A general overview of the duplications and lossesbased on the four trees is given in Paper II, fig. 3.
The TPT sequences split into two clusters (Paper II, suppl. fig. S1). The first one containsthe only A. thaliana TPT sequence and was therefore named TPT1. It is only present in an-giosperms (Magnoliophyta). The second TPT group was, to our knowledge, not describedbefore. This TPT2 can be found in species across all land plants including K. flaccidum. Ex-ceptions are all monocots and some dicots, particularly Brassicaceae and Amaranthaceae.The former two clades contain many model plants, which may be the reason why the TPT2was never described before. The phylogenetic distribution suggests that the TPT1 emergedfrom gene duplication of TPT2 in the most recent common ancestor (MRCA) of angio-sperms (Paper II, fig. 3). Within the TPT1, there was a duplication in the monocots and asubsequent duplication in the Poaceae. As the TPT2 was not known before, nothing waspublished so far about the difference between the two transporters. As most dicots possessTPTs from both subgroups, TPT1 and 2 probably have different physiological functionsthrough different expression patterns or substrate affinities.
The PPT sequences split into three clusters (Paper II, suppl. fig. S2). The first two clusterscontain the two PPTs from A. thaliana and were named PPT1 and PPT2, accordingly. Both
26

2.2 Phylogeny of plastid phosphate transporters
clusters contain only sequences from dicots, so they likely emerged from a gene duplica-tion early in the dicot evolution. The third cluster, PPT3, contains only sequences frommonocots and non-angiosperm species and is therefore the oldest branch. As there are nosequenced plants with a combination of PPT3 and PPT1 or 2, PPT3 likely acts as a func-tional PPT1 or 2.
Apparently, there was a duplication of PPT genes in monocots, with the Poaceae havingexperienced yet another duplication. It is difficult to classify the PPTs of Amborella tricho-poda and N. nucifera into any of the three clusters. The PPT of A. trichopoda is more onthe PPT3 branch, and both PPTs of N. nucifera are more on the PPT2 branch, but all threesequences are so close to the central branch point that an unambiguous classification is notpossible with the existing data and methods. A hypothetical scenario for the developmentof PPTs might be that after a duplication of the ancient PPT3, both resulting sequencesdiverged simultaneously, yielding PPT1 and 2. This hypothesis might be investigated by acloser analysis of the PPTs of A. trichopoda and N. nucifera as their sequences might be atransitional state between PPT3 and PPT1/2.
There is notmuch known about the physiological differences of the PPT groups. A knock-out of PPT1 in A. thaliana was unable to produce anthocyanins that are a product of thesecondary plant metabolism. Furthermore, the knock-out showed shortened roots and areticulate leaf phenotype [Streatfield et al., 1999]. The shikimate pathway was probablydisturbed by the knock-out of PPT1, which could not be compensated by PPT2. Althoughdifferent spatial and temporal expression patterns were recognised for PPT1 and 2 [Knappeet al., 2003b], the role of PPT2 is so far unknown. To our knowledge, no experimentalanalyses were published on any transporter here described as PPT3.
The situation in GPTs is not as clear as in the other pPTs (Paper II, suppl. fig. S3). Accord-ing to our analysis, we divided the GPTs into six groups. The first two large groups werenamed GPT1 and 2 after the sequences fromA. thaliana. They both contain sequences fromall angiosperms exceptA. trichopoda and N. nucifera. In addition, all asterids lack GPT2 butform another group, GPT3, that emerged at their root at the same time of the loss of GPT2(Paper II, fig. 3). It is not clear, whether the asterid GPT3 still fulfil the GPT2 function, orif they adapted to a new function.
The GPT4 group comprises all non-Poaceae monocots and the dicot A. trichopoda, whileGPT5 contains all Poaceae species. Both, GPT4 and GPT5, show further divisions into twosubgroups each, indicating a duplication at the root of monocots. The last group, GPT6,comprises all gymnosperms and lower plant species including mosses and K. flaccidum,making GPT6 the most basal group. The emergence of GPT4 went along with the loss ofGPT6, similarly to the emergence of GPT5 that went along with the loss of GPT4. From ouranalysis, we cannot determine the relationship among GPT4, GPT5, and GPT6. Althoughthey form distinct clusters in the sequence-based analysis, they may be functionally as-signed to the same group and probably fulfil the same function as the better-known GPT1or 2. To elucidate the functional roles of the diverse GPT groups, experiments with realproteins or structural analyses as conducted by Lee et al. [2017] for G. sulphuraria pPTsare necessary.
While GPT1 and GPT2 are both expressed in A. thaliana, GPT1 is expressed at muchhigher levels. Knock-out experiments have shown that GPT1 is vital for the plant [Nie-
27

2 Results and discussion
wiadomski et al., 2005]. A knock-down of GPT1 by 50% in Vicia narbonensis leads to 25%less starch, 45% less lipid, and 30% more protein in the seeds [Rolletschek et al., 2007]. Thereason for GPT1 knock-out lethality is most likely the impaired fatty acid synthesis, as thedecrease in starch itself is not lethal and does not lead to impaired fertility [Kofler et al.,2000; Mou et al., 2000]. A knock-out of GPT2 does not show any obvious phenotype inthe green house [Dyson et al., 2015]. GPT2 expression, however, is inducible by a highsugar concentration [Kunz et al., 2010] and is involved in the adaptation to frequent lightfluctuations or high light intensities [Athanasiou et al., 2010; Dyson et al., 2015].
The duplications seen in the monocots and Poaceae of TPT, PPT, and GPT are in linewith two proposed whole genome duplications that are believed to have occurred about130 and 96 million years ago [Tiley et al., 2016].
The XPT can only be found in most angiosperms and some gymnosperms (Paper II,suppl. fig. S4). Notably, all Poaceae lost the XPT, a loss that may be compensated by thehigh number of GPTs in that family (up to ten gene copies). It seems that the XPT emergedat the MRCA of Spermatophyta. XPT sequences do only show a very diffuse groupingpattern that is hard to pinpoint. Asterids may form a subgroup as well as Brassicales andmonocots. As most species have only one XPT, however, there is no general division ingroups as in the other three transporters.
After analysing the Embryophyta, we wanted to investigate the distribution of pPTs inalgae. We estimated a tree with the same parameters as for the Embryophyta, but withsequences from twelve green algae, three red algae, and ten members of the Chromalveo-lata. Chromalveolata possess secondary plastids from a secondary endosymbiosis of a redalga [Gould et al., 2015], making them relatives to red algae. We also added the sequencesof A. thaliana for classification and of K. flaccidum for comparison. As K. flaccidum is amember of Charophyta, it is the closest sequenced relative to the algal ancestors of landplants [de Vries and Archibald, 2018].
As in Embryophyta, the sequences clustered into three major groups, the TPTs, PPTs,and GPT/XPTs (Paper II, fig. 4). This indicates that the split of the three groups must havehappened earlier than the split between red and green algae. Most algal species possessexactly one transporter of each group, while Chlamydomonas reinhardtii and the two Os-treococcus species havemultiple PPTs.The parasitic algaHelicosporidium sp. possesses onlya GPT, but none of the other pPTs. This may be due to the loss of photosynthesis in theparasite [Pombert et al., 2014] that makes TPTs and PPTs less important, while the GPTmay still be needed for starch or fatty acid synthesis. All pPTs from the Chromalveolatacluster with TPTs from red algae. This hints to a loss of PPT and GPT in this taxon andis a support for the hypothesis of Chromalveolata TPT being monophyletic as proposedby Moog et al. [2015]. The cryptomonad G. theta (belonging to the Chromalveolata) hastwo TPTs that were analysed closely by Haferkamp et al. [2006]. One of them is expressedduring the night and the other during the day as described in the introduction of this thesison page 12.
Both, GPTs and XPTs, accept Xul5P as substrate, but only GPTs accept Glc6P. From thesequence comparison and clustering alone, it is not possible to determine whether thealgal transporters that are usually called GPT really are functional GPTs or XPTs. In thered algae G. sulphuraria, GPT/XPT does not transport Glc6P [Linka et al., 2008]. Xul5P
28

2.2 Phylogeny of plastid phosphate transporters
transport was not measured. Analysis of the binding site of the G. sulphuraria GPT/XPTshowed that it is too small for Glc6P but sufficiently large for Xul5P [Lee et al., 2017]. TheTPT and PPT in this red alga show similar substrate specificities as the transporters fromland plants [Linka et al., 2008]. The G. sulphuraria pPTs are the only algal pPTs that havebeen functionally analysed so far.
2.2.2 Structure of the pPT genesAs the intron/exon structure of a gene is generally conserved among species [Rogozinet al., 2012], we wanted to find out, whether we could find any changes in the structure ofpPT genes. For this, we aligned the mRNA sequence (where introns are spliced out) to thegenomic sequence (where introns are included) for every gene for which both mRNA andgenomic sequence were available. If only the genomic sequence was available, we retrievedthe algorithmically derived intron/exon borders from the NCBI nucleotide database [NCBIResource Coordinators, 2017]. If only the mRNA sequence was available, we could notdetermine intron/exon borders and the respective sequencewas excluded from the analysis.With both methods combined, we could include 506 sequences in the analysis.
Within the land plants, the four pPT families differ greatly in number and position ofintrons (Paper II, fig. 5). Within each family, however, the number and positions of theintrons are highly conserved with only a few exceptions (Paper II, fig. 5). In some cases,we found small changes in intron positions of up to nine base pairs. This may be becausethe alignment algorithm cannot determine the exact gap boundaries, if base pairs repeatat the beginning or the end of the gap. Another reason could be intron sliding, a processin which the intron boundaries may move by up to 60 base pairs [Rogozin et al., 2012;Stoltzfus et al., 1997].
TPT genes of land plants generally have eleven introns, although there are some excep-tions. Vigna angularis and Boea hygrometrica both seem to have lost their last intron inone gene, although this might be a wrong annotation, as the last intron is very close to the3’ end of the gene. Brassica napus apparently has a gene that was extended at the 3’ endincluding a twelfth intron. Although this might be correct, it may also stem from a wrongrecognition of the stop codon.The lycophyte Selaginella moellendorffii lost the first and thelast intron. The bryophyte (moss) Physcomitrella patens also lost the last intron whereasthe first intron moved by approximately 18 base pairs towards the 5’ end, which may beexplained by intron sliding. K. flaccidum also has the first intron moved by about 21 basepairs, but towards the 3’ end. Notably, there are six intron positions shared between landplants and many sequenced green algae. In red algae, G. sulphuraria possesses one andCyanidioschyzon merolae no introns.
PPT genes generally possess eight introns. Fabaceae and Solanaceae lost the first intronin PPT1 and PPT2, respectively. B. hygrometrica lost the last intron in one gene. Triticumurartu lost intron three but gained a new intron in the beginning of the gene. Most greenalgae share five to six intron positions with land plants.The red alga G. sulphuraria possessthree introns in its PPT gene, while the gene of C. merolae, as its TPT gene, has no introns.
GPT genes generally have four introns. There are a number of species that apparentlylack the fourth intron. As the fifth exon consists of only two to four codons in the translated
29

2 Results and discussion
region and the rest belongs to the 3’ untranslated region, this apparent lackmaywell be dueto awrong prediction or an alignment error. In contrast to TPT and PPT, whereK. flaccidumshared all introns with the higher plants, the charophyte has only three introns of whichonly the third shares its position with intron three of higher plants. No intron positionsof land plant GPTs are shared with any algae. This indicates that the gene structure ofGPT evolved in the MRCA of land plants, which is very late compared to the other twotransporters, where intron positions are shared with many green algae.
XPT genes do not possess any introns. As they show a high similarity to GPTs, a likelyscenario of the origin of the XPT is that the GPT mRNA was reversely transcribed andreintegrated into the genome. Such occurrences are rare but have been observed before[e.g. Wessler et al., 1995].
2.2.3 Embedding the pPT phylogeny in the early plant evolutionAbout 1.6 billion years ago, the first viable endosymbiosis with a cyanobacterium occurred.The glaucophytes emerged, shortly after followed by the split of red algae and Chloro-plastida. The Chloroplastida later diverged into various kinds of green algae and the Em-bryophyta (land plants) [Yoon et al., 2004]. Plastid phosphate transporters are a mono-phyletic group that likely evolved from the nucleotide sugar transporter (NST) in ER orGolgi membranes [Knappe et al., 2003a]. The integration of pPTs must have happenedearly to allow the host to exchange carbon structures with the photosynthetically activesymbiont [Cavalier-Smith, 2000]. No pPT could be found in the glaucophyte Cyanophoraparadoxa [Price et al., 2012], whereas pPTs could be found in the red algae G. sulphuraria[Linka et al., 2008]. Unless C. paradoxa lost its pPTs, the first pPT must have emergedbetween the separation of Glaucophyta and the split of red algae and Chloroplastida in theorder of 1560 and 1470 million years ago [Yoon et al., 2004]. As the three pPTs from G. sul-phuraria show homology to the respective land plant transporters, the initial separationtowards the specificity of the three pPT groups must have happened in the same period.Our analysis of gene structures shows that within the green algae, the intron/exon struc-ture changed considerably before the split of Embryophyta and Charophyta about 800 mil-lion years ago [Yoon et al., 2004]. The phylogenetic clustering in our analysis supports thehypothesis that Chromalveolata transporters are monophyletic [Moog et al., 2015].
To our knowledge, Paper II is the first detailed overview of the phylogeny of plastidphosphate transporters. We could reconstruct the rough positions of gene duplications inthe phylogenetic tree, recognising the new TPT2 subgroup. By including many differentspecies, we could further hypothesise on the relationship between GPT and XPT and thefunctional identity of the algal GPT/XPT.
30

2.3 Phylogeny of NAD salvage and consumption
2.3 Phylogeny of NAD salvage and consumptionThehigh turnover of NAD through NAD-consuming reactions requires constant replenish-ment of cellular NAD pools. We were riddled by the question why there are two distinctpathways for the recycling of Nam to NAD. Both, NADA and NamPRT, the respectivefirst enzymes of the two pathways, are already present in bacteria. We wanted to find outwhy NADA was completely lost in deuterostomes and why there is an enzyme, NNMT,that removes the vital metabolite Nam from the system. Paper III presents the phyloge-netic distribution of these three enzymes and tries to explain these questions with help ofmathematical modelling and experimental evidence.
2.3.1 Phylogenetic distribution of enzymes of interestTo analyse the phylogenetic distribution of the two NAD salvage pathways (fig. 3), welooked for functionally verified pathway enzymes and NAD consumers in the UniProtdatabase [The UniProt Consortium, 2017]. The sequences were used as query for a Blastpsearch against the NCBI non-redundant protein database. The use of Blast in this contextis discussed in the next section on page 36. The query proteins were taken preferably frommodel species as we assumed those genomes and functional verifications to be of highquality. Most sequences were taken from A. thaliana, Caenorhabditis elegans, Escherichiacoli, Saccharomyces cerevisiae, and human. Some other bacterial sequences were added forproteins that are not present in E. coli, like NamPRT, that was taken from Acinetobacter sp.An overview of the query sequences can be found in Paper III, supplementary table S1.
To prevent cross-hits, we determined the expectation value (e-value) at which the sameresult was found for two different query proteins. This comparison was done for each pos-sible combination of query proteins. The resulting matrix was used as reference to deter-mine the limiting e-values for the subsequent analyses. In addition, we assessed a minimallength for the result sequences of each query protein. This limitation was introduced toprevent possible false positives from sequences that share, for example, a single domainwith the query but differ strongly in the rest of the protein. Although the e-value limitsprevented cross-hits among the proteins of interest, they did not necessarily prevent falsepositive hits of proteins not in the analysis. Reasonable values for the length limits weredetermined from the result length distribution and set such that major peaks in the distri-bution that were much shorter than the whole protein were excluded. Blast results werefiltered by e-value and length. The resulting hits were assumed to be homologues of thequery protein.
In addition to the cross-hit matrix, we clustered the sequences of particularly closelyrelated groups with BAli-Phy. Indistinguishable proteins would group together in a mixedcluster. The analysed sequences cluster well in distinct groups. Visualisations of the clus-tering of the three NMNATs and the three phosphoribosyltransferases NamPRT, NAPRT,and QAPRT are given in fig. 4.
The focus of the phylogenetic analysis was the distribution of the three enzymes NADA,NamPRT, and NNMT. An overview of the phylogenetic distribution is given in Paper III,fig. 2. In plants and fungi, around 95% of species possess only NADA, the rest having either
31

2 Results and discussion
Figure 4 – Clustering of selected proteins. To verify that sequences of different genes are suf-ficiently different from each other to prevent cross-hits in a Blast search, we created a phylo-genetic tree for the sequences using the program BAli-Phy. This figure shows the two partic-ularly closely related groups, the three different NMNATs (A) and the three phosphoribosyl-transferases NamPRT, NAPRT, and QAPRT (B). The visualisations shows a clear distinctionbetween the clusters.
NamPRT or both enzymes. The picture is similar in bacteria, where around three quarterspossess only NADA and the final quarter is divided almost equally between species withNamPRT only and species with both enzymes. In metazoans, the distribution is almost re-versed. Three quarters possess NamPRT and one quarter NADA. The fraction of metazoanspecies with NADA is mainly due to arthropods (insects, spiders, crabs, and others) thatalmost exclusively possess NADA. Lophotrochozoa (ringed worms, shells, snails, and oth-ers) and Cnidaria (mostly jellyfish) also all possess NADA, but mostly in combination withNamPRT. In addition to the other two enzymes, more than half of the Metazoa possessNNMT that is not present in any non-metazoan species. One quarter of the Lophotrocho-zoa have all three enzymes. Members of the Nematoda are highly diverse and almost everycombination of the three enzymes is present. Deuterostome species possess almost exclu-sively both, NamPRT and NNMT, with the large exception of Sauropsida (birds and rep-tiles), where only about half of the sequenced species seem to possess both enzymes, andthe other half NamPRT alone. Within the deuterostomes, only a few species at the root ofthe clade have both, NamPRT and NADA. Those species belong to Hemichordata, Echino-dermata, and Branchiostoma. No deuterostome species possesses NADA without NamPRT.
Taken together, some patterns can be observed. NamPRT andNADA together occur onlyin marine invertebrates. NNMT is present in some protostomes and ubiquitous in deutero-stomes and is usually together with NamPRT. The only species that have only NADA andNNMT are a few nematodes. Some nematodes, Lophotrochozoa and some lower deutero-stomes possess all three enzymes. A similar basic distribution of NADA and NamPRT wasalso found by Gazzaniga et al. [2009], although they focused on microbes and includedonly few eukaryotes.
NamPRT is mostly present inMetazoa, but can also be found in bacteria. Functionality ofthe bacterial NamPRT has been experimentally proven in several bacterial species [Gerdes
32

2.3 Phylogeny of NAD salvage and consumption
et al., 2006; Martin et al., 2001; Sorci et al., 2010]. As we could not find any indicationsfor horizontal gene transfer from eukaryotes to bacteria, NamPRT was probably lost inmany clades.This notionwas also supported by Ternes and Schönknecht [2014], who foundindications of horizontal gene transfer of enzymes of the NAD metabolism from bacteriato eukaryotes but not the other way round.
It seems that NNMT arose de novo or diverged rapidly after the establishment of Meta-zoa. We tried to find homologues in non-metazoan species but to no avail. Even with anextremely high e-value of 0.1, no hit was found for NNMT queries in non-metazoan species.
The lack of NNMT in many birds may be due to the special excretion system that isoptimised to save as much water as possible. It is possibly not beneficial to methylateNNMT in that system. Another reason might be difficulties of genome sequencing in birds.Their genomes commonly include microchromosomes that are often difficult to sequence[Burt, 2002]. In addition, they have whole gene clusters with increased GC content thatmay lead to difficulties in assembly and annotation [Hron et al., 2015].
Another riddle are the species that have NNMT but neither NamPRT nor NADA. Al-though it is possible that these species get their whole NAD supply from de novo synthesis,it seems unlikely, as the NAD signalling reactions are vital and used often as illustrated inthe introduction chapter of this thesis. As always with this type of analysis, there might beincomplete sequences that lead to such results. Another possibility is that one of NamPRTor NADA is present in these species but that the gene mutated strongly for some reason,keeping the function, but excluding the Blast result from our rigorous e-value and lengthlimits.
In specieswith bothNADAandNamPRT, it is not clear from the sequence alone, whetherboth genes are expressed at the same time. However, it has been shown in four speciesfrom different clades that both enzymes are expressed simultaneously [Carneiro et al.,2013]. Other species may express the genes depending on environmental conditions orin different cellular compartments or tissues. As most species with both enzymes live inclose contact with bacteria, it is also possible that one of the genes is a contamination ofanother species. We separately clustered NADA and NamPRT sequences of species withboth enzymes with respective sequences of species from the whole phylogenetic tree. Dif-ferences between the protein tree and the species tree would point to possible contamin-ant sequences (or horizontal gene transfer). We did not find any contaminant NamPRT orNADA sequences in our samples.
In addition to the biosynthetic enzymes, we also looked into the distribution of NAD-consuming enzymes. We used the enzyme families defined by Gossmann et al. [2012b]in addition to the measures described above to prevent cross-hits of similar proteins inthe Blast results. We determined how many of the ten enzyme families are present ineach species and calculated averages for the clades of interest. Each protostome speciespossesses, on average, three to four families of NAD-consuming enzymes. The only ex-ception are Lophotrochozoa with an average of eight families. The average deuterostomepossesses nine families of NAD-consuming enzymes. If we take the number of families asa proxy for the complexity of NAD consumption, there is a tendency that this complex-ity increases where NamPRT and NNMT are present, compared to species with NADA.There are some exceptions from this tendency, though. Three quarters of the sequenced
33

2 Results and discussion
Lophotrochozoa with their eight families of NAD-consuming enzymes possess NADA andNamPRT without NNMT. The other quarter possess all three enzymes. Nematodes havea low average of three NAD-consuming enzymes, although one third of the sequencedmembers of the clade possess NamPRT and NNMT. The functional diversification of NADconsumption was also recognised by Gossmann and Ziegler [2014].
2.3.2 Mathematical modelling of NAD consumption and recyclingThe phylogenetic analysis left us with many open questions that we tried to tackle withthe help of dynamic modelling. Kinetic models are a good way to assess complex systemsand to find functional relationships among enzymes in biological pathways. Such modelsmay give hints on which aspects of the system experiments should focus on and, hence,help to save time and money.
We built a model including NAD consumption and both recycling pathways from Nam.Themajor problem was limited availability of detailed information from enzymes of all thedifferent species, such as expression levels and kinetic constants. To get a model with para-meters as consistent as possible, we only used kinetic constants of enzymes from humanand S. cerevisiae, including substrate affinities (KM ), reaction speed (turnover number, kcat),and known metabolite inhibition constants and rate laws. The expression level (or enzymeconcentration) was set equal for all enzymes except NamPRT and NMNAT that were sethigher to yield metabolite concentrations in a reasonable physiological range. We also in-cluded common dilution rates for all metabolites to simulate cell growth and cell division.A major problem of our model, besides the lack of data for various enzymes, might bethat we completely neglected the methyl donor for NNMT, S-adenosyl methionine (SAM)and its precursor methionine. Low concentrations of SAM may decrease the efficiency ofNNMT. It is very difficult to measure SAM concentrations in vivo and there are many othermethyltransferases in a eukaryotic cell that make modelling SAM concentrations muchmore difficult. Hence, we deliberately refrained from modelling SAM concentrations andassumed a constant, sufficient SAM concentration. In the NAD consumption part, we sim-ilarly ignored possibly varying concentrations of acetylated proteins that are substrate forsirtuins. We also neglected concentrations of ubiquitous co-substrates like PRPP and ATP.For details on the model, please see experimental procedures and supplementary materialin Paper III.
The first questions we wanted to investigate with the model were why NamPRT andNNMT occur mostly together in vertebrates and why the introduction of NNMT coin-cided with a strong increase in the number NAD-consuming families. We simulated cellswithout NADA but with NamPRT, comparing the properties with and without NNMT.When NNMT was present, the steady state concentration of NAD was lower than in thesimulation without NNMT. Under the same conditions, the NAD consumption rate wasincreased (Paper III, fig. 3). The lowered NAD concentration could be compensated by ahigher NamPRT expression rate that would also further increase the NAD consumptionflux. The explanation is that most NAD-consuming enzymes are inhibited by Nam. Re-moving Nam from the system, either by introducing NNMT or by increasing the NamPRTexpression would lower the inhibitory effect, increasing the NAD consumption flux. Hu-
34

2.3 Phylogeny of NAD salvage and consumption
man NamPRT has a high affinity (lowKM ) for Nam, such that a sufficient amount of Namis recycled to NAD, even if NNMT removes Nam from the system. For our explanation, weassumed that a more complex NAD consumption needs and accounts for a higher NADconsumption flux, because NAD consumption would then be involved in more processesthat may occur simultaneously. Following this argumentation, the introduction of NNMTmight have been a prerequisite for the increase of NAD consumption in vertebrates.
Since the presence of NNMT introduced a competitor of NamPRT for Nam, we wereinterested in the impact of the affinity of NamPRT for Nam on the system. We simulatedthe same model as before but this time with varyingKM values of NamPRT for Nam.WithNNMT absent, a change in NamPRT KM had hardly any effect on NAD concentration orconsumption (Paper III, fig. 4A and B). With NNMT present, NAD concentration and con-sumption increased with decreasingKM (Paper III, fig. 4C and D).This result was expected,because NamPRT with lowerKM (higher affinity) can better compete with the NNMT andthus producemore NAD. By also altering theKM of NNMT for Nam in themodel, we couldsee that both human enzymes have KM values very close to the optimum with respect tomaximising NAD concentration and consumption in our model (Paper III, fig. 5). Varyingthe metabolite dilution rate showed that the model with NNMT is much more robust tochanges in cell division rate. This might also indicate that NNMT helps to maintain NADconcentration under varying conditions.
NNMT expression is relatively low in healthy cells (except liver) but often high in cancers[Aksoy et al., 1994; Zhang et al., 2014]. As the presence of NNMT apparently makes NADconcentration and consumption more dependent on the KM of NamPRT, treatment withcompetitive inhibitors (that increase the apparentKM ) could become interesting for cancertreatment.
2.3.3 Experimental evidence for the modelling resultsAs we saw that the presence of NNMT favoured a lower NamPRT KM , we wanted to seewhether there are any obvious changes in the sequence of NamPRT in species with NNMTcompared to species without NNMT. Amultiple sequence alignment of NamPRT sequencesrevealed an insert of ten amino acids in deuterostomes with NNMT that is not present inother clades or deuterostomeswithout NNMT (Paper III, fig. 6A and suppl. fig. S1).The onlyexceptions are fish, where some species do have the insert, others do not, and a third grouphas a shorter insert in the enzyme.The presence of any of the three variants is independentof the presence of NNMT.
Looking at the three-dimensional structure of NamPRT, the insert of ten amino acidsforms a structurally unresolved loop close to the connecting surfaces of the homodimer(Paper III, fig. 6B). Furthermore, the insert is part of a predicted nuclear localisation se-quence (NLS) that is lost, when the insert is removed. To find out whether the insert ischanging the subcellular localisation of NamPRT, our collaboration partners, the group ofMathias Ziegler, recombinantly expressed the human wildtype enzyme and a mutated vari-ant that lacks the ten amino acids of the insert in HeLa cells. Both were designed to possessa Flag-tag for easier purification and immunofluorescence microscopy [Hopp et al., 1988].We could not see any change in the localisation of the protein. Both, wildtype and mutant
35

2 Results and discussion
protein show a mixed cytosolic and nuclear localisation (Paper III, fig. 6C). Either the lackof the insert does not affect the NLS, or there is another NLS that was not recognised assuch by the predictor.
Since the localisation was not changed, our collaboration partners analysed, whetherthe insert affects the affinity of NamPRT as predicted by the kinetic models. They recombi-nantly expressed the humanwildtype andmutant genes in E. coli and purified the enzymes.The activities were measured using nuclear magnetic resonance spectroscopy of NMN thatwas produced in a given timeframe with different concentrations of Nam, PRPP, and ATP.It turned out that the enzymatic activity of the mutant was much lower than the activityof the wildtype enzyme (Paper III, fig. 6D). As a change of Nam concentration has a muchstronger effect on the mutant than on the wildtype enzyme, we concluded that a lower af-finity (KM ) is responsible for the lower activity of the mutant enzyme. If the change inKM
was less pronounced and the activity was mainly influenced by a change in the turnoverrate (kcat), the effect of different Nam concentrations should not have been as pronouncedas it was observed. Another effect we could see from the experiments was that in contrastto the wildtype, the activity of the mutant enzyme is independent of the presence of ATP(Paper III, fig. 6E).
2.3.4 Modelling the role of NADAAnother questionwas, whyNADAwas lost in deuterostomes andwhy these organisms useNamPRT and NNMT instead. To get a direct comparison of NADA and NamPRT in com-petition for Nam, we built a model with two artificial compartments. Both compartmentspossess the identical pathways, except for NADA that is only present in one compartmentand NamPRT that is only present in the other compartment. NNMT may be present orabsent in the NamPRT compartment. We simulated the whole system with both compart-ments sharing the same, limited Nam source. Without NNMT, the NamPRT compartmenthad a little higher NAD consumption rate than the NADA compartment, while the steadystate NAD concentration was much lower (Paper III, fig. 7A and B). With NNMT present,the compartment with NamPRT had a higher NAD consumption and concentration (Pa-per III, fig. 7C and D). Hence, the combination of NamPRT and NNMT allowed for a higherNAD consumption flux and higher NAD concentration than NADA, which may be bene-ficial for a cell with many NAD consumers and yield a more stable redox potential in thecell.
Summarising, we could find strong evidence for functional co-evolution of the two en-zymes NNMT and NamPRT. In addition, we could find a reason for the distribution ofNADA and NamPRT in eukaryotes, at least in the big picture.
2.4 About the phylogenetic methods usedThe connecting element of the three papers is the work with evolution and phylogeny.Each of the papers has a different focus. While Paper I tries to find general evolutionaryproperties of disordered regions in human proteins, Paper II looks at the distribution and
36

2.4 About the phylogenetic methods used
relationships among four specific membrane proteins in the Archaeplastida, or plants ina broader sense. Paper III sheds light on the presence or absence of a number of enzymesactive in a very fundamental group of short and intertwined pathways.
The common algorithm used in all papers is the Blast algorithm, almost exclusively usedhere in the form of Blastp, or protein Blast, created by the NCBI [Altschul et al., 1990]. Theprogram was used to find orthologs of given proteins in the same or other species. It hasbeen shown that Blast performs well in finding orthologs within eukaryotes [Albà andCastresana, 2007]. The right parameters need to be chosen carefully, particularly the rightthreshold of the e-value that is the expected number of hits by chance of the given lengthand a database of a given size. The lower the e-value, the more reliable the hit is. Normally,we manually assessed every gene to find a reasonable e-value for a given protein or proteinfamily that minimised both false positives and false negatives. In Paper III, for example, weused a cross-hit matrix in combination with a length limit for the results described in thediscussion to the paper.
One big disadvantage of this method of finding orthologs is that the reproducibility islimited.The databases are huge⁵ and it is difficult to keep snapshots of the database versionsused. A change in the database will not only add (or delete) sequences, but also slightlychange the e-value of the exact same hit. It is more likely to find a random hit in a largedatabase than in a small one, so the e-value for the same hit will increase with a biggerdatabase. However, the BLAST algorithm is an efficient and reliable way to do non-exactsearches of queries against large databases. There are alternative programs, for example,BLAT [Kent, 2002] or Diamond [Buchfink et al., 2014], which need less time but are also lesssensitive. These programs are more often used in tasks where a large amount of sequenceshave to be aligned to a large database. In our case, the number of sequences to align wasstill manageable by Blast, allowing us to benefit from its higher sensitivity.
A general problem of the sequence databases is the difficult assessment of completenessof genomes and the presence of contamination. The general approach to assess the com-pleteness of a genome is to check whether a list of conserved genes is present. The moregenes present, the higher is the probability that the genome is complete [Parks et al., 2015;Simão et al., 2015; Veeckman et al., 2016]. This approach is dependent on a well-justified,evenly distributed selection of genes to check for and can give biased results if analysedspecies do not have any sequenced close relatives. Even if the completeness was known andvery high (e.g. more than 95%) for every genome, the high number of analysed genomesalone would make it likely to get false negatives.
To reduce sequence contamination, it is possible to compare the genomic sequenceswith a database of viral and bacterial contaminant sequences [e.g. Parks et al., 2015], butit has been shown that this approach has its limitations and possibly does not recognise alot of contaminations [Becraft et al., 2017]. An example of a highly contaminated genomeis that of the Tibetan antelope Pantholops hodgsonii [Ge et al., 2013]. Proteins assigned tothis species commonly clustered with bacterial proteins during the work for Paper III andwere consequently ignored in all analyses.
⁵As measured on 19.05.2018, the NCBI non-redundant protein database was about 46GB in size in a gzipcompressed plain text fasta format.
37

2 Results and discussion
Generally, both incomplete genomes and possible contaminations have to be taken intoaccount when doing phylogenetic analyses. Sparse and scattered events, like higher plantslacking a whole transporter family, vertebrates without NamPRT, or fungi with NamPRT,should be considered with caution. If a species apparently lacks an important gene, it mightbe worthwhile to test the presence in the lab, for example, by PCR. Possible sequencecontaminants could also be controlled by PCR or by sequence homology analysis, as itwas done in Paper III, comparing the sequence in question with sequences from the wholephylogenetic tree and seeing if it clusters with sequences from the clade it is supposed tobelong to.
In Paper I, we found the orthologs of any protein in our list of 90 mammalian genomesusing Blast and aligned the orthologs for each protein with a sophisticated alignment work-flow, described and discussed on page 22. These alignments were used in the actual ana-lyses of the proteins, mainly using the program PAML [Yang, 2007]. PAML can be used toestimate parameters for various evolutionary models given an alignment and a tree usingmaximum likelihood and Bayesian techniques. A tree can also be derived by the program,but in our case, we used a mammalian consensus species tree. The program does make thesimplified assumption that all synonymous substitutions are neutral and nonsynonymoussubstitutions are non-neutral, although it is known that there are synonymous non-neutralsubstitutions. Synonymous substitutions may have an influence on RNA stability, intro-duce or remove RNA splice sites, or change the codon to a rarely used codon meaning thatthe respective tRNA is only present in low concentration, thereby influencing the expres-sion rate of that gene [Chamary et al., 2006]. Nevertheless, we ignored this probable errorsource knowingly, because synonymous non-neutral changes are, after all, very rare andit is difficult to recognise them reliably.
The main tool used in Paper II was BAli-Phy [Suchard and Redelings, 2006], a tool thatcombines the Bayesian estimation of alignment and phylogeny in one program using Mar-kov chain Monte Carlo (MCMC)-based algorithms. This combination is very powerful asthe alignment quality greatly affects the quality of the derived phylogeny. In the case ofBAli-Phy, the alignment is refined every iteration based on the phylogeny. Another prac-tical advantage is that the tool is very easy to use, especially compared to the extremelyversatile tools for Bayesian inference of phylogenies, MrBayes [Ronquist and Huelsenbeck,2003] and BEAST [Bouckaert et al., 2014]. The major disadvantage that is probably sharedamong complex programs that estimate complex phylogenies is the long calculation time.For Paper II, we spent around 35 000 CPU hours on calculating the phylogenies shown inthe paper. There is also no built-in parallelization, although it is possible to start the pro-gram with the same parameters multiple time to start multiple MCMC chains that can becombined in the end.
There are two major groups of non-trivial algorithms to estimate phylogenies, the max-imum likelihood-based and the Bayesian MCMC-based algorithms. Representatives of themaximum likelihood tools are RAxML [Stamatakis, 2014] and PhyML [Guindon et al.,2010]. Maximum likelihood approaches normally generate the single best phylogeny forthe given data and evolutionary model. The standard approach to infer the quality of theestimated tree or specific branches is to run a bootstrap analysis. This is done by randomlyresampling the alignments multiple times (normally a hundred to a thousand times) and
38

2.5 Other phylogenetic analyses
rerunning the original analysis on the new, resampled data [Felsenstein, 1985]. Every runresults in a new phylogenetic tree that can be compared to the original one. The propor-tion of bootstrap replicates in which a grouping is the same as in the original tree is usedas branch support value, indicating how well supported the branch is by the bootstrap. Aproblem with the bootstrap is that it takes a lot of time or resources, as the whole analysishas to be repeated many times. Another problem is the question how to interpret the boot-strap branch support value [Soltis and Soltis, 2003]. The bootstrap is rather a measure ofresistance against perturbation than a measure of accuracy.
Bayesian-based algorithms like BAli-Phy generate posterior probabilities that can beused as branch support values. Although the exact handling of the values varies, especiallythe threshold at which to merge two branches with low posterior probability, the valueitself seemsmuch clearer. It is the probability of a given branch given the data and the priordistribution. In this prior probability distribution lies a problem of Bayesian approachesin phylogeny, as it can be very hard to determine a reasonable prior distribution for anygiven parameter.This problem can be alleviated by empirical measurements and repetition.Considering all pros and cons, we decided to use the Bayesian approach with BAli-Phybecause it takes less resources or time considering the necessary bootstrap runs and itincludes the alignment steps making the analysis less error prone.
2.5 Other phylogenetic analysesIn the past four years, there were a number of projects running in parallel to the work forthis thesis that involved phylogenetic analyses. Some were successful, while others did notyield any interesting results. This chapter provides a short overview of these projects topresent other fields in which the phylogenetic analyses used in this thesis can be applied.
2.5.1 NAD salvage in thermophilic bacteria and archaeaIn the work for Paper III, we also included bacterial and archaeal sequences. Althoughwe did not focus on these two domains of life in Paper III, we did see an interesting pat-tern. While extremophilic species always possess the enzymes necessary for the longerNAD salvage pathway starting with NADA and lack NamPRT, closely related mesophilicspecies often possess NamPRT but lack NADA. Our collaborators in Bergen (Norway) ledby Mathias Ziegler could measure the heat stability of various intermediates of the twosalvage pathways. All amidic intermediates (and NAD itself) are unstable at temperaturesabove 50℃, whereas the acidic intermediates are stable. The weak spot of all amidic in-termediates is always the bond between the nicotinamide and the ribose, so the resultingnicotinamide can be salvaged. Our hypothesis is that the amidic pathway using NamPRT isless efficient in hot environments, because both the intermediate NMN and NAD quicklydecompose. Using the acidic pathway with NADA, all intermediates are stable. It mightalso be beneficial for organisms in hot environments, to keep a stock of the acidic inter-mediate NAAD and to produce NAD just when it is needed to minimise the loss of NADdue to heat. We started to model the two salvage pathways including the thermal decom-
39

2 Results and discussion
position. Preliminary results show that the hypothesis of thermophiles stocking NAADseems plausible. Our collaborators started to measure intermediates of NAD biosynthesisin the thermophilic bacterium Thermaerobacter marianensis, but the results have not beenavailable, yet, when submitting this thesis.
2.5.2 Circadian clocksMany living organisms, including cyanobacteria, developed an internal clock to anticipaterhythmic daily changes, like the presence of sunlight. This circadian clock is believed tohave developed independently at least five times in different clades [Paranjpe and Sharma,2005; Rosbash, 2009]. With our master student Nicolai von Kügelgen, we wanted to findout, whether there are any hints that the circadian systems could have developed fromeach other. We ran Blast analyses of all core proteins of the circadian systems of the cy-anobacterium Synechococcus elongatus, the plant A. thaliana, the fungus Neurospora crassa,the fruit fly Drosophila melanogaster, and human. We found that the circadian core pro-teins of S. elongatus, A. thaliana, and N. crassa do not show any appreciable similarity withproteins from species from other kingdoms. The only exception are two ubiquitin ligasesthat show similarity with ubiquitin ligases all over the tree of life. There are some knownoverlaps in the circadian core machinery of humans and D. melanogaster that were knownfrom before [Glossop and Hardin, 2002]. However, the unique proteins of both clades donot show any appreciable similarity with the respective other clade.
Another analysis within the same project involved the analysis of synteny of the twovertebrate hormone regulators involved in biological rhythms type II iodothyronine deiodi-nase (Dio2) and thyrotropin receptor (TSHR). The genes of these two proteins show stronggenetic linkage (i.e. they are within one million base pairs) on the chromosomes of all ver-tebrates but teleosts (bony fish), where the two genes can even be found on two differentchromosomes.We hypothesised that this lack of synteny, or the maintenance of synteny inall other vertebrates, might have an effect on selective forces. Yet, a branch-specific dN/dSanalysis using PAML yielded no significant difference in the evolutionary rate of teleostand other vertebrate Dio2 or TSHR genes. In addition, a simple promoter analysis of thegenes did not reveal any effect that could be attributed to the (lack of) synteny.
2.5.3 The mTOR networkThemechanistic target of rapamycin (mTOR) is a protein kinase abundant in all eukaryotes.In humans, it forms two complexes, mTOR complex (mTORC) 1 and 2. These two com-plexes directly and indirectly phosphorylate various proteins, thereby controlling manycell functions, such as cell growth, proliferation, motility, and survival, as well as proteinbiosynthesis, transcription, and autophagy. The mTOR functions were well reviewed byHay and Sonenberg [2004] and Lipton and Sahin [2014]. The analyses of the mTOR net-work resulted in two papers with our collaboration partners around Kathrin Thedieck inGroningen (Netherlands), listed on page IX.
The first paper is about the role of protein arginine N-methyltransferase 5 (PRMT5) asconnector of the amino acid methionine and cell metabolism. It was known before that me-
40

2.5 Other phylogenetic analyses
Figure 5 – Presence of mTOR-associated genes in selected species. With our Blast approach,we investigated whether genes of interest are present or absent in sequenced genomes. Genespresent in a representative selection of species are shown with a black square. Species belong-ing to Deuterostomia are indicated on the left. Genes were selected for the unpublished papersHeberle et al. (A) and Prentzell et al. (B) listed on page IX.
thionine is essential for cell growth, protein synthesis, andmethylation reactions [Cavuotoand Fenech, 2012]. Lack of methionine leads to growth arrest and increased autophagy. Ina series of experiments, our collaborators could show that the connection of methionineto cell growth and autophagy is provided by the PRMT5 and its interaction with mTORC1.There were three major experimental findings. PRMT5 is necessary for mTORC1 inhibitionupon methionine restriction. Autophagy activity increases by a repressed mTORC1 uponPRMT5 inhibition or methionine restriction. PRMT5 likely destabilises the endogenousmTOR inhibitor DEPTOR.
With our analysis, we could show that DEPTOR and SAMTOR, a methionine sensor thatpromotesmTORC1 in presence ofmethionine [Gu et al., 2017], evolvedwith the emergenceof Deuterostomia, while PRMT5 is present in all eukaryotes (fig. 5A). The emergence ofDeuterostomiawas accompanied by the emergence of newmethyltransferases [Ponger andLi, 2005] that competed with PRMT5 for methionine. The coupling of PRMT5 to mTORC1via DEPTOR and SAMTOR might have been a possibility for the cell to adapt translationrates to methionine availability to avoid diminution of protein biosynthesis by too lowmethionine concentrations.
In the second paper, we analysed the Ras GTPase-activating protein-binding protein 1(G3BP1), whichwas discovered as a novel subunit of the tuberous sclerosis protein complex(TSC) in a separate paper by the group of KathrinThedieck [Schwarz et al., 2015]. The TSCis involved in the control of cell growth by suppressing mTORC1, making the TSC aninteresting target for cancer treatment [Huang and Manning, 2008]. In the second paper,our collaborators further investigated the function of G3BP1 within the TSC. They foundthat G3BP1 binds to lysosome-associated membrane glycoproteins (LAMP) 1 and 2, beingthe long-missing anchor of the TSC to the lysosomes. G3BP1 further acts, as part of the
41

2 Results and discussion
TSC, as mTORC1 suppressor. Using the same approach as in Paper III, we could showthat G3BP1 emerged together with the TSC components Hamartin, Tuberin, and TBC1D7,indicating that it evolved as part of the TSC (fig. 5B).
42

3 Conclusions and future perspectives
The goal of this work was to find evolutionary patterns in different biological systemsand different levels of organisation. All three papers have in common that the number ofanalysed sequences is very high compared to earlier publications on similar topics. Thetype of phylogenetic analysis done for the papers is not seen very often at this scale. Thiswork also benefited from the experts in the respective biological fields, emphasising theimportance of close collaboration.
Our investigation of evolutionary forces acting on disordered regions of human proteinsin Paper I showed that there is more pronounced positive and less purifying selection insuch regions compared to ordered protein parts. Still, there are strong evolutionary con-straints, pointing to a functional importance of disordered regions. Generally, we foundthat the power to detect positive selection increases drastically when using knowledgeabout the disordered state of a protein region. A possible next step would be to analysethe evolutionary effects at the borders of disordered regions in more detail. More method-ologically, studying the effect of non-neutral synonymous mutations on the estimation ofselective forces would help future investigations to interpret their results.
Paper II is the first detailed overview of the phylogeny of plastid phosphate transport-ers. We could reconstruct likely positions of gene duplications in the phylogenetic tree,recognising the new TPT2 subgroup. By including many different species, we could fur-ther hypothesise on the relationship between GPT and XPT and the functional identity ofthe algal GPT/XPT. In Paper III, we used a combination of phylogenetic analysis, metabolicmodelling, and experimental evidence. This unusual approach yielded strong evidence forfunctional co-evolution of the two enzymes NNMT and NamPRT as well as an explanationfor the coexistence of NADA, NamPRT, and NNMT.
As the phylogenetic methods led to remarkable new findings, it would be interestingto continue with other pathways or protein families, now that the analysis workflows areestablished. The investigation of plastid phosphate transporters could be extended to en-lighten the relationship to other transporters, like the nucleotide sugar transporter that isthought to be the origin of the pPTs [Colleoni et al., 2010; Weber et al., 2006]. Also, a moreglobal analysis of plant enzymes that are part of metabolic pathways associated with pPTsto find possible co-occurrences of transporter subgroups and the gain or loss of enzymesmay be interesting. Such results would have to be supported by experimental evidence.In the NAD field, a more detailed analysis of NAD-consuming enzymes or of the de novoNAD synthesis could lead to a better understanding of the NADmetabolism and new drugtargets against diseases associated with NAD metabolism. Of course, completely differentpathways could be interesting to analyse as well, preferentially with collaboration partnersthat can back the results with experiments.
43

3 Conclusions and future perspectives
In general, it might be rewarding to extend the analyses to the regulatory regions ofgenes. A comparison of common transcription factor binding sites and other regulatorysites may allow predicting expression patterns, for example, of pPT subgroups. This mayhelp to answer the question why there are so many different transporter subtypes.
In the coming years, the genomes of more and more species will be sequenced. Besidesthe efforts of many biological research groups to sequence their favourite organism, thereare also large sequencing projects with the aim to sequence a certain number of differ-ent organisms of a given clade. There are, for example, the Genome 10K Project that aimsto sequence the genomes of 10 000 vertebrate species [Genome 10K Community of Scien-tists, 2009] and the 1000 Plants Project that sequences transcriptomes of 1000 plant species[Matasci et al., 2014]. There are similar projects to sequence prokaryote genomes and mul-tiple genomes of the same species to allow for analysis of intraspecies variation. With allthese sequences available, analyses such as in Paper II and Paper III will become morecomprehensive. The most interesting genomes would be those of species that do not haveclosely related species or where no species of a whole family has been sequenced yet. Be-sides sequencing of more genomes, a better quality of genomes would also help to gainfurther knowledge.
With this exciting future ahead of us, whatever upcoming biological investigations willdeal with, there will certainly be more need for bioinformaticians to press <enter>.
44

4 Bibliography
Abelson, J., Trotta, C. R., and Li, H. (1998). tRNA splicing. The Journal of Biological Chem-istry, 273(21):12685–8.
Ahrens, J., Dos Santos, H. G., and Siltberg-Liberles, J. (2016). The nuanced interplay ofintrinsic disorder and other structural properties driving protein evolution. MolecularBiology and Evolution, 33(9):2248–56.
Akashi, H., Osada, N., and Ohta, T. (2012). Weak selection and protein evolution. Genetics,192(1):15–31.
Aksoy, S., Szumlanski, C. L., andWeinshilboum, R. M. (1994). Human liver nicotinamide N-methyltransferase. cDNA cloning, expression, and biochemical characterization. Journalof Biological Chemistry, 269(20):14835–14840.
Albà, M. M. and Castresana, J. (2007). On homology searches by protein Blast and thecharacterization of the age of genes. BMC Evolutionary Biology, 7(53).
Altschul, S. F., Gish, W., Miller, W., Myers, E. W., and Lipman, D. J. (1990). Basic localalignment search tool. Journal of Molecular Biology, 215(3):403–10.
Anisimova, M., Bielawski, J. P., and Yang, Z. (2001). Accuracy and power of the likelihoodratio test in detecting adaptive molecular evolution. Molecular Biology and Evolution,18(8):1585–92.
Archibald, J. M. (2015). Endosymbiosis and eukaryotic cell evolution. Current Biology,25(19):R911–R921.
Athanasiou, K., Dyson, B. C., Webster, R. E., and Johnson, G. N. (2010). Dynamic ac-climation of photosynthesis increases plant fitness in changing environments. PlantPhysiology, 152(1):366–73.
Becraft, E. D., Woyke, T., Jarett, J., Ivanova, N., Godoy-Vitorino, F., Poulton, N., Brown,J. M., Brown, J. W., Lau, M. C. Y., Onstott, T., Eisen, J. A., Moser, D., and Stepanauskas, R.(2017). Rokubacteria: Genomic giants among the uncultured bacterial phyla. Frontiersin Microbiology, 8:2264.
Belenky, P., Racette, F. G., Bogan, K. L., McClure, J. M., Smith, J. S., and Brenner, C.(2007). Nicotinamide riboside promotes Sir2 silencing and extends lifespan via Nrk andUrh1/Pnp1/Meu1 pathways to NAD+. Cell, 129(3):473–484.
45

4 Bibliography
Bellinzoni, M., De Rossi, E., Branzoni, M., Milano, A., Peverali, F. A., Rizzi, M., and Riccardi,G. (2002). Heterologous expression, purification, and enzymatic activity of Mycobac-terium tuberculosis NAD+ synthetase. Protein Expression and Purification, 25(3):547–557.
Berg, J. M., Tymoczko, J. L., and Stryer, L. (2010). Biochemistry. W. H. Freeman, 7th edition.
Berger, F., Ramírez-Hernández, M. H., and Ziegler, M. (2004). The new life of a centenarian:Signalling functions of NAD(P). Trends in Biochemical Sciences, 29(3):111–118.
Blinova, K., Carroll, S., Bose, S., Smirnov, A. V., Harvey, J. J., Knutson, J. R., and Balaban,R. S. (2005). Distribution of mitochondrial NADH fluorescence lifetimes: Steady-statekinetics of matrix NADH interactions. Biochemistry, 44(7):2585–2594.
Borchert, S., Harborth, J., Schünemann, D., Hoferichter, P., and Heldt, H. W. (1993). Studiesof the enzymic capacities and transport properties of pea root plastids. Plant Physiology,101(1):303–312.
Boskey, A. L. and Villarreal-Ramirez, E. (2016). Intrinsically disordered proteins and biom-ineralization. Matrix Biology, 52:43–59.
Bouckaert, R., Heled, J., Kühnert, D., Vaughan, T., Wu, C.-H., Xie, D., Suchard, M. A., Ram-baut, A., and Drummond, A. J. (2014). BEAST 2: A software platform for Bayesian evo-lutionary analysis. PLoS Computational Biology, 10(4):e1003537.
Bräutigam, A. and Weber, A. P. M. (2009). Proteomic analysis of the proplastid envelopemembrane provides novel insights into small molecule and protein transport across pro-plastid membranes. Molecular Plant, 2(6):1247–1261.
Buchfink, B., Xie, C., and Huson, D. H. (2014). Fast and sensitive protein alignment usingDIAMOND. Nature Methods, 12(1):59–60.
Buonvicino, D., Mazzola, F., Zamporlini, F., Resta, F., Ranieri, G., Camaioni, E., Muzzi, M.,Zecchi, R., Pieraccini, G., Dölle, C., Calamante, M., Bartolucci, G., Ziegler, M., Stecca, B.,Raffaelli, N., and Chiarugi, A. (2018). Identification of the nicotinamide salvage pathwayas a new toxification route for antimetabolites. Cell Chemical Biology, 25(4):471–482.e7.
Burt, D. W. (2002). Origin and evolution of avian microchromosomes. Cytogenetic andGenome Research, 96(1-4):97–112.
Bütepage, M., Eckei, L., Verheugd, P., and Lüscher, B. (2015). Intracellular mono-ADP-ribosylation in signaling and disease. Cells, 4(4):569–595.
Cantó, C. and Auwerx, J. (2012). Targeting sirtuin 1 to improve metabolism: all you needis NAD+? Pharmacological Reviews, 64(1):166–87.
Carneiro, J., Duarte-Pereira, S., Azevedo, L., Castro, L. F. C., Aguiar, P., Moreira, I. S.,Amorim, A., and Silva, R. M. (2013). The evolutionary portrait of metazoan NAD sal-vage. PLoS ONE, 8(5).
46

4 Bibliography
Castresana, J. (2000). Selection of conserved blocks from multiple alignments for their usein phylogenetic analysis. Molecular Biology and Evolution, 17(4):540–52.
Cavalier-Smith, T. (2000). Membrane heredity and early chloroplast evolution. Trends inPlant Science, 5(4):174–182.
Cavuoto, P. and Fenech, M. F. (2012). A review of methionine dependency and the role ofmethionine restriction in cancer growth control and life-span extension. Cancer Treat-ment Reviews, 38(6):726–736.
Chamary, J.-V., Parmley, J. L., and Hurst, L. D. (2006). Hearing silence: Non-neutral evolu-tion at synonymous sites in mammals. Nature Reviews Genetics, 7(2):98–108.
Charlesworth, B. (2009). Fundamental concepts in genetics: effective population size andpatterns of molecular evolution and variation. Nature Reviews Genetics, 10(3):195–205.
Charlesworth, B. (2010). Molecular population genomics: A short history. Genetics Re-search, 92(5-6):397–411.
Chen, J., Glémin, S., and Lascoux, M. (2017). Genetic diversity and the efficacy of purifyingselection across plant and animal species. Molecular Biology and Evolution, 34(6):1417–1428.
Chen, J. Q., Wu, Y., Yang, H., Bergelson, J., Kreitman, M., and Tian, D. (2009). Variationin the ratio of nucleotide substitution and indel rates across genomes in mammals andbacteria. Molecular Biology and Evolution, 26(7):1523–1531.
Clapham, D. E. (2007). Calcium signaling. Cell, 131(6):1047–1058.
Colleoni, C., Linka, M., Deschamps, P., Handford, M. G., Dupree, P., Weber, A. P. M., andBall, S. G. (2010). Phylogenetic and biochemical evidence supports the recruitment of anADP-glucose translocator for the export of photosynthate during plastid endosymbiosis.Molecular Biology and Evolution, 27(12):2691–2701.
Corda, D. and Di Girolamo, M. (2003). Functional aspects of protein mono-ADP-ribosylation. EMBO Journal, 22(9):1953–1958.
De Bruyn, A., Martin, D. P., and Lefeuvre, P. (2014). Phylogenetic reconstruction methods:an overview. Methods in Molecular Biology, 1115:257–77.
De Vos, M., Schreiber, V., and Dantzer, F. (2012). The diverse roles and clinical relevanceof PARPs in DNA damage repair: Current state of the art. Biochemical Pharmacology,84(2):137–146.
de Vries, J. and Archibald, J. M. (2018). Plant evolution: landmarks on the path to terrestriallife. New Phytologist, 217(4):1428–1434.
47

4 Bibliography
Di Paola, S., Micaroni, M., Di Tullio, G., Buccione, R., and Di Girolamo, M.(2012). PARP16/ARTD15 is a novel endoplasmic-reticulum-associated mono-ADP-ribosyltransferase that interacts with, and modifies karyopherin-β1. PLoS ONE, 7(6).
Dupont, C., Armant, D. R., and Brenner, C. A. (2009). Epigenetics: definition, mechanismsand clinical perspective. Seminars in Reproductive Medicine, 27(5):351–7.
Dyson, B. C., Allwood, J. W., Feil, R., Xu, Y., Miller, M., Bowsher, C. G., Goodacre, R., Lunn,J. E., and Johnson, G. N. (2015). Acclimation of metabolism to light in Arabidopsis thali-ana: The glucose 6-phosphate/phosphate translocator GPT2 directs metabolic acclima-tion. Plant, Cell and Environment, 38(7):1404–1417.
Edgar, R. C. (2004). MUSCLE: Multiple sequence alignment with high accuracy and highthroughput. Nucleic Acids Research, 32(5):1792–1797.
Eicks, M., Maurino, V., Knappe, S., Flügge, U.-I., and Fischer, K. (2002). The plastidic pentosephosphate translocator represents a link between the cytosolic and the plastidic pentosephosphate pathways in plants. Plant Physiology, 128(2):512–22.
Elhanati, Y., Murugan, A., Callan, C. G., Mora, T., and Walczak, A. M. (2014). Quantify-ing selection in immune receptor repertoires. Proceedings of the National Academy ofSciences, 111(27):9875–9880.
Eyre-Walker, A. and Keightley, P. D. (2007). The distribution of fitness effects of new muta-tions. Nature Reviews Genetics, 8(8):610–618.
Felsenstein, J. (1985). Confidence limits on phylogenies: an approach using the bootstrap.Evolution, 39(4):783–791.
Felsenstein, J. and Churchill, G. A. (1996). A hidden Markov model approach to variationamong sites in rate of evolution. Molecular Biology and Evolution, 13(1):93–104.
Finazzi, G., Petroutsos, D., Tomizioli, M., Flori, S., Sautron, E., Villanova, V., Rolland, N.,and Seigneurin-Berny, D. (2015). Ions channels/transporters and chloroplast regulation.Cell Calcium, 58(1):86–97.
Fischer, K. (2011). The import and export business in plastids: Transport processes acrossthe inner envelope membrane. Plant Physiology, 155(4):1511–1519.
Fischer, K., Kammerer, B., Gutensohn, M., Arbinger, B., Weber, A. P. M., Häusler, R. E., andFlügge, U.-I. (1997). A new class of plastidic phosphate translocators: a putative linkbetween primary and secondary metabolism by the phosphoenolpyruvate/phosphateantiporter. The Plant Cell, 9(3):453–62.
Fisher, R. A. (1930). The Genetical Theory of Natural Selection. The Clarendon Press.
Flügge, U.-I. (1992). Reaction mechanism and asymmetric orientation of the reconstitutedchloroplast phosphate translocator. Biochimica et Biophysica Acta, 1110(1):112–8.
48

4 Bibliography
Flügge, U.-I. and Benz, R. (1984). Pore-forming activity in the outer membrane of thechloroplast envelope. FEBS Letters, 169(1):85–89.
Flügge, U.-I. and Gao, W. (2005). Transport of isoprenoid intermediates across chloroplastenvelope membranes. Plant Biology, 7(1):91–7.
Flügge, U.-I. and Heldt, H. W. (1984). The phosphate-triose phosphate-phosphoglyceratetranslocator of the chloroplast. Trends in Biochemical Sciences, 9(12):530–533.
Flügge, U.-I., Häusler, R. E., Ludewig, F., and Fischer, K. (2003). Functional genomics ofphosphate antiport systems of plastids. Physiologia Plantarum, 118(4):475–482.
Gazzaniga, F., Stebbins, R., Chang, S. Z., McPeek, M. A., and Brenner, C. (2009). Micro-bial NAD metabolism: lessons from comparative genomics. Microbiology and MolecularBiology Reviews, 73(3):529–41.
Ge, R.-L., Cai, Q., Shen, Y.-Y., San, A., Ma, L., Zhang, Y., Yi, X., Chen, Y., Yang, L., Huang,Y., He, R., Hui, Y., Hao, M., Li, Y., Wang, B., Ou, X., Xu, J., Zhang, Y., Wu, K., Geng, C.,Zhou, W., Zhou, T., Irwin, D. M., Yang, Y., Ying, L., Bao, H., Kim, J., Larkin, D. M., Ma, J.,Lewin, H. A., Xing, J., Platt, R. N., Ray, D. A., Auvil, L., Capitanu, B., Zhang, X., Zhang,G., Murphy, R. W., Wang, J., Zhang, Y.-P., and Wang, J. (2013). Draft genome sequenceof the Tibetan antelope. Nature Communications, 4(May):1858.
Genome 10K Community of Scientists (2009). Genome 10K: a proposal to obtain whole-genome sequence for 10,000 vertebrate species. The Journal of Heredity, 100(6):659–74.
Gentil, J., Hempel, F., Moog, D., Zauner, S., and Maier, U. G. (2017). Review: Origin ofcomplex algae by secondary endosymbiosis: A journey through time. Protoplasma,254(5):1835–1843.
Gerdes, S. Y., Kurnasov, O. V., Shatalin, K., Polanuyer, B., Sloutsky, R., Vonstein, V., Over-beek, R., and Osterman, A. L. (2006). Comparative genomics of NAD biosynthesis incyanobacteria. Journal of Bacteriology, 188(8):3012–3023.
Gillespie, J. H. (2001). Is the population size of a species relevant to its evolution? Evolution,55(11):2161–9.
Glossop, N. R. J. and Hardin, P. E. (2002). Central and peripheral circadian oscillator mech-anisms in flies and mammals. Journal of Cell Science, 115(17):3369–3377.
Gossmann, T. I., Keightley, P. D., and Eyre-Walker, A. (2012a). The effect of variation inthe effective population size on the rate of adaptive molecular evolution in eukaryotes.Genome Biology and Evolution, 4(5):658–667.
Gossmann, T. I., Song, B.-H. H., Windsor, A. J., Mitchell-Olds, T., Dixon, C. J., Kapralov,M. V., Filatov, D. A., and Eyre-Walker, A. (2010). Genome wide analyses reveal littleevidence for adaptive evolution in many plant species. Molecular Biology and Evolution,27(8):1822–32.
49

4 Bibliography
Gossmann, T. I. and Ziegler, M. (2014). Sequence divergence and diversity suggests ongoingfunctional diversification of vertebrate NAD metabolism. DNA Repair, 23:39–48.
Gossmann, T. I., Ziegler, M., Puntervoll, P., de Figueiredo, L. F., Schuster, S., and Heiland, I.(2012b). NAD+ biosynthesis and salvage – a phylogenetic perspective. The FEBS Journal,279(18):3355–3363.
Gould, S. B., Maier, U. G., and Martin, W. F. (2015). Protein import and the origin of redcomplex plastids. Current Biology, 25(12):R515–R521.
Gu, X., Orozco, J. M., Saxton, R. A., Condon, K. J., Liu, G. Y., Krawczyk, P. A., Scaria,S. M., Harper, J. W., Gygi, S. P., and Sabatini, D. M. (2017). SAMTOR is an S-adenosylmethionine sensor for the mTORC1 pathway. Science, 358(6364):813–818.
Guindon, S., Dufayard, J.-F., Lefort, V., Anisimova, M., Hordijk, W., and Gascuel, O. (2010).New algorithms and methods to estimate maximum-likelihood phylogenies: assessingthe performance of PhyML 3.0. Systematic Biology, 59(3):307–21.
Gunasekaran, K., Tsai, C. J., Kumar, S., Zanuy, D., and Nussinov, R. (2003). Extended dis-ordered proteins: Targeting function with less scaffold. Trends in Biochemical Sciences,28(2):81–85.
Ha, H. C. and Snyder, S. H. (1999). Poly(ADP-ribose) polymerase is a mediator of nec-rotic cell death by ATP depletion. Proceedings of the National Academy of Sciences,96(24):13978–82.
Haferkamp, I., Deschamps, P., Ast, M., Jeblick, W., Maier, U. G., Ball, S. G., and Neuhaus,H. E. (2006). Molecular and biochemical analysis of periplastidial starch metabolism inthe cryptophyte Guillardia theta. Eukaryotic Cell, 5(6):964–971.
Haigis, M. C., Mostoslavsky, R., Haigis, K. M., Fahie, K., Christodoulou, D. C., Murphy,A. J., Valenzuela, D. M., Yancopoulos, G. D., Karow, M., Blander, G., Wolberger, C., Prolla,T. A., Weindruch, R., Alt, F. W., and Guarente, L. P. (2006). SIRT4 inhibits glutamatedehydrogenase and opposes the effects of calorie restriction in pancreatic β cells. Cell,126(5):941–954.
Haldane, J. B. S. (1957). The cost of natural selection. Journal of Genetics, 55(3):511–524.
Hardy, G. H. (1908). Mendelian proportions in a mixed population. Science, 28(706):49–50.
Hasmann, M. and Schemainda, I. (2003). FK866, a highly specific noncompetitive inhibitorof nicotinamide phosphoribosyltransferase, represents a novel mechanism for inductionof tumor cell apoptosis. Cancer Research, 63(21):7436–42.
Hay, N. and Sonenberg, N. (2004). Upstream and downstream of mTOR. Genes & Develop-ment, 18(16):1926–45.
50

4 Bibliography
Heckmann, D., Schulze, S., Denton, A., Gowik, U.,Westhoff, P.,Weber, A. P. M., and Lercher,M. J. (2013). Predicting C4 photosynthesis evolution: modular, individually adaptivesteps on a Mount Fuji fitness landscape. Cell, 153(7):1579–88.
Herrmann, K.M. (1995). The shikimate pathway: Early steps in the biosynthesis of aromaticcompounds. The Plant Cell, 7(7):907.
Herrmann, K. M. andWeaver, L. M. (1999). The shikimate pathway. Annual Review of PlantPhysiology and Plant Molecular Biology, 50(1):473–503.
Hong, S. J., Dawson, T. M., and Dawson, V. L. (2004). Nuclear and mitochondrial con-versations in cell death: PARP-1 and AIF signaling. Trends in Pharmacological Sciences,25(5):259–264.
Hopp, T. P., Prickett, K. S., Price, V. L., Libby, R. T., March, C. J., Pat Cerretti, D., Urdal, D. L.,and Conlon, P. J. (1988). A short polypeptide marker sequence useful for recombinantprotein identification and purification. Bio/Technology, 6(10):1204–1210.
Houtkooper, R. H., Pirinen, E., and Auwerx, J. (2012). Sirtuins as regulators of metabolismand healthspan. Nature Reviews Molecular Cell Biology, 13(4):225–238.
Hron, T., Pajer, P., Pačes, J., Bartüněk, P., and Elleder, D. (2015). Hidden genes in birds.Genome Biology, 16(1):4–7.
Hu, Q.-D., Lu, H., Huo, K., Ying, K., Li, J., Xie, Y., Mao, Y., and Li, Y.-Y. (2003). A humanhomolog of the yeast gene encoding tRNA 2’-phosphotransferase: cloning, characteriza-tion and complementation analysis. Cellular and Molecular Life Sciences, 60(8):1725–32.
Huang, C. Y., Ayliffe, M. A., and Timmis, J. N. (2003). Direct measurement of the transferrate of chloroplast DNA into the nucleus. Nature, 422(6927):72–76.
Huang, J. and Manning, B. D. (2008). The TSC1-TSC2 complex: a molecular switchboardcontrolling cell growth. Biochemical Journal, 412(2):179–190.
Iwata, H., Goettsch, C., Sharma, A., Ricchiuto, P., Goh, W. W. B., Halu, A., Yamada, I.,Yoshida, H., Hara, T., Wei, M., Inoue, N., Fukuda, D., Mojcher, A., Mattson, P. C., Barabási,A.-L., Boothby, M., Aikawa, E., Singh, S. A., and Aikawa, M. (2016). PARP9 and PARP14cross-regulate macrophage activation via STAT1 ADP-ribosylation. Nature Communica-tions, 7:12849.
Jiang, W., Wang, S., Xiao, M., Lin, Y., Zhou, L., Lei, Q., Xiong, Y., Guan, K.-L., and Zhao, S.(2011). Acetylation regulates gluconeogenesis by promoting PEPCK1 degradation viarecruiting the UBR5 ubiquitin ligase. Molecular Cell, 43(1):33–44.
Jing, E., Gesta, S., and Kahn, C. R. (2007). SIRT2 regulates adipocyte differentiation throughFoxO1 acetylation/deacetylation. Cell Metabolism, 6(2):105–114.
51

4 Bibliography
Jordan, G. andGoldman, N. (2012). The effects of alignment error and alignment filtering onthe sitewise detection of positive selection. Molecular Biology and Evolution, 29(4):1125–1139.
Jwa, M. and Chang, P. (2012). PARP16 is a tail-anchored endoplasmic reticulum proteinrequired for the PERK- and IRE1α-mediated unfolded protein response. Nature CellBiology, 14(11):1223–1230.
Kammerer, B., Fischer, K., Hilpert, B., Schubert, S., Gutensohn, M., Weber, A. P. M., andFlügge, U.-I. (1998). Molecular characterization of a carbon transporter in plastids fromheterotrophic tissues: The glucose 6-phosphate/phosphate antiporter. The Plant Cell,10(1):105–117.
Kanehisa, M. andGoto, S. (2000). KEGG: Kyoto encyclopedia of genes and genomes. NucleicAcids Research, 28(1):27–30.
Katoh, K. and Standley, D. M. (2016). A simple method to control over-alignment in theMAFFT multiple sequence alignment program. Bioinformatics, 32(13):1933–42.
Kellogg, E. A. (2013). C4 photosynthesis. Current Biology, 23(14):R594–9.
Kent, W. J. (2002). BLAT – the BLAST-like alignment tool. Genome Research, 12(4):656–64.
Khan, T., Douglas, G. M., Patel, P., Ba, A. N. N., and Moses, A. M. (2015). Polymorphismanalysis reveals reduced negative selection and elevated rate of insertions and deletionsin intrinsically disordered protein regions. Genome Biology and Evolution, 7(6):1815–1826.
Kimura, M. (1968). Evolutionary rate at the molecular level. Nature, 217(5129):624–6.
Kimura, M. and Ohta, T. (1969). The average number of generations until fixation of amutant gene in a finite population. Genetics, 61(3):763–71.
King, J. L. and Jukes, T. H. (1969). Non-Darwinian evolution. Science, 164(3881):788–98.
Knappe, S., Flügge, U.-I., and Fischer, K. (2003a). Analysis of the plastidic phosphate trans-locator gene family in Arabidopsis and identification of new phosphate translocator-homologous transporters, classified by their putative substrate-binding site. PlantPhysiology, 131(3):1178–90.
Knappe, S., Löttgert, T., Schneider, A., Voll, L. M., Flügge, U.-I., and Fischer, K. (2003b).Characterization of two functional phosphoenolpyruvate/phosphate translocator (PPT)genes in Arabidopsis – AtPPT1 may be involved in the provision of signals for correctmesophyll development. Plant Journal, 36(3):411–420.
Koehn, C. J. and Elvehjem, C. A. (1937). Further studies on the concentration of the anti-pellagra factor. Journal of Biological Chemistry, 118:693–699.
52

4 Bibliography
Kofler, H., Häusler, R. E., Schulz, B., Gröner, F., Flügge, U.-I., and Weber, A. P. M. (2000).Molecular characterisation of a new mutant allele of the plastid phosphoglucomutase inArabidopsis, and complementation of the mutant with the wild-type cDNA. Molecular& General Genetics, 263(6):978–86.
Kosakovsky Pond, S. L. and Frost, S. D.W. (2005). Not so different after all: A comparison ofmethods for detecting amino acid sites under selection. Molecular Biology and Evolution,22(5):1208–1222.
Kruger, N. J. and von Schaewen, A. (2003). The oxidative pentose phosphate pathway:Structure and organisation. Current Opinion in Plant Biology, 6(3):236–246.
Kunz, H. H., Häusler, R. E., Fettke, J., Herbst, K., Niewiadomski, P., Gierth, M., Bell, K.,Steup, M., Flügge, U.-I., and Schneider, A. (2010). The role of plastidial glucose-6-phosphate/phosphate translocators in vegetative tissues ofArabidopsis thalianamutantsimpaired in starch biosynthesis. Plant Biology, 12(Suppl. 1):115–28.
Kurnasov, O. V., Goral, V., Colabroy, K., Gerdes, S. Y., Anantha, S., Osterman, A. L., andBegley, T. P. (2003). NAD biosynthesis: Identification of the tryptophan to quinolinatepathway in bacteria. Chemistry & Biology, 10(12):1195–1204.
Kutschera, U. and Niklas, K. J. (2004). The modern theory of biological evolution: an ex-panded synthesis. Die Naturwissenschaften, 91(6):255–76.
Lau, C., Dölle, C., Gossmann, T. I., Agledal, L., Niere, M., and Ziegler, M. (2010). Isoform-specific targeting and interaction domains in human nicotinamide mononucleotide ad-enylyltransferases. The Journal of Biological Chemistry, 285(24):18868–76.
Lee, H. C. (2012). Cyclic ADP-ribose and nicotinic acid adenine dinucleotide phosphate(NAADP) as messengers for calcium mobilization. Journal of Biological Chemistry,287(38):31633–31640.
Lee, Y., Nishizawa, T., Takemoto, M., Kumazaki, K., Yamashita, K., Hirata, K., Minoda, A.,Nagatoishi, S., Tsumoto, K., Ishitani, R., and Nureki, O. (2017). Structure of the triose-phosphate/phosphate translocator reveals the basis of substrate specificity. NaturePlants, 3(10):825–832.
Linka, M., Jamai, A., and Weber, A. P. M. (2008). Functional characterization of the plas-tidic phosphate translocator gene family from the thermo-acidophilic red alga Galdieriasulphuraria reveals specific adaptations of primary carbon partitioning in green plantsand red algae. Plant Physiology, 148(3):1487–96.
Lipton, J. O. and Sahin, M. (2014). The neurology of mTOR. Neuron, 84(2):275–291.
Liu, Y., Schmidt, B., and Maskell, D. L. (2010). MSAProbs: Multiple sequence alignmentbased on pair hidden Markov models and partition function posterior probabilities. Bio-informatics, 26(16):1958–1964.
53

4 Bibliography
Lynch, M. and Crease, T. J. (1990). The analysis of population survey data on DNA sequencevariation. Molecular Biology and Evolution, 7(4):377–94.
Magni, G., Amici, A., Emanuelli, M., Orsomando, G., Raffaelli, N., and Ruggieri, S. (2004).Enzymology of NAD+ homeostasis inman. Cellular andMolecular Life Sciences, 61(1):19–34.
Majeran, W., Zybailov, B., Ytterberg, A. J., Dunsmore, J., Sun, Q., and van Wijk, K. J. (2008).Consequences of C4 differentiation for chloroplast membrane proteomes in maize meso-phyll and bundle sheath cells. Molecular & Cellular Proteomics, 7(9):1609–1638.
Martin, P. R., Shea, R. J., and Mulks, M. H. (2001). Identification of a plasmid-encoded genefrom Haemophilus ducreyi which confers NAD independence. Journal of Bacteriology,183(4):1168–74.
Martin, W. F., Rujan, T., Richly, E., Hansen, A., Cornelsen, S., Lins, T., Leister, D., Stoebe,B., Hasegawa, M., and Penny, D. (2002). Evolutionary analysis of Arabidopsis, cyanobac-terial, and chloroplast genomes reveals plastid phylogeny and thousands of cyanobac-terial genes in the nucleus. Proceedings of the National Academy of Sciences, 99(19):12246–51.
Matasci, N., Hung, L.-h., Yan, Z., Carpenter, E. J., Wickett, N. J., Mirarab, S., Nguyen, N.,Warnow, T., Ayyampalayam, S., Barker, M., Burleigh, J. G., Gitzendanner, M. A., Wafula,E., Der, J. P., DePamphilis, C. W., Roure, B., Philippe, H., Ruhfel, B. R., Miles, N. W.,Graham, S. W., Mathews, S., Surek, B., Melkonian, M., Soltis, D. E., Soltis, P. S., Rothfels,C., Pokorny, L., Shaw, J. A., DeGironimo, L., Stevenson, D. W., Villarreal, J. C., Chen, T.,Kutchan, T. M., Rolf, M., Baucom, R. S., Deyholos, M. K., Samudrala, R., Tian, Z., Wu, X.,Sun, X., Zhang, Y., Wang, J., Leebens-Mack, J., and Wong, G. K.-S. (2014). Data accessfor the 1,000 plants (1KP) project. Gigascience, 3:17.
McDonald, J. H. and Kreitman, M. (1991). Adaptive protein evolution at the Adh locus inDrosophila. Nature, 351(6328):652–654.
Meierhoff, K. and Westhoff, P. (1993). Differential biogenesis of photosystem II inmesophyll and bundle-sheath cells of monocotyledonous NADP-malic enzyme-typeC4 plants: the non-stoichiometric abundance of the subunits of photosystem II in thebundle-sheath chloroplasts and the translational activity of the plastome-encoded genes.Planta, 191(1):23–33.
Mereschkowsky, C. (1905). Über Natur und Ursprung der Chromatophoren im Pflanzen-reiche. Biologisches Centralblatt, 25(18).
Mereschkowsky, C. (1910). Theorie der zwei Plasmaarten als Grundlage der Symbiogenesis,einer neuen Lehre von der Entstehung der Organismen. Biologisches Centralblatt, 30(8-11).
54

4 Bibliography
Michishita, E., McCord, R. A., Berber, E., Kioi, M., Padilla-Nash, H., Damian, M., Cheung, P.,Kusumoto, R., Kawahara, T. L. A., Barrett, J. C., Chang, H. Y., Bohr, V. A., Ried, T., Gozani,O., and Chua, K. F. (2008). SIRT6 is a histone H3 lysine 9 deacetylase that modulatestelomeric chromatin. Nature, 452(7186):492–496.
Moog, D., Rensing, S. A., Archibald, J. M., Maier, U. G., and Ullrich, K. K. (2015). Localizationand evolution of putative triose phosphate translocators in the diatom Phaeodactylumtricornutum. Genome Biology and Evolution, 7(11):2955–2969.
Mou, Z., He, Y., Dai, Y., Liu, X., and Li, J. (2000). Deficiency in fatty acid synthase leadsto premature cell death and dramatic alterations in plant morphology. The Plant Cell,12(3):405–18.
Nakagawa, T., Lomb, D. J., Haigis, M. C., and Guarente, L. P. (2009). SIRT5 deacetylatescarbamoyl phosphate synthetase 1 and regulates the urea cycle. Cell, 137(3):560–570.
Nasrin, N., Wu, X., Fortier, E., Feng, Y., Baré, O. C., Chen, S., Ren, X., Wu, Z., Streeper, R. S.,and Bordone, L. (2010). SIRT4 regulates fatty acid oxidation and mitochondrial geneexpression in liver and muscle cells. Journal of Biological Chemistry, 285(42):31995–32002.
NCBI Resource Coordinators (2017). Database resources of the national center for biotech-nology information. Nucleic Acids Research, 45(D1):D12–D17.
Needleman, S. B. and Wunsch, C. D. (1970). A general method applicable to the search forsimilarities in the amino acid sequence of two proteins. Journal of Molecular Biology,48(3):443–453.
Nei, M. and Li, W.-H. (1979). Mathematical model for studying genetic variation in terms ofrestriction endonucleases. Proceedings of the National Academy of Sciences, 76(10):5269–5273.
Nejabati, H. R., Mihanfar, A., Pezeshkian, M., Fattahi, A., Latifi, Z., Safaie, N., Valiloo, M.,Jodati, A. R., and Nouri, M. (2018). N1-methylnicotinamide (MNAM) as a guardian ofcardiovascular system. Journal of Cellular Physiology, 233(10):6386–6394.
Neuhaus, H. E., Batz, O., Thom, E., and Scheibe, R. (1993). Purification of highly intactplastids from various heterotrophic plant tissues: Analysis of enzymic equipment andprecursor dependency for starch biosynthesis. The Biochemical Journal, 296(2):395–401.
Niewiadomski, P., Knappe, S., Geimer, S., Fischer, K., Schulz, B., Unte, U. S., Rosso, M. G.,Ache, P., Flügge, U.-I., and Schneider, A. (2005). The Arabidopsis plastidic glucose 6-phosphate/phosphate translocator GPT1 is essential for pollen maturation and embryosac development. The Plant Cell, 17(3):760–75.
North, B. J. and Verdin, E. (2004). Sirtuins: Sir2-related NAD-dependent proteindeacetylases. Genome Biology, 5(5):224.
55

4 Bibliography
Ohta, T. (1973). Slightly deleterious mutant substitutions in evolution. Nature,246(5428):96–98.
Ohta, T. and Gillespie, J. H. (1996). Development of neutral and nearly neutral theories.Theoretical Population Biology, 49(2):128–42.
Oka, S.-I., Hsu, C.-P., and Sadoshima, J. (2012). Regulation of cell survival and death bypyridine nucleotides. Circulation Research, 111(5):611–27.
Okamura, A., Ohmura, Y., Islam, M. M., Tagawa, M., Horitsu, K., Moriyama, Y., andFujimura, S. (1998). Increased hepatic nicotinamide N-methyltransferase activity as amarker of cancer cachexia in mice bearing colon 26 adenocarcinoma. Japanese Journalof Cancer Research, 89(6):649–656.
Osborne, B., Bentley, N. L., Montgomery, M. K., and Turner, N. (2016). The role of mito-chondrial sirtuins in health and disease. Free Radical Biology and Medicine, 100:164–174.
Pais, F. S.-M., Ruy, P. d. C., Oliveira, G., and Coimbra, R. S. (2014). Assessing the efficiencyof multiple sequence alignment programs. Algorithms for Molecular Biology, 9(1):4.
Paranjpe, D. A. and Sharma, V. K. (2005). Evolution of temporal order in living organisms.Journal of Circadian Rhythms, 3(1):7.
Parks, D. H., Imelfort, M., Skennerton, C. T., Hugenholtz, P., and Tyson, G. W. (2015).CheckM: assessing the quality of microbial genomes recovered from isolates, single cells,and metagenomes. Genome Research, 25(7):1043–55.
Peng, Z., Yan, J., Fan, X., Mizianty, M. J., Xue, B., Wang, K., Hu, G., Uversky, V. N., andKurgan, L. (2014). Exceptionally abundant exceptions: Comprehensive characterizationof intrinsic disorder in all domains of life. Cellular and Molecular Life Sciences, 72(1):137–151.
Peters, J. (2014). The role of genomic imprinting in biology and disease: An expanding view.Nature Reviews Genetics, 15(8):517–530.
Piovesan, D., Tabaro, F., Paladin, L., Necci, M., Mieti, I., Camilloni, C., Davey, N.,Dosztányi, Z., Mészáros, B., Monzon, A. M., Parisi, G., Schad, E., Sormanni, P., Tompa,P., Vendruscolo, M., Vranken, W. F., and Tosatto, S. C. E. (2018). MobiDB 3.0: More an-notations for intrinsic disorder, conformational diversity and interactions in proteins.Nucleic Acids Research, 46(D1):D471–D476.
Pombert, J. F., Blouin, N. A., Lane, C., Boucias, D., and Keeling, P. J. (2014). A lack ofparasitic reduction in the obligate parasitic green alga Helicosporidium. PLoS Genetics,10(5).
Ponger, L. and Li, W.-H. (2005). Evolutionary diversification of DNA methyltransferasesin eukaryotic genomes. Molecular Biology and Evolution, 22(4):1119–1128.
56

4 Bibliography
Prabhakar, V., Löttgert, T., Gigolashvili, T., Bell, K., Flügge, U.-I., and Häusler, R. E. (2009).Molecular and functional characterization of the plastid-localized phosphoenolpyruvateenolase (ENO1) from Arabidopsis thaliana. FEBS Letters, 583(6):983–991.
Preiss, J. and Handler, P. (1958a). Biosynthesis of diphosphopyridine nucleotide. I. identi-fication of intermediates. The Journal of Biological Chemistry, 233(2):488–92.
Preiss, J. and Handler, P. (1958b). Biosynthesis of diphosphopyridine nucleotide. II. en-zymatic aspects. The Journal of Biological Chemistry, 233(2):493–500.
Price, D. C., Chan, C. X., Yoon, H. S., Yang, E. C., Qiu, H., Weber, A. P. M., Schwacke, R.,Gross, J., Blouin, N. A., Lane, C., Reyes-Prieto, A., Durnford, D. G., Neilson, J. A. D., Lang,B. F., Burger, G., Steiner, J. M., Löffelhardt, W., Meuser, J. E., Posewitz, M. C., Ball, S. G.,Arias, M. C., Henrissat, B., Coutinho, P. M., Rensing, S. A., Symeonidi, A., Doddapaneni,H., Green, B. R., Rajah, V. D., Boore, J., and Bhattacharya, D. (2012). Cyanophora paradoxagenome elucidates origin of photosynthesis in algae and plants. Science, 335(6070):843–7.
Prud’homme, B., Gompel, N., and Carroll, S. B. (2007). Emerging principles of regulatoryevolution. Proceedings of the National Academy of Sciences, 104(Supplement 1):8605–12.
Rardin, M. J., He, W., Nishida, Y., Newman, J. C., Carrico, C., Danielson, S. R., Guo, A.,Gut, P., Sahu, A. K., Li, B., Uppala, R., Fitch, M., Riiff, T., Zhu, L., Zhou, J., Mulhern, D.,Stevens, R. D., Ilkayeva, O. R., Newgard, C. B., Jacobson, M. P., Hellerstein, M., Goetzman,E. S., Gibson, B. W., and Verdin, E. (2013a). SIRT5 regulates the mitochondrial lysinesuccinylome and metabolic networks. Cell Metabolism, 18(6):920–933.
Rardin, M. J., Newman, J. C., Held, J. M., Cusack, M. P., Sorensen, D. J., Li, B., Schilling, B.,Mooney, S. D., Kahn, C. R., Verdin, E., and Gibson, B. W. (2013b). Label-free quantitativeproteomics of the lysine acetylome in mitochondria identifies substrates of SIRT3 inmetabolic pathways. Proceedings of the National Academy of Sciences, 110(16):6601–6.
Rogozin, I. B., Carmel, L., Csuros, M., and Koonin, E. V. (2012). Origin and evolution ofspliceosomal introns. Biology Direct, 7:11.
Rolfe, H. M. (2014). A review of nicotinamide: treatment of skin diseases and potential sideeffects. Journal of Cosmetic Dermatology, 13(4):324–8.
Rolletschek, H., Nguyen, T. H., Häusler, R. E., Rutten, T., Göbel, C., Feussner, I., Radchuk,R., Tewes, A., Claus, B., Klukas, C., Linemann, U., Weber, H., Wobus, U., and Borisjuk,L. (2007). Antisense inhibition of the plastidial glucose-6-phosphate/phosphate translo-cator in Vicia seeds shifts cellular differentiation and promotes protein storage. PlantJournal, 51(3):468–484.
Ronquist, F. and Huelsenbeck, J. P. (2003). MrBayes 3: Bayesian phylogenetic inferenceunder mixed models. Bioinformatics, 19(12):1572–4.
Rosbash, M. (2009). The implications of multiple circadian clock origins. PLoS Biology,7(3):e62.
57

4 Bibliography
Rose, P. W., Bi, C., Bluhm, W. F., Christie, C. H., Dimitropoulos, D., Dutta, S., Green, R. K.,Goodsell, D. S., Prlić, A.,Quesada, M.,Quinn, G. B., Ramos, A. G.,Westbrook, J. D., Young,J., Zardecki, C., Berman, H. M., and Bourne, P. E. (2013). The RCSB protein data bank:New resources for research and education. Nucleic Acids Research, 41(D1):475–482.
Rouleau, M., McDonald, D., Gagné, P., Ouellet, M.-E., Droit, A., Hunter, J. M., Dutertre, S.,Prigent, C., Hendzel, M. J., and Poirier, G. G. (2007). PARP-3 associates with polycombgroup bodies and with components of the DNA damage repair machinery. Journal ofCellular Biochemistry, 100(2):385–401.
Ruggieri, S., Orsomando, G., Sorci, L., and Raffaelli, N. (2015). Regulation of NAD biosyn-thetic enzymes modulates NAD-sensing processes to shape mammalian cell physiologyunder varying biological cues. Biochimica et Biophysica Acta, 1854(9):1138–49.
Ruhfel, B. R., Gitzendanner, M. A., Soltis, P. S., Soltis, D. E., and Burleigh, J. G. (2014). Fromalgae to angiosperms – inferring the phylogeny of green plants (Viridiplantae) from 360plastid genomes. BMC Evolutionary Biology, 14:23.
Sage, R. F. (2016). A portrait of the C4 photosynthetic family on the 50th anniversaryof its discovery: species number, evolutionary lineages, and hall of fame. Journal ofExperimental Botany, 67(14):4039–56.
Sawaya, R., Schwer, B., and Shuman, S. (2005). Structure-function analysis of the yeastNAD+-dependent tRNA 2ʹ-phosphotransferase Tpt1. RNA, 11:107–113.
Scally, A. (2016). The mutation rate in human evolution and demographic inference. Cur-rent Opinion in Genetics and Development, 41:36–43.
Schimper, A. F. W. (1883). Ueber die Entwicklung der Chlorophyllkörner und Farbkörner.Botanische Zeitung, 41(7-10).
Schmid, J. and Amrhein, N. (1995). Molecular organization of the shikimate pathway inhigher plants. Phytochemistry, 39(4):737–749.
Schulz, B., Frommer, W. B., Flügge, U.-I., Hummel, S., Fischer, K., and Willmitzer, L. (1993).Expression of the triose phosphate translocator gene from potato is light dependent andrestricted to green tissues. Molecular & General Genetics, 238(3):357–61.
Schwarz, J. J., Wiese, H., Tölle, R. C., Zarei, M., Dengjel, J., Warscheid, B., and Thedieck, K.(2015). Functional proteomics identifies Acinus L as a direct insulin- and amino acid-dependent mammalian target of rapamycin complex 1 (mTORC1) substrate. Molecular& Cellular Proteomics, 14(8):2042–2055.
Sickmeier, M., Hamilton, J. A., LeGall, T., Vacic, V., Cortese, M. S., Tantos, A., Szabo, B.,Tompa, P., Chen, J., Uversky, V. N., Obradovic, Z., and Dunker, A. K. (2007). DisProt: Thedatabase of disordered proteins. Nucleic Acids Research, 35(SUPPL. 1):786–793.
58

4 Bibliography
Simão, F. A., Waterhouse, R. M., Ioannidis, P., Kriventseva, E. V., and Zdobnov, E. M. (2015).BUSCO: Assessing genome assembly and annotation completeness with single-copy or-thologs. Bioinformatics, 31(19):3210–3212.
Singh, G. (2010). Plant Systematics. CRC Press, 3rd edition.
Smith, J. M. and Haigh, J. (1974). The hitch-hiking effect of a favourable gene. GeneticalResearch, 23:23–35.
Soltis, D. E. and Soltis, P. S. (2003). Applying the bootstrap in phylogeny reconstruction.Statistical Science, 18(2):256–267.
Sorci, L., Blaby, I., De Ingeniis, J., Gerdes, S. Y., Raffaelli, N., Lagard, V. D. C., and Osterman,A. L. (2010). Genomics-driven reconstruction ofAcinetobacter NADmetabolism: Insightsfor antibacterial target selection. Journal of Biological Chemistry, 285(50):39490–39499.
Staehr, P., Löttgert, T., Christmann, A., Krueger, S., Rosar, C., Rolčík, J., Novák, O., Strnad,M., Bell, K., Weber, A. P. M., Flügge, U.-I., and Häusler, R. E. (2014). Reticulate leavesand stunted roots are independent phenotypes pointing at opposite roles of the phos-phoenolpyruvate/phosphate translocator defective in cue1 in the plastids of both organs.Frontiers in Plant Science, 5(April):126.
Stamatakis, A. (2014). RAxML version 8: a tool for phylogenetic analysis and post-analysisof large phylogenies. Bioinformatics, 30(9):1312–3.
Stoltzfus, A., Logsdon, J. M., Palmer, J. D., and Doolittle, W. F. (1997). Intron “sliding”and the diversity of intron positions. Proceedings of the National Academy of Sciences,94(20):10739–44.
Streatfield, S. J., Weber, A. P. M., Kinsman, E. A., Häusler, R. E., Li, J., Post-Beittenmiller,D., Kaiser, W. M., Pyke, K. A., Flügge, U.-I., and Chory, J. (1999). The phosphoenolpyru-vate/phosphate translocator is required for phenolic metabolism, palisade cell develop-ment, and plastid-dependent nuclear gene expression. The Plant Cell, 11(9):1609–22.
Suchard, M. A. and Redelings, B. D. (2006). BAli-Phy: simultaneous Bayesian inference ofalignment and phylogeny. Bioinformatics, 22(16):2047–8.
Sydenstricker, V. P. (1958). The history of pellagra, its recognition as a disorder of nutritionand its conquest. The American Journal of Clinical Nutrition, 6(4):409–414.
Szklarczyk, D., Franceschini, A., Wyder, S., Forslund, K., Heller, D., Huerta-Cepas, J., Si-monovic, M., Roth, A., Santos, A., Tsafou, K. P., Kuhn, M., Bork, P., Jensen, L. J., and vonMering, C. (2015). STRING v10: Protein-protein interaction networks, integrated overthe tree of life. Nucleic Acids Research, 43(D1):D447–D452.
tenOever, B. R. (2016). The evolution of antiviral defense systems. Cell Host and Microbe,19(2):142–149.
59

4 Bibliography
Ternes, C. M. and Schönknecht, G. (2014). Gene transfers shaped the evolution of de novoNAD+ biosynthesis in eukaryotes. Genome Biology and Evolution, 6(9):2335–2349.
The 1000 Genomes Project Consortium (2015). A global reference for human genetic vari-ation. Nature, 526(7571):68–74.
The UniProt Consortium (2017). UniProt: the universal protein knowledgebase. NucleicAcids Research, 45(D1):D158–D169.
Tiley, G. P., Ané, C., and Burleigh, J. G. (2016). Evaluating and characterizing ancient whole-genome duplications in plants with gene count data. Genome Biology and Evolution,8(4):1023–37.
Tong, L. and Denu, J. M. (2010). Function and metabolism of sirtuin metabolite O-acetyl-ADP-ribose. Biochimica et Biophysica Acta, 1804(8):1617–1625.
Van Meter, M., Simon, M., Tombline, G., May, A., Morello, T. D., Hubbard, B. P., Bredben-ner, K., Park, R., Sinclair, D. A., Bohr, V. A., Gorbunova, V., and Seluanov, A. (2016).JNK phosphorylates SIRT6 to stimulate DNA double-strand break repair in response tooxidative stress by recruiting PARP1 to DNA breaks. Cell Reports, 16(10):2641–2650.
VanLinden, M. R., Skoge, R. H., and Ziegler, M. (2015). Discovery, metabolism and functionsof NAD and NADP. The Biochemist, 37(1):9–13.
Vatsiou, A. I., Bazin, E., and Gaggiotti, O. E. (2016). Changes in selective pressures asso-ciated with human population expansion may explain metabolic and immune relatedpathways enriched for signatures of positive selection. BMC Genomics, 17(1):1–11.
Veech, R. L., Eggleston, L. V., and Krebs, H. A. (1969). The redox state of free nicotinamide-adenine dinucleotide phosphate in the cytoplasm of rat liver. The Biochemical Journal,115(4):609–19.
Veeckman, E., Ruttink, T., and Vandepoele, K. (2016). Are we there yet? reliably estimatingthe completeness of plant genome sequences. The Plant Cell, 28(8):1759–68.
Viola, R., Nyvall, P., and Pedersén, M. (2001). The unique features of starch metabolism inred algae. Proceedings of the Royal Society B: Biological Sciences, 268(1474):1417–22.
Vyas, S., Matic, I., Uchima, L., Rood, J., Zaja, R., Hay, R. T., Ahel, I., and Chang, P. (2014).Family-wide analysis of poly(ADP-ribose) polymerase activity. Nature Communications,5:1–13.
Wang, J., Santiago, E., and Caballero, A. (2016). Prediction and estimation of effectivepopulation size. Heredity, 117(4):193–206.
Wang, T., Zhang, X., Bheda, P., Revollo, J. R., Imai, S.-i., and Wolberger, C. (2006). Structureof Nampt/PBEF/visfatin, a mammalian NAD+ biosynthetic enzyme. Nature Structuraland Molecular Biology, 13(7):661–662.
60

4 Bibliography
Ward, J. J., Sodhi, J. S., McGuffin, L. J., Buxton, B. F., and Jones, D. T. (2004). Predictionand functional analysis of native disorder in proteins from the three kingdoms of life.Journal of Molecular Biology, 337(3):635–45.
Weber, A. P. M., Linka, M., and Bhattacharya, D. (2006). Single, ancient origin of a plas-tid metabolite translocator family in Plantae from an endomembrane-derived ancestor.Eukaryotic Cell, 5(3):609–12.
Weber, A. P. M. and Linka, N. (2011). Connecting the plastid: Transporters of the plastidenvelope and their role in linking plastidial with cytosolic metabolism. Annual Reviewof Plant Biology, 62(1):53–77.
Weber, A. P. M., Oesterhelt, C., Gross, W., Bräutigam, A., Imboden, L. A., Krassovskaya, I.,Linka, N., Truchina, J., Schneidereit, J., Voll, H., Voll, L. M., Zimmermann, M., Jamai, A.,Riekhof,W. R., Yu, B., Garavito, R.M., and Benning, C. (2004). EST-analysis of the thermo-acidophilic red microalga Galdieria sulphuraria reveals potential for lipid A biosynthesisand unveils the pathway of carbon export from rhodoplasts. Plant Molecular Biology,55(1):17–32.
Weinberg, W. (1908). Über den Nachweis der Vererbung beim Menschen. Jahreshefte desVereins für vaterländische Naturkunde in Württemberg, 64:369–382.
Wessler, S. R., Bureau, T. E., and White, S. E. (1995). LTR-retrotransposons and MITEs:important players in the evolution of plant genomes. Current Opinion in Genetics andDevelopment, 5(6):814–21.
Williamson, D. H., Lund, P., and Krebs, H. A. (1967). The redox state of free nicotinamide-adenine dinucleotide in the cytoplasm andmitochondria of rat liver. Biochemical Journal,103(2):514–527.
Wojcik, M., Seidle, H. F., Bieganowski, P., and Brenner, C. (2006). Glutamine-dependentNAD+ synthetase: How a two-domain, three-substrate enzyme avoids waste. Journal ofBiological Chemistry, 281(44):33395–33402.
Wright, S. (1931). Evolution in Mendelian populations. Genetics, 16(2):97–159.
Wu, M., Chatterji, S., and Eisen, J. A. (2012). Accounting for alignment uncertainty inphylogenomics. PLoS ONE, 7(1):1–10.
Yang, C. S., Jividen, K., Spencer, A., Dworak, N., Ni, L., Oostdyk, L. T., Chatterjee,M., Kuśmider, B., Reon, B., Parlak, M., Gorbunova, V., Abbas, T., Jeffery, E., Sher-man, N. E., and Paschal, B. M. (2017). Ubiquitin modification by the E3 Ligase/ADP-ribosyltransferase Dtx3L/Parp9. Molecular Cell, 66(4):503–516.e5.
Yang, H., Yang, T., Baur, J. A., Perez, E., Matsui, T., Carmona, J. J., Lamming, D. W.,Souza-Pinto, N. C., Bohr, V. A., Rosenzweig, A., de Cabo, R., Sauve, A. A., and Sinclair,D. A. (2007). Nutrient-sensitive mitochondrial NAD+ levels dictate cell survival. Cell,130(6):1095–1107.
61

4 Bibliography
Yang, Z. (2007). PAML 4: Phylogenetic analysis by maximum likelihood. Molecular Biologyand Evolution, 24(8):1586–1591.
Yang, Z. (2014). Molecular Evolution: A statistical approach. Oxford University Press.
Yi, J. S., Cox, M. A., and Zajac, A. J. (2010). Interleukin-21: A multifunctional regulator ofimmunity to infections. Microbes and Infection, 12(14-15):1111—-1119.
Yoon, H. S., Hackett, J. D., Ciniglia, C., Pinto, G., and Bhattacharya, D. (2004). A moleculartimeline for the origin of photosynthetic eukaryotes. Molecular Biology and Evolution,21(5):809–818.
Yu, M., Schreek, S., Cerni, C., Schamberger, C., Lesniewicz, K., Poreba, E., Vervoorts, J.,Walsemann, G., Grötzinger, J., Kremmer, E., Mehraein, Y., Mertsching, J., Kraft, R., Aus-ten, M., Lüscher-Firzlaff, J., and Lüscher, B. (2005). PARP-10, a novel Myc-interactingprotein with poly(ADP-ribose) polymerase activity, inhibits transformation. Oncogene,24(12):1982–1993.
Zhang, C., Zhai, Z., Tang, M., Cheng, Z., Li, T., Wang, H., and Zhu, W.-G. (2017). Quantita-tive proteome-based systematic identification of SIRT7 substrates. Proteomics, 17(13–14).
Zhang, D.-X., Zhang, J.-P., Hu, J.-Y., and Huang, Y.-S. (2016). The potential regulatory rolesof NAD(+) and its metabolism in autophagy. Metabolism: Clinical and Experimental,65(4):454–62.
Zhang, J., Wang, Y., Li, G., Yu, H., and Xie, X. (2014). Down-regulation of nicotinamide N-methyltransferase induces apoptosis in human breast cancer cells via the mitochondria-mediated pathway. PLoS ONE, 9(2).
Zhao, S., Xu, W., Jiang, W., Yu, W., Lin, Y., Zhang, T., Yao, J., Zhou, L., Zeng, Y., Li, H., Li, Y.,Shi, J., An,W., Hancock, S. M., He, F., Qin, L., Chin, J., Yang, P., Chen, X., Lei, Q., Xiong, Y.,and Guan, K.-L. (2010). Regulation of cellular metabolism by protein lysine acetylation.Science, 327(5968):1000–4.
Zhong, L., D’Urso, A., Toiber, D., Sebastian, C., Henry, R. E., Vadysirisack, D. D., Guimaraes,A., Marinelli, B., Wikstrom, J. D., Nir, T., Clish, C. B., Vaitheesvaran, B., Iliopoulos, O.,Kurland, I., Dor, Y., Weissleder, R., Shirihai, O. S., Ellisen, L. W., Espinosa, J. M., andMostoslavsky, R. (2010). The histone deacetylase Sirt6 regulates glucose homeostasisvia Hif1α. Cell, 140(2):280–293.
62

Part II
Publications


Author contributionsThe following authors contributed to the three papers included in this thesis (in alphabet-ical order).
Paper I Paper II Paper IIIConcept and idea TG KF IH, MZConducted research AA, MB, TG MB DH, MB, MN, TGContributed to research CC KFManuscript preparation AA, TG KF IH, MB, MZContributed to writing IH, MB IH, MB DH, MNFigure preparation AA, MB MB IH, MB
With my signature, I consent that the above listed articles where I am a co-author can bea part of the PhD thesis of the PhD candidate.
AA: Arina Afanasyeva CC: Christopher R. Cooney DH: Dorothée Houry
IH: Ines Heiland KF: Karsten Fischer MB: Mathias Bockwoldt
MN: Marc Niere MZ: Mathias Ziegler TG: Toni I. Gossmann

Paper I Afanasyeva, A., Bockwoldt, M., Cooney, C.R., Heiland, I. & Gossmann, T.I. (2018)
Human long intrinsically disordered protein regions are frequent targets of positive selection
Genome Research, 28(7), 975–982.
Available in Munin at https://hdl.handle.net/10037/14634.

Human long intrinsically disordered protein regionsare frequent targets of positive selection
Arina Afanasyeva,1,2,3,4,6 Mathias Bockwoldt,5,6 Christopher R. Cooney,1
Ines Heiland,5 and Toni I. Gossmann11Department of Animal and Plant Sciences, University of Sheffield, Sheffield S102TN, United Kingdom; 2Institute ofNanobiotechnologies, Peter the Great St. Petersburg Polytechnic University, Saint-Petersburg 195251, Russia; 3Petersburg NuclearPhysics Institute, B.P. Konstantinov NRC Kurchatov Institute, Gatchina, Leningrad District 188300, Russia; 4National Institutesof Biomedical Innovation, Health and Nutrition, Ibaraki City, Osaka 567-0085, Japan; 5Department of Arctic and Marine Biology,UiT The Arctic University of Norway, 9037 Tromsø, Norway
Intrinsically disordered regions occur frequently in proteins and are characterized by a lack of a well-defined three-dimen-
sional structure. Although these regions do not show a higher order of structural organization, they are known to be func-
tionally important. Disordered regions are rapidly evolving, largely attributed to relaxed purifying selection and an
increased role of genetic drift. It has also been suggested that positive selection might contribute to their rapid diversifica-
tion. However, for our own species, it is currently unknownwhether positive selection has played a role during the evolution
of these protein regions. Here, we address this question by investigating the evolutionary pattern of more than 6600 human
proteins with intrinsically disordered regions and their ordered counterparts. Our comparative approach with data from
more than 90 mammalian genomes uses a priori knowledge of disordered protein regions, and we show that this increases
the power to detect positive selection by an order of magnitude.We can confirm that human intrinsically disordered regions
evolve more rapidly, not only within humans but also across the entire mammalian phylogeny. They have, however, expe-
rienced substantial evolutionary constraint, hinting at their fundamental functional importance. We find compelling evi-
dence that disordered protein regions are frequent targets of positive selection and estimate that the relative rate of
adaptive substitutions differs fourfold between disordered and ordered protein regions in humans. Our results suggest
that disordered protein regions are important targets of genetic innovation and that the contribution of positive selection
in these regions is more pronounced than in other protein parts.
[Supplemental material is available for this article.]
There is substantial experimental evidence that proteins or proteinregions may be deprived of a specific three-dimensional structure(Daughdrill et al. 2005; Oldfield and Dunker 2014) and instead ex-ist as intrinsically disordered proteins or protein parts (IDPs). Thelack of a particular conformation may be an advantage wherestructural flexibility is required, for example for multifunctionalproteins or for functional flexibility and regulation (Tompa et al.2005; Oldfield et al. 2008; Hsu et al. 2013). In some cases, IDP re-gions can adopt a specific three-dimensional structure when envi-ronmental conditions change, for example, as entropic bristles(Santner et al. 2012), entropic springs (Smagghe et al. 2010), andentropic clocks (Zandany et al. 2015), or when binding to proteinpartners (Daughdrill et al. 1997). Experimental evidence suggeststhat real time state transition between ordered and disorderedstates can occur (Mohan et al. 2006), illustrating that protein struc-tures are not static arrangements, as they are generally perceived(Ahrens et al. 2017). Protein disorder may also provide a genome-wide mechanism of adaptation to environmental conditions andlifestyle; e.g., host-changingparasiteshaveahigher level of predict-ed disorder compared to obligate intra-cellular parasites and endo-symbionts (Pancsa and Tompa 2012). Other complex organismalroles for disordered regions have been suggested, such as tissue-
specific alternative splicing of disordered regions that may alterprotein functions and thus change protein–protein interactionnetworks by recruiting new interaction partners (Buljan et al.2013). These examples clearly demonstrate that IDPs are a hetero-geneous group of protein regions that increase the functional plas-ticity of proteins and the flexibility of intermolecular interactionsin the cell (Buljan et al. 2012; Mosca et al. 2012).
Due to the functional complexity of these protein regions,much research has been conducted to characterize IDPs andexplore the underlying evolutionary mechanisms (Brown et al.2002; Chen et al. 2006a,b; Bellay et al. 2011; Szalkowski andAnisimova 2011; Zea et al. 2013). The molecular rate at whichproteins evolve at the DNA level is an important quantity in evo-lutionary biology and population genetics to determine the selec-tive forces that have shaped protein composition and is generallydominated by selective constraint across many taxa (Gossmannet al. 2014). This is most prominently illustrated by the fact that,in protein coding regions, amino acid changing substitutions oc-cur much less frequently than synonymous changes, i.e., muta-tions that do not change the amino acid but the underlyingcodon. Consequently, the rate ratio of these two types of
6These authors contributed equally to this work.Corresponding author: [email protected] published online before print. Article, supplemental material, and publi-cation date are at http://www.genome.org/cgi/doi/10.1101/gr.232645.117.
© 2018 Afanasyeva et al. This article is distributed exclusively by Cold SpringHarbor Laboratory Press for the first six months after the full-issue publicationdate (see http://genome.cshlp.org/site/misc/terms.xhtml). After six months, itis available under a Creative Commons License (Attribution-NonCommercial4.0 International), as described at http://creativecommons.org/licenses/by-nc/4.0/.
Research
28:975–982 Published by Cold Spring Harbor Laboratory Press; ISSN 1088-9051/18; www.genome.org Genome Research 975www.genome.org
Cold Spring Harbor Laboratory Press on July 5, 2018 - Published by genome.cshlp.orgDownloaded from
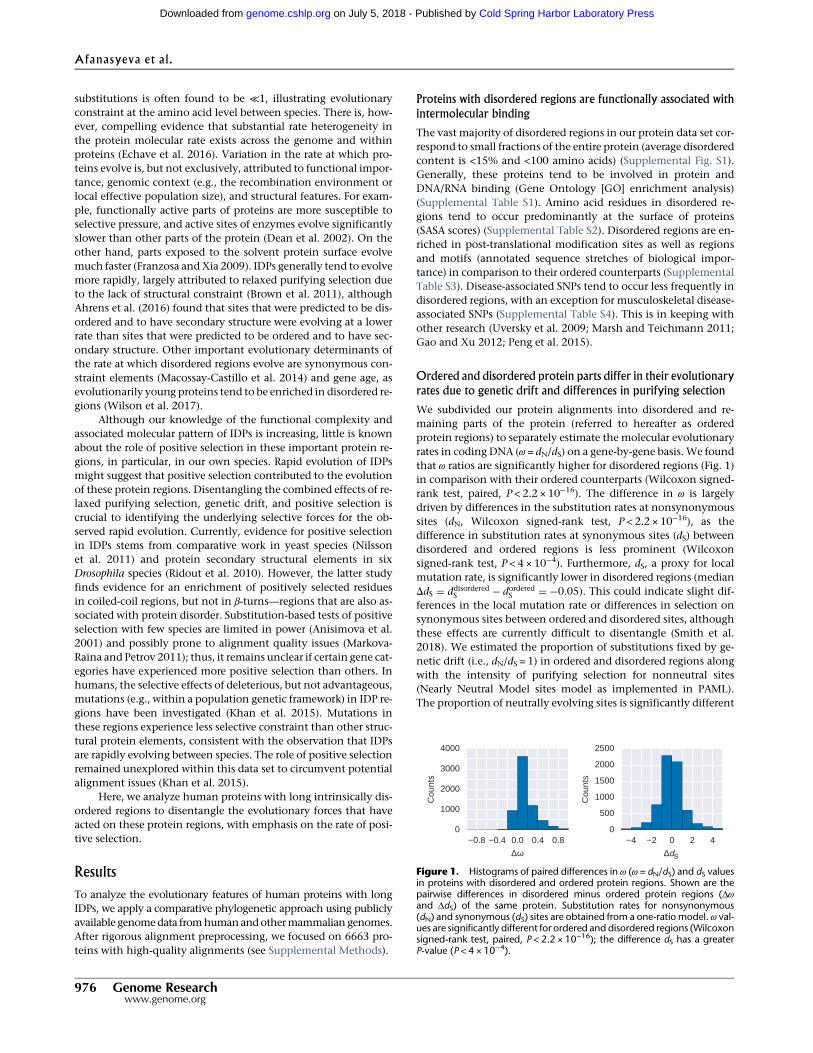
substitutions is often found to be ≪1, illustrating evolutionaryconstraint at the amino acid level between species. There is, how-ever, compelling evidence that substantial rate heterogeneity inthe protein molecular rate exists across the genome and withinproteins (Echave et al. 2016). Variation in the rate at which pro-teins evolve is, but not exclusively, attributed to functional impor-tance, genomic context (e.g., the recombination environment orlocal effective population size), and structural features. For exam-ple, functionally active parts of proteins are more susceptible toselective pressure, and active sites of enzymes evolve significantlyslower than other parts of the protein (Dean et al. 2002). On theother hand, parts exposed to the solvent protein surface evolvemuch faster (Franzosa andXia 2009). IDPs generally tend to evolvemore rapidly, largely attributed to relaxed purifying selection dueto the lack of structural constraint (Brown et al. 2011), althoughAhrens et al. (2016) found that sites that were predicted to be dis-ordered and to have secondary structure were evolving at a lowerrate than sites that were predicted to be ordered and to have sec-ondary structure. Other important evolutionary determinants ofthe rate at which disordered regions evolve are synonymous con-straint elements (Macossay-Castillo et al. 2014) and gene age, asevolutionarily young proteins tend to be enriched in disordered re-gions (Wilson et al. 2017).
Although our knowledge of the functional complexity andassociated molecular pattern of IDPs is increasing, little is knownabout the role of positive selection in these important protein re-gions, in particular, in our own species. Rapid evolution of IDPsmight suggest that positive selection contributed to the evolutionof these protein regions. Disentangling the combined effects of re-laxed purifying selection, genetic drift, and positive selection iscrucial to identifying the underlying selective forces for the ob-served rapid evolution. Currently, evidence for positive selectionin IDPs stems from comparative work in yeast species (Nilssonet al. 2011) and protein secondary structural elements in sixDrosophila species (Ridout et al. 2010). However, the latter studyfinds evidence for an enrichment of positively selected residuesin coiled-coil regions, but not in β-turns—regions that are also as-sociated with protein disorder. Substitution-based tests of positiveselection with few species are limited in power (Anisimova et al.2001) and possibly prone to alignment quality issues (Markova-Raina and Petrov 2011); thus, it remains unclear if certain gene cat-egories have experienced more positive selection than others. Inhumans, the selective effects of deleterious, but not advantageous,mutations (e.g., within a population genetic framework) in IDP re-gions have been investigated (Khan et al. 2015). Mutations inthese regions experience less selective constraint than other struc-tural protein elements, consistent with the observation that IDPsare rapidly evolving between species. The role of positive selectionremained unexplored within this data set to circumvent potentialalignment issues (Khan et al. 2015).
Here, we analyze human proteins with long intrinsically dis-ordered regions to disentangle the evolutionary forces that haveacted on these protein regions, with emphasis on the rate of posi-tive selection.
Results
To analyze the evolutionary features of human proteins with longIDPs, we apply a comparative phylogenetic approach using publiclyavailable genomedata fromhumanandothermammalian genomes.After rigorous alignment preprocessing, we focused on 6663 pro-teins with high-quality alignments (see Supplemental Methods).
Proteins with disordered regions are functionally associated with
intermolecular binding
The vast majority of disordered regions in our protein data set cor-respond to small fractions of the entire protein (average disorderedcontent is <15% and <100 amino acids) (Supplemental Fig. S1).Generally, these proteins tend to be involved in protein andDNA/RNA binding (Gene Ontology [GO] enrichment analysis)(Supplemental Table S1). Amino acid residues in disordered re-gions tend to occur predominantly at the surface of proteins(SASA scores) (Supplemental Table S2). Disordered regions are en-riched in post-translational modification sites as well as regionsand motifs (annotated sequence stretches of biological impor-tance) in comparison to their ordered counterparts (SupplementalTable S3). Disease-associated SNPs tend to occur less frequently indisordered regions, with an exception for musculoskeletal disease-associated SNPs (Supplemental Table S4). This is in keeping withother research (Uversky et al. 2009; Marsh and Teichmann 2011;Gao and Xu 2012; Peng et al. 2015).
Ordered and disordered protein parts differ in their evolutionary
rates due to genetic drift and differences in purifying selection
We subdivided our protein alignments into disordered and re-maining parts of the protein (referred to hereafter as orderedprotein regions) to separately estimate the molecular evolutionaryrates in coding DNA (ω = dN/dS) on a gene-by-gene basis.We foundthat ω ratios are significantly higher for disordered regions (Fig. 1)in comparison with their ordered counterparts (Wilcoxon signed-rank test, paired, P < 2.2 × 10⁻¹⁶). The difference in ω is largelydriven by differences in the substitution rates at nonsynonymoussites (dN, Wilcoxon signed-rank test, P < 2.2 × 10⁻¹⁶), as thedifference in substitution rates at synonymous sites (dS) betweendisordered and ordered regions is less prominent (Wilcoxonsigned-rank test, P < 4 × 10⁻⁴). Furthermore, dS, a proxy for localmutation rate, is significantly lower in disordered regions (medianDdS = ddisorderedS − dorderedS = −0.05). This could indicate slight dif-ferences in the local mutation rate or differences in selection onsynonymous sites between ordered and disordered sites, althoughthese effects are currently difficult to disentangle (Smith et al.2018). We estimated the proportion of substitutions fixed by ge-netic drift (i.e., dN/dS = 1) in ordered and disordered regions alongwith the intensity of purifying selection for nonneutral sites(Nearly Neutral Model sites model as implemented in PAML).The proportion of neutrally evolving sites is significantly different
Figure 1. Histograms of paired differences in ω (ω = dN/dS) and dS valuesin proteins with disordered and ordered protein regions. Shown are thepairwise differences in disordered minus ordered protein regions (Δωand ΔdS) of the same protein. Substitution rates for nonsynonymous(dN) and synonymous (dS) sites are obtained from a one-ratio model. ω val-ues are significantly different for ordered and disordered regions (Wilcoxonsigned-rank test, paired, P < 2.2 × 10⁻¹⁶); the difference dS has a greaterP-value (P < 4 × 10⁻⁴).
Afanasyeva et al.
976 Genome Researchwww.genome.org
Cold Spring Harbor Laboratory Press on July 5, 2018 - Published by genome.cshlp.orgDownloaded from

between ordered and disordered regions (Wilcoxon signed-ranktest, P < 2.2 × 10⁻¹⁶, with geneswith evidence for positive selectionremoved from the sample) (Fig. 2). We also found that ω for non-neutral sites is higher in disordered regions (median 0.078 com-pared to 0.041).
The role of positive selection is substantially more pronounced in
disordered regions
To investigate whether elevated ω ratios are additionally caused bythe effect of positive selection (e.g., a few sites for which dN/dS > 1),we conducted site-specific dN/dS analyses (Wong et al. 2004; Yanget al. 2005) using a gene-by-gene approach. First, we jointly ana-lyzed ordered and disordered regions and found that 363 proteins(5.4%) showedevidence for positive selectionbasedona likelihoodratio test (FDR = 0.1) (Table 1). Second, we conducted the sameanalysis separately for ordered and disordered regions. We foundevidenceofpositive selection in thedisordered regionsof377genesand in the ordered regions of 252 genes (significantly different,Fisher’s exact test [2 df], P < 0.001, FDR = 0.1) (Supplemental TableS5). There were 240 genes (64%) with evidence for positive selec-tion from the disordered set that were not identified as positivelyselected when the protein regions were jointly analyzed (in con-trast to ≈11% for the ordered region). Moreover, considering thatdisordered regions are generally shorter than theirordered counter-parts, this difference is likely to be an underestimate, as the powerto detect positive selection decreases with shorter protein length(Anisimova et al. 2001). We therefore repeated our analysis by us-ing the same number of sites for ordered and disordered regionsby down-sampling to the number of sites of the shorter region.Using this approach, we found a roughly 10-fold (38 versus 363genes) difference in the number of positively selected genes inordered regions compared to disordered regions (Fisher’s exacttest [2df],P≪ 0.001) (Table1).Wetestedwhetheralignment scoresbefore applying our alignment-processing pipeline are signifi-cantly different between the identified gene sets and find noevidence for that (Supplemental Fig. S2). Taken together, this illus-trates that positive selection has played an intensified role in disor-dered regions and suggests that an a priori distinction of disorderedsites substantially increases the power to detect adaptive processes.There is also no evidence that alignment quality issues have artifi-cially created a signature of positive selection.
The detected level of positive selection is likely to be an
underestimate
We investigated whether there is sufficient power and accuracy todetect positive selection for the estimated parameter range. For
this, we conducted extensive sequence evolution simulations forproteins with a signature of positive selection, as well as 250 ran-domly chosen proteins from the remaining set. On average,more than 90% of the simulated data sets for which we simulateda signature of positive selection were identified as such and lessthan 10%were significant when no positive selectionwas simulat-ed (Supplemental Fig. S3). We observed a slight increase in thedetection of positive selection in the simulated data sets for disor-dered regions where only the corresponding ordered region wasinitially identified as positively selected. As we do not generallysee this phenomenon for disordered regions, it suggests that, forthese proteins, the disordered region might be contributing tothe signal of positive selection. Possible reasons include a misclas-sification of ordered and disordered boundaries, heterogeneity ofthe lengths of ordered and disordered regions across species, andheterogeneity of positively selected sites within the disordered re-gions. As PAML does not consider gapped positions, we investigat-ed the impact of indels on our alignment-processing pipeline. Weadditionally simulated protein sequences composed of disorderedand ordered regions under varying indel rates, to simulate thealignment difficulties usually observed for disordered regions.Applying the site test to the processed alignments in comparisonto the true simulated alignment, we find that, with an increasingindel rate, the power to detect positive selection decreases (Supple-mental Fig. S4). The false positive rate stays low and remains on acomparable level when the test is applied on the true alignment.Taken together, these simulations suggest that our alignment pipe-line does not artificially create signatures of positive selection but,on the contrary, is rather conservative, and that the true rate ofpositive selection in disordered regions is likely to be even morepronounced than reported here.
Biological implications of disordered regions with positively
selected target sites
Wewere interested in the functional associations and interactionsof the proteins for which the corresponding genes showed evi-dence of positive selection. We performed a protein network anal-ysis using STRING (Szklarczyk et al. 2017) for protein products ofthe genes that were uniquely identified to have evolved under pos-itive selection in disordered and ordered regions (322 and 197genes, respectively). We find that protein interaction networksfor the two sets are significantly enriched in interactions but differdrastically in their layout (Supplemental Fig. S5). While the pro-teins from the ordered set show small-sized clusters with lessthan eight interaction partners, we find one large-size cluster con-necting more than 50 proteins from the disordered set that in-cludes important proteins such as breast cancer type 1
Figure 2. Estimates of sequence evolution in a nearly neutral model.Distributions of ω = dN/dS values (left panel) and the proportion of the neu-trally evolved sites (right panel) for ordered (blue), disordered (green), andordered and disordered protein regions jointly analyzed (orange).
Table 1. Number of genes with evidence of positive selection in or-dered, disordered, and joint estimates
Proteinregion
Evidence for positiveselection
No evidence for positiveselection
Ordered 252 (38) 6411 (6625)Disordered 377 (363) 6286 (6300)Joint 363 (363) 6300 (6300)
Number of genes with significant test of positive selection when down-sampled to the same length is given in brackets. Disordered regionsshow disproportionally more evidence of positive selection comparedto their ordered counterparts (FDR = 0.1, Fisher’s exact test [2 df],P < 0.001).
Selection in human intrinsic protein regions
Genome Research 977www.genome.org
Cold Spring Harbor Laboratory Press on July 5, 2018 - Published by genome.cshlp.orgDownloaded from

susceptibility protein BRCA1, the telomere binding protein TERF1,involved in telomere lengthhomeostasis, and theNAD-dependentde-acetylase SIRT1 that is an important drug target in aging re-search (Hubbard et al. 2013). Differences in maximum clustersize are also observed when differences in the protein numbersare accounted for (Supplemental Fig. S6). The interaction networkfrom the disordered gene set showed significant functional enrich-ment in RNA binding and nucleic acid binding, while the orderedgene set was associated with immune response and T-cell activa-tion (Supplemental Table S6). This suggests an important, and toour knowledge hitherto unattributed, role of positive selection ofdisordered regions in transcriptional and/or translational regula-tion andmay be driven by co-evolutionary mechanisms in regula-tory arms races. Rapid evolution of immune defense genes hasbeen reported in many taxa (Mondragón-Palomino et al. 2002;Viljakainen et al. 2009; Bonneaud et al. 2011; McTaggart et al.2012) and is often associated with adaptive immune response.
Molecular dynamics of positively selected target sites in IL21
As we applied a site-specific test of positive selection, it is possibleto specifically pinpoint amino acid residues that potentially haveevolved under positive selection. Unfortunately, three-dimension-al structural information for IDPs is difficult to obtain and, hence,substantially underrepresented in respective databases. A system-atic study of important residues in these regions on the three-di-mensional features is therefore very limited. Out of 7652 residuesin IDPs thatwe classified to be on the surface and, hence, accessibleto interaction partners (Supplemental Table S2), 83 residues(1.08%) show evidence for positive selection. In stark contrast,none of the residues identified to be on the surface in the orderedregions show evidence for positive selection, suggesting that thedisordered state, but not the ligand accessibility, lead to increasedmolecular rates. An exception suitable for a more detailed study ofthree-dimensional properties of positively selected sites in IDPs isoneof our candidate genes under positive selection, interleukin 21,a protein that plays a fundamental role in the innate and adap-tive immune responses (Yi et al. 2010; Ju et al. 2016). Based on apartly resolved NMR structure of the disordered region, we pin-pointed three residues under positive selection (Fig. 3A). This re-
gion has been shown to be a part of a helix C motif, which existsin both ordered and disordered states in different conformersand is involved in receptor binding (Bondensgaard et al. 2007).As disordered regions exist as ensembles of structures rather thanas a static snapshot, we conducted a molecular dynamic (MD)analysis by simulating molecular movements of the disordered re-gion based on the resolved NMR structure (PDB: 2OQP) for 200nanoseconds (nsec) in explicit water solvent (Fig. 3B). This allowsus to investigate the effect of the three identified residues on thestructural flexibility within this protein region (Rajasekaran et al.2011; Papaioannou et al. 2015). All three residues (S81, G85,R91) are located in a highly flexible region according to B-factorvalues, suggesting that these sites contribute to the structural flex-ibility in the disordered state (Radivojac et al. 2004). Comparingthese positions across species (Supplemental Fig. S7), we find atleast three different variant types at each site and with the excep-tion of Tarsius syrichta (I91), none of these variants is a protein or-der-promoting amino acid (Oldfield and Dunker 2014). The MDsimulation also reveals three neighboring residues of high flexibil-ity at positions 61–64 outside of the annotated disordered region(Fig. 3B). The initial study by Bondensgaard et al. (2007) reporteda segment fromposition 57 to 84 as regions of two interchangeableconformers (i.e., disordered region), adding to the notion that pre-cise boundaries of disordered regions are difficult to capture withdifferent methods.
The distribution of fitness effects differ between ordered
and disordered protein regions in humans
To get a better understandingof the role of genetic drift and the pu-rifying selective forces currently acting in IDP regions, we usedpolymorphism data from the 1000 Genomes Project (The 1000Genomes Project Consortium 2015). The rate ratio of nonsynony-mous to synonymous diversity (πN/πS) in coding regions can be re-garded as a rough indicator of the effectiveness of negativeselection on amino acid-changing mutations, with larger valuesindicating less effective purifying selection (Chen et al. 2017).Mean πN/πS is increased for disordered regions compared to theiror-dered counterparts (0.277 versus 0.17, Wilcoxon signed-rank test,P < 3.9 × 10⁻¹⁸) (Fig. 4A). We inferred the distribution of fitness ef-
fects (DFE) of new amino acid-changingmutations by applying a method thatuses the frequency distribution of muta-tions at nonsynonymous sites relative tosynonymous sites as neutral reference(Keightley and Eyre-Walker 2007). TheDFE in ordered and disordered regionsdiffers significantly, with roughly 23%of nonsynonymous mutations being ef-fectively neutral in disordered regionscompared to 12% for ordered regions. Incontrast, the proportion of mutationswith strong selective effects (i.e., Nes >100) is reduced for disordered regionsrelative to their ordered counterparts(48% versus 63%). Taken together, theseresults are in full agreementwith the sub-stitution rate analyses, hinting at a prom-inent role of genetic drift and reducedpurifying selection in disordered regions.When conducting a joint analysis of or-dered and disordered regions, results are
A B
Figure 3. Three-dimensional features of positively selected sites in the disordered region of humaninterleukin 21. (A) Cartoon of the NMR structure of human interleukin 21 (PDB Code: 2OQP) includingits disordered region indicating B-factor scores from themolecular dynamics analysis. Three residues havebeen identified as positively selected in a PAML branch-site test (Ser81, Gly85, and Arg91) in the disor-dered region. (B) Molecular dynamics analysis; shown are the B-factors of all residues. Here, B-factors re-flect the fluctuation of single amino acids (Cα atom) about their average positions during the MDsimulation. The predicted disordered region by MobiDB is indicated in green as well as the three identi-fied residues under positive selection (S81, G85, and R91).
Afanasyeva et al.
978 Genome Researchwww.genome.org
Cold Spring Harbor Laboratory Press on July 5, 2018 - Published by genome.cshlp.orgDownloaded from

very similar to ordered regions. Taking into account that themajor-ity of sites lie in ordered protein regions, indicating that the selec-tive effects in disordered regions are somewhat obscured by thevast number of mutations in the ordered protein parts.
Adaptive amino acid changes have substantially contributed
to the evolution of disordered protein regions in recent
human evolution
To infer the role of positive selection in IDP regions in recenthuman and ape evolution, we compared the ratio of nonsynony-mous to synonymous sites between intra-species polymorphismsand inter-species divergence (McDonald-Kreitman test [MK test])(McDonald and Kreitman 1991). This mathematical contrast canbe used to obtain the proportion of fixed substitutions that weredriven by positive selection (α) and the rate of adaptive substitu-
tions relative to the synonymous divergence (ωa) (Gossmannet al. 2010). Since the DFEs for ordered and disordered regions dif-fer (Fig. 4B), we applied a derivate of the MK test that corrects forthe effect of slightly deleterious mutations based on the DFE(Eyre-Walker and Keightley 2009).We find that disordered regionsshow a higher proportion of adaptive mutations (α = 17% versus11% for ordered regions) (Fig. 4C). Since there is strong evidencethat the proportion of effectively neutral nonsynonymous muta-tions and substitutions appear to be different (Figs. 2 and 4B) be-tween ordered and disordered regions, a contrast of ωa betweenthe two regions will reveal the contribution of positive selectionin absolute terms independent of fixation events of neutral andslightly deleterious mutations contributing to the nonsynony-mous divergence. We observe a significant difference in ωa values(≈fourfold, vdisordered
a = 0.043 versus vordereda = 0.0096) (Fig. 4C),
suggesting that the rate of adaptive substitutions relative to thesynonymous rate is elevated in disordered regions. As expected,we also find reduced rates of adaptive evolution when the MKtest is conducted jointly on ordered and disordered regions. Thisillustrates that the role of positive selection in IDP regions is diffi-cult to capture when not taken into account a priori.
Discussion
Here, we investigated the evolutionary pressures that may haveacted on proteins containing long IDP regions in humans. Our ap-proach differs fromprevious analyses of the evolutionary rate anal-ysis of these regions. First, in our comparative analysis, we usedsequence data from more than 90 species, many more speciesthan in any other previous study on this topic. In doing so, wewere able to exclude low-quality sequences by excluding sequenc-es of questionable alignability but still were able to conduct ourtest statistics with a sufficient number of orthologs in high-qualityalignments. Second, we accounted for the genomic context anddifferences in the amino acid composition of disordered regionsby conducting our test statistics separately for ordered and disor-dered regions of the same protein in a pairwise manner. Third, un-like previous approaches, we have combined inter-specific andintra-specific data for humans and other ape species to conduct aderivative of the McDonald-Kreitman test to investigate whetherpositive selection has played a role in the evolution of disorderedregions in the human lineage.
We show that the molecular evolutionary rates, as measuredby the nonsynonymous to synonymous rate ratio in coding re-gions, are elevated in disordered regions compared to their orderedcounterparts and identify threemain contributors for these elevat-ed rates: (1) relaxed purifying selection; (2) intensified geneticdrift; and (3) positive selection. This is in agreement with studiesfrom other taxa such as yeast species and Drosophila and suggestsgeneral features of the evolvability of IDP regions. The lack ofthree-dimensional constraint may explain the fast evolution ofthese protein regions. However, it has been shown that there areamino acid residues that maintain the intrinsic disorder and thatthese residues are under stronger evolutionary constraint than inordered regions (Ahrens et al. 2016). It is therefore important tonote that the vast majority of IDP regions experienced substantialpurifying selection during their evolution (Fig. 2), hinting at theirimportant functional role despite their relaxed structural featuresfor certain residues. The difference in the selective effects betweenordered and disordered regions may be attributed to a net shift ofstrongly deleterious to slightly deleterious and effectively neutralmutations (Fig. 4B). Hence, the selective effects on mutations in
A
B
C
Figure 4. Evidence for differences in the selective effects in disorderedand ordered protein regions in humans. (A) Nucleotide diversity at synon-ymous sites (πS, left panel) and the ratio of nucleotide diversity at nonsy-nonymous sites over synonymous sites (πN/πS, right panel) for ordered,disordered, and jointly obtained protein regions in humans. (B) The distri-bution of fitness effects of nonsynonymousmutations estimated separatelyfor ordered and disordered protein regions, as well as when jointly estimat-ed. Error bars represent the standard error. Nes denotes the effective pop-ulation size (Ne) scaled strength of selection (s). (C ) Estimates of the role ofpositive selection for the analyzed protein set. The proportion of nonsy-nonymous substitutions that can be attributed to positive selection (α)and the adaptive divergence relative to the synonymous divergence (ωa)estimated separately for ordered and disordered protein regions, as wellas when jointly estimated. All pairwise comparisons are significantly differ-ent (Wilcoxon signed-rank test, paired, P < 3 × 10⁻¹²).
Selection in human intrinsic protein regions
Genome Research 979www.genome.org
Cold Spring Harbor Laboratory Press on July 5, 2018 - Published by genome.cshlp.orgDownloaded from

IDP regions are more dependent on fluctuations of the effectivepopulation size (Charlesworth 2009)—which may explain rapidevolution and higher molecular diversification due to periodic ep-isodes of random genetic drift (Nabholz et al. 2013).
A major outcome of our study is that positive selection hasplayed a pronounced role in certain proteins with disordered re-gions across the entire mammalian tree, as we find evidence forpositive selection in 377 IDP regions. To our knowledge, this isthe first time that the increased role of positive selection in theseregions has been attributed in mammals. We show that there islimited power to detect adaptive processes if intrinsic features ofdisorder are not taken into account a priori. This may explainwhy the role of adaptive substitutions has not been emphasizedthus far. We also identify, based on an extended version of theMcDonald-Kreitman test that takes into account the distributionof fitness effects of newmutations, that there is a fourfold increasein the rate of adaptive substitutions relative to the rate of synony-mous substitutions (ωa) in intrinsically disordered regions. It is im-portant to note that ωa, but not α, should be used to compare theadaptive rates in these regions. If ordered and disordered regionswould experience the same amount of adaptive substitutions, wewould expect α to be lower in disordered regions; as there aremore neutral fixations, this reduces the relative proportion ofadaptive substitutions.
It has recently been suggested that younger proteins tend tobe enriched in disordered regions and over evolutionary time be-comemore ordered (Wilson et al. 2017). If the loss of intrinsic dis-order is potentially associated with a selective advantage (e.g., gainof protein domain function), then positive selection could be a ge-neral mechanism explaining the evolvability of these IDPs.However, it is difficult to determine the turnover of intrinsic disor-dered regions across various species from our data set and conse-quently whether our set of positively selected genes betweenspecies supports such a model of adaptive losses. Evidence for re-peated events of positive selection across the entire mammaliantree may suggest repeated functional diversification within themammalian lineage due to multiple independent losses of intrin-sic disorder. It is well possible that we underestimate the true roleof positive selection in IDP regions. Our estimates suggest thattheremight be up to a 10-fold difference in the amount of adaptivechanges between disordered and ordered protein parts when se-quence lengths are accounted for. This is due to technical limita-tions of the applied test statistic, with short sequence length andhigh quality alignments that are difficult to obtain for some IDPsdue to increased rate of fixed indels (Khan et al. 2015). Hence, dis-ordered residues in regions of ambiguous alignability are not in-cluded in this study and their evolutionary patterns remainunexplored. However, wewere able to elucidate the role of positiveselection in IDPs because we included structural information a pri-ori, and it is likely that our estimates of the amount of positive se-lection in these regions are conservative. Taken together, ourresults suggest that IDP regions are important targets of genetic in-novation and that the contribution of positive selection in theseregions is more pronounced than in other parts of proteins.
Methods
Protein annotations of disordered regions in human proteins and
multiple sequence alignments
We obtained information of long intrinsically disordered regionsfor human proteins from MobiDB v2.2 (Di Domenico et al.
2012). To conduct a phylogenetically based analysis, we per-formed multiple sequence alignments using a customized auto-mated pipeline (Supplemental Methods; Supplemental Fig. S8).As a phylogenetic framework, we used the near-complete spe-cies-level mammalian consensus tree assembled by Bininda-Emonds et al. (2007) and updated by Rolland et al. (2014) andpruned the complete tree to leave only those species correspond-ing to samples in our genomic data set (Supplemental Fig. S9).This resulted in 6663 human proteins with disordered regionsand their corresponding orthologs in other mammalian species.Details are described in the Supplemental Methods.
Phylogenetic models for site-specific analyses and site annotation
The ratio of nonsynonymous to synonymous substitutions (i.e.,ω = dN/dS) can be interpreted as ameasurement of selective pressurethat has acted during the evolution of a protein. Here, we use site-specific dN/dSmodels forwhichwe assume that there is variation ofselective pressures between different types of sites within a proteinbut not between species. Since these models are computationallyvery expensive, we randomly down-sampled the number of spe-cies in cases when there were too many (Supplemental Fig. S10).We conducted sequence simulations using the INDELible package(Fletcher and Yang 2009). Functional associations and structuraldata were obtained from UniProt and PDB Details, and based onthe relative solvent-accessible surface area (SASA), we predictedwhether a protein site is buried or more likely to be positionedat the surface of the protein. Details are described in the Supple-mental Methods.
Molecular dynamics analysis
Molecular dynamics simulations were performed using a standardprotocol for pmemd simulations included in the AMBER 14 soft-ware package (Salomon-Ferrer et al. 2013). A high-resolutionthree-dimensional structure of human interleukin 21 (IL21) re-solved by heteronuclear NMR spectroscopy (PDB code: 2OQP)was used (Bondensgaard et al. 2007).
Polymorphism statistics, DFE, and McDonald-Kreitman type test
of positive selection
We obtained coding gene information for 46 unrelated Yorubianindividuals from the 1000 Genomes Project (The 1000 GenomesProject Consortium 2015) and excluded genes on the X Chro-mosome as well as genes that could not clearly be assigned tothe respective MobiDB database entry. Divergence data for the re-spective gene was obtained by randomly obtaining the orthologfrom a closest related non-ape species we had in our between-spe-cies data set.We used DFE-alpha (Keightley and Eyre-Walker 2007;Eyre-Walker andKeightley 2009) to estimate the distribution of fit-ness effects of new nonsynonymous mutations (Eyre-Walker andKeightley 2007) along with the proportion of substitutions attrib-uted to positive selection and the relative rate of adaptive substitu-tions to synonymous divergence (ωa) (Gossmann et al. 2010) forordered and disordered regions as well as jointly for both together.Details are described in the Supplemental Methods.
Software availability
Customized scripts for the alignment processing pipeline are avail-able in Supplemental Material and at https://www.github.com/tonig-evo/3D_gaps.
Afanasyeva et al.
980 Genome Researchwww.genome.org
Cold Spring Harbor Laboratory Press on July 5, 2018 - Published by genome.cshlp.orgDownloaded from

Acknowledgments
We thank Tobias Warnecke for helpful comments on an earlierversion of thismanuscript, andwe also thank three anonymous re-viewers for comments that have helped to improve the qualityof this manuscript. The computations were partially performedon resources provided by UNINETT Sigma2–the National Infra-structure for High Performance Computing and Data Storage inNorway. Financial support for the work came from a FEBS Short-Term Fellowship to A.A., a UiT BFE mobility grant to M.B., and aLeverhulme Early Career Fellowship Grant (ECF-2015-453) andNatural Environment Research Council grant (NE/N013832/1) toT.I.G.
Author contributions: T.I.G. designed the study; A.A.,M.B., andT.I.G. conducted the research; C.R.C. contributed to the research;A.A. and T.I.G. wrote the draft of the manuscript; and all authorscontributed to editing of the manuscript.
References
The 1000Genomes Project Consortium. 2015. A global reference for humangenetic variation. Nature 526: 68–74.
Ahrens J, Dos Santos HG, Siltberg-Liberles J. 2016. The nuanced interplay ofintrinsic disorder and other structural properties driving protein evolu-tion. Mol Biol Evol 33: 2248–2256.
Ahrens JB, Nunez-Castilla J, Siltberg-Liberles J. 2017. Evolution of intrinsicdisorder in eukaryotic proteins. Cell Mol Life Sci 74: 3163–3174.
Anisimova M, Bielawski JP, Yang Z. 2001. Accuracy and power of the likeli-hood ratio test in detecting adaptive molecular evolution. Mol Biol Evol18: 1585–1592.
Bellay J, Han S, MichautM, Kim T, CostanzoM, Andrews BJ, Boone C, BaderGD, Myers CL, Kim PM. 2011. Bringing order to protein disorderthrough comparative genomics and genetic interactions. Genome Biol12: 1.
Bininda-Emonds ORP, Cardillo M, Jones KE, MacPhee RDE, Beck RMD,Grenyer R, Price SA, Vos RA, Gittleman JL, Purvis A. 2007. The delayedrise of present-day mammals. Nature 446: 507–512.
Bondensgaard K, Breinholt J, Madsen D, Omkvist DH, Kang L, Worsaae A,Becker P, Schiødt CB, Hjorth SA. 2007. The existence of multiple con-formers of interleukin-21 directs engineering of a superpotent analogue.J Biol Chem 282: 23326–23336.
Bonneaud C, Balenger SL, Russell AF, Zhang J, Hill GE, Edwards SV. 2011.Rapid evolution of disease resistance is accompanied by functionalchanges in gene expression in a wild bird. Proc Natl Acad Sci 108:7866–7871.
Brown CJ, Takayama S, Campen AM, Vise P, Marshall TW, Oldfield CJ,Williams CJ, Keith Dunker A. 2002. Evolutionary rate heterogeneity inproteins with long disordered regions. J Mol Evol 55: 104–110.
Brown CJ, Johnson AK, Dunker AK, Daughdrill GW. 2011. Evolution anddisorder. Curr Opin Struct Biol 21: 441–446.
Buljan M, Chalancon G, Eustermann S, Wagner GP, Fuxreiter M, BatemanA, Babu MM. 2012. Tissue-specific splicing of disordered segmentsthat embed binding motifs rewires protein interaction networks. MolCell 46: 871–883.
Buljan M, Chalancon G, Dunker AK, Bateman A, Balaji S, Fuxreiter M, BabuMM. 2013. Alternative splicing of intrinsically disordered regions andrewiring of protein interactions. Curr Opin Struct Biol 23: 443–450.
Charlesworth B. 2009. Fundamental concepts in genetics: effective popula-tion size and patterns of molecular evolution and variation. Nat RevGenet 10: 195–205.
Chen JW, Romero P, Uversky VN, Dunker AK. 2006a. Conservation of in-trinsic disorder in protein domains and families: I. A database of con-served predicted disordered regions. J Proteome Res 5: 879–887.
Chen JW, Romero P, Uversky VN, Dunker AK. 2006b. Conservation of in-trinsic disorder in protein domains and families: II. Functions of con-served disorder. J Proteome Res 5: 888–898.
Chen J, Glémin S, LascouxM. 2017. Genetic diversity and the efficacy of pu-rifying selection across plant and animal species. Mol Biol Evol 34:1417–1428.
Daughdrill GW, ChadseyMS, Karlinsey JE, Hughes KT, Dahlquist FW. 1997.The C-terminal half of the anti-σ factor, Flgm, becomes structured whenbound to its target, σ 28. Nat Struct Biol 4: 285–291.
Daughdrill GW, Pielak GJ, Uversky VN, Cortese MS, Dunker AK. 2005.Natively disordered proteins. In Protein folding handbook (ed. BuchnerJ, Kiefhaber T), pp. 275–357. Wiley, Hoboken, NJ.
Dean AM, Neuhauser C, Grenier E, Golding GB. 2002. The pattern of aminoacid replacements in α/β-barrels. Mol Biol Evol 19: 1846–1864.
Di Domenico T, Walsh I, Martin AJ, Tosatto SC. 2012. MobiDB: a compre-hensive database of intrinsic protein disorder annotations. Bioinfor-matics 28: 2080–2081.
Echave J, Spielman SJ,Wilke CO. 2016. Causes of evolutionary rate variationamong protein sites. Nat Rev Genet 17: 109–121.
Eyre-Walker A, Keightley PD. 2007. The distribution of fitness effects of newmutations. Nat Rev Genet 8: 610–618.
Eyre-Walker A, Keightley PD. 2009. Estimating the rate of adaptive molecu-lar evolution in the presence of slightly deleterious mutations and pop-ulation size change. Mol Biol Evol 26: 2097–2108.
Fletcher W, Yang Z. 2009. INDELible: a flexible simulator of biological se-quence evolution. Mol Biol Evol 26: 1879–1888.
Franzosa EA, Xia Y. 2009. Structural determinants of protein evolution arecontext-sensitive at the residue level. Mol Biol Evol 26: 2387–2395.
Gao J, Xu D. 2012. Correlation between posttranslational modification andintrinsic disorder in protein. Pac Symp Biocomput 2012: 94–103.
Gossmann TI, Song B-H, Windsor AJ, Mitchell-Olds T, Dixon CJ, KapralovMV, FilatovDA, Eyre-Walker A. 2010. Genomewide analyses reveal littleevidence for adaptive evolution in many plant species.Mol Biol Evol 27:1822–1832.
Gossmann TI, Santure AW, Sheldon BC, Slate J, Zeng K. 2014. Highly vari-able recombinational landscape modulates efficacy of natural selectionin birds. Genome Biol Evol 6: 2061–2075.
Hsu W-L, Oldfield CJ, Xue B, Meng J, Huang F, Romero P, Uversky VN,Dunker AK. 2013. Exploring the binding diversity of intrinsically disor-dered proteins involved in one-to-many binding. Protein Sci 22:258–273.
Hubbard BP, Gomes AP, Dai H, Li J, Case AW, Considine T, Riera TV, Lee JE,E SY, Lamming DW, et al. 2013. Evidence for a common mechanism ofSIRT1 regulation by allosteric activators. Science 339: 1216–1219.
Ju B, Li D, Ji X, Liu J, Peng H, Wang S, Liu Y, Hao Y, Yee C, Liang H, et al.2016. Interleukin-21 administration leads to enhanced antigen-specificT cell responses and natural killer cells in HIV-1 vaccinated mice. CellImmunol 303: 55–65.
Keightley PD, Eyre-Walker A. 2007. Joint inference of the distribution of fit-ness effects of deleterious mutations and population demography basedon nucleotide polymorphism frequencies. Genetics 177: 2251–2261.
Khan T, Douglas GM, Patel P, Nguyen Ba AN, Moses AM. 2015.Polymorphism analysis reveals reduced negative selection and elevatedrate of insertions and deletions in intrinsically disordered protein re-gions. Genome Biol Evol 7: 1815–1826.
Macossay-Castillo M, Kosol S, Tompa P, Pancsa R. 2014. Synonymous con-straint elements showa tendency to encode intrinsically disordered pro-tein segments. PLoS Comput Biol 10: e1003607.
Markova-Raina P, PetrovD. 2011.High sensitivity to aligner and high rate offalse positives in the estimates of positive selection in the 12 Drosophilagenomes. Genome Res 21: 863–874.
Marsh JA, Teichmann SA. 2011. Relative solvent accessible surface area pre-dicts protein conformational changes upon binding. Structure 19:859–867.
McDonald JH, KreitmanM. 1991. Adaptive protein evolution at the Adh lo-cus in Drosophila. Nature 351: 652–654.
McTaggart SJ, Obbard DJ, ConlonC, Little TJ. 2012. Immune genes undergomore adaptive evolution than non-immune system genes in Daphniapulex. BMC Evol Biol 12: 63.
Mohan A, Oldfield CJ, Radivojac P, Vacic V, Cortese MS, Dunker AK,Uversky VN. 2006. Analysis of molecular recognition features(MoRFs). J Mol Biol 362: 1043–1059.
Mondragón-Palomino M, Meyers BC, Michelmore RW, Gaut BS. 2002.Patterns of positive selection in the complete NBS-LRR gene family ofArabidopsis thaliana. Genome Res 12: 1305–1315.
Mosca R, Pache RA, Aloy P. 2012. The role of structural disorder in the rewir-ing of protein interactions through evolution. Mol Cell Proteomics 11:M111.014969.
Nabholz B, Uwimana N, Lartillot N. 2013. Reconstructing the phylogenetichistory of long-term effective population size and life-history traits us-ing patterns of amino acid replacement in mitochondrial genomes ofmammals and birds. Genome Biol Evol 5: 1273–1290.
Nilsson J, Grahn M, Wright APH. 2011. Proteome-wide evidence for en-hanced positive Darwinian selection within intrinsically disordered re-gions in proteins. Genome Biol 12: R65.
Oldfield CJ, Dunker AK. 2014. Intrinsically disordered proteins and intrin-sically disordered protein regions. Annu Rev Biochem 83: 553–584.
Oldfield CJ, Meng J, Yang JY, Yang MQ, Uversky VN, Dunker AK. 2008.Flexible nets: disorder and induced fit in the associations of p53 and14-3-3 with their partners. BMC Genomics 9: S1.
Pancsa R, Tompa P. 2012. Structural disorder in eukaryotes. PLoS One 7:e34687.
Selection in human intrinsic protein regions
Genome Research 981www.genome.org
Cold Spring Harbor Laboratory Press on July 5, 2018 - Published by genome.cshlp.orgDownloaded from

Papaioannou A, Kuyucak S, Kuncic Z. 2015. Molecular dynamics simula-tions of insulin: elucidating the conformational changes that enableits binding. PLoS One 10: e0144058.
Peng Z, Yan J, Fan X, Mizianty MJ, Xue B, Wang K, Hu G, Uversky VN,Kurgan L. 2015. Exceptionally abundant exceptions: comprehensivecharacterization of intrinsic disorder in all domains of life. Cell MolLife Sci 72: 137–151.
Radivojac P, Obradovic Z, Smith DK, Zhu G, Vucetic S, Brown CJ, LawsonJD, Dunker AK. 2004. Protein flexibility and intrinsic disorder. ProteinSci 13: 71–80.
Rajasekaran M, Abirami S, Chen C. 2011. Effects of single nucleotide poly-morphisms on human N-acetyltransferase 2 structure and dynamics bymolecular dynamics simulation. PLoS One 6: e25801.
Ridout KE, Dixon CJ, Filatov DA. 2010. Positive selection differs betweenprotein secondary structure elements in Drosophila. Genome Biol Evol2: 166–179.
Rolland J, Condamine FL, Jiguet F, Morlon H. 2014. Faster speciation andreduced extinction in the tropics contribute to the mammalian latitudi-nal diversity gradient. PLoS Biol 12: e1001775.
Salomon-Ferrer R, Case DA,Walker RC. 2013. An overview of the amber bio-molecular simulation package. Wiley Interdiscip Rev Comput Mol Sci 3:198–210.
Santner AA, Croy CH, Vasanwala FH, Uversky VN, Van Y-YJ, Dunker AK.2012. Sweeping away protein aggregation with entropic bristles:Intrinsically disordered protein fusions enhance soluble expression.Biochemistry 51: 7250–7262.
Smagghe BJ, Huang P-S, Ban Y-EA, Baker D, Springer TA. 2010. Modulationof integrin activation by an entropic spring in the β-knee. J Biol Chem285: 32954–32966.
Smith TCA, Arndt PF, Eyre-Walker A. 2018. Large scale variation in the rateof germ-line de novomutation, base composition, divergence and diver-sity in humans. PLoS Genet 14: e1007254.
Szalkowski AM, AnisimovaM. 2011. Markovmodels of amino acid substitu-tion to study proteins with intrinsically disordered regions. PLoS One 6:e20488.
Szklarczyk D,Morris JH, CookH, KuhnM,Wyder S, SimonovicM, Santos A,Doncheva NT, Roth A, Bork P, et al. 2017. The string database in 2017:quality-controlled protein–protein association networks, made broadlyaccessible. Nucleic Acids Res 45: D362–D368.
Tompa P, Szász C, Buday L. 2005. Structural disorder throws new light onmoonlighting. Trends Biochem Sci 30: 484–489.
Uversky VN, Oldfield CJ, Midic U, Xie H, Xue B, Vucetic S, Iakoucheva LM,Obradovic Z, Dunker AK. 2009. Unfoldomics of human diseases: linkingprotein intrinsic disorder with diseases. BMC Genomics 10: S7.
Viljakainen L, Evans JD, Hasselmann M, Rueppell O, Tingek S, Pamilo P.2009. Rapid evolution of immune proteins in social insects. Mol BiolEvol 26: 1791–1801.
Wilson BA, Foy SG, Neme R, Masel J. 2017. Young genes are highly disor-dered as predicted by the preadaptation hypothesis of de novo genebirth. Nat Ecol Evol 1: 0146-146.
Wong WSW, Yang Z, Goldman N, Nielsen R. 2004. Accuracy and power ofstatistical methods for detecting adaptive evolution in protein codingsequences and for identifying positively selected sites. Genetics 168:1041–1051.
Yang Z, Wong WSW, Nielsen R. 2005. Bayes empirical Bayes inference ofamino acid sites under positive selection. Mol Biol Evol 22: 1107–1118.
Yi JS, CoxMA, Zajac AJ. 2010. Interleukin-21: amultifunctional regulator ofimmunity to infections. Microbes Infect 12: 1111–1119.
Zandany N, Lewin L, Nirenberg V, Orr I, Yifrach O. 2015. Entropic clocks inthe service of electrical signaling: ‘ball and chain’ mechanisms for ionchannel inactivation and clustering. FEBS Lett 589: 2441–2447.
Zea DJ, Monzon AM, Fornasari MS, Marino-Buslje C, Parisi G. 2013. Proteinconformational diversity correlates with evolutionary rate.Mol Biol Evol30: 1500–1503.
Received November 21, 2017; accepted in revised form June 1, 2018.
Afanasyeva et al.
982 Genome Researchwww.genome.org
Cold Spring Harbor Laboratory Press on July 5, 2018 - Published by genome.cshlp.orgDownloaded from

Supplemental Material
Supplemental Methods 2Protein annotations of disordered regions in human proteins . . . . . . . . . . . . . . . . 2Multiple sequence alignments . . . . . . . . . . . . . . . . . . . . . . . . . . . . . . . . . . 2Phylogenetic framework . . . . . . . . . . . . . . . . . . . . . . . . . . . . . . . . . . . . . 2Alignment pipeline details . . . . . . . . . . . . . . . . . . . . . . . . . . . . . . . . . . . . 3Phylogenetic models for site-specific analyses . . . . . . . . . . . . . . . . . . . . . . . . 4Sequence evolution simulation studies . . . . . . . . . . . . . . . . . . . . . . . . . . . . . 5Functional association from public databases (UniProt, NCBI SNP and PDB) . . . . . . . 6Structural data and site localization determination . . . . . . . . . . . . . . . . . . . . . . 6Molecular dynamics analysis . . . . . . . . . . . . . . . . . . . . . . . . . . . . . . . . . . 6Polymorphism statistics, DFE and McDonald-Kreitman type test of positive selection . . . 7Statistical and GO enrichment analysis . . . . . . . . . . . . . . . . . . . . . . . . . . . . 7
Supplemental Figures 8Supplemental Figure S1 . . . . . . . . . . . . . . . . . . . . . . . . . . . . . . . . . . . . . 8Supplemental Figure S2 . . . . . . . . . . . . . . . . . . . . . . . . . . . . . . . . . . . . . 9Supplemental Figure S3 . . . . . . . . . . . . . . . . . . . . . . . . . . . . . . . . . . . . . 10Supplemental Figure S4 . . . . . . . . . . . . . . . . . . . . . . . . . . . . . . . . . . . . . 11Supplemental Figure S5 . . . . . . . . . . . . . . . . . . . . . . . . . . . . . . . . . . . . . 12Supplemental Figure S6 . . . . . . . . . . . . . . . . . . . . . . . . . . . . . . . . . . . . . 13Supplemental Figure S7 . . . . . . . . . . . . . . . . . . . . . . . . . . . . . . . . . . . . . 14Supplemental Figure S8 . . . . . . . . . . . . . . . . . . . . . . . . . . . . . . . . . . . . . 15Supplemental Figure S9 . . . . . . . . . . . . . . . . . . . . . . . . . . . . . . . . . . . . . 16Supplemental Figure S10 . . . . . . . . . . . . . . . . . . . . . . . . . . . . . . . . . . . . 17
Supporting Tables 18Supplementary Table S1 . . . . . . . . . . . . . . . . . . . . . . . . . . . . . . . . . . . . . 18Supplementary Table S2 . . . . . . . . . . . . . . . . . . . . . . . . . . . . . . . . . . . . . 19Supplementary Table S3 . . . . . . . . . . . . . . . . . . . . . . . . . . . . . . . . . . . . . 20Supplementary Table S4 . . . . . . . . . . . . . . . . . . . . . . . . . . . . . . . . . . . . . 21Supplementary Table S5 . . . . . . . . . . . . . . . . . . . . . . . . . . . . . . . . . . . . . 22Supplementary Table S6 . . . . . . . . . . . . . . . . . . . . . . . . . . . . . . . . . . . . . 23
Supplemental References 24
1

Supplemental Methods
Protein annotations of disordered regions in human proteins
We obtained information of long intrinsically disordered regions for human proteins from MobiDBv2.2 (Di Domenico et al. 2012), a database where such regions have been classified based ona consensus approach using ten different disordered protein region predictors. These includestructural information from crystallographic data (PDB, Protein Data Bank) (Berman et al. 2000),experimental data from the disordered protein database (DisProt database (Sickmeier et al. 2007)),as well as bioinformatic approaches such as ESpritz (Walsh et al. 2012), DisEMBL (Linding etal. 2003a), IUPred (Dosztanyi et al. 2005), GlobPlot (Linding et al. 2003b), VSL2 (Vucetic et al.2003) and RONN (Yang et al. 2005). In brief, the detection of long disordered regions is optimizedin MobiDB using an agreement factor ≥ 75% across predictors and a regular expression on longregions with more than 20 consecutive amino acids (Di Domenico et al. 2012). Currently MobiDBcontains 80,370,243 protein entries (release 2.2.2014.07 from 25/09/2014) and we restricted ouranalysis to human proteins (134,897 entries), focusing on the longest splicing variants. Ultimately,after filtering out entries containing only short disordered regions and shorter splicing variants,we obtained a dataset of 8,310 protein entries with disordered region annotation that was furtherprocessed to create high-quality alignments.
Multiple sequence alignments
To conduct a phylogenetically-based analysis we constructed multiple sequence alignments using acustomized automated pipeline. First, we obtained orthologous genes for each human protein usingthe NCBI RefSeq database (O’Leary et al. 2016) that contains annotated genome informationfor more than 90 mammalian genomes by pairwise best BLAST hits with the human and mousegenomes - two of the best annotated mammalian genomes to date and HGNC identifiers (Gray etal. 2015) of all identified proteins as annotated in RefSeq. We then prepared each orthologousgene set separately by including sequence and annotation information from MobiDB to be ableto identify disordered regions after alignment processing. In brief, we aligned protein sequencesusing MSAProbs (Liu et al. 2010), filtered out species with poor or little sequence information, toomany insertions or deletions (indels) or that showed evidence of extremely high rates of evolution(as measured by dN/dS in a pairwise comparison with the human sequence) indicative of wrongorthologous assignment.
Phylogenetic framework
As a phylogenetic framework for PAML, we used the near-complete species-level mammalianconsensus tree assembled by Bininda-Emonds et al. (2007) and updated by Rolland et al. (2014).To extract a phylogeny connecting the species in our study, we pruned the complete tree to leaveonly those species corresponding to samples in our genomic dataset.
2

Alignment pipeline details
To prepare input files for the phylogenetic analysis we developed an automated pipeline (Supple-mental Fig S8) that includes multiple alignments, species filtering, re-alignment, and removingsequence positions of poor alignment quality. This pipeline steps are outlined below and cus-tomised scripts for the alignment processing pipeline are available as Supplemental Code and at(https://www.github.com/tonig-evo/3D_gaps).
Masking approach for site annotation information
To be able to restore the initial information of the disordered sites from MobiDB after all thesefiltering steps we used a custom method of site annotation. Based on the site types of the Homosapiens protein sequence in MobiDB we constructed a corresponding artificial protein sequencewith Phenylalanine (F) corresponding to the ordered sites and Lysin (K) corresponding to thedisordered sites. The corresponding coding cDNA sequence was assigned accordingly (AAAindicates the codon for an ordered site and TTT for a disordered site). This annotation is mappedto the alignment based on the human sequence from MobiDB and contains positional informationand is removed after alignment preparation.
Included proteins from MobiDB
First, we downloaded the MobiDB database data for all Homo sapiens proteins based on theirUniProt identifiers. This data contains the protein sequence and general annotation information ofthe protein, such as name, sequence length, structural data availability (PDB codes) and locationinformation of disordered regions. We prepared an initial set of files for which (I) the fasta formatedfile in MobiDB contained information of long disordered region(s). (II) Files with homologousproteins from mammalian species for each of MobiDB entry were available and constructed (III) aphylogenetic tree for all the mammalian species in newick format derived from the large mammalianphylogeny as described above.
Merging MobiDB entries with homologous sequences and filtering steps
The first step of the alignment preparation procedure was to merge the MobiDB database entrywith the corresponding homologous sequences in RefSeq. For this we aligned the set of homologstogether with the MobiDB sequence using MSAProbs v0.9.7 (Liu et al. 2010) with standardparameters and created a custom site type annotation for proteins and their corresponding cDNAsequences based on the annotation approach as described above. Some of the homologousprotein sequences may affect alignment quality since they may contain large sequence insertionsor deletions or show a low proportion of truly homologous positions to the human sequence.Furthermore, some of the sequences in other species may be lacking or contain little homologouspositions of human long disordered regions, such sequences are not of interest for our analysis,so we conducted sequence filtration based on several statistics: We calculated the proportion ofhomologous positions relative to the human sequence for each species, the proportion of siteshomologous to the human disordered sites and the proportion of the human sequence that willremain after removing gapped positions and stop codons. We also used similar statistics fordisordered sites only. We defined an 80% threshold to filter sequences. For this we excludedsequences one by one starting from the sequence with the lowest number of homologous sitesand recalculated the statistics until the sequences in the alignment covered more than 80% ofsites for each of the three statistics. After this filtering procedure we performed a check for longinsertions in homologous sequences: if more than 20% of sites in the sequence did not have
3

homologous sites in the human sequence we excluded the sequence from further analysis. Afterapplying these filering procedures, we performed a second alignment with MSAProbs (if some ofthe homologous sequences were excluded during filtering) and annotation procedure. We alsochecked for mismatches between the human Refseq sequence and the MobiDB sequence: if suchmismatches occurred, we placed gaps in the mismatched sites. After these procedure we obtainedaligned protein sequences and the corresponding (unaligned) cDNA sequences. We used PAL2NAL(Suyama et al. 2006) to retrieve the corresponding cDNA alignment from the protein alignment.Due to our customised annotation, we could easily retrieve the whole alignment or alignnments forordered and disordered regions separately to conduct a separate analysis (Supplemental Fig S8).
Positional information through site masking and local realignment
After manual inspection we decided to additionally quality-check the resulting alignments usingZORRO (Wu et al. 2012) and Gblocks v0.91b (Talavera and Castresana 2007) to identify alignmentcolumns of poor alignment quality. These poorly aligned columns were subsequently excluded fromthe analysis, i.e. sites with a ZORRO score of less than 9 or sites outside of the identified blocks inGblocks using parameters -t=p -k=y -n=y -v=32000 -p=t. We then re-aligned the orthologous setsfor the disordered regions with MUSCLE (Edgar 2004) and removed gene sets from the analysis forwhich the MUSCLE alignment disagreed with the second MSAProbs alignment. We also estimatedpairwise substitution rates in a codon model for the disordered regions, and excluded species forwhich the median substitution rate exceeded two, a signature for saturation and hence potentialmisalignment. Due to these approaches, our method is more conservative regarding the alignmentquality of the disordered regions in comparison to the ordered regions. This resulted in 6,663human proteins with disordered regions and their corresponding orthologs in other mammalianspecies. These files were used to generate input files with PAL2NAL to conduct codon-basedsubstitution rate analyses with PAML version 4.9a (Yang 2007).
Phylogenetic models for site-specific analyses
Under the assumption that synonymous mutations evolve neutrally the evolutionary rate of a proteincan be expressed as the ratio of non-synonymous to synonymous substitutions (i.e. ω = dN/dS).This ratio can be interpreted as a measurement of selective pressure that has acted duringthe evolution of a protein, with ω values <1, =1, and >1 indicating purifying selection, neutralevolution, and diversifying selection, respectively. Hence this measure may be used to inferpotential function(s) of proteins or protein domains.
In our analysis, we used site-specific dN/dS models (model M1a, nearly neutral model, and modelM2a, direct test for positive selection) for which we assume that there is variation of selectivepressures between different types of sites within a protein but not between species. Differencesbetween models were assessed with a likelihood ratio test (LRT) assuming that twice the loglikelihood difference is approximately χ2 distributed with the respective degrees of freedom asindicated in the PAML manual. Although we cannot exclude the possibility of species-specificfunctions of disordered regions, we assume this is rather an exception. Additionally, as we excludedgenes that show extreme rates of evolution for specific species, it is likely that most of the caseswhere this assumption is violated have been already excluded during file preparation. As for thecodon-based analysis pipeline, we prepared three different alignment sets:
1. Joint analysis: Gene sets contain all sites (i.e. no prior information of site types was used)2. Separate analysis: Gene sets contains only sites in disordered regions
4

3. Separate analysis: Gene sets contain only sites in ordered regions (i.e. non-disorderedregions)
These models allow us to get more precise information about the specificity of evolutionary pres-sures that disordered protein regions have experienced and allow us to conduct comparativeanalyses between ordered and disordered parts of proteins, and by that controlling for the genomiccontext. Since these models are computationally very expensive, we had to compromise betweencomputational time and the number of included species. We therefore randomly downsampled thenumber of species in cases when there were too many (threshold of 30 species). We found thatdownsampling is reasonable if the number of species is not too low. The large scale phylogenetictree was pruned with the nw_prune module from the Newick Utilities tools for the processing ofphylogenetic trees (http://cegg.unige.ch/newick_utils (Junier and Zdobnov 2010)) and then unrootedresulted trees with unroot() procedure from the Ape library in R package (http://ape-package.ird.fr/).
Sequence evolution simulation studies
We conducted sequence simulations using the Indelible package (Fletcher and Yang 2009), anextension of the evolver program package included in PAML. Indel-free simulations were conductedusing parameter estimates obtained from the two separate codeml site analyses for ordered anddisordered regions. Using these estimates we generated sets of 100 alignments for each proteinby simultaneously simulating disordered and ordered protein regions in a partitioned model withIndelible. For computational reasons we focused on proteins with evidence for positive selection aswell as 250 randomly chosen proteins from the remaining protein set. We determined the powerand accuracy by conducting the same separate site analysis on the simulated sequences, split intoordered and disordered regions and counted how often LRTs were significant for each region. Weexpect that the proportion of significantly rejected site tests for genes initially identified to be underpositive selection to be high, while the proportion of significant LRTs should be low when there wasno positive selection inferred initially.
To determine how our alignment-processing pipeline performs, we applied it to simulated alignmentswith different indel rates for the disordered regions. For this, we constructed an artificial protein witha disordered region of 250 amino acids, flanked by ordered regions of 250 amino acids on eachside. As insertions and deletions may produce shorter and less accurate alignments, and as PAMLwas run to ignore sites with gaps, a proportion of the remaining codons after gap removal might beincorrectly aligned and could generate false positive or negative results. We hence constructed 100alignments with varying indel rates (equal rates for insertions and deletions with the indel rate being1×, 5× and 10× relative to the ordered region) with and without positive selection. Except for theindel rate, we used the parameter estimates and tree topology from SIRT1 (a protein with similarlength) and simulated either positive selection or neutral evolution for around 5% of the disorderedsites that were initially estimated to be positively selected in SIRT1. We assumed a Lavalettedistribution (Fletcher and Yang 2009) for indels with a maximum indel size of 50 and an a parameterof 2.0 which is within the range of generally observed values assuming this distribution (Gossmannand Schmid 2011). We applied the codeml site test separately for ordered and disordered regionsand compared our processed alignments with the true alignments generated with Indelible.
5

Functional association from public databases (UniProt, NCBI SNP and PDB)
We collected information about functional sites annotation from the PDB database as well as fromthe UniProt database (regions and motifs - structural or binding, PTMs - sites of post-translationalmodifications and other functional or binding sites) to combine the results of our phylogeneticanalysis with a potential functional classification of proteins containing disordered protein regions.UniProt contains data for almost all of the protein entries used in this analysis. We also obtaineddata of potential disease-related single-nucleotide polymorphism (SNP) positions in humans(http://www.uniprot.org/docs/humsavar.txt).
Structural data and site localization determination
As expected, PDB data was available for only 2,589 of the proteins in our dataset and only asmall fraction of these had functional or binding site annotation. Although the vast majority of longdisordered regions lack three-dimensional information, for a limited number of sequences thereare structural information for a part or even for a whole disordered protein region available. Forexample, these data could be obtained by NMR or by a combination of several methods, or thedisordered regions may be obtained in a structural conformation when bound to binding partners(Tan et al. 2009).
To determine the localization of long disordered regions in protein structures we combined ouranalysis with structural data from the PDB database. Based on the relative solvent-accessiblesurface area (SASA) it is possible to predict whether a protein site is buried or more likely to bepositioned at the surface of the protein. Since amino acids considerably differ in size, an absolutemeasure of SASA would be difficult to compare in sense of the solvent accessibility, thereforeshould SASA values be normalized. The relative SASA represents the ratio of the surface area of aresidue accessible to a solvent to its standard accessibilities in an unfolded state (calculated in theextended Gly-X-Gly tripeptide for all amino acid residue types) (Duarte et al. 2012). To calculate therelative SASA (rSASA) score we used ICM-Pro (http://www.molsoft.com/icm_pro.html), a programpackage for molecular modelling, assuming a standard water probe radius of 1.4 Åand the Shrakeand Rupley algorithm (Shrake and Rupley 1973).
Molecular dynamics analysis
Molecular dynamics simulations were performed using a standard protocol for pmemd simulationsincluded in the AMBER 14 software package (Salomon-Ferrer et al. 2013). A high-resolution three-dimensional structure of human interleukin (hIL)-21 resolved by heteronuclear NMR spectroscopy(PDB code: 2OQP) was used (Bondensgaard et al. 2007) and periodic box conditions were set.Water was modelled explicitly with the TIP3P model. Calculations were performed with NVIDIAGPU acceleration on a workstation with a GeForce GTX 1080 graphic card. B-factors (atomicdisplacement parameter, (Yuan et al. 2005)) for each protein residue were calculated based on thewhole time of the productive MD calculation (i.e. for 200 nano seconds with a time step of 0.002pico seconds and recorded every pico second) using AmberTools 14 and atomfluct utility. The MDtrajectory was pre-processed, i.e. box centred and superimposed by atoms of the protein mainchain.
6

Polymorphism statistics, DFE and McDonald-Kreitman type test of positive selec-tion
We obtained whole genome information for 46 unrelated Yorubian individuals (i.e. 92 haplotypes)from the human 1000K genome project (The 1000 Genomes Project Consortium 2015) andextracted their genic variation (genome annotation file http://ftp.ensembl.org/pub/grch37/release-87/gtf/homo_sapiens/). We excluded genes on the X Chromosome as well as genes that couldnot clearly be assigned to the respective MobiDB database entry. We focused on bi-allelic SNPvariation and created site frequency spectra for synonymous and nonsynonymous sites on agene-by-gene basis using the Python egglib package (De Mita and Siol 2012). Divergence datafor the respective gene was obtained by randomly obtaining the ortholog from a closest relatednon-ape species we had in our between species dataset. We then split the information intoordered and disordered regions and summed data across genes, because some genes are veryshort or contain little polymorphisms. Statistics presented here, unless otherwise stated, areobtained from the summed data. We used DFE-alpha (Keightley and Eyre-Walker 2007; Eyre-Walker and Keightley 2009) to estimate the distribution of fitness effects of new nonsynonymousmutations (Eyre-Walker and Keightley 2007) along with the proportion of substitutions attributedto positive selection and the relative rate of adaptive substitutions to synonymous divergence(ωa, (Gossmann et al. 2010)) for ordered and disordered regions as well as jointly for bothtogether. The McDonald Kreitman test (McDonald and Kreitman 1991) is a classic test of positiveselection that uses the contrast of divergence and diversity at selected (e.g. nonsynonymous)relative to neutral (e.g. synonymous) sites to infer the rate of positive selection. In its classicform, it neglects the effect of slightly deleterious mutations and the rate of adaptive evolutioncan be denoted as α, where α = 1 − (DSPN )/(DNPS) (where D and P denote the relative rateof (non)synonymous substitutions and polymorphisms, respectively (Eyre-Walker 2006)). Usingthis notation ωa = DnA/DS = αDN/DS , where DnA is the rate of adaptive nonsynonymoussubstitutions. Since we expect the number of non-adaptive nonsynonymous substitutions to varybetween disordered and ordered region because of the differences in the DFE, α would varybetween these protein regions even if DnA would be the same. Hence ωa is a better measure tocompare the role of adaptation between these two protein regions.
Statistical and GO enrichment analysis
For statistical analysis, we used the scipy Python package. Graphs were generated with matplotliband seaborn in Python3. In a box plot, the box represents the range between upper and lowerquartiles, the horizontal line within the box shows the median, and the whiskers show the mostextreme data point, which is no more than 1.5 times the length of the box away from the box. In abarplot the error bars denote the standard error. To test for enrichment of genes with different geneontology (GO) classifications, we used PANTHER (Mi et al. 2016) as well as STRING database(Szklarczyk et al. 2017). PyMOL 1.7.2.1 was used for protein structure visualisation.
7

Supplemental Figures
Supplemental Figure S1
Figure S1: Disordered protein content in the analysed dataset. Histograms of relative (leftpanel) and absolute (right panel) number of sites in proteins that are predicted to be part of a longintrinsically disordered protein region in our dataset, based on human protein sequences fromMobiDB (Di Domenico et al. 2012) after filtering and alignment processing (6,663 entries).
8

Supplemental Figure S2
ordered disordered not pos. sel.Alignments of Protein regions with evidence for positive selection
4
6
8
10
Alig
nmen
t qua
lity
(Zor
ro s
core
)
n.s. n.s.
n.s.
Figure S2: Alignment quality scores before alignment pipeline was applied. Average per sitezorro scores for alignments for which positive selection was inferred in the disordered and orderedregions and for the remaining gene sets are shown. No significant difference was observed foralignment quality between the groups (P > 0.05, Mann-Whitney-U test).
9

Supplemental Figure S3
pos. sel. indisordered regions
pos. sel. inordered regions
pos. sel. inboth regions
no positive selection
Initial evidence for positive selection
0
20
40
60
80
100
Pro
port
ion
of s
igni
fican
t LR
Ts
for
posi
tive
sele
ctio
n
ordered regions disordered regions
Figure S3: Simulation studies of proteins with evidence of positive selection and a randomsubset of 250 proteins without a signature of positive selection. Sets of 100 alignments per proteinwere simulated with INDELIBLE in a partioned model using parameters estimates from the separatecodeml analysis for ordered and disordered regions.
10

Supplemental Figure S4
Figure S4: Simulation studies for an artifical protein with a disordered protein region of 250amino acids flanked by ordered regions of 250 amino acids on each site under varying indel ratesin the disordered region (1×, 5× and 10× relative to the ordered region). 100 alignments weresimulated and processed for each group and positive selection was assumed for ≈ 5% of thedisordered sites with ω = 3.28, otherwise this fraction was set no evolve neutral (ω = 1).
11

Supplemental Figure S5
Figure S5: Protein interaction networks of proteins for which their coding genes showedevidence for positive selection (A) Proteins with unique evidence for positive selection in disor-dered regions (B) Proteins with unique evidence of positive selection in ordered regions. Colors arearbitrarily assigned based on an MCL clustering algorithm.
12

Supplemental Figure S6
A B
C D
Figure S6: Protein interaction networks of proteins for which their coding genes showedevidence for positive selection in disordered regions (A-D) Proteins with unique evidence forpositive selection in disordered regions randomly downsampled to 197 proteins to account fordifference in protein numbers between the ordered and disordered sets. Maximum cluster sizevaries between 13 and 18
13

Supplemental Figure S7
Disordered region (MobiDB)PDB 2OQP
Homo sapiens (PDB 2OQP) .....................MQGQDRHMIRMRQLIDIVDQLKNYVNDLVPEFLPAPEDVETNCEWSAFSCFQKAQLKSANTGNNERIINVSIKKLKRKPPSTNAGRRQKHRLTCPSCDSYEKKPPKEFLERFKSLLQKMIHQHLSSRTHGSEDSHomo sapiens (Q9HBE4) MERIVICLMVIFLGTLVHKSSSQGQDRHMIRMRQLIDIVDQLKNYVNDLVPEFLPAPEDVETNCEWSAFSCFQKAQLKSANTGNNERIINVSIKKLKRKPPSTNAGRRQKHRLTCPSCDSYEKKPPKEFLERFKSLLQKMIHQHLSSRTHGSEDSGorilla gorilla gorilla MERIVICLMVI.LGTLVHKSSSQGQDRHMIRMRQLIDIVDQLKNYVNDLVPEFLPAPEDVETNCEWSAFSCFQKAQLKSANTGNNE..INVSIKKLKRKPPSTNAGRRQKHRL..........KPPKEFLERFKSL...................Pan troglodytes MERIVICLMVI.LGTLVHKSSSQGQDRHMIRMRQLIDIVDQLKNYVNDLVPEFLPAPEDVETNCEWSAFSCFQKAQLKSANTGNNE..INVSIKKLKRKPPSTNAGRRQKHRL..........KPPKEFLERFKSL...................Cercocebus atys MERIVICLMVI.LGTLVHKSSSQGQDRHMIRMRQLIDIVDQLKNYVNDLDPEFLPAPEDVETNCEWSAFSCFQKAQLKSANTGNNE..INLSIKKLKRKSPSTGAERRQKHRL..........KPPKEFLERFKSL...................Papio anubis MERIVICLMVI.LGTLVHKSSSQGQDRHMIRMRQLIDIVDQLKNYVNDLDPEFLPAPEDVETNCEWSAFSCFQKAQLKSANTGNNE..INLSIKKLKRKSPSTGAERRQKHRL..........KPPKEFLERFKSL...................Macaca fascicularis MERIVICLMVI.LGTLVHKSSSQGQDRHMIRMRQLIDIVDQLKNYVNDLDPEFLPAPEDVETNCEWSAISCFQKAQLKSANTGNNE..INLSIKKLKRKSPSTGAERRQKHRL..........KPPKEFLERFKSL...................Mandrillus leucophaeus MERIVICLMVI.LGTLVHKSSSQGQDRHMIRMRQLIDIVDQLKNYVNDLDPEFLPAPEDVETNCEWSAFSCFQKAQLKSANTGNNE..INLSIKKLKRKSPSTGAERRQKHRL..........KPPKEFLERFKSL...................Colobus angolensis palliatus MERIVICLMVI.LGTLVHKSSSQGQDRHMIRMRQLIDIVDQLKNYVNDLDPEFLPAPEDVETNCEWSAFSCFQKAQLKSANTGNNE..ISLSIKKLKRKSPSTGAERRQKHRL..........KPPKEFLERFKSL...................Saimiri boliviensis boliviensis MERIVICLIVI.LGTLVHKSSSQGQDRHMIRMRQLIDIVDQLKNYVNDLDPEFLPAPEDVETNCEWSAFSCFQKAQLKSANTGDNE..INVSIKKLKRKPPSTKAERRQKHRL..........KPPKEFLERFKSL...................Nomascus leucogenys MERIVICLMVI.LGTLVHKSSSQGQDRHLIRMRQLIDIIDQLKNYVNDLVPEFLPAPEDVETNCEWSAFSCFQKAQLKSANTGNNE..INVSIKKLKRKLPSTNAGRRQKHRL..........KPPKEFLERFKSL...................Galeopterus variegatus MERMVICLMVT.LGTLAHKSSSQGQDRLMIRMRQLIDVVDQLKNYVNNLDPEFLPAPHDVKRHCERSAFSCFQKVQLKSVNTGDNE..INVLIKQLKRKLPPTNAGRRQKYKL..........KPPKEFLERLKSL...................Tarsius syrichta MERIFMCLMVI.LGTLAHKSNSQGQDRLLIRMRQLIDIVDQLINYVNDLDPELLPAPEDAKRHCEWSAFSCFQKAPLKPANTGDNE..IKLLTKQLKRKLPSTKAKRRQNHIL..........KPPKEFLERLKSL...................Leptonychotes weddellii MEKIVICLMVI.LGTVAHKSSFQEQDLLLIRLRQLIDIVDQLKNYMNDLDPESLPAPEDVKRHCERSAFSCFQKAQLKAANTGGNE..INVLTKQLKRKLPPTNAGRRQKHRP..........TPPKEFLERLKSL...................Odobenus rosmarus divergens MEKIVICLMVI.LGTVAHKSSFQEQDLLLIRLRQLIDIVDQLKNYVNDLDPESLPAPEDVKRHCERSAFSCFQKAQLKAANTGGNE..INVLTKQLKRKLPPTNAGRRQKHRP..........TPPKEFLERLKSL...................Panthera tigris altaica MEKIVICLMVI.LGTIAHKSSFQEKDLLLIRMRQLIDIVDQLQNYVNYLEPEPLPAPEDVKRHCERSAFSCFQKVQLKAANTGGNE..ISVLTKQLKRKLPPTNAGRRQKHRP..........TSPKEFLERLKSL...................Felis catus MEKIVICLMVI.LGTIAHKSSFQEKDLLLIRMRQLIDIVDQLQNYVNYLEPEPLPAPEDVKRHCERSAFSCFQKVQLKAANTGGNE..ISVLTKQLKRKLPPTNAGRRQKHRP..........TSPKEFLERLKSL...................Ailuropoda melanoleuca MEKIVICLTVI.LGTVAHKSSFQEQDRFLIRMRQLINIVDQLKKYVNDLDPESLPAPEDVKRHCEQSAFSCFQKAQIKTANTGGNE..ISVLTKQLKRKLPPTNAGRRQKHRP..........TPPKEFLERLKSL...................Capra hircus MERIVICLMVI.SGTVAHKSSFQGQDRLFIRLRQLIDIVDQLKNYVNDLDPEFLPAPEDVKRHCERSAFSCFQKVQLKSANNGDNE..INILTKQLKRKLPPTNAGRRQKHEL..........KPPKEYLERLKSL...................Bubalus bubalis MERIVICLMVI.SGTVAHKSSFQGQDRLFIRLRQLIDIVDQLKNYVNDLDPEFLPAPEDVKRHCERSAFSCFQKVQLKSANNGDNE..INILTKQLKRKLPATNAGRRQKHEV..........KPPKEYLERLKSL...................Bos taurus MERIVICLMVI.SGTVAHKSSSQGQDRLFIRLRQLIDIVDQLKNYVNDLDPEFLPAPEDVKRHCERSAFSCFQKVQLKSANNGDNE..INILTKQLKRKLPATNTGRRQKHEV..........KPPKEYLERLKSL...................Orcinus orca MERIVICLMVL.SGTLAHKSSFQGQDRLLIRLRQLIGIVDQLKNYVNDLDPEFLPAPEDVKRHCERSAFSCFQKIQLKSANTGDNE..INVLTKQLKRKLPPTNAGKRQKHKL..........KPPKEFLERLKSL...................Sus scrofa MEKIVICLMVI.SGTVAHKSSFQGQDRLLIRLRQLIDTVDQLKNYVHDLDPELLPAPEDVQRHCEQSAFSCFQKVELKSANTGDNE..INVLIKQLKRKLPPTNAGRRQKHGL..........KPIKEFLERLKSL...................Camelus bactrianus MERIVICLMVI.SGTVAHKSNSQGQDRLLIRLRQLIDIVDQLKHYVNDLDPEFLPAPEDVKRHCEWSAFSCFQKIQLKSANAGDKE..INVLTKQLKRKLPATNARRTQKHGL..........KPPKEFLERLKSL...................Camelus dromedarius MERIVICLMVI.SGTVAHKSNSQGQDRLLIRLRQLIDIVDQLKHYVNDLDPEFLPAPEDVKRHCEWSAFSCFQKIQLKSANAGDKE..INVLTKQLKRKLPATNARRTQKHGL..........KPPKEFLERLKSL...................Equus caballus MERIVICLMVI.LGTVAHKSSFQGQDRLLIRMRQLIDIVDQLKNYVNDLDPEFLPAPEDVKRHCEQSAFSCFQKVQLKSANAGDNE..INVLIKQLKRKLPPTNAERRQKHRP..........KPLKEFLERLKSL...................Elephantulus edwardii MQRIVFCLIVI.SGAAAHKSSSQEQDRFMIRMRLLLDIVDQLKNYMNYLAPDFFAAPQDIKDHCELSAFSCFQKAELKIINAGDNE..IQTRIHQLRRKLPPTKEGKKQKHKP..........KPPKEFLERLKSL...................Echinops telfairi MGRRVFCLMVI.SGIVAHKTSSKEHDRLMIRMLQLIDIVDQLKNYVNDLDPELLPAPQDVKRHCEQSAFSCFQKAQLKPLNAGDHE..INMGIKKLKRKLPPANGKKKQKRSP..........KPPKEFLENMKSL...................Dasypus novemcinctus MERVVFCLIVI.SGTVAHKSGSQRQDRFMIRMRQLIDIVDQLKNYVNDLDPEFLPAPQDVKRHCERTAFSCFQKAQLKSANTGGNE..INMLIKQLKRKLPPTNTGRRQKHRL..........KQPKEFLERLNSL...................Tupaia chinensis MERIVICLMVI.LGTVAHKSNSQRQDRRLIRLRQLLETVDELNNYVNDLDPEFLPAPQDVKKHCELSAFSCFQKAQLKPANTGDNG..IDDLIKRLKRKLPPTNAGKRQKREL..........KPPKEFLKRLKSL...................Oryctolagus cuniculus MERIVICLMVI.LGTVAHKSSSKGQDRYMIRMHQLLDIVDQLQSDVNDLDPDFLPAPQDVQKGCEQSAFSCFQKAQLKPANAGDNG..ISSLIKQLKRKLPSTKSKKTQKHRP..........KNLKEFLERLKSL....................
5.
10.
15.
20.
25.
30.
35.
40.
45.
50.
55.
60.
65.
70.
75.
80.
85.
90.
95.
100.
105.
110.
115.
120.
125.
130
↑ ↑ ↑S81G85 R91
Figure S7: Protein alignment of 30 species including human interleukin-21 used to identifysites under positive selection The protein sequence of the NMR structure of human interleukin-21 (PDB Code: 2OQP) is shown on top and the corresponding human disordered region fromMobiDB is indicated in green as well as three residues that have been identified as positivelyselected in a PAML branch-site test (S81, G85, and R91) in red. Note that sites have been countedrelative to the PDB protein sequence and that sites in sequences from non-human species that areindicated with gaps have been excluded from the paml analysis as part of the alignment processingpipeline.
14

Supplemental Figure S8
Figure S8: Graphical outline of the analysis pipeline to obtain evolutionary rates of humandisordered and ordered regions in a comparative framework. We extracted human proteinswith intrinsically disordered regions (C and N denote the C and N terminal protein regions, respec-tively). These were aligned with sequence orthologs from other species and human disorderedresidues were masked in the other sequences accordingly. To take the genomic context into accountwe only considered paired regions (disordered and ordered region of the same protein).
15

Supplemental Figure S9
Figure S9: Phylogenetic tree of the mammalian species used in this analysis.
16

Supplemental Figure S10
0 5 10 15 20 25 30 35 40 45Number of input species
0.0
0.1
0.2
0.3
0.4
0.5
pva
lue
P(H0 vs. H1, df=1)P(H1 vs. H22, df=2)
Figure S10: Likelihood tests for phylogenetic calculations with different numbers of randomlychosen species from the list of homologous sequences, where H0, H1 and H22 refer to differentPAML site models (hypothesis) for the phylogenetic analysis (one-ratio, neutral, positive selection,respectively, df denotes the degrees of freedom). Starting from 20 species, p-values for both testsare less than 0.05, hypothesis difference becomes significant.
17

Supporting Tables
Supplementary Table S1
Table S1: GO enrichment analysis with PANTHER of the gene set used in phylogenetic analysis(6,663 human genes annotated in MobiDB database) in comparison to the entire human proteome.Enrichment was tested with an exact Fisher’s exact test with df=2.
GO name GO id in background*in
analysed** expected Fold Enrichment p-value
mRNA binding GO:0003729 96 64 30.85 2.07 1.95 ×10−05
sequence-specificDNA binding RNA
polymerase IItranscription factor
activity
GO:0000981 190 122 61.05 2.00 5.77 ×10⁻¹⁰
chromatin binding GO:0003682 166 106 53.34 1.99 1.95 ×10−08
small GTPaseregulator activity
GO:0005083 287 166 92.21 1.80 3.66 ×10⁻¹⁰
guanyl-nucleotideexchange factor
activity
GO:0005085 146 81 46.91 1.73 6.34 ×10−04
RNA binding GO:0003723 359 195 115.35 1.69 9.96 ×10⁻¹⁰
sequence-specificDNA binding
transcription factoractivity
GO:0003700 1167 610 374.96 1.63 1.29 ×10⁻²⁸
enzyme regulatoractivity
GO:0030234 678 354 217.84 1.63 6.99 ×10⁻¹⁶
protein kinase activity GO:0004672 406 207 130.45 1.59 4.47 ×10−08
DNA binding GO:0003677 1392 704 447.25 1.57 2.23 ×10⁻²⁹
nucleic acid binding GO:0003676 2080 1042 668.31 1.56 9.48 ×10−44
transcription factorbinding transcription
factor activity
GO:0000989 231 114 74.22 1.54 1.70 ×10−03
protein bindingtranscription factor
activity
GO:0000988 232 114 74.54 1.53 2.04 ×10−03
transcription cofactoractivity
GO:0003712 222 109 71.33 1.53 3.21 ×10−03
kinase activity GO:0016301 573 251 184.11 1.36 2.07 ×10−04
binding GO:0005488 5024 2064 1614.22 1.28 1.00 ×10⁻³³
protein binding GO:0005515 2607 1009 837.64 1.20 7.07 ×10−08
* in background is the number of human proteins in the PANTHER database with this GO term(total 21002), ** in analysed is the number of analysed proteins with this GO term (total 6663)
18

Supplementary Table S2
Table S2: Number of amino acids with structural features based on SASA scores in ordered anddisordered regions of the analysed proteins. Structural information was available for 2115 of the6663 proteins. The p-value is based on a χ2 test of the two-by-two matrix.
Site category ordered disordered p-value
Surface 189163 7652Core 154962 820
————- ——– ———- ——-Surface to Core ratio 1.22 9.33 0
19

Supplementary Table S3
Table S3: Proportion of number of amino acids with Uniprot regional features in ordered anddisordered regions of analysed proteins. Uniprot feature information was available for 6649 of the6663 proteins. The p-value is based on the χ2-test of the two-by-two matrix of the raw counts. Theenriched pair is marked with an asterisk. Regions and motifs are protein regions (longer or shorterthan 20 amino acids, respectively) with a biological significance. PTMs are single amino acids thatmay undergo post-translational modification. Site are single amino acids with biological significancethat are not PTMs.
Annotation type ordered disordered p-value
Region 0.10640 0.10907* 7× 10−08
Motif 0.00245 0.00505* 2× 10−273
PTM 0.00027 0.00067* 4× 10−58
Site 0.00058* 0.00003 2× 10−73
20

Supplementary Table S4
Table S4: Number of amino acids in ordered and disordered regions with an annotated diseaseassociation. The p-value is based on a χ2 test, given that there is a total number of 641061 orderedand 91845 disordered sites. The enriched pair is marked with an asterisk. † Not enough counts forχ2 test. ICD 10 - International Statistical Classification of Diseases and Related Health Problems
Disease type ordered disordered p-value
Blood 410* 11 1× 10−09
Chromosomal 29 2 −†Circulatory 472* 58 3× 10−01
Digestive 134* 6 5× 10−03
Endocrine 1154* 35 3× 10⁻²³
EyeEar 690* 20 8× 10⁻¹⁵
Genitourinary 214* 15 8× 10−03
Infection 4 0 −†Mental 155* 19 6× 10−01
Musculoskeletal 594 131* 9× 10−06
Neoplasm 367* 22 6× 10−05
Nervous 1807* 83 1× 10⁻²⁶
OtherCongenital 1188* 100 3× 10−07
Pregnancy 5 1 −†Respiratory 21 0 −†Skin 23 0 −†Surgery 80 4 −†No ICD10 294* 20 1× 10−03
21

Supplementary Table S5
Table S5: Protein identifiers (HGNC), Uniprot Ids as well ω values for proteins with a signature ofpositive selection in ordered and disordered region
Table provided as Supplementary Excel file (Supplementary Table S5)
22

Supplementary Table S6
Table S6: Molecular functional enrichment categories (FDR<0.01) in the STRING network analyses(Supplemental Fig. S5) of proteins identified to be evolving under positive selection for disorderedand ordered protein regions.
pathway ID pathway description count in network false discovery rate
DisorderedGO:0003723 RNA binding 48 0.00393GO:0003676 nucleic acid binding 87 0.00927OrderedGO:0002682 regulation of immune system
process33 0.00104
GO:0050776 regulation of immune response 24 0.00133GO:0022407 regulation of cell-cell adhesion 15 0.00149GO:0050863 regulation of T cell activation 13 0.00149GO:0031347 regulation of defense response 22 0.0015GO:0022610 biological adhesion 25 0.00254GO:0051607 defense response to virus 10 0.00295GO:0002697 regulation of immune effector
process15 0.00425
GO:0007155 cell adhesion 24 0.00468GO:0050670 regulation of lymphocyte
proliferation10 0.00468
GO:0045088 regulation of innate immuneresponse
14 0.00504
GO:0002252 immune effector process 15 0.00683GO:0009615 response to virus 11 0.00686
23

Supplemental References
Berman HM, Westbrook J, Feng Z, Gilliland G, Bhat TN, Weissig H, Shindyalov IN, Bourne PE.2000. The protein data bank. Nucleic acids research 28: 235–242.
Bininda-Emonds ORP, Cardillo M, Jones KE, MacPhee RDE, Beck RMD, Grenyer R, Price SA,Vos RA, Gittleman JL, Purvis A. 2007. The delayed rise of present-day mammals. Nature 446:507–512.
Bondensgaard K, Breinholt J, Madsen D, Omkvist DH, Kang L, Worsaae A, Becker P, Schiødt CB,Hjorth SA. 2007. The existence of multiple conformers of interleukin-21 directs engineering of asuperpotent analogue. The Journal of biological chemistry 282: 23326–23336.
De Mita S, Siol M. 2012. EggLib: Processing, analysis and simulation tools for population geneticsand genomics. BMC genetics 13: 27.
Di Domenico T, Walsh I, Martin AJ, Tosatto SC. 2012. MobiDB: A comprehensive database ofintrinsic protein disorder annotations. Bioinformatics 28: 2080–2081.
Dosztanyi Z, Csizmok V, Tompa P, Simon I. 2005. The pairwise energy content estimated from aminoacid composition discriminates between folded and intrinsically unstructured proteins. Journal ofmolecular biology 347: 827–839.
Duarte JM, Srebniak A, Schärer MA, Capitani G. 2012. Protein interface classification by evolution-ary analysis. BMC bioinformatics 13: 1.
Edgar RC. 2004. MUSCLE: Multiple sequence alignment with high accuracy and high throughput.Nucleic acids research 32: 1792–1797.
Eyre-Walker A. 2006. The genomic rate of adaptive evolution. Trends in ecology & evolution 21:569–575.
Eyre-Walker A, Keightley PD. 2009. Estimating the rate of adaptive molecular evolution in thepresence of slightly deleterious mutations and population size change. Molecular biology andevolution 26: 2097–2108.
Eyre-Walker A, Keightley PD. 2007. The distribution of fitness effects of new mutations. Naturereviews Genetics 8: 610–618.
Fletcher W, Yang Z. 2009. INDELible: A flexible simulator of biological sequence evolution.Molecular biology and evolution 26: 1879–1888.
Gossmann TI, Schmid KJ. 2011. Selection-driven divergence after gene duplication in arabidopsisthaliana. Journal of molecular evolution 73: 153–165.
Gossmann TI, Song B-H, Windsor AJ, Mitchell-Olds T, Dixon CJ, Kapralov MV, Filatov DA, Eyre-Walker A. 2010. Genome wide analyses reveal little evidence for adaptive evolution in many plantspecies. Molecular biology and evolution 27: 1822–1832.
Gray KA, Yates B, Seal RL, Wright MW, Bruford EA. 2015. Genenames.org: The hgnc resources in2015. Nucleic acids research 43: D1079–D1085.
Junier T, Zdobnov EM. 2010. The Newick utilities: High-throughput phylogenetic tree processing inthe UNIX shell. Bioinformatics 26: 1669–1670.
24

Keightley PD, Eyre-Walker A. 2007. Joint inference of the distribution of fitness effects of deleteriousmutations and population demography based on nucleotide polymorphism frequencies. Genetics177: 2251–2261.
Linding R, Jensen LJ, Diella F, Bork P, Gibson TJ, Russell RB. 2003a. Protein disorder prediction:Implications for structural proteomics. Structure 11: 1453–1459.
Linding R, Russell RB, Neduva V, Gibson TJ. 2003b. GlobPlot: Exploring protein sequences forglobularity and disorder. Nucleic acids research 31: 3701–3708.
Liu Y, Schmidt B, Maskell DL. 2010. MSAProbs: Multiple sequence alignment based on pair hiddenMarkov models and partition function posterior probabilities. Bioinformatics 26: 1958–1964.
McDonald JH, Kreitman M. 1991. Adaptive protein evolution at the adh locus in drosophila. Nature351: 652–654.
Mi H, Poudel S, Muruganujan A, Casagrande JT, Thomas PD. 2016. PANTHER version 10:Expanded protein families and functions, and analysis tools. Nucleic acids research 44: D336–D342.
O’Leary NA, Wright MW, Brister JR, Ciufo S, Haddad D, McVeigh R, Rajput B, Robbertse B,Smith-White B, Ako-Adjei D, et al. 2016. Reference sequence (refseq) database at ncbi: Currentstatus, taxonomic expansion, and functional annotation. Nucleic acids research 44: D733–D745.
Rolland J, Condamine FL, Jiguet F, Morlon H. 2014. Faster speciation and reduced extinction in thetropics contribute to the mammalian latitudinal diversity gradient. PLoS biology 12: e1001775.
Salomon-Ferrer R, Case DA, Walker RC. 2013. An overview of the amber biomolecular simulationpackage. Wiley Interdisciplinary Reviews: Computational Molecular Science 3: 198–210.
Shrake A, Rupley J. 1973. Environment and exposure to solvent of protein atoms. Lysozyme andinsulin. Journal of molecular biology 79: 351–371.
Sickmeier M, Hamilton JA, LeGall T, Vacic V, Cortese MS, Tantos A, Szabo B, Tompa P, Chen J,Uversky VN, et al. 2007. DisProt: The database of disordered proteins. Nucleic acids research 35:D786–D793.
Suyama M, Torrents D, Bork P. 2006. PAL2NAL: Robust conversion of protein sequence alignmentsinto the corresponding codon alignments. Nucleic acids research 34: W609–W612.
Szklarczyk D, Morris JH, Cook H, Kuhn M, Wyder S, Simonovic M, Santos A, Doncheva NT, RothA, Bork P, et al. 2017. The string database in 2017: Quality-controlled protein-protein associationnetworks, made broadly accessible. Nucleic acids research 45: D362–D368.
Talavera G, Castresana J. 2007. Improvement of phylogenies after removing divergent andambiguously aligned blocks from protein sequence alignments. Systematic biology 56: 564–577.
Tan K, Duquette M, Joachimiak A, Lawler J. 2009. The crystal structure of the signature domainof cartilage oligomeric matrix protein: Implications for collagen, glycosaminoglycan and integrinbinding. The FASEB Journal 23: 2490–2501.
The 1000 Genomes Project Consortium. 2015. A global reference for human genetic variation.Nature 526: 68–74.
Vucetic S, Brown CJ, Dunker AK, Obradovic Z. 2003. Flavors of protein disorder. Proteins: Structure,Function, and Bioinformatics 52: 573–584.
25

Walsh I, Martin AJ, Di Domenico T, Tosatto SC. 2012. ESpritz: Accurate and fast prediction ofprotein disorder. Bioinformatics 28: 503–509.
Wu M, Chatterji S, Eisen JA. 2012. Accounting for alignment uncertainty in phylogenomics. PloSone 7: e30288.
Yang Z. 2007. PAML 4: Phylogenetic analysis by maximum likelihood. Molecular biology andevolution 24: 1586–1591.
Yang ZR, Thomson R, Mcneil P, Esnouf RM. 2005. RONN: The bio-basis function neural networktechnique applied to the detection of natively disordered regions in proteins. Bioinformatics 21:3369–3376.
Yuan Z, Bailey TL, Teasdale RD. 2005. Prediction of protein B-factor profiles. Proteins 58: 905–912.
26

Paper II Bockwoldt, M., Heiland, I. & Fischer, K.
The phylogeny of the plastid phosphate translocator family
(Manuscript)
Now published in Planta, 250, 245–261 (2019), available at https://doi.org/10.1007/s00425-019-03161-y.

The evolution of the plastid phosphatetranslocator family
Mathias Bockwoldt, Ines Heiland, and Karsten Fischer§
Department of Arctic and Marine Biology, UiT The Arctic University of Norway,Biologibygget, Framstredet 39, 9017 Tromsø, Norway
§ Corresponding author: [email protected]
AbstractThe plastid phosphate translocators (pPT) are a family of transporters involved inthe exchange of metabolites between stroma and cytosol. Based on their substratespecificities, they were divided into four subfamilies named TPT, PPT, GPT andXPT. To analyse the occurrence of these transporters in different plants we identified645 pPT genes in 101 sequenced genomes from algae and land plants for phyloge-netic analysis. The first three subfamilies are found in all species and evolved beforethe split of red and green algae while the XPTs were derived from the duplicationof a GPT gene at the base of Streptophyta. The analysis of the intron-exon struc-tures of the pPTs corroborated these findings. While the number and positions ofintrons are remarkably conserved within each subfamily, they differ between thesubfamilies suggesting an insertion of the introns shortly after the three subfami-lies evolved. During angiosperm evolution, the subfamilies further split into differentgroups (TPT1-2, PPT1-3, GPT1-6). Angiosperm species differ significantly in thetotal number of pPTs, with many species having only a few while several plants, espe-cially crops, have a higher number, pointing to the importance of these transportersfor improved source-sink strength and yield. The differences in the number of pPTscan be explained by several small-scale gene duplications and losses in plant familiesor single species, but also by whole genome duplications, for example, in grasses.This work could be the basis for a more comprehensive analysis of the molecular andphysiological functions of this important family of transporters.
1

1 IntroductionIn contrast to primary non-photosynthetic eukaryotes, all photosynthetic eukaryoticcells contain plastids. These organelles play an essential role, as they represent thesites of photosynthesis and a multitude of other metabolic routes. They provide, forexample, the building blocks for a wide variety of primary and secondary metabo-lites as well as phytohormones. Plastids furthermore play an essential role in plantnitrogen and sulphur assimilation. Plastid metabolism is intertwined with that of thesurrounding cytosol and other cellular compartments. This causes considerable trafficof metabolites across the plastid membrane that is mediated by various transporters[Weber, 2004; Weber and Fischer, 2007]. Plastids of higher plants are surrounded bytwo concentric membranes, the inner and outer plastid envelope membranes. Trans-port across the outer envelope membrane is enabled by a set of β-barrel proteinsthat form pores that are cation or anion selective [Bölter and Soll, 2001]. The trans-port across the inner membrane is performed by a large set of α-helical membranetransporters, which are highly specific for their substrates [Fischer, 2011].The triose phosphate/phosphate translocator (TPT) from spinach was the first
plastid transporter that had been characterised at the molecular level [Flügge et al.,1989]. It belongs to a family of plastid phosphate translocators (pPTs) that func-tion as antiport systems using inorganic phosphate and phosphorylated C3, C5 orC6 compounds as counter substrates [Flügge et al., 2003]. Plastid phosphate trans-locator proteins are divided into four different subfamilies mainly based on theirsubstrate specificities. Firstly, TPTs transport triose phosphates and 3-phosphogly-cerate (3-PGA). They export the products of the Calvin cycle to the cytosol wherethey are used for the biosynthesis of sucrose and other metabolites [Flügge et al.,2003; Schneider et al., 2002].Secondly, the phosphoenolpyruvate (PEP)/phosphate translocators (PPTs) are
specific for PEP and 2-PGA, that are C3 compounds phosphorylated at C-atom 2,while triose phosphates and 3-PGA are not transported [Fischer et al., 1997]. Thephysiological role of PPTs in C3 plants is to supply plastids with PEP for fatty acidsynthesis and the shikimate pathway. This in turn leads to the synthesis of aro-matic amino acids and a large number of secondary metabolites [Prabhakar et al.,2010; Streatfield et al., 1999]. The import of PEP is important because chloroplastsand most non-green plastids (depending on the plant species and on the develop-mental stage of the tissue) are unable to convert hexose phosphates and triose phos-phates into PEP as they lack a complete glycolytic pathway [Borchert et al., 1993;Prabhakar et al., 2009; Stitt and ap Rees, 1979]. In contrast, in root cells PPTsmight act as an overflow valve by exporting PEP produced by a complete plastidglycolysis [Staehr et al., 2014]. In C4 plants, such as maize, and in CAM plants, suchas Mesembryanthemum crystallinum, PPTs are also involved in the export of PEPfrom the plastid stroma to the cytosol [Häusler et al., 2000a]. PEP is generated bythe enzyme pyruvate orthophosphate:dikinase (PPDK) [Fißlthaler et al., 1995] inplastids while in the cytosol PEP serves as the acceptor molecule for CO2 fixationby PEP carboxylase.
2

Thirdly, glucose-6-phosphate (Glc6P)/phosphate translocators (GPTs) show thebroadest substrate specificity. They accept phosphorylated C3 (triose phosphates,3-PGA), C5 (xylulose-5-phosphate, Xul5P), and C6 compounds (Glc6P) [Eicks et al.,2002; Kammerer et al., 1998]. In heterotrophic tissues, GPTs mediate the uptakeof carbon into plastids in the form of Glc6P, which serves as substrate for starchsynthesis, fatty acid synthesis, or the oxidative pentose phosphate pathway (OPPP)[Flügge et al., 2003; Hedhly et al., 2016; Niewiadomski et al., 2005]. Analysis ofstarchless mutant lines that are deficient in the plastid phosphoglucomutase (PGM,catalysing the interconversion of Glc6P and Glc1P), led to the conclusion that inmost plants Glc6P is the main precursor for starch synthesis [Kofler et al., 2000].Fourthly, Xul5P/phosphate translocators (XPTs) show a similar substrate spe-
cificity as GPTs, but do not transport Glc6P or other hexose phosphates indicatingthat pentose phosphates (especially Xul5P) are the main physiological substrate ofthe XPTs [Eicks et al., 2002]. It has been suggested that the XPTs might play a keyrole in the co-operation between the oxidative pentose phosphate pathway (OPPP)in the cytosol and the two pentose phosphate cycles (reductive and oxidative) inplastids [Flügge et al., 2003].cDNAs encoding pPT proteins of all four subfamilies have been isolated and se-
quenced [Eicks et al., 2002; Fischer et al., 1994, 1997; Flügge et al., 1989; Kammereret al., 1998]. Members of each subfamily share a high degree of identical amino acidswith each other (> 80%), while sequence identities between the members of the sub-families are only approximately 35%, with the exception of XPTs and GPTs thatshow a higher degree of identity (50%) with each other [Eicks et al., 2002; Kammereret al., 1998]. An analysis of the complete genome sequence of Arabidopsis thaliana[The Arabidopsis Genome Initiative, 2000] revealed that it contains one gene eachencoding a TPT and XPT, but two genes each encoding PPTs (PPT1 and 2) andGPTs (GPT1 and 2) [Knappe et al., 2003a]. However, not much is known aboutthe pPT family in other plants and in algae. The large number of completely se-quenced genomes from many clades of photosynthetic eukaryotic species now offersthe possibility to analyse the evolution of the pPT family in much more detail.
2 Materials and Method2.1 Phylogenetic treesProtein sequences of plastid phosphate translocators from completely sequenced ge-nomes of land plants and algae were obtained by BLASTP searches against the NCBInon-redundant protein database (www.ncbi.nlm.nih.gov) using protein sequencesfrom A. thaliana as queries (AtTPT, AtPPT1, AtGPT1, and AtXPT; encoded bythe genes At5g46110, At5g33320, At5g54800, and At5g17630, respectively). Resultswere manually curated to remove pseudo-genes encoding truncated proteins.Multiple alignments of protein sequences and building of trees were performed
using BAli-Phy 3.0-beta1 [Suchard and Redelings, 2006]. BAli-Phy is a program
3

that estimates multiple sequence alignments and resulting evolutionary trees usingMCMC (Markov Chain Monte Carlo) algorithms. For branch length and scaling,the LG+F substitution model [Le and Gascuel, 2008; Whelan et al., 2001], and theRS07 indel model with gamma distributions were used [Redelings and Suchard, 2007].Convergence of trees was checked with the program tracer from the BEAST package[Bouckaert et al., 2014]. For each tree, BAli-Phy was run four times. The consensustree and posterior probabilities were calculated using the program Trees-Consensusshipped with BAli-Phy. The burn-in was set to 10%. The program FigTree 1.4.3(http://tree.bio.ed.ac.uk/software/figtree) was used to visualise the trees. The im-ages were finalised using Inkscape 0.91 (www.inkscape.org).
2.2 Analysis of exon-intron bordersMultiple protein sequence alignments were performed using Muscle 3.8.31 [Edgar,2004]. Visualisation of multiple sequence alignments was done with a custom scriptwritten in Python 3. Exon borders were derived from two sources. If genome databut no transcriptome data from a plant species were available, exon-intron borderswere used that had been determined algorithmically at NCBI. The borders couldin this case be derived from the NCBI database using Biopython 1.68 [Cock et al.,2009]. If both genome and transcriptome data were available, exon-intron bordersof the nucleotide sequence of interest were determined by BLAST searches (mega-blast; [Camacho et al., 2009]) of mRNA sequences against the genomic database. Theexons would show up as different high-scoring segment pairs on the same hit. Mul-tiple sequence alignments with exon-intron borders were visualised using a customPython 3 script. Gene structures were shown with the help of the Gene StructureDisplay Server [Hu et al., 2015].
3 Results3.1 Phosphate translocators in land plantsIn order to identify all pPT genes in completely sequenced genomes of land plants andalgae, we performed BLAST searches with the pPT protein sequences from A. thali-ana against the NCBI non-redundant protein database. We obtained pPT sequencesfrom 52 dicotyledonous species, 13 monocotyledonous species and from Amborellatrichopoda [Amborella Genome Project, 2013], which is regarded as the single sis-ter species to all other extant angiosperms (Magnoliophyta). We also collected pPTsequences from six species of gymnosperms, from Selaginella moellendorffii (Lycopo-diophyta) and from two species of bryophytes (Physcomitrella patens, Marchantiapolymorpha). We also obtained sequences from three red algae, twelve green algae,and one species of the Charophyta (Klebsormidium flaccidum). Finally, 24 pPTsequences from ten species of the kingdom Chromalveolata were included in theanalysis (Suppl. Table S1). The pPT sequences were carefully curated manually to
4

remove all truncated and falsely annotated sequences, as it had been shown earlierthat even a small genome like that of A. thaliana contains a considerable numberof pPT pseudo-genes (four GPT and six PPT pseudo-genes; [Knappe et al., 2003a]).The set of 645 pPT sequences (Suppl. Table S1) was then used for phylogeneticanalysis as described in Materials and Methods.In a first step, pPT sequences from four eudicots, three monocots, A. trichopoda,
P. patens, and K. flaccidum were used to create a phylogenetic tree (Fig. 1). Thesequences cluster into three subfamilies (TPT, PPT, and GPT/XPT), the latter fur-ther divided into the GPTs and XPTs. In a second step, sequences from all speciesof Streptophyta including K. flaccidum were used to create individual phylogenetictrees of the four subfamilies of pPTs. Fig. 2 presents an overview of the four treesobtained while a detailed picture of the individual trees with all species names isshown in the Supplementary Figs. S1-S4. According to our analysis, the TPTs splitinto two groups (Fig. 2; Suppl. Fig. S1). One group consists of TPTs from almostall angiosperms (Table 1). As this group contains the well-characterised TPTs fromspinach and A. thaliana [Flügge et al., 1989, 2003; Schneider et al., 2002], it wasnamed TPT1. The second group (TPT2) consists of proteins from some families ofangiosperms and all TPTs from non-angiosperm Streptophyta including one fromK. flaccidum, indicating that it was the TPT2 group, which evolved first from analgal precursor. Because A. trichopoda possesses both TPT1 and TPT2, while allspecies that do not belong to the angiosperms lack the TPT1 (Table 1), the TPT1group most likely evolved by duplication of the TPT2 gene in the most recent com-mon ancestor (MRCA) of angiosperms (Fig. 3). Most angiosperm species possess onecopy of each of the TPT genes, while others (e.g. Glycine max,Malus domestica, Ses-amum indicum) have encountered a further duplication of the TPT1 gene (Table 1).In contrast, a duplication in angiosperms of the TPT2 gene has been identified inonly two species, Vitis vinifera (Vitaceae, Vitales) and Erythranthe guttata (Phry-maceae, Lamiales). A number of families have independently lost the TPT2 gene,most prominently all families of monocots and, in dicots, the Amaranthaceae andthe Brassicaceae. Interestingly, Tarenaya hassleriana, a member of the Cleomaceae,a family that is closely related to Brassicaceae, also lacks a TPT2 gene. In contrast,we have identified a TPT2 gene in a species from the Moringaceae (Moringa oleifera)that, together with some other families, diverged early during the evolution of theorder Brassicales [Cardinal-McTeague et al., 2016]. This implies that the MRCA ofBrassicales possessed a TPT2 gene that was lost later, most likely after the splitof Moringaceae. In the Fabaceae, some species (e.g. Medicago truncatula) possessa TPT2 gene, while others like Glycine max have lost it. All Fabaceae whose ge-nomes we have analysed belong to the Papilionoideae, one of three subfamilies of thefamily. This subfamily is further divided into seven subclades [Wojciechowski et al.,2004]. Further analysis revealed that the species lacking the TPT2 gene belong tothe subclade Millettioids, while the species possessing the TPT2 gene belong to theRobinioids, indicating that the gene loss occurred after the split into these subclades(Fig. 3; Table 1).
5

The PPTs can be divided into three different groups (Fig. 2; Suppl. Fig. S2). Twoof them consist of the PPT sequences from dicots including the well-characterisedPPT1 [Fischer et al., 1997; Flügge et al., 2003; Staehr et al., 2014; Streatfield et al.,1999] and the PPT2 [Knappe et al., 2003b] from A. thaliana. They were thus namedaccordingly. Most dicot genomes possess one copy of the PPT1 and PPT2 geneseach while in most Fabaceae and in the genera Populus and Gossypium, the PPT1gene was duplicated (Table 1). A few species have either lost the PPT1 (Ziziphusjujuba, Eutrema salsugineum) or the PPT2 (e.g. Cucumis melo, Phaseolus vulgaris).The third group harbours the PPTs from A. trichopoda and all monocots and non-angiosperm Streptophyta including K. flaccidum. This group obviously representsthe ancestral PPTs, which evolved from an algal ancestor and was named PPT3. Thephylogenetic tree (Fig. 2; Suppl. Fig. S2) furthermore reveals a split in the monocotPPT sequences followed by another split in the sequences of Poaceae, which are mostlikely caused by two whole genome duplications (WGDs) at the root of monocotsand the Poaceae, respectively [Tiley et al., 2016]. This led to the high number ofPPTs in most monocot species (with the exception of Triticum urartu and Zosteramarina). These data suggest that the two different groups of PPTs found in eudicotsevolved by a duplication of the ancestral PPT3 gene that occurred early in dicotevolution (Fig. 3).The GPT sequences diversified into six different groups whose relationships could
not be completely resolved (Fig. 2; Suppl. Fig. S3). One group consists of sequencesfrom all dicot species (with the exception of the sequences from Nelumbo nucifera).As this group contains the well-characterised GPT1 from A. thaliana [Kammereret al., 1998; Niewiadomski et al., 2005], we named the group accordingly. A secondgroup (GPT2) comprises GPTs from many angiosperm species including the GPT2from A. thaliana [Athanasiou et al., 2010; Dyson et al., 2015; Kunz et al., 2010], butlacks sequences from monocots, A. trichopoda, Nelumbo nucifera and from all speciesbelonging to the Solanales, Lamiales, and Gentianales, three orders that belong tothe asterid clade. Instead, some GPT sequences from the asterid species form a dis-tinct group (GPT3) that evolved after the duplication of either the GPT1 or GPT2gene at the root of the asterid clade (Figs. 2, 3; Suppl. Fig. 3). Whether the GPT3functionally replaced the GPT2 in these species or adopted a different function hasto be shown by analysing the molecular and physiological functions of these trans-porters. The GPT sequences from monocotyledonous species form two independentgroups (GPT4 and 5; Fig. 2; Suppl. Fig. S3). One group (GPT4) comprises all GPTsfrom non-Poaeceae monocots and, interestingly, also the GPT from A. trichopoda.This group can be further divided into two subgroups, which indicates a duplica-tion of the GPT gene at the root of monocots. The other group (GPT5) consistsof all GPTs from Poaceae that can be further divided into two subgroups. The lastGPT group (GPT6) contains all sequences from non-angiosperm species (e.g. gym-nosperms and mosses) including the GPT from the streptophytic alga K. flaccidum.In summary, we can conclude that the GPTs of land plants evolved from the GPTof streptophytic algae. During early angiosperm evolution, that is to say after thebranching of A. trichopoda and the monocots from the other angiosperms, the du-
6

plication of a GPT gene seemingly gave rise to the GPT1 and GPT2 genes found inmost dicots (Fig. 3). Most non-dicot species possess one or two GPTs (either GPT4,5, or 6) while most eudicot species possess one or two GPT1 and GPT2, respectively(Table 1).XPTs [Eicks et al., 2002] are closely related to GPTs (Fig. 1). They are found
in some gymnosperms and many angiosperms, but not in bryophytes (liverworts,hornworts, and mosses) (Table 1; Suppl. Fig. S4). This indicates that they evolvedfrom a GPT gene at the root of the Embryophyta (Fig. 3). Most species of theEmbryophyta possess one XPT gene, while in some species a duplication of the XPTgene occurred (Table 1). A noteworthy exception are the Poaceae family and Zosteramarina (Alismatales) that have lost the XPTs.
3.2 Phosphate translocators in algaeIt has been shown earlier that the red alga Galdieria sulphuraria possesses three pPTswhose transport activities resemble those from A. thaliana and other angiosperms,with the exception of a GPT-like protein that does not transport Glc6P [Linkaet al., 2008]. To analyse algal pPTs and their phylogenetic relationship to the pPTsof Streptophyta, we constructed a phylogenetic tree with pPT sequences from twelvegreen algae and three red algae (Fig. 4). We additionally included sequences fromA. thaliana and K. flaccidum as representatives of the Streptophyta and sequencesfrom algae that belong to the kingdom Chromalveolata. These algae possess plastidsacquired by a secondary endosymbiotic event, whereby a red alga was engulfed by aeukaryotic host (for a discussion of the monophyly of Chromalveolata see e.g. Gouldet al. [2015]). The pPT sequences from red and green algae branch into three groupswith homology to the TPT, PPT, and GPT/XPT proteins from A. thaliana (Fig. 4)providing evidence that the split into three pPT subfamilies already occurred in theMRCA of red and green algae. Most green algae and all red algae possess one TPT,PPT, and GPT/XPT, respectively (Table 1) while in Chlamydomonas reinhardtiiand in the two Ostreococcus species the PPT gene has been duplicated once or twice.In the parasitic alga Helicosporidium sp., both the TPT and PPT were lost whilea GPT was found. This pattern could be explained by the loss of photosynthesis,a process TPTs are involved in, while GPT-dependent starch synthesis is preserved[Pombert et al., 2014]. All pPT sequences from the chromalveolate algae group withTPTs of red algae, corroborating findings by Moog et al. [2015] that the pPTs ofthese algae are monophyletic, meaning that they are all derived from a single redalgal TPT, while the PPTs and GPTs obviously have been lost in these species.
3.3 Structure of the pPT genesIntrons interrupting protein-coding genes are found in many genes in all eukaryotes.The gene structure and intron distribution could be used to support the phylogeneticreconstruction based on protein sequence homology. We therefore determined theintron-exon borders in all pPT genes by aligning the mRNA sequences against the
7

corresponding genes. If no mRNA sequences were available, the predicted intron-exonborders from the NCBI database were used. The intron positions were then mappedonto alignments of the pPT amino acid sequences (Suppl. Fig. S5). The results can besummarised as follows. Within the Streptophyta, the different pPT subfamilies, theparalogous sequences, differ substantially both in the number and position of introns.In fact, none of the introns is conserved among the four pPT subfamilies. In contrast,within the subfamilies, the orthologous sequences, the intron positions are highlyconserved within a range of a few residues (Suppl. Fig. S5). These slight differencesin the positions are most likely due to the process of intron sliding, meaning therelocation of intron/exon boundaries over short distances [Rogozin et al., 2012].All TPT genes possess eleven introns at conserved positions, with the only excep-
tion of one of the TPTs from Selaginella moellendorffii, which lacks intron 1 (Fig. 5;Suppl. Fig. S5). This might, however, be explained by wrong sequence annotation.Most of the PPT genes contain eight introns at conserved positions (Fig. 5; Suppl.Fig. S5). Intron 1 has been lost in the PPT2 genes of the Solanaceae and in one ofthe PPT1 genes of Fabaceae, which diverts early from the other PPT1 genes (seeSuppl. Fig. S2). Intron 1 has also been lost in Spinacia oleracea while it is foundin the closely related species Beta vulgaris. In Boea hygrometrica, the last intron ismissing in the PPT2 gene while both species of the genus Triticum lack intron 3in their sole PPT gene. In addition, there is an insertion of an intron into the firstexon of the PPT gene of Triticum urartu (but not of T. aestivum). Most of theGPT genes possess four introns at conserved positions, while several genes lack thefourth intron (Fig. 5; Suppl. Fig. S5). However, the presence or absence of the lastintron is difficult to predict without mRNA sequences available for many genes, asit is located only a few residues upstream of the stop codon. This means that thelast exon contains only a few conserved residues, while most of it represents the non-conserved untranslated 3’ region. We found only very few differences between theGPT genes for the first three introns. One but not the other three of the GPT genesfrom Zostera marina is lacking the three last introns. Interestingly, the positions ofthe first two introns in the GPT gene from the streptophytic algae K. flaccidumdiffer significantly from those of the land plants indicating that the conserved intron-exon structure first evolved in the MRCA of all land plants. The XPT genes do notcontain any introns.In contrast to the well-conserved gene structures of land plants, the intron-exon
structures differ significantly between the different algae species (Fig. 5; Suppl.Fig. S5). In Rhodophyta, two of the three species do not possess introns in anyof the pPT genes. Only the pPT genes in G. sulphuraria contain a few introns, noneof them located at the conserved integration sites found in Streptophyta. In contrast,several introns identified in land plants are also found in many but not all species ofgreen algae, especially those of the Chlorophyceae and Trebouxiophyceae. Introns 1,2, 4, and 6-10 of the TPT genes, almost all introns of the PPT genes and intron 2of the GPT genes are found in many algae, while some of the introns are lackingin all algae (introns 3, 5 and 11 of the TPTs, intron 3 of the PPTs and introns 1,3 and 4 of the GPTs). Species of the order Prasinophyceae lack almost all introns
8

except intron 1 of the TPT. These picoalgae possess very small, intron-poor genomes.Many algae species possess additional introns not found in land plants. Especiallythe GPT genes contain introns, which were either obtained by the algae or lost inland plants after the split of Chlorophyta and Streptophyta.
4 Discussion4.1 The early evolution of the pPT familyThe evolution of the plastid phosphate translocators is closely connected to the evo-lution of plastids, the specific organelles of photosynthetic eukaryotic cells. Plastidsare of endosymbiotic origin [Mereschkowsky, 1905] (for an English translation see[Martin and Kowallik, 1999]). They are derived from a cyanobacterium that evolvedinto a novel organelle after engulfment by a heterotrophic eukaryotic cell, a processnow called primary endosymbiosis [Reyes-Prieto et al., 2007]. This single event gaverise to the Archaeplastidae, which comprise three lineages, the glaucophytes (withonly 15 species), the red algae (Rhodophyta) and the “green lineage” (Chloroplastidaor Viridiplantae) [de Vries et al., 2016]. The primary endosymbiotic event took placeabout 1.6 billion years ago (Bya), followed by branching into glaucophytes and redand green algae 1.5 to 1.6 Bya [Yoon et al., 2004]. It has been proposed that the in-tegration of new transporters into the membranes of the endosymbiont was a criticaland very early step in plastid evolution, enabling the export of carbon assimilated inphotosynthesis to the host cell [Cavalier-Smith, 2000; Fischer et al., 2016]. In landplants, triose phosphates represent the most important metabolites of the Calvin-Benson cycle that are exported to the cytosol by TPTs [Flügge, 1999].Analysis of sequence data from A. thaliana and some other plants showed that
the pPTs evolved from a nucleotide sugar transporter (NST) of the ER and/or Golgimembranes [Knappe et al., 2003a]. In a more extensive analysis, Weber et al. [2006]showed that the pPTs are monophyletic, meaning that they were derived from asingle NST protein that had been retargeted to the plastid inner envelope membraneenabling the host to connect to the photosynthetic carbon pool of the endosymbiontin the form of exported nucleotide sugars [Ball et al., 2011]. The plastid NST thenevolved into pPTs by changing its substrate specificities from nucleotide sugars tophosphorylated compounds.Sequencing of the genome of the first glaucophyte alga, Cyanophora paradoxa,
revealed that this species lacks pPTs [Price et al., 2012] indicating that these trans-porters evolved after the split of Glaucophyta and the other Archaeplastidae butbefore the division of the red and green lineages. In the MRCA of red and greenalgae, the new NST/pPT gene most likely duplicated twice, and the resulting threegenes gave rise to the three pPT subfamilies found in all red and green algae. Thesealgal pPTs group together with the TPTs, PPTs and GPTs/XPTs of land plants inphylogenetic trees (see Fig. 4). Analysis of the transport activities of the pPTs fromthe red alga G. sulphuraria showed that they have the same substrate specificities
9

as the pPTs from higher plants with the exception of the GPT (see below) [Linkaet al., 2008]. These data indicate that the three subfamilies of pPTs evolved veryearly close to the base of the Archaeplastidae tree.Other photosynthetic eukaryotes such as diatoms, or non-photosynthetic parasites
like the Apicomplexa evolved through higher order endosymbiosis in which either ared or green alga were engulfed by other eukaryotic cells. These new endosymbiontswere subsequently reduced to secondary plastids, which, in contrast to primary plas-tids, are surrounded by three to four membranes [Cavalier-Smith, 2000; Gibbs, 1978;Yoon et al., 2002]. The secondary endosymbiosis involving a red alga, which gave riseto the kingdom Chromalveolata, occurred about 1.3 Bya [Yoon et al., 2004]. Accord-ing to phylogenetic analyses, the phosphate translocators of the Chromalveolata aremonophyletically derived from the red algal TPTs, whereas GPT/XPTs and PPTshave been lost [Moog et al., 2015; Weber et al., 2006]. The data presented here(Fig. 4) support this hypothesis. The pPTs from chromalveolate species all groupphylogenetically with TPT sequences from red algae.This very early evolution of the pPTs is also corroborated by the analysis of the
intron-exon structures of the pPT genes. Comprehensive analyses of gene structuresfrom all eukaryotic clades revealed an extensive conservation of introns. Introns arelocated in the exact same position within orthologous genes even in distantly re-lated species such as A. thaliana and Homo sapiens (for an extensive discussion seeRogozin et al. [2012]). This suggests that many introns are ancestral, that is, theywere integrated during a period of massive intron gains very early in eukaryoticphylogeny. The subsequent evolution in most lineages of eukaryotes including an-giosperms involved primarily loss of introns with very few episodes of intron gains[Rogozin et al., 2012; Wang et al., 2014]. In contrast to the conservation of intronpositions in orthologous genes, ancient paralogous genes often differ substantially intheir intron-exon structure, indicating that they originated from gene duplicationssimultaneously with or before the early invasion of introns. A similar pattern wasfound in the pPT genes. Orthologous pPT genes of Streptophyta (genes belongingto the same pPT subfamily) have highly conserved intron-exon structures with fewintron losses and even fewer gains of additional introns in the TPT and PPT genesof some species. In the case of the GPT genes, however, the streptophyte alga K. flac-cidum possesses only one out of four introns found in land plants, indicating that theconserved GPT gene structure evolved only in the MRCA of land plants. In contrast,the intron-exon structures of paralogous pPT genes differ significantly both in thenumber and positions of the introns, with none of the introns being conserved in allthree pPT subfamilies. This points to an early gain of most of the introns with theexception of the GPTs.To obtain further evidence for the ancient nature of the pPT introns, we analysed
the intron-exon structures of pPT genes from red and green algae. Chlorophyta, rep-resenting most of the green algae, evolved through a schism early in the evolution ofViridiplantae (before 1 Bya; [Leliaert et al., 2011]), which gave rise to Chlorophytaand Streptophyta, being streptophyte algae (Charophyta) and land plants (Embryo-phyta). The Chlorophyta divided early into two major clades, the prasinophytes and
10

the core chlorophytes [Leliaert et al., 2012, 2011]. Species of the Trebouxiophyceaeand Chlorophyceae (both belonging to the core chlorophytes) possess several but notall of the introns found in the pPTs of Streptophyta, indicating that these introns areancient and existed already in the MRCA of Viridiplantae. A few conserved intronsare found only in Streptophyta, meaning they were gained after the split from greenalgae. Alternatively, they could have been lost in Chlorophyta. These green algaefurthermore possess a number of introns not found in the conserved genes of Strep-tophyta. Strikingly, we found differences in the number of introns even in closelyrelated species such as Chlorella variabilis and C. prothothecoides or Ostreococcustauri and O. lucimarinus showing the dynamics of the potentially still ongoing pro-cess of intron gains and losses in green algae [Simmons et al., 2015]. Species belongingto the prasinophytes have lost all but the first intron in the TPT genes. These speciesare unicellular picoalgae with small, “streamlined” genomes that have lost most ofthe ancient introns [Lemieux et al., 2014].The three species of the Rhodophyta we analysed lack all of the conserved introns
found in the green lineage. While two species do not contain any introns in the pPTgenes at all, G. sulphuraria possesses five new introns. The number of available redalgae genomes is too limited so far to answer the question whether or not the MRCAof red and green algae possessed the conserved introns found in the green lineage.These introns either were lost in red algae or, alternatively, have evolved after thesplit of the red and green lineage.
4.2 Evolution of the pPT family in StreptophytaAlthough the evolution of land plants (Embryophyta) is not fully understood theyunambiguously evolved from streptophyte algae [Delwiche and Cooper, 2015]. K. flac-cidum is the first charophyte alga for which a draft genome has been published [Horiet al., 2014]. The species belongs to the class Klebsormidiophyceae, a group of fil-amentous freshwater algae, which are regarded as sister clade to the ZCC clade ofCharophyta (Zygnematophyceae, Coleochaetophyceae, and Charophyceae) and allEmbryophyta which emerged on earth between 450 and 500 million years ago (Mya)[de Vries et al., 2016; Ruhfel et al., 2014]. K. flaccidum possesses one TPT, PPT,and GPT each, but no XPT. These pPTs from streptophytic algae are the ancestorsof the pPTs found in land plants, the evolution and physiological function of whichwe will discuss in more detail.
4.2.1 TPTs and PPTs
The TPT sequences split into two groups. The TPT1 group comprises proteins fromall angiosperms including the well characterised TPTs from spinach and A. thaliana[Flügge et al., 1989; Schneider et al., 2002]. The second group (TPT2) that had notbeen described before consists of all non-angiosperm proteins and those from severaldicot families. Thus, the TPT2 protein likely represents the ancestral transporter,which evolved from algal precursors. Because both TPTs are found in A. trichopoda
11

but not in gymnosperms, the TPT1 most likely arose from a duplication of the TPT2gene in the MRCA of angiosperms (Fig. 3). The TPT2 was later lost in several plantfamilies including all monocots and several dicot families as the Brassicaceae andAmaranthaceae. These are the families, most of the model plants belong to. Thismight be the reason why the TPT2 group has not been described until now.The function of the TPT1 in A. thaliana is the export of triose phosphates, the
products of CO2 assimilation, to the cytosol [Flügge et al., 2003]. The TPT1 of mostangiosperms and the TPT2 of non-angiosperm species thus represent the day-pathof photoassimilate export. During the night, however, carbon is exported in the formof maltose and glucose, the products of starch degradation. An A. thaliana knock-out mutant of the TPT1 showed no growth retardation under ambient greenhouseconditions. A detailed analysis of the mutant plants showed that the lack of triosephosphate export for cytosolic sucrose biosynthesis was almost fully compensated byboth continuous and accelerated starch turnover and export of neutral sugars fromthe stroma throughout the day [Schneider et al., 2002]. Albeit this bypass of theTPT exists most likely in many plants, all algae and Streptophyta possess at leastone functional TPT indicating the importance of this transporter for photosyntheticmetabolism. In plant species, which have more than one copy of the TPT1 or possessboth TPT1 and TPT2, the physiological function of each of these transporters is lessclear. They could be mainly involved in triose phosphate export or, alternatively,some of these proteins could have adopted a different physiological function.The PPT proteins split into three different groups. The PPT3 group consists of all
PPTs from non-angiosperm species and all monocots thus representing the ancestralPPT. This group also includes the single PPT from A. trichopoda, which means thatthe other two groups found in almost all dicots evolved after the split of A. trichopodaby duplication(s) of the PPT3 gene. Although the actual scenario is not known, theanalysis of the genome of Aquilegia coerulea, which belongs to the Ranunculales, anearly branching order of the eudicots, revealed the existence of both PPT1 and 2in this species. These data let us predict that both PPT1 and 2 evolved after thesplit of A. trichopoda but before the appearance of eudicots (Fig. 3). However, thishypothesis has to be verified by the analysis of more genomes of species from earlysplitting orders belonging to the Magnollidae.Most Streptophyta possess more than one PPT, most likely because the different
transporters have different physiological functions. A PPT1 knock-out mutant ofA. thaliana shows a reticulate leaf phenotype, stunted roots and is unable to pro-duce anthocyanins as a product of secondary plant metabolism [Streatfield et al.,1999]. More detailed analyses of the mutant line revealed that this phenotype iscaused by the reduction of PEP import into plastids, which leads to disturbanceof the shikimate pathway and altered levels of aromatic amino acids and secondarymetabolites [Staehr et al., 2014; Streatfield et al., 1999; Voll et al., 2003]. The en-dogenous PPT2 of A. thaliana is obviously not able to compensate for the absenceof PPT1 in the mutant background, pointing to different physiological functions ofboth transporters, an assumption, which is corroborated by the different temporal
12

and spatial expression profiles of both PPTs [Knappe et al., 2003b]. However, thephysiological function of the PPT2 (and of the PPT3) is still not known.
4.2.2 GPTs and XPTs
The phylogeny of the GPT and XPT proteins is more difficult to resolve. The dif-ferentiation into the two groups is based originally on the transport activities ofthe proteins from pea and A. thaliana [Eicks et al., 2002; Kammerer et al., 1998].They differ only in the ability to transport Glc6P while Xul5P is accepted by bothtransporters. Although genes belonging to the GPT/XPT clade are detectable inred and green algae, it is difficult to decide whether they actually represent func-tional GPTs or XPTs, based solely on sequence homology. Transport data are onlyavailable for the GPT/XPT protein from the red alga G. sulphuraria [Linka et al.,2008] that does not transport Glc6P while the transport of Xul5P had not beenanalysed in that study. In a recent publication of the crystal structure of this trans-porter, however, Lee et al. [2017] showed that the Glc6P molecule does not fit intothe substrate-binding site while Xul5P could bind to the transporter. Thus, theGPT/XPT protein that originally evolved in the MRCA of red and green algae(see above) might have been a “functional” XPT. The ability to transport Glc6Pmost likely evolved in green and/or streptophyte algae, but experimental evidenceof the transport activities of pPTs in these algae is still missing. The analysis ofthe physiological function of the GPTs in A. thaliana and other dicots revealed thatthey mediate the import of Glc6P into plastids for the synthesis of starch and fattyacids [Hedhly et al., 2016; Niewiadomski et al., 2005]. Interestingly, starch synthesisin red algae and, most likely, also in the MRCA of red and green algae is located inthe cytosol while in green algae and Streptophyta it is found in plastids [Ball et al.,2011]. It is tempting to speculate that the evolution of the Glc6P transport activityis tightly connected to this relocation of starch synthesis in the green lineage.We found GPTs in all Streptophyta including K. flaccidum. Although we were
not able to resolve the exact phylogeny of the GPTs, we identified six differentgroups (GPT1-6). GPT6 comprises all non-angiosperm proteins and thus representthe ancestral group. The sequences from monocots split into two groups. One groupcontains the proteins from Poaceae (GPT5), the other one (GPT4) those from allother monocot families, but also includes the GPT from A. trichopoda. That indicatesthat the two different types of GPTs, GPT1, and GPT2 (Table 1), found in mostdicots evolved after branching of the most basic angiosperms (Fig. 3). It shouldbe emphasised that almost all land plants possess more than one functional GPTgene, most commonly two to four, but up to nine in Glycine max and Camelinasativa. This points at different physiological functions of the different conservedGPT proteins. Biochemical and molecular data from A. thaliana, which possessestwo different functional GPTs [Knappe et al., 2003a], one GPT1 and one GPT2,corroborate this assumption. The GPT1 is important for carbon uptake into plastidsin most non-green tissues, for example, in both the female and the male gametophyteof A. thaliana [Niewiadomski et al., 2005] or in seeds of A. thaliana and Vicia
13

narbonensis [Andriotis et al., 2010; Rolletschek et al., 2007]. The deletion of theGPT1 gene in A. thaliana turned out to be lethal because the disruption of Glc6Pimport impairs the delivery of carbon skeletons for starch and fatty acid synthesisand also the production of NADPH by the OPPP thereby severely disturbing plastidmetabolism.In contrast, GPT2 knock out lines show no obvious mutant phenotype under am-
bient conditions. However, the GPT2 is involved in the adaptation of A. thalianato different stress conditions. The GPT2 gene is induced when carbohydrate meta-bolism is impaired, for example, at higher concentrations of soluble sugars when theGPT2 appears to be a safety valve for plastids [Kunz et al., 2010]. In addition, theGPT2 seems to be necessary both for the adaptation to high light [Athanasiou et al.,2010] and to fluctuations in light intensity [Dyson et al., 2015]. The importance ofthe two GPTs is documented by the fact that almost all dicots possess both GPT1and 2. A GPT1 was found in all species, while the GPT2 was lost only in a few singlespecies (e.g. Sesamum indicum) and by all species belonging to the Euasterid 1 cladewhere GPT2 was replaced by GPT3 (Table 1). Although there are no experimentaldata available for the GPT4-6 groups, it is very likely that they have similar oridentical physiological functions as GPT1 and 2 in dicots.The XPTs are a group of proteins closely related to GPTs (Fig. 1; [Eicks et al.,
2002]). Because they are found in many Spermatophyta but not in mosses and ferns,they are most likely derived from the duplication of a GPT gene in the MRCAof Spermatophyta (Fig. 3). Because XPT genes lack all introns occurring in GPTgenes, the gene duplication might have occurred by reverse-transcription from aGPT mRNA followed by genome insertion. Several cases of such intron-less geneswithin families of intron-containing genes have been reported in animals and plants[e.g. Frugoli et al., 1998; Li et al., 2002]. Many sequences were found in plants thatcould be the source of a reverse transcriptase activity, for example, copia-like andgypsy-like retroelement sequences [Wessler et al., 1995].Although the physiological function of the XPTs has not been determined yet, it
had been proposed, based on the compartmentation of plant metabolism that theXPTs connect the pentose phosphate pathways of the cytosol and plastids [Flüggeet al., 2003]. Co-operation between plastid and cytosolic OPPPs accomplished bythe exchange of metabolites have been shown in a number of studies [e.g. Averillet al., 1998]. These cycles are a major source of reducing power (in the form ofNADPH) and provide carbon skeletons for other biosynthetic reactions, for example,nucleotide biosynthesis and the deoxyxylulose phosphate (DOXP) pathway. Severallines of evidence indicate that many plant cells lack any activity of the cytosolicisoforms of transketolase and transaldolase catalysing the last two reactions of theregenerative part of the OPPP [Caillau and Quick, 2005; Debnam and Emes, 1999;Schnarrenberger et al., 1995], although this might differ between different plant tis-sues and species (for a discussion of this topic see Kruger and von Schaewen [2003]).To enable further metabolisation of the pentose phosphates produced in the cytosol,they have to be transported into plastids by XPTs or GPTs.
14

A second physiological function of XPTs might be the import of 1-deoxy--xylu-lose 5-phosphate (DOX5P) into plastids. This compound is the first metabolite ofthe plastid-localised DOXP pathway, which leads to the synthesis of various terpen-oids and isoprenoids. DOX5P is synthesised by the plastid-localised DOX5P synthasefrom glyceraldehyde-3-phosphate (GAP) and pyruvate [Eisenreich et al., 2001]. How-ever, it has been shown that the non-phosphorylated sugar 1-deoxy--xylulose (DX)is also incorporated into isoprenoids in plant cells. This is achieved by phosphoryla-tion of DX by a cytosolic DX kinase [Hemmerlin et al., 2006] followed by the importof DOX5P by the XPT [Flügge and Gao, 2005]. However, the physiological signifi-cance of this pathway in plant cells is still unclear. Although Xul5P and DOX5P arealso transported by the GPT1 of A. thaliana, XPTs are more effective in the trans-port of both metabolites since their activity is not competitively inhibited by Glc6P[Eicks et al., 2002]. We identified one or two XPT genes in most Spermatophytawhile they are lacking in some gymnosperms and, strikingly, in all grass species. Thereason for the absence of XPTs in Poaceae but not in other monocots is unclear.Most grass species, however, possess a high number of up to ten GPTs. Thus, it ispossible that some of these GPTs can compensate for the loss of the XPTs.
4.3 Plant genomes and pPT genesPlant genomes show a considerable gene redundancy; in other words, they possesslarge numbers of families of homologous genes. The pPTs also represent a smallfamily with significantly different number of genes in different species. Gene familiesarise from duplications of ancestral genes, either by small-scale duplications (SSDs)of one or a few genes, or by whole genome duplications (WGDs). Direct evidencefor ancient WGDs (or paleopolyploidy) is the presence of large duplicated regionswith a conserved gene order (syntenic regions) in all angiosperm genomes sequencedso far [Tiley et al., 2016]. Detailed analysis of plant genomes revealed more than 50ancient WGDs distributed across angiosperm phylogeny, with the oldest event evenpreceding the origin of the clade itself [Tank et al., 2015]. Thus, polyploidisationhas played an important role in angiosperm diversification and phylogeny [Soltiset al., 2009]. Each ancient genome duplication was followed by the loss of genes andwhole chromosomes, reducing the genome to a diploid state. However, the loss andretention of genes is a biased process with many duplicated genes lost again whileothers were retained leading to the growth of several gene families.In the pPT family, evidence for all three processes of SSDs, single gene losses and
WGDs are found. For example, the closely related species Populus trichocarpa andP. euphratica differ in the number of GPTs and XPTs (three GPT1, two GPT2,one XPT in P. trichocarpa; two GPT1, one GPT2, two XPT in P. euphratica),a pattern which can best be explained by species-specific gene duplications andlosses. In Brassicaceae, almost all species (including Arabidopsis lyrata) possess two(or more) GPT2 genes while A. thaliana has only one, indicating a loss of one ofthe genes in this species. There are several more examples of specific pPT geneduplications and losses, which cannot be discussed in detail here (see Table 1). Most
15

monocots possess a significantly higher number of pPTs than most of the dicots.The PPT sequences of the monocots split into two subgroups and the sequencesfrom Poaceae form another four subgroups (Suppl. Fig. S2). A similar topology ofthe phylogenetic tree is found in the monocot GPT sequences and the TPT sequencesfrom Poaceae (Suppl. Figs. S1 and S3). These different pPT subgroups are thereforemost likely derived from two ancient WGDs, one occurred close to the origin ofmonocots (130-170 Mya) and the other at the base of the Poaceae (70-80 Mya) [Soltiset al., 2009; Tank et al., 2015]. An interesting example is the autopolyploid speciesGlycine max, which seemed to have had a lineage specific WGD at about 13 Mya,after which most of the genes were retained [Tiley et al., 2016]. This WGD is alsoseen in the pPT family with most but not all pPT genes being duplicated comparedto G. soja (Table 1). Another example of an autopolyploid species is the hexaploidplant Camelina sativa, which, after a recent triplication of its genome [Kagale et al.,2014], possesses three times the number of pPT genes than the other Brassicaceae.In contrast to G. max and C. sativa, Brassica napus is an allotetraploid species,which is derived from hybridisation of B. oleracea and B. rapa. This is the reasonwhy the G. max genome contains more than twice as many pPT genes as most ofthe other Brassicaceae.As discussed above, all angiosperms are paleopolyploids. However, most of the
species possess only the basic number of pPT genes, which means that they havelost the additional copies after each WGD. In several species, there was only a slight(if any) reduction in the number of pPT genes after these WGDs, for example, inmany grasses and other monocots and in species of the genus Gossypium or Populus.Many of these species are important crop plants and are, hence, the result of longbreeding processes. A major goal in plant breeding is the improvement of yield byboth increasing productivity of photosynthesis (source strength) and storage capacity(sink strength). Plant metabolite transporters are crucial to source-sink metabolitetransport because they are involved in important steps such as export from andimport into plastids or phloem loading and unloading [Griffiths et al., 2016]. It hasbeen shown that the activity of the TPT has an effect on the source strength of leaves[Cho et al., 2012; Häusler et al., 2000b; Schneider et al., 2002]. In potato tubers, theGPT in cooperation with the plastid ATP transporter is a major determinant ofstarch synthesis and sink strength [Zhang et al., 2008]. These data suggest that thelarge number of pPTs in crop plants is connected to the improvement of their sourceand sink strength compared to their wild ancestors and thus is a direct outcome ofthe breeding process.In summary, our study provides a comprehensive overview about the number and
evolution of different pPTs in algae and land plants. Since the molecular and physiolo-gical functions of only a handful of pPT proteins in a few model plants have beendetermined in detail, this study could be the basis for a extensive analysis of thisimportant transporter family in many different plants.
16

ReferencesAmborella Genome Project (2013). The Amborella genome and the evolution offlowering plants. Science, 342(6165):1241089.
Andriotis, V. M. E., Pike, M. J., Bunnewell, S., Hills, M. J., and Smith, A. M.(2010). The plastidial glucose-6-phosphate/phosphate antiporter GPT1 is essentialfor morphogenesis in Arabidopsis embryos. Plant Journal, 64(1):128–139.
Athanasiou, K., Dyson, B. C., Webster, R. E., and Johnson, G. N. (2010). Dynamicacclimation of photosynthesis increases plant fitness in changing environments.Plant Physiology, 152(1):366–73.
Averill, R. H., Bailey-Serres, J., and Kruger, N. J. (1998). Co-operation betweencytosolic and plastidic oxidative pentose phosphate pathways revealed by 6-phosphogluconate dehydrogenase-deficient genotypes of maize. Plant Journal,14(4):449–457.
Ball, S. G., Colleoni, C., Cenci, U., Raj, J. N., and Tirtiaux, C. (2011). The evo-lution of glycogen and starch metabolism in eukaryotes gives molecular clues tounderstand the establishment of plastid endosymbiosis. Journal of ExperimentalBotany, 62(6):1775–1801.
Borchert, S., Harborth, J., Schünemann, D., Hoferichter, P., and Heldt, H. W. (1993).Studies of the enzymic capacities and transport properties of pea root plastids.Plant Physiology, 101(1):303–312.
Bouckaert, R., Heled, J., Kühnert, D., Vaughan, T., Wu, C.-H., Xie, D., Suchard,M. A., Rambaut, A., and Drummond, A. J. (2014). BEAST 2: A software platformfor Bayesian evolutionary analysis. PLoS Computational Biology, 10(4):e1003537.
Bölter, B. and Soll, J. (2001). Ion channels in the outer membranes of chloroplastsand mitochondria: open doors or regulated gates? The EMBO Journal, 20(5):935–40.
Caillau, M. and Quick, W. P. (2005). New insights into plant transaldolase. PlantJournal, 43(1):1–16.
Camacho, C., Coulouris, G., Avagyan, V., Ma, N., Papadopoulos, J., Bealer, K., andMadden, T. L. (2009). BLAST+: Architecture and applications. BMC Bioinfor-matics, 10:1–9.
Cardinal-McTeague, W. M., Sytsma, K. J., and Hall, J. C. (2016). Biogeographyand diversification of Brassicales: A 103 million year tale. Molecular Phylogeneticsand Evolution, 99:204–224.
Cavalier-Smith, T. (2000). Membrane heredity and early chloroplast evolution.Trends in Plant Science, 5(4):174–182.
17
Cho, M. H., Jang, A., Bhoo, S. H., Jeon, J. S., and Hahn, T. R. (2012). Ma-nipulation of triose phosphate/phosphate translocator and cytosolic fructose-1,6-bisphosphatase, the key components in photosynthetic sucrose synthesis, enhancesthe source capacity of transgenic Arabidopsis plants. Photosynthesis Research,111(3):261–268.
Cock, P. J. A., Antao, T., Chang, J. T., Chapman, B. A., Cox, C. J., Dalke, A., Fried-berg, I., Hamelryck, T., Kauff, F., Wilczynski, B., and de Hoon, M. J. L. (2009).Biopython: freely available Python tools for computational molecular biology andbioinformatics. Bioinformatics, 25(11):1422–3.
de Vries, J., Stanton, A., Archibald, J. M., and Gould, S. B. (2016). Streptophyteterrestrialization in light of plastid evolution. Trends in Plant Science, 21(6):467–476.
Debnam, P. M. and Emes, M. J. (1999). Subcellular distribution of enzymes ofthe oxidative pentose phosphate pathway in root and leaf tissues. Journal ofExperimental Botany, 50(340):1653–1661.
Delwiche, C. F. and Cooper, E. D. (2015). The evolutionary origin of a terrestrialflora. Current Biology, 25(19):R899–R910.
Dyson, B. C., Allwood, J. W., Feil, R., Xu, Y., Miller, M., Bowsher, C. G., Goodacre,R., Lunn, J. E., and Johnson, G. N. (2015). Acclimation of metabolism to lightin Arabidopsis thaliana: The glucose 6-phosphate/phosphate translocator GPT2directs metabolic acclimation. Plant, Cell and Environment, 38(7):1404–1417.
Edgar, R. C. (2004). MUSCLE: Multiple sequence alignment with high accuracyand high throughput. Nucleic Acids Research, 32(5):1792–1797.
Eicks, M., Maurino, V., Knappe, S., Flügge, U.-I., and Fischer, K. (2002). The plas-tidic pentose phosphate translocator represents a link between the cytosolic andthe plastidic pentose phosphate pathways in plants. Plant Physiology, 128(2):512–22.
Eisenreich, W., Rohdich, F., and Bacher, A. (2001). Deoxyxylulose phosphate path-way to terpenoids. Trends in Plant Science, 6(2):78–84.
Fischer, K. (2011). The import and export business in plastids: Transport processesacross the inner envelope membrane. Plant Physiology, 155(4):1511–1519.
Fischer, K., Arbinger, B., Kammerer, B., Busch, C., Brink, S., Wallmeier, H., Sauer,N., Eckerskorn, C., and Flügge, U.-I. (1994). Cloning and in vivo expression of func-tional triose phosphate/phosphate translocators from C3- and C4-plants: evidencefor the putative participation of specific amino acid residues in the recognition ofphosphoenolpyruvate. The Plant Journal, 5(2):215–26.
18

Fischer, K., Kammerer, B., Gutensohn, M., Arbinger, B., Weber, A. P. M., Häusler,R. E., and Flügge, U.-I. (1997). A new class of plastidic phosphate translocators:a putative link between primary and secondary metabolism by the phosphoenol-pyruvate/phosphate antiporter. The Plant Cell, 9(3):453–62.
Fischer, K., Weber, A. P. M., and Kunz, H. H. (2016). The transporters of plastids– new insights into an old field. In Kirchhoff, H., editor, Chloroplasts: Currentresearch and future trends, pages 207–238. Caister Academic Press.
Fißlthaler, B., Meyer, G., Bohnert, H. J., and Schmitt, J. M. (1995). Age-dependentinduction of pyruvate, orthophosphate dikinase in Mesembryanthemum crys-tallinum L. Planta, 196(3):492–500.
Flügge, U.-I. (1999). Phosphate translocators in plastids. Annual Review of PlantPhysiology and Plant Molecular Biology, 50:27–45.
Flügge, U.-I., Fischer, K., Gross, A., Sebald, W., Lottspeich, F., and Eckerskorn,C. (1989). The triose phosphate-3-phosphoglycerate-phosphate translocator fromspinach chloroplasts: nucleotide sequence of a full-length cDNA clone and importof the in vitro synthesized precursor protein into chloroplasts. The EMBO Journal,8(1):39–46.
Flügge, U.-I. and Gao, W. (2005). Transport of isoprenoid intermediates acrosschloroplast envelope membranes. Plant Biology, 7(1):91–7.
Flügge, U.-I., Häusler, R. E., Ludewig, F., and Fischer, K. (2003). Functional geno-mics of phosphate antiport systems of plastids. Physiologia Plantarum, 118(4):475–482.
Frugoli, J. A., McPeek, M. A., Thomas, T. L., and McClung, C. R. (1998). Intronloss and gain during evolution of the catalase gene family in angiosperms. Genetics,149(1):355–65.
Gibbs, S. P. (1978). The chloroplasts of Euglena may have evolved from symbioticgreen algae. Canadian Journal of Botany, 56(22):2883–2889.
Gould, S. B., Maier, U. G., and Martin, W. F. (2015). Protein import and the originof red complex plastids. Current Biology, 25(12):R515–R521.
Griffiths, C. A., Paul, M. J., and Foyer, C. H. (2016). Metabolite transport and asso-ciated sugar signalling systems underpinning source/sink interactions. Biochimicaet Biophysica Acta - Bioenergetics, 1857(10):1715–1725.
Hedhly, A., Vogler, H., Schmid, M. W., Pazmino, D., Gagliardini, V., Santelia, D.,and Grossniklaus, U. (2016). Starch turnover and metabolism during flower andearly embryo development. Plant Physiology, 172(4):2388–2402.
19

Hemmerlin, A., Tritsch, D., Hartmann, M., Pacaud, K., Hoeffler, J.-F., van Dors-selaer, A., Rohmer, M., and Bach, T. J. (2006). A cytosolic Arabidopsis -xylulosekinase catalyzes the phosphorylation of 1-deoxy--xylulose into a precursor of theplastidial isoprenoid pathway. Plant Physiology, 142(2):441–57.
Hori, K., Maruyama, F., Fujisawa, T., Togashi, T., Yamamoto, N., Seo, M., Sato,S., Yamada, T., Mori, H., Tajima, N., Moriyama, T., Ikeuchi, M., Watanabe, M.,Wada, H., Kobayashi, K., Saito, M., Masuda, T., Sasaki-Sekimoto, Y., Mashiguchi,K., Awai, K., Shimojima, M., Masuda, S., Iwai, M., Nobusawa, T., Narise, T.,Kondo, S., Saito, H., Sato, R., Murakawa, M., Ihara, Y., Oshima-Yamada, Y.,Ohtaka, K., Satoh, M., Sonobe, K., Ishii, M., Ohtani, R., Kanamori-Sato, M.,Honoki, R., Miyazaki, D., Mochizuki, H., Umetsu, J., Higashi, K., Shibata, D.,Kamiya, Y., Sato, N., Nakamura, Y., Tabata, S., Ida, S., Kurokawa, K., and Ohta,H. (2014). Klebsormidium flaccidum genome reveals primary factors for plantterrestrial adaptation. Nature Communications, 5(May):3978.
Hu, B., Jin, J., Guo, A.-Y., Zhang, H., Luo, J., and Gao, G. (2015). GSDS 2.0: anupgraded gene feature visualization server. Bioinformatics, 31(8):1296–7.
Häusler, R. E., Baur, B., Scharte, J., Teichmann, T., Eicks, M., Fischer, K. L.,Flügge, U.-I., Schubert, S., Weber, A. P. M., and Fischer, K. (2000a). Plas-tidic metabolite transporters and their physiological functions in the induciblecrassulacean acid metabolism plant Mesembryanthemum crystallinum. The PlantJournal, 24(3):285–96.
Häusler, R. E., Schlieben, N. H., Nicolay, P., Fischer, K., Fischer, K. L., and Flügge,U.-I. (2000b). Control of carbon partitioning and photosynthesis by the triose phos-phate/phosphate translocator in transgenic tobacco plants (Nicotiana tabacum l.).I. comparative physiological analysis of tobacco plants with antisense repressionand overexpression of t. Planta, 210(3):371–82.
Kagale, S., Koh, C., Nixon, J., Bollina, V., Clarke, W. E., Tuteja, R., Spillane, C.,Robinson, S. J., Links, M. G., Clarke, C., Higgins, E. E., Huebert, T., Sharpe,A. G., and Parkin, I. A. P. (2014). The emerging biofuel crop Camelina sativaretains a highly undifferentiated hexaploid genome structure. Nature Communic-ations, 5:3706.
Kammerer, B., Fischer, K., Hilpert, B., Schubert, S., Gutensohn, M., Weber, A.P. M., and Flügge, U.-I. (1998). Molecular characterization of a carbon trans-porter in plastids from heterotrophic tissues: The glucose 6-phosphate/phosphateantiporter. The Plant Cell, 10(1):105–117.
Knappe, S., Flügge, U.-I., and Fischer, K. (2003a). Analysis of the plastidic phos-phate translocator gene family in Arabidopsis and identification of new phos-phate translocator-homologous transporters, classified by their putative substrate-binding site. Plant Physiology, 131(3):1178–90.
20

Knappe, S., Löttgert, T., Schneider, A., Voll, L. M., Flügge, U.-I., and Fischer,K. (2003b). Characterization of two functional phosphoenolpyruvate/phosphatetranslocator (PPT) genes in Arabidopsis – AtPPT1 may be involved in the provi-sion of signals for correct mesophyll development. Plant Journal, 36(3):411–420.
Kofler, H., Häusler, R. E., Schulz, B., Gröner, F., Flügge, U.-I., and Weber, A. P. M.(2000). Molecular characterisation of a new mutant allele of the plastid phospho-glucomutase in Arabidopsis, and complementation of the mutant with the wild-type cDNA. Molecular & General Genetics, 263(6):978–86.
Kruger, N. J. and von Schaewen, A. (2003). The oxidative pentose phosphate path-way: Structure and organisation. Current Opinion in Plant Biology, 6(3):236–246.
Kunz, H. H., Häusler, R. E., Fettke, J., Herbst, K., Niewiadomski, P., Gierth, M.,Bell, K., Steup, M., Flügge, U.-I., and Schneider, A. (2010). The role of plastidialglucose-6-phosphate/phosphate translocators in vegetative tissues of Arabidopsisthaliana mutants impaired in starch biosynthesis. Plant Biology, 12(Suppl. 1):115–28.
Le, S. Q. and Gascuel, O. (2008). An improved general amino acid replacementmatrix. Molecular Biology and Evolution, 25(7):1307–20.
Lee, Y., Nishizawa, T., Takemoto, M., Kumazaki, K., Yamashita, K., Hirata, K.,Minoda, A., Nagatoishi, S., Tsumoto, K., Ishitani, R., and Nureki, O. (2017).Structure of the triose-phosphate/phosphate translocator reveals the basis of sub-strate specificity. Nature Plants, 3(10):825–832.
Leliaert, F., Smith, D. R., Moreau, H., Herron, M. D., Verbruggen, H., Delwiche,C. F., and De Clerck, O. (2012). Phylogeny and molecular evolution of the greenalgae. Critical Reviews in Plant Sciences, 31(1):1–46.
Leliaert, F., Verbruggen, H., and Zechman, F. W. (2011). Into the deep: New dis-coveries at the base of the green plant phylogeny. Bioessays, 33(9):683–692.
Lemieux, C., Otis, C., and Turmel, M. (2014). Six newly sequenced chloroplastgenomes from prasinophyte green algae provide insights into the relationshipsamong prasinophyte lineages and the diversity of streamlined genome architecturein picoplanktonic species. BMC Genomics, 15(1):1–20.
Li, Y., Darley, C. P., Ongaro, V., Fleming, A., Schipper, O., Baldauf, S. L., andMcQueen-Mason, S. J. (2002). Plant expansins are a complex multigene familywith an ancient evolutionary origin. Plant Physiology, 128(3):854–64.
Linka, M., Jamai, A., and Weber, A. P. M. (2008). Functional characterization of theplastidic phosphate translocator gene family from the thermo-acidophilic red algaGaldieria sulphuraria reveals specific adaptations of primary carbon partitioningin green plants and red algae. Plant Physiology, 148(3):1487–96.
21

Martin, W. F. and Kowallik, K. (1999). Annotated English translation of Meresch-kowsky’s 1905 paper ‘Über Natur und Ursprung der Chromatophoren im Pflan-zenreiche’. European Journal of Phycology, 34(3):287–295.
Mereschkowsky, C. (1905). Über Natur und Ursprung der Chromatophoren im Pflan-zenreiche. Biologisches Centralblatt, 25(18).
Moog, D., Rensing, S. A., Archibald, J. M., Maier, U. G., and Ullrich, K. K. (2015).Localization and evolution of putative triose phosphate translocators in the diatomPhaeodactylum tricornutum. Genome Biology and Evolution, 7(11):2955–2969.
Niewiadomski, P., Knappe, S., Geimer, S., Fischer, K., Schulz, B., Unte, U. S., Rosso,M. G., Ache, P., Flügge, U.-I., and Schneider, A. (2005). The Arabidopsis plastidicglucose 6-phosphate/phosphate translocator GPT1 is essential for pollen matura-tion and embryo sac development. The Plant Cell, 17(3):760–75.
Pombert, J. F., Blouin, N. A., Lane, C., Boucias, D., and Keeling, P. J. (2014). Alack of parasitic reduction in the obligate parasitic green alga Helicosporidium.PLoS Genetics, 10(5).
Prabhakar, V., Löttgert, T., Geimer, S., Dörmann, P., Krüger, S., Vijayakumar, V.,Schreiber, L., Göbel, C., Feussner, K., Feussner, I., Marin, K., Staehr, P., Bell,K., Flügge, U.-I., and Häusler, R. E. (2010). Phosphoenolpyruvate provision toplastids is essential for gametophyte and sporophyte development in Arabidopsisthaliana. The Plant Cell, 22(8):2594–617.
Prabhakar, V., Löttgert, T., Gigolashvili, T., Bell, K., Flügge, U.-I., and Häusler,R. E. (2009). Molecular and functional characterization of the plastid-localizedphosphoenolpyruvate enolase (ENO1) from Arabidopsis thaliana. FEBS Letters,583(6):983–991.
Price, D. C., Chan, C. X., Yoon, H. S., Yang, E. C., Qiu, H., Weber, A. P. M.,Schwacke, R., Gross, J., Blouin, N. A., Lane, C., Reyes-Prieto, A., Durnford, D. G.,Neilson, J. A. D., Lang, B. F., Burger, G., Steiner, J. M., Löffelhardt, W., Meuser,J. E., Posewitz, M. C., Ball, S. G., Arias, M. C., Henrissat, B., Coutinho, P. M.,Rensing, S. A., Symeonidi, A., Doddapaneni, H., Green, B. R., Rajah, V. D.,Boore, J., and Bhattacharya, D. (2012). Cyanophora paradoxa genome elucidatesorigin of photosynthesis in algae and plants. Science, 335(6070):843–7.
Redelings, B. D. and Suchard, M. A. (2007). Incorporating indel information intophylogeny estimation for rapidly emerging pathogens. BMC Evolutionary Biology,7:40.
Reyes-Prieto, A., Weber, A. P. M., and Bhattacharya, D. (2007). The origin andestablishment of the plastid in algae and plants. Annual Review of Genetics,41(1):147–168.
22

Rogozin, I. B., Carmel, L., Csuros, M., and Koonin, E. V. (2012). Origin and evolu-tion of spliceosomal introns. Biology Direct, 7:11.
Rolletschek, H., Nguyen, T. H., Häusler, R. E., Rutten, T., Göbel, C., Feussner, I.,Radchuk, R., Tewes, A., Claus, B., Klukas, C., Linemann, U., Weber, H., Wo-bus, U., and Borisjuk, L. (2007). Antisense inhibition of the plastidial glucose-6-phosphate/phosphate translocator in Vicia seeds shifts cellular differentiation andpromotes protein storage. Plant Journal, 51(3):468–484.
Ruhfel, B. R., Gitzendanner, M. A., Soltis, P. S., Soltis, D. E., and Burleigh, J. G.(2014). From algae to angiosperms – inferring the phylogeny of green plants(Viridiplantae) from 360 plastid genomes. BMC Evolutionary Biology, 14:23.
Schnarrenberger, C., Flechner, A., and Martin, W. F. (1995). Enzymatic evidence fora complete oxidative pentose phosphate pathway in chloroplasts and an incompletepathway in the cytosol of spinach leaves. Plant Physiology, 108(2):609–614.
Schneider, A., Häusler, R. E., Kolukisaoglu, �., Kunze, R., van der Graaff, E.,Schwacke, R., Catoni, E., Desimone, M., and Flügge, U.-I. (2002). An Arabidopsisthaliana knock-out mutant of the chloroplast triose phosphate/phosphate translo-cator is severely compromised only when starch synthesis, but not starch mobili-sation is abolished. Plant Journal, 32(5):685–699.
Simmons, M. P., Bachy, C., Sudek, S., Van Baren, M. J., Sudek, L., Ares, M., andWorden, A. Z. (2015). Intron invasions trace algal speciation and reveal nearlyidentical arctic and antarctic micromonas populations. Molecular Biology andEvolution, 32(9):2219–2235.
Soltis, D. E., Albert, V. A., Leebens-Mack, J., Bell, C. D., Paterson, A. H., Zheng, C.,Sankoff, D., DePamphilis, C. W., Wall, P. K., and Soltis, P. S. (2009). Polyploidyand angiosperm diversification. American Journal of Botany, 96(1):336–348.
Staehr, P., Löttgert, T., Christmann, A., Krueger, S., Rosar, C., Rolčík, J., Novák,O., Strnad, M., Bell, K., Weber, A. P. M., Flügge, U.-I., and Häusler, R. E. (2014).Reticulate leaves and stunted roots are independent phenotypes pointing at op-posite roles of the phosphoenolpyruvate/phosphate translocator defective in cue1in the plastids of both organs. Frontiers in Plant Science, 5(April):126.
Stitt, M. and ap Rees, T. (1979). Capacities of pea chloroplasts to catalyse theoxidative pentose phosphate pathway and glycolysis. Phytochemistry, 18(12):1905–1911.
Streatfield, S. J., Weber, A. P. M., Kinsman, E. A., Häusler, R. E., Li, J., Post-Beittenmiller, D., Kaiser, W. M., Pyke, K. A., Flügge, U.-I., and Chory, J. (1999).The phosphoenolpyruvate/phosphate translocator is required for phenolic meta-bolism, palisade cell development, and plastid-dependent nuclear gene expression.The Plant Cell, 11(9):1609–22.
23

Suchard, M. A. and Redelings, B. D. (2006). BAli-Phy: simultaneous Bayesianinference of alignment and phylogeny. Bioinformatics, 22(16):2047–8.
Tank, D. C., Eastman, J. M., Pennell, M. W., Soltis, P. S., Soltis, D. E., Hinchliff,C. E., Brown, J. W., Sessa, E. B., and Harmon, L. J. (2015). Nested radiationsand the pulse of angiosperm diversification: increased diversification rates oftenfollow whole genome duplications. The New Phytologist, 207(2):454–67.
The Arabidopsis Genome Initiative (2000). Analysis of the genome sequence of theflowering plant Arabidopsis thaliana. Nature, 408(6814):796–815.
Tiley, G. P., Ané, C., and Burleigh, J. G. (2016). Evaluating and characterizing an-cient whole-genome duplications in plants with gene count data. Genome Biologyand Evolution, 8(4):1023–37.
Voll, L., Häusler, R. E., Hecker, R., Weber, A. P. M., Weissenböck, G., Fiene, G.,Waffenschmidt, S., and Flügge, U.-I. (2003). The phenotype of the Arabidopsiscue1 mutant is not simply caused by a general restriction of the shikimate pathway.Plant Journal, 36(3):301–317.
Wang, H., Devos, K. M., and Bennetzen, J. L. (2014). Recurrent loss of specificintrons during angiosperm evolution. PLoS Genetics, 10(12).
Weber, A. P. M. (2004). Solute transporters as connecting elements between cytosoland plastid stroma. Current Opinion in Plant Biology, 7(3):247–253.
Weber, A. P. M. and Fischer, K. (2007). Making the connections – the crucial roleof metabolite transporters at the interface between chloroplast and cytosol. FEBSLetters, 581(12):2215–2222.
Weber, A. P. M., Linka, M., and Bhattacharya, D. (2006). Single, ancient origin of aplastid metabolite translocator family in Plantae from an endomembrane-derivedancestor. Eukaryotic Cell, 5(3):609–12.
Wessler, S. R., Bureau, T. E., and White, S. E. (1995). LTR-retrotransposons andMITEs: important players in the evolution of plant genomes. Current Opinion inGenetics and Development, 5(6):814–21.
Whelan, S., Goldman, N., Wheland, S., and Goldman, N. (2001). A general empiricalmodel of protein evolution derived from multiple protein families using a maximum-likelihood approach. Molecular Biology and Evolution, 18(5):691–9.
Wojciechowski, M. F., Lavin, M., and Sanderson, M. J. (2004). A phylogenyof legumes (Leguminosae) based on analysis of the plastid matK gene resolvesmany well-supported subclades within the family. American Journal of Botany,91(11):1846–1862.
24

Yoon, H. S., Hackett, J. D., Ciniglia, C., Pinto, G., and Bhattacharya, D. (2004). Amolecular timeline for the origin of photosynthetic eukaryotes. Molecular Biologyand Evolution, 21(5):809–818.
Yoon, H. S., Hackett, J. D., Pinto, G., and Bhattacharya, D. (2002). The single, an-cient origin of chromist plastids. Proceedings of the National Academy of Sciences,99(24):15507–12.
Zhang, L., Häusler, R. E., Greiten, C., Hajirezaei, M. R., Haferkamp, I., Neuhaus,H. E., Flügge, U.-I., and Ludewig, F. (2008). Overriding the co-limiting import ofcarbon and energy into tuber amyloplasts increases the starch content and yieldof transgenic potato plants. Plant Biotechnology Journal, 6(5):453–464.
AcknowledgementsWe thank Toni I. Gossmann for helpful comments on this manuscript. The compu-tations were performed on resources provided by UNINETT Sigma2—the NationalInfrastructure for High Performance Computing and Data Storage in Norway.
25


Figure and table legends
Figure 1 – Phylogenetic trees of the four groups of pPTs from all species of Strepto-phyta analysed in this study. pPT subfamilies as mentioned in the text are writtenin bold. The scale bar shows the evolutionary distance. Complete phylogenetic treesincluding species names are shown in supplementary figures S1 to S4.
27

28

Figure 2 – Phylogenetic trees of the four subfamilies of pPTs from all species ofStreptophyta analysed in this study. pPT subfamilies as mentioned in the text arewritten in bold. The scale bar shows the evolutionary distance. Complete phyloge-netic trees including species names are shown in supplementary figures S1 to S4.
29

30

Figure 3 – Cladogram of Viridiplantae showing important events in the phylogenyof the pPT family. Position of events in the cladogram are deduced from the presenceor absence of any given transporter subfamily in the analysed species. Transportersubfamilies are abbreviated to their first letter with the group given as number. Nine-pointed stars indicate the first occurrence of a subfamily or group, five-pointed starsindicate a gene duplication, and a triangle the loss of a gene. As the exact phylogenyof the groups in the GPT subfamily could not be determined in this work, the “loss”of one GPT group and the concurrent “occurrence” of another group is indicatedwith a hexagon as transition from one to the other group.
31

Figure 4 – Phylogenetic tree of pPTs from algae. pPT sequences of two speciesof Streptophyta (A. thaliana, K. flaccidum) are included. The scale bar shows theevolutionary distance.
32

Figure 5 – Schematic visualisation of introns in the pPT genes. The horizontallines represent the pPT sequences, whereas coloured boxes indicate the positionsof introns. The consensus sequences show the conserved intron positions found inalmost all Streptophyta. The introns are numbered according to their position inthe consensus sequence. The figure does not shown gaps in the sequence. Largertaxonomic clades are indicated for orientation, where GA is green algae and RA isred algae. If multiple transporters exist in a species, the depicted gene is furtherdefined by the number of the family and a letter indicating the specific gene asused in Supplementary Table S1. Introns depicted in darker shades are at the samepositions as in the consensus sequence while introns in lighter shades are not foundin the consensus sequence. The multiple sequence alignment with intron positionson which this figure is based on is available as supplementary figure S5.
33

Table 1 – The number of pPT proteins in Streptophyta. GPTs in groups 4 to 6 arewritten centred between the columns of GPT1 and GPT2. Occurrences of GPT3 arewritten in italics with grey background in the GPT2 column. Larger taxonomic cladesare indicated for orientation. An extended version with algae and more detailedtaxonomic information is given in supplementary table S2.
34

Supplementary figures and tables
Supplementary Figure S1 – Detailed view of the TPT phylogeny. Subfamiliesas mentioned in the text are written in bold. The scale bar shows the evolutionarydistance.
35

Supplementary Figure S2 – Detailed view of the PPT phylogeny. Subfamiliesas mentioned in the text are written in bold. The scale bar shows the evolutionarydistance.
36

Supplementary Figure S3 – Detailed view of the GPT phylogeny. Subfamiliesas mentioned in the text are written in bold. The scale bar shows the evolutionarydistance.
37

Supplementary Figure S4 – Detailed view of the XPT phylogeny. The scale barshows the evolutionary distance.
38

Supplementary Figure S5 – Multiple sequence alignment of pPT sequences ofViridiplantae with intron positions.
Supplementary Table S1 – Complete list of protein sequences. Given are theNCBI accessions, the plant species, the pPT subfamilies, and a letter indicating thespecific gene, if necessary.
Supplementary Table S2 – Comprehensive list of the number of pPTs in eachspecies.
39

Paper III Bockwoldt, M., Houry, D., Niere, M., Gossmann, T.I., Ziegler, M. & Heiland, I.
NamPRT and NNMT – evolutionary and kinetic drivers of NAD-dependent signalling
(Manuscript)
Now published as:
Bockwoldt, M., Houry, D., Niere, M., Gossmann, T.I., Reinartz, I., Schug, A. Ziegler, M. & Heiland, I. (2019). Identification of evolutionary and kinetic drivers of NAD-dependent signaling. Proceedings of the National Academy of Sciences, 116(32), 15957-15966, available at https://doi.org/10.1073/pnas.1902346116.

NamPRT and NNMT – evolutionaryand kinetic drivers of NAD-dependentsignallingMathias Bockwoldt1, Dorothée Houry2, Marc Niere2, Toni I. Gossmann3, MathiasZiegler2, and Ines Heiland1,§
1Department of Arctic and Marine Biology, UiT The Arctic University of Norway,Biologibygget, Framstredet 39, 9017 Tromsø, Norway2Department of Biomedicine, University of Bergen, Jonas Lies Vei 91, 5020 Bergen,Norway3Department of Animal and Plant Sciences, Western Bank, University of Sheffield,Sheffield, S10 2TN, United Kingdom§ Corresponding author: [email protected]
SummaryNAD is best known as cofactor in redox reactions, but it is also substrate of NAD-dependent signalling reactions that consume NAD and release nicotinamide (Nam).Two different Nam salvage pathways exist. We conducted extensive phylogeneticanalyses of these pathways and show that in lower organisms the initial deamida-tion of Nam is prevalent, whilst the direct conversion of Nam to the mononucleotideby Nam phosphoribosyltransferase (NamPRT) dominates in animals and eventuallyremains as the single Nam recycling route in vertebrates. Strikingly, loss of the deam-idation pathway in early vertebrates is preceded by the emergence of a new enzymethat marks Nam for excretion by methylation – nicotinamide N-methyltransferase(NNMT). Paradoxically, the occurrence of this Nam degrading enzyme is paralleledby a diversification of NAD dependent signalling enzymes in vertebrates.To better understand these evolutionary changes and the role of NNMT for NAD
metabolism, we built a mathematical model of the pathway using available enzymekinetics data. Our simulations indicate that NNMT is required to maintain highNAD consumption fluxes, thereby enabling diversification of the NAD-dependentsignalling pathways. This kinetic regulation requires and explains the unusually highsubstrate affinity of the key enzyme for Nam salvage, NamPRT. Moreover, we sug-gest that NNMT exerted evolutionary pressure on NamPRT, enforcing the develop-ment of its high substrate affinity. Using multiple sequence alignments, we identifieda sequence insertion first occurring in vertebrates that parallels an experimentallyverified increase in the substrate affinity of the enzyme. Additional simulations showthat the deamidation pathway became obsolete owing to the high substrate affin-
1

ity of NamPRT. Collectively, our results illustrate a close evolutionary relationshipbetween NAD biosynthesis and the diversification of NAD-dependent signalling path-ways, potentially driven by the concomitant occurrence of a regulator of Nam salvage,NNMT.
1 IntroductionNAD metabolism represents one of the most critical links that connect cellular sig-nal transduction and energy metabolism. Even though it is best known as cofactorfor various redox-reactions, NAD is involved in a number of signalling processesthat consume NAD+ by cleaving the molecule to nicotinamide (Nam) and ADP-ribose [Verdin, 2015]. These NAD-dependent signalling reactions include poly- andmono-ADP-ribosylation [Bütepage et al., 2015; De Vos et al., 2012], NAD-dependentprotein deacylation by sirtuins [Osborne et al., 2016], and the synthesis of calcium-mobilizing molecules such as cyclic ADP-ribose [Lee, 2012]. These NAD-dependentsignalling processes participate in the regulation of virtually all cellular activities.The enzymes involved in these processes are sensitive to the available NAD concen-tration [Ruggieri et al., 2015], which in turn is dependent on the NAD+/NADH redoxratio. Therefore, NAD-dependent signalling can act as a transmitter of changes in thecellular energy homeostasis, for example, to regulate gene expression or metabolicactivity [Koch-Nolte et al., 2009].The significance of NAD-dependent signalling for NAD homeostasis has long been
underestimated. It has now been established, however, that substances affectingNAD biosynthesis lead to a rapid decline of the NAD concentration [Buonvicinoet al., 2018]. This suggests that NAD-dependent signalling reactions consume sub-stantial amounts of NAD. Therefore, we later refer to them also as NAD-consumingreactions. The resulting NAD turnover differs in a cell-type-specific manner andcan lead to an NAD half-life as short as two hours [Liu et al., 2018]. To maintainthe NAD concentration at physiological levels, NAD biosynthesis needs to act atan equally rapid rate. Imbalances in NAD homeostasis have been linked to variousmainly age related diseases, such as diabetes, neurodegenerative disorders, and can-cer [Chiarugi et al., 2012; Verdin, 2015]. Several recent studies have demonstratedimpressive health benefits of dietary supplementation with intermediates of NAD bio-synthesis including Nam mononucleotide (NMN) and Nam riboside (NR) [Yoshinoet al., 2018]. Apparently, the exploitation of NAD biosynthetic routes, in additionto the use of nicotinamide as precursor (fig. 1), results in increased NAD concen-trations that stimulate NAD-dependent signalling processes, in particular, proteindeacetylation by sirtuins [North and Verdin, 2004].Due to the constant release of Nam through NAD-consuming signalling reac-
tions, the NAD salvage pathway using Nam as precursor is the most importantNAD synthesis pathway. If Nam were not continuously recycled into NAD, humanswould require a much higher daily vitamin B3 intake than the 16mg that are thecurrent daily recommendation [Commission of European Communities, 2008]. Two
2

principal pathways exist that recycle Nam. Firstly, vertebrates use a direct two-step pathway starting with the conversion of Nam into the mononucleotide NMNby the Nam phosphoribosyltransferase (NamPRT) using phosphoribosyl pyrophos-phate (PRPP) as co-substrate. The nearly complete recycling of Nam by NamPRT isachieved by an extraordinary high substrate affinity to Nam, theKM being in the lownanomolar range [Burgos and Schramm, 2008]. This appears to be mediated by anATP-dependent phosphorylation of a histidine residue in the catalytic core [Burgoset al., 2009]. Despite the importance of its salvage, Nam can also be marked for ex-cretion by methylation. The presence of nicotinamide N-methyltransferase (NNMT)in vertebrates [Gossmann et al., 2012] is among the most enigmatic and counterintu-itive features of NAD metabolism. While NamPRT is seemingly optimised to recycleeven the faintest amounts of Nam back into NAD synthesis, NNMT seems to haveno metabolic function other than to remove Nam from NAD metabolism. It has beensuggested that the process potentially acts as a metabolic methylation sink [Pissios,2017].Secondly, in most prokaryotes as well as in plants and fungi, a pathway consisting
of four steps starting with the deamidation of Nam to nicotinic acid (NA) by theNam deamidase (NADA) is used. (fig. 1). The three enzymes that act after NADAbelong to the Preiss-Handler pathway that also exists in vertebrates. NA is convertedinto the corresponding mononucleotide (NAMN), in a reactions performed by theNA-specific phosphoribosyltransferase NAPRT. The conversion of both mononuc-leotides, NMN and NAMN, into their corresponding dinucleotides, NAD and NAAD,is catalysed by the Nam/NA adenylyltransferases (NMNATs) that are essential in allorganisms [de Figueiredo et al., 2011]. The recycling pathway via NA finally requiresre-amidation of NAAD by NAD synthase. This final reaction includes an enzymeadenylation step that consumes ATP. Therefore, the Nam recycling by NADA is en-ergetically less efficient under normal conditions than the recycling pathway startingwith NamPRT.We and others have earlier shown that the two pathway co-exists in some eu-
karyotes [Carneiro et al., 2013; Gossmann et al., 2012], as well as in some bacterialspecies [Gazzaniga et al., 2009]. But why we observe such a scattered distribution ofthe two pathways is still unknown. We furthermore have little understanding of thephysiological role of NNMT and its impact on NAD-metabolism so far.As earlier analyses have been limited by the few eukaryotic genomes available at
the time, we here performed a comprehensive phylogenetic analysis of the NAD path-ways using 793 eukaryotic and 7892 prokaryotic genomes. Our results suggest thatthere has been a selection for the co-existence of NamPRT and NNMT in deutero-stomes, while the deamidation pathway, which is dominant in bacteria, is lost. Thistransition was accompanied by a marked increase in the number of NAD-consumingsignalling enzymes. Mathematical modelling of the pathway revealed an unexpectedpositive kinetic role of NNMT in the maintenance of high NAD-consuming signallingfluxes, preventing accumulation of inhibitory Nam. In addition, the model predictsthat NNMT likely exerted an evolutionary pressure on NamPRT to develop a highaffinity towards its substrate Nam. Indeed, we identified a short sequence insertion
3

in NamPRT, which first occurs in Deuterostomes and that appears to modulatethe affinity of NamPRT. Simulating the resource competition, we furthermore showthat the presence of high affinity NamPRT together with NNMT makes the NADA-dependent pathway obsolete.Taken together, our analyses suggest that the co-existence of NamPRT and NNMT
has been a prerequisite to enable the evolutionary development of versatile NAD-dependent signalling mechanisms present in vertebrates.
2 Experimental Procedures2.1 Phylogenetic AnalysisFunctionally verified sequences of NNMT, NADA, NamPRT, and NAD-consumingenzymes were used (suppl. table S1) as sequence templates for a Blastp analysisagainst the NCBI non-redundant protein sequence database. Blastp parameters wereset to yield maximum 20 000 target sequences, using the BLOSUM62 matrix with aword size of 6 and gap opening and extension costs of 11 and 1, respectively. Low-complexity filtering was disabled. To prevent cross-hits, a matrix was created inwhich the lowest e-values were given at which Blast yielded the same result for eachquery protein pair. With help of the matrix, the e-value cut-off was set to 1e-30 forall enzymes. To further prevent false positives, a minimal length limit was set basedon a histogram of the hit lengths found for each query protein, excluding peaks muchlower than the total protein length. Length limits are given in supplementary table S1.In addition, obvious sequence contaminations were removed by manual inspectionof the results. The taxonomy IDs of the species for each enzyme was derived fromthe accession2taxonomy database provided by NCBI. Scripts for creating, analysing,and visualising the phylogenetic tree were written in Python 3.5, using the ETE3toolkit [Huerta-Cepas et al., 2016].
2.2 Dynamic modellingKinetic parameters (substrate affinity (KM) and turnover rates (kcat), substrate andproduct inhibitions) were retrieved from the enzyme database BRENDA and ad-ditionally evaluated by checking the original literature especially with respect tomeasurement conditions. Parameter values from mammals were used if available.For enzymes not present in mammals, values from yeast were integrated. The fulllist of kinetic parameters including reference to original literature can be found insupplementary table S2. For NMNAT, the previously developed rate law for substratecompetition was used [Schäuble et al., 2013]. Otherwise, Henri-Michaelis-Menten ki-netics were applied for all reactions except the import and efflux of Nam, whichwere simulated using constant flux and mass action kinetics, respectively. Steadystate calculation and parameter scan tasks provided by COPASI 4.24 [Hoops et al.,
4

2006] were used for all simulations. The model will be available at the Biomodelsdatabase upon publication. Related figures were generated using Gnuplot 5.0.
2.3 Generation of expression vectors encoding wild-type andmutant human NamPRT
For eukaryotic expression with a C-terminal FLAG-epitope, the open reading frame(ORF) encoding human NamPRT was inserted into pFLAG-CMV-5a (Merck - SigmaAldrich) via EcoRI/BamHI sites. Using a PCR approach, this vector provided thebasis for the generation of a plasmid encoding a NamPRT deletion mutant lack-ing amino acid residues 42-51 (∆42-51 NamPRT). For prokaryotic expression withan N-terminal 6xHis-tag, the wild-type and mutant ORFs were inserted into pQE-30 (Qiagen) via BamHI and PstI-sites. All cloned sequences were verified by DNAsequence analysis.
2.4 Transient transfection, immunocytochemistry, and confocallaser scanning microscopy
HeLa S3 cells cultivated in Ham’s F12 medium supplemented with 10% (v/v) FCS,2mM L-glutamine, and penicillin/streptomycin, were seeded on cover slips in a 24well plate. After one day, cells were transfected using Effectene transfection reagent(Qiagen) according to the manufacturer’s recommendations. Cells were fixed with4% paraformaldehyde in PBS 24 hours post transfection, permeabilised (0.5% (v/v)Triton X-100 in PBS) and blocked for one hour with complete culture medium.After overnight incubation with primary FLAG-antibody (mouse M2, Sigma-Aldrich)diluted 1:2500 in complete medium, cells were washed and incubated for one hourwith secondary AlexaFluor 594-conjugated goat anti mouse antibody (ThermoFisher,Invitrogen) diluted 1:1000 in complete culture medium. Nuclei were stained withDAPI and the cells washed. The cover slips were mounted on microscope slides usingProLong Gold (ThermoFisher, Invitrogen). Confocal laser scan imaging of cells wasperformed using a Leica TCS SP8 STED 3x microscope equipped with a 100x oilimmersion objective (numerical aperture 1.4).
2.5 Purification of NamPRTThe cells were harvested by centrifugation and resuspended in lysis buffer (20mMTris-HCl pH 8.0, 500mM NaCl, 4mM dithiothreitol (DTT), 1mg/mL lysozyme, 1XComplete EDTA-free protease inhibitor cocktail (Roche)). After sonification, thelysate was centrifuged for 30min at 13000 g, and the clear lysate was incubatedwith 2mL of Nickel-NTA resin (Qiagen). Non-specific protein binding was removedwith washing buffer (20mM Tris-HCl pH 8.0, 500mM NaCl, 1mM DTT, 20mMimidazole). The protein was eluted with 2.5mL of elution buffer (20 mMTris-HClpH 8.0, 500mM NaCl, 300mM imidazole).
5

The eluted protein was immediately subjected to size exclusion chromatography(SEC) on an ÄKTA pure system (GE Healthcare) and loaded onto a HiLoad 16/60Superdex 200 pg column (GE Healthcare), run at a flow rate of 1mL/min with SECbuffer (20mM Tris-HCl pH 8.0, 500mM NaCl). Fractions corresponding to the sizeof recombinant protein were pooled and used for enzymatic assay. The purity andsize of the protein were assessed by SDS-PAGE.
2.6 Enzymatic Assay2 µM of enzyme were incubated with 5-phospho--ribose 1-diphosphate (PRPP,0.1mM or 1mM) and nicotinamide (Nam, 0.1mM or 1mM) in reaction buffer(20mM Tris-HCl pH 8.0, 500mM NaCl, 2mM MgCl2, and 0.03% BSA), in absenceor presence of 1mM of adenosine triphosphate (ATP). The 1.2mL reaction was in-cubated for 10 minutes at 30 °C and the enzymatic activity stopped with 0.1mM ofFK866, the samples were frozen in liquid nitrogen.
2.7 Sample preparation and NMR spectroscopyThe samples were dried with an Eppendorf Vacufuge Concentrator, and then resus-pended with 200 µl of NMR buffer containing 5% deuterated H2O (D2O) and 1mM4,4-dimethyl-4-silapentane-1-sulfonate (DSS).1D 1H NMR spectra were acquired on a 850MHz Ascend Bruker spectrometer
equipped with 5mm TCI triple-resonance CryoProbe and a pulse field gradientsalong the z-axis. The experiments were acquired with the zgesgppe pulse sequence,allowing water suppression using excitation sculpting with gradients and perfectecho. The temperature was kept constant at 300K and the acquisition was startedwith 2000 scans, 1 s relaxation delay, 1.6 s acquisition time, 65 000 data points, anda spectral width of 14 ppm.The spectra phase and baseline were automatically and manually corrected using
TopSpin 3.5 software (Bruker Biospin). Quantification of nicotinamide mononuc-leotide (NMN) was done by the integration of the peak at 9.52 ppm and DSS usedas an internal standard.
3 Results3.1 Paradoxical evolutionary correlation between NAD-dependent
signalling and precursor metabolismTo understand the functional roles and potential interplay between the three knownenzymes that use Nam as substrate (NamPRT, NADA and NNMT), we first conduc-ted a comprehensive phylogenetic analysis of these three enzymes. The phylogeneticdistribution of the two enzymes that initiate the two different NAD salvage pathways,NADA and NamPRT is scattered in bacteria [Gazzaniga et al., 2009], while their co-
6

occurrence has been detected in some marine invertebrates [Gossmann et al., 2012].As shown in Figure 2A, bacteria, fungi, and plants predominantly possess NADAand only a few of them harbour NamPRT. In contrast, Metazoa predominantlylost NADA and have NamPRT together with NNMT. NNMT seems to have arisende novo or diverged rapidly in the most recent common ancestor of Ecdysozoa andLophotrochozoa (fig. 2B). We were unable to find any NNMT gene with an e-valuebelow 0.1 in fungi or plants.Nematodes are the only organisms, where we observed a concomitant presence
of NADA and NNMT. In deuterostomes, the only large clade that possesses onlyNamPRT and seems to have lost NNMT are Sauropsida, and among them especiallybirds. The reason why about half of the sequenced bird genomes do not seem toencode for NNMT remains unclear. The distribution of NNMT in birds is quitescattered (suppl. fig. S2) but could be explained by the fact that numerous birdgenes are high in GC content [Hron et al., 2015]. The lack of NNMT might berelated to the differences in the excretion system, as the product of NNMT, methyl-Nam, is in mammals excreted with the urine. There are few metazoan species forwhich we could not find NamPRT or NADA, while NNMT was present. We assumethat this is due to incomplete genomes in the database, as the distribution of suchspecies is scarce and widely scattered.In addition to the phylogenetic distribution of the two Nam salvage enzymes
NADA and NamPRT, we analysed the phylogenetic diversity of enzymes catalysingNAD-dependent signalling reactions. To do so, we used the previously establishedclassification into ten different families of NAD-consuming signalling enzymes [Goss-mann et al., 2012]. The detailed list of templates used for the phylogenetic analysescan be found in supplementary table S1. The numbers shown in figure 2B denote theaverage number of NAD-dependent signalling enzyme families found in each clade.With the exception of Cnidaria and Lophotrochozoa, we find an average of three tofour families in protostomes, whereas most deuterostome species have, on average,more than eight families with an increasing diversification of enzymes within someof these families [Gossmann and Ziegler, 2014].Taken together, we found that NADA is lost in vertebrates, but strongly preserved
in most other organisms, despite the higher energetic requirement of that pathway.Moreover, the selection for having both NamPRT and NNMT coincides with anincreased diversification of NAD-dependent signalling. This observation seems coun-terintuitive, as one would expect that increased NAD-dependent signalling shouldbe accompanied by an increase of substrate availability for NAD biosynthesis.
3.2 Functional properties of NamPRT and NNMT have evolvedto maximise NAD-dependent signalling
To resolve this apparent contradiction, we wished to scrutinise the NAD metabolicnetwork. Given the complexity of this network, we turned to modelling approaches
7

and built a dynamic model of NAD metabolism based on previously reported kineticdata (for details, see Experimental Procedures and suppl. tab. S2).To be able to compare metabolic features of evolutionary quite different systems in
our simulations and as we had limited information about species-specific expressionlevels of enzymes, we initially assumed equal expression rates for all enzymes. Aswe have very few cross species kinetic data, we were furthermore mainly relying onkinetic constants found for human or yeast enzymes. Wherever possible, we includedboth substrate affinities and known product inhibitions or inhibition by downstreammetabolites. As we in addition assumed that cell growth is, besides NAD-consumingreactions, a major driving force for NAD biosynthesis, we analysed different growthrates (cell division rates) by simulating different dilution rates for all metabolites.First, we addressed the unexpected correlation between the selection for co-occur-
rence of NamPRT and NNMT and an increase in the number of NAD-consumingenzyme families. We calculated steady state NAD concentrations and NAD con-sumption rates by simulating NAD biosynthesis proceeding via NamPRT in thepresence or absence of NNMT. To achieve free NAD concentrations in the rangereported in the literature and due to the very low turnover of NamPRT, we usedtenfold higher NamPRT levels compared to other enzymes. We also adjusted theamount of NMNAT accordingly to avoid that the NAD synthesis rates are limitedby this enzyme. Surprisingly, as shown in figure 3, the presence of NNMT enableshigher rather than lower NAD consumption rates (fig. 3A). However, it diminishesthe steady state concentration of NAD (fig. 3B). The decline in NAD concentrationcan be compensated by a higher expression of NamPRT, further increasing NADconsumption flux (dashed lines in fig. 3A and B).These results can be explained by looking in more detail at the kinetic parameters
of NamPRT and NAD-consuming enzymes such as Sirtuin 1. Most NAD-consumingenzymes are inhibited by their product Nam. Thus, the presence of NNMT enableshigher NAD consumption fluxes, by removing excess Nam from the cells. At thesame time, the high substrate affinity of NamPRT maintains a sufficiently high NADconcentration, although the concentration is, as expected, lower than in the systemwithout NNMT.Kinetic parameters of NamPRT were previously measured for the human enzyme
[Burgos and Schramm, 2008] as well as for some bacterial enzymes [Sorci et al.,2010], the latter having a much lower substrate affinity for Nam. We thus analysedthe potential effect of NamPRT affinity (KM) on NAD steady state concentrationand NAD consumption flux. In the absence of NNMT, a variation of the substrateaffinity of NamPRT for Nam has very little effect on steady state NAD concentrationand NAD consumption flux (fig. 4A and B). In the presence of NNMT, however, NADconsumption flux and NAD concentration increases with decreasing KM values ofNamPRT (fig. 4C and D).Remarkably, NAD concentration and consumption flux are both considerably af-
fected by cell division rates in a system without NNMT, at least if the enzyme ex-pression is kept constant at different cell division rates. Of course, this is an artificialscenario, as one would assume organisms to regulate enzyme expression to achieve
8

similar levels of metabolite concentrations instead. Nevertheless, in the absence ofNNMT there seems to be a trade-off between maintainable NAD concentration andconsumption flux. In contrast, in the presence of NNMT, NAD consumption ratesand concentrations are almost independent of cell division rates.Figures 4E and F visualise a direct comparison of simulations assuming different
affinities of NamPRT for Nam, in the presence or absence of NNMT. Interestingly,at an affinity of KM = 1µM, which is in the range of the KM of NADA for Nam,NAD consumption flux is only higher with NNMT present when cell division ratesare low (fig. 4E). If the affinity of NamPRT is high enough, consumption rates arealways higher with NNMT than without it. The NAD concentration is always lowerwith NNMT (fig. 4F).To understand the interplay and competition for Nam between NamPRT and
NNMT, we scanned a wide range of possible KM values for both enzymes in oursimulations. As shown in figure 5, the simulations indicate that both NAD con-sumption flux and NAD concentration would be minimal in case of a high KM forNamPRT and a low KM for NNMT. Conversely, lowering the KM of NamPRT tothe nanomolar range substantially increases NAD consumption and concentration,which reach a maximum when the KM of NNMT is concomitantly elevated to thesubmillimolar range. The asterisks in figure 5 denote the KM values actually foundfor the human enzymes. Astonishingly, the naturally occurring KM values are veryclose to the theoretical optimum.
3.3 Sequence variance acquired in metazoans enhances substrateaffinity
Given that NNMT might have exerted an evolutionary pressure on the develop-ment of NamPRT, one would expect to observe adaptations that are reflected inthe NamPRT protein sequence arising shortly after the occurrence of NNMT. Toexplore this, we created a multiple sequence alignment. The alignment of selectedsequences is shown in figure 6A and a more comprehensive multiple sequence align-ment containing a larger number of species can be found in supplementary figure S1.We found that most Deuterostomes that possess only NamPRT and NNMT (indi-cated by the blue circle) have an insert of ten amino acids corresponding to positions42 to 51 in the human enzyme. This insert overlaps with a predicted weak nuclearlocalisation signal (NLS) that is lost when the insert is removed. These ten aminoacids correspond to a stretch at the protein surface that is unresolved in all availablecrystal structures of human NamPRT (e.g. structure visualisation in fig. 6B fromWang et al. [2006]). Intriguingly, this presumed loop, depicted in red in figure 6B, isconnected to one of the β-sheets involved in substrate binding [Burgos et al., 2009]and in the functional homodimer, the two loops are placed side-by-side.From these observations, we derived two possible hypotheses regarding the role
of the loop in NamPRT function. The first hypothesis was that the presence of theloop could change the subcellular localisation of NamPRT, as it is overlapping with
9

a predicted NLS. To test this hypothesis, we created a mutant NamPRT lackingthe loop and recombinantly expressed FLAG-tagged wildtype and mutant NamPRTin HeLa S3 cells. Immunofluorescence imaging showed a mixed cytosolic nuclearlocalisation for both the wildtype and the mutant NamPRT (fig. 6C). Thus, deletionof the loop did not compromise the nuclear localisation.The second hypothesis was that the sequence insertion might influence substrate
binding of NamPRT. We thus expressed both wildtype and mutant proteins, N-ter-minally fused to a 6xHis-tag in E. coli, and purified them. The size exclusion chro-matography profile showed that both wildtype and mutant protein were expressedas dimers (see suppl. fig. S3), indicating that the missing residues in the mutant didnot dramatically affect the protein structure. The enzymatic activity was measuredby NMR spectroscopy using the detection of NMN produced in the presence andabsence of ATP. Upon incubation with the NamPRT inhibitor FK866 [Hasmannand Schemainda, 2003] for 30 minutes, both wildtype and mutant NamPRT did notproduce any NMN, suggesting that binding of FK866 is not affected by the mutation(see suppl. fig. S4). Nevertheless, the enzymatic activity of the mutant enzyme wasonly approximately 30% of that of the wildtype enzyme (fig. 6D). In contrast towildtype NamPRT, the activity of the mutant enzyme was not stimulated in thepresence of ATP (fig. 6E). These observations suggest that the mutant enzyme iscatalytically active, retains its dimeric state and sensitivity to FK866. However, thelower activity and the absence of catalytic activation by ATP indicate that deletionof amino acids 42 to 51 might have affected substrate binding.
3.4 NamPRT and NNMT made NADA obsolete in vertebratesNext, we wished to understand why NADA was lost in vertebrates. As selectionduring evolution results usually from competition for resources, we built a two-compartment model, based on the pathway model described above. One compart-ment contains NADA, while the other one contains either NamPRT alone or to-gether with NNMT. Both compartments share a limited Nam source (for details, seeExperimental Procedures and suppl. tab. S2). Without NNMT, the compartmentcontaining NADA shows slightly lower NAD consumption rates (fig. 7A), but is ableto maintain much higher NAD concentrations especially at low cell division rates(fig. 7B). At high cell division rates, steady state concentrations in both compart-ments are similar. This might explain why in bacteria that often have relatively highgrowth rates, both systems can co-exist.In the presence of NNMT, the NamPRT compartment has both higher NAD con-
sumption rates and higher steady state NAD concentrations than the compartmentcontaining NADA (fig. 7C and D). The higher NAD concentrations in the com-partment containing NamPRT and NNMT can, however, only be maintained if theaffinity of NamPRT for Nam is high enough. If the substrate affinity of NamPRT istoo low (high KM), the NADA compartment is able to maintain higher NAD con-centrations, but still has a lower NAD consumption flux. Taken together, the resultssuggest that the NADA pathway might have become obsolete upon emergence of the
10

high affinity NamPRT. This in turn might have been induced by the appearance ofNNMT.
4 DiscussionWe here comprehensively analysed the phylogenetic distribution of the three enzymesusing Nam as a substrate. These are the two NAD salvage pathway enzymes NADAand NamPRT as well as the Nam-degrading enzyme NNMT. We found that afterthe first appearance of NNMT in Protostomia, a diversification of NAD-consumingreactions in Deuterostomia can be observed. We could explain these finding usingmathematical modelling, as NNMT removes excess Nam from cells and thereby re-duces product inhibition of NAD signalling enzymes. This in turn enables higherfluxes through these reactions. Thus, the diversification of NAD-consuming enzymesin mammals seems to have been enabled by the presence of NNMT.NAD-consuming enzymes are involved in a wide variety of signalling and gene
regulatory mechanisms that, due to their sensitivity to NAD+, have the ability totranslate differences in metabolic states into changes in signalling and gene regulation.As NAD concentrations are lowered by the removal of NAD precursor by NNMT,a high affinity of NamPRT is required for high NAD consumption fluxes and NADconcentrations in the presence of NNMT. It therefore seems plausible that NNMTmight have been driving NamPRT evolution. Looking at the enzyme affinities of thehuman enzymes, it furthermore appears that both NNMT and NamPRT reachedan almost optimal state, as further changes in the affinity of either NamPRT orNNMT would not result in much higher steady state NAD concentrations or NADconsumption fluxes. In addition, our simulations suggest that NNMT makes bothNAD concentration and NAD consumption relatively independent of other processesrequiring NAD, such as cell growth.Our findings shed new light on the potential physiological role of NNMT, which has
earlier been recognised as potential marker for some types of cancer [e.g. Okamuraet al., 1998]. The main healthy tissue expressing NNMT is the liver, while no or onlylittle expression of NNMT is observed in most other healthy tissues [Aksoy et al.,1994]. The increased NNMT expression observed in some types of cancer, might serveto remove Nam derived by increased NAD-dependent signalling. To maintain highNAD concentrations, a simultaneous higher expression of NamPRT is required, whichis what has been found in some types of cancer [Bi et al., 2011; Wang et al., 2011].It is worth noticing that NNMT is only advantageous as long as NamPRT affinityis sufficiently high. This suggests that certain types of cancer expressing NNMTat a high level, would potentially be more susceptible to competitive inhibitors ofNamPRT. Several of such inhibitors are currently tested in clinical studies [Espindola-Netto et al., 2017; Xu et al., 2015]. Based on our analysis, we would suggest that itmight be reasonable to screen patients before treatment, as non-NNMT expressingtumours might respond less to competitive NamPRT inhibitors and missing Namdegradation in those cancer cells would potentially lead to an accumulation of Nam
11

that could outcompete the inhibitor. The latter aspect is not well investigated andrequires further analysis.Neither the scattered distribution of NamPRT and NADA that is especially pro-
nounced in bacteria [Gazzaniga et al., 2009], but that has also been observed in eu-karyotes, nor the disappearance of NADA in vertebrates has been understood earlier.Our combined phylogenetic-modelling analysis now provides a potential explanationfor both observations. Using simulated competition between two compartments thatshare the same limited source of Nam, we show that the compartment that containsNamPRT and NNMT can maintain a higher steady state NAD concentration andNAD consumption rate than the compartment containing NADA. This is, however,only the case if NamPRT substrate affinity is sufficiently high. The dominant enzymecombination found in vertebrates, a high-affinity NamPRT with NNMT, thus seemsto provide a competitive advantage. As this may also hold for mammalian-associatedbacteria, particularly pathogens, we wanted to see whether pathogenic bacteria solelyexpress NamPRT. Unfortunately, bacterial habitat information is currently far fromcomplete and often difficult to access. We therefore manually checked bacteria thatpossess NamPRT and indeed found that most of them have been characterised tobe pathogenic. It should be noted that the distribution of NADA and NamPRTdoes not follow the bacterial species tree [Gazzaniga et al., 2009]. Besides the sug-gestion made here, there might well be other environmental aspects that influencethe phylogenetic distribution in bacteria.A detailed analysis of sequence variances in NamPRT revealed that only deutero-
stomes that have NNMT, but not NADA, have a sequence insertion in the N-terminalpart of NamPRT that seems to enable the high affinity of the enzyme. This in turnwould suggest that also the bacterial enzymes do not have a high substrate affinity.The substrate affinity measured for a bacterial NamPRT from Acinetobacter baylyi[Sorci et al., 2010] is indeed 10 000 times higher lower (KM of 0.04mM) than thatof the human NamPRT, supporting our hypothesis. Other bacterial NamPRTs wereshown to be functional [Gerdes et al., 2006; Martin et al., 2001], but the substrateaffinities have not been determined. The differences in activity and affinity, implyingdifferences in substrate binding could potentially be exploited for the developmentof antibiotics. Further analysis possibly including the crystallisation of a bacterialNamPRT would be required, to see whether the bacterial NAD metabolism couldbe a promising target.In our analyses, we did not consider the potential effects of co-substrates of the
investigated pathway. Such co-substrates include targets of the NAD-consumingenzymes, such as acylated proteins for sirtuins, for example, or phosphoribosyl pyro-phosphate (PRPP) and ATP that are required for NMN synthesis by NamPRT. Fur-thermore, the presence of the methyl donor S-adenosyl methionine (SAM) and itsprecursor methionine that have been shown to potentially limit the effect of NNMT[Ulanovskaya et al., 2013] was not considered here. As co-substrate availability mightalter the behaviour of the system, these should thus be included in future analyses.Unfortunately, information about the in vivo concentrations of these co-substratesis currently very limited.
12

During our analysis, we came across several problems related to the use of NCBIsequence databases for phylogenetic analyses. One is sequence contamination, whichis a well-known problem [Ballenghien et al., 2017; Longo et al., 2011]. To avoid con-tamination, we used sequence homology analysis to remove all sequences of obviousbacterial origin from the results in eukaryotic species. Another problem is incompletegenomes. Although there are tools to assess the completeness of a genome [e.g. Simãoet al., 2015], none of them could convincingly claim to be reliable. The genomes ofthe common model organisms can probably be assumed to be close to complete,but there are many draft genomes in the databases whose completeness is uncertain.Even if the completeness would be known, due to the high number of genomes usedin this analysis, it is likely that some genes of interest were not sequenced in everygenome. For our analysis, this means that scattered patterns of few missing genescould be real, but are in general thought more likely to stem from an incompletegenome.The third problem are wrong annotations. We tried to avoid these, by only relying,
wherever possible, on template sequences with confirmed function. This problembecomes apparent by the fact that in yeast an enzyme named NNMT can be found.The initial naming was based on a very weak homology to human NNMT and ananalysis of life span extension of the mutant in Saccharomyces cerevisae [Andersonet al., 2003], which showed similar effects as other mutants of the NAD pathway.The protein has later been shown not to function as methyltransferase for Nam, butfor the eukaryotic elongation factor 1A (eEF1A) giving it its new name elongationfactor methyltransferase 7 (Efm7) [Hamey et al., 2016]. The old name is still presentin many databases, though.Taken together, we have been able to comprehensively analyse the functional co-
evolution of several enzymes of the NAD pathway. The appearance of NNMT seem-ingly initiated and drove complex alterations of the pathway such as an increase anddiversification of NAD-dependent signalling, followed by an increase in NamPRTsubstrate affinity. A schematic overview is given in figure 8. This transition appearsto be accompanied by the loss of NADA in vertebrates and the first gene duplica-tion of NMNATs [Lau et al., 2010]. We also noted that the second gene duplicationof NMNATs and thus the further compartmentalisation of NAD metabolism is co-occurring with a site-specific positive selection event in NNMT (unpublished results).We here developed a new approach that combines detailed phylogenetic analysis
with dynamic metabolic modelling and have been able to explain observed evolu-tionary changes in the NAD biosynthesis and consumption pathway. Based on thesimulated pathway dynamics, we have furthermore derived predictions for physiolo-gical interdependencies between several enzymes of the pathway that are potentiallyrelevant for new disease treatments. Our results, including the experimental veri-fication of parts of our predictions, demonstrate the potential of our approach forthe analysis of dynamic networks and how the approach can be used to unravelfunctional interdependencies within pathways of interest.
13

ReferencesAksoy, S., Szumlanski, C. L., and Weinshilboum, R. M. (1994). Human liver nico-tinamide N-methyltransferase. cDNA cloning, expression, and biochemical charac-terization. Journal of Biological Chemistry, 269(20):14835–14840.
Anderson, R. M., Bitterman, K. J., Wood, J. G., Medvedik, O., and Sinclair, D. A.(2003). Nicotinamide and PNC1 govern lifespan extension by calorie restrictionin Saccharomyces cerevisiae. Nature, 423(6936):181–185.
Arnold, K., Bordoli, L., Kopp, J., and Schwede, T. (2006). The SWISS-MODELworkspace: A web-based environment for protein structure homology modelling.Bioinformatics, 22(2):195–201.
Ballenghien, M., Faivre, N., and Galtier, N. (2017). Patterns of cross-contaminationin a multispecies population genomic project: Detection, quantification, impact,and solutions. BMC Biology, 15(1):1–16.
Bi, T. Q., Che, X. M., Liao, X. H., Zhang, D. J., Long, H. L., Li, H. J., and Zhao, W.(2011). Overexpression of Nampt in gastric cancer and chemopotentiating effectsof the Nampt inhibitor FK866 in combination with fluorouracil. Oncology Reports,26(5):1251–1257.
Biasini, M., Bienert, S., Waterhouse, A., Arnold, K., Studer, G., Schmidt, T., Kiefer,F., Cassarino, T. G., Bertoni, M., Bordoli, L., and Schwede, T. (2014). SWISS-MODEL: Modelling protein tertiary and quaternary structure using evolutionaryinformation. Nucleic Acids Research, 42(W1):252–258.
Buonvicino, D., Mazzola, F., Zamporlini, F., Resta, F., Ranieri, G., Camaioni, E.,Muzzi, M., Zecchi, R., Pieraccini, G., Dölle, C., Calamante, M., Bartolucci, G.,Ziegler, M., Stecca, B., Raffaelli, N., and Chiarugi, A. (2018). Identification of thenicotinamide salvage pathway as a new toxification route for antimetabolites. CellChemical Biology, 25(4):471–482.e7.
Burgos, E. S., Ho, M.-C., Almo, S. C., and Schramm, V. L. (2009). A phosphoen-zyme mimic, overlapping catalytic sites and reaction coordinate motion for humanNAMPT. Proceedings of the National Academy of Sciences, 106(33):13748–53.
Burgos, E. S. and Schramm, V. L. (2008). Weak coupling of ATP hydrolysis to thechemical equilibrium of human nicotinamide phosphoribosyltransferase. Biochem-istry, 47(42):11086–96.
Bütepage, M., Eckei, L., Verheugd, P., and Lüscher, B. (2015). Intracellular mono-ADP-ribosylation in signaling and disease. Cells, 4(4):569–595.
Carneiro, J., Duarte-Pereira, S., Azevedo, L., Castro, L. F. C., Aguiar, P., Moreira,I. S., Amorim, A., and Silva, R. M. (2013). The evolutionary portrait of metazoanNAD salvage. PLoS ONE, 8(5).
14

Chiarugi, A., Dölle, C., Felici, R., and Ziegler, M. (2012). The NAD metabolome –a key determinant of cancer cell biology. Nature Reviews Cancer, 12(11):741–752.
Commission of European Communities (2008). Commission Directive 2008/100/ECof 28 October 2008 amending Council Directive 90/496/EEC on nutrition labellingfor foodstuffs as regards recommended daily allowances, energy conversion factorsand definitions. Official Journal of the European Union, 285:9–12.
de Figueiredo, L. F., Gossmann, T. I., Ziegler, M., and Schuster, S. (2011). Pathwayanalysis of NAD+ metabolism. Biochemical Journal, 439(2):341–348.
De Vos, M., Schreiber, V., and Dantzer, F. (2012). The diverse roles and clinicalrelevance of PARPs in DNA damage repair: Current state of the art. BiochemicalPharmacology, 84(2):137–146.
Espindola-Netto, J. M., Chini, C. C. S., Tarragó, M., Wang, E., Dutta, S., Pal, K.,Mukhopadhyay, D., Sola-Penna, M., and Chini, E. N. (2017). Preclinical efficacyof the novel competitive NAMPT inhibitor STF-118804 in pancreatic cancer. On-cotarget, 8(49):85054–85067.
Gazzaniga, F., Stebbins, R., Chang, S. Z., McPeek, M. A., and Brenner, C. (2009).Microbial NAD metabolism: lessons from comparative genomics. Microbiology andMolecular Biology Reviews, 73(3):529–41.
Gerdes, S. Y., Kurnasov, O. V., Shatalin, K., Polanuyer, B., Sloutsky, R., Vonstein,V., Overbeek, R., and Osterman, A. L. (2006). Comparative genomics of NADbiosynthesis in cyanobacteria. Journal of Bacteriology, 188(8):3012–3023.
Gossmann, T. I. and Ziegler, M. (2014). Sequence divergence and diversity suggestsongoing functional diversification of vertebrate NAD metabolism. DNA Repair,23:39–48.
Gossmann, T. I., Ziegler, M., Puntervoll, P., de Figueiredo, L. F., Schuster, S., andHeiland, I. (2012). NAD+ biosynthesis and salvage – a phylogenetic perspective.The FEBS Journal, 279(18):3355–3363.
Hamey, J. J., Winter, D. L., Yagoub, D., Overall, C. M., Hart-Smith, G., and Wilkins,M. R. (2016). Novel N-terminal and lysine methyltransferases that target transla-tion elongation factor 1A in yeast and human. Molecular & Cellular Proteomics,15(1):164–176.
Hasmann, M. and Schemainda, I. (2003). FK866, a highly specific noncompetitiveinhibitor of nicotinamide phosphoribosyltransferase, represents a novel mechanismfor induction of tumor cell apoptosis. Cancer Research, 63(21):7436–42.
Hoops, S., Sahle, S., Gauges, R., Lee, C., Pahle, J., Simus, N., Singhal, M., Xu, L.,Mendes, P., and Kummer, U. (2006). COPASI – a COmplex PAthway SImulator.Bioinformatics, 22(24):3067–74.
15

Hron, T., Pajer, P., Pačes, J., Bartüněk, P., and Elleder, D. (2015). Hidden genes inbirds. Genome Biology, 16(1):4–7.
Huerta-Cepas, J., Serra, F., and Bork, P. (2016). ETE 3: Reconstruction, ana-lysis, and visualization of phylogenomic data. Molecular Biology and Evolution,33(6):1635–8.
Koch-Nolte, F., Haag, F., Guse, A. H., Lund, F., and Ziegler, M. (2009). Emergingroles of NAD+ and its metabolites in cell signaling. Science Signaling, 2(57):mr1.
Lau, C., Dölle, C., Gossmann, T. I., Agledal, L., Niere, M., and Ziegler, M.(2010). Isoform-specific targeting and interaction domains in human nicotin-amide mononucleotide adenylyltransferases. The Journal of Biological Chemistry,285(24):18868–76.
Lee, H. C. (2012). Cyclic ADP-ribose and nicotinic acid adenine dinucleotide phos-phate (NAADP) as messengers for calcium mobilization. Journal of BiologicalChemistry, 287(38):31633–31640.
Liu, L., Su, X., Quinn, W. J., Hui, S., Krukenberg, K., Frederick, D. W., Redpath, P.,Zhan, L., Chellappa, K., White, E., Migaud, M. E., Mitchison, T. J., Baur, J. A.,and Rabinowitz, J. D. (2018). Quantitative analysis of NAD synthesis-breakdownfluxes. Cell Metabolism, 27(5):1067–1080.e5.
Longo, M. S., O’Neill, M. J., and O’Neill, R. J. (2011). Abundant human DNAcontamination identified in non-primate genome databases. PLoS ONE, 6(2):1–4.
Martin, P. R., Shea, R. J., and Mulks, M. H. (2001). Identification of aplasmid-encoded gene from Haemophilus ducreyi which confers NAD indepen-dence. Journal of Bacteriology, 183(4):1168–74.
North, B. J. and Verdin, E. (2004). Sirtuins: Sir2-related NAD-dependent proteindeacetylases. Genome Biology, 5(5):224.
Okamura, A., Ohmura, Y., Islam, M. M., Tagawa, M., Horitsu, K., Moriyama, Y.,and Fujimura, S. (1998). Increased hepatic nicotinamide N-methyltransferaseactivity as a marker of cancer cachexia in mice bearing colon 26 adenocarcinoma.Japanese Journal of Cancer Research, 89(6):649–656.
Osborne, B., Bentley, N. L., Montgomery, M. K., and Turner, N. (2016). The role ofmitochondrial sirtuins in health and disease. Free Radical Biology and Medicine,100:164–174.
Pissios, P. (2017). Nicotinamide N-methyltransferase: More than a vitamin B3 clear-ance enzyme. Trends in Endocrinology and Metabolism, 28(5):340–353.
16

Prum, R. O., Berv, J. S., Dornburg, A., Field, D. J., Townsend, J. P., Lemmon,E. M., and Lemmon, A. R. (2015). A comprehensive phylogeny of birds (Aves)using targeted next-generation DNA sequencing. Nature, 526(7574):569–573.
Ruggieri, S., Orsomando, G., Sorci, L., and Raffaelli, N. (2015). Regulation ofNAD biosynthetic enzymes modulates NAD-sensing processes to shape mam-malian cell physiology under varying biological cues. Biochimica et BiophysicaActa, 1854(9):1138–49.
Schäuble, S., Stavrum, A.-K., Puntervoll, P., Schuster, S., and Heiland, I. (2013).Effect of substrate competition in kinetic models of metabolic networks. FEBSLetters, 587(17):2818–2824.
Simão, F. A., Waterhouse, R. M., Ioannidis, P., Kriventseva, E. V., and Zdobnov,E. M. (2015). BUSCO: Assessing genome assembly and annotation completenesswith single-copy orthologs. Bioinformatics, 31(19):3210–3212.
Sorci, L., Blaby, I., De Ingeniis, J., Gerdes, S. Y., Raffaelli, N., Lagard, V. D. C.,and Osterman, A. L. (2010). Genomics-driven reconstruction of AcinetobacterNAD metabolism: Insights for antibacterial target selection. Journal of BiologicalChemistry, 285(50):39490–39499.
Ulanovskaya, O. A., Zuhl, A. M., and Cravatt, B. F. (2013). NNMT promotesepigenetic remodeling in cancer by creating a metabolic methylation sink. NatureChemical Biology, 9(5):300–306.
Verdin, E. (2015). NAD+ in aging, metabolism, and neurodegeneration. Science,350(6265).
Wang, B., Hasan, M. K., Alvarado, E., Yuan, H., Wu, H., and Chen, W. Y. (2011).NAMPT overexpression in prostate cancer and its contribution to tumor cell sur-vival and stress response. Oncogene, 30(8):907–21.
Wang, T., Zhang, X., Bheda, P., Revollo, J. R., Imai, S.-i., and Wolberger, C. (2006).Structure of Nampt/PBEF/visfatin, a mammalian NAD+ biosynthetic enzyme.Nature Structural and Molecular Biology, 13(7):661–662.
Xu, T.-Y., Zhang, S.-L., Dong, G.-Q., Liu, X.-Z., Wang, X., Lv, X.-Q., Qian, Q.-J.,Zhang, R.-Y., Sheng, C.-Q., and Miao, C.-Y. (2015). Discovery and character-ization of novel small-molecule inhibitors targeting nicotinamide phosphoribosyl-transferase. Scientific Reports, 5(1):10043.
Yoshino, J., Baur, J. A., and Imai, S.-i. (2018). NAD+ intermediates: The biologyand therapeutic potential of NMN and NR. Cell Metabolism, 27(3):513–528.
17

AcknowledgementsWe thank the Norwegian Research Council for funding (grant no. 250395/F20 andgrant no. 226244/F50). We furthermore thank for the computation time providedthrough UNINETT Sigma2 – the National Infrastructure for High Performance Com-puting and Data Storage in Norway.
18

Figure legends
Nam
NMN
NAD
NAAD
NAMN
NA
MNam
NMNAT
NamPRTNADA
NAPRT
NMNAT NADS
NNMT
NADconsumption
FromTrp
NRNRK
Figure 1 – Schematic overview of NAD biosynthesis pathways. NAD canbe synthesised from tryptophan (Trp), nicotinamide (Nam), nicotinic acid (NA),and to a lesser extend nicotinamide ribose (NR). Nam is the main precursor inhuman and also the product of NAD-consuming signalling reactions by enzymessuch as sirtuins (NAD-dependent deacylases) or PARPs (poly-ADP-ribosylases). Forthe recycling of Nam, two different pathways exist. The pathway found in yeast,plants, and many bacteria starts with the deamidation of Nam by Nam deamidase(NADA). The other three enzymes comprise the Preiss-Handler pathway that alsoexists in vertebrates. The pathway found in vertebrates directly converts Nam intothe corresponding mononucleotide (NMN) by the Nam phosphoribosyltransferase(NamPRT). The Nam N-methyltransferase (NNMT) degrades Nam to methyl-Nam(MNam), which is in mammals excreted with the urine.
19

20

Figure 2 –Phylogenetic distribution of NADA, NNMT, and NamPRT andtheir relation to the number of NAD consumers. A) Distribution of NADA,NNMT, and NamPRT in selected clades. NADA is dominant in bacteria, fungi,and plants (Viridiplantae), whereas NamPRT together with NNMT is dominant inMetazoa. Numbers at the pie charts show, how many species of the clades possessthe respective enzyme combination indicated by the colour explained in the lowerright of the figure. The number of species in a clade is given below its name. B)Common tree of selected clades within the Metazoa, including 334 species. The piecharts indicate the distribution of species within the respective clade that encodethe enzyme combination indicated by the different colours. The size of the pie chartsis proportional to the logarithm of the number of species analysed in the particularclade. The numbers below the clade names indicate the average number of NAD-consuming enzyme families found in all species of that clade. The branch length isarbitrary.
21


0
0.5
1
1.5
2
2.5
3
3.5
0.01 0.1 1
AN
AD
co
nsu
mp
. flu
x (
µM
/s)
cell division rate per h
NAD consumption
NamPRT onlyNamPRT and NNMT
4 × NamPRT and NNMT
0
5
10
15
20
25
30
35
40
0.01 0.1 1
A B
fre
e N
AD
co
nc.
(µM
)
cell division rate per h
NAD concentration
NamPRT onlyNamPRT and NNMT
4 × NamPRT and NNMT
Figure 3 – NNMT enables high NAD consumption flux. We used a dy-namic model of NAD biosynthesis and consumption (for details, see ExperimentalProcedures) to simulate steady state NAD consumption flux (A) and concentration(B). The amount of NMNAT and NamPRT used in the simulations where adjustedsuch that the free NAD concentrations were in the range reported in the literature.All other enzyme concentrations were set equal. Details are given in supplementarytable S2. In the presence of NNMT (blue lines), steady state NAD consumption ratesare higher despite reduced NAD concentrations. Increasing the amount of NamPRTin the simulation fourfold (blue dotted lines) partially compensates for the decreasedNAD concentration caused by Nam degradation through NNMT.
23

0.00010.001
0.010.1
1 0.01
0.1
1 0.1
0.2
0.3
0.4
NA
D c
on
su
mp
. flu
x (
µM
/s)
NamPRT onlyA
KM NamPRT (µM)
cell d
ivisio
n rate
per h
NA
D c
on
su
mp
. flu
x (
µM
/s)
0.05 0.1 0.15 0.2 0.25 0.3 0.35
0.00010.001
0.010.1
1 0.01
0.1
1 14
16
18
20
22
24
26
fre
e N
AD
co
nc.
(µM
)
NamPRT onlyA B
KM NamPRT (µM)
cell d
ivisio
n rate
per hfr
ee
NA
D c
on
c.
(µM
)
14 16 18 20 22 24 26
0.00010.001
0.010.1
1 0.01
0.1
1 0.2
0.3
0.4
0.5
0.6
0.7
NA
D c
on
su
mp
. flu
x (
µM
/s)
NamPRT and NNMT
A B
C
KM NamPRT (µM)
cell d
ivisio
n rate
per h
NA
D c
on
su
mp
. flu
x (
µM
/s)
0.2 0.3 0.4 0.5 0.6 0.7
∗
0.00010.001
0.010.1
1 0.01
0.1
1 1
2
3
4
fre
e N
AD
co
nc.
(µM
)
NamPRT and NNMTD
KM NamPRT (µM)
cell d
ivisio
n rate
per hfr
ee
NA
D c
on
c.
(µM
)
1 1.5 2 2.5 3 3.5
∗
0
0.2
0.4
0.6
0.8
1
0.01 0.1 1
E
NA
D c
on
su
mp
. flu
x (
µM
/s)
cell division rate per h
Nam import 0.1 µM/s
NamPRT KM = 5 nMNamPRT KM = 5 nM + NNMTNamPRT KM = 1 µMNamPRT KM = 1 µM + NNMT
0
5
10
15
20
25
30
35
0.01 0.1 1
E F
fre
e N
AD
co
nc.
(µM
)
cell division rate per h
Nam import 0.1 µM/s
NamPRT KM = 5 nMNamPRT KM = 5 nM + NNMTNamPRT KM = 1 µMNamPRT KM = 1 µM + NNMT
24

Figure 4 – Role of NamPRT substrate affinity. We simulated the effect ofdifferent Michaelis-Menten constants (KM) of NamPRT for Nam on the steady stateNAD consumption flux and NAD concentration at different cell division rates. Allparameters were equal to those used for the simulations in figure 3. In the absence ofNNMT, the KM of NamPRT has little influence on NAD consumption (A) and con-centration (B), but both are strongly influenced by cell division rates. In the presenceof NNMT, decreasing KM of NamPRT enables increasing NAD consumption flux (C)and NAD concentration (D). NNMT furthermore makes both, NAD consumptionflux and concentration, almost independent of cell division rates. Comparing thesituation with and without NNMT (E and F) at two different NamPRT KM valuesreveals that at high KM (dashed lines) and high cell division rates NNMT no longerenables higher NAD consumption rates compared to NamPRT alone (green line anddashed grey line).
25


0.00010.001 0.01 0.1 11
10
100
1000
0 0.1 0.2 0.3 0.4 0.5 0.6 0.7
NAD consumption (µM/s)A
KM NamPRT (µM) K M N
NM
T (µM
)
0 0.1 0.2 0.3 0.4 0.5 0.6 0.7∗
0.00010.001 0.01 0.1 11
10
100
1000
0 0.5
1 1.5
2 2.5
3 3.5
NAD concentration (µM)B
KM NamPRT (µM) K M N
NM
T (µM
)
0 0.5 1 1.5 2 2.5 3 3.5∗
Figure 5 – The substrate affinities of human NNMT and NamPRT are op-timal.We simulated the impact of changes in theKM for both NamPRT and NNMTon NAD consumption rates (A) and NAD concentration (B). Both are increasingwith decreasing KM of NamPRT, but increasing KM of NNMT. The affinities re-ported for human enzymes (indicated by a black asterisk) appear to be close to thetheoretical optimum, as further improvements would have little or no effect on NADconsumption or concentration.
27

28

Figure 6 – The function of the structurally unresolved loop of NamPRT.Most deuterostomes that possess NamPRT and NNMT show a sequence insertion inthe N-terminal region of NamPRT that has been revealed by multiple sequence align-ment of NamPRT from different species (A). Coloured circles indicate the enzymespresent in the respective species blue: NamPRT and NNMT; black: NamPRT, NADAand NNMT; yellow: NamPRT and NADA. For a more comprehensive alignment,please see supplementary figure S1. The structure visualisation of human NamPRT(B) is based on a structure prediction by SWISS-MODEL [Arnold et al., 2006; Bias-ini et al., 2014] using the model 2H3D of the human NamPRT as template [Wanget al., 2006]. The inserted region is not resolved in any of currently available crystalstructures of NamPRT and thus appears to be a flexible loop structure at the surfaceof the NamPRT dimer, coloured in red. Immunofluorescence images (C) show thatthe localisation of the FLAG-tagged mutant protein lacking the unresolved loop isnot changed compared to FLAG-tagged human wildtype NamPRT. Both show aheterogeneous nuclear-cytosolic localisation in HeLa S3 cells. In vitro measurementsusing recombinant protein show that the mutant NamPRT has a lower activity thanthe wildtype enzyme (D) and is not activated by ATP (E). Bars in panels D andE that have different letters indicate significant difference of measured values asestimated using a T test assuming independent samples and significance at p < 0.05.
29

0
0.2
0.4
0.6
0.8
1
0.01 0.1 1
A
NA
D c
on
su
mp
. flu
x (
µM
/s)
cell division rate per h
without NNMT
NADANamPRT
0
5
10
15
20
25
30
35
40
0.01 0.1 1
A B
fre
e N
AD
co
nc.
(mM
)
cell division rate per h
without NNMT
NADANamPRT
0
0.2
0.4
0.6
0.8
1
0.0001 0.001 0.01 0.1 1
A B
C
NA
D c
on
su
mp
. flu
x (
µM
/s)
KM NamPRT (µM)
with NNMT
NADANamPRT and NNMT
0
1
2
3
4
5
0.0001 0.001 0.01 0.1 1
A B
C D
fre
e N
AD
co
nc.
(µM
)
KM NamPRT (µM)
with NNMT
NADANamPRT and NNMT
Figure 7 – NNMT provides a competitive advantage and makes NADAobsolete. To simulate competition for common resources, we created a two-com-partment model where one compartment contained NADA, but no NamPRT andthe other compartment contained NamPRT either with or without NNMT, but noNADA. NADA and NamPRT were simulated to be present at equal amounts. Inthe absence of NNMT the compartment containing NADA has slightly lower NADconsumption rates (A), but much higher steady state NAD concentrations (B). Inthe presence of NNMT, however, both NAD consumption (C) and NAD concentra-tion (D) are lower in the NADA compartment. This effect is dependent on a lowNamPRT KM .
30

Figure 8 – Schematic representation of evolutionary events in the NADpathway. Based on the phylogenetic analysis presented here (roman font) and earlierwork [Lau et al., 2010] (italic font) we summarised and indicated important eventsin the evolution of NAD metabolism in Metazoa.
31

Supplementary figures and tables
Supplementary Figure S1 – The structurally unresolved loop structure ofNamPRT. Sequence alignment of NamPRT of different species cropped to the re-gion around the unresolved loop structure. Coloured rectangles indicate the enzymespresent in the species besides NamPRT; blue: NNMT; black: NADA and NNMT; yel-low: NADA; green: NamPRT only. Major clades are indicated for better orientation.Number of amino acid indicated at the top refer to the human protein.
32

Supplementary Figure S2 – The phylogenetic distribution of NamPRTand NNMT in birds and reptiles is scattered. The phylogenetic distributionof birds and reptiles was adopted from Prum et al. [2015]. Families are marked witha green circle if they possess NamPRT without NNMT or a blue circle if they possessboth NamPRT and NNMT.
33

34

Supplementary Figure S3 – Purification of wildtype NamPRT and ∆42-51 NamPRT. A) Elution profile of wildtype NamPRT and mutant ∆42-51 on size-exclusion chromatography using a Superdex 200 16/60 column. B) Coomassie staineddenaturating SDS-PAGE analysis of ∆42-51 NamPRT (lane 1) and wt NamPRT(lane 2). 3µg of pooled enzyme eluted from SEC loaded onto the gel. C) The columnwas calibrated with apronitin 6.5 kDa, ovalbumine 42.7 kDa, coalbumine 75 kDa andblue dextran 2000 kDa. The partition coefficient (Kav) was determined for eachstandard (light grey squares) and plotted versus log10 molecular weight. The Kavwas determined for wt NamPRT and ∆42-51 NamPRT and the apparent molecularweight calculated to be 135 kDa and 110 kDa, respectively.
35

[ppm] 9.60 9.55 9.50 9.45
[rel
*1e-
6] 0
5
0 1
00
150
25062018-dorothee59 1 1 C:\Bruker\TopSpin3.5pl7\data
Standard NMN
wt NamPRT
Δ 42-51 NamPRT
wt NamPRT + FK866
Δ 42-51 NamPRT + FK866
Supplementary Figure S4 – NMR measurement of NamPRT activity.As described in Experimental Procedures, NamPRT activity was measured andproduct (NMN) formation was detected using 1D 1H NMR spectroscopy. Inset onthe right: molecular structure of NMN with the atom detected by NMR indicatedby an arrow. The range used for NMN detection in typical 1D 1H NMR spectraof the enzymatic reactions is shown. NMN quantification was done with the sing-let detected at 9.52 ppm. From the top to the bottom, peak detection of NMNstandard (200 µM), wildtype NamPRT (1mM Nam and 1mM PRPP), mutant ∆42-51 NamPRT (1mM Nam and 1mM PRPP), wildtype NamPRT with FK866, andmutant ∆42-51 NamPRT with FK866. Incubation with inhibitor FK866 was donefor 30min at 30 °C.
36

Supplementary Table S1 – Query proteins used for Blast searches.
Supplementary table S2 – Overview of kinetic constants and rate lawsused for the construction of the mathematical model.
37

Copyright © 2022 FDOKUMEN