Optimizing full-brain coverage in human brain MRI through population distributions of brain size
8
Technical Note Optimizing full-brain coverage in human brain MRI through population distributions of brain size Maarten Mennes a,b, ⁎, Mark Jenkinson c , Romain Valabregue d , Jan K. Buitelaar a,b , Christian Beckmann b,c , Stephen Smith c a Department of Cognitive Neuroscience, Radboud University Nijmegen Medical Centre, Nijmegen, The Netherlands b Donders Institute for Brain, Cognition and Behaviour, Radboud University Nijmegen, Nijmegen, The Netherlands c Centre for Functional MRI of the Brain, University of Oxford, Oxford, United Kingdom d Inserm, U975, CNRS, UMR 7225, CENIR: Centre de NeuroImagerie de Recherche, ICM Paris, France abstract article info Article history: Accepted 8 April 2014 Available online 18 April 2014 Keywords: Population brain size Field-of-view FOV Neuroimaging When defining an MRI protocol, brain researchers need to set multiple interdependent parameters that define repetition time (TR), voxel size, field-of-view (FOV), etc. Typically, researchers aim to image the full brain, mak- ing the expected FOV an important parameter to consider. Especially in 2D-EPI sequences, non-wasteful FOV set- tings are important to achieve the best temporal and spatial resolution. In practice, however, imperfect FOV size estimation often results in partial brain coverage for a significant number of participants per study, or, alterna- tively, an unnecessarily large voxel-size or number of slices to guarantee full brain coverage. To provide norma- tive FOV guidelines we estimated population distributions of brain size in the x-, y-, and z-direction using data from 14,781 individuals. Our results indicated that 11 mm in the z-direction differentiate between obtaining full brain coverage for 90% vs. 99.9% of participants. Importantly, we observed that rotating the FOV to optimally cover the brain, and thus minimize the number of slices needed, effectively reduces the required inferior– superior FOV size by ~5%. For a typical adult imaging study, 99.9% of the population can be imaged with full brain coverage when using an inferior–superior FOV of 142 mm, assuming optimal slice orientation and minimal within-scan head motion. By providing population distributions for brain size in the x-, y-, and z-direction we im- prove the potential for obtaining full brain coverage, especially in 2D-EPI sequences used in most functional and diffusion MRI studies. We further enable optimization of related imaging parameters including the number of slices, TR and total acquisition time. © 2014 Elsevier Inc. All rights reserved. Introduction When implementing an imaging protocol for a new neuroimaging study, researchers need to decide on multiple interdependent parame- ters that determine the properties and capabilities of their MRI sequences. One basic but important parameter is the size of the field- of-view (FOV). The FOV determines the size of the imaging window that will be used. Depending on the placement of the participant in the scanner, FOV determines what parts of the brain are imaged. Typically, researchers aim to obtain full coverage of a participant's brain, including the cerebellum (often the inferior extreme) as well as the upper parts of somatosensory cortex (the superior extreme). Moreover, in light of in- creased interest in whole-brain connectivity-based analyses in FMRI or DTI studies, full brain coverage is highly desirable. Excluding parts of the brain, such as the cerebellum or parts of somatosensory cortex, will result in incomplete and thus incorrect ‘whole-brain’ connectivity matrices and their derived measures (e.g., degree centrality, path length). As the same MRI sequences are typically used for all participants in a study, it is imperative to consider the expected FOV needed to achieve full brain coverage for most – if not all – participants. However, no guidelines regarding required FOV size for typical populations of inter- est exist. In practice, FOV size is commonly roughly estimated based on previous experience or the brain size of a (large-headed) pilot sub- ject. This often results in either partial brain coverage for a number of participants per study (when the needed FOV is underestimated), or an unnecessarily large voxel-size or number of slices (when the FOV needed to achieve full brain coverage is overestimated). Importantly, FOV-size can interact with other MRI acquisition parameters including volume repetition time (TR) and voxel size. An example is the in-plane resolution of the resulting image, which is determined by a combination of the FOV and the imaging matrix. For in- stance, a 64 × 64 imaging matrix with a FOV of 192 × 192 mm would re- sult in 3 mm squares; a 64 × 64 imaging matrix with a FOV of 256 × 256 mm would result in 4 mm squares. A second example is the direct relationship between slice thickness, the number of slices in a volume NeuroImage 98 (2014) 513–520 ⁎ Corresponding author at: Donders Institute for Brain, Cognition and Behaviour, P.O. Box 9010, 6500 GL Nijmegen, The Netherlands. E-mail address: [email protected] (M. Mennes). http://dx.doi.org/10.1016/j.neuroimage.2014.04.030 1053-8119/© 2014 Elsevier Inc. All rights reserved. Contents lists available at ScienceDirect NeuroImage journal homepage: www.elsevier.com/locate/ynimg
-
Upload
independent -
Category
Documents
-
view
0 -
download
0
Transcript of Optimizing full-brain coverage in human brain MRI through population distributions of brain size

NeuroImage 98 (2014) 513–520
Contents lists available at ScienceDirect
NeuroImage
j ourna l homepage: www.e lsev ie r .com/ locate /yn img
Technical Note
Optimizing full-brain coverage in human brain MRI through populationdistributions of brain size
Maarten Mennes a,b,⁎, Mark Jenkinson c, Romain Valabregue d, Jan K. Buitelaar a,b,Christian Beckmann b,c, Stephen Smith c
a Department of Cognitive Neuroscience, Radboud University Nijmegen Medical Centre, Nijmegen, The Netherlandsb Donders Institute for Brain, Cognition and Behaviour, Radboud University Nijmegen, Nijmegen, The Netherlandsc Centre for Functional MRI of the Brain, University of Oxford, Oxford, United Kingdomd Inserm, U975, CNRS, UMR 7225, CENIR: Centre de NeuroImagerie de Recherche, ICM Paris, France
⁎ Corresponding author at: Donders Institute for BrainBox 9010, 6500 GL Nijmegen, The Netherlands.
E-mail address: [email protected] (M. M
http://dx.doi.org/10.1016/j.neuroimage.2014.04.0301053-8119/© 2014 Elsevier Inc. All rights reserved.
a b s t r a c t
a r t i c l e i n f oArticle history:Accepted 8 April 2014Available online 18 April 2014
Keywords:Population brain sizeField-of-viewFOVNeuroimaging
When defining an MRI protocol, brain researchers need to set multiple interdependent parameters that definerepetition time (TR), voxel size, field-of-view (FOV), etc. Typically, researchers aim to image the full brain, mak-ing the expected FOV an important parameter to consider. Especially in 2D-EPI sequences, non-wasteful FOV set-tings are important to achieve the best temporal and spatial resolution. In practice, however, imperfect FOV sizeestimation often results in partial brain coverage for a significant number of participants per study, or, alterna-tively, an unnecessarily large voxel-size or number of slices to guarantee full brain coverage. To provide norma-tive FOV guidelines we estimated population distributions of brain size in the x-, y-, and z-direction using datafrom 14,781 individuals. Our results indicated that 11 mm in the z-direction differentiate between obtainingfull brain coverage for 90% vs. 99.9% of participants. Importantly, we observed that rotating the FOV to optimallycover the brain, and thus minimize the number of slices needed, effectively reduces the required inferior–superior FOV size by ~5%. For a typical adult imaging study, 99.9% of the population can be imaged with fullbrain coverage when using an inferior–superior FOV of 142mm, assuming optimal slice orientation andminimalwithin-scanheadmotion. By providing population distributions for brain size in the x-, y-, and z-directionwe im-prove the potential for obtaining full brain coverage, especially in 2D-EPI sequences used in most functional anddiffusion MRI studies. We further enable optimization of related imaging parameters including the number ofslices, TR and total acquisition time.
© 2014 Elsevier Inc. All rights reserved.
Introduction
When implementing an imaging protocol for a new neuroimagingstudy, researchers need to decide on multiple interdependent parame-ters that determine the properties and capabilities of their MRIsequences. One basic but important parameter is the size of the field-of-view (FOV). The FOV determines the size of the imaging windowthat will be used. Depending on the placement of the participant in thescanner, FOV determines what parts of the brain are imaged. Typically,researchers aim to obtain full coverage of a participant's brain, includingthe cerebellum (often the inferior extreme) as well as the upper parts ofsomatosensory cortex (the superior extreme). Moreover, in light of in-creased interest in whole-brain connectivity-based analyses in FMRI orDTI studies, full brain coverage is highly desirable. Excluding parts ofthe brain, such as the cerebellum or parts of somatosensory cortex,will result in incomplete and thus incorrect ‘whole-brain’ connectivity
, Cognition and Behaviour, P.O.
ennes).
matrices and their derived measures (e.g., degree centrality, pathlength).
As the sameMRI sequences are typically used for all participants in astudy, it is imperative to consider the expected FOV needed to achievefull brain coverage for most – if not all – participants. However, noguidelines regarding required FOV size for typical populations of inter-est exist. In practice, FOV size is commonly roughly estimated basedon previous experience or the brain size of a (large-headed) pilot sub-ject. This often results in either partial brain coverage for a number ofparticipants per study (when the needed FOV is underestimated), oran unnecessarily large voxel-size or number of slices (when the FOVneeded to achieve full brain coverage is overestimated).
Importantly, FOV-size can interact with other MRI acquisitionparameters including volume repetition time (TR) and voxel size. Anexample is the in-plane resolution of the resulting image, which isdetermined by a combination of the FOV and the imagingmatrix. For in-stance, a 64 × 64 imagingmatrixwith a FOV of 192 × 192mmwould re-sult in 3 mm squares; a 64 × 64 imaging matrix with a FOV of 256 ×256 mmwould result in 4 mm squares. A second example is the directrelationship between slice thickness, the number of slices in a volume

514 M. Mennes et al. / NeuroImage 98 (2014) 513–520
and the volume TR (for many types of MRI sequences). The smallerthe slice thickness, the more slices are needed to cover the FOV,and, in 2D imaging sequences, the more slices in a volume, the longerthe TR.
Optimal FOV settings are generally not critical for 3D anatomical se-quences, where researchers are less interested in temporal resolution,and more in factors such as optimal signal-to-noise ratios, and avoid-ance of aliasing of extreme areas of tissue on top of each other. In con-trast, the interdependence between sequence parameters is especiallyimportant for 2D-EPI sequences used in most FMRI and DTI studies. InFMRI studies, researchers aim to scan as fast as possible (optimal tem-poral resolution) while using the highest possible spatial resolution.Here, non-optimal FOV settings will either result in longer TRs (due tomore slices) and hence a lower temporal resolution, or in sub-optimalbrain coverage or spatial resolution when researchers do not want tosacrifice imaging speed. Likewise, in 2D-EPI based diffusion MRI se-quences, liberal FOV settings will result in unnecessary long scanningtimes, reduced spatial resolution, or a reduced number of diffusion-encoding directions/repeats. It is our experience that FOV is too oftenunderestimated in 2D-EPI sequences, as researchers are reluctant tosacrifice imaging speed or scan for longer periods. This underestimationinvariably leads to data-loss when full brain coverage is desired. For in-stance, in many cases the cerebellum is incomplete.
To facilitate optimal FOV settings for MRI sequences we sought toestablish population distributions of brain size in the x-, y-, andz-direction. To achieve this goal we considered data from 16,351 indi-viduals (including 14,781 in our final analysis). Providing normativeFOV estimates will improve the potential for obtaining full brain cover-age, while providing opportunities to optimize related imaging param-eters including the number of slices, maximal resolution and TR,especially in 2D-EPI sequences.
Methods
Included datasets
We considered high-resolution, T1-weighted anatomical scans from16,351 individuals, aggregated across several sources. From the Interna-tional Neuroimaging Datasharing Initiative (INDI, www.fcon_1000.projects.nitrc.org) we included 1,286 individuals from the FCP ClassicCollection (Biswal et al., 2010), 912 individuals from the ADHD-200sample (Fair et al., 2012), 1,102 individuals from the ABIDE sample (DiMartino et al., 2013), 77 individuals from the Power2012 sample, and323 from the NKI-Rockland sample (Nooner et al., 2012). In additionto these openly available datasets, we included 3,306 T1-weightedscans collected at the Donders Institute in Nijmegen, The Netherlands
Fig. 1. Age and sex distribution for all datasets included in the final analysis (n = 14,781).separately.
(813 from the NeuroIMAGE sample, and 2493 from the BIG sample);1,279 T1-weighted scans collected at the Max Planck Institute in Leip-zig; 7,317 scans collected at the CENIR in Paris; and 749 scans collectedby the Institute for Pediatric Neuroscience at the NYU Langone MedicalCenter. To avoid possible overlap between the local NYU datasets andNYU datasets also available in INDI, we excluded all NYU datasetsprovided in INDI (n= 447). Age and sex are known for every individualdataset; datasets lacking demographic information were excluded(n = 183).
Participant ethnicity (beyond imaging site location) was not avail-able for most datasets. Access to this information would have allowedcalculating ethnicity-specific distributions of brain size, allowing furtheroptimization of imaging parameters. It is, for example, a common obser-vation that Asian participants have rounder brains, while brains of Cau-casian participants are typically elongated (Tang et al., 2010; Zilles et al.,2001). Making assumptions about participant ethnicity based on imag-ing site location, we estimate ~97% of included participants were likelyof Caucasian descent.
By combining all datasets we were able to span an age range fromage 2 to 95 years (Fig. 1). The age-range between 18 and 25 was over-represented in accordance with the typical inclusion of college-agedparticipants inmost non-clinical FMRI studies. See Inline SupplementaryFigure S1 for dataset specifics.
Inline Supplementary Fig. S1 can be found online at http://dx.doi.org/10.1016/j.neuroimage.2014.04.030.
Calculating brain size
Fig. 2 illustrates the analytical pipeline used to calculate brain size inthe x-, y-, and z-direction for eachhigh-resolution, T1-weighted anatom-ical scan. After removing the skull of each T1-weighted scanwe obtainedfor each brain the linear transformation (12 degrees-of-freedom) to theMNI152 standard space brain template using FSL's FLIRT (Jenkinson andSmith, 2001; Jenkinson et al., 2002).We visually verified the transforma-tion of each participant's brain to the MNI152 brain and excluded 940datasets from further analysis due to misalignment. Observed misalign-ments were not caused by aberrant brain size, but were related to inferi-or image quality or failed skull removal. Next, we applied the inverse ofthe 12 degrees-of-freedom linear transformation to an MNI152 brainmask with 1 mm isotropic resolution. Hence we obtained a subject-specific version of the MNI152 brain mask. Of note, we did not seekfull non-linear transformation of each individual's brain to MNI152space, as the 12 degrees-of-freedom linear transformation alreadymatched the overall dimensions of each participant's brain to theMNI152 brain robustly. Additional subject-specific brain extraction andhigh degree-of-freedom non-linear transformationmight accommodate
Inline Supplementary Figure S1 illustrates the age and sex distribution for each sample

MNI152
MNI152 maskNative space
rigid body translation and rotation
Native T1
12dof linear transformation
12dof inversetransformation
MNI152 spacex
z
y
Fig. 2. Pipeline used to calculate brain size in the x-, y-, and z-direction. Step 1 calculated the linear transformation for each T1-weighted image to MNI152 standard space (FSL FLIRT 12degrees-of-freedom). Step 2 transformed amask derived from theMNI152 brain to each individual's native space using the exact inverse of the transformation obtained in step 1. In step 3we transformed the native space MNI152 brain mask back to MNI152 standard space using a rigid body transformation (i.e., not allowing any rescaling or shearing of the mask, therebyretaining subject-specific brain size); nextwe rotated the brain around the x-axis to occupyminimal FOV in the z-direction (see also Fig. 3).Whenminimal FOVwas achievedwe recordedbrain size in the x-, y-, and z-direction.
515M. Mennes et al. / NeuroImage 98 (2014) 513–520
local, subject-specific protrusions, but would likely result in an overallloss of robustness (given the amount of participants), without gainingaccuracy as the brain's outline does not vary dramatically across partici-pants. Hence, our analysis pipeline avoids the influence of subject-specific small inaccuracies in skull-stripping that might influence braindimensions (e.g., a small piece of remaining neck would affect brainsize in the z-direction).
The brain maskwas then transformed back to MNI152 space (1mmisotropic resolution) using the original 12dof T1-to-MNI152 transfor-mation, but with the transformation parameters restricted to generat-ing the closest possible rigid body transformation. This rigid bodytransformation only incorporated rotations and shifts to align the
Fig. 3. Illustration of coverage gained by rotating the FOV to achieve optimal coverage. By rotatinbrain) without changing the size of the FOV (i.e., without adding extra slices).
cardinal axes and origin of each brain, while specifically avoiding anyscaling that would alter brain size. The use of a 1 mm isotropicMNI152 brain mask aligned to MNI152 space facilitated calculationsby having all brains in 1 mm isotropic resolution, and by aligning allbrains with the MNI152 cardinal axes and origin. The applied transfor-mations did not alter brain size and none of the transformation param-eters were used to estimate brain size.
The resulting subject-specific brain mask in 1 mm isotropic MNI152space (which has the AC–PC line perpendicular to z) was then rotatedaround the x-axis (i.e., backward/up or forward/down), to occupymin-imal space in the z-direction (see Fig. 3 for an example).Whenminimalz-size was attained, we recorded brain size in the x-, y-, and z-direction
g the FOV it is possible to include the bottomof the cerebellum (indicated in red on the left

Fig. 4. Empirical population (n= 14,781) distributions of brain size in the x-, y-, and z-direction after optimal rotation of the FOV to achieveminimal size in the z-direction. Graphs on theright illustrate distributions for males (n= 7,716) and females (n = 7,065) separately. Median values are indicated for each distribution. Graphs on the bottom row illustrate the distri-butions after log-transformation of the y-axis to highlight uniformity in the tails of the distributions.
516 M. Mennes et al. / NeuroImage 98 (2014) 513–520
using FSL's FSLSTATS command with the ‘-w’ option; in addition we re-corded the angle of rotation needed to achieve minimal z-size. Finally,we calculated the size of the brain mask transformed to MNI152 spacewithout any extra rotation applied. This provided a measure of brainsize when aligning the FOVwith the anterior and posterior commissure
Table 1Population percentiles of FOV size (mm) in the x-, y-, and z-direction. IncludedN = 14,781, ageafter rotation of the FOV to achieveminimal distance in the z-direction. Importantly, we adviseticipantmotion. Thefinal columns indicate changes in FOV-size due to FOV rotation to achievemFOV rotation.
Percentile AC–PC orientation Optimal FO
x y z x
0.0 115 141 108 1140.1 118 148 111 1180.5 121 151 114 1211.0 122 153 116 12210.0 127 162 122 12750.0 133 172 129 13380.0 138 179 134 13885.0 139 180 135 13990.0 141 182 137 14195.0 143 185 139 14399.0 148 190 143 14799.5 149 192 144 14999.9 153 196 149 153100.0 159 207 160 159
(or AC–PC line), a common strategy for placing the FOV of T1-weightedanatomical scans.
To summarize, our outcomemeasures of interest were: brain size inthe x-, y-, and z-direction under AC–PC alignment; brain size in the x-,y-, and z-direction when rotating the brain to obtain minimal size in
range = 2–95 years, 52%males. FOV size is displayedboth for AC–PCorientation aswell asto include at least 3 mmextra FOV size in each direction to accommodatewithin-scan par-inimal z-size. Negative numbers indicate coverage (inmm)gainedwhen applyingoptimal
V orientation FOV change after rotation
y z x y z
139 101 −1 −2 −7144 107 0 −4 −4148 110 0 −3 −4150 111 0 −3 −5159 117 0 −3 −5169 124 0 −3 −5176 129 0 −3 −5177 130 0 −3 −5179 131 0 −3 −6182 133 0 −3 −6187 137 −1 −3 −6189 138 0 −3 −6194 142 0 −2 −7201 152 0 −6 −8
517M. Mennes et al. / NeuroImage 98 (2014) 513–520
the z-direction; and the rotation angle needed fromAC–PC alignment toachieve minimal z-size in the z-direction.
Creating population distributions
Using final data from 14,781 individuals we plotted brain size distri-butions for the complete sample, as well as for males and females sepa-rately. Using the empirical size distributions we calculated percentiletables that can readily be used to determine the FOV size needed toachieve full brain coverage for e.g., 99.9% of a sample.
In addition, we determined the distribution andmean of the rotationangles needed to achieve minimal z-size. By comparing the percentiletables obtained for brain size achieving minimal z-size and brain sizeunder AC–PC orientation, we assessed whether rotating the FOV toachieve minimal z-size effectively resulted in significant coverage
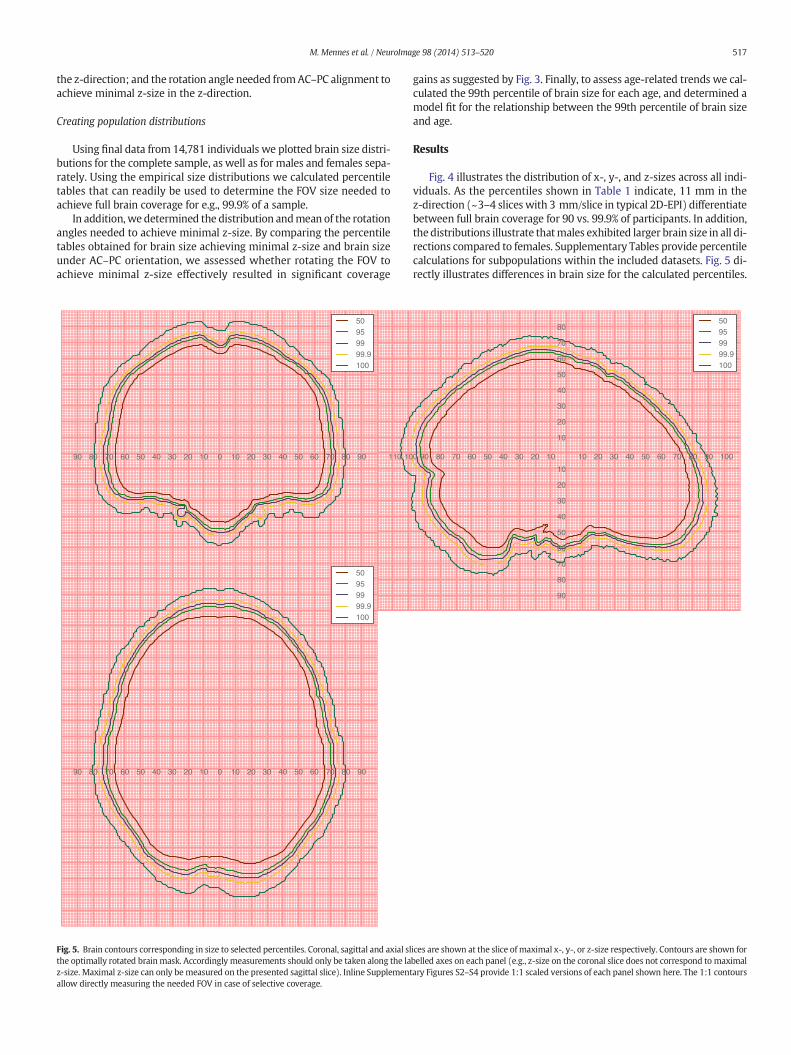
Fig. 5. Brain contours corresponding in size to selected percentiles. Coronal, sagittal and axial slthe optimally rotated brainmask. Accordingly measurements should only be taken along the laz-size. Maximal z-size can only bemeasured on the presented sagittal slice). Inline Supplementallow directly measuring the needed FOV in case of selective coverage.
gains as suggested by Fig. 3. Finally, to assess age-related trends we cal-culated the 99th percentile of brain size for each age, and determined amodel fit for the relationship between the 99th percentile of brain sizeand age.
Results
Fig. 4 illustrates the distribution of x-, y-, and z-sizes across all indi-viduals. As the percentiles shown in Table 1 indicate, 11 mm in thez-direction (~3–4 slices with 3 mm/slice in typical 2D-EPI) differentiatebetween full brain coverage for 90 vs. 99.9% of participants. In addition,thedistributions illustrate thatmales exhibited larger brain size in all di-rections compared to females. Supplementary Tables provide percentilecalculations for subpopulations within the included datasets. Fig. 5 di-rectly illustrates differences in brain size for the calculated percentiles.
ices are shown at the slice of maximal x-, y-, or z-size respectively. Contours are shown forbelled axes on each panel (e.g., z-size on the coronal slice does not correspond to maximalary Figures S2–S4 provide 1:1 scaled versions of each panel shown here. The 1:1 contours

Fig. 6. Developmental trends observed for the 99th percentile of brain size in the x-, y-, and z-direction. Brain size is displayed after rotating the FOV to achieve minimal size in thez-direction (see Inline Supplementary Figure S5 for a similar graph using AC–PC FOV orientation). Markers illustrate individual data points. Finally, we added linear regression modelsfor the relationship between age and the 99th percentile brain sizes. For size in the y- and z-direction, we included separate linear models for ages b16 years and ages ≥16 years.Error bars display 99% confidence intervals of the regression lines obtained by bootstrapping the regression 10,000 times using 80% of the data points.
518 M. Mennes et al. / NeuroImage 98 (2014) 513–520
For further reference, Inline Supplementary Figures S2–S4 provide 1:1scaled versions of the panels in Fig. 5. These 1:1 scaled figures can beused to measure FOV size (using a ruler or tape measure) when aimingto cover only part of the brain (e.g., visual cortex only).
Inline Supplementary Figs. S2-S4 can be found online at http://dx.doi.org/10.1016/j.neuroimage.2014.04.030.
All FOVs had to be rotated from AC–PC alignment to achieve minimalz-size. The mean angle of rotation was 15.94 (±1.99) degrees counterclockwise when in RPI orientation. This is a rotation of the front of thebrain downwithin the imagingmatrix, which, in practice, means rotatingthe front of the imaging matrix upwith respect to the brain. Rotating theFOV resulted in up to 8 mm gained coverage compared to aligning theFOV to the AC–PC line (see Table 1). 83% of rotations needed to achieveoptimal coverage were within 14–18° upward from AC–PC orientation.
Fig. 6 illustrates changes in the 99th percentile of x-, y-, z-brain sizeas a function of age.While brain size increased in all directions up to age16, only the y- and z-direction exhibited a steady decrease after age 16.Linear models best characterized the relationship between age and the99th percentile of brain size. For size in the y- and z-direction, models
were fitted separately for age b16 and age ≥16. Inline SupplementaryFigure S5 displays the age–relationship and linear model fits for brainsize under AC–PC orientation. In addition, the Supplementary Materialprovides tables for the following age categories: b16, ≥16, as well asfor every 2-year age bin. Of note, linear models provided in Fig. 6would allow estimating the 99th percentile FOV size for any age.
Inline Supplementary Fig. S5 can be found online at http://dx.doi.org/10.1016/j.neuroimage.2014.04.030.
Discussion
Tailoring MR imaging sequences to match the needs of brain re-searchers involves choosing many controlling parameters, includingthe number of slices, TR and FOV. Achieving themost optimal combina-tion of settings is especially important in FMRI experiments where bothoptimal temporal and spatial resolution are desired. Underestimatingthe FOV or number of slices results in data loss due to incompletebrain coverage. As typical group-level analyses only include voxelsthat are present in all participants, incomplete brain coverage in one

519M. Mennes et al. / NeuroImage 98 (2014) 513–520
participant will result in the exclusion of missing voxels in all partici-pants. In contrast, overestimating the needed FOV or number of sliceswill result in losing spatial resolution (increased slice thickness) or tem-poral resolution (longer TR). Here we used data from 14,781 partici-pants to provide population distributions of brain size in the x-, y-,and z-direction. These distributions will help guide decisions on FOVsize and the number of slices needed to achieve full brain coverage in(2D-EPI) MRI experiments.
Importantly, optimizing the FOV size or number of slices for a popu-lation of interest is not trivial. Our brain size distributions indicated thatthere is an 11 mm difference between being able to obtain full braincoverage in the z-direction for 90% vs. 99.9% of the population. In prac-tice this differencewould typically translate into theneed to include 3–4extra slices or, when the number of slices is kept constant, a loss in spa-tial resolution of about 0.2 mm per slice.
Already implemented at some imaging sites, our results confirm thepotential of increased brain coverage when optimally angling the FOV.Our results indicated that on average rotating the FOV about 16°counter-clockwise (when in RPI orientation) from AC–PC alignmentyielded the best results. As 83% of rotations needed to achieve optimalcoverage were within 14–18° and percentiles obtained for a fixed 16°rotation were virtually identical to the optimal FOV orientation percen-tiles, we suggest using a standard rotation of about 16° from AC–PCalignment. Choosing such standard rotation will avoid between-participant differences in signal-dropout or distortions due to differ-ences in the slice angling. However, a fixed rotation parameter mightreduce the number of participants that will fit the chosen FOV, assome participants will require more or less rotation to achieve fullbrain coverage.
When working with a tight fitting FOV there is by definition no mar-gin for error. Participant movement could move the participant's brainout of the FOV leading to data loss. Likewise, inadequate FOV placement(typically guided by a localizer scan) will result in data loss. Accordingly,we advise including at least 3 mm in each direction over and above theFOV size needed to obtain full brain coverage for the desired percentageof a population. To minimize the effect of between-scan participantmovement, one could also repeat short localizer scans before each scanof interest, thus facilitating optimal bounding box placement for eachscan. Note that when optimal FOV rotation is employed, the most frontaltip of orbitofrontal cortex and/or the temporal lobes, in addition to thecerebellum, likely determine placement of the lower boundaries of theFOV.
A second consideration in addition to participant motion is that atight FOV in the phase encoding direction (generally y or x) can resultin ‘wrap around’ of structures outside the FOV (e.g., the nose or ears).As a result, signals from those structures may be aliased with signal onthe opposite side of the FOV (e.g., signal from the nose aliased with sig-nal from the back of the brain). Accordingly using a sufficiently largeFOV in the phase encoding direction is recommended. As a guideline,we determined that the size of the MNI152 head (i.e., with skull) was24% larger in the x-direction and 16% larger in the y-direction comparedto the MNI152 brain. To be able to cover the full MNI152 head onewould need to expand the FOV at least 34 mm in the x-direction and29 mm in the y-direction. It should be clear however, that enlargingthe FOV in the phase encoding direction comes with a much smaller re-duction in performance compared to the changes in imaging speed as-sociated with adding or removing complete slices. Accordingly, toavoid signal wrap around, we recommend choosing a sufficiently largeFOV in the phase encoding direction. Of note, in 2D-EPI sequences thenose is typically located well below the chosen FOV (especially whenthe FOV is rotated as recommended), thus avoiding signal wrap-around altogether.
Finally, the limited size of certain head coils physically prevents in-clusion of some participants with a particularly large head, a rather pro-truding nose or the need to wear glasses. These participants are notincluded in the current population distributions, as they were excluded
at the time of imaging. Accordingly, the presented brain size distribu-tions are representative for the typical ‘image-able’ participant. As fu-ture technological advances might enable inclusion of any head size,wemight envision a small shift towards larger brain sizes for the highestpercentiles.
When assessing the presented population distributions, the readershould be aware that these distributions are based on a heterogeneousaggregation of available open-access and local datasets. The includeddatasets were not uniformly sampled from one single population.Datasets were included from over 50 imaging sites spread across theworld. In addition, at least 7% percent of the included sample had a con-firmed psychiatric diagnosis of Attention Deficit Hyperactivity Disorder(ADHD) or Autism Spectrum Disorders (ASD). Including such variety ofparticipants supports the generalizability of the proposed distributions.However, our empirical distributions might for instance be biassed to-wards the elongated and higher brains of Caucasian participants, asthey constituted the majority of included datasets. As a guideline, aChinese brain template was 6% larger in the x-direction (wider), 5%smaller in the y-direction (shorter) and 11% smaller in the z-direction(lower) compared to theMNI152 template (Tang et al., 2010). A Koreanbrain template on the other hand was 10% smaller in both y and z, butequal in x compared to the MNI152 template (Lee et al., 2005).
Conclusions
Through combining data from 14,781 participants we provided acomprehensive description of brain size in the x-, y-, and z-direction.The associated population distributions of brain size will help guideFOV settings to achieve full brain coverage, especially in 2D-EPI se-quences where both optimal temporal and spatial resolutions are de-sired. Covering an extra 11 mm in the z-direction will differentiatebetween obtaining full brain coverage for 90 vs. 99.9% of a study sample.Importantly, rotating the FOV ~16° from typical AC–PC alignment canresult in up to 8mmgained coverage. Finally, we encourage researchersto include a safety margin at least 3 mm in every direction of their FOVto accommodate participant movement and allow optimal FOV place-ment. Brain researchers can readily use our results to guide their FOVsettings. This will invariably result in less data loss due to insufficientbrain coverage and optimization of associated imaging parameters,resulting in better spatial and temporal resolution.
Acknowledgments
The authors like to thank the past and presentmembers of the Insti-tute for Pediatric Neuroscience at the NYU Langone Medical Center forproviding the NYU datasets; Daniel Margulies and Judy Kipping fromthe Max Planck Institute for Human Cognitive and Brain Sciences inLeipzig for their help including the Max Planck Datasets; and all thepast and present members of the BIG and NeuroIMAGE consortia forthe inclusion of their data. This work makes use of the BIG (Brain Imag-ing Genetics) database, first established in Nijmegen, The Netherlands,in 2007. This resource is now part of Cognomics (www.cognomics.nl),a joint initiative by researchers of the Donders Centre for Cognitive Neu-roimaging, the Human Genetics and Cognitive Neuroscience depart-ments of the Radboud University Medical Centre and the Max PlanckInstitute for Psycholinguistics in Nijmegen. The Cognomics Initiative issupported by the participating departments and centres and by externalgrants, i.e. the Biobanking and Biomolecular Resources Research Infra-structure (Netherlands) (BBMRI-NL), the Hersenstichting Nederland,and the Netherlands Organisation for Scientific Research (NWO). TheNeuroIMAGE project was supported by NIH Grant R01MH62873 (toStephen V. Faraone), NWO Large Investment Grant 1750102007010and ZonMW Grant 60-60600-97-193 (to Jan Buitelaar), and grantsfrom the Radboud University Nijmegen Medical Center, UniversityMedical Center Groningen and Accare, and VU University Amsterdam.MM is supported by a Brain & Cognition grant (056-13-015) to Jan

520 M. Mennes et al. / NeuroImage 98 (2014) 513–520
Buitelaar.Wewould also like to thankMarkus Barth, Marcel Zwiers andRasim Boyacioglu for helpful MR physics discussions. Finally, we wouldlike to thank The Neuro Bureau for facilitating collaboration in action,thereby greatly accelerating the data inclusion rate for this study.
Appendix A. Supplementary data
Supplementary data to this article can be found online at http://dx.doi.org/10.1016/j.neuroimage.2014.04.030.
References
Biswal, B.B., Mennes, M., Zuo, X.-N., Gohel, S., Kelly, C., Smith, S.M., Beckmann, C.F.,Adelstein, J.S., Buckner, R.L., Colcombe, S., Dogonowski, A.-M., Ernst, M., Fair, D.,Hampson, M., Hoptman, M.J., Hyde, J.S., Kiviniemi, V.J., Kötter, R., Li, S.-J., Lin, C.-P.,Lowe, M.J., Mackay, C., Madden, D.J., Madsen, K.H., Margulies, D.S., Mayberg, H.S.,McMahon, K., Monk, C.S., Mostofsky, S.H., Nagel, B.J., Pekar, J.J., Peltier, S.J., Petersen,S.E., Riedl, V., Rombouts, S.A.R.B., Rypma, B., Schlaggar, B.L., Schmidt, S., Seidler, R.D.,Siegle, G.J., Sorg, C., Teng, G.-J., Veijola, J., Villringer, A., Walter, M., Wang, L., Weng,X.-C., Whitfield-Gabrieli, S., Williamson, P., Windischberger, C., Zang, Y.-F., Zhang,H.-Y., Castellanos, F.X., Milham, M.P., 2010. Toward discovery science of humanbrain function. Proc. Natl. Acad. Sci. U. S. A. 107, 4734–4739.
Di Martino, A., Yan, C.-G., Li, Q., Denio, E., Castellanos, F.X., Alaerts, K., Anderson, J.S., Assaf,M., Bookheimer, S.Y., Dapretto, M., Deen, B., Delmonte, S., Dinstein, I., Ertl-Wagner, B.,Fair, D.A., Gallagher, L., Kennedy, D.P., Keown, C.L., Keysers, C., Lainhart, J.E., Lord, C.,Luna, B., Menon, V., Minshew, N.J., Monk, C.S., Mueller, S., ller, R.-A.M.U., Nebel, M.B.,Nigg, J.T., Hearn, K.O.A., Pelphrey, K.A., Peltier, S.J., Rudie, J.D., Sunaert, S., Thioux, M.,Tyszka, J.M., Uddin, L.Q., Verhoeven, J.S., Wenderoth, N., Wiggins, J.L., Mostofsky, S.H.,
Milham, M.P., 2013. The autism brain imaging data exchange: towards a large-scaleevaluation of the intrinsic brain architecture in autism. Mol. Psychiatry 1–9.
Fair, D.A., Nigg, J.T., Iyer, S., Bathula, D., Mills, K.L., Dosenbach, N.U.F., Schlaggar, B.L.,Mennes, M., Gutman, D., Bangaru, S., Buitelaar, J.K., Dickstein, D.P., Di Martino, A.,Kennedy, D.N., Kelly, C., Luna, B., Schweitzer, J.B., Velanova, K., Wang, Y.-F.,Mostofsky, S., Castellanos, F.X., Milham, M.P., 2012. Distinct neural signatures detect-ed for ADHD subtypes after controlling for micro-movements in resting state func-tional connectivity MRI data. Front. Syst. Neurosci. 6, 80.
Jenkinson, M., Smith, S., 2001. A global optimisation method for robust affine registrationof brain images. Med. Image Anal. 5, 143–156.
Jenkinson, M., Bannister, P., Brady, M., Smith, S., 2002. Improved optimization for the ro-bust and accurate linear registration and motion correction of brain images.NeuroImage 17, 825–841.
Lee, J.S., Lee, D.S., Kim, J., Kim, Y.K., Kang, E., Kang, H., Kang, K.W., Lee, J.M., Kim, J.J., Park, H.J.,Kwon, J.S., Kim, S.I., Yoo, T.W., Chang, K.H., Lee, M.C., 2005. Development of Koreanstandard brain templates. J. Korean Med. Sci. 20, 483–488.
Nooner, K.B., Colcombe, S.J., Tobe, R.H.,Mennes, M., Benedict, M.M., Moreno, A.L., Panek, L.J.,Brown, S., Zavitz, S.T., Li, Q., Sikka, S., Gutman, D., Bangaru, S., Schlachter, R.T., Kamiel,S.M., Anwar, A.R., Hinz, C.M., Kaplan, M.S., Rachlin, A.B., Adelsberg, S., Cheung, B.,Khanuja, R., Yan, C., Craddock, C.C., Calhoun, V., Courtney, W., King, M., Wood, D.,Cox, C.L., Kelly, A.M.C., Di Martino, A., Petkova, E., Reiss, P.T., Duan, N., Thomsen, D.,Biswal, B., Coffey, B., Hoptman, M.J., Javitt, D.C., Pomara, N., Sidtis, J.J., Koplewicz, H.S.,Castellanos, F.X., Leventhal, B.L., Milham, M.P., 2012. The NKI-Rockland sample: amodel for accelerating the pace of discovery science in psychiatry. Front. Neurosci. 6,152.
Tang, Y., Hojatkashani, C., Dinov, I.D., Sun, B., Fan, L., Lin, X., Qi, H., Hua, X., Liu, S., Toga,A.W., 2010. The construction of a Chinese MRI brain atlas: a morphometric compar-ison study between Chinese and Caucasian cohorts. NeuroImage 51, 33–41.
Zilles, K., Kawashima, R., Dabringhaus, A., Fukuda, H., Schormann, T., 2001. Hemisphericshape of European and Japanese brains: 3-D MRI analysis of intersubject variability,ethnical, and gender differences. NeuroImage 13, 262–271.