Relationships between Brain Activation and Brain Structure in Normally Developing Children
10
Cerebral Cortex November 2009;19:2595--2604 doi:10.1093/cercor/bhp011 Advance Access publication February 24, 2009 Relationships between Brain Activation and Brain Structure in Normally Developing Children Lisa H. Lu 1,2 , Mirella Dapretto 3,4 , Elizabeth D. O’Hare 1,4 , Eric Kan 1 , Sarah T. McCourt 1 , Paul M. Thompson 1,4 , Arthur W. Toga 1 , Susan Y. Bookheimer 3,4 and Elizabeth R. Sowell 1,4 1 UCLA Laboratory of Neuro Imaging, Department of Neurology, Los Angeles, CA 90095, USA, 2 Roosevelt University, Department of Psychology, Chicago, IL 60605, USA, 3 UCLA Department of Psychiatry and Biobehavioral Sciences, Los Angeles, CA 90095, USA and 4 UCLA Interdepartmental Ph.D. Program for Neuroscience, Los Angeles, CA 90095, USA Dynamic changes in brain structure, activation, and cognitive abilities co-occur during development, but little is known about how changes in brain structure relate to changes in cognitive function or brain activity. By using cortical pattern matching techniques to correlate cortical gray matter thickness and functional brain activity over the entire brain surface in 24 typically developing children, we integrated structural and functional magnetic resonance imaging data with cognitive test scores to identify correlates of mature performance during orthographic processing. Fast-naming individuals activated the right fronto-parietal attention network in response to novel fonts more than slow-naming individuals, and increased activation of this network was correlated with more mature brain morphology in the same fronto-parietal region. These relationships remained even after effects of age or general cognitive ability were statistically controlled. These results localized cortical regions where mature morphology corresponds to mature patterns of activation, and may suggest a role for experience in mediating brain structure--activation relationships. Keywords: attention, fMRI, imaging, language, morphometry Introduction Structural brain imaging studies have revealed dynamic spatial and temporal patterns of brain development, but how such morphological changes relate to cognitive skills remain largely unexplored. Specifically, the dorsal cortices of the frontal and parietal lobes show dramatic and regionally variable trajecto- ries of change during childhood and adolescence (Sowell, Thompson, Holmes, Jernigan, et al. 1999; Sowell et al. 2001, 2003; Gogtay et al. 2004; Sowell, Thompson, Leonard, et al. 2004; Shaw et al. 2006), with parietal cortices thinning most rapidly between childhood and adolescence (Sowell, Thompson, Holmes, Batth, et al. 1999), and frontal lobes thinning most rapidly between adolescence and young adult- hood (Sowell, Thompson, Holmes, Jernigan, et al. 1999). This is important as executive functions attributable to frontal structures (Fuster 2002) continue to develop between adolescence and adulthood. However, considerable variability in cortical structure has been observed cross-sectionally (Sowell et al. 2003), even between individuals of the same age, and the growth trajectory is associated with gray matter thickening in some brain regions and thinning in other regions (Sowell et al. 2003; Sowell, Thompson and Toga 2004; Lu et al. 2007). Such variability challenges efforts to un- derstand the relationship between morphological maturation and cognitive skill maturation. Significant variability in functional brain activity has also been observed during childhood and adolescence (Turkeltaub et al. 2003; for example). Developmental differences in acti- vation patterns have manifested as a greater extent of activation in children than in adults (Thomas et al. 1999; Gaillard et al. 2000), increase in the degree of hemispheric lateralization with age (Holland et al. 2001), greater intensity of activation in adults than in children (Thomas et al. 1999; Gaillard et al. 2003; Booth et al. 2004), or increased activation with age in key regions related to the task accompanied by decreased ac- tivation with age in regions less centrally related to the task (Rivera et al. 2005). It has been speculated that through experience and maturation, there is a shift from more diffuse activation to more focal activation as plasticity declines and efficiency improves (Durston and Casey 2006; Durston et al. 2006), though developmental changes progressing from fewer to greater number of connections have also been proposed and supported (Brown et al. 2005). It is tempting to speculate that changes in functional activation observed during the childhood and adolescent period of rapid cognitive development are related to changes in brain structure, but little evidence to support this has been reported in the literature. In this study, we used cortical pattern matching techniques to anchor anatomical land- marks across individuals (Sowell, Thompson, Leonard, et al. 2004; Thompson et al. 2004) and integrated structural morphology with corresponding functional activation. Figure 1 depicts the model that guided our study. We first defined ‘‘mature’’ activation by identifying brain regions where activation intensity corresponded with skill level improvement. Then we looked for regions where ‘‘mature’’ activation corresponded with morphological growth trajectories associ- ated with maturation in previous reports (i.e., thinning in dorsal fronto-parietal regions; thickening in perisylvian regions) (Sowell, Thompson, Holmes, Jernigan, et al. 1999; Sowell et al. 2001, 2003; Gogtay et al. 2004; Sowell, Thompson, Leonard, et al. 2004; Shaw et al. 2006). If there are regions of overlap, then morphological maturation is associated with maturation of functional activation. It is important to note that both genetic influences that unfold with age and experience contribute to skill level. We statistically parsed out variance associated with age to illuminate structure--activation relationships indepen- dent of age effects. We hypothesized that mature cortical thickness patterns would be associated with mature activation patterns. Specifically, we expected thinning in frontal-parietal regions to be associated with more mature activation patterns during attentional aspects of an orthographic processing functional magnetic resonance imaging (fMRI) task and thickening in perisylvian language regions to be associated with more mature activation patterns on reading aspects of the task. Ó The Author 2009. Published by Oxford University Press. All rights reserved. For permissions, please e-mail: [email protected]
Transcript of Relationships between Brain Activation and Brain Structure in Normally Developing Children

Cerebral Cortex November 2009;19:2595--2604
doi:10.1093/cercor/bhp011
Advance Access publication February 24, 2009
Relationships between Brain Activationand Brain Structure in NormallyDeveloping Children
Lisa H. Lu1,2, Mirella Dapretto3,4, Elizabeth D. O’Hare1,4,
Eric Kan1, Sarah T. McCourt1, Paul M. Thompson1,4, Arthur
W. Toga1, Susan Y. Bookheimer3,4 and Elizabeth R. Sowell1,4
1UCLA Laboratory of Neuro Imaging, Department of Neurology,
Los Angeles, CA 90095, USA, 2Roosevelt University, Department
of Psychology, Chicago, IL 60605, USA, 3UCLA Department of
Psychiatry and Biobehavioral Sciences, Los Angeles, CA 90095,
USA and 4UCLA Interdepartmental Ph.D. Program for
Neuroscience, Los Angeles, CA 90095, USA
Dynamic changes in brain structure, activation, and cognitiveabilities co-occur during development, but little is known abouthow changes in brain structure relate to changes in cognitivefunction or brain activity. By using cortical pattern matchingtechniques to correlate cortical gray matter thickness and functionalbrain activity over the entire brain surface in 24 typically developingchildren, we integrated structural and functional magnetic resonanceimaging data with cognitive test scores to identify correlates ofmature performance during orthographic processing. Fast-namingindividuals activated the right fronto-parietal attention network inresponse to novel fonts more than slow-naming individuals, andincreased activation of this network was correlated with moremature brain morphology in the same fronto-parietal region. Theserelationships remained even after effects of age or general cognitiveability were statistically controlled. These results localized corticalregions where mature morphology corresponds to mature patterns ofactivation, and may suggest a role for experience in mediating brainstructure--activation relationships.
Keywords: attention, fMRI, imaging, language, morphometry
Introduction
Structural brain imaging studies have revealed dynamic spatial
and temporal patterns of brain development, but how such
morphological changes relate to cognitive skills remain largely
unexplored. Specifically, the dorsal cortices of the frontal and
parietal lobes show dramatic and regionally variable trajecto-
ries of change during childhood and adolescence (Sowell,
Thompson, Holmes, Jernigan, et al. 1999; Sowell et al. 2001,
2003; Gogtay et al. 2004; Sowell, Thompson, Leonard, et al.
2004; Shaw et al. 2006), with parietal cortices thinning
most rapidly between childhood and adolescence (Sowell,
Thompson, Holmes, Batth, et al. 1999), and frontal lobes
thinning most rapidly between adolescence and young adult-
hood (Sowell, Thompson, Holmes, Jernigan, et al. 1999). This
is important as executive functions attributable to frontal
structures (Fuster 2002) continue to develop between
adolescence and adulthood. However, considerable variability
in cortical structure has been observed cross-sectionally
(Sowell et al. 2003), even between individuals of the same
age, and the growth trajectory is associated with gray matter
thickening in some brain regions and thinning in other
regions (Sowell et al. 2003; Sowell, Thompson and Toga 2004;
Lu et al. 2007). Such variability challenges efforts to un-
derstand the relationship between morphological maturation
and cognitive skill maturation.
Significant variability in functional brain activity has also
been observed during childhood and adolescence (Turkeltaub
et al. 2003; for example). Developmental differences in acti-
vation patterns have manifested as a greater extent of activation
in children than in adults (Thomas et al. 1999; Gaillard et al.
2000), increase in the degree of hemispheric lateralization with
age (Holland et al. 2001), greater intensity of activation in
adults than in children (Thomas et al. 1999; Gaillard et al. 2003;
Booth et al. 2004), or increased activation with age in key
regions related to the task accompanied by decreased ac-
tivation with age in regions less centrally related to the task
(Rivera et al. 2005). It has been speculated that through
experience and maturation, there is a shift from more diffuse
activation to more focal activation as plasticity declines and
efficiency improves (Durston and Casey 2006; Durston et al.
2006), though developmental changes progressing from fewer
to greater number of connections have also been proposed and
supported (Brown et al. 2005).
It is tempting to speculate that changes in functional
activation observed during the childhood and adolescent
period of rapid cognitive development are related to changes
in brain structure, but little evidence to support this has been
reported in the literature. In this study, we used cortical
pattern matching techniques to anchor anatomical land-
marks across individuals (Sowell, Thompson, Leonard, et al.
2004; Thompson et al. 2004) and integrated structural
morphology with corresponding functional activation. Figure
1 depicts the model that guided our study. We first defined
‘‘mature’’ activation by identifying brain regions where
activation intensity corresponded with skill level improvement.
Then we looked for regions where ‘‘mature’’ activation
corresponded with morphological growth trajectories associ-
ated with maturation in previous reports (i.e., thinning in dorsal
fronto-parietal regions; thickening in perisylvian regions)
(Sowell, Thompson, Holmes, Jernigan, et al. 1999; Sowell et al.
2001, 2003; Gogtay et al. 2004; Sowell, Thompson, Leonard,
et al. 2004; Shaw et al. 2006). If there are regions of overlap,
then morphological maturation is associated with maturation of
functional activation. It is important to note that both genetic
influences that unfold with age and experience contribute to
skill level. We statistically parsed out variance associated with
age to illuminate structure--activation relationships indepen-
dent of age effects. We hypothesized that mature cortical
thickness patterns would be associated with mature activation
patterns. Specifically, we expected thinning in frontal-parietal
regions to be associated with more mature activation patterns
during attentional aspects of an orthographic processing
functional magnetic resonance imaging (fMRI) task and
thickening in perisylvian language regions to be associated
with more mature activation patterns on reading aspects of
the task.
� The Author 2009. Published by Oxford University Press. All rights reserved.
For permissions, please e-mail: [email protected]

Materials and Methods
SubjectsTwenty-eight normally developing children without history of neuro-
logical, psychiatric, or developmental disorders were recruited from
the community near the University of California, Los Angeles, CA. All
learned English as their native language. All subjects and their parents
gave written assent/consent according to procedures approved by the
UCLA Institutional Review Board. Three subjects whose structural or
functional scan had inadequate image quality were excluded. One
subject was excluded due to excessive movement. Table 1 provides
demographic descriptions of the remaining 24 subjects (age ranged
from 6 to 15).
Functional TaskOrthographic processing is a skill which develops rapidly during
childhood (Sprenger-Charolles et al. 2003) and involves detection of
visual features within printed stimuli. The orthographic processing task
described by Turkeltaub et al. (2003) required subjects to indicate the
presence of an ascending character in visually presented stimuli of either
real words or false font strings (e.g., k, l for the real word condition, and
similar nonletter tall characters in the false font string condition) by
button press with their right index finger and to indicate absence with
their right middle finger (Fig. 2). This task (Turkeltaub et al. 2003) was
ideal for our purposes because it activates both brain regions whose
maturational trajectory is characterized by gray matter thickening (i.e.,
primary language cortices in the perisylvian region) as well as regions
characterized by thinning (i.e., dorsal frontal and parietal regions) (Sowell,
Thompson, Leonard, et al. 2004). The false font stringminusword contrast
was thought to reflect attentional response to the salience of novel print,
as all task demands for the false font string and word conditions were
exactly the same except that false font strings were novel, word-like
stimuli never seen before. The word minus false font string contrast was
thought to reflect implicit reading. Stimuli and task parameters were
exactly as described by Turkeltaub et al. (2003) except interstimulus
fixation lasted 2.8 s and intercondition rest period lasted 16 s.
Behavioral TasksBecause our functional activation task was an orthographic processing
task, we chose a cognitive measure whose maturation level was
characterized by fluency with orthography: naming speed. The speed
with which letters and digits are named becomes faster with age
(Wagner et al. 1999), and naming speed in the preschool age range
predicts later reading achievement (Wagner et al. 1997; Wolf and
Bowers 1999). Naming speed was therefore selected as the operation-
alized index of cognitive development, and correlations between brain
activation and naming speed (i.e., time in seconds) allowed us to
identify ‘‘mature’’ patterns of activation with the orthographic process-
ing task. Activation (i.e., increased or decreased) associated with faster
naming was defined to be more ‘‘mature.’’
Structural Image AcquisitionHigh-resolution T1-weighted sagittal volumes were collected from a 1.5
Tesla (T) Siemens Sonata scanner (repetition time [TR], 1900 ms; echo
time [TE], 4.38 ms; flip angle, 15�; matrix size, 256 3 256 3 160; field of
view [FOV], 256 mm; voxel size, 1 3 1 3 1 mm; acquisition time, 8 min,
8 s). We chose to acquire the structural images on the 1.5T magnet
because it yields less susceptibility artifact than the 3T magnet, thus
allowing more consistent tissue segmentation throughout the volume.
Two to 4 acquisitions were acquired for each subject. Raters blind to
subject age and sex evaluated image quality, and data from at least 2
acquisitions were averaged to enhance signal-to-noise ratio. There was
no significant relationship between the number of image acquisitions
used and age (Pearson’s r = 0.21, P = 0.32).
Figure 1. Model that guided the present study. Regions where there is overlapbetween activation and skill improvement reflect regions where activation intensitychanges with better skill (striped). Activation of such regions is therefore defined as‘‘mature.’’ Activation is then correlated with morphology. We looked for regions where‘‘mature’’ activation corresponded with morphological growth trajectory (i.e., thinningin dorsal fronto-parietal regions; thickening in perisylvian regions). If there are regionsof overlap (checker board), then morphological maturation is associated withmaturation of functional activation.
Table 1Demographic description of 24 normally developing subjects and their mean performance on
behavioral measures
Mean SD
Age (range 6--15) 10.54 2.81Number of males 11 —Handedness quotienta 73.88 23.12WISC-4 FSIQb 113.30 15.82CTOPP rapid naming standard scorec 102.62 12.71Ortho word % correct 93.8 7.1Ortho false font string % correct 95.3 5.6
aDextrality quotient from the modified Edinburgh Handedness Inventory (Oldfield 1971).bWechsler Intelligence Scale for Children (WISC), 4th ed, prorated FSIQ (Wechsler 2003).cComprehensive Test of Phonological Processing (CTOPP; Wagner et al. 1999). WISC and CTOPP
scores have a mean of 100 and SD of 15.
Figure 2. Orthographic processing task. Subjects were instructed to press a buttonwith their right index finger if an ascender was present, and a button with their rightmiddle finger if there was no ascender. In the examples given here, the correctresponse for ‘‘alarm’’ and its corresponding false font string was ‘‘yes,’’ and thecorrect response for ‘‘sauce’’ and its corresponding false font string was ‘‘no.’’ Falsefont strings matched real words for length, size, and location of ascenders anddescenders. Words containing the letters i and j were excluded to avoid confusion.Scan repetition time was 4 s. Ten volumes were acquired from each experimentalblock and 4 from each rest period. The initial 2 volumes corresponding to theinstruction (‘‘GET READY!’’) were discarded to exclude measurements preceding T1equilibrium. The experiment lasted 7 min, 52 s and yielded 116 usable volumes.
2596 Brain Activation--Structure Relationships in Children d Lu et al.

Functional Image AcquisitionFunctional imaging data were obtained from a 3T Siemens Allegra head-
only scanner. First, we acquired a high-resolution structural T2-weighted
echo-planar image (EPI) volume in the anterior commissure--posterior
commissure plane (TR, 5000 ms; TE, 33 ms; matrix size, 128 3 128; FOV,
20 cm; 36 slices; voxel size, 1.6 3 1.6 3 3; 3 mm thick; 1-mm gap)
coplanar with the functional scan to allow for spatial registration of each
subject’s data into a standard coordinate system. During the orthographic
processing task, one functional scan lasting 7 min and 52 s was acquired
covering the whole brain volume (116 images; EPI gradient echo
sequence; TR, 4000 ms; TE, 25 ms; flip angle, 90�; matrix size, 64 3 64;
FOV, 20 cm; 36 slices; voxel size, 3.1 3 3.1 3 3; 3 mm thick; 1 mm gap).
The EPI acquisition available on the 3T magnet allows us to collect more
image volumes, with better signal-to-noise ratio and shorter scanning
time than would be possible on the 1.5T magnet. Thus, functional and
structural data were acquired on 2 different magnets, and spatially
registered in image processing.
Subjects viewed visual stimuli from magnet-compatible goggles
containing 2 miniature television screens with full 512 3 512 resolution
(Resonance Technology, Northridge, CA). Stimuli were presented using
MacStim 3.2 psychological experimentation software (WhiteAnt
Occasional Publishing, West Melbourne, Australia).
Structural Imaging Data AnalysisPreprocessing of high-resolution structural imaging data from the 1.5T
scanner were identical to those described previously (Sowell et al.
2002; Sowell, Thompson, Leonard, et al. 2004). Briefly, the MR images
were preprocessed with a series of manual and automated procedures
executed by analysts blind to subject age and sex: 1) transform brain
volumes into a standardized 3D coordinate space (Mazziotta et al.
1995) using a 12 parameter, linear, automated image registration
algorithm (Woods et al. 1993); 2) semiautomated tissue segmentation
was conducted for each volume data set to classify voxels based on
signal intensity as most representative of gray matter, white matter, or
cerebral spinal fluid (Shattuck et al. 2001); 3) remove nonbrain tissue
(i.e., scalp, orbits) and the cerebellum, and exclude the left hemisphere
from the right; 4) automatically extract the cortical surface of each
hemisphere, which was represented as a high-resolution mesh of 131
072 triangulated elements spanning 65 536 surface points in each
hemisphere (MacDonald et al. 1994); 5) trace 35 sulcal and gyral
landmarks on the lateral and medial surfaces of each hemisphere using
detailed criteria that we have developed (Sowell et al. 2002) for
delineating the starting and stopping points for each sulcus using brain
surface atlases as references (Ono et al. 1990; Duvernoy et al. 1991) (17
on the lateral surface of each hemisphere: Sylvian fissure, central,
precentral, postcentral, superior temporal sulcus (STS) main body, STS
ascending branch, STS posterior branch, inferior temporal, superior
frontal, inferior frontal, intraparietal, primary intermediate sulcus,
secondary intermediate sulcus, transverse occipital, olfactory, occipito-
temporal, and collateral sulci. Twelve on each interhemispheric
surface: callosal sulcus, inferior callosal outline, superior rostral sulcus,
inferior rostral sulcus, paracentral sulcus, anterior and posterior
segments of the cingulate sulcus, outer segment double parallel
cinglate sulcus when present, parieto-occipital sulcus, anterior and
posterior segments of the calcarine sulcus, and the subparietal sulcus.
Six midline landmark curves bordering the longitudinal fissure were
delineated to establish hemispheric gyral limits); 6) transform the
image volumes back into their own native image acquisition space by
mathematically inverting the transformation which took them into
standard space; 7) spatially register all segmented images and brain
surfaces for each individual to a standard orientation by using the first
and last points on 20 of the 35 manually defined anatomical landmarks
matched to a standard atlas (Sowell et al. 2003); and (8) measure
cortical thickness in millimeters at each anatomically matched cortical
surface point.
The thickness of gray matter was calculated using the Eikonal Fire
Equation (Sapiro 2001; Thompson et al. 2004). Although the brain
images acquired for this study had voxel dimensions of approximately 1
3 1 3 1 mm, we supersampled the imaging data to create voxel
dimensions of 0.33 mm3 using trilinear interpolation (Ratnanather et al.
2004; Aganj et al. forthcoming). The 3D Eikonal equation was applied
only to voxels that segmented as gray matter, and a smoothing kernel
was used to average gray matter thickness within a 15-mm sphere at
each point on the cortical surface. The cortical surface area within each
sphere likely varied depending on its location within the 3-dimensional
thickness volume for each subject. Nonetheless, these methods allowed
us to calculate cortical thickness for each subject at an effective
resolution much finer than that of the original voxel size in the image,
given that the error associated with localizing anatomy on the inner and
outer cortical surfaces is averaged with the unbiased error of all other
voxels within the smoothing kernel. Once preprocessing was
completed, points on the cortical surfaces surrounding and between
the sulcal contours drawn on each individual’s brain surface were
calculated using the averaged sulcal contours as anchors to drive 3D
cortical surface mesh models from each subject into correspondence
(Thompson et al. 2004). This cortical pattern matching technique, also
known as high-dimensional continuum mechanical image warping
(Thompson et al. 2001, 2003), allows the creation of average surface
models while accounting for cortical variability across subjects. All
analyses of the thickness maps were conducted in each subject’s native
(unscaled space).
To map gray matter thickness onto the surface rendering of each
child’s brain, the coordinate of each point on the cortical surface for
each child (anatomically matched across individuals) was mapped to
the same anatomical location in their ‘‘thickness’’ volume, and the
average maximum thickness of gray matter within a 15-mm sphere was
calculated. In a previous report, we helped to establish the validity of
these methods by showing close regional correspondence between
maps of cortical thickness created for normally developing children in
vivo (Sowell, Thompson, Leonard, et al. 2004) and for the post mortem
data of Von Economo (von Economo 1929). In our earlier report
(Sowell, Thompson, Leonard, et al. 2004), we also assessed the test-
retest reliability of measures of cortical thickness in individuals scanned
twice at short time intervals, demonstrating maximum error estimates
of 0.15 mm.
Functional Imaging Data AnalysisPreprocessing and statistical analysis of functional imaging data were
carried out using FSL (Oxford Centre for Functional Magnetic Resonance
Imaging of the Brain [FMRIB]’s Software Library, Oxford University,
Oxford, UK; www.fmrib.ox.ac.uk/fsl). We corrected for motion by using
MCFLIRT (Jenkinson et al. 2002) and for slice-timing by using Fourier-
space time-series phase-shifting. Nonbrain tissues were removed using
BET (Smith 2002). Spatial smoothing was applied with a Gaussian kernel
of full width half maximum of 6 mm. Mean-based intensity normalization
of all volumes by the same factor was applied, as well as highpass
temporal filtering (Gaussian-weighted least-squares straight line fitting,
with sigma = 15 s).
After preprocessing, statistical analyses were performed at the single-
subject level by using the general linear model within FSL (FEAT [FMRI
Expert Analysis Tool] version 5.63). Each experimental condition was
modeled using a boxcar function convolved with a canonical hemo-
dynamic response function. Time-series statistical analysis was carried
out using FILM (FMRIB’s Improved Linear Model) with local autocor-
relation correction (Woolrich et al. 2001). Volumes for which greater
than 2 mm of correction of motion was required were modeled as
a covariate of no interest. Results were rendered on Z statistic images
thresholded using clusters determined by Z > 1.7 and a (corrected)
cluster significance threshold of P = 0.05 (Worsley et al. 1992). Each
subject’s functional data were first registered to corresponding
structural volumes using 6-parameter rigid-body transformation, then
spatially normalized to the Montreal Neurological Institute-152
template using 12-parameter affine registration via FLIRT (Jenkinson
and Smith 2001; Jenkinson et al. 2002) for group analyses.
Mixed-effects group analyses were carried out using FLAME (FMRIB’s
Local Analysis of Mixed Effects) (Beckmann et al. 2003; Woolrich et al.
2004). Variances and parameters resulting from single-subject fixed
effects analyses were carried into higher-level mixed-effects analysis to
allow for inferences to be drawn at the population level. Higher-level
statistical maps were thresholded by using clusters determined by Z >
1.7 and a (corrected) cluster significance threshold of P = 0.05.
Cerebral Cortex November 2009, V 19 N 11 2597
Coregistering Functional (3T) and Structural (1.5T) DataBefore correlation between activation and gray matter thickness could
be conducted, data acquired from 2 different scanners were coreg-
istered into the same space. Structural T1- and T2-weighted images
(from 1.5T and 3T scanners, respectively) were first registered into the
standardized International Consortium for Brain Mapping’s 305 3D
coordinate space (Mazziotta et al. 1995) using a 12 parameter, linear,
automated image registration algorithm (Woods et al. 1993) (trans-
formation 1), then registration was further refined by rigid-body
transformation of T2-weighted volume into the T1-weighted space
(transformation 2). These 2 transformation files were combined by
multiplying together transformation matrices and the result was
applied to the activation data (the unthresholded t-map for each
subject representing the false font string minus word contrast) to bring
the functional activation map into correspondence with the high-
resolution structural data collected on the 1.5T magnet. Then the high-
dimensional continuum mechanical image warping transformation
created from the 1.5T T1-weighted structural data was applied to this
3T T2-weighted structural data (which was registered to the functional
activation data also collected on the 3T magnet) to bring both
functional activation and cortical thickness into anatomical correspon-
dence. An average activation map (using the unthresholded t-map for
each individual) for each individual was created using a spatial
smoothing kernel of a 15 mm (radius) sphere, identical to the one
used for the cortical thickness maps.
Statistical AnalysesCorrelations between the 2 contrasts (t-scores representing the
magnitude of false font string minus word and word minus false font
string) and gray matter thickness were examined by calculating
Pearson’s r correlation coefficients on a point-by-point basis for each
cortical surface point (approximately 60 000 per hemisphere).
Correlations between the activation at each surface point and naming
speed for each individual subject were also calculated. Note that the
word minus false font string contrast is simply the inverse of the false
font string minus word contrast, and thus statistical maps in Figure 5
were only shown for the false font string minus word contrast. To
control for multiple comparisons, we conducted permutation analyses
(Nichols and Holmes 2004) by randomly permuting activation intensity
values and associated correlates (i.e., gray matter thickness or naming
speed) in 1000 new analyses. The number of significant correlations
(Pearson’s r with P < 0.05) in these 1000 new analyses fell along
a normal curve, against which we compared our observed number of
significant correlations with original, nonpermutated data. The observed
number of significant correlations was deemed to pass correction for
multiple comparisons if the probability of it occurring by chance was less
than 0.05. Permutation analyses were conducted within 10 regions of
interest (ROIs) in each hemisphere, 6 on the lateral surface and 4 on the
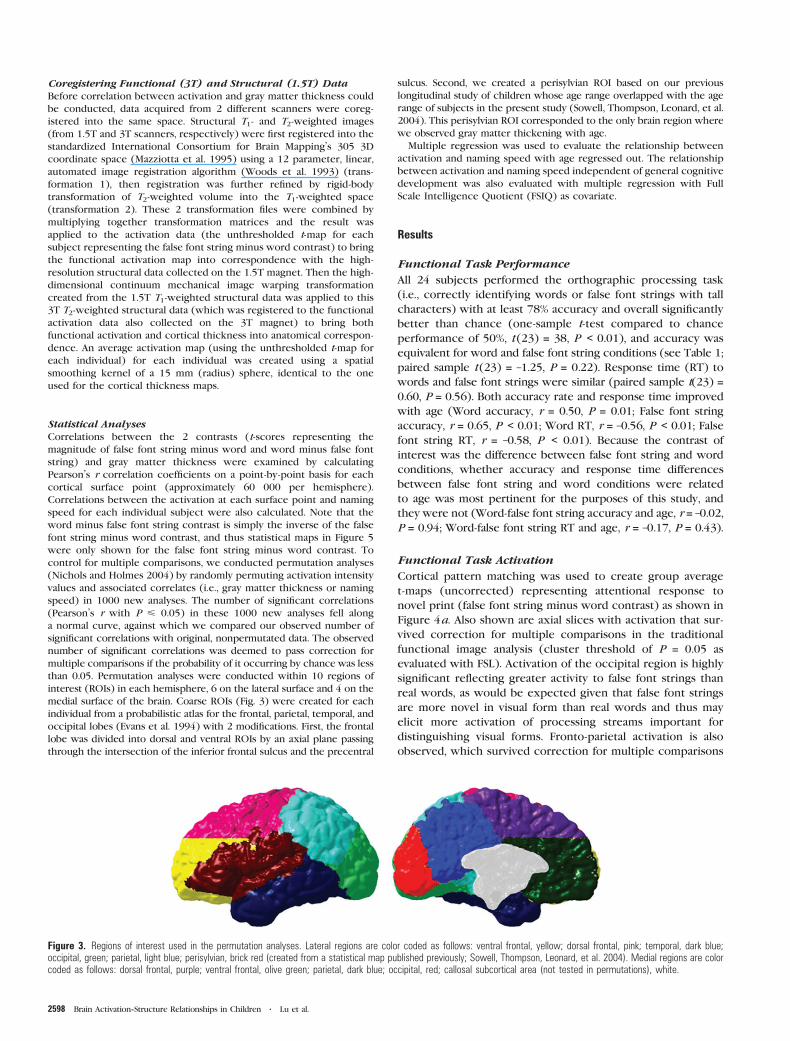
medial surface of the brain. Coarse ROIs (Fig. 3) were created for each
individual from a probabilistic atlas for the frontal, parietal, temporal, and
occipital lobes (Evans et al. 1994) with 2 modifications. First, the frontal
lobe was divided into dorsal and ventral ROIs by an axial plane passing
through the intersection of the inferior frontal sulcus and the precentral
sulcus. Second, we created a perisylvian ROI based on our previous
longitudinal study of children whose age range overlapped with the age
range of subjects in the present study (Sowell, Thompson, Leonard, et al.
2004). This perisylvian ROI corresponded to the only brain region where
we observed gray matter thickening with age.
Multiple regression was used to evaluate the relationship between
activation and naming speed with age regressed out. The relationship
between activation and naming speed independent of general cognitive
development was also evaluated with multiple regression with Full
Scale Intelligence Quotient (FSIQ) as covariate.
Results
Functional Task Performance
All 24 subjects performed the orthographic processing task
(i.e., correctly identifying words or false font strings with tall
characters) with at least 78% accuracy and overall significantly
better than chance (one-sample t-test compared to chance
performance of 50%, t (23) = 38, P < 0.01), and accuracy was
equivalent for word and false font string conditions (see Table 1;
paired sample t (23) = –1.25, P = 0.22). Response time (RT) to
words and false font strings were similar (paired sample t(23) =0.60, P = 0.56). Both accuracy rate and response time improved
with age (Word accuracy, r = 0.50, P = 0.01; False font string
accuracy, r = 0.65, P < 0.01; Word RT, r = –0.56, P < 0.01; False
font string RT, r = –0.58, P < 0.01). Because the contrast of
interest was the difference between false font string and word
conditions, whether accuracy and response time differences
between false font string and word conditions were related
to age was most pertinent for the purposes of this study, and
they were not (Word-false font string accuracy and age, r = –0.02,
P = 0.94; Word-false font string RT and age, r = –0.17, P = 0.43).
Functional Task Activation
Cortical pattern matching was used to create group average
t-maps (uncorrected) representing attentional response to
novel print (false font string minus word contrast) as shown in
Figure 4a. Also shown are axial slices with activation that sur-
vived correction for multiple comparisons in the traditional
functional image analysis (cluster threshold of P = 0.05 as
evaluated with FSL). Activation of the occipital region is highly
significant reflecting greater activity to false font strings than
real words, as would be expected given that false font strings
are more novel in visual form than real words and thus may
elicit more activation of processing streams important for
distinguishing visual forms. Fronto-parietal activation is also
observed, which survived correction for multiple comparisons
Figure 3. Regions of interest used in the permutation analyses. Lateral regions are color coded as follows: ventral frontal, yellow; dorsal frontal, pink; temporal, dark blue;occipital, green; parietal, light blue; perisylvian, brick red (created from a statistical map published previously; Sowell, Thompson, Leonard, et al. 2004). Medial regions are colorcoded as follows: dorsal frontal, purple; ventral frontal, olive green; parietal, dark blue; occipital, red; callosal subcortical area (not tested in permutations), white.
2598 Brain Activation--Structure Relationships in Children d Lu et al.

on the right but not on the left. These fronto-parietal regions
are part of an attentional network that generates top-down
influence on the visual cortex (Kastner and Ungerleider 2000),
and thus has been posited to underlie orienting of attention to
visual tasks (Fan et al. 2005; Raz and Buhle 2006). Significant
activation during implicit reading (word minus false contrast)
is observed in the left inferior frontal gyrus and survived cor-
rection for multiple comparisons in the traditional functional
image analysis as seen on horizontal slices in Figure 4b.
Activation in left inferior parietal and posterior temporal regions
is subthreshold and observed only with uncorrected t-maps on
the cortical surface renderings (Fig. 4b). These results are
generally consistent with Turkeltaub et al.’s findings using this
same orthographic processing task, where both left inferior
Figure 4. Functional activation of response to novel print and implicit reading. (a) An uncorrected statistical map of response to novel print (false font-word) is rendered on thecortical surface, and activation that passed correction for multiple comparisons (cluster threshold set at Z[ 1.7, P 5 0.05) is rendered on axial slices. Regions responding tonovel print more than real words included right parietal (BA 7, 19), right frontal (BA 9, 10), right inferior temporal (BA 37), and bilateral occipital (BA 18) regions. (b) Anuncorrected statistical map of implicit reading (word-false font) is rendered on the cortical surface, and activation that passed correction for multiple comparisons (clusterthreshold set at Z[ 1.7, P5 0.05) is rendered on axial slices. Regions responding more to real words than novel print included the left inferior frontal gyrus (BA 44, 45, 47). Leftposterior temporal and inferior parietal activation (BA 22, 40) evident on the surface rendering but not on the axial slices indicated subthreshold activation in those regions.
Cerebral Cortex November 2009, V 19 N 11 2599

Figure 5. Relationships between activation, gray matter thickness, and naming speed. For all surface maps (a, c, d, and e), cortical surface points with statistically significantPearson’s r correlation coefficients are differentiated from points with nonsignificant values (gray) by color coding, and 3 different levels of statistical significance (P# 0.05, 0.01,and 0.005) are rendered. Relationship between activation and gray matter thickness. (a) Negative correlations (i.e., red, orange, yellow) indicate that those with thinner cortexactivated the fronto-parietal network more in response to novel print. (b) Scatter plots of 3 right parietal surface points (averaged) show that response to novel print (false
2600 Brain Activation--Structure Relationships in Children d Lu et al.

frontal and posterior temporal activation were found in adults
but activation in only one of these regions passed threshold in
children (Turkeltaub et al. 2003).
Activation and Gray Matter Thickness
T-statistic maps representing attentional response to novel
print for each subject were correlated with gray matter
thickness values for each subject at each cortical surface point
(anatomically matched across subjects and between activation
and thickness maps within subjects). As shown in Figure 5a,
greater attentional response to novel print than real words is
associated with thinner cortex in bilateral fronto-parietal
networks. Permutation testing was conducted within regions
of interest to correct for multiple comparisons, and significant
negative relationships in the right dorsal frontal and parietal
regions were unlikely to be due to chance (Table 2). The
normal maturational trajectory of cortex within dorsal parietal
and frontal regions is gray matter thinning during the age range
that we studied (Sowell et al. 2003; Gogtay et al. 2004; Sowell,
Thompson, Leonard, et al. 2004), and the present sample of
subjects conforms to this pattern (Fig. 6). Therefore, more
‘‘mature’’ individuals (i.e., subjects with thinner cortex in these
regions) activate the fronto-parietal attentional network more
than less ‘‘mature’’ individuals (i.e., subjects with thicker cortex
in these regions) when processing novel print compared to real
words. In contrast, there was no significant positive relation-
ship between activation and gray matter thickness in the
perisylvian region (Fig. 5a). Lack of gray matter thickening in
the perisylvian region of the present sample of subjects (Fig. 6)
may have contributed to decreased ability to detect activation--
morphological relationships in this region.
Because attentional network activation in our experiment is
based on activation during one condition (false font strings)
relative to another (real words), the relative contribution of
each condition must be evaluated for interpretation. Scatter
plots for activation and thickness values for the average of 3
cortical surface points chosen from right parietal regions
where correlations between thickness and activation were
significant (from Fig. 5a) are plotted in Figure 5b. These plots
show that the significant correlation between thickness and
attentional network activation (false font minus word) is driven
more by false font strings (false font minus rest, r = –0.36) than
by real words (word minus rest, r = 0.15).
Table 2Permutation test results showing the probability that the number of significant correlations (at P # 0.05) within each ROI occurred by chance
Lateral ROI Response to novelprint and gray matter thickness
Response to novel printand naming speed
Response to novel printand naming speed with age regressed
Response to novel print andnaming speed with IQ regressed
Left Right Left Right Left Right Left Right
Dorsal frontal ns 0.0246 0.0022 0.0031 0.0326 ns 0.0108 0.0111Ventral frontal ns ns 0.0121 0.0055 ns ns 0.0235 0.0249Parietal ns 0.0091 0.0075 0.0081 ns ns 0.0257 0.0177Occipital ns ns ns ns ns ns ns nsTemporal ns ns ns ns ns ns ns nsPerisylvian ns ns 0.0198 0.0014 ns 0.0278 0.0403 0.0043
Note: ns 5 not significant.
Figure 6. Correlation between age and gray matter thickness. Cortical surface points with statistically significant Pearson’s r correlation coefficients are differentiated from pointswith nonsignificant values (gray) by color coding, and 3 different levels of statistical significance (P # 0.05, 0.01, and 0.005) are rendered. Results conform to documentedpattern of cortical thinning in the dorsal fronto-parietal region among larger subject groups with more extended age ranges than in the present study; however, the present studysample did not show cortical thickening in the perisylvian region as others have reported (Sowell et al. 2003; Gogtay et al. 2004; Sowell, Thompson, Leonard, et al. 2004).
font-word) is mainly driven by the false font string condition (false-rest) and not by the word condition (word-rest). Relationship between activation and naming speed. (c)Negative correlations indicate that individuals with faster-naming speed activated diverse bilateral regions in response to novel print, including the fronto-parietal attentionnetwork. After effects of age (d) and general cognitive development (e) were statistically removed, naming speed still correlated significantly with the fronto-parietal network’sresponse to novel print. Naming speed predicted activation of the fronto-parietal attention network independently of age or IQ.
Cerebral Cortex November 2009, V 19 N 11 2601

Activation and Naming Speed
Activation representing attentional response to novel print (false
font minus word) was correlated with naming speed to identify
the activation pattern associated with more ‘‘mature’’ skill (i.e.,
faster-naming speed). Resulting statistical maps (Fig. 5c) bear
spatial correspondence to the activation--thickness map in
fronto-parietal regions (Fig. 5a). Naming speed was measured
by time, and larger values represented slower, or worse,
performance. Negative relationships between activation and
naming speed indicate that those with more ‘‘mature’’ skill
(faster) activated the fronto-parietal attentional network more in
response to novel print. Similar relationships are also found in
bilateral perisylvian and inferior frontal regions, where more
‘‘mature’’ skill presumably corresponds to other functional
demands of processing false font strings compared to real words.
Parceling Skill Level from Age and General CognitiveDevelopment
Both activation--thickness (Fig. 5a) and activation--performance
(Fig. 5c) maps indicate greater activation of the fronto-parietal
network in response to novel print among individuals with
more ‘‘mature’’ skills. Because older subjects were faster at
naming (r = –0.71, P < 0.001), it was possible that relationships
between activation and performance were spuriously corre-
lated through shared variance with age. Thus, we re-evaluated
the relationship between naming speed and activation using
age as a covariate. Resulting statistical maps (Fig. 5d) show
regions where naming speed predicted activation in response
to novel print independent of age effects. Skill in naming letters
is accounting for some of the variance in activation of the
fronto-parietal network in response to novel print and the
shared age variance does not completely account for the ob-
served relationships between activation and performance.
To examine whether the correlation between activation and
namingspeed is specific tonamingskill level rather thana reflection
of general cognitive development, we used FSIQ as a covariate in
a separate analysis. Resulting statistical maps (Fig. 5e) look
remarkably similar to Figure 5c, indicating that general intellectual
functioning does not completelymediate the relationship between
naming speed and activation in response to novel print.
Discussion
By integrating functional activity, structural morphology, and
cognitive skill performance, we were able to identify brain
regions where functional activation during orthographic
processing was related to cortical thickness. The correlation
between activation and naming speed (shown in Fig. 5c)
allowed us to determine that greater difference in activation
between false font strings and words reflects a more ‘‘mature’’
pattern of activation. This ‘‘mature’’ pattern of activation was
associated with thinner cortex in the right fronto-parietal
region (Fig. 5a), where cortex thins during childhood and
adolescence (Sowell et al. 2003; Gogtay et al. 2004). These data
are consistent with the notion that more ‘‘mature’’ cortical
thickness patterns (i.e., thinner) are associated with more
‘‘mature’’ activation patterns. This relationship was preserved in
the fronto-parietal attention network even after controlling for
age or IQ.
One assumption of the present study is that the ortho-
graphic processing task used is facilitated by naming skills. The
faster children are at naming letters, the easier it should be to
decide if a tall letter is in the stimulus. Naming speed is
a learned skill but it also correlates with age. Coupling of age
and skill level confounds activation due to genetic influences
that unfold with age and activation associated with higher skill
level. We attempted to dissociate the 2 by using multiple
regression to examine effects of skill level while statistically
controlling for age effects. Results showed that activation in the
fronto-parietal attention network was still associated with
naming speed once the effects of age were covaried out. That
is, chronological age does not fully explain the relationship
between thinning fronto-parietal cortex and faster-naming
speed. As both age and experience with print contribute to
naming speed, it is tempting to speculate that the relationship
between the fronto-parietal attention network and naming
speed reflects experience effects. However, the present study
design does not allow for such inference because ‘‘experience’’
was neither quantified nor measured. We are not the only
group to have parsed out age effects from activation--skill level
relationships. Our findings are consistent with Schlaggar and
colleagues’ reports of functional activation that varies
independently of age and is performance related (Schlaggar
et al. 2002; Brown et al. 2005).
In a separate analysis, we controlled for IQ while examining
the relationship between activation and skill level. It is possible
that individuals with higher intelligence have faster-naming
speed and that activation--naming speed relationship found in
fronto-parietal regions is driven by effects of intelligence.
Activation of the fronto-parietal attention network was
associated with naming speed independent of IQ. This finding
is important because it suggests that general cognitive ability
does not fully explain activation in the fronto-parietal attention
network during orthographic processing. Faster-naming indi-
viduals activate this fronto-parietal attention network more
regardless of effects of general cognitive ability.
The fronto-parietal attention network is involved in both overt
and covert orienting of attention to spatial location (Fan et al.
2005; Raz and Buhle 2006). As reviewed by Kastner and
Ungerleider (2000), top-down bias from the attention system to
visual processing includes enhancement of neural responses to
an attended stimulus and increasing stimulus salience. Function-
al connectivity of the superior parietal lobule and frontal eye
fields put them in a position to serve as sources of top-down
biasing signals to visual processing streams (Kastner and
Ungerleider 2000). The strongest determinant of neural respon-
siveness of the lateral intraparietal area turns out tobe the salience
of the stimulus (Colby and Goldberg 1999). The most parsimo-
nious explanation of enhanced activation of this fronto-parietal
attention network among individuals with more advanced skills,
after controlling for age or general cognitive ability, is that false
font strings appear more salient than real words to those with
more advanced naming skill. Naming speed can be enhanced by
experience, so sensitivity of this parietal--frontal attention
network to false font strings may be a specific consequence of
experience. In other words, false font strings and real words may
be equally novel to slow-naming individuals (i.e., less experience
with print, after accounting for their age or IQ) resulting in less
difference in activation between the 2 conditions. But among
fast-naming individuals (i.e., more experience with print, after
controlling for age or IQ), word stimuli were likely quite familiar
and only the false font strings were novel and salient, resulting
in greater activation of fronto-parietal attention networks to the
false font strings relative to real words.
2602 Brain Activation--Structure Relationships in Children d Lu et al.

The functional task used here was initially designed to elicit
implicit reading (Turkeltaub et al. 2003). We did not observe
statistically significant relationships between cortical thick-
ness and implicit reading activation in classical brain language
regions. Cortical thickness in these regions have been shown
to increase with age into young adulthood, but variability is
much higher and effects much smaller than the thinning that
occurs in frontal and parietal cortices during this age range
(Sowell et al. 2003). Cortical thickening was not observed in
these regions in the present sample, perhaps due to limited
cross-sectional sample size or a relatively restricted age range.
Activation related to the implicit reading aspects of the task
may be less robust than activation related to attentional
aspects of the task, as suggested by the observation that
activation in posterior perisylvian language regions did not
survive correction for multiple comparisons. That reading
requires attentional resources is not a novel finding, as
Turkeltaub et al. (2003) also reported activation in fronto-
parietal attention areas for words and false font strings relative
to rest using the same task. Our study highlights that the
difference in activation pattern of children from that of adults
reported in other studies may not reflect differences in the
targeted cognitive system under study, but may in fact reflect
supportive cognitive systems required to complete the task.
‘‘Mature’’ activation patterns for a given task may involve
supportive systems as much as the target system, consistent
with other developmental fMRI reports (reviewed in Durston
and Casey 2006).
The current results are consistent with the notion that the
protracted course of functional activation development in the
human brain is associated with skill level, at least in fronto-
parietal attention networks, and activation corresponds to more
‘‘mature’’ morphology in these regions. From this, we posit that
structural brain development may also be related to skill level
and not merely to genetic influences that unfold with age. There
may be relationships between mature patterns of activation and
morphology in other regions of the brain that we lacked
sufficient power to detect. The current study is a correlational
study and cannot address if structural maturation allows for
learning to take place, or if experience leads to morphological
maturation. Nevertheless, integrating structural MRI with
functional MRI and neurocognitive performance holds tremen-
dous promise in elucidating structure--performance relationships
of high-level cognitive functions specific to humans.
Funding
National Institute of Drug Abuse Grants (R21 DA15878
and RO1 DA017831) awarded to E.R.S.; National Institute of
Health (NIH)/National Center for Research Resources grant
(P41 RR013642); National Institute of Neurological Disorders
and Stroke grant (NS3753) awarded to A.W.T; grants
(AG016570, LM05639, EB01651, and RR019771) supported
P.M.T.; and NIH Roadmap for Medical Research grant (U54
RR021813 entitled Center for Computational Biology).
Notes
We thank Guinevere Eden’s research group for sharing the stimuli used
in the orthographic processing task. Conflict of Interest : None declared.
Address correspondence to Elizabeth R. Sowell, PhD, UCLA
Laboratory of Neuro Imaging, Department of Neurology, 635 Charles
Young Drive South, Suite 225, Los Angeles, CA 90095, USA. Email:
References
Aganj I, Sapiro G, Parikshak N, Madsen SK, Thompson PM. 2008.
Measurement of cortical thickness from MRI by minimum line inte-
grals on soft-classified tissue. Human Brain Mapping. Forthcoming.
Beckmann CF, Jenkinson M, Smith SM. 2003. General multilevel linear
modeling for group analysis in FMRI. Neuroimage. 20:1052--1063.
Booth JR, Burman DD, Meyer JR, Gitelman DR, Parrish TB, Mesulam MM.
2004. Development of brain mechanisms for processing ortho-
graphic and phonologic representations. J Cogn Neurosci. 16:
1234--1249.
Brown TT, Lugar HM, Coalson RS, Miezin FM, Petersen SE, Schlaggar BL.
2005. Developmental changes in human cerebral functional
organization for word generation. Cereb Cortex. 15:275--290.
Colby CL, Goldberg ME. 1999. Space and attention in parietal cortex.
Annu Rev Neurosci. 22:319--349.
Durston S, Casey BJ. 2006. What have we learned about cognitive
development from neuroimaging? Neuropsychologia. 44:2149--2157.
Durston S, Davidson MC, Tottenham N, Galvan A, Spicer J, Fossella JA,
Casey BJ. 2006. A shift from diffuse to focal cortical activity with
development. Dev Sci. 9:1--8.
Duvernoy HM, Cabanis EA, Vannson JL. 1991. The human brain: surface,
three-dimensional sectional anatomy and MRI. Vienna, Austria:
Springer-Verlag.
Evans AC, Kamber M, Collins DL, MacDonald D. 1994. An MRI-based
probabilistic atlas of neuroanatomy. In: Shorvon SD, editor. Magnetic
resonance scanning and epilepsy. New York: Plenum. p. 263--274.
Fan J, McCandliss BD, Fossella J, Flombaum JI, Posner MI. 2005. The
activation of attentional networks. Neuroimage. 26:471--479.
Fuster JM. 2002. Frontal lobe and cognitive development. J Neurocytol.
31:373--385.
Gaillard WD, Hertz-Pannier L, Mott SH, Barnett AS, LeBihan D,
Theodore WH. 2000. Functional anatomy of cognitive development:
fMRI of verbal fluency in children and adults. Neurology. 54:
180--185.
Gaillard WD, Sachs BC, Whitnah JR, Ahmad Z, Balsamo LM, Petrella JR,
Braniecki SH, McKinney CM, Hunter K, Xu B, et al. 2003.
Developmental aspects of language processing: fMRI of verbal
fluency in children and adults. Hum Brain Mapp. 18:176--185.
Gogtay N, Giedd JN, Lusk L, Hayashi KM, Greenstein D, Vaituzis AC,
Nugent TF, 3rd, Herman DH, Clasen LS, Toga AW, et al. 2004.
Dynamic mapping of human cortical development during childhood
through early adulthood. Proc Natl Acad Sci USA. 101:8174--8179.
Holland SK, Plante E, Weber Byars A, Strawsburg RH, Schmithorst VJ,
Ball WS, Jr. 2001. Normal fMRI brain activation patterns in children
performing a verb generation task. Neuroimage. 14:837--843.
Jenkinson M, Bannister P, Brady M, Smith S. 2002. Improved
optimization for the robust and accurate linear registration and
motion correction of brain images. Neuroimage. 17:825--841.
Jenkinson M, Smith S. 2001. A global optimisation method for robust
affine registration of brain images. Med Image Anal. 5:143--156.
Kastner S, Ungerleider LG. 2000. Mechanisms of visual attention in the
human cortex. Annu Rev Neurosci. 23:315--341.
Lu L, Leonard C, Thompson P, Kan E, Jolley J, Welcome S, Toga A,
Sowell E. 2007. Normal developmental changes in inferior frontal gray
matter are associated with improvement in phonological processing:
a longitudinal MRI analysis. Cereb Cortex. 17:1092--1099.
MacDonald D, Avis D, Evans A. 1994. Multiple surface identification and
matching in magnetic resonance images. Proc Vis Biomed Comput.
2359:160--169.
Mazziotta JC, Toga AW, Evans A, Fox P, Lancaster J. 1995. A probabilistic
atlas of the human brain: theory and rationale for its development.
The International Consortium for Brain Mapping (ICBM). Neuroimage.
2:89--101.
Nichols T, Holmes A. 2004. Nonparametric permutation tests for
functional neuroimaging. In: Frackowiak RSJ, Friston KJ, Frith CD,
Dolan RJ, Price CJ, Zeki S, Ashburner J, Penny W, editors. Human
brain function. 2nd edn. New York: Elsevier. p. 887--910.
Oldfield RC. 1971. The assessment and analysis of handedness: The
Edinburgh inventory. Neuropsychologia. 9:97--113.
Ono M, Kubik S, Abernathey CD. 1990. Atlas of the cerebral sulci.
Stuttgart: G. Thieme Verlag.
Cerebral Cortex November 2009, V 19 N 11 2603

Ratnanather JT, Wang L, Nebel MB, Hosakere M, Han X, Csernansky JG,
Miller MI. 2004. Validation of semiautomated methods for quanti-
fying cingulate cortical metrics in schizophrenia. Psychiatry Res.
132:53--68.
Raz A, Buhle J. 2006. Typologies of attentional networks. Nat Rev
Neurosci. 7:367--379.
Rivera SM, Reiss AL, Eckert MA, Menon V. 2005. Developmental changes
in mental arithmetic: evidence for increased functional specializa-
tion in the left inferior parietal cortex. Cereb Cortex. 15:1779--1790.
Sapiro G. 2001. Geometric partial differential equations and image
analysis. Cambridge (UK): Cambridge University Press.
Schlaggar BL, Brown TT, Lugar HM, Visscher KM, Miezin FM,
Petersen SE. 2002. Functional neuroanatomical differences between
adults and school-age children in the processing of single words.
Science. 296:1476--1479.
Shattuck DW, Sandor-Leahy SR, Schaper KA, Rottenberg DA, Leahy RM.
2001. Magnetic resonance image tissue classification using a partial
volume model. Neuroimage. 13:856--876.
Shaw P, Greenstein D, Lerch J, Clasen L, Lenroot R, Gogtay N, Evans A,
Rapoport J, Giedd J. 2006. Intellectual ability and cortical
development in children and adolescents. Nature. 440:676--679.
Smith SM. 2002. Fast robust automated brain extraction. Hum Brain
Mapp. 17:143--155.
Sowell ER, Peterson BS, Thompson PM, Welcome SE, Henkenius AL,
Toga AW. 2003. Mapping cortical change across the human life
span. Nat Neurosci. 6:309--315.
Sowell ER, Thompson PM, Holmes CJ, Batth R, Jernigan TL, Toga AW.
1999. Localizing age-related changes in brain structure between
childhood and adolescence using statistical parametric mapping.
Neuroimage. 9:587--597.
Sowell ER, Thompson PM, Holmes CJ, Jernigan TL, Toga AW. 1999. In
vivo evidence for post-adolescent brain maturation in frontal and
striatal regions. Nat Neurosci. 2:859--861.
Sowell ER, Thompson PM, Leonard CM, Welcome SE, Kan E, Toga AW.
2004. Longitudinal mapping of cortical thickness and brain growth
in normal children. J Neurosci. 24:8223--8231.
Sowell ER, Thompson PM, Rex D, Kornsand D, Tessner KD, Jernigan TL,
Toga AW. 2002. Mapping sulcal pattern asymmetry and local cortical
surface gray matter distribution in vivo: maturation in perisylvian
cortices. Cereb Cortex. 12:17--26.
Sowell ER, Thompson PM, Tessner KD, Toga AW. 2001. Mapping
continued brain growth and gray matter density reduction in dorsal
frontal cortex: Inverse relationships during postadolescent brain
maturation. J Neurosci. 21:8819--8829.
Sowell ER, Thompson PM, Toga AW. 2004. Mapping changes in the
human cortex throughout the span of life. Neuroscientist.
10:372--392.
Sprenger-Charolles L, Siegel LS, Bechennec D, Serniclaes W. 2003.
Development of phonological and orthoraphic processing in
reading aloud, in silent reading, and in spelling: a four-year
longitudinal study. J Exp Child Psychol. 84:194--217.
Thomas KM, King SW, Franzen PL, Welsh TF, Berkowitz AL, Noll DC,
Birmaher V, Casey BJ. 1999. A developmental functional MRI study
of spatial working memory. Neuroimage. 10:327--338.
Thompson PM, Hayashi KM, de Zubicaray G, Janke AL, Sowell ER,
Rose SE, Semple J, Herman D, Hong MS, Dittmer SS, et al. 2003.
Dynamic mapping of Alzheimer’s disease. Proceedings of the 19th
Colloque Medecine et Recherche. IPSEN Foundation. Paris (France):
Springer-Verlag.
Thompson PM, Hayashi KM, Sowell ER, Gogtay N, Giedd JN,
Rapoport JL, de Zubicaray GI, Janke AL, Rose SE, Semple J, et al.
2004. Mapping cortical change in Alzheimer’s disease, brain
development, and schizophrenia. Neuroimage. 23(Suppl. 1):S2--18.
Thompson PM, Mega MS, Vidal C, Rapoport JL, Toga AW, editors. 2001.
Detecting disease-specific patterns of brain structure using cortical
pattern matching and a population-based probablistic brain atlas.
New York: Springer-Verlag.
Turkeltaub PE, Gareau L, Flowers DL, Zeffiro TA, Eden GF. 2003.
Development of neural mechanisms for reading. Nat Neurosci.
6:767--773.
Von Economo CV. 1929. The cytoarchitectonics of the human cerebral
cortex. London: Oxford Medical Publications.
Wagner RK, Torgesen JK, Rashotte CA. 1999. Comprehensive test of
phonological processing. Austin (TX): Pro-Ed.
Wagner RK, Torgesen JK, Rashotte CA, Hecht SA, Barker TA, Burgess SR,
Donahue J, Garon T. 1997. Changing relations between phonolog-
ical processing abilities and word-level reading as children develop
from beginning to skilled readers: a 5-year longitudinal study. Dev
Psychol. 33:468--479.
Wechsler D. 2003. Wechsler Intelligence Scale for Children. San
Antonio (TX): The Psychological Corporation.
Wolf M, Bowers PG. 1999. The double-deficit hypothesis for the
developmental dyslexias. J Educ Psychol. 91:415--438.
Woods RP, Mazziotta JC, Cherry SR. 1993. MRI-PET registration with
automated algorithm. J Comput Assist Tomogr. 17:536--546.
Woolrich MW, Behrens TE, Beckmann CF, Jenkinson M, Smith SM. 2004.
Multilevel linear modelling for FMRI group analysis using Bayesian
inference. Neuroimage. 21:1732--1747.
Woolrich MW, Ripley BD, Brady M, Smith SM. 2001. Temporal
autocorrelation in univariate linear modeling of FMRI data. Neuro-
image. 14:1370--1386.
Worsley KJ, Evans AC, Marrett S, Neelin P. 1992. A three-dimensional
statistical analysis for CBF activation studies in human brain. J Cereb
Blood Flow Metab. 12:900--918.
2604 Brain Activation--Structure Relationships in Children d Lu et al.