Rimonabant-induced apoptosis in leukemia cell lines: Activation of caspase-dependent and...
46
Accepted Manuscript Title: Rimonabant-induced apoptosis in leukemia cell lines: activation of caspase-dependent and -independent pathways. Authors: Dario Gallotta, Patrizia Nigro, Roberta Cotugno, Patrizia Gazzerro, Maurizio Bifulco, Maria Antonietta Belisario PII: S0006-2952(10)00297-2 DOI: doi:10.1016/j.bcp.2010.04.023 Reference: BCP 10540 To appear in: BCP Received date: 8-2-2010 Revised date: 16-4-2010 Accepted date: 16-4-2010 Please cite this article as: Gallotta D, Nigro P, Cotugno R, Gazzerro P, Bifulco M, Belisario MA, Rimonabant-induced apoptosis in leukemia cell lines: activation of caspase-dependent and -independent pathways., Biochemical Pharmacology (2008), doi:10.1016/j.bcp.2010.04.023 This is a PDF file of an unedited manuscript that has been accepted for publication. As a service to our customers we are providing this early version of the manuscript. The manuscript will undergo copyediting, typesetting, and review of the resulting proof before it is published in its final form. Please note that during the production process errors may be discovered which could affect the content, and all legal disclaimers that apply to the journal pertain. peer-00596263, version 1 - 27 May 2011 Author manuscript, published in "Biochemical Pharmacology 80, 3 (2010) 370" DOI : 10.1016/j.bcp.2010.04.023
-
Upload
independent -
Category
Documents
-
view
0 -
download
0
Transcript of Rimonabant-induced apoptosis in leukemia cell lines: Activation of caspase-dependent and...

Accepted Manuscript
Title: Rimonabant-induced apoptosis in leukemia cell lines:activation of caspase-dependent and -independent pathways.
Authors: Dario Gallotta, Patrizia Nigro, Roberta Cotugno,Patrizia Gazzerro, Maurizio Bifulco, Maria AntoniettaBelisario
PII: S0006-2952(10)00297-2DOI: doi:10.1016/j.bcp.2010.04.023Reference: BCP 10540
To appear in: BCP
Received date: 8-2-2010Revised date: 16-4-2010Accepted date: 16-4-2010
Please cite this article as: Gallotta D, Nigro P, Cotugno R, Gazzerro P, Bifulco M,Belisario MA, Rimonabant-induced apoptosis in leukemia cell lines: activation ofcaspase-dependent and -independent pathways., Biochemical Pharmacology (2008),doi:10.1016/j.bcp.2010.04.023
This is a PDF file of an unedited manuscript that has been accepted for publication.As a service to our customers we are providing this early version of the manuscript.The manuscript will undergo copyediting, typesetting, and review of the resulting proofbefore it is published in its final form. Please note that during the production processerrors may be discovered which could affect the content, and all legal disclaimers thatapply to the journal pertain.
peer
-005
9626
3, v
ersi
on 1
- 27
May
201
1Author manuscript, published in "Biochemical Pharmacology 80, 3 (2010) 370"
DOI : 10.1016/j.bcp.2010.04.023

Page 1 of 45
Accep
ted
Man
uscr
ipt
1 2 3 4 5 6 7 8 9 10 11 12 13 14 15 16 17 18 19 20 21 22 23 24 25 26 27 28 29 30 31 32 33 34 35 36 37 38 39 40 41 42 43 44 45 46 47 48 49 50 51 52 53 54 55 56 57 58 59 60 61 62 63 64 65
1
Rimonabant-induced apoptosis in leukemia cell lines: activation of caspase-
dependent and -independent pathways.
Dario Gallotta, Patrizia Nigro, Roberta Cotugno, Patrizia Gazzerro, Maurizio Bifulco and Maria
Antonietta Belisario
Dipartimento di Scienze Farmaceutiche – Università degli Studi di Salerno – Via Ponte Don
Melillo, 84084 Fisciano (SA) – Italy
To whom correspondence should be address:
Maria Antonietta Belisario, Dipartimento di Scienze Farmaceutiche, Università di Salerno, Via
Ponte Don Melillo, 84084 Fisciano, Salerno, Italy.
Tel: +39 089 969740. Fax: +39 089 969602.
e-mail address: [email protected]
*Manuscriptpe
er-0
0596
263,
ver
sion
1 -
27 M
ay 2
011

Page 2 of 45
Accep
ted
Man
uscr
ipt
1 2 3 4 5 6 7 8 9 10 11 12 13 14 15 16 17 18 19 20 21 22 23 24 25 26 27 28 29 30 31 32 33 34 35 36 37 38 39 40 41 42 43 44 45 46 47 48 49 50 51 52 53 54 55 56 57 58 59 60 61 62 63 64 65
2
Abstract
Rimonabant (SR141716), a cannabinoid CB1 receptor antagonist known for anti-obesity activity,
has more recently been shown to inhibit tumor cell growth. Here we demonstrated the anti-tumor
potential of SR141716 in leukemia-derived cell lines and its low toxicity in normal cells (PBMC).
SR141716 (1-20 M range of doses) reduced Jurkat and U937 cell number by activating death
signals as well as affecting cell cycle progression. The most prominent response in U937 to
SR141716 was a G0/G1 block, while in Jurkat cells there was activation of cell death processes.
SR141716-treated cells exhibited the morphological and biochemical features of apoptosis and to
some extent necrosis. Apoptotic mode of cell death was confirmed in both cell lines by analysis of
cell morphology, phosphatidylserine exposure and DNA fragmentation. Moreover, the drug was
found to induce an early and robust mitochondrial membrane depolarization. In Jurkat cells the
apoptotic process was typically caspase-dependent, while in U937 caspase-independent pathways
were also activated. The contribution of PARP activation to SR141716-induced apoptosis in U937
was suggested by protein PARylation, AIF release and apoptosis reversal by PARP inhibitors.
Moreover, SR141716 negatively modulated, especially in U937, the PI3K/AKT pathways. In
conclusion, our data indicate that SR141716 elicits alternative response and/or cell death pathways
depending on the cell type affected.
peer
-005
9626
3, v
ersi
on 1
- 27
May
201
1

Page 3 of 45
Accep
ted
Man
uscr
ipt
1 2 3 4 5 6 7 8 9 10 11 12 13 14 15 16 17 18 19 20 21 22 23 24 25 26 27 28 29 30 31 32 33 34 35 36 37 38 39 40 41 42 43 44 45 46 47 48 49 50 51 52 53 54 55 56 57 58 59 60 61 62 63 64 65
3
1. Introduction
The term “endocannabinoid system” (ES) was coined to indicate the complex signalling
system of cannabinoid receptors, endogenous ligands and the enzymes responsible for their
biosynthesis and inactivation [1, 2 and references therein]. Along with the endocannabinoids, the
ES encompasses proteins that modulate the levels of these compounds, their biosynthetic and
degradative enzymes and putative transporters, the major endocannabinoid receptors, named CB1
and CB2, and the transient receptor potential channels of the vanilloid type-1 (TRPV1).
The ubiquitous regulatory actions of the ES in health and disease emphasize its role in several
physio-pathological processes and suggest distinct targets through which this signalling system
could be modulated for therapeutic gain [3, 4]. Increasing evidence suggests that cannabinoids exert
both direct and indirect effects on cancer by different mechanisms of action in different types of
malignancies [5, 6]. Cannabinoids have been found to control cell growth and death in many cancer
types, both in vitro and in vivo [7-9], as well as the neoangiogenesis and metastatic spreading [10-
13], but the mechanisms underlying the antitumor effects are sometimes cell type specific.
Human leukemia and lymphoma cell lines, expressing CB2 and lacking CB1 receptor, were
susceptible to apoptosis induced by several natural and synthetic CB receptor agonists [14].
However, in the same cells pre-treatment with SR144528 (a selective CB2 antagonist) failed to
completely revert tetrahydrocannabinol (THC)-induced apoptosis, suggesting that the observed
effects were not completely dependent upon this receptor. On the other hand, other reports
demonstrate that cannabinoids exert their tumor cell-death promoting activity through mechanisms
independent of CB receptors. [15,16]. In their study, Maccarone et al. [15] showed that
Anandamide, the first endocannabinoid to be identified, induced apoptosis in the U937 cell line
through the vanilloid receptor and this effect was potentiated by the inhibitors of Anandamide
degradation. The apoptosis induced by Anandamide was associated with an increase in intracellular
peer
-005
9626
3, v
ersi
on 1
- 27
May
201
1
Page 4 of 45
Accep
ted
Man
uscr
ipt
1 2 3 4 5 6 7 8 9 10 11 12 13 14 15 16 17 18 19 20 21 22 23 24 25 26 27 28 29 30 31 32 33 34 35 36 37 38 39 40 41 42 43 44 45 46 47 48 49 50 51 52 53 54 55 56 57 58 59 60 61 62 63 64 65
4
calcium, drop in mitochondrial membrane potential, release of cytochrome c and activation of
caspases.
SR141716 (Rimonabant, Acomplia®
) is the first selective cannabinoid receptor CB1
antagonist described [17]. Along with its anti-obesity action, emerging findings show potential anti-
proliferative and anti-inflammatory actions of SR141716 in several in vitro and in vivo models [18].
In human peripheral blood mononuclear cells (PBMC) SR141716 significantly inhibited the
proliferative response to mitogens and this effect was accompanied by a G1/S phase arrest without
induction of apoptosis and cell death [19]. Moreover, in this model SR141716 used in combination
with 2-methylarachidonyl-2’-fluoro-ethylamide, a stable analogue of the Anandamide, showed
synergism rather than antagonism of the inhibition of PBMC proliferation, indicating the
multifaceted role of SR141716 in the control of cell fate. Flygare and colleagues [20] demonstrated
that micromolar concentrations of SR141716 decreased viability of primary mantle cell lymphoma
(MCL) isolated from human tumor biopsies. Moreover, in the MCL cell line Rec-1, combined
treatment with SR141716 and Anandamide, used at equipotent doses, showed an additive effect in
the inhibition of cancer cell proliferation. Synergic anti-proliferative effect of SR141716 and
oxaliplatin, one of the cytotoxic drugs currently used in the treatment of colorectal cancer, was also
demonstrated in human colon cancer cell line, DLD-1 [21]. Even if increasing evidence
demonstrated the antitumor action of SR141716, the molecular mechanism underlying this effect is
still unclear and is yet not extensively investigated [22].
In this study, we have evaluated the antitumor potential of SR141716 in two leukemia-derived
cell lines, Jurkat and U937 cells. Aimed to clarify the mechanisms underlying SR141716 cell
growth inhibition activity, we analysed the effect of the drug on cell cycle progression, cell death
and apoptosis. The contribution of mitochondria and caspase, PARP1, and PI3K/AKT pathways in
the SR141716-induced cell death was also investigated.
peer
-005
9626
3, v
ersi
on 1
- 27
May
201
1

Page 5 of 45
Accep
ted
Man
uscr
ipt
1 2 3 4 5 6 7 8 9 10 11 12 13 14 15 16 17 18 19 20 21 22 23 24 25 26 27 28 29 30 31 32 33 34 35 36 37 38 39 40 41 42 43 44 45 46 47 48 49 50 51 52 53 54 55 56 57 58 59 60 61 62 63 64 65
5
2. Material and Methods
2.1 Materials
Chemicals. SR141716 was kindly provided by Sanofi-Aventis (Montpellier, France). Foetal
bovine serum (FBS) was from Bio-Whittaker, Hoechst 33342 and inhibitors (PJ34, ZVAD-fmk)
were from Calbiochem. All the other reagents were from Sigma-Aldrich. Antibodies: anti-
cytochrome c antibody (mouse mAb, 556433), anti-HSP60 (mouse, 611562) and anti-PAR (rabbit,
551813) from BD Pharmingen; anti-pAKT (Ser 473, mouse mAb, 9271), anti-AKT (rabbit, 9272)
and anti-cleaved caspase 3 (Asp 175, rabbit, 9661) from Cell Signaling; anti-AIF (H-300, sc-5586),
anti GAPDH (mouse mAb, sc-32233), and anti-PARP1 (mouse mAb, sc-8007) from Santa Cruz
Biotechnology; anti- tubulin (mouse mAb, T 5168) from Sigma-Aldrich; appropriate peroxidase-
conjugated secondary antibodies from Jackson ImmunoResearch.
2.2 Cell culture and treatments
Jurkat and U937 cells, obtained from Cell Bank in GMP-IST (Genova, Italy), were
maintained in RPMI 1640 medium supplemented with 10% (v/v) FBS, 2 mM L-glutamine and
antibiotics at 37°C in humidified atmosphere with 5% CO2. All the experiments were performed by
using cells seeded at a density of 2 x 10⁵ cells/ml. Under given experimental conditions, untreated
leukemia cells were able to double their number within less than 24 h.
SR141716 stock solutions (50 mM) in DMSO were stored at -20° C and appropriately diluted
in the same solvent or directly in the medium just before use. The final concentration of DMSO
never exceeding 0.15 % (v/v), a non cytoxic concentration, and was equal in samples and controls..
Other treatments: cells were pre-incubated with Z-VAD-fmk (ZVAD) (20 M), PJ34 (4 M), and
peer
-005
9626
3, v
ersi
on 1
- 27
May
201
1

Page 6 of 45
Accep
ted
Man
uscr
ipt
1 2 3 4 5 6 7 8 9 10 11 12 13 14 15 16 17 18 19 20 21 22 23 24 25 26 27 28 29 30 31 32 33 34 35 36 37 38 39 40 41 42 43 44 45 46 47 48 49 50 51 52 53 54 55 56 57 58 59 60 61 62 63 64 65
6
LY294002 (15 M) for 2 h, or for 30 min with 500 nM 1,2-bis-(o-aminophenoxy)-ethane-
N,N,N',N'-tetra acetic acid-tetraacetoxymethyl ester (BAPTA-AM), a cell permeable Ca++
chelator.
Human peripheral blood mononuclear cells (PBMC) were isolated from buffy coats of healthy
donors (kindly provided by the Blood Center of the Hospital of Battipaglia, Salerno, Italy) by using
standard Ficoll–Hypaque gradients. Freshly isolated PBMC contained 92.8 ± 3.1 % live cells.
2.3 Cell proliferation and viability
Cells were seeded in 96 well-plates (2 x 10⁴/well) and incubated for the established times in
the absence and in the presence of different concentrations of SR141716. The number of viable
cells was quantified by CellTiter-Blue® Cell Viability assay (Promega) and by cytometric count
(trypan blue exclusion test).
2.4 Flow cytometric and fluorometric analysis
Cell cycle and hypodiploidia. Cellular DNA content was evaluated by propidium iodide (PI)
staining of permeabilized cells according to the available protocol [23]. Data from 10 000 - 20 000
events per sample were collected. The percentages of the elements in the hypodiploid region were
calculated using the CellQuest software and those in G0/G1, S and G2/M phases of the cell cycle
were determined using the MODFIT software (Becton Dickinson, San Jose, CA, USA).
Apoptosis detection. Phosphatidylserine (PS) externalization was examined with a two colour
analysis of FITC-labelled annexin V binding and PI uptake. The assay was performed by Human
Annexin-V/FITC kit (Bender MedSystem) according to the manufacturer’s instructions. The
fluorescence distribution was displayed as dot plot analysis (electronic compensation was required
to exclude overlapping of the two emission spectra), and the percentage of fluorescent cells in each
quadrant was determined. This test allows for the discrimination of live cells (unstained with either
peer
-005
9626
3, v
ersi
on 1
- 27
May
201
1

Page 7 of 45
Accep
ted
Man
uscr
ipt
1 2 3 4 5 6 7 8 9 10 11 12 13 14 15 16 17 18 19 20 21 22 23 24 25 26 27 28 29 30 31 32 33 34 35 36 37 38 39 40 41 42 43 44 45 46 47 48 49 50 51 52 53 54 55 56 57 58 59 60 61 62 63 64 65
7
fluorochrome – gated in the lower left quadrant: annexin-/PI
-) from early apoptotic cells (stained
only with annexin V - gated in the lower right quadrant: annexin+/PI
-), late apoptotic cells (stained
with both annexin V and PI - gated in the upper right quadrant: annexin+/PI
+) or necrotic cells
(stained only with PI - gated in the upper left quadrant: annexin-/PI
+).
Mitochondrial membrane potential changes. Treated and control cells were loaded with 5 nM
tetramethylrhodamine ethyl ester (TMRE), a potential sensitive probe [24]. After 30 min,
fluorescence intensity was evaluated by flow cytometry (FL-2 channel).
Intracellular redox state. 2’,7’-dichlorodihydrofluorescein diacetate (DCFH-DA) was used as
a probe for intracellular reactive oxygen species (ROS) formation [25]. Briefly, at the end of the
incubation time, cells were washed and resuspended (1 x 10⁶ cells/ml) in serum-free medium
containing 10 µM DCFH-DA. Following further 30 min of incubation at 37° C, DCF fluorescence
was monitored by flow cytometry (FL-1 channel). In some experiments, cells were double loaded
with DCFH-DA and PI to monitor simultaneously the level of ROS–oxidized fluorescent product,
DCF, and the integrity of plasma membrane (membrane leakage might cause an increase of DCF
efflux).
Free Ca+2
concentrations were determined using the calcium indicator dye, Fura-2. Cells,
suspended in a HEPES-based Ca+2
-free buffer (plus 5 mM dextrose), were incubated with 5 M
fura-2 acetoxymethyl (AM) ester for 60 min at 37°C to convert the ester to Fura-2. After washing,
Fura-2 loaded cells were resuspended in RPMI 1640 (serum- and phenol red-free) at 1 x 10⁴/ml
density. Fluorescence was monitored on a luminescence spectrometer (LS55, PerkinElmer Life
Science). Fura-2 was excited at alternating wavelengths of 340 and 380 nm and emission was
recorded at 510 nm. Increased 340/380 ratios indicate elevated intracellular [Ca2+
]. In long-term
experiments, cells were exposed to vehicle or SR141716 for the established times before Fura-2
loading. In short term experiments, Fura-2 loaded cells were added to a cuvette and analyzed to
establish a baseline before the addition of stimuli. Thapsigargin (200 nM) was used as positive
control (340/380 ratio: 1.97 ± 0.12).
peer
-005
9626
3, v
ersi
on 1
- 27
May
201
1

Page 8 of 45
Accep
ted
Man
uscr
ipt
1 2 3 4 5 6 7 8 9 10 11 12 13 14 15 16 17 18 19 20 21 22 23 24 25 26 27 28 29 30 31 32 33 34 35 36 37 38 39 40 41 42 43 44 45 46 47 48 49 50 51 52 53 54 55 56 57 58 59 60 61 62 63 64 65
8
2.5 Light and fluorescence microscopy
Cells were stained with crystal violet (0.1% in PBS/20% MeOH) for whole cell
morphological analysis. Hoechst 33342 (10 µg/ml) staining was used for apoptotic nuclei
determination. Cells were analyzed by the Zeiss Axiovert 200 microscope at Hoechst 33342
fluorescence region (excitation, 351 nm; emission, 380 nm).
2.6 Western blot analysis
Whole lysates for immunoblot analysis were prepared according to standard protocols. Cytosolic
protein extracts for determining cytochrome c and AIF release were prepared as follows: cells
(2x10⁶) were gently lysed for 2 min in 80 µl ice-cold
lysis buffer (250 mM sucrose, 1 mM EDTA,
20 mM Tris–HCl pH 7.2, 1 mM DTT, 10 mM KCl, 1.5 mM MgCl2, 5 µg/ml pepstatin
A, 10 µg/ml
leupeptin, 2 µg/ml aprotinin) containing digitonin 0.05%. Protein concentration in samples was
determined by Bio-Rad DC Protein Assay. Clarified cell lysates or cytosolic fractions were subject
to SDS-PAGE (20-50 µg/lane) under reducing conditions. The percentages of polyacrylamide were
15 %, 10 % or 8 % chosen on the basis of the MW of the protein to detect. Proteins were then
transferred onto nitrocellulose membranes and immunoblotted with different primary antibodies.
Signals were visualized with appropriate horseradish peroxidase-conjugated secondary antibodies
and enhanced chemiluminescence (Amersham, USA).
2.7 Statistical analysis
Unless otherwise specified data reported in each figure are the mean value ± SD of at least
three experiments performed in duplicate. Differences between treatment groups were analyzed by
the student t test. Differences were considered significant when p <0.05.
peer
-005
9626
3, v
ersi
on 1
- 27
May
201
1

Page 9 of 45
Accep
ted
Man
uscr
ipt
1 2 3 4 5 6 7 8 9 10 11 12 13 14 15 16 17 18 19 20 21 22 23 24 25 26 27 28 29 30 31 32 33 34 35 36 37 38 39 40 41 42 43 44 45 46 47 48 49 50 51 52 53 54 55 56 57 58 59 60 61 62 63 64 65
9
3. Results
3.1 Cell growth inhibition
To determine the effect of SR141716 on cell growth, leukemia-derived Jurkat and U937 cells
and non-stimulated freshly isolated PBMC, taken as normal cell counterpart, were exposed to
increasing concentrations of SR141716 or vehicle only and the number of viable cells was
measured after 24 h. As shown in Fig. 1A, SR141716 inhibited the growth of both leukemia-
derived cell lines in a dose- and time-dependent manner. Dose response-curves were obtained in a
narrow range of doses. SR141716 exhibited low or no cell growth inhibition activity at
concentrations lower than 5 M, but was highly cytotoxic at 20-25 M. The SR141716 inhibitory
effect was more pronounced, especially at the lowest doses, in Jurkat than in U937 cells. The half
maximal inhibitory concentration (IC50) values were 13 M and 18 M in Jurkat and U937,
respectively. In contrast, SR141716 slight affected PBMC viability, as the number of trypan blue
positive cells increased only at the highest doses tested.
The effect of SR141716 on Jurkat and U937 cell viability was evaluated also at 48 h
treatment. The half maximal inhibitory concentration (IC50) values, calculated on the basis of dose-
response curves at 48 h (data not shown), were 6 and 10 M in Jurkat and U937, respectively
(about one half those calculated at 24 h).
3.2 Cell cycle analysis and sub-G1 DNA measurement
Since the decrease in the cell number may result from cell cycle arrest and/or cell death, we
first examined whether SR141716 affected Jurkat and U937 cell cycle progression. As shown in
Fig. 1B, 24 h SR141716 treatments caused different effects on Jurkat and U937 cell cycle
peer
-005
9626
3, v
ersi
on 1
- 27
May
201
1

Page 10 of 45
Accep
ted
Man
uscr
ipt
1 2 3 4 5 6 7 8 9 10 11 12 13 14 15 16 17 18 19 20 21 22 23 24 25 26 27 28 29 30 31 32 33 34 35 36 37 38 39 40 41 42 43 44 45 46 47 48 49 50 51 52 53 54 55 56 57 58 59 60 61 62 63 64 65
10
progression. In Jurkat cells, the drug induced a dose-dependent increase (at concentrations up to 15
M) of the percentages of cells in S phase. Conversely, U937 cells accumulated dose-dependently
in G0/G1 at all SR141716-tested doses, except at the lowest (5 M), where a delay in S-phase
transition was detectable. Substantially similar results were observed at 48 h (data not shown).
In addition to cytostatic potential, SR141716 also exhibited cytotoxic activity in both Jurkat
and U937 cells (Fig. 1C). After 24 h incubation, we observed a dose-dependent increase of Jurkat
and U937 cells in sub-G0/G1 Jurkat cells proved more susceptible to SR141716 cell death-
promoting activity than U937. Conversely, non-stimulated PBMC resulted quite resistant to
SR141716 cytotoxic effect, since a slight increase of the percentages of hypodiploid cells was
detectable only at the highest SR141716 dose tested (20 M). After 48 h incubation, a further
increase of the percentages of hypodiploid cells was observed in Jurkat cells at all tested SR141716
doses; in U937 and non-stimulated PBMC, a time-dependent increase of hypodiploidia was
detectable at doses ≥ 15 M and > 20 M, respectively. However, it should be underlined that
control PBMC maintained in culture for 48 h in the absence of mitogenic stimuli was quite high (
30%, and 20 % underwent apoptotic death), thus the possibility that the forced conditions make
these primary cells more susceptible to exogenous toxic stimuli cannot be excluded.
3.3 Characterization of SR141716 cell death-promoting activity
The observed increase of cells with a DNA content lower than G1 (hypodiploidia) suggested that
SR141716 promoted cell death by, at least partly, activating apoptotic processes. To better
discriminate between apoptosis and necrosis (sub-G1 cell count might also include necrotic cells),
we performed the annexin V-FITC / PI test. Jurkat and U937 cells were treated with SR141716 at
doses close to the respective IC50 values (15 M and 20 M, respectively). These doses were used
to obtain comparable levels of cell death in the two cell lines and, unless otherwise specified, were
peer
-005
9626
3, v
ersi
on 1
- 27
May
201
1

Page 11 of 45
Accep
ted
Man
uscr
ipt
1 2 3 4 5 6 7 8 9 10 11 12 13 14 15 16 17 18 19 20 21 22 23 24 25 26 27 28 29 30 31 32 33 34 35 36 37 38 39 40 41 42 43 44 45 46 47 48 49 50 51 52 53 54 55 56 57 58 59 60 61 62 63 64 65
11
used in all the subsequent experiments. Representative cytograms in Fig. 2A (a) (cytograms on the
top), show that 24 h exposure to SR141716 caused an increase of the percentages of cells gated in
the upper right quadrant (annexin
+/PI
+, late apoptotic/necrotic cells) and, to a lower extent, of cells
in the lower right quadrant (annexin+/PI
-, early apoptosis). In particular, after subtracting the
respective control values, the ratio between annexin+/PI
- and annexin
+/PI
+ cell populations was
about 0.5 in Jurkat and only 0.1 in U937 cells. Since the majority of dying cells were positive for
annexin V labelling, but also permeable to PI, we wondered whether these cells derived from
apoptotic cells that acquired membrane incompetence (secondary necrotic death) or were an artifact
due to staining of intracellular phosphatidylserine (PS) in membrane-compromised primary necrotic
cells. Firstly, in the attempt to delay the kinetics of cell transition from the lower left to the upper
left quadrant, we examined the annexin V/PI profiles of cells exposed to SR141716 for a time
shorter than 24 h. Representative cytograms in Fig. 2A (b) (cytograms in the middle) illustrated
that, after 18 h treatment, the annexin+/PI
- to annexin
+/PI
+ ratio increased up to 0.9 in Jurkat, but
less than 0.3 in U937 cells. Next, Jurkat and U937 were exposed 12 h to 25 M and 30 M
SR141716, respectively, two highly cytotoxic concentrations. As indicated by cytograms on the
bottom of Fig. 2A, a typical necrotic profile (being the most of the cells positive for PI uptake,
but
negative for annexin V staining) was obtained. Taken together, the above results suggest the
occurrence of mainly secondary necrosis, especially in Jurkat cells, and exclude artificial
intracellular PS staining due to PI influx.
To gain more insight into the SR141716-induced apoptotic mode of cell death, we examined
cell and nuclear morphology in treated and control leukemia cells by light and fluorescence
microscopy. After 24h of treatment, SR141716 caused morphological changes characteristic of
apoptosis such as features of membrane blebbing and nuclear disintegration in both Jurkat and
U937 cells (Fig. 2B). Hoechst 33342 staining demonstrated a significant increase of DNA
fragmentation in treated cells compared to controls.
peer
-005
9626
3, v
ersi
on 1
- 27
May
201
1

Page 12 of 45
Accep
ted
Man
uscr
ipt
1 2 3 4 5 6 7 8 9 10 11 12 13 14 15 16 17 18 19 20 21 22 23 24 25 26 27 28 29 30 31 32 33 34 35 36 37 38 39 40 41 42 43 44 45 46 47 48 49 50 51 52 53 54 55 56 57 58 59 60 61 62 63 64 65
12
3.4 SR141716 induces loss of mitochondrial membrane potential and Ca2+
elevation
Since mitochondria play a critical role in the regulation of both apoptotic and necrotic cell
death [26], we evaluated the effect of SR141716 on mitochondrial membrane potential (m).
Jurkat and U937 cells were exposed to increasing doses of SR141716 and analyzed after 24 h for
both the loss of m and the extent of PS exposure on plasma membrane (annexin+/PI
- plus
annexin+/PI
+ cell populations). Curves reported in Fig. 3A show that SR141716 induced a robust
m loss in both cell lines. Interestingly, the percentage of cells with depolarized mitochondria
was higher, especially in U937, than that of annexin+
cells measured at the same drug
concentrations. Data summarized in Fig. 3B indicate that SR141716-induced m loss occurred
earlier than PS exposure especially in U937 cells, where mitochondria depolarization was
detectable also in the absence of any apoptotic death sign.
Because Ca2+
elevation has been shown to contribute to mitochondrial dysfunction [27], the
effect of the cell permeable Ca2+
chelator BAPTA-AM on SR141716-induced mitochondria
depolarization was evaluated. By preventing Ca2+
elevation, the extent of SR141716-induced
mitochondria depolarization was significantly attenuated in U937 cells (cytograms in Fig. 3C), but
not in Jurkat cells (data not shown). This result prompted us to evaluate the effect of SR141716 on
intracellular Ca2+
elevation. When U937 cells were incubated with the drug for 1, 3, 6 and 12 h
before Fura-2 loading, we did not measure any increase of the 340/380 ratios. However, by
lowering the exposure time to 10 min, the 340/380 ratio in 20 M SR141716-treated cells increased
from 1.06 ± 0.09, the value recorded in control cells, to 1.37 ± 0.13, thus suggesting that the drug
triggered a rapid intracellular Ca2+
elevation. Our results on the role of Ca2+
in SR141716-induced
U937 cell death are also supported by previous studies showing that U937 cells possess a Ca2+
-
dependent apoptosis pathway [28, 29].
peer
-005
9626
3, v
ersi
on 1
- 27
May
201
1
Page 13 of 45
Accep
ted
Man
uscr
ipt
1 2 3 4 5 6 7 8 9 10 11 12 13 14 15 16 17 18 19 20 21 22 23 24 25 26 27 28 29 30 31 32 33 34 35 36 37 38 39 40 41 42 43 44 45 46 47 48 49 50 51 52 53 54 55 56 57 58 59 60 61 62 63 64 65
13
Mitochondrial damage and subsequent cell death are often dependent upon drug-induced
oxidative stress. Thus, we evaluated SR141716 pro-oxidant potential by measuring DCFH-DA
ROS-mediated oxidation in Jurkat and U937 cells. Cells were exposed to the drug for times ≤ 3h,
because at longer times ROS elevation might be a consequence, rather than a cause, of
mitochondrial dysfunctions. While SR141716 did not cause any increase of ROS production in
Jurkat cells (data not shown), it induced a slight dose-dependent elevation of ROS in U937 cells. In
particular, at 30, 90 and 180 min, the percentage of DCF green fluorescence positive cells increased
by 3%, 5% and 13%, respectively (representative histograms obtained after 3 h incubation are
reported in Fig. 3D, upper panel). The absence of PI red fluorescence positive cells allowed us to
exclude that the slight ROS elevation observed was due to increased DCF efflux occurring in
membrane compromised cells (Fig. 3D, lower panel).
3.5 Cytochrome c and AIF release
The cytosolic release of mitochondrial pro-apoptotic proteins is one of the key events in the
mitochondria-dependent apoptotic death process [30]. In particular, cytochrome c and apoptosis-
inducing factor (AIF) are two important effectors of caspase-dependent and caspase-independent
cell death programs.
Blots in Fig. 4A show that cytochrome c (panel A) was present in the mitochondria-free
cytosolic fractions from both Jurkat and U937 cells exposed 12 h to SR141716, but not in the
corresponding controls. SR141716 treatment induced also mitochondrial AIF release, even though
the process turned out to occur later than cytochrome c release (Fig. 4B), since immunoreactive AIF
signals were detectable 18 h, but not 12 h (data not shown), after treatment. Moreover, while the
amount of cytosolic cytochrome c was almost comparable in the two leukemia cell lines, the levels
of released AIF was higher in U937 than in Jurkat cells. Interestingly, the AIF immunoreactive
signal in both the cytosolic fractions and whole lysates of SR141716-exposed cells appeared as a
peer
-005
9626
3, v
ersi
on 1
- 27
May
201
1

Page 14 of 45
Accep
ted
Man
uscr
ipt
1 2 3 4 5 6 7 8 9 10 11 12 13 14 15 16 17 18 19 20 21 22 23 24 25 26 27 28 29 30 31 32 33 34 35 36 37 38 39 40 41 42 43 44 45 46 47 48 49 50 51 52 53 54 55 56 57 58 59 60 61 62 63 64 65
14
doublet rather than a single band, suggesting a protease-mediated cleavage of AIF from its native
form (MW 67 kDa) to the N-terminal-truncated forms (57-62 kDa) [31].
3.6 Role of caspases in SR141716-induced cell death
We evaluated the contribution of caspase pathways to SR141716-induced apoptosis and
mitochondrial dysfunction by means of ZVAD, a pan-caspase inhibitor. SR141716-treated Jurkat
and U937 cells were incubated 24 h in the absence and in the presence of ZVAD and after the
incubation, the percentage of annexin+
cells and cells with reduced mitochondrial potential were
evaluated (Fig. 5A). In Jurkat cells, the caspase inhibitor reduced the levels of PS exposure by
60%; the effect was particularly marked on the percentages of annexin+/PI
- (early apoptotic cells),
which dropped to control values (representative cytograms in the insert). In U937 cells, the
contribution of the caspase-pathways to SR141716-induced cell death seemed to be lower than in
Jurkat cells, as ZVAD reduced the percentage of annexin+ cells by less than 35%. Caspase
inhibition likely had a lower protective effect against m loss than PS exposure, as mitochondrial
potential dissipation was reduced by 45% in Jurkat and less than 20 % in U937 cells. This result
suggested that caspase pathway activation by SR141716 occurred mainly downstream of
mitochondria.
Since ZVAD has been shown to inhibit other proteases [32], we needed to establish
unequivocally the presence of a caspase-dependent component in the SR141716-induced cell death
program. Because of the key role of mitochondria in SR141716-induced cell death, we focused on
caspase 3 as this effector caspase is generally activated succeeding mitochondrial depolarization
and release of cytochrome c. SR141716-treatment caused caspase 3 cleavages in both Jurkat and
U937 cells, as two bands with an apparent MW of 19 and 17 kDa were detectable (Fig. 5B).
peer
-005
9626
3, v
ersi
on 1
- 27
May
201
1

Page 15 of 45
Accep
ted
Man
uscr
ipt
1 2 3 4 5 6 7 8 9 10 11 12 13 14 15 16 17 18 19 20 21 22 23 24 25 26 27 28 29 30 31 32 33 34 35 36 37 38 39 40 41 42 43 44 45 46 47 48 49 50 51 52 53 54 55 56 57 58 59 60 61 62 63 64 65
15
However, in U937, caspase activation was likely to occur later and to a lower extent than in Jurkat
cells.
3.7 Role of PARP1 in SR141716-induced leukemia cell death
Poly(ADP-ribose) polymerase (PARP1), apart from its role as a DNA repairing enzyme, is an
important activator of caspase-independent cell death via promoting AIF release [33]. Thus, we
investigated whether PARP1 activation played some role in the non ZVAD-inhibitable component
of the SR141716 cell death program. We evaluated the effect of PJ34, a PARP1 inhibitor, on the
extent of SR141716-induced PS exposure (annexin+/PI
- plus annexin
+/PI
+cells) and mitochondrial
depolarization. In Jurkat cells we found that PJ34 has only a marginal or no protective effect against
the increase of annexin+
cells and m loss. Furthermore, the effects of combined PJ34 and ZVAD
were comparable to ZVAD alone. Conversely, in U937 cells, pharmacological inhibition of PARP1
activity reduced the percentage of cells with altered m by 50% and that of cells positive for
annexin labeling by 33% (Fig. 6A). Interestingly, the annexin+/PI
- / annexin
+/PI
+ ratio increased
from 0.08 to 1.8 (Fig. 6B), thus indicating that PJ34 prevented, at least in part, the rapid shift of
cells from the early apoptotic to the late apoptotic/necrotic phenotype. The protective effect of PJ34
and ZVAD co-administration turned out to be additive in agreement with the hypothesis that both
caspase-dependent and caspase-independent (PARP1-mediated) pathways contributed to the
SR141716-induced cell death execution program.
To confirm the role of PARP1-pathway in SR141716-induced U937 cell death, we evaluated
the activation of this enzyme by measuring the level of protein poly(ADP-ribosyl)ation (PAR) by
WB. Extensive protein PARylation, almost completely prevented by PJ34, was observed in U937
cells (Fig. 6C). PAR formation was detectable as early as 4 h after SR141716-exposure, thus
peer
-005
9626
3, v
ersi
on 1
- 27
May
201
1

Page 16 of 45
Accep
ted
Man
uscr
ipt
1 2 3 4 5 6 7 8 9 10 11 12 13 14 15 16 17 18 19 20 21 22 23 24 25 26 27 28 29 30 31 32 33 34 35 36 37 38 39 40 41 42 43 44 45 46 47 48 49 50 51 52 53 54 55 56 57 58 59 60 61 62 63 64 65
16
indicating that PARP1 activation occurred before m loss and PS exposure (see Fig. 3).
Interestingly, the intensity of PAR protein signal, after a maximum at 8 h, began to decrease at 12 h.
Such a decrease suggested the onset of processes counteracting sustained PARP1 activation
and the subsequent PARP1-dependent necrotic cell death [34]. As PARP1 cleavage by caspase 3 to
a non-functional 89 kDa peptide is known to be crucial for the shift from the necrotic to the
apoptotic program, we evaluated the presence of this proteolytic fragment in SR141716-treated
Jurkat and U937 cells. Blots reported in Fig. 7 (A, B) show that SR141716 caused a dose- and
time-dependent increase of the signals at 89 kDa concomitant with a decrease of the full-length
protein band in both cell lines. Surprisingly, PARP1 cleavage turned out to be more extensive (there
was a higher ratio between the cleaved/native forms of PARP1) and to occur earlier in U937 than in
Jurkat cells. In another set of experiments we verify whether PARP1 digestion was inhibited by
ZVAD. Fig. 7C shows that while PARP1 digestion was completely inhibited by ZVAD in Jurkat
cells, the 89 kDa fragment intensity was only attenuated by the caspase inhibitor in U937 cells. This
result suggested that, in U937 cells, other proteases might contribute to the higher extent of PARP1
processing. For instance, PARP1 is also a substrate for cathepsins and calpains [35, 36]. However,
in SR141716-treated U937 cells we did not observe any of the PARP1 fragments known to be
produced by these lysosomal proteases (see Fig. 7C). Moreover, both the calpain inhibitor I and Z-
FA-fmk, a broad spectrum inhibitor of cathepsins, failed to reduce the intensity of the 89 kDa signal
(data not shown).
3.8 PI3K/AKT pathway has a survival role in SR141716-induced cell death
Since the PI3K/AKT pathways are well-characterized cell survival signalling pathways that
block apoptosis in a variety of cell types [37-39], we examined the role of PI3K-dependent signals
in counteracting SR141716-induced cell death by means of a pharmacological approach. In
preliminary experiments we found that the combined treatment with SR141716 and LY294002, a
peer
-005
9626
3, v
ersi
on 1
- 27
May
201
1

Page 17 of 45
Accep
ted
Man
uscr
ipt
1 2 3 4 5 6 7 8 9 10 11 12 13 14 15 16 17 18 19 20 21 22 23 24 25 26 27 28 29 30 31 32 33 34 35 36 37 38 39 40 41 42 43 44 45 46 47 48 49 50 51 52 53 54 55 56 57 58 59 60 61 62 63 64 65
17
selective P13K inhibitor, caused extensive cell death at 24 h. Thus, in subsequent experiments the
effect of PI3K inhibition was quantified as early as 12 h after treatment (Fig. 8A). Especially in
U937, the presence of LY294002 strongly increased the extent of SR141716-induced mitochondria
depolarization and PS exposure. Next we evaluated whether SR141716 by itself had some effect on
the activation of PI3K/AKT pathways. Blots reported in Fig. 8B show that SR141716 decreased the
extent of constitutive AKT phosphorylation in both cell lines, without affecting the protein level.
Interestingly, in U937, the reduction of pAKT signal was more marked and earlier detectable than
in Jurkat cells.
peer
-005
9626
3, v
ersi
on 1
- 27
May
201
1

Page 18 of 45
Accep
ted
Man
uscr
ipt
1 2 3 4 5 6 7 8 9 10 11 12 13 14 15 16 17 18 19 20 21 22 23 24 25 26 27 28 29 30 31 32 33 34 35 36 37 38 39 40 41 42 43 44 45 46 47 48 49 50 51 52 53 54 55 56 57 58 59 60 61 62 63 64 65
18
4. Discussion
In this study we investigated the in vitro effects of SR141716, a CB1 antagonist, on cell
growth, morphology, cell cycle and death in Jurkat and U937, two leukemia-derived cell lines, and
examined the mechanisms underlying its actions. We found that SR141716 is an effective tumor
cell growth inhibitor, displaying IC50 values of 13 and 18 M in Jurkat and U937 cells,
respectively, at 24 h incubation and still lower values at 48 h. On the other hand, SR141716 doses
up to 25 M slightly reduced the number of non-stimulated freshly isolated PBMC, taken as normal
cell counterpart.
SR141716 reduced the number of proliferating cells by activating, to a different extent, both
cell cycle arrest and cell death responses. In Jurkat cells, SR141716 primarily exhibited a cell death-
promoting activity, while in U937 cells it elicited mainly cytostatic effects. Indeed, the G0/G1 arrest
of U937 cells might likely be a condition responsible of the higher resistance of this cell line to the
onset of cell death program. The hypothesis that G0/G1 cell cycle arrest might have some protective
role against SR141716-induced death might be partially supported by results previously obtained on
proliferating PBMC [19]. The work showed that SR141716 significantly inhibited the proliferative
response of stimulated PBMC by inducing a G0/G1 block, without inducing apoptosis and cell death.
However, if the quiescent status (G0/G1 block) was likely to make PBMC quite resistant to
SR141716-triggered death stimuli, the same G0/G1 block induced in U937 by SR141716 delayed,
but did not prevent subsequent cell death. A possible explanation of the different capabilities of
U937 cells and PBMC to counteract SR141716 cell death-promoting activity might lie in the
different effects of the drug on PI3K/AKT pathways, known to contribute to apoptosis-resistance
[37-39]. In PBMC, SR141716 was found to increase the levels of pAKT [19], while here we
showed that in U937 cells the drug decreased, as early as 4 h following treatment, the level of
pAKT as compared to untreated controls. Previous studies in p53-defective hematopoietic tumor
cells have shown that the p53-independent G1 arrest in response to toxic agents can be overridden
peer
-005
9626
3, v
ersi
on 1
- 27
May
201
1

Page 19 of 45
Accep
ted
Man
uscr
ipt
1 2 3 4 5 6 7 8 9 10 11 12 13 14 15 16 17 18 19 20 21 22 23 24 25 26 27 28 29 30 31 32 33 34 35 36 37 38 39 40 41 42 43 44 45 46 47 48 49 50 51 52 53 54 55 56 57 58 59 60 61 62 63 64 65
19
by the PI3K/AKT pathway [40]. Thus, the observed early down regulation of this pathway might
allow U937, lacking p53, to accumulate in G0/G1 as a primary defensive condition. Yet, just the
inactivation of PI3K/AKT pathways – which normally is sustained in leukemia-derived cells – was
likely to make U937 more responsive than their normal counterparts to further SR141716-triggered
death stimuli. PI3K pharmacological inhibition by LY294002 increased SR141716 death response,
thus indicating that SR141716 reduced, but did not abrogate, PI3K/AKT signals and confirmed the
key role of this pathway in leukemia-derived cell survival [38-41].
It has been reported that several natural and synthetic cannabinoids activate cell-death
promoting signals through mechanisms independent of CB receptor engagement [15, 16, 42].
Similarly, the SR141716 cytotoxic effects against leukemia cells was not likely to be dependent on
SR141716-CB1 complex triggered signals. This was suggested by the following observations: i)
cytotoxic effects were detectable only at concentrations that far exceed those (≤ 5 M) used in CB1
competition experiments [15]; ii) in agreement with previous studies [15, 42], we found that the
expression of CB1 was very low (Jurkat) or absent (U937) in leukemia-derived cells used in the
present study (data not shown).
Concerning the mechanisms of SR141716-induced cell death, we found that Jurkat and U937
treated cells displayed hypodiploidia, PS exposure and dissipation of mitochondrial membrane
potential, typical, even if not exclusive, markers of the apoptotic mode of cell death. However, after
24 h incubation with SR141716, most of the PS-exposing cells, especially in U937 cells, were also
positive for PI uptake, indicative of necrosis- or late apoptosis-associated plasma membrane
leakage. By shortening SR141716 treatments to times lower than 24 h, the transition kinetics from
the annexin+/PI
- to annexin
+/PI
+ phenotype was delayed in Jurkat, thus supporting that in this cell
line the annexin+/PI
+ population mostly included late apoptotic cells, rather than primary necrotic
cells. Conversely, in U937 PS exposure was associated with plasma membrane permeabilization at
24 h and shorter incubation times. This may suggests that SR141716 activated necrotic death in
U937. However, SR141716 caused extensive chromatin condensation and fragmentation not only in
peer
-005
9626
3, v
ersi
on 1
- 27
May
201
1

Page 20 of 45
Accep
ted
Man
uscr
ipt
1 2 3 4 5 6 7 8 9 10 11 12 13 14 15 16 17 18 19 20 21 22 23 24 25 26 27 28 29 30 31 32 33 34 35 36 37 38 39 40 41 42 43 44 45 46 47 48 49 50 51 52 53 54 55 56 57 58 59 60 61 62 63 64 65
20
Jurkat, but also in U937. Thus, on the basis of nuclear morphology postulating that necrotic cell
death occurs without nuclear condensation [43] and further evidences discussed below, it is
conceivable that SR141716 signals could activate other types of programmed cell death (PCD)
processes, rather than simple primary necrosis [44].
Previous studies have shown that TRPV1 (vanilloid) receptor agonists and antagonists (some
of which have activity at CB1 and/or CB2 receptors) modulate mitochondrial function, resulting in
apoptotic cell death [45] and also demonstrated that natural and synthetic cannabinoids are strong
inhibitors of mitochondria functions [46]. Also SR141716-activated signals seemed to converge and
integrate at the level of the mitochondria. In fact, consistent with mitochondria-mediated death
process, SR141716 caused extensive loss of membrane potential (m) and release of aptogenic
proteins, such as cytochrome c and AIF. Mitochondria-dependent death signalling was particularly
relevant in U937 cells where depolarization occurred before the appearance of other signs of
apoptosis or necrosis. Although some increase in ROS production and Ca2+
elevation contributed to
m loss in U937 cells, the mechanisms responsible for SR141716-induced mitochondria
dysfunctions remain to be clarified.
Cytochrome c is a key mediator of caspase-dependent cell death. After cytochrome c is
released from the mitochondria, it promotes apoptosome-complex formation and thus caspase
pathway activation [reviewed in 30]. Cytochrome c release as well as proteolytic cleavage of the
death protease capsase 3 were detected in SR141716-exposed Jurkat and U937 cells. The activation
of a caspase-dependent pathway by SR141716 in U937 cells was quite surprising, as the fast
appearance of cells positive for both annexin V and PI is rather associated to caspase-independent
death or necrotic processes [47]. However, the contribution of a caspase-dependent component in
SR141716-induced cell death was effectively lower in U937 compared to Jurkat cells. In fact,
ZVAD inhibited SR141716-induced cell death by only 35% in U937 and by about 60% in Jurkat
cells. The abrogation of caspase pathways by ZVAD was still less effective in preventing,
especially in U937 cell line, SR141716-induced mitochondrial potential collapse. In particular, the
peer
-005
9626
3, v
ersi
on 1
- 27
May
201
1
Page 21 of 45
Accep
ted
Man
uscr
ipt
1 2 3 4 5 6 7 8 9 10 11 12 13 14 15 16 17 18 19 20 21 22 23 24 25 26 27 28 29 30 31 32 33 34 35 36 37 38 39 40 41 42 43 44 45 46 47 48 49 50 51 52 53 54 55 56 57 58 59 60 61 62 63 64 65
21
changes in m were consistently independent of the caspase inhibitor at short exposure times,
confirming that SR141716-induced activation of caspases occurred downstream of mitochondria
and possibly that their activation might provide a positive feedback loop, which further
compromises mitochondrial integrity.
Along with a minor contribution of ZVAD-inhibitable death pathways [44], SR141716 caused
a more pronounced mitochondrial release of the AIF flavoprotein in U937 than in Jurkat cells. Once
released from mitochondria, AIF translocates into the nucleus, where it causes chromatin
condensation and triggers other signals resulting in PS exposure, large scale DNA fragmentation,
and ultimately caspase-independent cell death [47].
PARP1, aside from its main function as a DNA repair enzyme, plays a role in necrotic as well
caspase-independent cell death by promoting AIF release [48]. Although the exact mechanisms
underlying AIF release from mitochondria are not completely elucidated [49], in the PARP1/AIF-
mediated PCD model, the binding of the PAR polymer to acceptor proteins (PAR polymer binding
proteins) at the mitochondria is likely to play a role in AIF translocation from the mitochondria to
the nucleus [50]. By means of pharmacological approaches and direct measurements of protein
PARylation levels we demonstrated the contribution of PARP1 activation in the non ZVAD-
inhibitable component of the SR141716-triggered cell death program in U937 cells, but not in
Jurkat cells. The PARP1 inhibitor, PJ34, reduced the percentage of U937 PS-exposing cells
(annexin+/PI
- plus annexin
+/PI
+) by about 35%, a value similar to that obtained with ZVAD in this
cell line. However, differently from ZVAD, PJ34 was effective in delaying the transition of PS-
exposing cells with intact plasma membrane (annexin+/PI
-) towards membrane incompetence
(annexin+/PI
+ cells). Furthermore, we found that: i) the preventive effect of PJ34 against SR141716-
induced mitochondrial depolarization was much more pronounced than that of ZVAD; ii) the
combined exposure to PJ34 and ZVAD caused additive protective effects on both PS exposure and
m loss. Taken together, our findings suggest that in U937cells, PARP1 activation occurs
upstream of the onset of mitochondrial dysfunction and subsequent cell-death signals, such as the
peer
-005
9626
3, v
ersi
on 1
- 27
May
201
1

Page 22 of 45
Accep
ted
Man
uscr
ipt
1 2 3 4 5 6 7 8 9 10 11 12 13 14 15 16 17 18 19 20 21 22 23 24 25 26 27 28 29 30 31 32 33 34 35 36 37 38 39 40 41 42 43 44 45 46 47 48 49 50 51 52 53 54 55 56 57 58 59 60 61 62 63 64 65
22
release of cytochrome c and AIF. These proteins mediated, in turn, the caspase-dependent and
caspase-independent component of the SR141716-induced cell death program. However, in U937,
caspase 3 and other undefined proteases seem to promote a negative feedback loop for the PARP1-
triggered non ZVAD-inhibitable pathway. In fact, we observed that extensive PARP1 cleavage to
its 89 kDa inactive fragment, a specific product of caspase 3-mediated PARP1 processing, occurred
in U937 cells to a greater extent than in Jurkat cells.
In conclusion, SR141716 induces cell cycle arrest and programmed cell death in leukemia-
derived Jurkat and U937 cell lines, and, depending on the cell type, activates different as well
equivalent death pathways to a different extent. Furthermore, independent of the activated cell death
program, SR141716 efficiently triggers PS exposure in both cell lines, a key “eat-me” signal for
macrophage-engulfment, thus preventing an undesirable inflammatory response.
SR141716 also exerts its cytotoxic effects in leukemia-derived cell lines across a range of
doses at which only limited cell death was observed in non-proliferating freshly isolated PBMC,
taken as normal cell counterpart. Thus, in view of the challenging task of identifying novel
therapeutic agents that specifically work on cancer cells instead of normal cells, SR141716 may
represent a promising chemotherapy molecule by itself or as a lead compound. In particular, the low
toxicity against normal cells, especially in the absence of cell cycle induction, might suggest a
potential therapeutic use of SR141716 as an ex vivo purging agent for autologous transplantation in
hematologic malignancies [50,51].
peer
-005
9626
3, v
ersi
on 1
- 27
May
201
1

Page 23 of 45
Accep
ted
Man
uscr
ipt
1 2 3 4 5 6 7 8 9 10 11 12 13 14 15 16 17 18 19 20 21 22 23 24 25 26 27 28 29 30 31 32 33 34 35 36 37 38 39 40 41 42 43 44 45 46 47 48 49 50 51 52 53 54 55 56 57 58 59 60 61 62 63 64 65
23
Aknowledgements.
This work was supported by an Internal Grant of the University of Salerno, Italy.
peer
-005
9626
3, v
ersi
on 1
- 27
May
201
1
Page 24 of 45
Accep
ted
Man
uscr
ipt
1 2 3 4 5 6 7 8 9 10 11 12 13 14 15 16 17 18 19 20 21 22 23 24 25 26 27 28 29 30 31 32 33 34 35 36 37 38 39 40 41 42 43 44 45 46 47 48 49 50 51 52 53 54 55 56 57 58 59 60 61 62 63 64 65
24
References
[1] Bifulco M, Di Marzo V. The endocannabinoid system as a target for the development of
new drugs for cancer therapy. Nat Med 2002;8:547-550.
[2] De Petrocellis L, Di Marzo V. An introduction to the endocannabinoid system: from the
early to the latest concepts. Best Pract Res Clin Endocrinol Metab 2009;23:1-15.
[3] Di Marzo V. The endocannabinoid system: its general strategy of action, tools for its
pharmacological manipulation and potential therapeutic exploitation. Pharmacol Res
2009;60:77-84.
[4] Bifulco M. The endocannabinoid system: from biology to therapy. Pharmacol Res
2009;60:75-6.
[5] Bifulco M, Laezza C, Pisanti S, Gazzerro P. Cannabinoids and cancer: pros and cons of an
antitumour strategy. Br J Pharmacol 2006;148:123-35.
[6] Pisanti S, Malfitano AM, Grimaldi C, Santoro A, Gazzerro P, Laezza C, et al. Use of
cannabinoid receptor agonists in cancer therapy as palliative and curative agents. Best Pract
Res Clin Endocrinol Metab 2009;23:117-31.
[7] Bifulco M, Laezza C, Valenti M, Ligresti A, Portella G, DI Marzo V. A new strategy to
block tumor growth by inhibiting endocannabinoid inactivation. FASEB J 2004;18:1606-8.
peer
-005
9626
3, v
ersi
on 1
- 27
May
201
1

Page 25 of 45
Accep
ted
Man
uscr
ipt
1 2 3 4 5 6 7 8 9 10 11 12 13 14 15 16 17 18 19 20 21 22 23 24 25 26 27 28 29 30 31 32 33 34 35 36 37 38 39 40 41 42 43 44 45 46 47 48 49 50 51 52 53 54 55 56 57 58 59 60 61 62 63 64 65
25
[8] Ligresti A, Moriello AS, Starowicz K, Matias I, Pisanti S, De Petrocellis L, et al.
Antitumor activity of plant cannabinoids with emphasis on the effect of cannabidiol on human
breast carcinoma. J Pharmacol Exp Ther 2006;318:1375-87.
[9] Grimaldi C, Pisanti S, Laezza C, Malfitano AM, Santoro A, Vitale M, et al. Anandamide
inhibits adhesion and migration of breast cancer cells. Exp Cell Res 2006;312:363-73.
[10] Portella G, Laezza C, Laccetti P, De Petrocellis L, Di Marzo V, Bifulco M. Inhibitory
effects of cannabinoid CB1 receptor stimulation on tumor growth and metastatic spreading:
actions on signals involved in angiogenesis and metastasis. FASEB J 2003;17:1771-3.
[11] Pisanti S, Borselli C, Oliviero O, Laezza C, Gazzerro P, Bifulco M. Antiangiogenic
activity of the endocannabinoid anandamide. Correlation to its tumour-suppressor efficacy. J
Cell Physiol 2007;211:495-503.
[12] Bifulco M, Gazzerro P, Laezza C, Pentimalli F. Endocannabinoids as emerging
suppressors of angiogenesis and tumor invasion. Oncol Rep 2007;17:813-6.
[13] Laezza C, Pisanti S, Malfitano AM, Bifulco M. The anandamide analog, Met-F-AEA,
controls human breast cancer cell migration via the RHOA/RHO kinase signalling pathway.
Endocr Relat Cancer 2008;15:965-74.
[14] McKallip RJ, Lombard C, Fisher M, Martin BR, Ryu S, Grant S, et al. Targeting CB2
cannabinoid receptors as a novel therapy to treat malignant lymphoblastic disease. Blood
2002;100:627-634.
peer
-005
9626
3, v
ersi
on 1
- 27
May
201
1

Page 26 of 45
Accep
ted
Man
uscr
ipt
1 2 3 4 5 6 7 8 9 10 11 12 13 14 15 16 17 18 19 20 21 22 23 24 25 26 27 28 29 30 31 32 33 34 35 36 37 38 39 40 41 42 43 44 45 46 47 48 49 50 51 52 53 54 55 56 57 58 59 60 61 62 63 64 65
26
[15] Maccarrone M, Lorenzon T, Bari M, Melino G, Finazzi-Agro A. Anandamide induces
apoptosis in human cells via vanilloid receptors. Evidence for a protective role of cannabinoid
receptors. J Biol Chem 2000;275:31938-45.
[16] Sarker KP, Maruyama I. Anandamide induces cell death independently of cannabinoid
receptors or vanilloid receptor 1: possible involvement of lipid rafts. Cell Mol Life Sci.
2003;60:1200-8.
[17] Rinaldi-Carmona M, Barth F, Healume M, Shire D, Calandra B, Congy C, et al.
SR141716A, a potent and selective antagonist of the brain cannabinoid receptor. FEBS Lett
1994;350:240-4.
[18] Sarnataro D, Pisanti S, Santoro A, Gazzerro P, Malfitano AM, Laezza C, et al. The
cannabinoid CB1 receptor antagonist rimonabant (SR141716) inhibits human breast cancer
cell proliferation through a lipid raft-mediated mechanism. Mol Pharmacol 2007;70:1298-
306.
[19] Malfitano AM, Laezza C, Pisanti S, Gazzerro P, Bifulco M. Rimonabant (SR141716)
exerts anti-proliferative and immunomodulatory effects in human peripheral blood
mononuclear cells. Br J Pharmacol 2008;153:1003-10.
[20] Flygare J, Gustafsson K, Kimby E, Christensson B, Sander B. Cannabinoid receptor
ligands mediate growth inhibition and cell death in mantle cell lymphoma. FEBS Lett
2005;579:6885-9.
peer
-005
9626
3, v
ersi
on 1
- 27
May
201
1

Page 27 of 45
Accep
ted
Man
uscr
ipt
1 2 3 4 5 6 7 8 9 10 11 12 13 14 15 16 17 18 19 20 21 22 23 24 25 26 27 28 29 30 31 32 33 34 35 36 37 38 39 40 41 42 43 44 45 46 47 48 49 50 51 52 53 54 55 56 57 58 59 60 61 62 63 64 65
27
[21] Gazzerro P, Malfitano AM, Proto MC, Santoro A, Pisanti S, Caruso MG, et al.
Synergistic inhibition of human colon cancer cell growth by the cannabinoid CB1 receptor
antagonist rimonabant and oxaliplatin. Oncol Rep 2010;23:171-5.
[22] Bifulco M, Santoro A, Laezza C, Malfitano AM. Cannabinoid receptor CB1 antagonists
state of the art and challenges. Vitam Horm 2009;81:159-89.
[23] Nicoletti I, Migliorati G, Pagliacci MC, Grignani F, Riccardi C. A rapid and simple
method for measuring thymocyte apoptosis by propidium iodide staining and flow cytometry.
J Immunol Methods 1991;139:271-9.
[24] Scaduto RC Jr, Grotyohann LW. Measurement of mitochondrial membrane potential
using fluorescent rhodamine derivatives. Biophys J 1999;76:469-77.
[25] Rothe G, Valet G. Flow cytometric analysis of respiratory burst activity in phagocytes
with hydroethidine and 2′,7′-dichlorofluorescin. J Leukoc Biol 1990;47:440-8.
[26] Gogvadze V, Orrenius S, Zhivotovsky B. Mitochondria as targets for chemotherapy.
Apoptosis 2009;14:624-40.
[27] Scorrano L, Oakes SA, Opferman JT, Cheng EH, Sorcinelli MD, Pozzan T, et al. BAX
and BAK regulation of endoplasmic reticulum Ca2+
: a control point for apoptosis. Science
2003;300:135-9.
[28] Li M, Kondo T, Zhao QL, Li FJ, Tanabe K, Arai Y, et al. Apoptosis induced by
cadmium in human lymphoma U937 cells through Ca2+-calpain and caspase-mitochondria-
dependent pathways. J Biol Chem 2000;275:39702-9.
peer
-005
9626
3, v
ersi
on 1
- 27
May
201
1

Page 28 of 45
Accep
ted
Man
uscr
ipt
1 2 3 4 5 6 7 8 9 10 11 12 13 14 15 16 17 18 19 20 21 22 23 24 25 26 27 28 29 30 31 32 33 34 35 36 37 38 39 40 41 42 43 44 45 46 47 48 49 50 51 52 53 54 55 56 57 58 59 60 61 62 63 64 65
28
[29] Arai Y, Kondo T, Tanabe K, Zhao QL, Li FJ, Ogawa R, et al. Enhancement of
hyperthermia-induced apoptosis by local anesthetics on human histiocytic lymphoma U937
cells. J Biol Chem 2002;277:18986-93.
[30] Kroemer G, Galluzzi L, Brenner C. Mitochondrial Membrane Permeabilization in Cell
Death. Physiol Rev 2007;87:99-163.
[31] Cao G, Xing J, Xiao X, Liou AK, Gao Y, Yin XM, et al. Critical role of calpain I in
mitochondrial release of apoptosis-inducing factor in ischemic neuronal injury. Journal
Neurosci 2007;27:9278-93.
[32] Vandenabeele P, Vanden Berghe T, Festjens N. Caspase inhibitors promote alternative
cell death pathways. Sci STKE. 2006;2006:pe44.
[33] Yu SW, Andrabi SA, Wang H, Kim NS, Poirier GG, Dawson TM, et al. Apoptosis-
inducing factor mediates poly(ADPribose) (PAR) polymer-induced cell death. Proc Natl Acad
Sci U S A 2006;103:18314-9.
[34] Hassa PO. The molecular "Jekyll and Hyde" duality of PARP1 in cell death and cell
survival. Front Biosci 2009;14:72-111.
[35] Imre G, Dunai Z, Petak I, Mihalik R. Cystein cathepsin and Hsp90 activities determine
the balance between apoptotic and necrotic cell death pathways in caspase-compromised
U937 cells. Biochim Biophys Acta 2007;1773:1546-57.
peer
-005
9626
3, v
ersi
on 1
- 27
May
201
1

Page 29 of 45
Accep
ted
Man
uscr
ipt
1 2 3 4 5 6 7 8 9 10 11 12 13 14 15 16 17 18 19 20 21 22 23 24 25 26 27 28 29 30 31 32 33 34 35 36 37 38 39 40 41 42 43 44 45 46 47 48 49 50 51 52 53 54 55 56 57 58 59 60 61 62 63 64 65
29
[36] Chaitanya GV, Babu PP. Differential PARP cleavage: an indication of heterogeneous
forms of cell death and involvement of multiple proteases in the infarct of focal cerebral
ischemia in rat. Cell Mol Neurobiol 2009;29:563-73.
[37] Yu HG, Ai YW, Yu LL, Zhou XD, Liu J, Li JH, et al. Phosphoinositide 3-kinase/AKT
pathway plays an important role in chemoresistance of gastric cancer cells against etoposide
and doxorubicin induced cell death. Int J Cancer 2008;122:433-43.
[38] Oh JH, Lee TJ, Kim SH, Choi YH, Lee SH, Lee JM, et al. Induction of apoptosis by
withaferin A in human leukemia U937 cells through down-regulation of AKT
phosphorylation. Apoptosis 2008;13:1494-504.
[39] de Frias M, Iglesias-Serret D, Cosialls AM, Coll-Mulet L, Santidrián AF, González-
Gironès DM, et al. AKT inhibitors induce apoptosis in chronic lymphocytic leukemia cells.
Haematologica 2009;94:1698-707.
[40] Eapen AK, Henry MK, Quelle DE, Quelle FW. DNA damage-induced G(1) arrest in
hematopoietic cells is overridden following phosphatidylinositol 3-kinase-dependent
activation of cyclin-dependent kinase 2. Mol Cell Biol 2001;21:6113-21.
[41] Yu C, Mao X, Li WX. Inhibition of the PI3K pathway sensitizes fludarabine-induced
apoptosis in human leukemic cells through an inactivation of MAPK-dependent pathway.
Biochem Biophys Res Comm. 2005;331:391-7.
peer
-005
9626
3, v
ersi
on 1
- 27
May
201
1

Page 30 of 45
Accep
ted
Man
uscr
ipt
1 2 3 4 5 6 7 8 9 10 11 12 13 14 15 16 17 18 19 20 21 22 23 24 25 26 27 28 29 30 31 32 33 34 35 36 37 38 39 40 41 42 43 44 45 46 47 48 49 50 51 52 53 54 55 56 57 58 59 60 61 62 63 64 65
30
[42] Powles T, te Poele R, Shamash J, Chaplin T, Propper D, Joel S, et al. Cannabis-induced
cytotoxicity in leukemic cell lines: the role of the cannabinoid receptors and the MAPK pathway.
Blood. 2005 Feb 1;105(3):1214-21.
[43] Jaattela M, Tschopp J. Caspase-independent cell death in T lymphocytes. Nat Immunol
2003;4:416-23.
[44] Kroemer G, Galluzzi L, Vandenabeele P, Abrams J, Alnemri ES, Baehrecke EH, et al.
Classification of cell death: recommendations of the Nomenclature Committee on Cell Death
2009. Cell Death Differ 2009;16:3-11.
[45] Athanasiou A, Smith PA, Vakilpour S, Kumaran NM, Turner AE, Bagiokou D, et al.
Vanilloid receptor agonists and antagonists are mitochondrial inhibitors: how vanilloids cause
non-vanilloid receptor mediated cell death. Biochem Biophys Res Commun 2007;354:50-5.
[46] Athanasiou A, Clarke AB, Turner AE, Kumaran NM, Vakilpour S, Smith PA, et al.
Cannabinoid receptor agonists are mitochondrial inhibitors: a unified hypothesis of how
cannabinoids modulate mitochondrial function and induce cell death. Biochem Biophys Res
Commun 2007;364:131-7.
[47] Boujrad H, Gubkina O, Robert N, Krantic S, Susin SA. AIF-mediated programmed
necrosis: a highly regulated way to die. Cell Cycle 2007;6:2612-9.
[48] Wang Y, Dawson VL, Dawson TM. Poly(ADP-ribose) signals to mitochondrial AIF: a
key event in parthanatos. Exp Neurol 2009;218:193-202.
peer
-005
9626
3, v
ersi
on 1
- 27
May
201
1

Page 31 of 45
Accep
ted
Man
uscr
ipt
1 2 3 4 5 6 7 8 9 10 11 12 13 14 15 16 17 18 19 20 21 22 23 24 25 26 27 28 29 30 31 32 33 34 35 36 37 38 39 40 41 42 43 44 45 46 47 48 49 50 51 52 53 54 55 56 57 58 59 60 61 62 63 64 65
31
[49] Wang Y, Kim NS, Li X, Greer PA, Koehler RC, Dawson VL, et al. Calpain activation is
not required for AIF translocation in PARP-1-dependent cell death (parthanatos). J
Neurochem 2009;110:687-96.
[50] Heeres PT, Hergenrother PJ. Poly(ADP-ribose) makes a date with death. Curr Opin
Chem Biol 2007;11:644-53.
[51] Lee NS, Cheong HJ, Kim SJ, Kim SE, Kim CK, Lee KT, et al. Ex vivo purging of
leukemia cells using tumor-necrosis-factor-related apoptosis-inducing ligand in hematopoietic
stem cell transplantation. Leukemia 2003;17:1375–83.
[52] Kornacker M, Stumm J, Pott C, Dietrich S, Süssmilch S, Hensel M, et al. Characteristics of
relapse after autologous stem-cell transplantation for follicular lymphoma: a long-term follow-
up. Ann Oncol. 2009;20:722-28.
peer
-005
9626
3, v
ersi
on 1
- 27
May
201
1

Page 32 of 45
Accep
ted
Man
uscr
ipt
1 2 3 4 5 6 7 8 9 10 11 12 13 14 15 16 17 18 19 20 21 22 23 24 25 26 27 28 29 30 31 32 33 34 35 36 37 38 39 40 41 42 43 44 45 46 47 48 49 50 51 52 53 54 55 56 57 58 59 60 61 62 63 64 65
32
Legends to the figures
Fig.1. SR141716 cytotoxic and cytostatic effects. Jurkat and U937 cells and non-stimulated freshly
isolated PBMC were exposed to increasing doses of SR141716 or vehicle only as controls. (A) The
number of viable cells was evaluated after 24 h treatment; data are expressed as percentages of the
respective controls; the number of control leukemia cells after 24 h incubation was more than
doubled; the number of control non proliferating PBMC after 24 h incubation was slight lower
(about 10%) than at time 0. (B) The distribution of Jurkat, U937 cells and the respective controls in
the different phases of cell cycle was measured 24 h following treatment. (C) Percentages of
hypodiploid cells in SR141716-treated Jurkat, U937, and PBMC cells after subtracting the
respective control values (24 h incubation: 2.3 ± 0.05 %, 2.7 ± 0.45%, and 10.11 ± 0.1 %, in Jurkat,
U937, and PBMC, respectively; 48 h incubation: 3.8 ± 0.07 %, 4.2 ± 0.04 %; and 19.8 ± 2.05 % in
Jurkat, U937, and PBMC, respectively). All data are shown as means ± SD of at least three
experiments each done in triplicate (*p <0.05 and #p < 0.01 vs. control).
Fig. 2. SR141716-induced phosphatidyl serine exposure and chromatin condensation. (A) Control
and cells exposed to SR141716 were double stained with annexin V-FITC and PI under non-
permeabilized conditions and analyzed by flow cytometry. Jurkat and U937 cells were exposed for
the indicated times to 15 M and 20 M (a, b) or 25 M and 30 M (c) SR141716, respectively.
The analysis regions were set such that ≤ 2% of control cells were positive for annexin V-FITC/PI.
Cytograms are representative of at least three experiments with similar results. (B) Cell and nuclear
morphology. Light (crystal violet staining) and fluorescence (Hoechst 33342 staining) microscopy
(400x magnification) analysis of Jurkat and U937 exposed to vehicle alone (A, D and A’, D’) or to
15 M (B, E and B’, E’) and 20 M (C, F and C’, F’) SR141716, respectively, for 24 h. Lower
panel: percentage of apoptotic cells based on counting approximately 100 cells. Error bars indicate
± SD of thee independent experiments (#p < 0.01 vs. control).
peer
-005
9626
3, v
ersi
on 1
- 27
May
201
1

Page 33 of 45
Accep
ted
Man
uscr
ipt
1 2 3 4 5 6 7 8 9 10 11 12 13 14 15 16 17 18 19 20 21 22 23 24 25 26 27 28 29 30 31 32 33 34 35 36 37 38 39 40 41 42 43 44 45 46 47 48 49 50 51 52 53 54 55 56 57 58 59 60 61 62 63 64 65
33
Fig. 3. SR141716-induced mitochondrial depolarization and changes in Ca2+
and ROS levels. (A)
Mitochondrial membrane depolarization (Δm loss) and PS exposure (annexin V-FITC positive
cells, A+/PI
- plus A
+/PI
+) in Jurkat and U937 cells exposed to increasing doses of SR141716 or
vehicle for 24 h. Data are shown as means ± SD of at least three experiments performed in
duplicate. (B) Mitochondrial membrane depolarization and PS exposure in Jurkat and U937 cells
exposed to 15 µM and 20 µM SR141716, respectively, for the indicated times. Data, subtracted for
control values, are shown as means ± SD of two experiments performed in duplicate (*p <0.05 and
#p < 0.01 Δm loss vs. PS exposure). (C) Protective effect of Ca2+
chelation on the extent of Δm
in U937 treated with 20 M SR141716 for the indicated times. Cytograms are from one experiment
of three with similar results. (D) ROS levels in U937 exposed to vehicle only (control), 300 M t-
BOOH (positive control) and 20 M SR141716 for 3 h; cells were loaded with DCFH-DA alone
(upper panel) or with both DCFH-DA and PI (lower panel). The figures are representative of three
independent experiments.
Fig. 4. SR141716-induced release of cytochrome c and AIF. Jurkat and U937 cells were exposed
for the indicated times to 15 µM and 20 µM SR141716, respectively, or to vehicle only. Cytosolic
fractions and whole lysates were probed with anti-cytochrome c (A) and anti-AIF (B) antibodies.
Blots were reprobed with anti-Hsp60 and, subsequently, with anti-tubulin antibodies to check the
purity of the cytosolic fractions and protein loading, respectively. Results from a single experiment
out of three experiments with similar results are showed.
Fig. 5. Role of caspases in SR141716-induced cell death. (A) Effect of ZVAD (20 M) on
SR141716-induced PS externalization (annexin V-FITC positive cells, A+/PI
- plus A
+/PI
+) and
Δm loss in Jurkat and U937 cells exposed 24 h to 15 M and 20 M of the drug, respectively.
peer
-005
9626
3, v
ersi
on 1
- 27
May
201
1

Page 34 of 45
Accep
ted
Man
uscr
ipt
1 2 3 4 5 6 7 8 9 10 11 12 13 14 15 16 17 18 19 20 21 22 23 24 25 26 27 28 29 30 31 32 33 34 35 36 37 38 39 40 41 42 43 44 45 46 47 48 49 50 51 52 53 54 55 56 57 58 59 60 61 62 63 64 65
34
Reported results are the means ± SD of at least three experiments performed in duplicate (*p <0.05
and #p < 0.01 vs. samples without ZVAD). Representative cytograms of SR141716-treated Jurkat
cells in the absence and in the presence of ZVAD are shown in the insert (the analysis regions were
set such that < 2% of the control cells were positive for annexin V-FITC/PI). (B) Caspase 3
activation. Whole lysates from Jurkat and U937 cells, exposed for the indicated times to SR141716
(SR) 15 M and 20 M, respectively, were checked for caspase 3 proteolytic cleavage. Cells treated
with the vehicle alone (C) were used as negative control. Jurkat cells (lane 1) and U937 cells (lane
2) treated with 10 µM etoposide for 24 h were used as positive controls. GAPDH was used for
normalization. MW markers are indicated on the left. Blots from a single experiment representative
of at least two with similar results are reported.
Fig. 6. Role of PARP1 activation in SR141716-induced cell death. (A) Effect of PJ34 (4 M), alone
or given in combination with ZVAD (20M), on SR141716-induced increase of PS externalization
(annexin V-FITC positive cells, A+/PI
- plus A
+/PI
+) and Δm loss. Jurkat and U937 cells were
exposed 24 h to 15 M and 20 M SR141716, respectively. Data are shown as means ±SD of at
least three experiments each done in duplicate (*p <0.05 and #p < 0.01 vs. cells treated with
SR141716 alone). (B) Representative cytograms of annexin V-FITC /PI doubled stained U937 cells
exposed 24 h to 20 M SR141716 in the absence or in the presence of the inhibitors as indicated in
the figure. The analysis regions were set such that < 2% of the control cells were positive for
annexin V-FITC/PI. Cells exposed to ZVAD or PJ34 alone gave profiles comparable to that of
control cells (not shown). (C) Whole cell lysates from U937 exposed for the indicated times to 20
M SR141716 were probed with PAR antibody. Lanes 1, cells treated 8 h with vehicle only.
Tubulin was used for normalization. Blots from a single experiment representative of two with
similar results are reported.
peer
-005
9626
3, v
ersi
on 1
- 27
May
201
1
Page 35 of 45
Accep
ted
Man
uscr
ipt
1 2 3 4 5 6 7 8 9 10 11 12 13 14 15 16 17 18 19 20 21 22 23 24 25 26 27 28 29 30 31 32 33 34 35 36 37 38 39 40 41 42 43 44 45 46 47 48 49 50 51 52 53 54 55 56 57 58 59 60 61 62 63 64 65
35
Fig. 7. PARP1 processing in SR141716-treated Jurkat and U937 cells. PARP1 processing was
evaluated in whole lysates from Jurkat and U937 cells exposed 24 h to different doses of SR141716
(A) or to 15 M and 20 M of the drug, respectively, for the indicated times (B). Cells exposed to
vehicle only (C) or etoposide (E) were used as negative and positive controls, respectively. (C)
Effect of ZVAD on PARP1 cleavage in Jurkat and U937cells exposed 24 h to 15 M and 20 M
SR1411716, respectively. Treatment were shown as: vehicle (lane 1), ZVAD (lane 2), etoposide
(lane 3), etoposide + ZVAD (lane 4), SR141716 (lane 5), SR141716 + ZVAD (lane 6). Tubulin was
used for normalization. Blots from a single experiment representative of at least two with similar
results are reported.
Fig. 8. Involvement of PI3K/AKT pathway in SR141716-induced effects. (A) Jurkat and U937 cells
were exposed 12 h to LY294002 alone or in combination with 15 M and 20 M SR141716,
respectively. Cells exposed to vehicle were included as controls. The percentages of annexin V-
FITC positive cells (A+/PI
- plus A
+/PI
+) and of those with reduced Δm were evaluated by flow
cytometry. Data are the means ± SD of three independent experiments performed in duplicate (*p
<0.05 and #p < 0.01 vs. in the absence of LY294002). (B) Whole cell lysates from Jurkat and U937
exposed for the indicated times to 15 M and 20 M, respectively, were checked for the level of
AKT and its phosphorylated form (pAKT). Tubulin was used for normalization. The figure is one
representative of three with similar results.
peer
-005
9626
3, v
ersi
on 1
- 27
May
201
1

Page 36 of 45Accep
ted
Man
uscr
ipt
*Graphical Abstractpe
er-0
0596
263,
ver
sion
1 -
27 M
ay 2
011

Page 37 of 45Accep
ted
Man
uscr
ipt
SR141716 induces cell cycle arrest and programmed cell death in leukemia-derived Jurkat and U937 cell lines, and, depending on the cell type,
activates different as well equivalent death pathways to a different extent. SR141716 exhibits low toxicity in PBMC.
Jurkat
caspase3
U937
SR141716
G0G1 arrest
PI3K/AKT
AIF
cyt. c
PARP
Cell death
SR141716
AIF
Cyt. c
Cell death
caspase3
S arrest
Ca2+
peer
-005
9626
3, v
ersi
on 1
- 27
May
201
1

Page 38 of 45
Accep
ted
Man
uscr
ipt
A
B
C
Figure 1pe
er-0
0596
263,
ver
sion
1 -
27 M
ay 2
011

Page 39 of 45
Accep
ted
Man
uscr
ipt
A B
Figure 2pe
er-0
0596
263,
ver
sion
1 -
27 M
ay 2
011

Page 40 of 45
Accep
ted
Man
uscr
ipt
A
C
D
B
Figure 3pe
er-0
0596
263,
ver
sion
1 -
27 M
ay 2
011
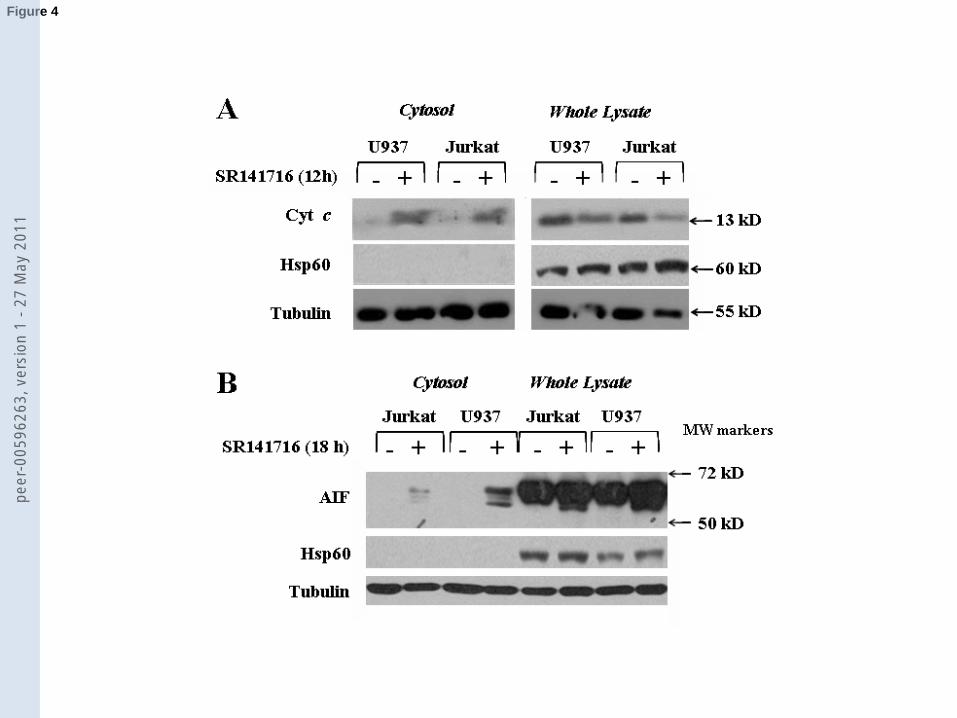
Page 41 of 45
Accep
ted
Man
uscr
ipt
Figure 4pe
er-0
0596
263,
ver
sion
1 -
27 M
ay 2
011

Page 42 of 45
Accep
ted
Man
uscr
ipt
A
B
Figure 5pe
er-0
0596
263,
ver
sion
1 -
27 M
ay 2
011

Page 43 of 45
Accep
ted
Man
uscr
ipt
A B
C
Figure 6pe
er-0
0596
263,
ver
sion
1 -
27 M
ay 2
011

Page 44 of 45
Accep
ted
Man
uscr
ipt
Figure 7pe
er-0
0596
263,
ver
sion
1 -
27 M
ay 2
011

Page 45 of 45
Accep
ted
Man
uscr
ipt
A
B
Figure 8pe
er-0
0596
263,
ver
sion
1 -
27 M
ay 2
011