Screening for Caspase-3 Inhibitors: A New Class of Potent Small-Molecule Inhibitors of Caspase-3

Mezencev et al. J. Nat. Med. 2011; 65(3-4):488-499.
1
The final publication is available at Springer via http://dx.doi.org/10.1007/s11418-011-0526-x
Camalexin induces apoptosis in Jurkat T-leukemia cells by increased concentration of reactive oxygen species and activation of caspases-8 and -9.
Roman Mezencev*1
, Taylor Updegrove1, Peter Kutschy
2, Mária Repovská
2, and John F.
McDonald1
1 Georgia Institute of Technology, School of Biology, 310 Ferst Dr., Atlanta, GA 30332
2 P. J. Šafárik University, Faculty of Science, Institute of Chemical Sciences, Moyzesova 11, Košice, Slovakia
* corresponding author
Abstract
Camalexin, a major indole phytoalexin of Arabidopsis thaliana, accumulates in various
cruciferous plants in response to environmental stress and reportedly displays antimicrobial
activities against various plant pathogens. However, its cytotoxicity against eukaryotic cells
and potential as a prospective drug for human diseases has been examined only in a limited
context. Our data demonstrate the time- and concentration-dependent cytotoxicity of
camalexin on human T-leukemia Jurkat cells in the micromolar range, and the lower potency
of cytotoxic effects on human lymphoblasts and primary fibroblasts. Cytotoxicity of
camalexin is enhanced by the glutathione-depleting agent buthionine sulfoximine and
completely blocked by pan caspase inhibitor Z-VAD-FMK. Treatment of Jurkat cells with
camalexin resulted in activation of caspase-8, caspase-9, caspases-3/7, and apoptosis that was
detected by the presence of a sub-G1 population of cells, externalization of phosphatidyl
serine and decreased mitochondrial membrane potential. Staining with 2',7'-
dichlorodihydrofluorescein diacetate and dihydroethidium bromide displayed increased
concentration of ROS early in camalexin-treated Jurkat cells, prior to the onset of apoptosis
while staining with MitoSOXTM
dye identified mitochondria as a source of increased ROS.
Our data suggest that this phytochemical, which has a wide range of predicted
pharmacological activities, induces apoptosis in Jurkat leukemia cells through increased ROS
followed by dissipation of mitochondrial membrane potential and execution of caspase-9-
and caspase-8-initiated apoptosis. This is, to the best of our knowledge, the first report on
antileukemic activity and mode of action of this unique indole phytoalexin.
Keywords
camalexin; leukemia; reactive oxygen species; ROS; apoptosis; phytoalexin

Mezencev et al. J. Nat. Med. 2011; 65(3-4):488-499.
2
Introduction
Camalexin [3-(thiazol-2-yl)-1H-indole] (Fig. 1) is an indole phytoalexin that accumulates in
various cruciferous plants, e.g. Camelina sativa, Arabidopsis thaliana, and Capsella bursa-
pastoralis, in response to plant pathogen attack or abiotic stress [1-3]. It displays
antimicrobial activity against some bacterial and fungal plant pathogens, including
Pseudomonas syringae, Alternaria brassicicola, Alternaria brassicaeae and Leptosphaeria
maculans reportedly via its cell membrane disrupting effect [4]. In addition, camalexin exerts
cytostatic/cytotoxic effects on the human protozoan pathogen, Trypanosoma cruzi [5], and on
the human breast cancer cell line SKBr3 (4-day treatment, IC50=2.7 μM) where it displays
higher potency than the traditional anticancer agents cisplatin (IC50=7.4 μM) and melphalan
(IC50=13.0 μM) [6]. In spite of the fact that camalexin as well as other phytoalexins may
impact human and animal health as constituents of conventional or enhanced animal feed or
human food [7-8], or as a lead compound for future development of structurally related drugs,
information on its effects on mammalian cells is rather limited, and it has been researched
predominantly with regard to plant chemical defensive mechanisms. For this reason, we have
further investigated the cytotoxic properties of this phytochemical on cultured human T-
leukemia Jurkat cells (cancer cell line) as well as on human lymphoblasts (immortalized cell
line) and human skin fibroblasts (non-malignant primary cell culture), and characterized its
mode of cytotoxic action.
Material and Methods
Chemicals
Camalexin (CAM) was synthesized following Ayer et al. [9] and its stock solution (40 mM in
absolute ethanol) was kept at -80 C before use. DL-buthionine-(S,R)-sulfoximine (BSO),
staurosporine (STA) and etoposide (ETO) were obtained from Sigma-Aldrich (St. Louis,
MO, USA); N-benzyloxycarbonyl-valyl-alanyl-aspartyl-(O-methyl)-fluoromethylketone (Z-
VAD-FMK) was from R&D Systems, Inc (Minneapolis, MN, USA), and tris (2-
carboxyethyl) phosphine hydrochloride (TCEP) was obtained from Thermo Fisher Scientific
Inc. (Rockford, IL, USA). Stock solutions of these compounds were prepared as follows:
BSO – 40 mM in sterile H2O; STA - 100 g/mL in DMSO; ETO – 40 mM in DMSO; Z-
VAD-FMK - 20 mM in DMSO; TCEP – 100 mM in H2O. 2',7'-dichlorodihydrofluorescein
diacetate (DCFH-DA), dihydroethidium bromide (DHE) and MitoSOXTM
were obtained from
Cayman Chemical (Ann Arbor, MI, USA), Polysciences, Inc (Warrington, PA), and
Invitrogen Corporation (Carlsbad, California, USA), respectively.
Cell cultures
Acute T-lymphoblastic leukemia Junkat cells [10], clone E6-1, were obtained from ATCC
(Manassas, Virginia, USA) and maintained in RPMI 1640 medium supplemented with fetal
bovine serum (10%), L-glutamine (2 mM), penicillin (100 IU/mL), streptomycin (100
μg/mL) and amphotericin B (0.25 μg/mL) in an atmosphere of humidified air with 5% CO2.
Human immortalized lymphoblasts GM 15851 [11] were procured from Coriell (Camden,
NJ, USA) and maintained in RPMI 1640 medium with fetal bovine serum (15%), L-
glutamine (2 mM), penicillin (100 IU/mL), streptomycin (100 μg/mL) and amphotericin B
(0.25 μg/mL) in an atmosphere of humidified air with 5% CO2. Human primary skin
fibroblasts were obtained from Coriell Cell Repositories (Camden, NJ, USA, Catalog ID
AG13153) and maintained in Eagle’s MEM supplemented with fetal bovine serum (15%), 26
mM HEPES, 2 mM L-glutamine, penicillin (100 IU/mL), streptomycin (100 μg/mL) and
amphotericin B (0.25 μg/mL) in an atmosphere of humidified air with 5% CO2. For plating

Mezencev et al. J. Nat. Med. 2011; 65(3-4):488-499.
3
onto 96-well plates, a single cell suspension of fibroblasts (passage 13) was prepared by
harvesting and dissociation using Accutase Cell Detachment Solution (Thermo Electron
Corporation, Louisville, CO, USA) for 10 minutes at 37C and filtration through the cell
strainer with 40 m nylon mesh.
Cytotoxicity assay
The cytostatic and cytotoxic activity of camalexin on cultured Jurkat, human lymphoblasts
and human primary fibroblast cells was evaluated using the in vitro toxicology assay kit
TOX-8 (Sigma-Aldrich, St. Louis, MO, USA) [12]. 100 µL of cell suspension were plated in
96-well black-walled plates at 100,000 cells/mL (Jurkat, human lymphoblasts) or 50,000
cells/mL (human fibroblasts) in Eagle’s MEM medium supplemented with 5% FBS, L-
glutamine (2 mM), penicillin (100 IU/mL), streptomycin (100 μg/mL) and amphotericin B
(0.25 μg/mL), and grown at 37C in humidified air with 5% CO2 for 24h. Thereafter, 100 µL
of the tested compounds dissolved in growth medium at a concentration 2-fold of the desired
final concentration were added in quadruplicates and cells were incubated for a specific time.
After that 20 μL of the TOX-8 reagent were added to each well and incubated for the next 2
hours (Jurkat cells and human fibroblasts) or 3 hours (human lymphoblasts). The increase of
fluorescence was measured at a wavelength of 590 nm using an excitation wavelength of 560
nm. The emission of control wells (no drug treatment) after the subtraction of a blank was
taken as 100% and the results for treatments were expressed as a percentage of the control.
IC50 values (concentrations of tested agents that inhibited growth of Jurkat or fibroblast cell
cultures after 72-hour incubation to 50% of the untreated control) were determined by non-
linear regression of log-transformed data using a normalized response-variable slope model
(GraphPad Prism 5.01; GraphPad Software, Inc.) and expressed as mean ± SD. Time
dependence of cytostatic/cytotoxic effects of camalexin was determined for a single
concentration of camalexin (50 M) on Jurkat cells at various incubation times. For
elucidation of the mode of action, cytotoxicity of camalexin on Jurkat cells was also tested in
combinations with BSO (-glutamylcysteine synthetase inhibitor) and Z-VAD-FMK (a cell-
permeant pan caspase inhibitor). In all cytotoxicity assays, test was performed in 4 wells for
each treatment. For each 4 treatment wells there were 4 untreated control wells in the same
column of the 96-well plate. Experiments were performed 2 times and consistency between
plates was observed.
Caspase activity
Activity of caspase-8 and caspase-9 was measured by the homogeneous Caspase-Glo 8 or
Caspase-Glo 9 Assay (Promega, Madison, WI), respectively. These initiator caspases were
determined based on cleavage of their specific luminogenic substrates, Z-LETD-
aminoluciferin (caspase-8) and Z-LEHD-aminoluciferin (caspase-9) in the presence of the
proteasome inhibitor MG-132 [13]. Activities of effector caspase-3 and caspase-7 were
measured using the homogeneous luminescent Caspase-Glo 3/7 Assay (Promega, Madison,
WI) based on caspase 3/7-catalyzed cleavage of Z-DEVD-aminoluciferin [14]. In all these
assays, 50 μL (150,000 cells/mL) of Jurkat cells in Eagle’s MEM medium supplemented with
5% FBS, L-glutamine (2 mM), penicillin (100 IU/mL), streptomycin (100 μg/mL) and
amphotericin B (0.25 μg/mL) were plated onto 96-well white-walled plates at 150,000
cells/mL and grown at 37C in humidified air with 5% CO2 for 24h. Thereafter, 50 µL of
camalexin in full medium were added so that the final concentration was 100 μM and the
plate then was incubated for the next 72 hours. Assays were performed following
manufacturer’s recommendations with following controls: wells with medium only (no-
treatment); 10 μM staurosporine (positive control for caspase-9 and caspase-3/7 activation),
and 25 μM etoposide (positive control for caspase-8) [15]. All positive controls were applied

Mezencev et al. J. Nat. Med. 2011; 65(3-4):488-499.
4
during the last 6 hours of incubation. Activities of caspases were determined by imaging
using the Typhoon 8600 Variable Mode Imager in chemiluminescence scan mode. For
detection of each caspase activity, camalexin treatments were performed in 4 wells; untreated
controls were performed in 2-4 wells and positive controls in 2 wells. Luminescence
corresponding to individual wells was quantified using image analysis software Science Lab
2005 Multi Gauge Ver. 3.0 (Fujifilm, USA). The experiment was performed 2 times and
consistency between results was confirmed.
Apoptosis via externalized PS
Apoptosis through detection of externalized phosphatidyl serine (PS) was determined in
Jurkat cells treated with camalexin (100 M) or solvent control by flow cytometry (BD
LSRII, BD Biosciences, San Jose, CA, USA) using Annexin V-FITC Apoptosis Detection
Kit (Calbiochem, San Diego, CA, USA). Upon induction of apoptosis, PS normally localized
in the internal part of the plasma membrane, becomes surface-exposed and available to bind
to the annexin V-FITC conjugate [16]. Early apoptotic cells are detected as Annexin V-
positive and propidium iodide (PI)-negative (FITC+/PI
-); late apoptotic and necrotic cells are
detected as FITC+/PI
+ and non-apoptotic cells as FITC
-/PI
- events. Jurkat cells were treated
with camalexin or solvent control in full RPMI 1640 medium for 8, 24 and 48 hours and the
assay was performed following the manufacturer’s rapid binding protocol. Experiments were
performed 3 times and a representative result is displayed in the form of PI vs Annexin V-
FITC fluorescence scattergrams.
Mitochondrial membrane potential
The mitochondrial respiratory chain generates transmembrane potential (ΔΨm) and its
disruption observed during apoptosis can be detected with the lipophilic cationic dye
5,5’,6,6’-tetrachloro-1,1’,3,3’-tetraethylbenzimidazolylcarbocyanine iodide (JC-1). JC-1
selectively enters into mitochondria with high ΔΨm and reversibly forms J-aggregates with
intense red fluorescence, while in cells with low ΔΨm remains in monomeric form that
displays green fluorescence only [17]. Cells treated with camalexin (100 µM) or solvent
control for 8, 24 and 48 hours were processed using the Mitochondrial Apoptosis Detection
Kit (GenScript, Piscataway, NJ, USA) following manufacturer’s protocol for flow cytometric
assay format. Experiments were performed 3 times and representative results are displayed in
the form of PerCP-Cy5 vs Annexin V-FITC fluorescence scattergrams.
Cell cycle analysis
Distribution of camalexin and control-treated Jurkat cells in various phases of cell cycle was
determined based on cellular DNA content by flow cytometry [18]. Jurkat cells were cultured
in RPMI 1640 medium supplemented with 5% FBS, L-glutamine (2 mM), penicillin (100
IU/mL), streptomycin (100 μg/mL) and amphotericin B (0.25 μg/mL), at 37C in humidified
air with 5% CO2 were treated with 100 μM camalexin or solvent control for 48h. Thereafter,
cells were pelleted at 200 g for 5 minutes, washed twice with ice cold PBS, resuspended in
ice cold PBS at 2106
cells/mL, and slowly added to an equal volume of cold absolute
ethanol. After storing for 24 hours at -40C, cells were centrifuged at 200 g/10 min/4C,
washed with cold PBS and resuspended in 500 L of solution containing 0.2 mg/mL DNAse-
free RNAse A and 20 g/mL PI in a 0.1% solution of Triton-X100 in PBS. After 15 min
incubation at 37C cell cycle analysis was performed using a BD LSRII benchtop flow
cytometer (BD Biosciences). Cell cycle distribution was determined by deconvolution of
DNA content histograms, after discrimination of doublets and other cellular aggregates, by
FlowJo 7.6 software (Tree Star, Inc., Ashland, OR, USA) using the Dean-Jet-Fox (DJF)
model that fits G1 and G2 phases with Gaussian curves and S phase with a second degree

Mezencev et al. J. Nat. Med. 2011; 65(3-4):488-499.
5
polynomial [19]. The cell cycle analysis experiment was performed 3 times and
representative data are displayed in Figure 9A. Data summarizing cell cycle distribution in all
3 experiments are presented in Figure 9B.
Determination of cellular ROS
Intracellular levels of hydrogen peroxide and some reactive nitrogen species (nitric oxide and
peroxynitrite) in camalexin and solvent control treated cells were determined by FACS using
the fluorogenic probe DCFH-DA, which diffuses into cells where it is deacetylated by
cellular esterases and rapidly oxidized by ROS to highly fluorescent 2’,7’-
Dichlorofluorescein (DCF) [20]. Detection of intracellular superoxide was performed with
dihydroethidium bromide (DHE). DHE is specifically oxidized by superoxide to a DNA-
binding fluorophore hydroxyethidium [21-22].
In all ROS detection experiments, Jurkat cells were plated onto 6-well plates at cell densities
of 500,000 cells/mL and treated with 100 M camalexin or solvent control for 6 hours. After
the treatment, cells were pelleted, washed with PBS, resuspended in DMEM with 30 M of
DCFH-DA or DHE and incubated for 30 min in 5% CO2 at 37C. After the incubation, cells
were pelleted, washed with PBS, resuspended in PBS and analyzed by FACS using FITC or
PE channels in the BD LSRII benchtop flow cytometer. Experiments were performed 3 times
and representative results of FACS are presented in the form of fluorescence distribution
histograms.
Determination of mitochondrial superoxide
Mitochondrial superoxide is selectively detected using fluorogenic live cell-permeant
mitochondria-targeted dye MitoSOXTM
[23]. Jurkat cells were plated onto 6-well plates at
cell densities of 500,000 cells/mL and treated with 100 M camalexin or solvent control for 6
hours. Thereafter, cells were washed two times with HBBS/Ca/ Mg containing 1% BSA and
stained with 5 M solution of MitoSOX in HBBS/Ca/Mg containing 1% BSA for 10 minutes
at 37C. Stained cells were washed 3 times with warm buffer, re-suspended in the buffer,
analyzed by FACS and visualized by fluorescent microscopy.
Determination of cellular glutathione
Jurkat cells were plated at density 350,000 cells/mL in 12-well plates in DMEM/F12 medium
(glutathione-free) supplemented with 10% FBS and antibiotic/antimycotic and treated with
camalexin (100 μM) or solvent control for 12 hours. Reduced glutathione (GSH) and total
cellular glutathione (GSH+GSSG) in camalexin and solvent control-treated cells were
quantified using GSH-Glo Glutathione Assay (Promega). In this assay the luciferin derivative
Luc-NT is converted in the presence of GSH and glutathione S-transferase (GST) to luciferin
that in a coupled reaction catalyzed by firefly luciferase generates a luminescent signal. The
assay was performed following manufacturer’s instructions for suspension cell cultures. Total
cellular glutathione was determined after reduction of GSSG to GSH with TCEP (final
concentration 1 mM). Luminescence signal after subtraction of blanks (net RLU) was
normalized to the number of viable cells determined by resazurin-based cell viability assay
TOX-8 (Sigma-Aldrich). All experiments were performed in triplicates. BSO was used as a
positive control for glutathione depletion at a final concentration of 25 μM. Camalexin, BSO
and solvent control treatments were performed in 3 replicated wells and the experiment was
performed 2 times.
In silico predictions
The virtual screening tool Miscreen (Molinspiration Cheminformatics, Slovensky Grob,
Slovakia) [24] was employed to perform the ligand-based virtual screening with camalexin.

Mezencev et al. J. Nat. Med. 2011; 65(3-4):488-499.
6
This tool generates substructure features (fragments) from a training set of active and inactive
compounds and subsequently builds a bioactivity model using Bayesian statistics. These
models calculate an activity score for each screened molecule as a sum of the activity
contributions of its fragments. A higher score means a higher probability that the compound
is active. For this report, activity scores of camalexin as a GPCR ligand, ion channel
modulator, kinase inhibitor or nuclear receptor ligand were determined using Molinspiration
Cheminformatics models available online (http://www.molinspiration.com. Accessed
October 2010) and compared with those for average organic molecules.
Statistics
When not specified otherwise, significance of differences between means of two-class data
was tested by two-tailed Welch’s t-test. The trend between cell viability and time of cell
exposure to camalexin was determined by linear regression analysis and expressed as slope
SD and p-value of F-test for significance of difference of slope from 0. Significance of
differences among sample means in the time course cytotoxicity experiment was tested by
one-way ANOVA followed by the Tukey-Kramer procedure to test significance of
differences between selected pairs of sample means. In all tests, differences were considered
significant if p-value < 0.05.
Results
Camalexin exerts cytotoxic effects on Jurkat cells at an intermediate micromolar range and
IC50 value for 72-hour exposure equals to 52.9±2.52 μM (mean±SD) (Fig 2A). The cytotoxic
effect of camalexin increases with exposure time (Fig 3) and the trend is statistically
significant with slope 0.4560.0987 and p-value 0.0191 (the difference between 99 h and 121
h is not statistically significant). The potency of the cytotoxic effect of camalexin in human
cultured lymphoblasts is lower (IC50 = 84.27.5 M; p=0.0042) and in human primary
fibroblasts much lower (243.7±12.7 μM; p<0.0001) than that in Jurkat cells (Fig 2B and 2C).
The cytotoxicity of camalexin on Jurkat cells was increased by co-treatment with BSO at
concentrations of 50 and 100 M (Fig 4A), while Z-VAD-FMK at 30 M completely
blocked cytotoxicity of camalexin at 50 M (Fig 4B). Consistent with this finding, assays
based on cleavage of specific luminogenic substrates demonstrated activation of caspase-8,
caspase-9, and caspases -3 and -7 (Fig 5A and 5B) upon treatment of Jurkat cells with
camalexin. Activation of caspases is not sufficient evidence for apoptosis, since they also
function in other cellular processes, including T-cell proliferation and cell cycle regulation
[25]. For this reason, the role of apoptosis in camalexin-induced cytotoxicity of Jurkat cells
was further demonstrated by complementary methods. FACS analysis of Annexin V-
FITC/PI-stained cells shows that Jurkat cells treated with 100 M camalexin display early
apoptosis (meanSD: 23.93.18% of treated vs 4.801.21% of untreated cells; N=3;
p=0.0104) and late apoptosis/necrosis (meanSD: 34.13.46% of treated vs 3.001.07% of
untreated cells; N=3; p=0.0045) after 48-h (Fig 6), but not after 8-h treatment (data not
shown). In contrast, primary human fibroblasts display relatively limited apoptosis after 72-
hour treatment with 50 and 200 μM camalexin, which is consistent with their reduced
sensitivity to the cytotoxic effects of camalexin (Fig 7).
Dissipation of mitochondrial membrane potential, an early event in the apoptotic process that
precedes caspase activation and PS externalization, is detected in JC-1-stained Jurkat cells
after 24- and 48-h treatment with camalexin but not after 8-h (Fig 8) with respective
proportions of apoptotic cells 32.65.31%, 53.48.54% and 7.551.59% (meanSD; N=3).
The proportion of apoptotic cells detected by JC-1 staining in untreated controls was

Mezencev et al. J. Nat. Med. 2011; 65(3-4):488-499.
7
8.371.72 (meanSD; N=9). The proportion of cells with decreased mitochondrial potential
after 48-h treatment, shown in Figure 8 (52.9%), is consistent with the proportion of Annexin
V-FITC positive cells shown in Figure 6 (Q2 + Q3 = 55.3%), which corresponds to the
combined proportion of early and late apoptotic/necrotic cells. These data show that the
mitochondrial membrane potential is disrupted in both early apoptotic and late
apoptotic/necrotic cells resulting from camalexin treatment of Jurkat cells. Cell cycle
distribution analysis provides an additional line of evidence for apoptotic cell death in
camalexin-treated Jurkat cells. Apoptotic cells are characterized by fractional DNA content
and correspond to the sub-G1 population on the DNA content frequency distribution
histograms (Fig 9A). Our data suggest that the proportion of apoptotic (sub-G1) Jurkat cells
increased upon 48-hour treatment with 100 μM camalexin from 4.10.69% to 33.74.08%
(meanSD; N=3; p=0.0002) (Fig 9B). These values are similar to the proportion of early
apoptotic cells after 48-h treatment, identified by Annexin V-FITC and PI binding
(4.801.21% and 23.93.18%) (Fig 6). In addition, cell cycle distribution analysis reveals
that increase in proportion of apoptotic cells in camalexin-treated Jurkat cells compared to
untreated control is associated with statistically significant decrease in the proportion of S-
and G2/M-phase cells (Fig 9).
Increased concentration of ROS was found in camalexin-treated Jurkat cells after 6-h
treatment using both DCFH-DA and DHE probes (Fig 10). Staining with MitoSOX suggested
intramitochondrial generation of superoxide in Jurkat cells treated with camalexin (Fig 11).
Significant dissipation of mitochondrial membrane potential or externalization of PS were not
detected after 8-h treatment with camalexin; therefore, the increase of ROS occurred prior to
the onset of apoptosis.
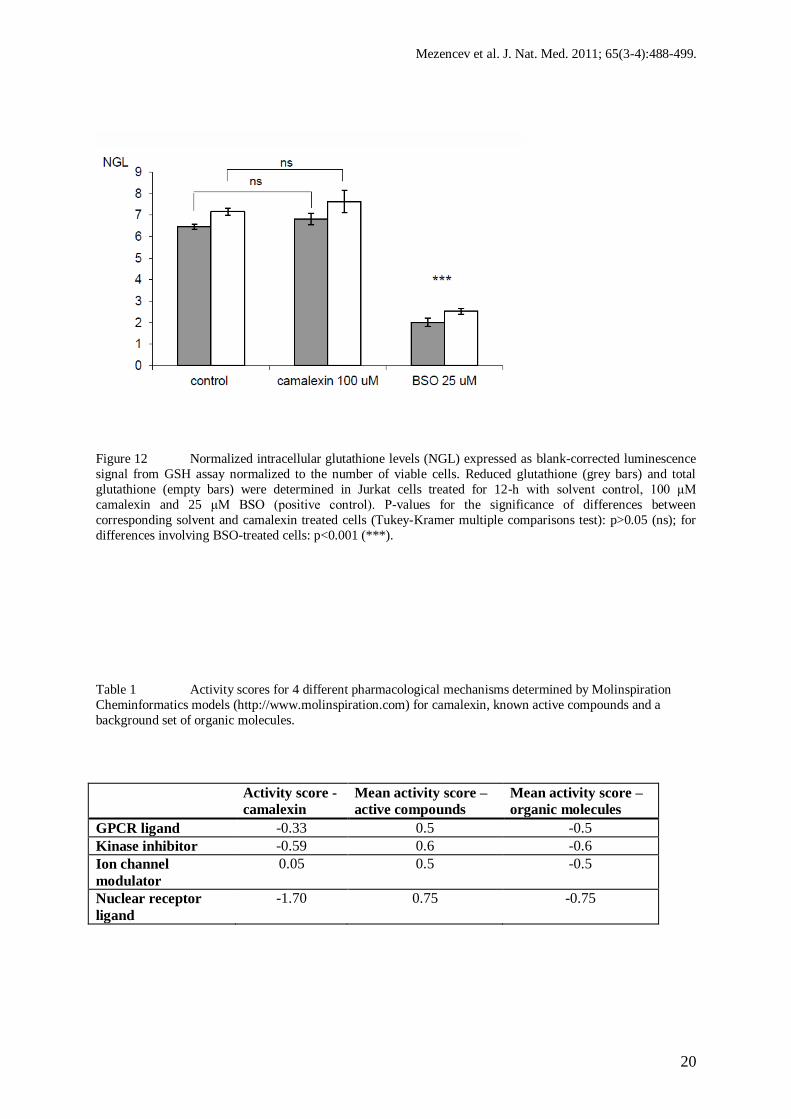
Cellular reduced glutathione (GSH) and total cellular glutathione (GSH + GSSG) levels were
not decreased even after 12-hour treatment of Jurkat cells with 100 μM camalexin (Fig 12),
and GSH/(GSH+GSSG) ratio was the same for camalexin-treated and solvent (control)-
treated cells (0.894 and 0.901, respectively).
Virtual screening results demonstrate that camalexin is not likely to act as a ligand of G
protein-coupled receptors, a kinase inhibitor or a nuclear receptor ligand, while its activity as
an ion channel modulator is inconclusive (Table 1).
Discussion
Camalexin, a major indole phytoalexin of A. thaliana, previously has been investigated with
regard to its biosynthesis, regulation, antimicrobial properties and degradation by plant
pathogens [26-29]. However, its cytotoxicity against eukaryotic cells and potential as a
prospective drug for human diseases has been examined only in a limited context [5-6]. Since
camalexin might possess some therapeutic activity, including antibacterial, antifungal,
antiviral, anticancer, antidepressive, antiparkinsonic, antiallergic, antihypertensive and
analgesic, as predicted by binary QSAR models from GeneGo MetaDrug system
(http://www.genego.com/metadrug.php. Accessed October 2010) [30] we decided to further
explore its cytotoxicity on human cancer and non-cancerous cells. We found that camalexin
exhibited cytotoxic effects on leukemia Jurkat cells with higher potency than on non-
leukemic human lymphoblasts and human primary fibroblasts. Complete suppression of
camalexin-induced cytotoxicity in Jurkat cells by Z-VAD-FMK suggests that caspase-
mediated apoptosis is an exclusive mode of cell death under these conditions without
involvement of non-apoptotic cell death such as necrosis and autophagy. Furthermore, our
cytotoxicity data do not demonstrate switch to necrosis [31] or autophagy [32] upon

Mezencev et al. J. Nat. Med. 2011; 65(3-4):488-499.
8
inhibition of caspases by Z-VAD-FMK, a phenomenon observed by other investigators in
similar experiments. Enhanced cytotoxicity of camalexin in combination with BSO is
consistent with the role of ROS in cytotoxicity of this phytochemical and suggests that GSH
may have a protective effect against it. BSO enhances the cytotoxicity of various anticancer
agents, including cisplatin, melphalan, doxorubicin [33], treosulfan [34], etoposide,
vincristine [35], as well as arsenic trioxide (ATO) [36]. Chemosensitization by BSO
generally involves depletion of cellular glutathione, followed by suppression of drug
detoxification, and decreased multidrug resistance-associated protein (MRP)-mediated drug
efflux. BSO-mediated chemosensitization of different cancer cell types to ATO is associated
with enhanced generation of ROS [36-37], that likely reflects an impaired redox state by BSO
with the increase in reactive oxygen species generated by ATO. Our data suggest that, similar
to ATO [38-39], camalexin induces generation of ROS followed by caspase-dependent
apoptosis. Furthermore, cytotoxicity of both camalexin and ATO is not induced by
glutathione depletion [40] and both these agents appear to induce mitochondrial generation of
ROS [41]. Considering these facts, camalexin appears to display substantial similarity in its
mode of cytotoxic action to ATO, an approved drug for the treatment of relapsed or
refractory acute promyelocytic leukemia [42].
The mode of action (MOA) of camalexin is not yet understood in detail and there are no
published reports on molecular mechanisms of camalexin on mammalian cells.
Transcriptomics analysis on Alternaria brassisicola ascomycete identified several functional
categories of genes induced by camalexin, including lipid, fatty acids and sterol metabolism,
cellular transport, cell wall structure and function, protein fate, and oxidative burst, stress and
defense [43]. However, the relevance of these data to the understanding of camalexin MOA
on mammalian cells is rather limited. Since breast cancer cells SKBr3 sensitive to camalexin
over express topoisomerase IIα, it has been speculated that topoisomerase II is the target of
camalexin [6]. However, camalexin up to 200 M does not display any inhibitory activity on
topoisomerase II-catalyzed relaxation of supercoiled plasmids in vitro (data not presented)
using Topoisomerase II alpha assay kit (USB Corporation, Cleveland, OH). Thus, the
antiproliferative effect of camalexin most likely does not include inhibition of topoisomerase
II. Camalexin also does not appear to interact directly with DNA, since such interaction
should result in the changed stability of the dsDNA duplex that may be recognized by
dsDNA melting experiments [44], and we did not identify any alterations by analyses of
melting curves of calf thymus DNA treated with camalexin in vitro (data not shown).
In conclusion, camalexin triggers apoptotic cell death of Jurkat cells by generation of ROS. It
is well known that ROS may promote cell proliferation or cell death depending on
circumstances that include intensity and cellular location of generated ROS, as well as status
of the antioxidant defense system [45]. In addition to ATO, many other anticancer agents
increase production of ROS in cancer cells, including cisplatin, paclitaxel, 2-
methoxyestradiol, doxorubicin, bleomycin and 5-fluorouracil, and oxidative stress is
responsible, at least in part, for their anticancer activity or toxic side effects [45-46]. These
agents generate ROS by various mechanisms, including the microsomal monooxygenase
system, xanthine oxidase, Fenton and Haber-Weiss reactions, the mitochondrial electron
transport chain, and inhibition of superoxide dismutase [47]. Our results imply camalexin-
induced mitochondrial superoxide generation, that likely results from targeting one or more
possible ROS generating or ROS detoxifying systems, such as Complex I (NADH-
ubiquinone oxidoreductase), Complex III, MnSOD, glutathione system and others. Our
results further suggest that camalexin does not inhibit -glutamylcysteine synthetase, the rate-
controlling enzyme for GSH synthesis, and that camalexin may also inhibit ROS scavenging
by glutathione system, since the total cellular glutathione and GSH/(GSH+GSSG) ratio

Mezencev et al. J. Nat. Med. 2011; 65(3-4):488-499.
9
remained unchanged in camalexin-treated cells with increased ROS. The specific source of
mitochondrial ROS and components of the signaling pathway connecting camalexin-induced
ROS with apoptosis of Jurkat cells remain to be elucidated. Understanding may result in
development of new cancer therapeutic strategies and possibly also new drugs using
camalexin as a lead compound. Camalexin contains a biaryl scaffold considered to be a
privileged structure for drug discovery due to its wide range of different pharmacological
activities, including antifungal, anti-inflammatory, anticancer and follicle-stimulating
hormone (FSH) agonistic effects [48].
Disclosure Statement
Authors declare that no actual or potential conflict of interest exists in relation to this article.
Acknowledgement
This work was supported by Deborah Nash Harris Endowment Fund; Ovarian Cycle
Foundation, the Ovarian Cancer Institute, and the Slovak Research and Development Agency
under the contract No. APVV-0514-06. Authors thank Dr. DeEtte Walker for reviewing the
manuscript and Dr. Kenneth Scarberry for his help with the artwork.
References
1. Browne LM, Conn KL, Ayer WA, Tewari JP (1991) The camalexins: new
phytoalexins produced in the leaves of Camelina sativa (Cruciferae). Tetrahedron
47:3909–3914.
2. Jimenez LD, Ayer WA, Tewari JP (1997) Phytoalexins produced in the leaves of
Capsella bursa-pastoris (shepherd’s purse). Phytoprotection 78: 99–103.
3. Tsuji J, Jackson EP, Gage DA, Hammerschmidt R, Somerville SC (1992) Phytoalexin
accumulation in Arabidopsis thaliana during the hypersensitive reaction to
Pseudomonas syringae pv syringae. Plant Physiol 98:1304–1309.
4. Glawischnig E (2007) Camalexin. Phytochemistry 68:401-406.
5. Mezencev R, Galizzi M, Kutschy P, Docampo R (2009) Trypanosoma cruzi:
antiproliferative effect of indole phytoalexins on intracellular amastigotes in vitro.
Exp Parasitol 122:66-69.
6. Moody CJ, Roffey JRA, Stephens MA, Stratford IJ (1997) Synthesis and cytotoxic
activity of indolyl thiazoles. Anti-Cancer Drugs 8:489-499.
7. Beier RC, Nigg HN (2001) Toxicology of naturally occurring chemicals in food. In:
Hui YH, Smith RA, Spoerke DG, Jr (eds) Foodborne Disease Handbook, Volume 3,
Plant Toxicants. Marcel Dekker Inc., New York, 2001, pp. 37-186.
8. Boue SM, Cleveland TE, Carter-Wientjes C, Shih BY, Bhatnagar D, McLachlan JM,
Burow ME (2009) Phytoalexin-enriched functional foods. J Agric Food Chem
57:2614-2622.
9. Ayer WA, Craw PA, Ma Y, Schiang M (1992) Synthesis of camalexin and related
phytoalexins. Tetrahedron 48:2919-2924.

Mezencev et al. J. Nat. Med. 2011; 65(3-4):488-499.
10
10. Schneider U, Schwenk HU, Bornkamm G (1977) Characterization of EBV-genome
negative "null" and "T" cell lines derived from children with acute lymphoblastic
leukemia and leukemic transformed non-Hodgkin lymphoma. Int J Cancer 19:621-
626.
11. Willis JH, Isaya G, Gakh O, Capaldi RA, Marusich MF (2008) Lateral-flow
immunoassay for the frataxin protein in Friedreich's ataxia patients and carriers. Mol
Genet Metab 94:491-497.
12. O’Brien J, Wilson I, Orton T, Pognan F (2000) Investigation of the Alamar Blue
(resazurin) fluorescent dye for the assessment of mammalian cell cytotoxicity. Eur J
Biochem 267:5421-5426.
13. Hickey TE, Majam G, Guerry P (2005) Intracellular survival of Campylobacter jejuni
in human monocytic cells and induction of apoptotic death by cytholethal distending
toxin. Infect Immun 73:5194-5197.
14. Ren YG, Wagner KW, Knee DA, Aza-Blanc P, Nasoff M, Deveraux QL (2004)
Differential regulation of the TRAIL death receptors DR4 and DR5 by the signal
recognition particle. Mol Biol Cell 15:5064–5074.
15. Boesen-de Cock JG, de Vries E, Williams GT, Borst J (1998) The anti-cancer drug
etoposide can induce caspase-8 processing and apoptosis in the absence of CD95
receptor-ligand interaction. Apoptosis 3:17-25.
16. Reutelingsperger CP, van Heerde WL (1997) Annexin V, the regulator of
phosphatidylserine-catalyzed inflammation and coagulation during apoptosis. Cell
Mol Life Sci 53:527-532.
17. Cossarizza A, Baccarani-Contri M, Kalashnikova G, Franceschi C (1993) A new
method for the cytofluorimetric analysis of mitochondrial membrane potential using
the J-aggregate forming lipophilic cation 5,5',6,6'-tetrachloro-1,1',3,3'-
tetraethylbenzimidazol carbocyanine iodide (JC-1). Biochem Biophys Res Commun
197: 40-45.
18. Nunez R (2001) DNA measurement and cell cycle analysis by flow cytometry. Curr
Issues Mol Biol 3:67-70.
19. Fox MH (1980) A model for the computer analysis of synchronous DNA distributions
obtained by flow cytometry. Cytometry 1:71-77.
20. Possel H, Noack H, Augustin W, Keilhoff G, Wolf G (1997). 2,7-
Dihydrodichlorofluorescein diacetate as a fluorescent marker for peroxynitrite
formation. FEBS Letters 416:175-178.
21. Tarpey MM, Wink DA, Grisham MB (2004) Methods for detection of reactive
metabolites of oxygen and nitrogen: in vitro and in vivo considerations. Am J Physiol
Regul Integr Comp Physiol 286:R431-44.
22. Peshavariya HM, Dusting GJ, Selemidis S (2007) Analysis of dihydroethidium
fluorescence for the detection of intracellular and extracellular superoxide produced
by NADPH oxidase. Free Radic Res 41:699-712.
23. Mukhopadhyay P, Rajesh M, Yoshihiro K, Haskó G, Pacher P (2007) Simple
quantitative detection of mitochondrial superoxide production in live cells. Biochem
Biophys Res Commun 358:203-208.

Mezencev et al. J. Nat. Med. 2011; 65(3-4):488-499.
11
24. Mazumdera J, Chakraborty R, Sena S, Vadrab S, Dec B, Ravi TK (2009) Synthesis
and biological evaluation of some novel quinoxalinyl triazole derivatives. Der
Pharma Chemica 2:188-198.
25. Schwerk C, Schulze-Osthoff K (2003) Non-apoptotic functions of caspases in cellular
proliferation and differentiation. Biochem Pharmacol 66:1453-1458.
26. Glawischnig E, Hansen BG, Olsen CE, Halkier BA (2004) Camalexin is synthesized
from indole-3-acetaldoxime, a key branching point between primary and secondary
metabolism in Arabidopsis. PNAS 101:8245-8250.
27. Pedras MSC, Jha M, Okeola OG (2005) Camalexin induces detoxification of the
phytoalexin brassinin in the plant pathogen Leptosphaeria maculans. Phytochemistry
66:2609-2611
28. Thomma BP, Nelissen I, Eggermont K, Broekaert WF (1999) Deficiency in
phytoalexin production causes enhanced susceptibility of Arabidopsis thaliana to the
fungus Alternaria brassicicola. Plant J 19:163–171.
29. Zhao J, Last RL (1996) Coordinate regulation of the tryptophan biosynthetic pathway
and indolic phytoalexin accumulation in Arabidopsis. Plant Cell 8:2235-2244.
30. Ekins S, Bugrim A, Brovold L, Kirillov E, Nikolsky Y, Rakhmatulin E, Sorokina S,
Ryabov A, Serebryiskaya T, Melnikov A, Metz J, Nikolskaya T (2006) Algorithms
for network analysis in systems-ADME/Tox using the MetaCore and MetaDrug
platforms. Xenobiotica 36:877-901.
31. Lemaire C, Andreau K, Souvannavong V, Adam A (1998) Inhibition of caspase
activity induces a switch from apoptosis to necrosis. FEBS Letters 425:266-270.
32. Shao Y, Gao Z, Marks PA, Jiang X (2004) Apoptotic and autophagic cell death
induced by histone deacetylase inhibitors. Proc Natl Acad Sci USA 101:18030-18035.
33. Hamilton TC, Winker MA, Louie KG, Batist G, Behrens BC, Tsuruo T, Grotzinger,
KR, McKoy WM, Young RC, Ozols RF (1985). Augmentation of Adriamycin.
melphalan. and cisplatin cytotoxicity in drug-resistant and sensitive human ovarian
carcinoma cell lines by buthionine sulfoximine mediated glutathione depletion.
Biochem Pharmacol 34: 2583-2586.
34. Reber U, Wüllner U, Trepel M, Baumgart J, Seyfried J, Klockgether T, Dichgans J,
Weller M (1998) Potentiation of treosulfan toxicity by the glutathione-depleting agent
buthionine sulfoximine in human malignant glioma cells: the role of bcl-2. Biochem
Pharmacol 55:349-359.
35. Schneider E, Yamazaki H, Sinha BK, Cowan KH (1995) Buthionine sulphoximine-
mediated sensitisation of etoposide-resistant human breast cancer MCF7 cells
overexpressing the multidrug resistance-associated protein involves increased drug
accumulation. Br J Cancer 71:738–743.
36. Kito M, Akao Y, Ohishi N, Yagi K, Nozawa Y (2002) Arsenic trioxide-induced
apoptosis and its enhancement by buthionine sulfoximine in hepatocellular carcinoma
cell lines. Biochem Biophys Res Commun 291:861-867.
37. Pu YS, Hour TC, Chen J, Huang CY, Guan JY, Lu SH (2002) Arsenic trioxide as a
novel anticancer agent against human transitional carcinoma--characterizing its
apoptotic pathway. Anticancer-Drugs 13:293-300.

Mezencev et al. J. Nat. Med. 2011; 65(3-4):488-499.
12
38. Wang TS, Kuo CF, Jan KY, Huang H (1996) Arsenite induces apoptosis in Chinese
hamster ovary cells by generation of reactive oxygen species. J Cell Physiol 169: 256-
268.
39. Chen YC, Lin-Shiau SY, Lin JK (1998) Involvement of reactive oxygen species and
caspase 3 activation in arsenite-induced apoptosis. J Cell Physiol 177:324-333.
40. Wang Y, Xu Y, Wang H, Xue P, Li X, Li B, Zheng Q, Sun G (2009). Arsenic induces
mitochondria-dependent apoptosis by reactive oxygen species generation rather than
glutathione depletion in Chang human hepatocytes. Arch Toxicol 10: 899-908.
41. Han YH, Moon HJ, You BR, Kim SZ, Kim SH, Park WH (2009) The effect of MAPK
inhibitors on arsenic trioxide-treated Calu-6 lung cells in relation to cell death, ROS
and GSH levels. Anticancer Res 29:3837-3844.
42. Cohen MH, Hirschfeld S, Flamm Honig S, Ibrahim A, Johnson JR, O'Leary JJ, White
RM, Williams GA, Pazdur R (2001) Drug approval summaries: arsenic trioxide,
tamoxifen citrate, anastrazole, paclitaxel, bexarotene. Oncologist 6: 4-11.
43. Sellam A, Dongo A, Guillemette T, Hudhomme P, Simoneau P (2007) Transcriptional
responses to exposure to the brassicaceous defence metabolites camalexin and allyl-
isothiocyanate in the necrotrophic fungus Alternaria brassicicola. Mol Plant Pathol 8:
195-208.
44. Žaludová R, Žákovská A, Kašpárková J, Balcarová Z, Kleinwächter V, Vrána O
(1997) DNA interactions of bifunctional dinuclear platinum(II) antitumor agents. Eur
J Biochem 246:508-517.
45. Manda G, Nechifor MT, Neagu TM (2009) Reactive Oxygen Species, Cancer and
Anti-Cancer Therapies. Curr Chem Biol 3:22-46.
46. Hwang IT, Chung YM, Kim JJ, Chung JS, Kim BS, Kim HJ, Kim JS, Yoo YD (2007)
Drug resistance to 5-FU linked to reactive oxygen species modulator 1. Biochem
Biophys Res Commun 359:304-310.
47. Benhar M, Engelberg D, Levitzki A (2002) ROS, stress-activated kinases and stress
signaling in cancer. EMBO Reports 3:420-425.
48. Hajduk PJ, Bures M, Praestgaard J, Fesik SW (2000) Privileged Molecules for Protein
Binding Identified from NMR-Based Screening. J Med Chem 43:3443-3447.

Mezencev et al. J. Nat. Med. 2011; 65(3-4):488-499.
13
Figure 1 Structural formula of camalexin
Figure 2 Viability of Jurkat (A), human immortalized lymphoblasts (B) and primary human fibroblast
(C) cells treated with different concentrations of camalexin for 72 hours (log c) and expressed as % of solvent-
treated control. Curves fitted by non-linear regression of log-transformed data using a normalized response-
variable slope model. Error bars: standard deviations; N=4.

Mezencev et al. J. Nat. Med. 2011; 65(3-4):488-499.
14
Figure 3 Time dependency of cytotoxic effect of camalexin on Jurkat cells. Viability of cells treated
with 50 M of camalexin for different times is expressed as % of solvent treated control. Error bars: standard errors of means. Statistical significance of differences shown between consecutive timepoints only; ** - p < 0.01
(Tukey-Kramer Multiple Comparisons Test).
Figure 4 Cytotoxic effect of camalexin (CAM) in combination with BSO (A) and Z-VAD-FMK (B) on
Jurkat cells (72-h treatment). Error bars: SEM (N=4).
(A) 1: BSO 50 M; 2: BSO 100 M; 3: CAM 50 M; 4: CAM 50M + BSO 50 M; 5: CAM 50 M + BSO
100 M; significance of differences between 3-4 and 3-5: p<0.01 (**);
(B) 1: Z-VAD-FMK 10 M; 2: Z-VAD-FMK 30 M; 3: CAM 50 M; 4: Z-VAD-FMK 10 M + CAM 50 M;
5: Z-VAD-FMK 30 M + CAM 50 M; significance of differences between 3-4 and 3-5: p<0.01 (**);

Mezencev et al. J. Nat. Med. 2011; 65(3-4):488-499.
15
Figure 5 Determination of caspase 8, caspase 9, and caspase 3/7 in Jurkat cells treated with camalexin
at 100 M for 72 hours, ETO at 25 M for 6 hours, STA at 10 M for 6 hours, or solvent control for 72 hours. (A) Visualization of luminescent signal for individual wells (B) Quantification of intensity of luminescent
signal; PPC[%] – luminescence intensity signal expressed in % of positive control; error bars: SEM (N=4).

Mezencev et al. J. Nat. Med. 2011; 65(3-4):488-499.
16
Figure 6 Determination of apoptosis (via externalization of PS) in Jurkat cells treated with solvent
control (A) or 100 M camalexin (B) for 48 hours. PI and FITC-A signify respective fluorescence intensities. Early apoptotic cells - Q3 (FITC+/PI-); late apoptotic and necrotic cells – Q2 (FITC+/PI+), viable cells – Q4
(FITC-/PI-).
Figure 7 Apoptosis in human primary fibroblast cells treated with 20 M (A) or 200 M (B) camalexin
for 72 hours. Cells were fixed with phosphate buffered formalin and stained with 10 g/mL Hoechst 33342 in H2O. Apoptotic nuclei demonstrate chromatin condensation and fragmentation (white arrows).

Mezencev et al. J. Nat. Med. 2011; 65(3-4):488-499.
17
Figure 8 Mitochondrial membrane potential dissipation upon treatment of Jurkat cells with solvent
control (A) or 100 M camalexin (B) for 8 hours (I), 24 hours (II) and 48 hours (III) detected by FACS using
JC-1 staining. Gated population displays reduced fluorescence of J-aggregates and reduced mitochondrial membrane potential.

Mezencev et al. J. Nat. Med. 2011; 65(3-4):488-499.
18
Figure 9 (A) Deconvolution of DNA content frequency histograms for Jurkat cells treated for 48 hours
with solvent control (left histogram) or 100 μM camalexin (right histogram) by the Dean-Jet-Fox model. (B)
Distribution of Jurkat cells in G0/G1, S and G2/M phases of cell cycle and sub-G1 apoptotic fraction after 48-h
treatment with 100 μM camalexin (black bars) or solvent control (empty bars) determined by flow cytometry
analysis. P[%] – proportion of cells in specific phases of cell cycle. Error bars: SEM (N=3). P-values for the
significance of differences between solvent and camalexin-treated cells for each cell cycle phase: p<0.05 (*);
p<0.01 (**).

Mezencev et al. J. Nat. Med. 2011; 65(3-4):488-499.
19
Figure 10 Detection of ROS using DCFH-DA (I) and DHE (II) in Jurkat cells treated for 6 hrs with 100
M camalexin (solid lines) or solvent control (hatched lines).
Figure 11 Detection of mitochondrial superoxide by MitoSOX staining using fluorescent microscopy (A)
and flow cytometry (B). (A) Cells treated with 100 µM camalexin for 6 hours imaged by fluorescence
microscope using Olympus rhodamine filter (peak excitation 547 nm, emission filter 580 nm long pass),
demonstrate red fluorescence (untreated cells did not display appreciable fluorescence under the same imaging
conditions). (B) Fluorescence of MitoSOX dye upon its oxidation by mitochondrial O2- and binding to DNA
was detected in Jurkat cells treated for 6 hrs with 100 M camalexin (solid lines) or solvent control (hatched lines).
Mezencev et al. J. Nat. Med. 2011; 65(3-4):488-499.
20
Figure 12 Normalized intracellular glutathione levels (NGL) expressed as blank-corrected luminescence
signal from GSH assay normalized to the number of viable cells. Reduced glutathione (grey bars) and total
glutathione (empty bars) were determined in Jurkat cells treated for 12-h with solvent control, 100 μM
camalexin and 25 μM BSO (positive control). P-values for the significance of differences between
corresponding solvent and camalexin treated cells (Tukey-Kramer multiple comparisons test): p>0.05 (ns); for
differences involving BSO-treated cells: p<0.001 (***).
Table 1 Activity scores for 4 different pharmacological mechanisms determined by Molinspiration
Cheminformatics models (http://www.molinspiration.com) for camalexin, known active compounds and a
background set of organic molecules.
Activity score -
camalexin
Mean activity score –
active compounds
Mean activity score –
organic molecules
GPCR ligand -0.33 0.5 -0.5
Kinase inhibitor -0.59 0.6 -0.6
Ion channel
modulator
0.05 0.5 -0.5
Nuclear receptor
ligand
-1.70 0.75 -0.75
Copyright © 2022 FDOKUMEN