
Removal of hydrogen sulfide using red mud at ambient conditions
21
1 Fuel Processing Technology 92 (2011) 1587–1592 doi:10.1016/j.fuproc.2011.04.002 Removal of hydrogen sulfide using red mud at ambient conditions Ramesh Chandra Sahu a , Rajkishore Patel a and Bankim Chandra Ray b a Department of Chemistry, b Department of Metallurgical and Materials Engineering National Institute of Technology, Rourkela 769008, Orissa, India E-mail address: [email protected] Abstract Red mud (RM) is a caustic waste product of alumina industry. A laboratory study was conducted to investigate the removal of hydrogen sulfide (H 2 S) gas using RM at ambient conditions. Red mud was characterized before reaction and after reaction by using XRD, BET, SEM/EDX, TG-DSC, FT-IR, and CHNS. The XRD and EDX data confirmed that the H 2 S was removed in the form of FeS 2 , FeS, CaSO 4 ·2H 2 O, sulfur, sulfide and bisulfide of Na. During the sulfidation reaction, the color of some RM changes from red to black, indicating that iron oxide was converted to iron sulfide. The black color in this case was an indicator of mineral sulfide compounds which indicated that some H 2 S sorption and removal were occurred. The removal capacity of sulfidic filtrate was more as compared to the sulfidic red mud as revealed by thermogravimetric and EDX analysis. Keywords: Red mud; Hydrogen sulfide; Iron oxide; Energy dispersive X-ray
-
Upload
independent -
Category
Documents
-
view
0 -
download
0
Transcript of Removal of hydrogen sulfide using red mud at ambient conditions

1
Fuel Processing Technology 92 (2011) 1587–1592 doi:10.1016/j.fuproc.2011.04.002
Removal of hydrogen sulfide using red mud at ambient conditions Ramesh Chandra Sahu a, Rajkishore Patel a and Bankim Chandra Ray b
a Department of Chemistry, b Department of Metallurgical and Materials Engineering
National Institute of Technology, Rourkela 769008, Orissa, India
E-mail address: [email protected]
Abstract
Red mud (RM) is a caustic waste product of alumina industry. A laboratory study was
conducted to investigate the removal of hydrogen sulfide (H2S) gas using RM at ambient
conditions. Red mud was characterized before reaction and after reaction by using XRD, BET,
SEM/EDX, TG-DSC, FT-IR, and CHNS. The XRD and EDX data confirmed that the H2S was
removed in the form of FeS2, FeS, CaSO4·2H2O, sulfur, sulfide and bisulfide of Na. During the
sulfidation reaction, the color of some RM changes from red to black, indicating that iron oxide
was converted to iron sulfide. The black color in this case was an indicator of mineral sulfide
compounds which indicated that some H2S sorption and removal were occurred. The removal
capacity of sulfidic filtrate was more as compared to the sulfidic red mud as revealed by
thermogravimetric and EDX analysis.
Keywords: Red mud; Hydrogen sulfide; Iron oxide; Energy dispersive X-ray
2
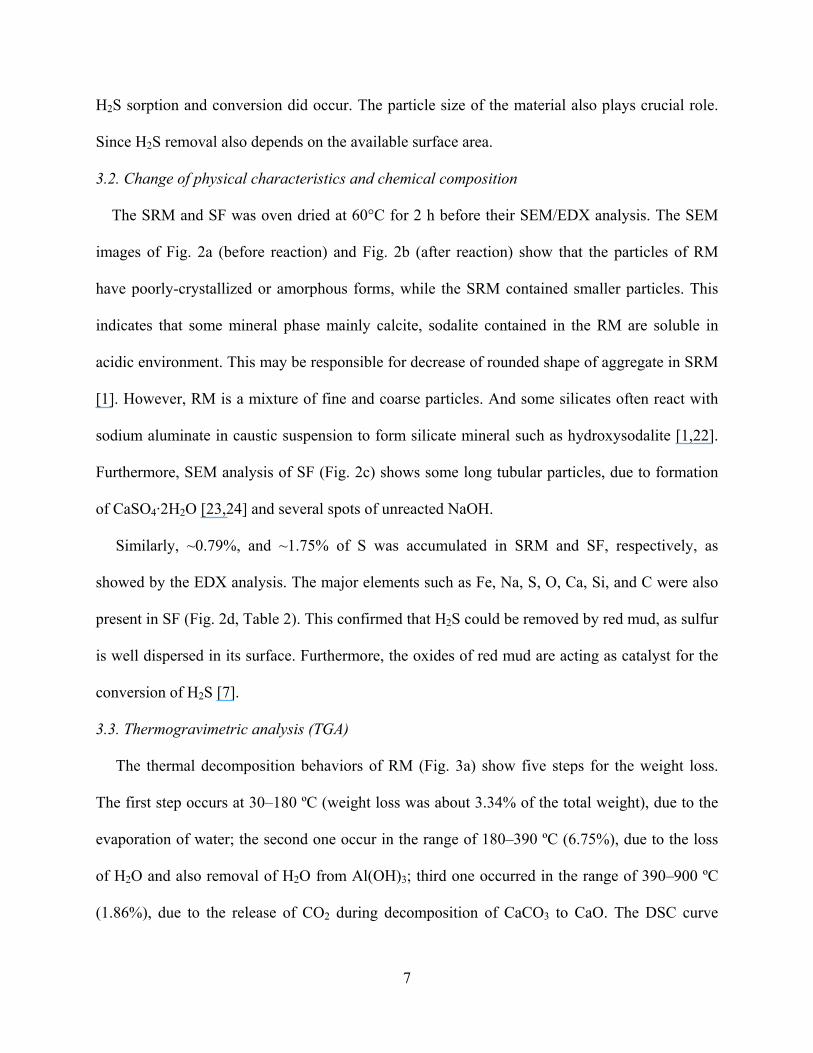
1. Introduction
Red mud is a caustic waste material of bauxite ore processing for alumina extraction. Bayer
process is commonly used for digestion of bauxite ore in a solution of conc. NaOH at a
temperature of 150–230˚C under pressure. During the digestion process, aluminum reacts with
NaOH to form soluble sodium aluminate leaving red mud slurry [1]. Red mud slurry is highly
caustic having pH > 13, due to presence of NaOH and Na2CO3 (1−6%, w/w), these are expressed
in terms of Na2O [2,3]. The main constituents of red mud (% w/w) are: Fe2O3 (30−60%), Al2O3
(10−20%), SiO2 (3−50%), Na2O (2−10%), CaO (2−8%), and TiO2 (trace−10%) [4].
Coal gasification generates large amounts of hydrogen sulfide gas which is responsible for a
serious environmental problem [5,6]. H2S gas is very corrosive, and highly toxic for the living
organisms at relatively high concentration [7]. Furthermore, it is a constituent of sulfate aerosol
which decreases droplet radius in cloud. The increase of aerosol concentration weakens rain fall
and hydrological cycle in polluted cloud [8]. Several commercial techniques are available for the
removal of H2S, including aqueous NaCl [9], iron-based sorbents [10,11], activated carbon [12],
FeOOH [13], Fe2O3, metal oxides [14], sewage sludge [15,16], and aqueous solutions [17].
However, there is always research for the development of effective and low-cost method.
Utilization of industrial wastes as a resource to solve the problem of another wastes provide
economic benefit. Therefore, the removal of H2S using red mud is one of the promising options
for the reduction of industrial air pollution.
Removal of H2S using aqueous RM takes place by the following reactions [7,17–21]:
H2S(aq) + H2O ↔ HS−(aq) + H3O+ (1)

3
H2S(aq) + NaOH(aq) ↔ NaHS(aq) + H2O(l) (2)
H2S(aq) + 2NaOH(aq) ↔ Na2S + 2H2O (3)
Fe2O3 + 2H2S + H2 → 2FeS + 3H2O (4)
[FeS] + H2S → [Fe−S→SH2] → FeS2 + H2 (5)
FeOOH(s) + 3HS–(aq) + 3H–(aq) → FeS (s) + S0(s) + 4H2O (l) (6)
CaCO3(s) + H2S (g) → CaS (s) +H2O (l) + CO2 (g) (7)
CaS(s) + 2CO2(g) +2H2O(l) → CaSO4·2H2O(s) + 2C(s) (8)
The main objective of this study was to investigate the removal of H2S using aqueous red
mud at ambient conditions. In this work, red mud, sulfidic red mud, and sulfidic filtrate were
characterized using the X-ray diffraction, scanning electron microscope, energy dispersive X-
ray, thermogravimetric analysis, differential scanning calorimetric techniques, CHNS, FT-IR,
etc.
2. Materials and methods
2.1. Materials
Red mud used in this study was obtained from R&D Laboratory of NALCO, Damanjodi,
Orissa, India, in the form of dried–clay. Hydrochloric acid (HCl) used in this study was obtained
from Merck and nitric acid (HNO3) from Rankem. The H2S gas (200 ppm) balanced by He gas
was purchased from SKP Corporative Service Rourkela.
2.2. Materials preparation
The RM samples were air–dried, grounded in a mortar and pestle and stored in vacuum
desiccators until used. The red mud suspension was prepared by mixing 5.0 g of red mud with 75

4
mL of distilled water in different plastic bottles of 150 mL to obtain a sufficient volume of
slurry. The suspension was stirred through a magnetic stirrer for 24 h at constant speed ∼5 s–1 for
standard solid–liquid contact.
2.3. Materials characterization
The samples were oven-dried at a temperature of 110 ºC for 2 h before their analyses. The
XRD pattern of the material and mineral composition were determined by using Philips X’Pert
X-ray diffractometer with a Cu Kα radiation source in a 2θ range of 10° to 80º at a scanning rate
of 2º min–1 and was analyzed using standard software provided with the instrument. The surface
micro-morphology of materials was investigated using a scanning electron microscope (SEM)
and element composition was analyzed using energy dispersive X-ray (EDX) by JOEL model
JSM-6480LV (Japan). The pH measurements were made using a calibrated Orion 2 Star Bench
top pH meter and electrical conductivity was measured using CM 138, EC-TDS analyzer. The
pH and electrical conductivity were measured after centrifugation of suspensions (as prepared in
Section 2.2) for 15 min at 3000 rpm and filtration were done using Whatman 42 filter paper. The
parameters were measured by adding distilled water to the red mud at a solid to liquid ratio of
1:2.5 standard methods.
The thermogravimetric analysis and differential scanning calorimetry (TGA/DSC) analysis of
air dried samples were carried out using NETZSCH STA 409C (Germany). In this analysis, 24–
30 mg of sample was used. The sample was heated in an Al2O3 crucible at a heating rate of 10.0
ºC min–1 from 30 to 910 ºC. Sulfur content was determined by using varioELcube CHNS
Elemental Analyzer, Germany. The O2 gas was used as fuel, Helium gas was used as carrier gas
and to provide inert atmosphere. The operating temperature of combustion tube and reduction
tube were 1150 °C and 850 °C, respectively. The BET surface area of the sample was measured

5
at liquid nitrogen temperature using BET surface area analyzer (Quantachrome AUTOSORB–1,
USA). Particle size of the red mud was measured using Master Sizer 33370-45 (Malverns, UK).
The FT-IR spectra of the samples were obtained by using PerkinElmer FT-IR Spectrometer
Spectrum RX-I. The spectrum was scanned from 4000 to 400 cm–1. Samples were
homogeneously crushed with anhydrous KBr in a ratio of 1:50. The powder was pressed at 10
tons cm–2 to make a translucent tablet for recording FT-IR spectra.
2.4. Batch experiments
Batch experiments were carried out at room temperature (25±2 ºC) using suspensions of
different bottles as described in Section 2.2. The H2S gas was passed through a rotameter at a gas
flow rate of 50 mL min–1, subsequently through a micro bubbles stone for 5, 10, 20, 30, 60 min
into the suspensions of different bottles with an inlet and an outlet to vent the pressure. This
experiment is referred as sulfidic reaction.
The suspension was stirred through a magnetic stirrer to increase their solubility at constant
speed of ∼5 s–1 for all the experimental tests reported here. After the reaction the suspension was
centrifuged for 15 min at 3000 rpm and was air dried. It is referred as sulfided red mud (SRM).
The filtrate was filtered through Whatman 42 filter paper and is referred as sulfidic filtrate (SF).
3. Results and discussion
3.1. Change of mineral composition
Particle size of the red mud was in the range of 0.1–160 µm. The BET-N2 surface area, pore
volume, pore diameter of RM were found to be 31.7 m2 g–1, 0.015 cm3 g–1, 18.20 Å,
respectively (Table 1). Fig.1 shows the X-ray diffraction patterns of RM and SRM. From the
XRD peaks of RM the following mineral phases were identified: hematite (α-Fe2O3), goethite
(α-FeO(OH)), gibbsite(γ-Al(OH)3), rutile/anatase (TiO2), calcite (CaCO3), sodalite: zeolite (I)

6
(1.08Na2OAl2O31.68SiO21.8H2O), quartz (SiO2), sodium aluminum silicate (Na(AlSiO4)), and
magnetite (Fe3O4). However, a single weak peak of sodalite (labelled S) was showed by XRD.
This may be due to the presence of less amount of sodalite in RM as compared to the other
dominant crystalline mineral phases [1,3], which depends on the origin of RM. The XRD pattern
of SRM confirmed the formation of iron pyrite (FeS2) and iron sulfide (FeS), as referred from
JCPDS file (42-1340, 76-0961) of X’Pert High Score software. But, most peaks that are assigned
to FeS and FeS2 in SRM seem to correspond almost exactly to peaks assigned to other
components in RM. By using peak broadening technique of X’Pert High Score software of XRD
analysis one can clearly differentiate among these peaks. However, in the compressed form of
the graph (Fig. 1) they seem to be in exact position. FeS is extremely air sensitive and
decomposes readily to FeS2 and α-Fe2O3 even at room temperature. Therefore, no stoichiometric
FeS was clearly detected by XRD [18]. The dominant crystal phase for calcined RM is α-Fe2O3.
Furthermore, when H2S concentration is low, only surface sulfide species will be formed because
bulk sulfide is not thermally stable [19].
During the reaction brownish black precipitate of FeS was formed, due to the reaction between
aqueous S(−II) and Fe(II). However, the rate of pyrite formation is slow relative to the rate of
dissociation of FeS. Thus, FeS acts as continuous source for FeS2 formation Eq. (5). In this
reaction, H2S acts as oxidizing agent with respect to [FeS] [20]. This reaction is possible, due to
the attractive non-covalent interactions and the activation cost of bond rearrangement [21].
However, minimal changes are observed between the parent mineralogical species present in RM
and SRM. Meanwhile, during the sulfidation reaction, the color of RM changes significantly
from red to black, indicating that iron oxides (red) are converted to iron sulfide (black). The
black color in this case is an indicator of mineral sulfide compounds which indicated that some
7
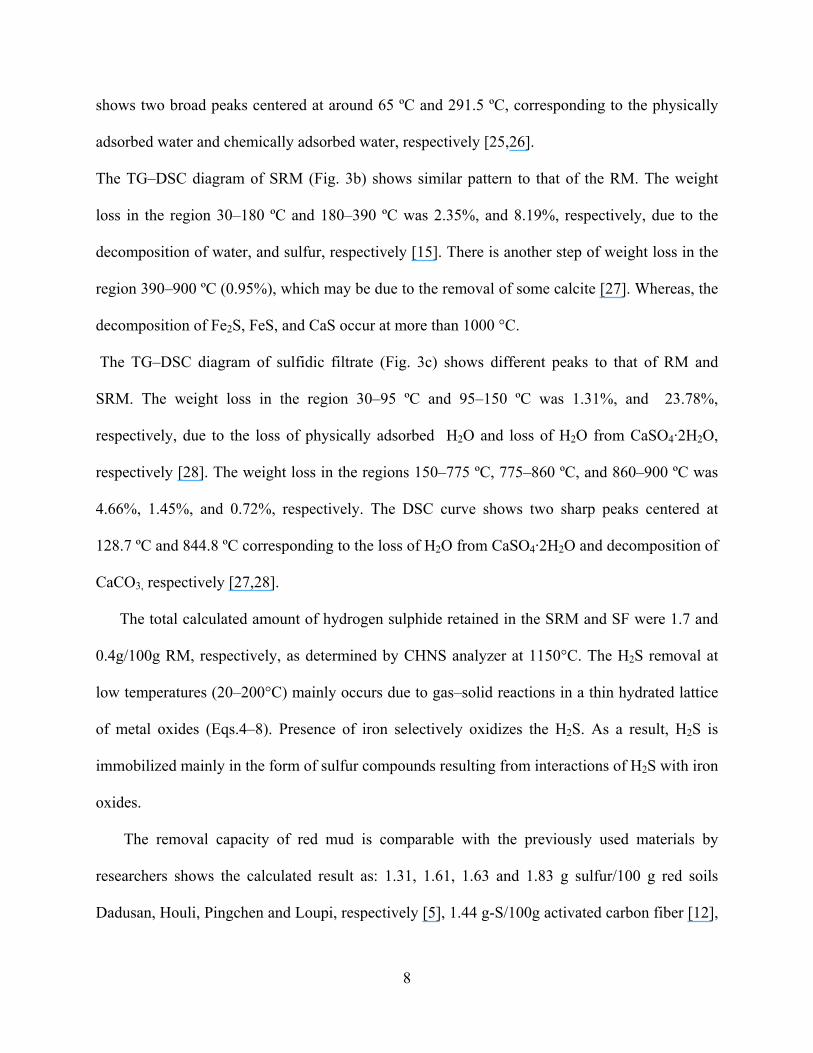
H2S sorption and conversion did occur. The particle size of the material also plays crucial role.
Since H2S removal also depends on the available surface area.
3.2. Change of physical characteristics and chemical composition
The SRM and SF was oven dried at 60°C for 2 h before their SEM/EDX analysis. The SEM
images of Fig. 2a (before reaction) and Fig. 2b (after reaction) show that the particles of RM
have poorly-crystallized or amorphous forms, while the SRM contained smaller particles. This
indicates that some mineral phase mainly calcite, sodalite contained in the RM are soluble in
acidic environment. This may be responsible for decrease of rounded shape of aggregate in SRM
[1]. However, RM is a mixture of fine and coarse particles. And some silicates often react with
sodium aluminate in caustic suspension to form silicate mineral such as hydroxysodalite [1,22].
Furthermore, SEM analysis of SF (Fig. 2c) shows some long tubular particles, due to formation
of CaSO4·2H2O [23,24] and several spots of unreacted NaOH.
Similarly, ~0.79%, and ~1.75% of S was accumulated in SRM and SF, respectively, as
showed by the EDX analysis. The major elements such as Fe, Na, S, O, Ca, Si, and C were also
present in SF (Fig. 2d, Table 2). This confirmed that H2S could be removed by red mud, as sulfur
is well dispersed in its surface. Furthermore, the oxides of red mud are acting as catalyst for the
conversion of H2S [7].
3.3. Thermogravimetric analysis (TGA)
The thermal decomposition behaviors of RM (Fig. 3a) show five steps for the weight loss.
The first step occurs at 30–180 ºC (weight loss was about 3.34% of the total weight), due to the
evaporation of water; the second one occur in the range of 180–390 ºC (6.75%), due to the loss
of H2O and also removal of H2O from Al(OH)3; third one occurred in the range of 390–900 ºC
(1.86%), due to the release of CO2 during decomposition of CaCO3 to CaO. The DSC curve
8
shows two broad peaks centered at around 65 ºC and 291.5 ºC, corresponding to the physically
adsorbed water and chemically adsorbed water, respectively [25,26].
The TG–DSC diagram of SRM (Fig. 3b) shows similar pattern to that of the RM. The weight
loss in the region 30–180 ºC and 180–390 ºC was 2.35%, and 8.19%, respectively, due to the
decomposition of water, and sulfur, respectively [15]. There is another step of weight loss in the
region 390–900 ºC (0.95%), which may be due to the removal of some calcite [27]. Whereas, the
decomposition of Fe2S, FeS, and CaS occur at more than 1000 °C.
The TG–DSC diagram of sulfidic filtrate (Fig. 3c) shows different peaks to that of RM and
SRM. The weight loss in the region 30–95 ºC and 95–150 ºC was 1.31%, and 23.78%,
respectively, due to the loss of physically adsorbed H2O and loss of H2O from CaSO4·2H2O,
respectively [28]. The weight loss in the regions 150–775 ºC, 775–860 ºC, and 860–900 ºC was
4.66%, 1.45%, and 0.72%, respectively. The DSC curve shows two sharp peaks centered at
128.7 ºC and 844.8 ºC corresponding to the loss of H2O from CaSO4·2H2O and decomposition of
CaCO3, respectively [27,28].
The total calculated amount of hydrogen sulphide retained in the SRM and SF were 1.7 and
0.4g/100g RM, respectively, as determined by CHNS analyzer at 1150°C. The H2S removal at
low temperatures (20–200°C) mainly occurs due to gas–solid reactions in a thin hydrated lattice
of metal oxides (Eqs.4–8). Presence of iron selectively oxidizes the H2S. As a result, H2S is
immobilized mainly in the form of sulfur compounds resulting from interactions of H2S with iron
oxides.
The removal capacity of red mud is comparable with the previously used materials by
researchers shows the calculated result as: 1.31, 1.61, 1.63 and 1.83 g sulfur/100 g red soils
Dadusan, Houli, Pingchen and Loupi, respectively [5], 1.44 g-S/100g activated carbon fiber [12],

9
456 mg H2S/g sludge-based adsorbent and ~300–330 mg H2S/g activated carbon when mixed
with NaOH [16], whereas this study shows 2.1g H2S/100g RM. The direct comparison with
activated carbon and sludge-based adsorbent is difficult because the mechanism of absorption
differs from adsorption. The removal capacity of H2S depends on reaction conditions and
materials used. Red mud should be used for removal of H2S because it is an industrial waste and
available with free of cost. So this is a low-cost material for removal of H2S.
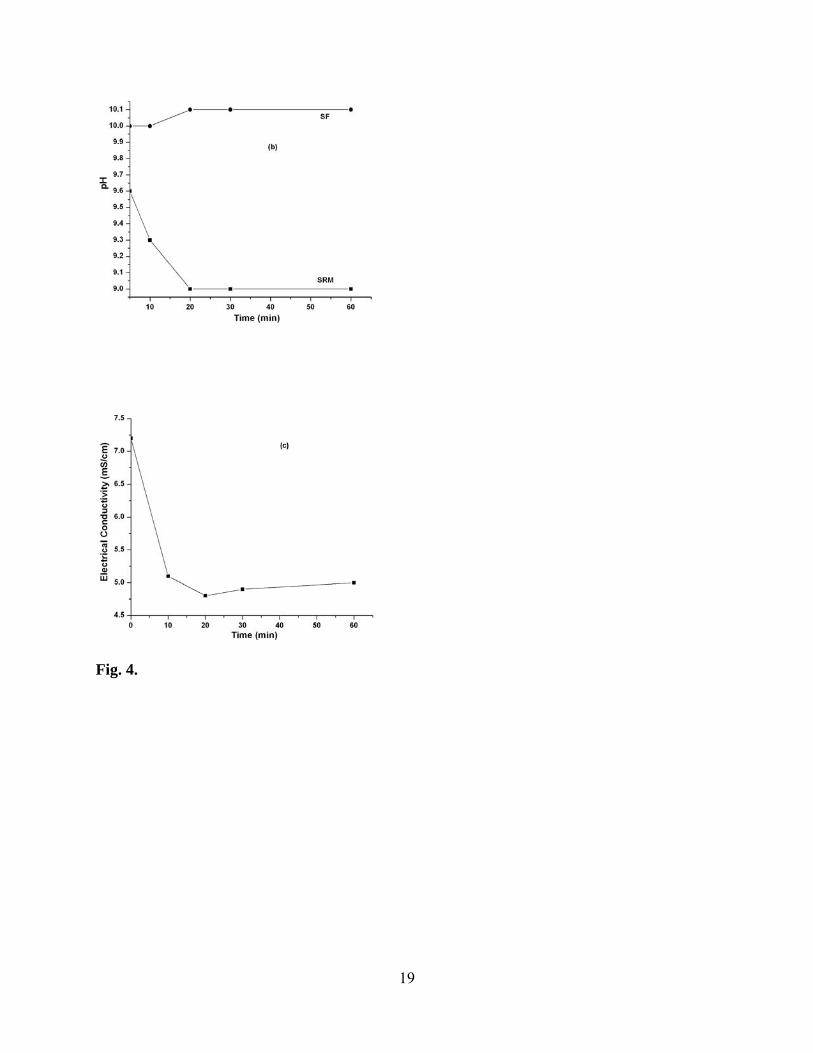
3.4. Variation of pH and electrical conductivity
Fig. 4a and c shows that the rapid decrease of pH of RM suspension from ~11.8 to ~7 is
accompanied by decrease in electrical conductivity from ~7.2 to ~4.8 mS cm–1 for first 20 min
of H2S treatment, after that they slowly increases. Because, the reaction of H2S with H2O and
HO− in aqueous medium is very rapid, due to a permanent dipole moment and water like shape
of H2S, which acidify the RM suspension [15–17], Eqs. (1), (2), and (3). As a result, large
amount of Ca– and Na–hydroxides/oxides were rapidly converted to sulfide and bisulfide
species. Moreover, formation of sodium hydrogen sulphide is preferred over Na2S when less
amount of residual NaOH is available [16,17].
Furthermore, after centrifugation of H2S treated RM suspension at pH ~7, the resultant pH of
SRM was ~9.0. Similarly, pH of SF was ~10.1, due to the presence of large amount of basic
element Na, Ca, Fe, and S (Fig. 4b). The pH of SRM was remained at ~9.0 instead of ~7.0 (Fig.
4a,b). This reversion of pH is due to the formation of FeS2 and presence of unreacted OH– ions,
as Na+ ion is a counter ion for H2S gas to maintain the pH of suspension [20]. Since, silicates are
able to exchange Na+ ions with the suspension [2]. However, all this H2S storage is not stable,
depending on the reaction, produces OH– and causing pH reversion. Also, due to more partial

10
pressure of hydrogen sulfide in situ than atmosphere and desilication reactions of treated RM are
highly responsible.
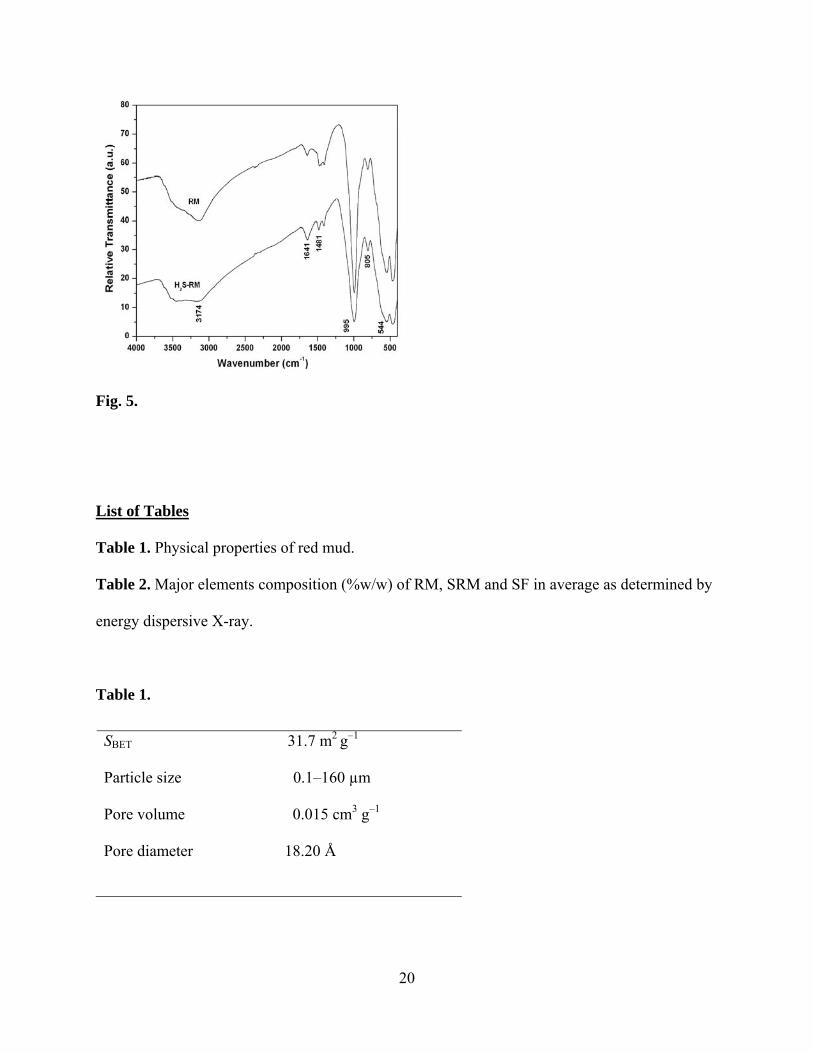
3.5 Spectroscopy studies
Fig.5 shows the FT-IR spectra of H2S-RM and RM. In both the spectra, the positions of the
absorption bands are nearly similar. The relative intensities are more intense in the case of RM.
The FT-IR absorption by RM showed a broad band at ~3140 cm–1 and a weak peak at ~1640 cm–
1 due to the stretching vibrations of O–H bonds and H–O–H bending vibrations of interlayer
adsorbed H2O molecule, respectively. This reveals that by increasing the H2S-RM sample
temperature to 60 °C leads to the disappearance of all of the FT-IR bands due to H2S absorption.
It is also interesting to know that the characteristic S–H stretching vibration at 2562 cm–1,
because this band generally exhibits a very weak IR intensity and can sometimes be missed [29].
The absorption bands at ~1476 and ~1489 cm–1 are due to the stretching vibrations of C=O,
confirmed the presence of carbonate groups. It confirmed that the fresh red mud was absorbed
CO2 from the atmosphere. Characteristic bands correspond to Si–O vibration were detected at
~993 cm–1 and for O–Si–O at ~803 cm–1 proved the presence of silicate groups. Peaks at ~544
and ~466 cm–1 are due to the bending vibration of Si–O–Al and stretching vibrations of Fe–O
bonds respectively [30].
H2S can react with alkaline materials and be removed from the gas phase. As a gas molecule
diffuses through a porous media, gas molecules adsorbed to the surfaces of red mud materials by
physisorption and chemisorptions. Because of their alkaline nature, iron oxide, NaOH, Ca(OH)2
can react with H2S and subsequently converted to sulfide minerals through reactions Eqs. (1–6).
Alkaline fine red mud has greater capabilities in conversion of H2S as compared to the clay and

11
sandy soils [31]. In liquid phases, absorption of H2S is more by NaOH as compared to FeOOH,
Fe2O3 [32,33], through dissolution and precipitation [34].
4. Conclusions
In this preliminary study, H2S gas was removed by using aqueous red mud at ambient
conditions. The XRD, EDX analysis results showed that the hydrogen sulfide was removed in
the form of FeS2, FeS, S, and sulfide minerals. During the sulfidation reaction, RM changes from
red to black, indicating that some iron oxide was converted to iron sulfide. Furthermore, the red
mud used here is produced as a by-product in the alumina industry and currently have no
economic value. They could be used directly, therefore no additional manufacturing cost. Hence,
the waste red mud can be used for the removal of air pollutant H2S from industrial emission.
Acknowledgements
The authors would like to thank CSIR and MHRD, New Delhi, India for financial support.
The authors also thank NIT, Rourkela for providing necessary facilities.
References
[1] T. Newson, T. Dyer, C. Adam, S. Sharp, Effect of structure on the geotechnical properties
of bauxite residue, J. Geotech. Eng. 132(2) (2006) 143–151.
[2] E. Fois, A. Lallai, G. Mura, Sulfur dioxide absorption in a bubbling reactor with
suspensions of Bayer red mud, Ind. Eng. Chem. Res. 46 (2007) 6770–6776.
[3] R.C. Sahu, R.K. Patel, B.C. Ray, Neutralization of red mud using CO2 sequestration cycle, J.
Hazard.Mater. 179 (2010) 28–34.
[4] A. Collazo, M.J. Cristobal, X. R. Novoa, G. Pena, M. C. Perez, Electrochemical impedance
spectroscopy as a tool for studying steel corrosion inhibition in simulated concrete
environments-red mud used as rebar corrosion, J. ASTM. Int. 3(2) (2006) 1–10.

12
[5] T-H. Ko, H. Chu, H-P. Lin, C-Y. Peng, Red soil as a regenerable sorbent for high
temperature removal of hydrogen sulfide from coal gas, J. Hazard. Mater. B136 (2006) 776–783.
[6] J.B. Chung, J.S. Chung, Desulfurization of H2S using cobalt-containing sorbents at low
temperatures, Chem. Eng. Sci. 60 (2005) 1515–1523.
[7] M.A. Shields, N.I. Dowling, P.D. Clark, Catalytic H2S conversion and SO2 production over
iron oxide and iron oxide/γ-Al2O3 in liquid sulfur, Ind. Eng. Chem. Res. 46 (2007)7721–7728.
[8] V. Ramanathan, P.J. Crutzen, J.T. Kiehl, D. Rosenfeld, Aerosols, climate, and the
hydrological cycle, Science. 294 (2001) 2119.
[9] Z. Duan, R. Sun, R. Liu, C. Zhu, Accurate thermodynamic model for the calculations of H2S
solubility in pure water and brines, Energy & Fuels. 21 (2007) 2056–2065.
[10] W. Xie, L. Chang, D. Wang, K. Xie, T. Wall, J. Yu, Removal of sulfur at high temperatures
using iron-based sorbents supported on fine coal ash, Fuel 89 (2010) 868–873.
[11] N.N. Nassar, M.M. Husein, P. Pereira-Almao, Ultrasispersed particles in heavy oil: Part II,
sorption of H2S(g), Fuel Pro. Tech. 91 (2010) 169-174.
[12] J.J. Choi, Oxidative removal of malodorous volatile sulfur compounds by air over a
activated carbon fiber, J. Ind. Eng. Chem. 3 (1997) 56–62.
[13] S. Peiffer, W. Gade, Reactivity of ferric oxide toward H2S at low pH, Environ. Sci. Technol.
41 (2007) 3159–3164.
[14] X.M. Meng, W.D. Jong, AH.M. Verkooijen, Thermodynamic analysis and kinetics model of
H2S sorption using different sorbents, Env. Prog. & Sus. Ener. 28 (2009) 360–371.
[15] A. Bagreev, S. Bashkova, D.C. Locke, T.J. Bandosz, Sewage sludge-derived materials as
efficient adsorbents for removal of hydrogen sulfide, Environ. Sci. Technol. 35 (2001)1537–
1543.

13
[16] A. Ros, M.A. Lillo-Rodens, C. Canals-Batlle, E.Fuente, M.A. Montes-Moran, M.J. Martin,
A. Linares-Solano, A new generation of sludge-based adsorbents for H2S abatement at room
temperature, Environ. Sci. Technol. 41 (2007) 4375–4381.
[17] J. Boniface, Q. Shi, Y.Q. Li, J.L. Cheung, O.V. Rattigan, P. Davidovits, Utake of gas- phase
SO2, H2S, and CO2 by aqueous solutions, J. Phys. Chem. A 104 (2000) 7502–7510.
[18] L. Zhang, J-M. M. Millet, U.S. Ozkan, Deactivation characteristics of Fe–Al–Cu water–gas
shift catalysts in the presence of H2S, J. Mol. Catal. A: Chem. 309 (2009) 63–70.
[19] Z. Cheng, M. Liu, Characterization of sulfur poisoning of Ni–YSZ anodes for solid oxide
fuel cells using in situ Raman microscopy, Solid State Ionics 178 (2007) 925–935.
[20] D. Rickard, G.W. Luther, Chemistry of iron sulfides, Chem. Rev. 107 (2007) 514–562.
[21] B.A. Ellingson, D.G. Truhlar, Explanation of unusual temperature dependence of the
atmospherically important OH + H2S → H2O + HS reaction and prediction of rate
constant at combustion temperatures, J. Am. Chem. Soc. 129 (2007) 12765–12771.
[22] S.J. Palmer, R.L. Frost, T. Nguyen, Hydrotalcites and their role in coordination of anions in
Bayer liquors: anion binding in layered double hydroxides, Coordi. Chem. Rev. 253 (2009) 250–
267.
[23] J. Li, G. Li, Y. Yu, The influence of gypsum water-proofing additive on gypsum crystal
growth, Materials Letters. 61 (2007) 872–876.
[24] N.R. Mbhele, W.V.D. Merwe, J.P.Maree, D. Theron, Recovery of sulphur from waste
gypsum, International Mine Water Conference, (2009) 622-630.
[25] Y.N. Zhang, Z.H. Pan, Characterization of red mud thermally treated at different
temperature, J. Jinan University (Sci & Tech.) 19 (4) (2005) 293–297.
14
[26] R.C. Sahu, R.K. Patel, B.C. Ray, Adsorption of Zn(II) on activated red mud: Neutralized by
CO2, Desalination. 266 (2011) 93–97.
[27] R. Bassilakis, Y. Zhao, P.R. Solomon, M.A. Serio, Sulfur and nitrogen evolution in the
Argonne coals: experimental and modeling, Energy & Fuel. 7 (1993) 710–720.
[28] C.G. Julia, C.P. Bonafe, The use of natural earths in picture: study and differentiation by
thermal analysis, Thermochimica Acta 413 (2004) 185–192.
[29] H.Y. Huang, R.T. Yang, Amine-grafted MCM-48 and silica xerogel as superior sorbents for
acidic gas removal from natural gas, Ind. Eng. Chem. Res. 42 (2003) 2427–2433.
[30] R.C. Sahu, R.K. Patel, B.C.Ray, Utilization of activated CO2–neutralized red mud for
removal of arsenate from aqueous solutions, J. Hazard. Mater. 179 (2010) 1007–1013.
[31] C. Plaza, Q. Xu, T. Townsend, G. Bitton, M. Booth, Evaluation of alternative landfill over
soils for attenuating hydrogen sulfide from construction and demolition (C&D) debris landfills,
J. Env. Mang. 84 (2007) 314–322.
[32] M.M. Husein, L. Patruyo, P. Pereira-Almao, N.N. Nassar, Scavenging H2S(g) from oil
phases by means of ultradispersed sorbents J. Colloid Interface Sci. 342 (2010) 253–260.
[33] T.K. Tseng, H.C. Chang, H. Chu, H.T. Chen, Hydrogen sulfide removal from coal gas by
the metal-ferrite sorbents made from the heavy metal wastewater sludge, J. Hazard. Mater. 160
(2008) 482–488.
[34] K-D. Jung, O-S. Joo, S-H. Cho, S-H. Han, Catalytic wet oxidation of H2S to sulfur on
Fe/MgO catalyst, Appl. Catal. A: Gen. 240 (2003) 235–241.

15
List of Figures
Fig. 1. Variation of powder XRD patterns of RM and SRM.
Fig. 2. Variation of SEM images of (a) RM, (b) SRM, and (c) SEM image of dried SF; (d) EDX
analysis spectrum of SF.
Fig.3. TG-DSC diagrams showing weight loss of: (a) RM, (b) SRM, and (c) SF in the
temperature range of 30–910ºC.
Fig. 4. (a) Variation of pH of RM suspension after reaction with H2S, (b) variation of pH of
SRM and SF, (c) variation of electrical conductivity of RM suspension after reaction with H2S.
Fig. 5. FT-IR spectra of H2S-RM and RM.
Fig. 1.

16

17
Fig. 2.

18
Fig.3.
19
Fig. 4.
20
Fig. 5.
List of Tables
Table 1. Physical properties of red mud.
Table 2. Major elements composition (%w/w) of RM, SRM and SF in average as determined by
energy dispersive X-ray.
Table 1.
SBET 31.7 m2 g–1
Particle size 0.1–160 µm
Pore volume 0.015 cm3 g–1
Pore diameter 18.20 Å

21
Table 2.
Major elements RM SRM SF
C 1.97 1.03 18.38
O 31.86 35.81 59.55
Na 4.30 0.95 14.32
Al 5.86 4.27 ---
Si 3.83 1.08 1.00
Ca 0.74 --- 3.75
Ti 1.82 0.75 ---
Fe 47.62 53.01 1.25
Zr 2.00 2.31 ---
S --- 0.79 1.75
Total 100.00 100.00 100.00