Expression of T cell receptor genes in an antigen-specific hybridoma and radiation-induced variants
Upload
khangminh22Category
view
2download
0
Universidad Autónoma de Madrid
Faculty of Sciences
Department of Molecular Biology
Relevance of antigen presentation by T cells on T cell
differentiation
Doctoral Thesis Viola Lucrezia Boccasavia
Madrid
2018

Doctoral Thesis
Relevance of antigen presentation by T cells on T cell differentiation
This thesis is submitted by Viola Lucrezia Boccasavia in fulfillment of the
requirements for the degree of Doctor in Molecular Biology
Thesis director: Dr. Balbino Alarcón Sánchez
Research professor in Consejo Superior de Investigaciones Científicas
Centro de Biología Molecular Severo Ochoa
Universidad Autónoma de Madrid

The research leading to these results has received funding from the People
Programme (Marie Curie Actions) of the European Union's Seventh Framework
Programme FP7/2007-2013/ under REA grant agreement n°317057 and it was
entirely performed under the direction of Balbino Alarcón at the Centro de
Biología Molecular Severo Ochoa (CSIS-UAM).

1
1
Acknowledgement
2
2
List of the abbreviations
Ags Antigens
APC Antigen presenting cell
ACK Erythrocyte lysis buffer
Bcl6 B cell lymphoma 6 protein
BM Bone Marrow
BSA Bovine Serum Albumin
CCR6 Chemokine receptor type 6
CD Cluster of differentiation
cSMAC Central supramolecular activation clusters
DC Dendritic cell
DMEM Dulbecco's Modified Eagle's Medium
dSMAC Distal supramolecular activation clusters
EDTA Ethylene Diamine Tetra-acetic Acid
FBS Fetal Bovine Serum
FcγR Fragment crystalizable region
FITC Fluorescein isothiocyanate
Foxp3 Forkhead box protein O
GDP Guanosine diphosphate
GFP Green fluorescent protein
GM-CSF Granulocyte macrophage colony-stimulating factor
GTP Guanosine triphosphate
IFN Interferon
IL Interleukin
JAK Janus tyrosine kinase
KDa kilodalton
Lamp1 Lysosome-associated membrane protein 1
LNSC Lymph node stromal cells
MCC Moth cytochrome c 88-103 peptide
MHC Major histocompatibility complex
NK Natural Killer
OVA Ovalbumin peptide
PBS Phosphate-buffered solution
PD-1 Programmed Death-1
PE Phycoerythrin

3
3
PMA Phorbol myristate acetate
pSMAC Peripheral supramolecular activation clusters
RAR Retinoic Acid Receptors
RORγt Retinoic acid-related orphan receptor gamma t
RPMI Roswell Park Memorial Institute medium
RT Room Temperature
RT-q PCR Real time quantitative polymerase chain reaction
STAT Signal transducers and activators of a transcription
T-Box21 T cell specific T-Box transcription factor T-Bet
TCR T cell receptor
Tfh T follicular helper cell
TGFβ Transforming growth factor beta
Th cells T helper cells
TNFα Tumour necrosis factor alpha
Treg Regulatory T cells
WT Wild type

5
5
Table of contents
Acknowledgement ............................................................................................ 1
List of the abbreviations .................................................................................... 2
LIST OF FIGURES ............................................ ¡Error! Marcador no definido.
LIST OF TABLES .............................................. ¡Error! Marcador no definido.
ABSTRACT ..................................................................................................... 12
PRESENTACIÓN ............................................................................................ 13
INTRODUCTION ............................................................................................. 15
1. The immune cell network at a glance ................................................. 16
2. T cell immune response ..................................................................... 17
2.1 The innate and adaptive immune system ........................................ 17
3. Main characters of the adaptive immune response ............................ 18
3.1 APCs: Dendritic cells ...................................................................... 18
3.2 T lymphocytes ................................................................................ 19
3.3 CD4+ T cells.................................................................................... 20
3.4 CD8+ T cells.................................................................................... 20
4. The Immunological Synapse .............................................................. 21
4.1 Architecture of the Immunological Synapse ........................................ 22
4.2 Localization of a APC-T cell interaction .............................................. 24
5. The mechanisms of antigen uptake .................................................... 24
6. Trogocytosis: phenomenology............................................................ 26
7. CD4+ T cell differentiation .................................................................. 28
i. Th1 cells ............................................................................................ 30
ii. Th2 cells ............................................................................................ 31
iii. Th17 cells ...................................................................................... 32
iv. Treg cells ....................................................................................... 33
v. T follicular helper (Tfh) ....................................................................... 34
6
6
8. Ras superfamily ................................................................................. 34
1. Rho family ...................................................................................... 36
RhoG ....................................................................................................... 36
MATERIALS AND METHODS ......................................................................... 39
1. Materials ............................................................................................ 40
1.1 Cell lines ......................................................................................... 40
1.2 Mice ................................................................................................ 41
1.3 Animal Handling ............................................................................. 42
1.4 Mouse peripheral blood collection for genotyping ........................... 42
1.5 Reagents ........................................................................................ 42
1.6 Antibodies and fluorescent probes .................................................. 45
2. Methods ............................................................................................. 49
2.1 Isolation and purification of mouse T cells ...................................... 49
2.2 Cell transfection .............................................................................. 51
Lipofectamine System (Lipofectamine TM and PLUS TM Reagent) ............. 51
2.3 Genomic DNA extraction for genotyping ......................................... 52
2.4 Cell labelling ................................................................................... 52
2.5 Functional assays ........................................................................... 52
a) T cell – T cell co-cultures ............................................................... 53
b) Bone marrow chimera ..................................................................... 53
c) Experimental autoimmune encephalomyelitis ..................................... 53
d) MVA-OVA Virus ................................................................................... 54
2.6 Flow Cytometry ............................................................................... 54
2.6.1 Intracellular Cytokine Staining ....................................................... 55
2.6.2 Interleukin measurement ............................................................... 55
2.6.3 Proliferation assay ......................................................................... 55
3. Microscopy ..................................................................................... 56
3.1 Fluorescence Confocal microscopy ................................................ 56
3.2 Acquisition ...................................................................................... 57
7
7
3.3 High-resolution light microscopy ELYRA: SIM-Superresolution
structured illumination .......................................................................................... 57
3.4 Imagestream X Mark II Imaging Flow Cytometer ............................ 57
3.5 Measurement of mRNA levels and Real-time q-PCR ...................... 58
4. Electron microscopy ....................................................................... 59
4.1 Pre-embedding Immunoelectron Microscopy IEM of T cells ........... 59
5. Statistical Analysis .......................................................................... 60
OBJECTIVES .................................................................................................. 61
RESULTS ....................................................................................................... 64
Part 1 .............................................................................................................. 65
T cells acquire MHC- I/II and co-stimulatory molecules by Trogocytosis. ......... 66
1.1 TC21 and RhoG mediate Trogocytosis .............................................. 66
1.2 Expression of acquired pMHC on the T cell plasma membrane using
AND and OT2 mouse models. ................................................................................. 67
1.3 Trogocytosis affected by inhibitors of cytoskeleton. ............................ 69
1.4 Expression of acquired pMHC- peptide OVA on the T cell’s plasma
membrane. 70
1.5 Acquisition of co-stimulatory molecule. ............................................... 71
1.6 Acquisition of pMHC revealed by Confocal Microscopy and Electron
Microscopy 73
1.7 MHC-II acquisition by trogocytosis also occurs in vivo. ...................... 77
1.8 T cell proliferation in response to cognate Antigen presentation by T
cells. 78
1.9 T cells take up and present bystander antigens. ................................ 80
Part 2 .............................................................................................................. 84
T-T cell antigen presentation exerts a role in Th differentiation. ....................... 85
2.1 Presenting and Responding T cells show a different profile in vitro. ....... 85
2.2 Presenting and Responding T cells show a different effector profile also in
vivo. ........................................................................................................................ 90
2.3 Characterization of Presenting and Responding T cells: how and when they
differentiate. ............................................................................................................ 91
8
8
2.4 Presenting and Responding in comparison between T-APC and T-APC+ T
naïve. ...................................................................................................................... 94
2.5 Transcriptional landscape of Presenting and Responding T cells. .......... 96
Part 3 ............................................................................................................ 101
Role of T-T antigen presentation in vivo. ....................................................... 102
3.1 Rhog -/- mice are more susceptible to low doses of a pathogen. ....... 102
3.2 Rhog -/- mice develop a less severe disease in the EAE model. ....... 103
3.3 T cell polarization is influenced by the abundance of professional antigen
presenting cells. .................................................................................................... 108
3.4 Relevance of a T-T cell presentation on the response to different doses
of a pathogen such as MVA-OVA .......................................................................... 112
3.5 T-T interactions in vivo ..................................................................... 114
DISCUSSION ................................................................................................ 119
CONCLUSIONS ............................................................................................ 133
REFERENCES .............................................................................................. 139
9
9
List of figures
Figure 1. Acquisition of MHC-II by TCR transgenic AND and OT2 T cells……….. 68
Figure 2. Acquisition of I-Ek MHC-II by TCR transgenic AND T cell by confocal
microscopy ................................................................................................................................ 69
Figure 3. Acquisition of I-Ek MHC-II from DCs to T cells is actin cytoskeleton and Src
signalling dependent.. .............................................................................................................. 70
Figure 4. Acquisition of H-2kb (MHC-I)/OVA peptide by TCR transgenic OT1 T cells.. .... 71
Figure 6. Acquisition of I-Ek MHC-II co-localize with Lamp1 and CD63 ............................... 74
Figure 7. Acquisition of I-Ek MHC-II and CD80 by ELYRA super-resolution. ...................... 74
Figure 8. Acquisition of I-Ek MHC-II by using ImageStream X Mark II Imaging Flow
Cytometer. .................................................................................................................................. 75
Figure 9. Acquisition of I-Ek MHC-II by representative transmission electron micrographs
(TEM).. ......................................................................................................................................... 76
Figure 10. Acquisition of I-Ek MHC-II in vivo. A. ................................................................... 77
Figure. 11. T cells stimulated by DC cells express activation markers. ............................. 79
Figure 12. Proliferation assay. ................................................................................................. 80
Figure 13. Proliferation assay. A.............................................................................................. 81
Figure. 14. Acquisition of I-Ek MHC-II and I-Ab MHC-II by confocal microscopy.. ............. 81
Fig.15. Proliferation Assay with Cell Trace staining. ............................................................. 82
. .................................................................................................................................................... 83
Fig.17. Differentiation in vitro at day 6. A. .............................................................................. 86
Figure 18. Differentiation in vitro at days 3 of co-culture. A. ................................................ 89
Figure 19. Differentiation in vivo.............................................................................................. 90
Figure 20. Differentiation in vitro at earlier time points: CCR6 and CD25 markers. ........... 92
Figure 21. Differentiation in vitro at earlier time points: CD69, CD44, CD25 and PD-1.. .... 93
Figure 22. CBA Assay. .............................................................................................................. 94
Figure 23. Comparison between T-APCs (Pres) and Pres+Resp. ........................................ 95
Figure 24. Microarray analysis.. ............................................................................................... 97
Figure 25. Different mRNA expression between Presenting and Responding:. ................. 99
Fig.26.Conclusive Model of the 2nd part. ............................................................................... 100
Figure 27: Preliminary experiment in vivo with L. monocytogenes. .................................. 102
Figure 29. EAE model in reconstituted mice. A.. ................................................................. 106
Figure 30. EAE model: analysis of extracellular markers in secondary lymphoid organs
................................................................................................................................................... 107
Figure 31. Model of RhoG defect.. ......................................................................................... 108
Figure 32. CD4+ T cell differentiation relies on the number of DCs present in the culture.
................................................................................................................................................... 109

10
10
Figure 33. CD4+ T cell differentiation relies on the number of DCs injected in vivo. A.. 111
Figure 34. CD4+ T cell differentiation relies on the number of viral particles administrated
in vivo. ...................................................................................................................................... 113
Figure 35. T-T interactions in vivo.. ....................................................................................... 116
Figure 36. Analysis of intracellular markers. ........................................................................ 117
Figure 37. Model of the 3rd part. ............................................................................................ 118
11
11
List of Tables
Table 1. List of media: provides an exhaustive list of all media used in this study for culture
and maintenance of cell lines and primary cells. ......................................................................... 40
Table 2. Oligonucleotides. Oligonucleotide sequences for mice genotyping. .......................... 42
Table 3. Reagents, sources and application .......................................................................... 43
Table 4. List of buffers. ............................................................................................................. 44
Table 5: List of antibodies used in this thesis. FC: Flow Cytometry IF: Immunofluorescence. 45
Table 6: List of antibodies used in this thesis. FC: Flow Cytometry IF: Immunofluorescence. 49
Table 7. List of primers used for qRT-PCR ............................................................................. 59
12
12
ABSTRACT
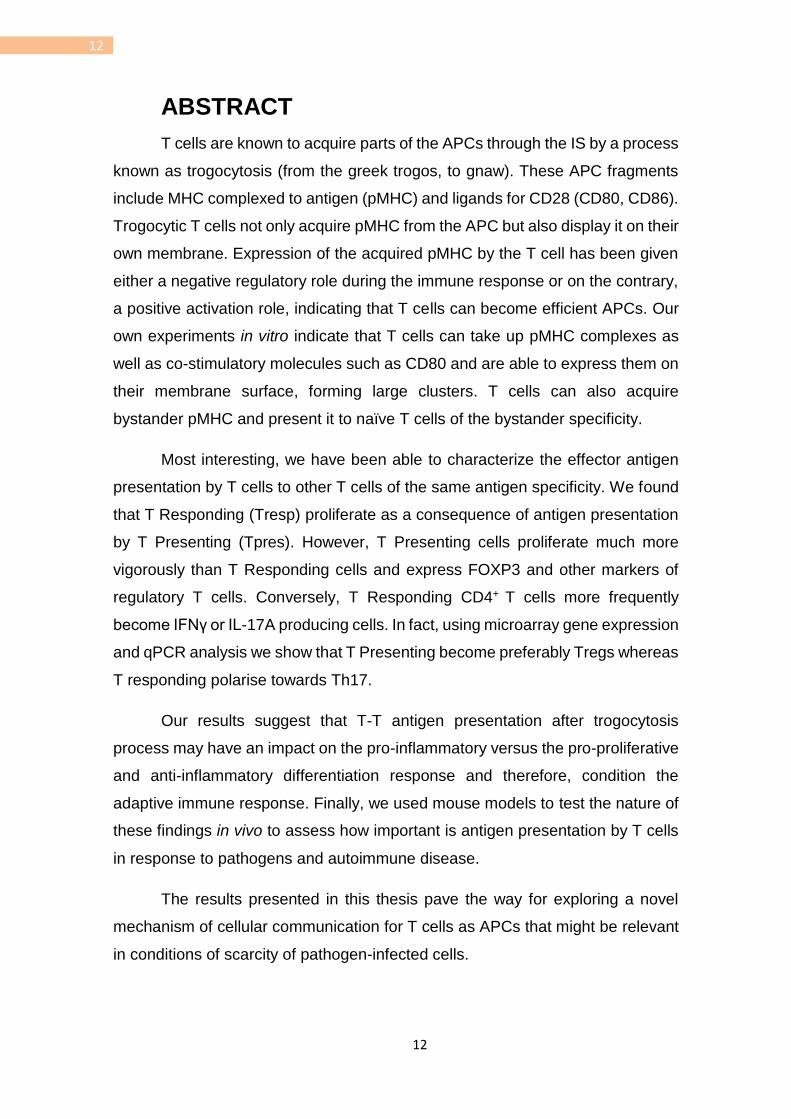
T cells are known to acquire parts of the APCs through the IS by a process
known as trogocytosis (from the greek trogos, to gnaw). These APC fragments
include MHC complexed to antigen (pMHC) and ligands for CD28 (CD80, CD86).
Trogocytic T cells not only acquire pMHC from the APC but also display it on their
own membrane. Expression of the acquired pMHC by the T cell has been given
either a negative regulatory role during the immune response or on the contrary,
a positive activation role, indicating that T cells can become efficient APCs. Our
own experiments in vitro indicate that T cells can take up pMHC complexes as
well as co-stimulatory molecules such as CD80 and are able to express them on
their membrane surface, forming large clusters. T cells can also acquire
bystander pMHC and present it to naïve T cells of the bystander specificity.
Most interesting, we have been able to characterize the effector antigen
presentation by T cells to other T cells of the same antigen specificity. We found
that T Responding (Tresp) proliferate as a consequence of antigen presentation
by T Presenting (Tpres). However, T Presenting cells proliferate much more
vigorously than T Responding cells and express FOXP3 and other markers of
regulatory T cells. Conversely, T Responding CD4+ T cells more frequently
become IFNγ or IL-17A producing cells. In fact, using microarray gene expression
and qPCR analysis we show that T Presenting become preferably Tregs whereas
T responding polarise towards Th17.
Our results suggest that T-T antigen presentation after trogocytosis
process may have an impact on the pro-inflammatory versus the pro-proliferative
and anti-inflammatory differentiation response and therefore, condition the
adaptive immune response. Finally, we used mouse models to test the nature of
these findings in vivo to assess how important is antigen presentation by T cells
in response to pathogens and autoimmune disease.
The results presented in this thesis pave the way for exploring a novel
mechanism of cellular communication for T cells as APCs that might be relevant
in conditions of scarcity of pathogen-infected cells.
13
13
PRESENTACIÓN
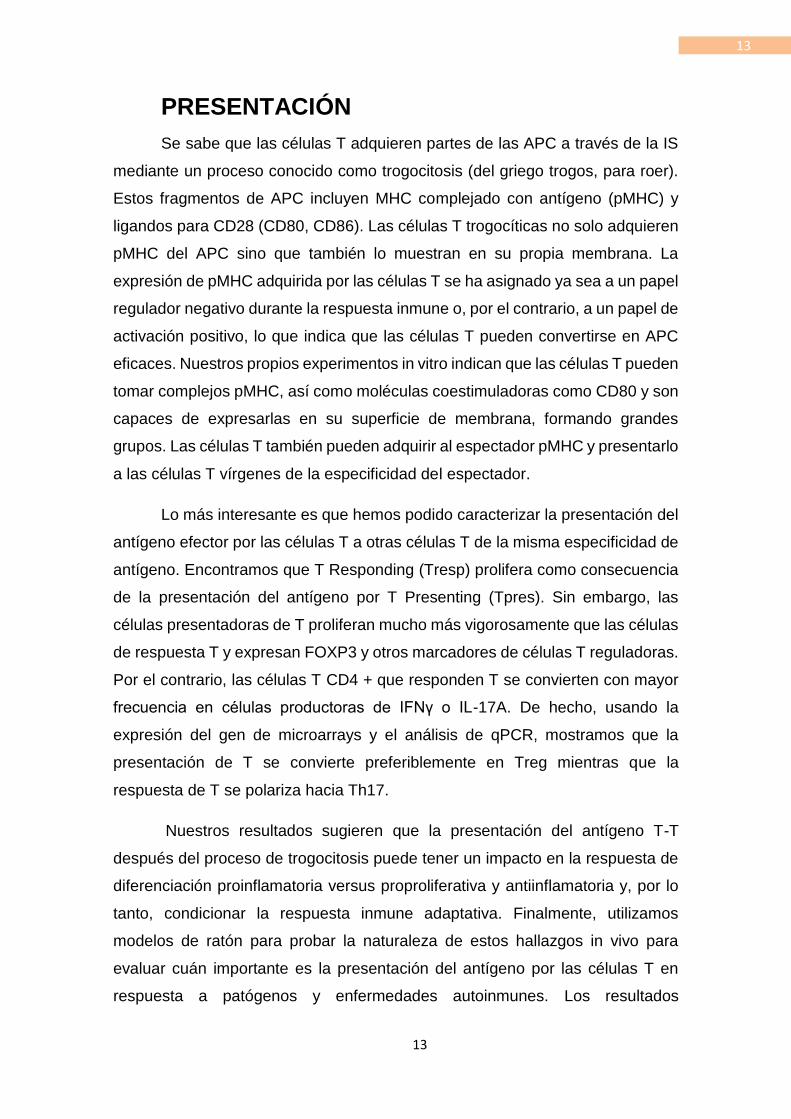
Se sabe que las células T adquieren partes de las APC a través de la IS
mediante un proceso conocido como trogocitosis (del griego trogos, para roer).
Estos fragmentos de APC incluyen MHC complejado con antígeno (pMHC) y
ligandos para CD28 (CD80, CD86). Las células T trogocíticas no solo adquieren
pMHC del APC sino que también lo muestran en su propia membrana. La
expresión de pMHC adquirida por las células T se ha asignado ya sea a un papel
regulador negativo durante la respuesta inmune o, por el contrario, a un papel de
activación positivo, lo que indica que las células T pueden convertirse en APC
eficaces. Nuestros propios experimentos in vitro indican que las células T pueden
tomar complejos pMHC, así como moléculas coestimuladoras como CD80 y son
capaces de expresarlas en su superficie de membrana, formando grandes
grupos. Las células T también pueden adquirir al espectador pMHC y presentarlo
a las células T vírgenes de la especificidad del espectador.
Lo más interesante es que hemos podido caracterizar la presentación del
antígeno efector por las células T a otras células T de la misma especificidad de
antígeno. Encontramos que T Responding (Tresp) prolifera como consecuencia
de la presentación del antígeno por T Presenting (Tpres). Sin embargo, las
células presentadoras de T proliferan mucho más vigorosamente que las células
de respuesta T y expresan FOXP3 y otros marcadores de células T reguladoras.
Por el contrario, las células T CD4 + que responden T se convierten con mayor
frecuencia en células productoras de IFNγ o IL-17A. De hecho, usando la
expresión del gen de microarrays y el análisis de qPCR, mostramos que la
presentación de T se convierte preferiblemente en Treg mientras que la
respuesta de T se polariza hacia Th17.
Nuestros resultados sugieren que la presentación del antígeno T-T
después del proceso de trogocitosis puede tener un impacto en la respuesta de
diferenciación proinflamatoria versus proproliferativa y antiinflamatoria y, por lo
tanto, condicionar la respuesta inmune adaptativa. Finalmente, utilizamos
modelos de ratón para probar la naturaleza de estos hallazgos in vivo para
evaluar cuán importante es la presentación del antígeno por las células T en
respuesta a patógenos y enfermedades autoinmunes. Los resultados

14
14
presentados en esta tesis allanan el camino para explorar un nuevo mecanismo
de comunicación celular para las células T como APC que podría ser relevante
en condiciones de escasez de células infectadas por patógenos.

15
INTRODUCTION
16
Introduction
1. The immune cell network at a glance
We live surrounded by microorganisms present in our everyday
environment, many of which cause disease. Yet despite this continual
exposure we become ill only rarely. How does the body defend itself? The term
"Immunology" comes from the latin word immunitas and is the study of the
body´s defence against infection.
One feature of the immune system is that it can form long-lasting
memories of the pathogens it has previously encountered by creating cells
called memory cells. Immunological memory, the ability of the body to
“remember” and respond rapidly and more vigorously to a pathogen upon
subsequent encounters, has long been recognized in human history. The first
documentation of immunological memory came from the Greek historian
Thucydides, who vividly described the plague that struck the city of Athens at
the beginning of the Peloponnesian war in 430 B.C., recounting that “this
disease never took any man the second time”; it took us more than two
millennia to understand that immunological memory is a fundamental feature
of the adaptive immunity conveyed by B and T lymphocytes and forms the basis
of vaccination; by exposing the immune system to a pathogen in a controlled,
safe way, memory cells form and can efficiently fight off a future infection.
The most important organs of the immune system are the bone marrow
and the thymus, considered as the two primary lymphatic organs where
lymphocytes are formed and mature. Lymph nodes, tonsils, the spleen, Peyer’s
patches, the mucosa- and gut-associated lymphoid tissues are the secondary
lymphoid tissues where lymphocytes are activated. Importantly, the cells of the
immune system are all derived from specialized hematopoietic stem cells
(HSC) in the bone marrow from where they either migrate towards the thymus
for development or circulate in the blood or lymph to detect pathogenic or
malignant threats to the body. In order to do so, all immune cells rely on a

17
distinct set of receptors with which they discriminate self/healthy from non-
self/diseased tissues to ensure that their effector potential is only released in
dangerous situations. In vertebrates, the cells of the immune system are
classically assigned to either the innate or the adaptive immune system. This
is done according to the type of recognition receptors used and the timing of
the subsequent immune reaction but also by the ability of the cell to exert
immunological memory.
2. T cell immune response
2.1 The innate and adaptive immune system
The immune system is a highly developed network of cells, which recognizes
and fights pathogens. This system consists out of two core groups comprising
distinct features, referred to as innate and adaptive immunity. In general terms,
innate immune cells express surface receptors that recognize evolutionarily
conserved structures (DNA, RNA, glycoproteins etc.) mainly derived from
potential pathogens; the innate system is also able to sense “danger signals”, or
danger associated molecular patterns (DAMPs) through different receptors
(Matzinger 2002); innate immune defences are characterized by fast
assimilation and rapid responses, which are of limited duration. They include
humoral factors (e.g. complement and certain cytokines) and cellular
components, a broad range of differentiated cells, neutrophils, macrophages,
Dendritic Cell (DCs), Natural Killer cells (NK-cell) etc. each of these cell types
has a specific differentiation pathway and exert specific and sometimes
overlapping function. This allows early recognition of invading pathogens and
subsequently either clearance through innate immune cell effector
functions (e.g. phagocytosis, degranulation) or activation of the adaptive
immune system. In particular, the process of phagocytosis is initiated by the
formation of a phagocytic cup, leading to internalization of very large particles of
bacteria that end up with the destruction of the pathogen. If the body’s first line
of defence is not successfully in destroying the pathogens, after about four to

18
seven days the antigen-specific adaptive immune response sets in. In contrast
to the innate immune response, the adaptive needs more time to develop, it is
more specific and last longer. It is crucial for antigens to interact with the immune
system for an effective activation, especially with antigen presenting cells (APC)
including monocytes, macrophages and, most importantly, DCs. Adaptive
immune cells globally identify potential dangers based on their ability to
recognize “non-self antigens”, which are elements that are not present in the
human body under normal conditions. The second major attribute of the
adaptive immune system is the ability of maintaining an “immunological
memory” of previously encountered antigens; the appearance of memory B
and T cells share the ability to be very quickly reactivated upon secondary
infection with a similar pathogen (Zinkernagel and Doherty 1997).
There are two types of adaptive immune responses: humoral immunity mediated
by various substances in the blood and antibodies produced by B lymphocytes,
and on the other hand cell-mediated immunity that is the one we are going to
focus on in this work and is mediated by lymphocytes, T and B lymphocytes
primarily, antibodies and cytokines in the blood.
An adaptive immune response can be divided into a primary response and a
secondary response. During a primary response, naive T cells encounter their
cognate antigen, therefore get activated, differentiate and ultimately generate
memory T cells. The secondary response is orchestrated by already existing
memory T cells (generated during a primary response), which recognize the
previously encountered antigen upon re-infection by the same pathogen, leading
to its elimination.
3. Main characters of the adaptive immune response
3.1 APCs: Dendritic cells

19
The specialized components of innate immunity that play a critical role in the
initiation and development of adaptive immunity are called ‘APCs’. To play such
an important role and keep the balance between health and disease, they have
a unique set of features that enables them to operate at the interface of host
defence and tolerance. Among various APCs, Dendritic Cells (from the Greek
word for tree, “dendron”) are regarded as professional APCs since they share
the ability to efficiently take up and process Ags for presentation to naïve T
cells. DCs represent a heterogeneous populations of cells (Banchereau and
Steinman 1998); are distinct from other APCs in that they possess stellate
morphology, show elevated expression of major histocompatibility complex
(MHC) I and II molecules as well as co-stimulatory molecules (cluster of
differentiation CD40, CD80, CD86 and CD45), exhibit motility, and most
importantly, switch from an Ag-capturing status to a T-cell sensitizing status
called maturation (del Rio et al. 2010). 44 years after their discovery by Ralph
Steinman, it is now confirmed that DCs possess characteristic T-cell sensitizing
properties and control many aspects of immunity, forming a bridge between the
innate and adaptive immune responses. Their role in initiating and coordinating
adaptive immune responses is a consequence of their localization within
tissues and their specialized ability for migration (Hu and Pasare 2013). DCs
form a physical link between skin/mucosae in the periphery and secondary
lymphoid organs, for they capture harmful pathogens in the periphery and
induce the immune response by activating T lymphocytes. Upon phagocytosing
pathogens, DCs can secrete important cytokines and mediate antiviral defence
mechanisms (Mogensen 2009). To achieve these functions, DCs undergo a
definitive maturation process where, after capturing invaded pathogens, they
rearrange cytoskeletal structures to downregulate their phagocytic activity,
process and present antigens to T cells (Granucci et al. 2003).
3.2 T lymphocytes
In the adaptive immune system, T cells are specialized in the recognition of
peptide antigens presented in the context of a major histocompatibility complex
(Zinkernagel and Doherty 1997). As a result, T cells can see antigen exclusively
on the surface of an antigen presenting cells, such a dendritic cells or B cells.
20
T cells are responsible for the special defence in the tissue, they recognize
infected cells and they eliminate them from the body. During the course of an
immune reaction, T lymphocytes develop into specialized effector cells: T
helper cells or CD4 which contribute to the orientation of the immune response
through secretion of cytokines, and T killer or cytotoxic cells or CD8 which can
induce cell death in an antigen specific manner.
3.3 CD4+ T cells
CD4+ T cells are one of the most versatile immune cell types and exhibit multi-
faceted roles in regulating pathogen clearance and host protection. Generally,
both naïve CD4+ and CD8+ T cells live for few to several months. During this
period, unless they encounter foreign Ags, CD4+ T cells inexorably migrate
through the circulation and lymphoid organs, performing extensive sampling of
self-pMHC, exiting secondary lymphoid organs, and returning to circulation
(Cahalan and Parker 2006).
3.4 CD8+ T cells
CD8+ T cells are primarily involved in host immune responses against
intracellular pathogens, e.g. bacterial and viral infections but also in anti-tumor
immunity. Depending on their differentiation state, CD8+ T cells may commonly
be partitioned into naïve, effector, effector memory and central-memory
populations. Upon activation, T cells undergo massive proliferation while
upregulating surface activation markers i.e. CD25, CD69, CD44, and producing
major effector molecules such as IFN-γ, granzyme-B, perforin as well as Fas-
L.
Activation of T cells by APCs requires the formation of a specific and long-
lasting (up to 24h) interface, a very tight adhesion between the two cells, known
as the immunological synapse (Dustin et al. 1997, Stoll et al. 2002, Mempel et
al. 2004).

21
4. The Immunological Synapse
T cells play a pivotal role in orchestrating the immune system. T cell
responses are induced by antigen recognition through the T cell receptors
(TCRs), which bind antigen peptide–major histocompatibility (MHCp)
complexes on antigen-presenting cells (APCs). It was known that upon
interaction between the T cells and the APCs, TCRs and other accessory
molecules accumulated at the interface between the two cell types (Paul et al.
1987). T cells recognize cognate antigen by interacting with APCs to form
immunological synapses (Huppa and Davis 2003). The term “synapse” was
first used in the immune system by Norcross in 1984 in a prescient theoretical
paper (Norcross 1984) describing the accumulation and function of various
molecules at the T cell–APC interface, and, ten years later, Paul revived this
term (Paul and Seder 1994). Similarly to the CD4+ T cell–APC synapse, Kupfer
noticed the reorientation of the microtubule organizing center (MTOC) and
Golgi apparatus toward the cytotoxic T lymphocyte (CTL)–target cell interface
as an early event in CTL killing. Later, his group reported membrane and
cytoskeletal reorientation at the junction between a T cell–B cell conjugate,
leading to the important discovery of the supramolecular activation cluster
(SMAC), a highly patterned clustering and segregation of cell surface
molecules, particularly antigen receptors and adhesion molecules (Monks et al.
1998, Monks et al. 2015). The immunological synapse has been identified not
only in the T cell–APC conjugates but also at the interface between B cell–
membrane-bound antigen (Fleire et al. 2006), NK cell– target cell (Orange
2008), and NKT cell–CD1d-expressing cell (McCarthy et al. 2007).
After this historic digression, we can define the immunological synapse as a
special molecular architecture for recognition and signalling, where the
receptors and adhesion molecules could be structurally and kinetically
organized for the initial and sustained T cell activation (Monks et al. 1998);
(Grakoui et al. 1999). The concept of the immunological synapse beautifully
correlated with what was known about T cell antigen recognition and activation;
however, this model could not explain early activation events, which can occur
22
within 1 min. A much smaller signalling unit was predicted to form prior to the
mature immunological synapse formation. Indeed, the TCR microcluster was
discovered as a signalling cluster containing receptors, accessory molecules,
and downstream signalling molecules (Bunnell et al. 2006); (Campi et al. 2005),
(Yokosuka and Saito 2005). Microclusters dynamically change the localization
and the assembled molecules at the immunological synapse and induce initial
and sustained TCR signalling as well as costimulation signals (Depoil et al.
2008); (Yokosuka et al. 2008). The centripetal motion of TCR microclusters is
dependent on constant remodelling of the actin cytoskeleton (Lasserre and
Alcover 2010). This model is now known to describe the signalling of other
lymphocytes, including B cells, natural killer (NK) cells, and natural killer T (NKT)
cells (Davis and Dustin 2004).
4.1 Architecture of the Immunological Synapse
The immunological synapse is traditionally characterized by a “bull’s eye”
structure, c-SMAC, and peripheral-SMAC (p-SMAC) (Monks et al. 1998);
(Huppa and Davis 2003); (Dustin 2009) (Fig. 1). The major components of the
c-SMAC are key molecules for T cell signalling, such as TCR/CD3–MHCp,
CD28 – or cytotoxic T-lymphocyte antigen-4 (CTLA-4) – CD80/CD86, and
protein kinase C y (PKCy). In contrast, the p-SMAC is composed of
cytoskeleton-related or adhesion molecules structurally supporting the
immunological synapse, such as leukocyte function- associated antigen-1
(LFA-1)/talin – intracellular adhesion molecule-1 (ICAM-1) and CD2–
CD48/CD58. The distal-SMAC (d-SMAC) was defined later as a region
enriched in molecules with long extracellular domains, such as CD45 (Freiberg
et al. 2002) and CD43 (Allenspach et al. 2001); (Delon et al. 2001); (Revy et
al. 2001); (Roumier et al. 2001); (Stoll et al. 2002). It was thought that the c-
SMAC mediates antigen recognition and subsequent T cell activation, whereas
the p-SMAC supports T cell–APC conjugation and maintains the architecture
of the immunological synapse.

23
Illustration 1. Architecture of the conventional immunological synapse. (a) The CD3 core
is clearly identified at the stable conjugation between a T cell and an APC by fluorescence-
labeled anti-CD3e antibodies (lateral view, top). (b) The alignment of the receptors and the
adhesion molecules are considered to be ordered by size of ectodomain (Davis and van der
Merwe 2006); T cell receptor (TCR)/CD3 complex – MHC-peptide (MHCp), CD28/protein
kinase C y (PKCy) – CD80/86, cytotoxic T-lymphocyte antigen 4 (CTLA-4) – CD80/CD86,
Agrin, and lysobisphosphatidic acid (LBPA) in the c-SMAC; CD2–CD48/CD58, leukocyte
function-associated antigen-1 (LFA-1)/ talin–intracellular adhesion molecule 1 (ICAM-1), F-
actin, and CD4/Lck in the p-SMAC; and CD43/moesin, CD45, and F-actin in the d-SMAC
Adapted from (Davis and Dustin 2004).

24
24
4.2 Localization of a APC-T cell interaction
Particulate antigens, as well as antigen-containing dendritic cells and
macrophages, enter the lymph node via the lymph through afferent lymphatic
vessels. Lymphocytes also arrive in the lymph node via afferent lymphatic
vessels, as well as from the blood through specialized high endothelial venules.
The cortex of the lymph node consists of B cell follicles (containing B cells and
follicular dendritic cells) and a T cell zone (made up of mostly T cells and
dendritic cells). The inner medulla contains strings of lymphocytes and
macrophages known as medullary cords, as well as medullary sinuses that
drain into the efferent lymphatic vessels and help guide lymph and activated
lymphocytes into the blood. Naïve T cells are in constant motion, scanning the
lymph node at high rates (10-15 µm/min average, 25 µm/ min burst speeds) in
search for the appropriate antigen and danger signals are capable of contacting
5000 dendritic cells in one hour (Fooksman et al. 2009).
5. The mechanisms of antigen uptake
The recognition between cells of the immune system involves the activation of
pathways for receptor internalization. Antigen uptake can occur at different
levels. There are numerous ways that endocytic cargo molecules may be
internalized from the surface of eukaryotic cells; in addition to the classical
clathrin-dependent mechanism of endocytosis, several endocytic pathways that
do not use clathrin have also emerged (Mayor and Pagano 2007) .
25
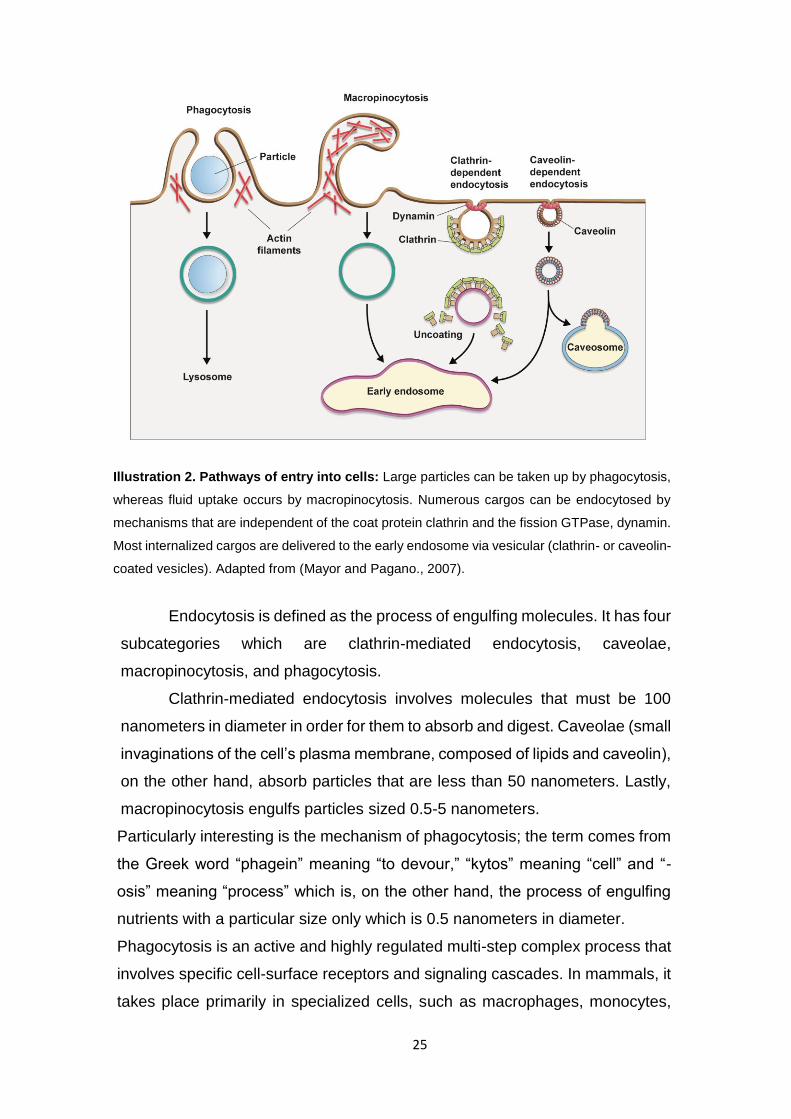
Illustration 2. Pathways of entry into cells: Large particles can be taken up by phagocytosis,
whereas fluid uptake occurs by macropinocytosis. Numerous cargos can be endocytosed by
mechanisms that are independent of the coat protein clathrin and the fission GTPase, dynamin.
Most internalized cargos are delivered to the early endosome via vesicular (clathrin- or caveolin-
coated vesicles). Adapted from (Mayor and Pagano., 2007).
Endocytosis is defined as the process of engulfing molecules. It has four
subcategories which are clathrin-mediated endocytosis, caveolae,
macropinocytosis, and phagocytosis.
Clathrin-mediated endocytosis involves molecules that must be 100
nanometers in diameter in order for them to absorb and digest. Caveolae (small
invaginations of the cell’s plasma membrane, composed of lipids and caveolin),
on the other hand, absorb particles that are less than 50 nanometers. Lastly,
macropinocytosis engulfs particles sized 0.5-5 nanometers.
Particularly interesting is the mechanism of phagocytosis; the term comes from
the Greek word “phagein” meaning “to devour,” “kytos” meaning “cell” and “-
osis” meaning “process” which is, on the other hand, the process of engulfing
nutrients with a particular size only which is 0.5 nanometers in diameter.
Phagocytosis is an active and highly regulated multi-step complex process that
involves specific cell-surface receptors and signaling cascades. In mammals, it
takes place primarily in specialized cells, such as macrophages, monocytes,
26
and neutrophils, which function to clear away large pathogens such as bacteria,
parasites and large cell debris.
Phagocytic uptake involves actin dynamics including polymerisation, bundling,
contraction, severing and depolymerisation of actin filaments.
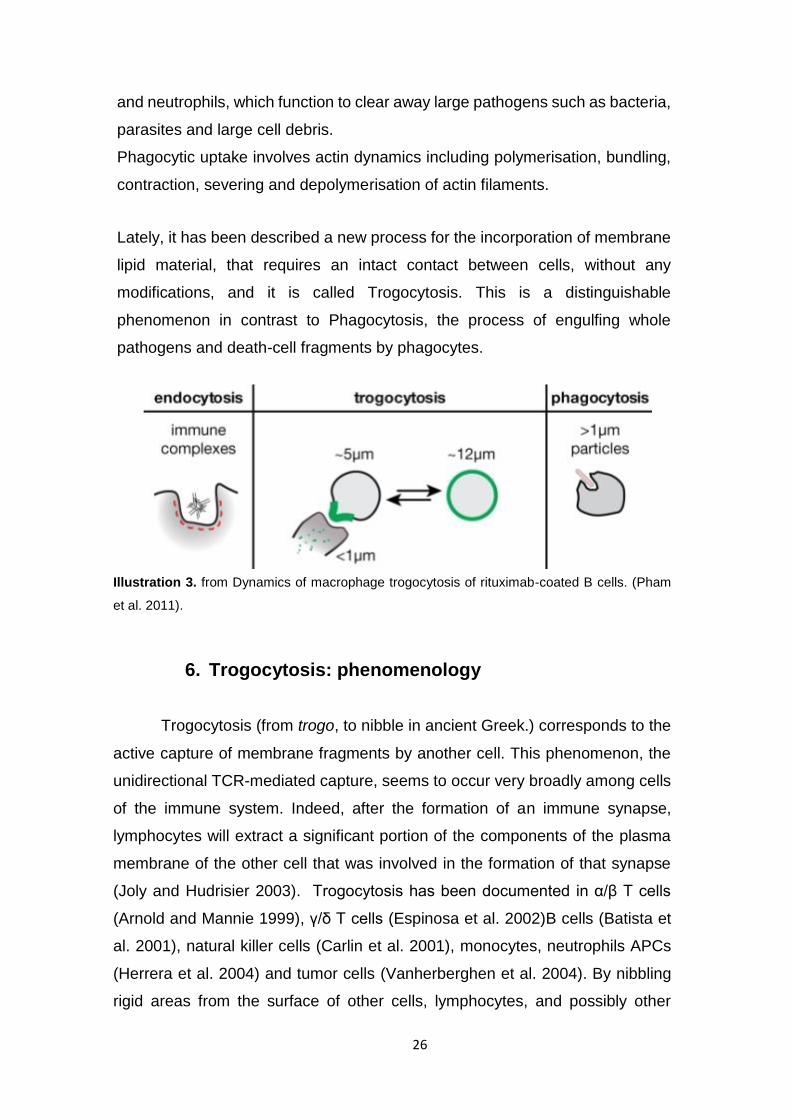
Lately, it has been described a new process for the incorporation of membrane
lipid material, that requires an intact contact between cells, without any
modifications, and it is called Trogocytosis. This is a distinguishable
phenomenon in contrast to Phagocytosis, the process of engulfing whole
pathogens and death-cell fragments by phagocytes.
Illustration 3. from Dynamics of macrophage trogocytosis of rituximab-coated B cells. (Pham
et al. 2011).
6. Trogocytosis: phenomenology
Trogocytosis (from trogo, to nibble in ancient Greek.) corresponds to the
active capture of membrane fragments by another cell. This phenomenon, the
unidirectional TCR-mediated capture, seems to occur very broadly among cells
of the immune system. Indeed, after the formation of an immune synapse,
lymphocytes will extract a significant portion of the components of the plasma
membrane of the other cell that was involved in the formation of that synapse
(Joly and Hudrisier 2003). Trogocytosis has been documented in α/β T cells
(Arnold and Mannie 1999), γ/δ T cells (Espinosa et al. 2002)B cells (Batista et
al. 2001), natural killer cells (Carlin et al. 2001), monocytes, neutrophils APCs
(Herrera et al. 2004) and tumor cells (Vanherberghen et al. 2004). By nibbling
rigid areas from the surface of other cells, lymphocytes, and possibly other
27
leukocyte types, may not only be surveying their neighbouring cells for the
development of dangerous pathogens, but may also have an important role in
the refuse disposal of membrane docks that may be unwanted at the surface of
resting healthy cells. Lymphocytes inherit many different molecules from
conjugating cells. Some of these molecules, which are not transcribed by
lymphocytes, may directly or indirectly influence the phenotype and function of
the lymphocytes. From an evolutionary perspective, trogocytosis may have
developed initially as a symbiotic arrangement: leukocytes may be ‘feeding´off
other cell types in return for undertaking the defence of the organism against
pathogens (Joly and Hudrisier 2003).
So, it seems that trogocytosis could be a vector for intercellular
communication. T cells may acquire peptide/MHC complexes at the T-APC
interface, forming clusters within minutes that are subsequently acquired and
internalized in T cells.
Although the physiological consequences of the intercellular transfer are
still questionable, several observations suggest an active role in the immune
responses. Two schools of thinking have been described: the first one shows a
positive regulation by CD8+ T cells that acquire MHC class II molecules in vitro
and in vivo in response to a viral infection, a transfer which confers them the
capacity to directly activate CD4+ T cells. The connotation of this intercellular
transfer of antigen-MHC complexes may expand the repertoire of cells that can
act functionally as APCs and regulate the immune response.
Conversely, the second show that intercellular transfer may down-
regulate immune responses. There is some evidence that the presence of APC-
derived peptide MHC complexes on T cells may render them susceptible to
fratricide lysis. As a negative consequence, active lymphocytes that naturally
spend time in close proximity to pathogens, could contribute to the spread of
pathogens within the host either through direct capture of the pathogen or its
genome.
28
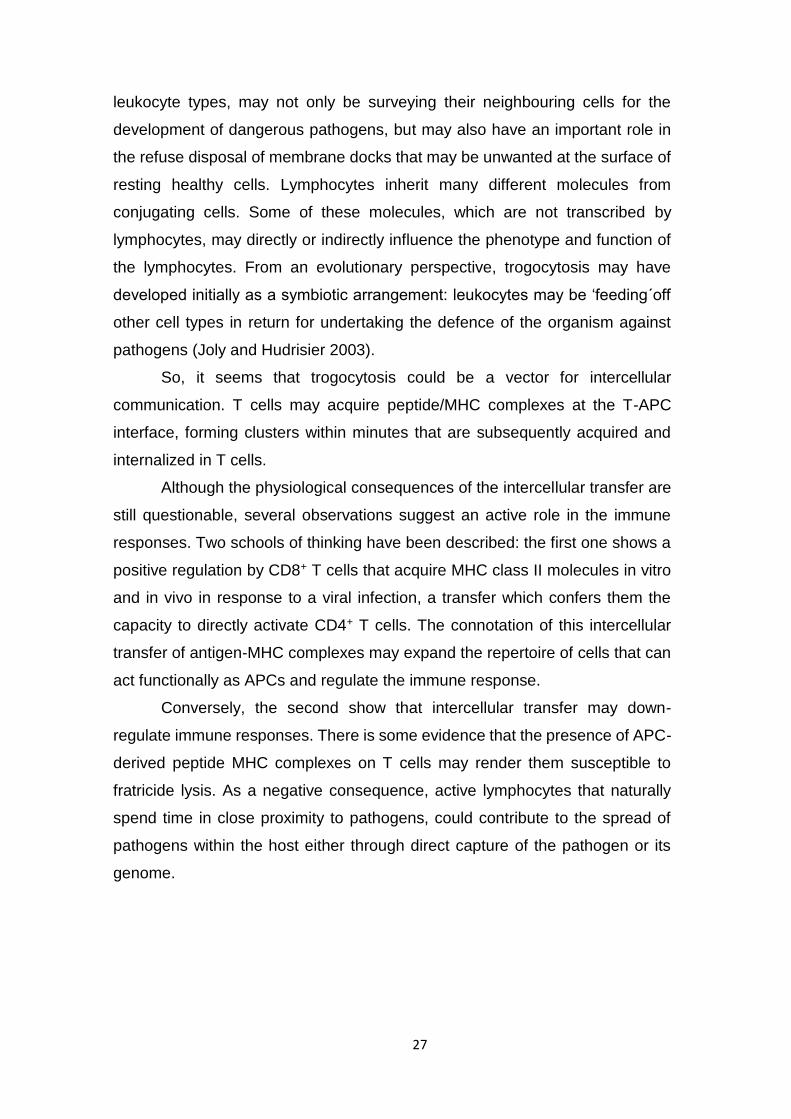
Illustration 4. TCR Internalization and Trogocytosis in T Cells.
Constitutive TCR turnover occurs in resting cells. Upon stimulation, TCR nanoclusters aggregate
to signaling-active microclusters that can be internalized in the pSMAC in a clathrin-dependent
manner. Once the microclusters have reached the cSMAC, patches of the APC containing the
pMHC molecules are trogocytosed in a TC21- and RhoG-dependent mechanism. Trogocytosed
membrane proteins from the APC can be re-expressed on the T cell. Adapted from (Dopfer et al.
2011).
An effective immune response is vital in the protection against invading foreign
pathogens: CD4+ T cells play a pivotal role in host defence by secreting
cytokines to drive appropriate immune responses.
7. CD4+ T cell differentiation
The differentiation of CD4+ T cells into various T helper subsets,
in vivo, is predominantly dictated by the cytokine milieu surrounding the T
cell at the time of its first encounter with an antigen.
The induction of CD4+ T cell differentiation is generally thought of as a two-
step process: cytokine stimulation which triggers JAK/STAT signalling
cascades, followed by induction of master regulator transcription factors.
(Darne l l e t a l . 1994 ) . Expression of so-called “master regulators” has
been identified for all of the T helper cell populations introduced in this
dissertation: T helper 1 (Th1), T helper 2 (Th2), T helper 17 (Th17), T

29
follicular helper (Tfh) and regulatory T cells (Treg). Those master regulators
are, in fact, transcription factors defined as essential for promoting
differentiation into respective T helper cell populations (Zh u e t a l . 2 0 1 0 ) .
Presented below in the I l lustrat ion 5 an overview of T helper cell
populations, the cytokine-dependent STAT-signaling needed for their
differentiation, their inhibitory function against each other and the distinct
set of cytokines that different T helper cell populations.
Illustration 5. Overview of naïve CD4+
T cells differentiation into T helper subsets.
The outer circles represent naïve CD4+ T cells and different helper T cell subsets. Cytokines
depicted above arrows drive differentiation towards the respective subsets. Inner circles
contain designated master-regulator (transcription factors) and outer circles show STAT-
molecules associated with the respective differentiation process. Cytokines in italic are
effector cytokines produced by corresponding T helper cells.
CD4+ T cells have the potential to differentiate into multiple effector T helper
(Th) cells depending on TCR signal strength and on the cytokine milieu, which

30
is mainly shaped by innate immune cells. In this context, dendritic cells (DCs)
represent master regulators of effector T cell responses to invading
pathogens. DCs can indeed instruct T cell polarization by providing proper
antigen-dependent TCR stimulation via major histocompatibility complex
(MHC) molecules, as well as co-stimulation through surface receptors, which
are up-regulated on the DC surface following pattern recognition receptor
engagement by pathogen-associated molecular patterns. In addition,
according to the qualitative/cytokine model of differentiation, DCs have the
potential to instruct T cell differentiation by altering the microenvironment
through the release of specific cytokines, including interleukin (IL)-12, IL-4 or
IL-6 and Transforming Growth Factor β (TGF-β), which are Th1-, Th2- and
Th17-polarizing cytokines, respectively.
i. Th1 cells
T helper 1 cells mediate immune responses mainly against intracellular
viral and bacterial pathogens. The major Th1 related cytokine is IFN-γ, and
the designated master regulator for Th1 differentiation is transcription factor
T-bet (Szabo et al. 2000).
IL-12 receptor beta (IL-12Rβ) 1 is constitutively expressed on CD4+
T cells (Kano et al., 2008). However, upon TCR stimulation IL-12Rβ2 is
upregulated, thereby forming the IL-12 receptor complex and increasing
responsiveness to IL-12 (Gadina et al. 2001) (Szabo et a l . 1997) .
Engagement of IL-12 triggers STAT-4 signalling which induces IFN-γ
production, leading to an autocrine signal amplification involving IFN-γ
receptor signalling via STAT-1. Subsequently, sustained STAT-1 signalling
drives the expression of master regulator, T-bet, and therefore Th1 cell
differentiation (L ighvan i e t a l . 2001) .
Macrophages and DCs are the major source of IL-12 for CD4 T cells
during initiation of Th1 differentiation. Th1 cells then migrate to infected
tissue through up-regulation of appropriate chemokine receptors e.g.
CXCR3 (Bonecch i e t a l . 1998 , Sa l lus to e t a l . 1998 ) and CCR5

31
(Loetscher et al. 1998) (Loetscher et al. 1998). Even though Th1 cells have
been reported to produce and secrete granzyme B (a serine protease
important for contact dependent cytotoxic activity), their major role relies on
the ability to produce high amounts of interferon-γ. This localized Th1-
mediated change in the cytokine environment provides help in attracting
and activating other immune cells such as macrophages, NK cells and
cytotoxic CD8 T cells, which in turn mediate target killing through
phagocytosis or degranulation of cytotoxic agents.
ii. Th2 cells
T helper 2 cells are responsible for host immunity against
extracellular parasites such as helminths. Cytokines associated with Th2
responses include IL-4, IL-5, IL-13 and IL-25. Moreover, the master regulator
driving Th2 differentiation is transcription factor GATA-3 (Zheng and
F lave l l 1997) .
Activation of CD4+ T cells in the presence of IL-4 leads to STAT-6
activation (Takeda et al. 1996), through wh ich chromatin signalling leads
to upregulation and sustained GATA-3 expression (Onodera et al. 2010).
Moreover, IL-4 driven GATA-3 expression selectively stimulates
commitment to Th2 ( Z h e n g a n d F l a v e l l 1 9 9 7 ) (, while suppressing
Th1, Th17 and Tfh cell differentiation directly or through upregulation of
transcriptional repressor Gfi- 1 (Zhu et al. 2002) and B – lymphocyte
induced maturation protein 1 (Blimp-1) (C immino et a l . 2008) ; ( L i n e t
a l . 2 0 1 3 ) . Other transcription factors such as c-Maf, IRF4 and NFATc2
work collaboratively forming a transcriptional complex in the promoter region
of the il4 gene to stimulate IL-4 production and subsequently Th2
differentiation (Rengarajan et al. 2002). Interestingly, c-Maf and Gfi-1 play
a major role in regulating STAT-5 mediated IL-2 signalling (Zhu et al.
2006) (Ho et al. 1998), which cooperates with IL-4 induced STAT-6
signalling to drive Th2 polarization (Cote-Sierra et al. 2004). In vitro
experiments have shown that constitutive expression of STAT -5 in CD4+ T
cells allows Th2 differentiation even in the absence of IL-4 and in presence o f

32
I L - 1 2 . ( Z h u e t a l . 2 0 1 0 ) . However, in the absence of GATA-3 T
cells failed to commit to Th2 cells, demonstrating that although IL-4
independent Th2 polarization mechanisms exist, GATA-3 is signalling
(Zheng and F lave l l 1997) .
iii. Th17 cells
Th17 cells play a critical role in host defence against extracellular
pathogens and particularly in the gut mucosa. Effector cytokines produced
by this subset are IL-17 (or IL-17A), IL-17F, IL-21 and IL-22. Moreover, the
transcription factor RAR-related orphan receptor (ROR)γt has been
established as master regulator of Th17 cell differentiation ( Ivanov e t a l .
2006) .
The discovery of a novel cytokine chain, IL-23p19 (Oppmann et al. 2000)
was a key finding for the identification and detailed description of Th17
cells. It became evident that the heterodimeric IL-12 receptor would share
the same beta subunit (IL-12p40) with what is known today as the IL-23
receptor. Until that time, self-reactive Th1 cells were thought to be the
major cell type involved in experimental autoimmune encephalomyelitis
(EAE). However, by comparing T cell immune responses of IL-12p35-
deficient mice with IL-23p19 knockout mice, Cua and colleges managed
to demonstrate that IL-23 but not IL-12 would induce EAE, through
expansion of IL-17 producing T cells (Cua et a l . 2003) . A follow-up study
showed different gene expression profiles for Th1 cells compared to IL-17
producing T cells, which led to the introduction of the ThIL-17 or Th17 subset
(Langrish et al. 2005).
Despite the early recognition of IL-23-driven IL-17 production in T
cells, it was unclear how CD4+ T cells, which do not express the IL-23
receptor, would differentiate into Th17. The presence of other mediators,
such as transforming growth factor-beta (TGF-β) and IL-6 (or IL-21 in
human), was found to be crucial for initiating Th17 differentiation ( M a n g a n
e t a l . 2 0 0 6 , V e l d h o e n e t a l . 2 0 0 6 ) . Indeed, TFG-β promotes
33
RORγt expression, while at the same time repressing its function through
FOX-P3.
iv. Treg cells
Tregs are indispensable for maintenance of immune homeostasis.
The main function of Tregs is down-modulating immune responses to
prevent autoimmunity and eliminate potential auto-reactive cells. TGF-β and
IL-10 are the predominant effector cytokines produced by Tregs and the
master regulator of this subset is transcription factor forkhead box P3
(Fox-P3) (Fontenot et al. 2003, Hori et al. 2003); ( K h a t t r i e t a l . 2 0 0 3 ) .
Of note, previous to the identification of Fox-P3, Tregs were identified by
constitutive surface expression of CD25, hence, in some publications they
are referred to as CD4+ CD25+ T cells.
Treg cells can be divided into thymic-derived natural regulatory T cells
(nTregs) (Josefowicz and Rudensky 2009) and extrathymically-derived
induced regulatory T cells (iTreg) according to CD25 expression ( B i l a t e
a n d L a f a i l l e 2 0 1 2 ) .During thymus development, hyperresponsive CD4
T cells are mostly eliminated from the T cell pool. However, a small fraction
of those cells differentiate into nTregs and acquire the ability to react to self-
antigen inducing and regulating central tolerance, specific to self-antigens
( J o s e f o w i c z a n d R u d e n s k y 2 0 0 9 ) . In contrast, iTregs acquire their
suppressive potential in the periphery and they are a natural by-product of
any ongoing immune response. This process can be divided into two
mechanistically distinct categories of which the first one is the better
understood. 1) iTreg differentiation can be induced when T cells are
activated in the absence of co-receptor stimulation e.g. under non-
inflammatory conditions (Kretschmer et al. 2005). 2) iTreg differentiation is
also induced in the course of an immune response, concomitant to the
generation of cognate effector T cells ( G o t t s c h a l k e t a l . 2 0 1 0 ) .
Thus, iTregs have the ability to introduce immunological tolerance to
(foreign) elements previously unknown to the immune system.

34
v. T follicular helper (Tfh)
Tfh cells are essential in providing help for B cell maturation, class switch
recombination (CSR) and somatic hypermutation (SHM) through which they
modulate humoral responses. Tfh helper cells can be distinguished from other
CD4+ T cells lineages by their low expression levels of cytokines (IFN-γ, IL-4,
IL-17) and transcription factors (T-bet, GATA3, and Rorγt) characteristic of Th1,
Th2, and Th17 cells, respectively. (Crotty 2014). Furthermore, Tfh cells express
a unique combination of effector molecules that are critical for their
development and function, including high levels of the surface receptors
ICOS,CD40 ligand (CD40L), OX40, BTLA and CD84, the cytoplasmatic
adaptor protein SLAM-associated protein (SAP), and the transcription factors
Bcl-6 and c-Maf (Nurieva et al. 2009).
Tfh cells are CXCR5hi, CCR7lo and canonically secrete IL-21, IL-4 and
CXCL13 (Kroenke et al. 2012) . CCR7 is a chemokine receptor needed for
migration to the T cell zone, c-Maf is a transcription factor involved in Tfh
differentiation and PD-1 is a marker associated to exhaustion in cytotoxic CD8
T cells;
8. Ras superfamily
The Ras superfamily consists of 150 Ras GTPases, known as small or
monomeric G proteins with low molecular weight (20–30 kDa). The Ras
superfamily is divided into five large families: Ras, Rho, Rab, Ran and Arf.
(Goitre et al. 2014).
The story of small GTPases started more than three decades ago with
the discovery of the Ras oncogenes, which was soon followed by the discoveries
of related proteins now forming the Ras superfamily (Bourne et al. 1990). The
three human Ras proteins, H-Ras, K-Ras, and N-Ras, are the founding
members of this large superfamily of small GTPases with evolutionarily
conserved orthologs found in Drosophila, Caenorhabditis elegans,
Saccharomyces cerevisiae, Saccharomyces pombe, Dictyostelium, and plants.

35
This superfamily is divided into families and subfamilies on the basis of
sequence and functional similarities.
Illustration 6. Dendrogram of the small G protein superfamily: Distribution of the members of
the 5 different families of Ras superfamily: Ras, Rab, Ran, Rho and Arf. Taken from: Takai et al.
(2001) Small GTP-Binding Proteins.
They are monomeric GTP-binding and hydrolysing (GTPases) proteins that act
as binary, GDP-/GTP-regulated, molecular switches in coupling extracellular
signals to intracellular signalling networks that regulate a wide range of
fundamental cellular processes, including proliferation, differentiation,
morphology, polarity, adhesion, migration, survival, and apoptosis. When
activated and bound to GTP, they interact with downstream effectors; inactive
GDP-bound, Rho family G proteins are thought to be cytosolic and bound to
guanine dissociation inhibitor (GDI). In order to cycle between GDP- and GTP-
bound states, Ras proteins need guanine nucleotide exchange factors (GEF)
and GTPase-activating proteins (GAP). GEF activity is required to activate Ras
proteins by catalysing GDP exchange to GTP. GAPs increase the intrinsically
low catalytic activity of G proteins causing GTP hydrolysis and rapid inactivation.
36
1. Rho family
The Rho (Ras homologous) family of small GTPases is closely related to
the Ras family and is composed of 23 members, which are involved in signalling
networks regulating actin cytoskeleton organization, cell adhesion, polarity and
motility, cell-cycle progression, and gene expression (Heasman and Ridley
2008). According to their homology in the amino-acid sequence, this group is
divided into 6 subfamilies: Rho, Rac, Cdc42, Rnd, RhoBTB y RhoT/MIRO
(Wennerberg and Der 2004).
The first function attributed to the GTPases of the Rho family was
controlling cytoskeletal polymerization; the actin cytoskeleton is a constantly
evolving network formed of higly dynamic polarized actin filaments (Alberts et
al., 2014). The well-studied proteins considered as prototypical of this family of
Rho GTPases are RhoA, Rac and Cdc42. Each of them acts as a link between
signalling through membrane receptors and the assembly or disassembly of
the actin cytoskeleton (Bustelo et al. 2007).
RhoG
RhoG is a member of the Rho family, a classically regulated GTPase, most
closely related to Rac, sharing the homology with Rac1 and Cdc42 of 72% and
62% respectively. The Rho family member RhoG was identified as a serum
inducible gene in fibroblasts (Vincent et al. 1992).
37
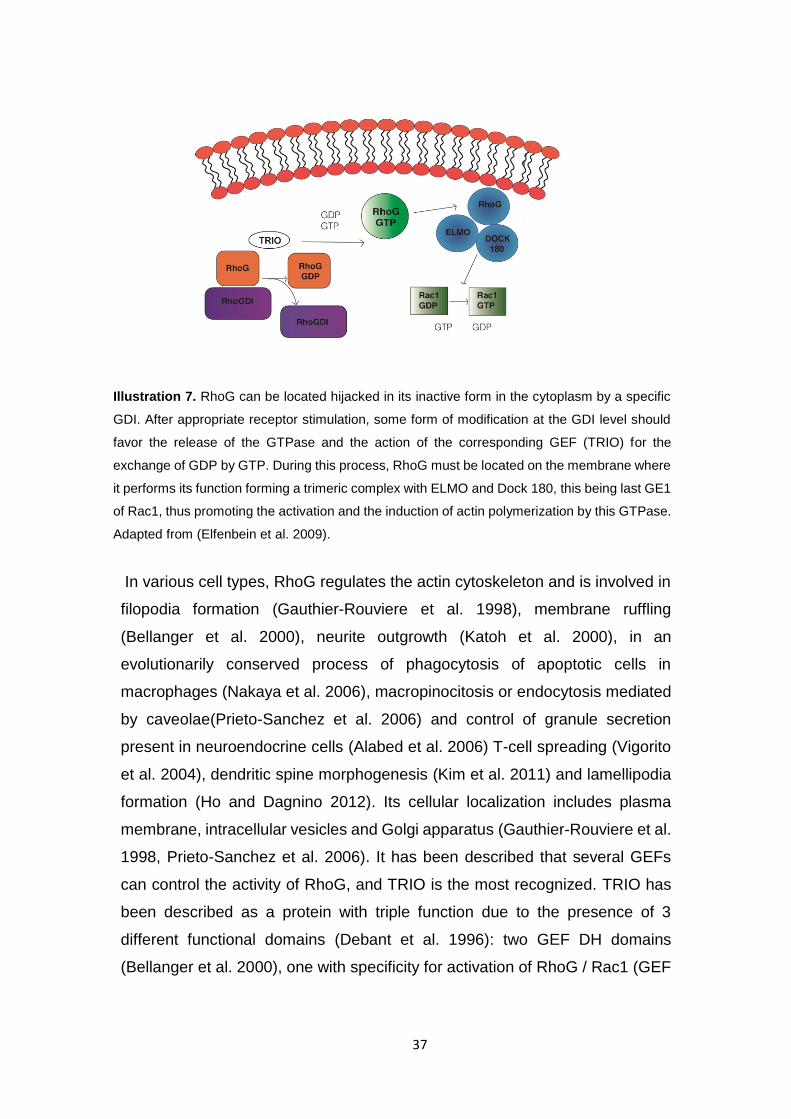
Illustration 7. RhoG can be located hijacked in its inactive form in the cytoplasm by a specific
GDI. After appropriate receptor stimulation, some form of modification at the GDI level should
favor the release of the GTPase and the action of the corresponding GEF (TRIO) for the
exchange of GDP by GTP. During this process, RhoG must be located on the membrane where
it performs its function forming a trimeric complex with ELMO and Dock 180, this being last GE1
of Rac1, thus promoting the activation and the induction of actin polymerization by this GTPase.
Adapted from (Elfenbein et al. 2009).
In various cell types, RhoG regulates the actin cytoskeleton and is involved in
filopodia formation (Gauthier-Rouviere et al. 1998), membrane ruffling
(Bellanger et al. 2000), neurite outgrowth (Katoh et al. 2000), in an
evolutionarily conserved process of phagocytosis of apoptotic cells in
macrophages (Nakaya et al. 2006), macropinocitosis or endocytosis mediated
by caveolae(Prieto-Sanchez et al. 2006) and control of granule secretion
present in neuroendocrine cells (Alabed et al. 2006) T-cell spreading (Vigorito
et al. 2004), dendritic spine morphogenesis (Kim et al. 2011) and lamellipodia
formation (Ho and Dagnino 2012). Its cellular localization includes plasma
membrane, intracellular vesicles and Golgi apparatus (Gauthier-Rouviere et al.
1998, Prieto-Sanchez et al. 2006). It has been described that several GEFs
can control the activity of RhoG, and TRIO is the most recognized. TRIO has
been described as a protein with triple function due to the presence of 3
different functional domains (Debant et al. 1996): two GEF DH domains
(Bellanger et al. 2000), one with specificity for activation of RhoG / Rac1 (GEF
38
D1) and another for RhoA (GEF D2), and a serine-threonine protein domain
kinase (PSK).
Once activated, RhoG controls the activity of Rac1 and Cdc42, through the
union with ELMO (deBakker et al. 2004); (Katoh et al. 2006) (Katoh and Negishi
2003)forming a trimeric complex with Dock180 (Gumienny et al. 2001).
The functions of RhoG in lymphocytes have been investigated in cell culture
systems and using constitutive RhoG −/− mice (Vigorito et al. 2004) where it has
shown that a deficiency in RhoG does not lead a major impact upon the
development of either B or T cells. However, RhoG-deficient lymphocytes show
a modestly enhanced response to antigen challenge and respond better to in
vitro stimulation than their wild-type counterparts(Vigorito et al. 2004).
We already know, from previous studies, that T cells are able to acquire
antigens from other cells and RhoG is implicated in this process; in this thesis
we investigate the meaning of this acquisition in a new context that drives T
cell differentiation.

39
39
MATERIALS AND METHODS
40
Materials and Methods
1. Materials
1.1 Cell lines
DCEKs is a cellular line from fibroblasts transfected with plasmids
encoding I-Ek and CD80. These cells were cultured in DMEM with 10% fetal
bovine serum (FBS) supplemented with 2Mm L-Glutamine, 100 U/ml penicillin
and 100 U/ml streptomycin.
Naïve T lymphocytes isolated from mouse peripheral lymphoid organs,
were maintained in RPMI with 10% fetal bovin serum (FBS) supplemented with
2mM L-Glutamine, 100U/ml penicillin and 100U/ml streptomycin, 10mM Sodium
pyruvate and 20µM β-Mercaptoethanol.
Dendritic cells were generate from bone marrow cultured with RPMI-1640
10% FBS, supplemented with 100U/ml penicillin, 100U/ml streptomycin, 10 Mm
sodium pyruvate, 20 µM β-Mercaptoethanol and 20 ng/ml of Granulocyte
macrophage colony-stimulating factor (GM-CSF).
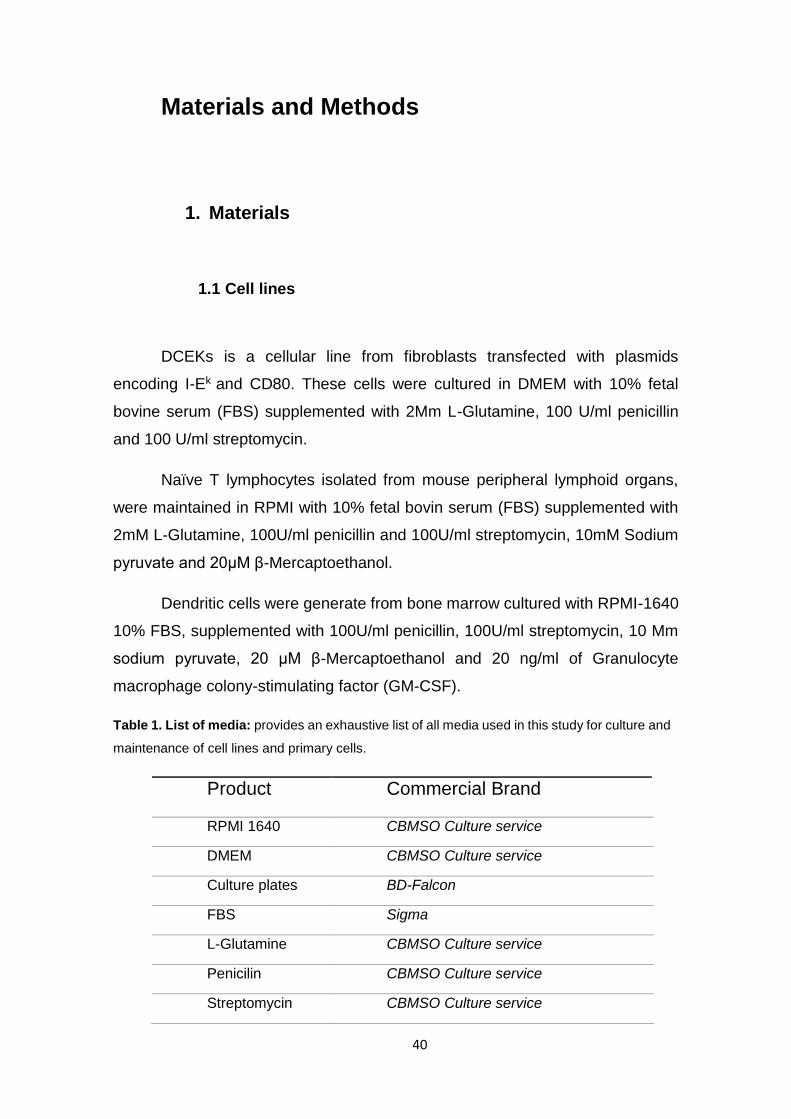
Table 1. List of media: provides an exhaustive list of all media used in this study for culture and
maintenance of cell lines and primary cells.
Product Commercial Brand
RPMI 1640 CBMSO Culture service
DMEM CBMSO Culture service
Culture plates BD-Falcon
FBS Sigma
L-Glutamine CBMSO Culture service
Penicilin CBMSO Culture service
Streptomycin CBMSO Culture service
41
βMercaptoethanol Sigma
AANE CBMSO Culture service
GM-CSF Peprotech
Table 1: List of media used in this thesis
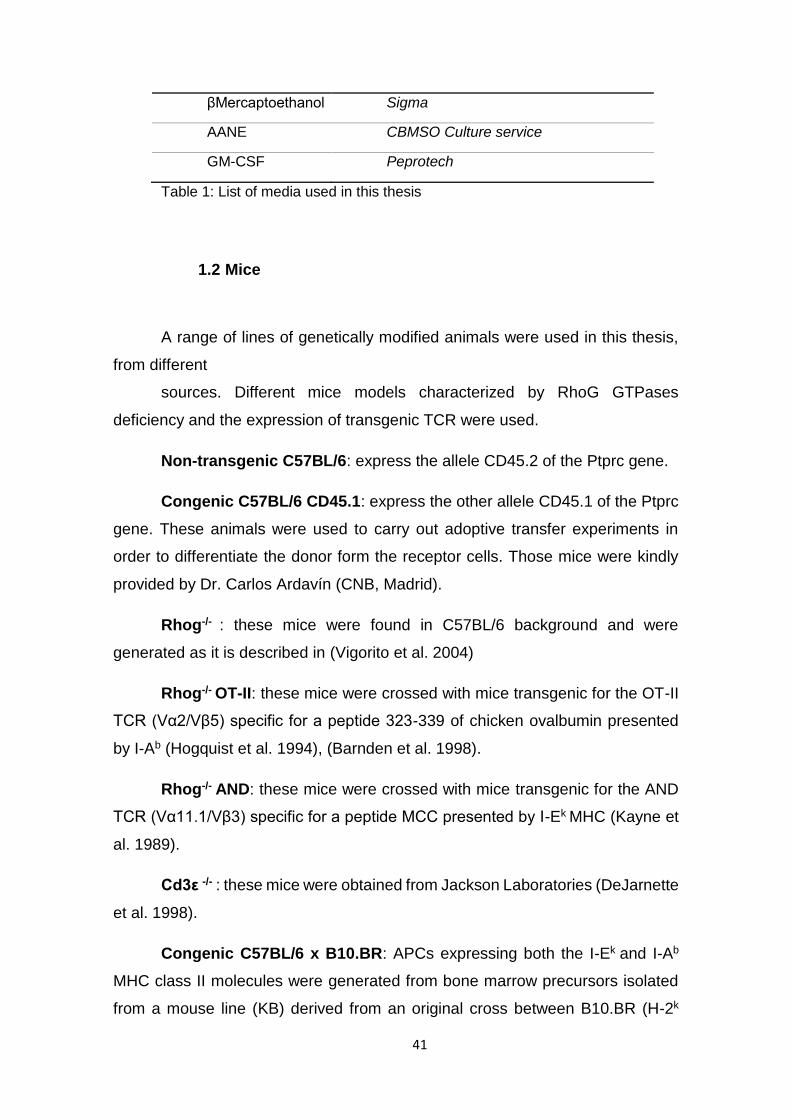
1.2 Mice
A range of lines of genetically modified animals were used in this thesis,
from different
sources. Different mice models characterized by RhoG GTPases
deficiency and the expression of transgenic TCR were used.
Non-transgenic C57BL/6: express the allele CD45.2 of the Ptprc gene.
Congenic C57BL/6 CD45.1: express the other allele CD45.1 of the Ptprc
gene. These animals were used to carry out adoptive transfer experiments in
order to differentiate the donor form the receptor cells. Those mice were kindly
provided by Dr. Carlos Ardavín (CNB, Madrid).
Rhog-/- : these mice were found in C57BL/6 background and were
generated as it is described in (Vigorito et al. 2004)
Rhog-/- OT-II: these mice were crossed with mice transgenic for the OT-II
TCR (Vα2/Vβ5) specific for a peptide 323-339 of chicken ovalbumin presented
by I-Ab (Hogquist et al. 1994), (Barnden et al. 1998).
Rhog-/- AND: these mice were crossed with mice transgenic for the AND
TCR (Vα11.1/Vβ3) specific for a peptide MCC presented by I-Ek MHC (Kayne et
al. 1989).
Cd3ε -/- : these mice were obtained from Jackson Laboratories (DeJarnette
et al. 1998).
Congenic C57BL/6 x B10.BR: APCs expressing both the I-Ek and I-Ab
MHC class II molecules were generated from bone marrow precursors isolated
from a mouse line (KB) derived from an original cross between B10.BR (H-2k

42
haplotype) and C57BL/6 (H-2b haplotype) mice and maintained on a H-2kb
haplotype by intercrossing.
1.3 Animal Handling
Mice were bred and maintained under SPF conditions in the animal facility
of the Centro de Biología Molecular Severo Ochoa with unlimited access to food
and water. All experiments were carried out in strict accordance with the
European Commission legislation for the protection of animal used purposes
(2010/63/EU). The protocol for the treatment of the animals was approved by the
“Comite de Etica de Investigacion de la Comunidad de Madrid”, Spain (permits
PROEX 21/14 and PROEX 148/15). They were euthanized in a CO2 chamber
and all efforts were made to minimize their suffering.
1.4 Mouse peripheral blood collection for genotyping
A small aliquot of peripheral blood (100µl) was taken from each mouse in
an Eppendorf containing heparin. Blood was centrifuged 5 minutes at 7000 rpm
and treated for 5 minutes at RT with ACK lysis buffer to remove the erythrocytes.
Samples were centrifuged once more and washed in PBS+2%BSA and they were
stained with anti-Vα2/anti-CD4 or anti-CD45.1/anti-CD45.2 antibodies for 20
minutes at 0ºC. Then, cells were washed and analyzed by flow cytometry.
Table 2. Oligonucleotides. Oligonucleotide sequences for mice genotyping.
Allele Oligo 5’ Oligo 3’
Rhog+/+ GGCACAAATGGCACCCAGAGG GAGTTTCCAGGCAAGGGGTGC
Rhog-/- CCTCGTCTTGGAGTTCATTC GAGTTTCCAGGCAAGGGGTGC
1.5 Reagents
This section presents a list of the reagents used in the experiments
43
performed in this thesis.
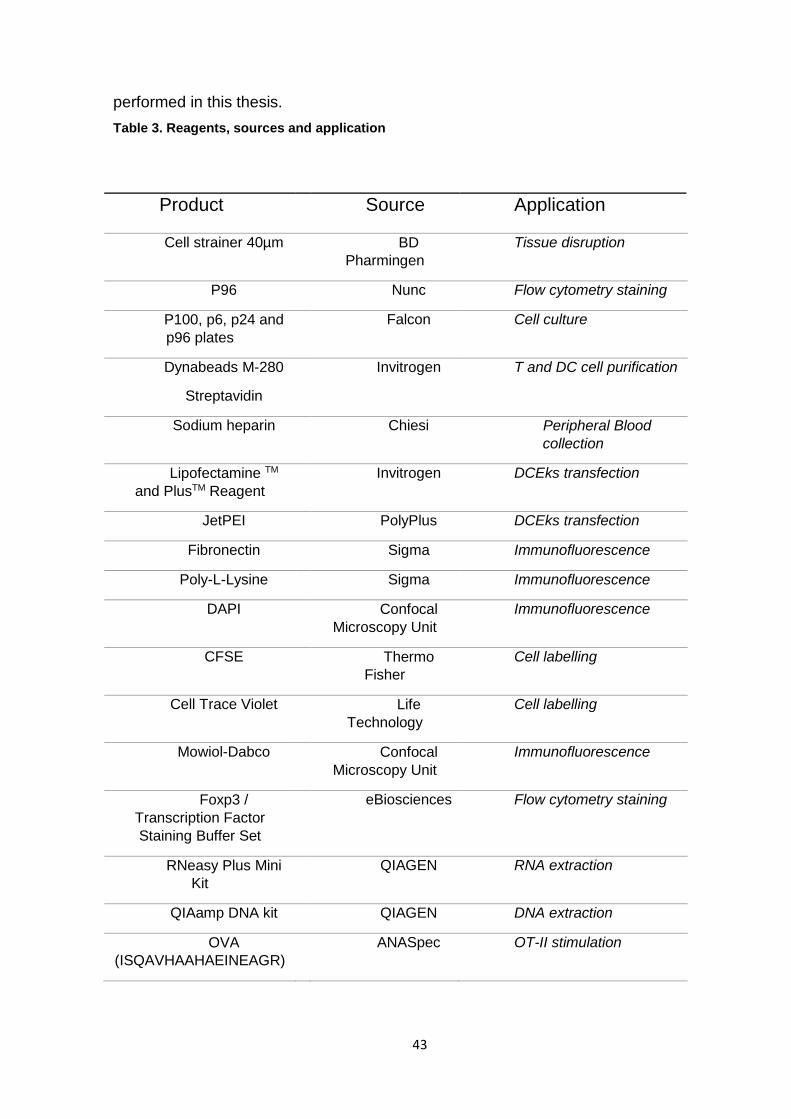
Table 3. Reagents, sources and application
Product Source Application
Cell strainer 40µm BD
Pharmingen
Tissue disruption
P96 Nunc Flow cytometry staining
P100, p6, p24 and
p96 plates
Falcon Cell culture
Dynabeads M-280
Streptavidin
Invitrogen T and DC cell purification
Sodium heparin Chiesi Peripheral Blood
collection
Lipofectamine TM
and PlusTM Reagent
Invitrogen DCEks transfection
JetPEI PolyPlus DCEks transfection
Fibronectin Sigma Immunofluorescence
Poly-L-Lysine Sigma Immunofluorescence
DAPI Confocal
Microscopy Unit
Immunofluorescence
CFSE Thermo
Fisher
Cell labelling
Cell Trace Violet Life
Technology
Cell labelling
Mowiol-Dabco Confocal
Microscopy Unit
Immunofluorescence
Foxp3 /
Transcription Factor
Staining Buffer Set
eBiosciences Flow cytometry staining
RNeasy Plus Mini
Kit
QIAGEN RNA extraction
QIAamp DNA kit QIAGEN DNA extraction
OVA
(ISQAVHAAHAEINEAGR)
ANASpec OT-II stimulation
44
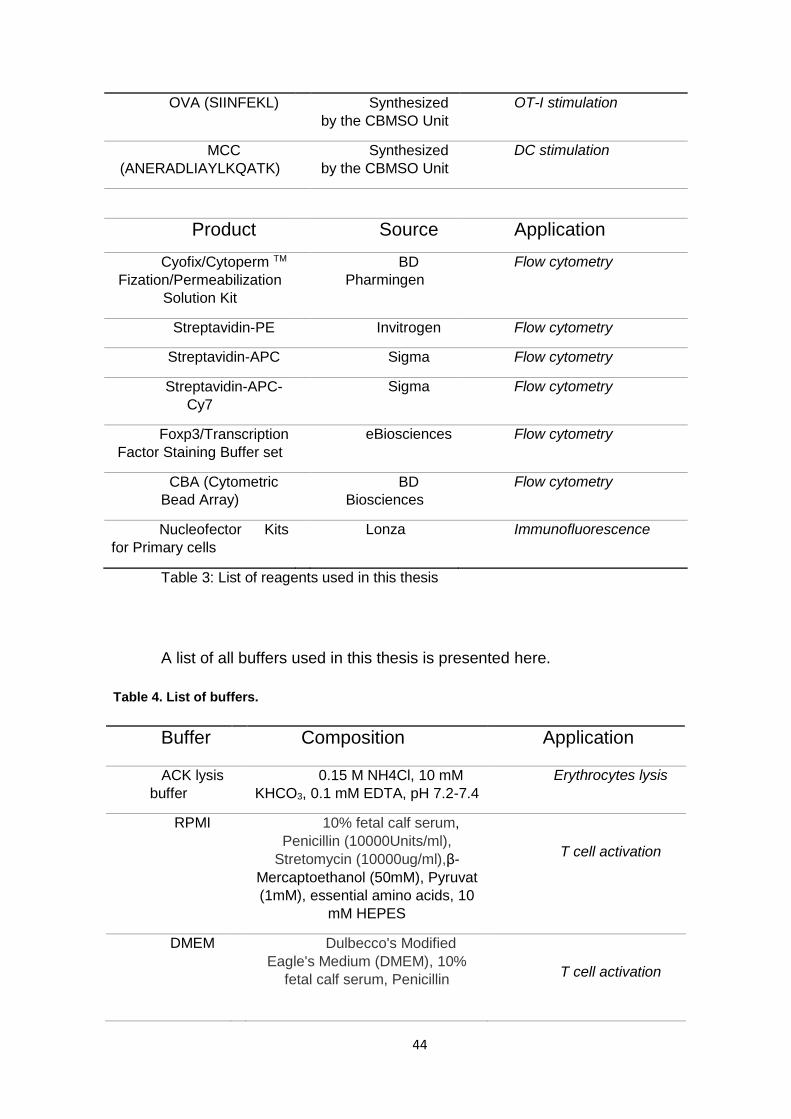
OVA (SIINFEKL) Synthesized
by the CBMSO Unit
OT-I stimulation
MCC
(ANERADLIAYLKQATK)
Synthesized
by the CBMSO Unit
DC stimulation
Product Source Application
Cyofix/Cytoperm TM
Fization/Permeabilization
Solution Kit
BD
Pharmingen
Flow cytometry
Streptavidin-PE Invitrogen Flow cytometry
Streptavidin-APC Sigma Flow cytometry
Streptavidin-APC-
Cy7
Sigma Flow cytometry
Foxp3/Transcription
Factor Staining Buffer set
eBiosciences Flow cytometry
CBA (Cytometric
Bead Array)
BD
Biosciences
Flow cytometry
Nucleofector Kits
for Primary cells
Lonza Immunofluorescence
Table 3: List of reagents used in this thesis
A list of all buffers used in this thesis is presented here.
Table 4. List of buffers.
Buffer Composition Application
ACK lysis
buffer
0.15 M NH4Cl, 10 mM
KHCO3, 0.1 mM EDTA, pH 7.2-7.4
Erythrocytes lysis
RPMI 10% fetal calf serum,
Penicillin (10000Units/ml),
Stretomycin (10000ug/ml),β-
Mercaptoethanol (50mM), Pyruvat
(1mM), essential amino acids, 10
mM HEPES
T cell activation
DMEM Dulbecco's Modified
Eagle's Medium (DMEM), 10%
fetal calf serum, Penicillin
T cell activation
45
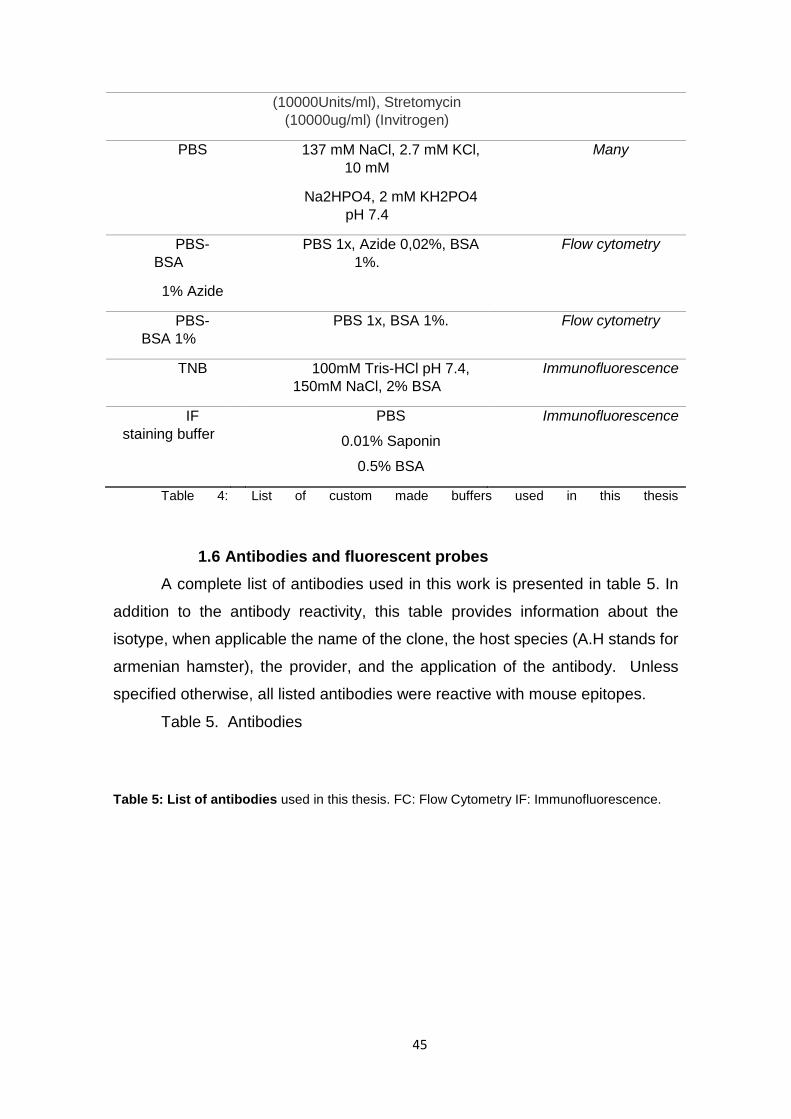
(10000Units/ml), Stretomycin
(10000ug/ml) (Invitrogen)
PBS 137 mM NaCl, 2.7 mM KCl,
10 mM
Na2HPO4, 2 mM KH2PO4
pH 7.4
Many
PBS-
BSA
1% Azide
PBS 1x, Azide 0,02%, BSA
1%.
Flow cytometry
PBS-
BSA 1%
PBS 1x, BSA 1%. Flow cytometry
TNB 100mM Tris-HCl pH 7.4,
150mM NaCl, 2% BSA
Immunofluorescence
IF
staining buffer
PBS
0.01% Saponin
0.5% BSA
Immunofluorescence
Table 4: List of custom made buffers used in this thesis
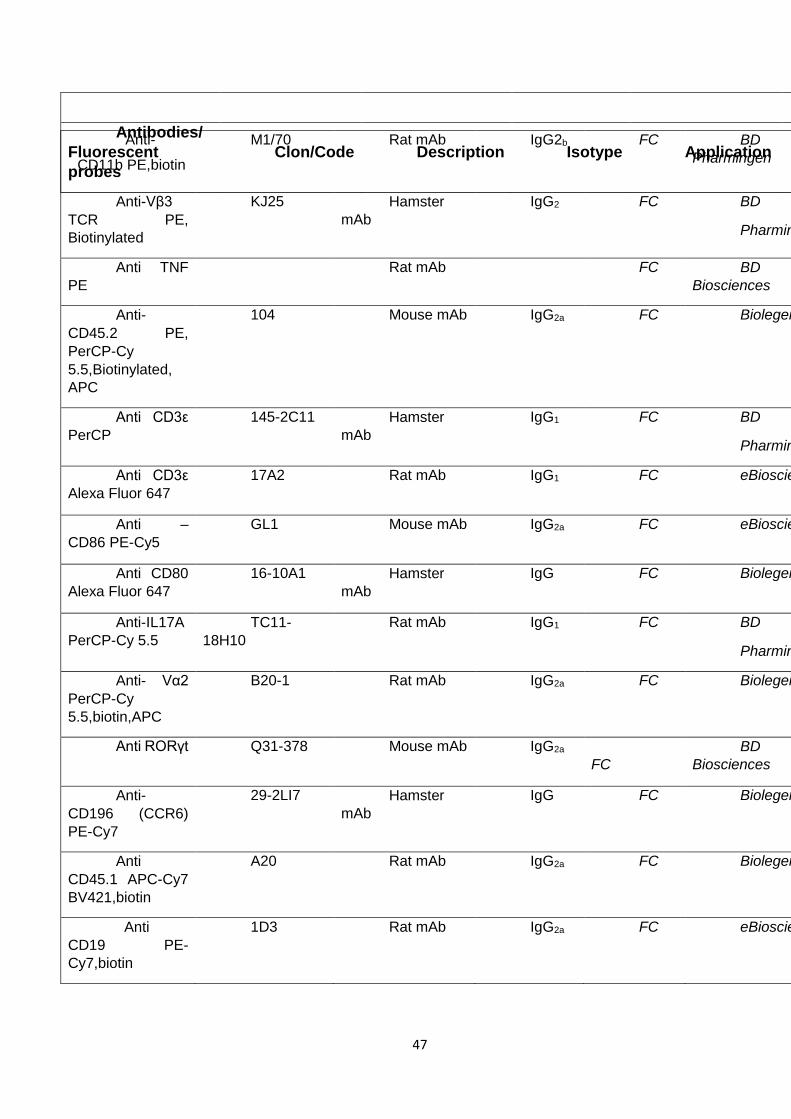
1.6 Antibodies and fluorescent probes
A complete list of antibodies used in this work is presented in table 5. In
addition to the antibody reactivity, this table provides information about the
isotype, when applicable the name of the clone, the host species (A.H stands for
armenian hamster), the provider, and the application of the antibody. Unless
specified otherwise, all listed antibodies were reactive with mouse epitopes.
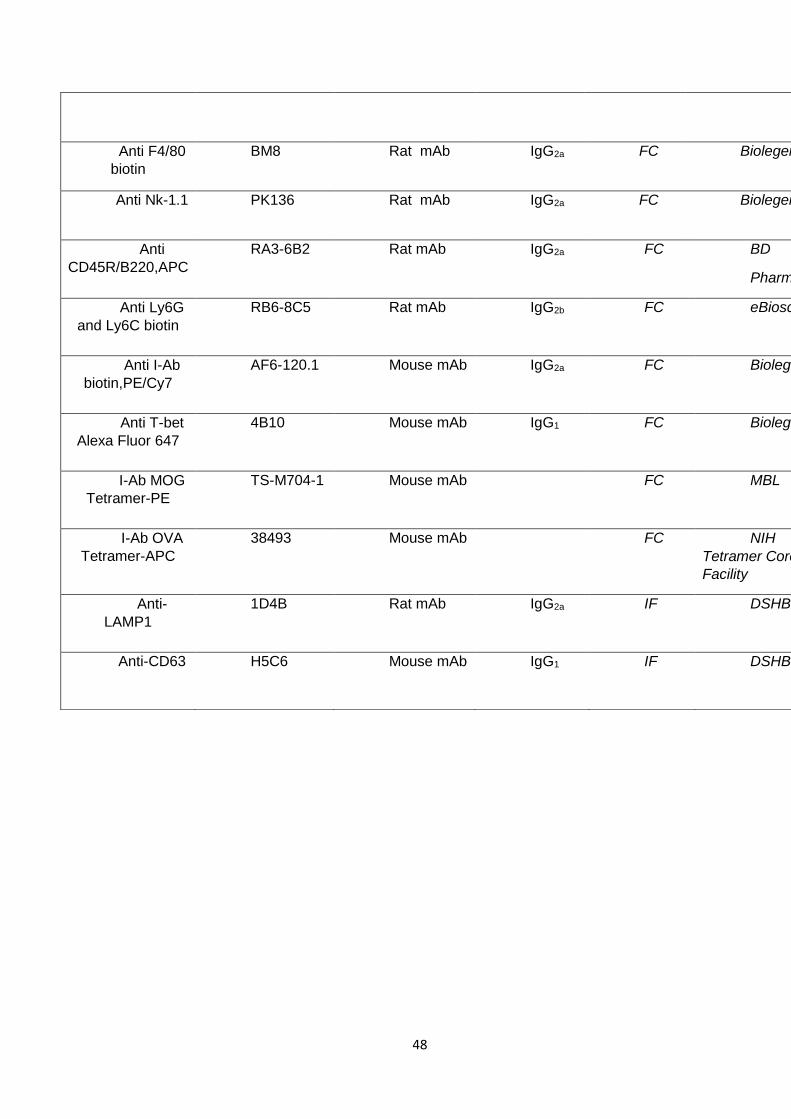
Table 5. Antibodies
Table 5: List of antibodies used in this thesis. FC: Flow Cytometry IF: Immunofluorescence.

46
Antibodies/
Fluorescent
probes
Clon/Code Description Isotype Application Source Use
Anti-CD16/32
purified 2.4G2 Rat mAb IgG2b FC
BD
Pharmingen
1:250
Anti- CD4-647,
FITC, PerCP,
Biotin, BV450
RM4-5
Rat mAb
IgG2a
FC/IF
BD
Pharmingen
1:200
Anti-CD8-
PerCP,Biotin 53-6.7 Rat mAb IgG2a FC
BD
Pharmingen 1:200
Anti-CD11c-
PE, Biotin, APC HL3 Hamster Ab IgG1 FC
BD
Pharmingen 1:200
Anti-CD69
FITC,PE H1.2F3 Hamster Ab IgG1 FC
BD
Pharmingen 1:200
Anti-CD44
FITC
KM81 Rat mAb IgG2a FC ImmunoTools 1:200
Anti-CD44
BV421,APC
IM7 anti-Hu/Mo IgG2b FC Biolegend 1:200
Anti CD62L
FITC,biotin
MEL-14 Rat mAb IgG2a FC BD
Biosciences
1:200
Anti-CD279
(PD-1) FITC
J43 Rat mAb IgG FC Biosciences
1:200
Anti H-2Kk
FITC
36-7-5 Mouse mAb IgG2a FC BD
Pharmingen
1:100
Anti I-Ek
FITC,biotin
17-3-3 Mouse mAb IgG2a FC BD
Pharmingen
1:100
Anti-CD25
FITC, PerCP,
PC61 Rat mAb IgG1 FC Biolegend 1:200
Anti-Gata-3
FITC
TWAJ anti-Hu/Mo IgG1 FC eBiosciences 1:100
Anti-CD152
(CTL4) PE
UC10-
4F10-11
Hamster
mAb
IgG1 FC BD
Biosciences
1:200
Anti-Foxp3 PE NRRF-30 Rat mAb IgG2a FC eBiosciences 1:100
Anti H-2Kb PE AF6-88.5
Mouse mAb IgG2a FC BD
Biosciences
1:100
47
Antibodies/
Fluorescent
probes
Clon/Code Description Isotype Application Source Use Anti-
CD11b PE,biotin
M1/70 Rat mAb IgG2b FC BD
Pharmingen
1:200
Anti-Vβ3
TCR PE,
Biotinylated
KJ25 Hamster
mAb
IgG2 FC BD
Pharmingen
1:200
Anti TNF
PE
Rat mAb FC BD
Biosciences
1:100
Anti-
CD45.2 PE,
PerCP-Cy
5.5,Biotinylated,
APC
104 Mouse mAb IgG2a FC Biolegend
1:200
Anti CD3ε
PerCP
145-2C11 Hamster
mAb
IgG1 FC BD
Pharmingen
1:200
Anti CD3ε
Alexa Fluor 647
17A2 Rat mAb IgG1 FC eBiosciences 1:200
Anti –
CD86 PE-Cy5
GL1 Mouse mAb IgG2a FC eBiosciences 1:200
Anti CD80
Alexa Fluor 647
16-10A1 Hamster
mAb
IgG FC Biolegend
1:200
Anti-IL17A
PerCP-Cy 5.5
TC11-
18H10
Rat mAb IgG1 FC BD
Pharmingen
1:100
Anti- Vα2
PerCP-Cy
5.5,biotin,APC
B20-1 Rat mAb IgG2a FC Biolegend
1:200
Anti RORγt Q31-378 Mouse mAb IgG2a
FC
BD
Biosciences
1:100
Anti-
CD196 (CCR6)
PE-Cy7
29-2LI7 Hamster
mAb
IgG FC Biolegend
1:200
Anti
CD45.1 APC-Cy7
BV421,biotin
A20 Rat mAb IgG2a FC Biolegend
1:200
Anti
CD19 PE-
Cy7,biotin
1D3 Rat mAb IgG2a FC eBiosciences 1:200
48
Anti F4/80
biotin
BM8 Rat mAb IgG2a FC Biolegend
1:200
Anti Nk-1.1 PK136 Rat mAb IgG2a FC Biolegend
1:200
Anti
CD45R/B220,APC
RA3-6B2 Rat mAb IgG2a FC BD
Pharmingen
1:200
Anti Ly6G
and Ly6C biotin
RB6-8C5 Rat mAb IgG2b FC eBiosciences 1:200
Anti I-Ab
biotin,PE/Cy7
AF6-120.1 Mouse mAb IgG2a FC Biolegend
1:200
Anti T-bet
Alexa Fluor 647
4B10 Mouse mAb IgG1 FC Biolegend
1:100
I-Ab MOG
Tetramer-PE
TS-M704-1 Mouse mAb FC MBL 1:100
I-Ab OVA
Tetramer-APC
38493 Mouse mAb FC NIH
Tetramer Core
Facility
1:100
Anti-
LAMP1
1D4B Rat mAb IgG2a IF DSHB 1:100
Anti-CD63 H5C6 Mouse mAb IgG1 IF DSHB 1:100
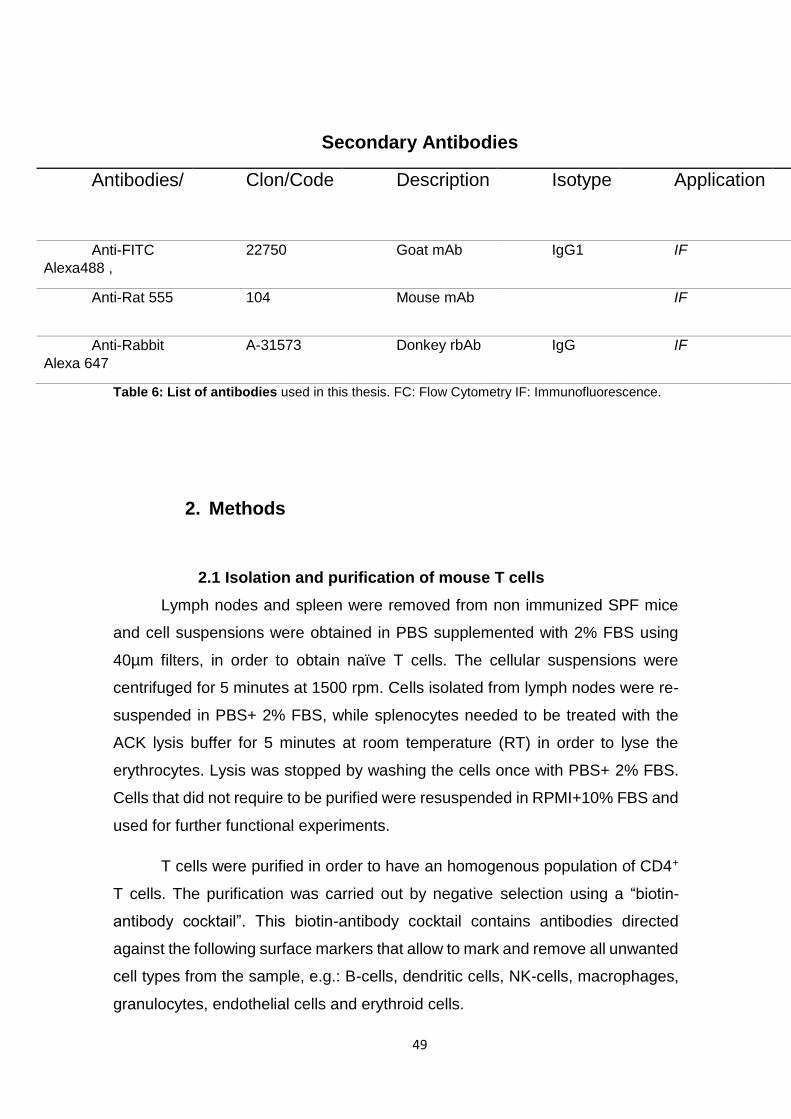
49
Secondary Antibodies
Table 6: List of antibodies used in this thesis. FC: Flow Cytometry IF: Immunofluorescence.
2. Methods
2.1 Isolation and purification of mouse T cells
Lymph nodes and spleen were removed from non immunized SPF mice
and cell suspensions were obtained in PBS supplemented with 2% FBS using
40µm filters, in order to obtain naïve T cells. The cellular suspensions were
centrifuged for 5 minutes at 1500 rpm. Cells isolated from lymph nodes were re-
suspended in PBS+ 2% FBS, while splenocytes needed to be treated with the
ACK lysis buffer for 5 minutes at room temperature (RT) in order to lyse the
erythrocytes. Lysis was stopped by washing the cells once with PBS+ 2% FBS.
Cells that did not require to be purified were resuspended in RPMI+10% FBS and
used for further functional experiments.
T cells were purified in order to have an homogenous population of CD4+
T cells. The purification was carried out by negative selection using a “biotin-
antibody cocktail”. This biotin-antibody cocktail contains antibodies directed
against the following surface markers that allow to mark and remove all unwanted
cell types from the sample, e.g.: B-cells, dendritic cells, NK-cells, macrophages,
granulocytes, endothelial cells and erythroid cells.
Antibodies/
Clon/Code Description Isotype Application Source Use
Anti-FITC
Alexa488 ,
22750 Goat mAb IgG1 IF Rockland
1:300
Anti-Rat 555 104 Mouse mAb IF Invitrogen
1:500
Anti-Rabbit
Alexa 647
A-31573 Donkey rbAb IgG IF Invitrogen
1:500
50
-AND T cell purification: anti-B220, anti-CD11b, anti-CD8, anti-NK1.1, anti-
Gr1, anti- F4/80. This cocktail of biotinylated antibodies allows the removal of B
cells, CD8 T cells, NK cells, granulocytes, monocytes, DC, macrophages and
activated CD4 T cells.
-OT-II T cell purification: anti-B220, anti-CD11b, anti-CD8, anti-NK1.1,
anti-Gr1, anti- F4/80. This cocktail of biotinylated antibodies allows the removal
of B cells, CD8 T cells, NK cells, granulocytes, monocytes, DC, macrophages
and activated CD4 T cells.
-DC cell purification: anti-CD11b and anti-CD11C.
Incubation with the purification cocktail was performed on ice in PBS+ 2% FBS
for 20 minutes at 50x106 cells/ml concentration. Subsequently, cells were washed
and a small aliquot was taken in order to test the purification efficiency.
After incubation with biotin-antibody cocktail, they were incubated with magnetic
beads covered with streptavidin in a 1.5:1 beads:cells ratio in the same volume
used previously for the staining (50x106 cells/ml). The beads were previously
washed in PBS. The cell suspension was incubated with the beads at 4º C for 45
minutes under rotation. After that, beads were removed using a magnet and only
the supernatant was recovered. This step was repeated twice in order to eliminate
all the beads residual, saving the biotinylated stained pellet of cells. The final
cellular suspension was washed and re-suspended in RPMI+ 10% FBS. The
counting represent the last step of purification. We re-suspended the cells at the
concentration of interest. We verify the purification result staining cells taken
before and after incubation with the streptavidin beads:
- AND or OT-II purification: streptavidin (to detect the biotinylated
antibodies) and anti-CD4.
When required, T lymphocytes were isolated by sorting with the FACSAria fusion
after label them with anti-CD4 and anti- Vβ3. These protocols yielded 95-98% pure
T cell populations.

51
1.1 Dendritic cells from Bone Marrow
Femurs and tibiae of female, 4-12 weeks old female were removed and
purified from the surrounding muscle tissue. Thereafter, intact bones were
cleaned in 70% ethanol for disinfection and washed with PBS. Then both ends
were cut with scissors and the marrow flushed with PBS using a syringe with a
0.45 mm diameter needle. Clusters within the marrow suspension were
disintegrated by vigorous pipetting. The principle method for generating BM-DC
with GM-CSF was adapted from previous publications (Inaba et al. 1992),
(Scheicher et al. 1992), (Inaba et al. 1998). Modifications were as follows. Instead
of 24-well plates, bacteriological petri dishes with 150mm diameter were used.
Cell culture medium was RPMI 10% (as shown before). At day 0 BM leukocytes
were seeded at 2x10⁶ per 150mm dish in 10 ml of medium containing 200 U/ml
(= 20ng/ml) of GM-CSF (Peprotech/Tebu). At day 3 another 10 ml of medium
containing 200 U/ml GM-CSF were added to the plates. At day 6 and 8 half of the
culture supernatant was collected, centrifuged, and the pellet re-suspended in 10
ml fresh medium containing 200 U/ml GM-CSF, and given back to the original
plate. At day 10 cells can be used.
2.2 Cell transfection
Lipofectamine System (Lipofectamine TM and PLUS TM Reagent)
DCEK cells are plated at 5x10⁵ cells per well of a p6 (35 mm) with 2 ml of
DMEM medium 10% FBS (see complete medium in Materials and Methods). The
following day we proceed with the transfection; for each well we proceed in this
way:
- Add 2 µg of DNA of interest in 100 ml of DMEM serum-free
- Mix the “PLUS TM Reagent” vial, add 20 µl of this to the DNA vial suspended
previously. Mix and incubate for 15 minutes at RT.
- In another tube we dilute 5 µl of Lipofectamine in 100 µl of DMEM serum-free and
we mix this solution with the previous one containing the DNA previous prepared.
We incubate at RT for 15 minutes.

52
- The medium is removed from the DCEKs cells and 400 µl of serum-free DMEM
was add to the 220 µl of mixing solution DNA- Lipofectamine.
- The plate is maintained for 3h at 37°C.
- At the end, we add 600 µl of DMEM 10% serum.
- Cells are used 48-72h later. Before use them, it is harshly recommended check
the efficiency of the transfection analysing the GFP levels by FACS.
2.3 Genomic DNA extraction for genotyping
For genotyping, genomic DNA was extracted from a small fragment of the
tail cut when the animal was 3-4 weeks old. Tail tissue was digested overnight at
55ºC using a specific buffer detailed in Table 4 and Proteinase K (10µg per
sample). Once digested, 1 volume of phenol:clorophorm:isoamilic alcohol
(25:24:1) was added, vortexed and centrifuged 10 minutes at 10000 rpm at RT.
The aqueous phase (were the DNA is retained) was laid on 1 volume of
phenol:clorophorm (24:1), vortexed and centrifuged for 10 minutes at 10000 rpm.
Finally, the aqueous phase was mixed with 2 volumes of ethanol, allowing
the DNA precipitation. After another centrifugation, the DNA was washed another
time with 500 µl of 70% ethanol. After the last centrifugation, the liquid was
decanted for the removal of ethanol residues allowing the DNA to dry. DNA was
re-suspended in 50µl of sterile water for its further usage in a PCR reaction.
2.4 Cell labelling
Single cell suspensions of T cells were incubated for 5 minutes at 37°C in
PBS supplemented with 2 μM Cell Trace Violet CTV or 1μM
Carboxifluoresceinsuccinimidil ester CFSE. Labelled cell were washed twice in
complete medium and kept at 37°until further utilisation.
2.5 Functional assays
53
a) T cell – T cell co-cultures
CD4+ T cells were purified from Lymph nodes and were incubated with DC
ON. T cell purity was measured by flow cytometry. The day after, we sorted the
population of T cells from DC cells and T cells were cultured together for six days
with a new pool of CD4+ naive T cells in complete RPMI medium at a density of
0,3x10⁶ cells/mL, and distributed into 96 well plates (200µL per well) or at a
density of 5x10⁶ cells/mL distributed into 12 well plates (4mL per well); in order
to distinguish the different pool of T cells, we labelled one of them with CTV or
CFSE, in some experiments we used CD4+ T cells from AND WT mice that
express CD45.2 and AND WT mice that express both CD45.2-1 alleles. After this
period of time, cells were stained with various surface markers and analysed by
flow cytometry.
b) Bone marrow chimera
Animals were transferred into acidified water one week before the
beginning of the procedure. They were lethally irradiated using 10 Gy, and
injected intravenously 24h later with 5-10.106 donor bone marrow cells (see
section 2.2 for dendritic cells from bone marrow extraction protocol). Mixed bone
marrow were generated by injecting either a mixture of 80% of CDε -/- mice with
20% of "genotype of interest" AND WT and KO for RhoG.
Mice were kept with acidic water up to 2 weeks after irradiation to prevent
the development of any kind of infections. Animals were bled after 5 weeks to
check the reconstitution efficiency. They were used for further experimentation 8
to 10 weeks after adoptive transfer.
c) Experimental autoimmune encephalomyelitis
Chronic EAE was induced in female C57BL/6 mice (6 to 8 weeks old; 20
g body weight) by subcutaneously injecting a total of 150 µg of MOG 35-55

54
(Espikem) emulsified in Freud’s complete adjuvant (Sigma-Aldrich) and
supplemented with Mycobacterium tuberculosis (1mg/ml) (H37Ra strain from
Difco) into both femoral regions. The mice were immediately injected
intraperitoneal with 200 ng of pertussis toxin (Sigma-Aldrich) and, again, 48h
hours after immunization. Mice were examined daily for clinical signs of disease,
which were scored as follows: 0, no symptoms; 1, limp tail; 2, weakness of hind
legs; 3, complete paralysis of hind legs; 4, complete hind leg and partial front leg
paralysis; 5, moribund state (Choi et al. 2015).
d) MVA-OVA Virus
11- old mice were infected with 3 different doses 1x10⁶ , 0.1x10⁶ and
0.01x10⁶ PFU (Plaque Forming Unit) of Modified Vaccinia Virus Ankara in 50 µl
of PBS by intraperitoneal injection. 7 days after infection, mixed lymph nodes
were harvested, processed and analysed by flow cytometry, after stimulate the
cells with PMA- ionomycin.
2.6 Flow Cytometry
Flow cytometry staining were performed using p96 V-bottom. Each well
contained 2-5x10⁵ cells and all procedures were carried out at 0ºC using a
staining buffer of PBS+ 1% BSA+ 0.02% azide. For all flow cytometry staining,
cells were incubated with anti-CD16/32 in the staining buffer in a final volume of
50ml per well for 20 minutes. This allows to block binding of antibodies to Fc
receptors expressed by immune cells. After the first incubation, the plate was
centrifuged for 2 minutes at 1500 rpm, the supernatant was discarded and cells
were washed with the PBS+1%BSA buffer. Antibody cocktails were added to the
samples and cells were incubated on ice for further 30 minutes. If the primary
antibodies were not directly labelled with a fluorophore, staining with a secondary
antibody or with fluorescent streptavidin during 15 minutes at the dilution required
was carried out. Cells were washed once and re-suspended in a final volume of
200ml to analyse the samples by flow cytometry. Flow cytometry experiments
55
were performed using either a BD FACS Canto, Becton, Dickinson and Company.
Samples were acquired using BD FACS Canto, Becton, Dickinson and Company.
All flow cytometry data analyses were performed using Flow Jo (Tree Star Inc,
USA) software.
2.6.1 Intracellular Cytokine Staining
Cells obtained from in vitro cultures were incubated for 6 h with phorbol
12-myristate 13-acetate (50 ng/mL; Sigma) and Ionomycin (500 ng/mL; Sigma)
with Brefeldin A (2 μg/mL; Sigma) added after 2 h. Cell surfaces were stained
with the appropriate fluorescence-labeled antibodies. After surface staining, cells
were washed and re-suspended in Permeabilization-Fixation solution (BD
Cytofix/Cytoperm kit; BD Pharmingen), and intracellular cytokine staining was
performed with appropriate fluorescence-labeled antibodies (eBioscience)
according to manufacturer's protocol.
2.6.2 Interleukin measurement
In order to have information regarding the cytokines released by the kit
contains reagents to measure IL-2, IL-4, IL-6, IL-10, IL-17A, IFN-γ, and TNF.
Many of these cytokines are multifunctional and are involved in proliferation IL-2
and regulation IL-10 of multiple T-cell differentiation pathways.
2.6.3 Proliferation assay
In order to measure the proliferation and T cells in our cultures after 72-96
hours of stimulation, cells were previously stained with CTV or CFSE. To do that,
after cellular purification cells were counted and re-suspended in a 50ml-Falcon
tube in RPMI 20mM Hepes at 6-10x106 cells/ml. Cells were incubated 10 minutes
at 37ºC in order to get tempered. Subsequently, cells were vortexed while CTV
or CFSE was being slowly added at a 5 µM final concentration (1:1000 dilution)
and incubated for 5-10 minutes at 37ºC protected from light. To stop the reaction
RPMI 20%FBS was added and cells were washed twice using complete RPMI
medium. After that, cells were counted and cultured as explained above (Methods
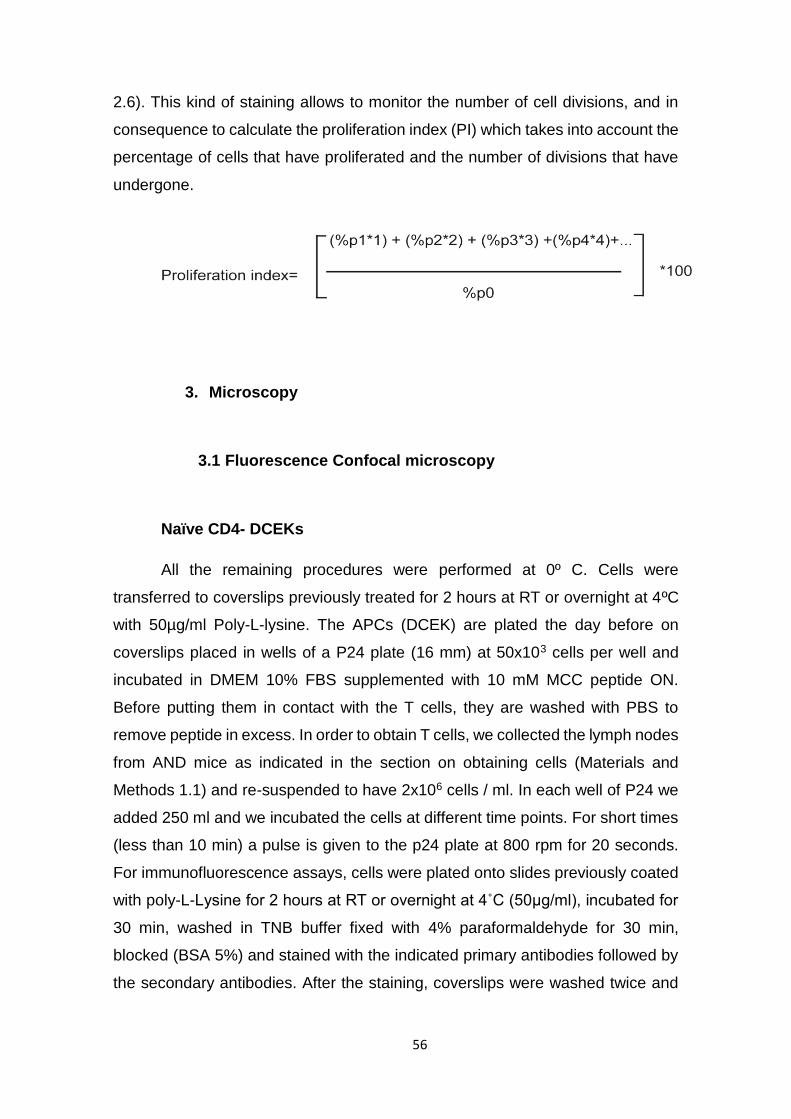
56
2.6). This kind of staining allows to monitor the number of cell divisions, and in
consequence to calculate the proliferation index (PI) which takes into account the
percentage of cells that have proliferated and the number of divisions that have
undergone.
3. Microscopy
3.1 Fluorescence Confocal microscopy
Naïve CD4- DCEKs
All the remaining procedures were performed at 0º C. Cells were
transferred to coverslips previously treated for 2 hours at RT or overnight at 4ºC
with 50µg/ml Poly-L-lysine. The APCs (DCEK) are plated the day before on
coverslips placed in wells of a P24 plate (16 mm) at 50x103 cells per well and
incubated in DMEM 10% FBS supplemented with 10 mM MCC peptide ON.
Before putting them in contact with the T cells, they are washed with PBS to
remove peptide in excess. In order to obtain T cells, we collected the lymph nodes
from AND mice as indicated in the section on obtaining cells (Materials and
Methods 1.1) and re-suspended to have 2x10⁶ cells / ml. In each well of P24 we
added 250 ml and we incubated the cells at different time points. For short times
(less than 10 min) a pulse is given to the p24 plate at 800 rpm for 20 seconds.
For immunofluorescence assays, cells were plated onto slides previously coated
with poly-L-Lysine for 2 hours at RT or overnight at 4˚C (50μg/ml), incubated for
30 min, washed in TNB buffer fixed with 4% paraformaldehyde for 30 min,
blocked (BSA 5%) and stained with the indicated primary antibodies followed by
the secondary antibodies. After the staining, coverslips were washed twice and
57
fixed onto glass slides with Mowiol. The samples were left dried at RT for 24
hours and stored at 4º C afterwards.
The antibodies used through this thesis for immune-fluorescence were:
3.2 Acquisition
Confocal imaging was performed with a Zeiss LSM 780 microscope with
a plan apochromat 20X, NA 0.8 objective for tissue sections or a plan apochromat
63X, NA 1.40 objective for other applications. Images were analysed with Imaris
(Bitplane) and ImageJ (NIH) softwares.
3.3 High-resolution light microscopy ELYRA: SIM-
Superresolution structured illumination
Structured Illumination microscopy was performed on an Elyra PS.1
microscope (Carl Zeiss) using 488-nm and 640-nm laser excitation and a
63×/1.40 Plan Apochromat oil-immersion objective (Zeiss). Two-colour alignment
was performed after each experiment day using a multicolour bead sample
(Zeiss) and the channel alignment function in the Zen software (Zeiss). Images
were reconstructed in the Zen software using a theoretical point-spread function
and a noise filter setting of –4.0 for both channels, which gave a good
compromise between resolution and signal to noise ratio of the reconstructed
images. Under these conditions, the lateral resolution was found to be 150 nm
using 40-nm green fluorescent beads.
3.4 Imagestream X Mark II Imaging Flow Cytometer
The acquisition experiment with DCEks transfected with I-Ek GFP and
CD4+ T cells has also been performed using this technique combines the speed,

58
sensitivity, and phenotyping abilities of flow cytometry with the detailed imagery
and functional insights of microscopy. This represent a descriptive data
confirming our previous results regarding the ability of T cells to acquire MHC and
co-stimulatory molecules as CD80.
3.5 Measurement of mRNA levels and Real-time q-PCR
Naïve or activated T cells were obtained from culture and after sorting
them, mRNA was extracted using the RNeasy system (Cat. 74104, Quiagen)
following manufacturer’s instructions and quantified in a NanoDrop (ND 1000)
spectrophotometer. 50-100 ng of total RNA were retro-transcribed to cDNA using
SuperScript III reverse transcriptase and random primers (Invitrogen). cDNA
were stored at -20˚until use. For real-time quantitative PCR (RT-qPCR),
LightCycler 480 SYBR Green I Master Mix was used following the instructions
provided by the manufacturers. Quantitative real-time PCR was performed in
triplicate and all quantifications were normalized to GADPH and the ribosomal
18S gene to account for the variability in the initial concentration of RNA and in
the conversion efficiency of the reverse transcription (∆CT). The qPCR reaction
was performed using the ABI 7300 Real Time PCR System and the results were
analysed using the SDS2.4 software. Obtained cycle threshold (Ct) values were
used to calculate mRNA levels relative to HPRT and GAPDH expression using
the 2-ΔΔCt method.
Oligonucleotides
Gene Forward Reverse
Tbet CTGGAGCCCACAAGCCATTA CCCCTTGTTGTTGGTGAGCT
Gata3 GCAACCTCTACCCCACTGTG CCCATTAGCGTTCCTCCTCC
IL6 TTGGGACTGATGCTGGTGAC CAAGTGCATCATCGTTGTTCA
IL5 GGCTTCCTGTCCCTACTCAT ATAGCATTTCCACAGTACCCC
IL13 GTATGGAGTGTGGACCTGGC CTTGCGGTTACAGAGGCCAT

59
IL17A ACATGAGTCCAGGGAGAGCT TGCGCCAAGGGAGTTAAAGA
IL17F CATGAAGTGCACCCGTGAAA AGCGGTTCTGGAATTCACGT
IL10 CCTGGTAGAAGTGATGCCCC GCTCCACTGCCTTGCTCTTA
IL21 TCAGAAGGCCAAACTCAAGC TCATACGAATCACAGGAAGGGC
TGB1 CGTCAGACATTCGGGAAGCA TGCCGTACAACTCCAGTGAC
FOXP3 GCCAAGCAGATCATCTCCTG CACAGATGGAGCCTTGGCC
BCL6 CGAAGCAGCAGTGAGAGTCA TCGTTGCAGAAGAAGGTCCC
TOB1 CTCGTGTAAGCTTGCCGTC ATCCTTCAACCTTCCCGTGG
IKZF4 GGATGAACGGCTCCTGGATA GAGGCACCACACTGATTACA
PYDC3 TGCTCACTCACTCACTGCTT AGGTCATGGTTCAGTAAGGAC
BCL3 ATAGCCGCTGTCTACCGAAT CATGCCAGGTGAATTGCAGT
NFKB2 TATGCCATTGTGTTCCGGAC TCCTCTGCACTTCCTCCTTG
Table 7. List of primers used for qRT-PCR
4. Electron microscopy
Purified naïve CD4+ T cells were cultured for two hours in the
presence of DCEKs as APCs (as described in 2.8.1) ; T cells GFP+, were sorted
with the help of the staff of the Flow cytometry unit at the CBMSO on a BD
FACSARIA Fusion (Becton Dickinson) and then the samples were transported to
the Electron Microscopy Unit for further processing. As a control, naïve CD4 T
cells purified from Lymph nodes were also added to the analysis.
4.1 Pre-embedding Immunoelectron Microscopy IEM of T cells
Processing of cells for TEM and imaging was performed by Dr.Maite
Reyes from the Electron Microscopy Unit at the CBMSO. Sample were initially
fixed with PFA 2%, for 20-30 min in PBS at room temperature and centrifuged at
12.000 rpm for four minutes. CD4+ GFP+ cells were incubate with Ab anti-IEk biotin
in PBS + 1% BSA for 30 min RT and afterwards with gold particles PAG of 15 nm
1.50 in a volume of 200 µl. A further step of fixation with 500 mL of 4% PFA + 2%

60
GT BP 0.1M pH 7.4 for two hours has been performed. The pellet obtained,
embedded in gelatin matrix was then cut in little cubes in order to proceed with
Epon embedding. Blocks were sectioned (UC6 ultramicrotome; Leica), picked up
on Formvar®-coated slot grids and post-stained with lead citrate. Sections were
imaged using a transmission electron microscope (TEM).
5. Statistical Analysis
Statistical parameters including the exact value of n with the description of
what n represents, the mean, the SEM and the p value are reported in the Figures
and the Figure Legends. Statistical analyses were performed using Prism
(GraphPad Software) with the version 7.0 for Windows, two-tailed t test (95%
confidence interval), p values < 0.05 were considered significant. In figures,
asterisks stand for: *, p<0.05,** p<0.01, ***, p<0.001, ****,<0.0001.

61
OBJECTIVES

62
Objectives
While the role of dendritic cells and other “professional” APCs in antigen
presentation has been extensively studied, the role of T cells in antigen
presentation has been considered as negligible and remains less understood.
Other groups and ours have gained evidence that T cells take up MHC/antigen
complexes from professional APCs. The objectives of this thesis aim to
interrogate the relevance of pMHC complexes by T cells and whether such
activity of APCs has a distinctive role during the response to antigens.
Specifically the objectives of this work are:
1. To characterize the acquisition of p MHC from antigen loaded professional
APCs by cognate T lymphocytes
2. To unveil the capacity of T cells to act as “T cells APCs”.
3. To characterize the effector cell fate of CD4+T cells stimulated by
professional APCs vs. T-APCs.
4. To determine the functional consequences of T-T antigen presentation in
vivo

63
Objetivos
Mientras que el papel de las células dendríticas y otras APCs
"profesionales" en la presentación del antígeno se ha estudiado ampliamente, el
papel de las células T en la presentación del antígeno se ha considerado
insignificante y sigue siendo menos conocido. Otros grupos y el nuestro han
obtenido evidencia de que las células T toman complejos MHC / antígeno de
APCs profesionales. Los objetivos de esta tesis apuntan a interrogar la
relevancia de los complejos pMHC por las células T y si dicha actividad de APC
tiene un papel distintivo durante la respuesta a los antígenos.
Específicamente los objetivos de este trabajo son:
1. Caracterizar la adquisición de p MHC a partir de APC profesionales
cargadas de antígeno mediante linfocitos T cognado
2. Desvelar la capacidad de las células T para actuar como "Células T
APC".
3. Caracterizar el destino de la célula efectora de células T CD4 +
estimuladas por APCs profesionales frente a T-APCs.
4. Determinar las consecuencias funcionales de la presentación del
antígeno T-T en vivo

64
RESULTS

65
Part 1

66
T cells acquire MHC- I/II and co-
stimulatory molecules by Trogocytosis.
As briefly mentioned in the introduction, a classical way of T cell activation
involves the professional APCs that have the ability to engulf, proteolytically
process and present antigens on their cell surface to T cells. T cells interact with
APCs and scan their surface searching for the cognate peptide and subsequently
swarm and arrest on DC (Hugues et al. 2004). Activation occurs when a T cell
detects the presence of its cognate antigen, loaded on the MHC of the APC,
which subsequently triggers several intracellular signalling cascades. In addition
to T cell activation, the contact of T cells with its cognate pMHC in the
immunological synapse, there is a transfer of pMHC from the APC to the T cell.
This process has been firmly established both in vitro and in vivo (Huang et al.
1999) although the physiological role for this debated phenomenon is still unclear
and under investigation. We became interested in understanding the significance
of this acquisition and we found that T cells, quite surprisingly, express it on their
plasma membrane and they are also able to activate other T cells.
1.1 TC21 and RhoG mediate Trogocytosis.
Once the TCR has been engaged at the IS, it becomes internalized. It was
previously described in our laboratory that TCR internalization is mediated by
trogocytosis and identified TC21 and RhoG as key players. TC21, a RRas
subfamily of GTPases, is constitutively associated with the TCR and is necessary
for the internalization by a clathrin-independent mechanism but is dependent on
the small GTPase, RhoG previously associated with phagocytosis (Martinez-
Martin et al. 2011). The inhibition of material uptake from APC, together with a
decrease in the re-expression of this material on the membrane of cells from mice
lacking TC21 and RhoG, describe the implications of these two proteins in the
process of trogocyosis (Martinez-Martin et al. 2011).
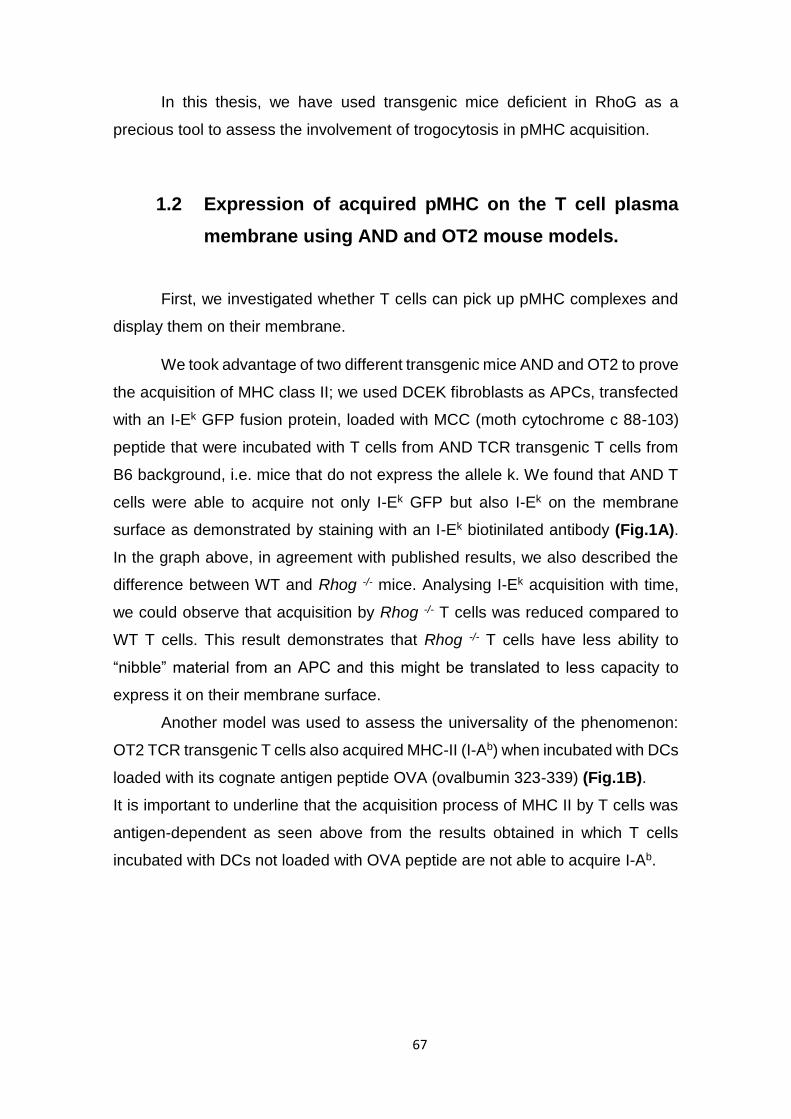
67
In this thesis, we have used transgenic mice deficient in RhoG as a
precious tool to assess the involvement of trogocytosis in pMHC acquisition.
1.2 Expression of acquired pMHC on the T cell plasma
membrane using AND and OT2 mouse models.
First, we investigated whether T cells can pick up pMHC complexes and
display them on their membrane.
We took advantage of two different transgenic mice AND and OT2 to prove
the acquisition of MHC class II; we used DCEK fibroblasts as APCs, transfected
with an I-Ek GFP fusion protein, loaded with MCC (moth cytochrome c 88-103)
peptide that were incubated with T cells from AND TCR transgenic T cells from
B6 background, i.e. mice that do not express the allele k. We found that AND T
cells were able to acquire not only I-Ek GFP but also I-Ek on the membrane
surface as demonstrated by staining with an I-Ek biotinilated antibody (Fig.1A).
In the graph above, in agreement with published results, we also described the
difference between WT and Rhog -/- mice. Analysing I-Ek acquisition with time,
we could observe that acquisition by Rhog -/- T cells was reduced compared to
WT T cells. This result demonstrates that Rhog -/- T cells have less ability to
“nibble” material from an APC and this might be translated to less capacity to
express it on their membrane surface.
Another model was used to assess the universality of the phenomenon:
OT2 TCR transgenic T cells also acquired MHC-II (I-Ab) when incubated with DCs
loaded with its cognate antigen peptide OVA (ovalbumin 323-339) (Fig.1B).
It is important to underline that the acquisition process of MHC II by T cells was
antigen-dependent as seen above from the results obtained in which T cells
incubated with DCs not loaded with OVA peptide are not able to acquire I-Ab.
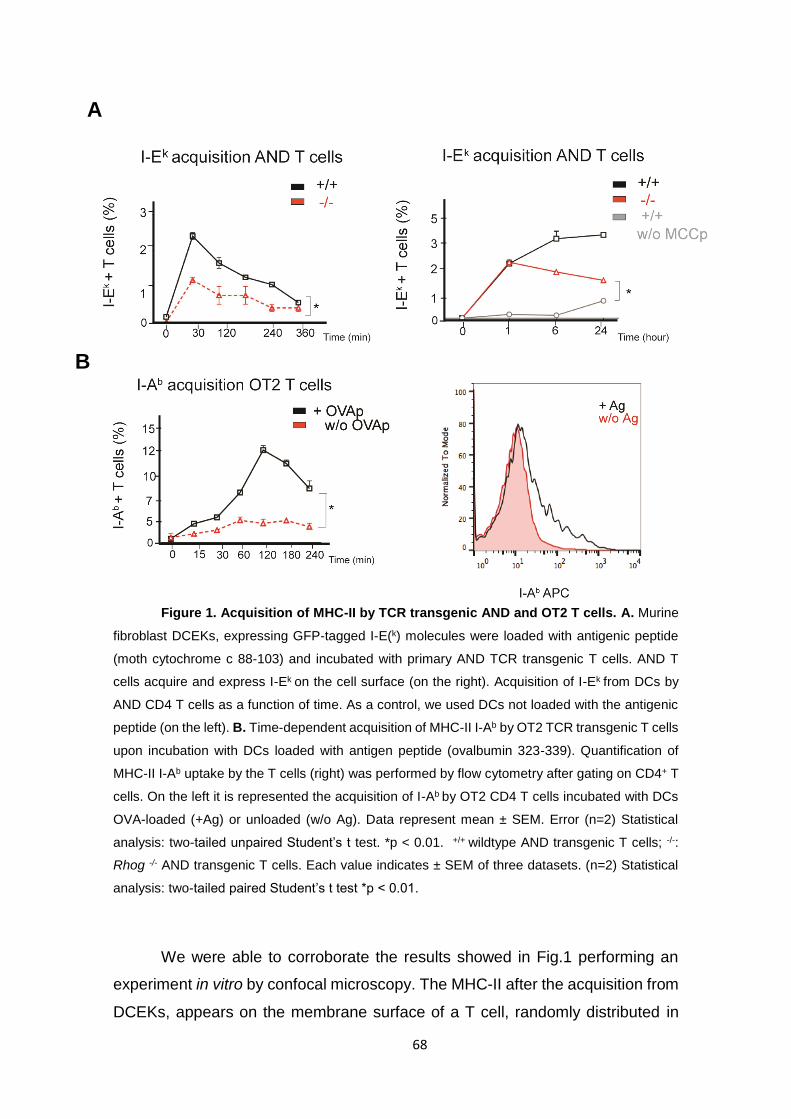
68
Figure 1. Acquisition of MHC-II by TCR transgenic AND and OT2 T cells. A. Murine
fibroblast DCEKs, expressing GFP-tagged I-E(k) molecules were loaded with antigenic peptide
(moth cytochrome c 88-103) and incubated with primary AND TCR transgenic T cells. AND T
cells acquire and express I-Ek on the cell surface (on the right). Acquisition of I-Ek from DCs by
AND CD4 T cells as a function of time. As a control, we used DCs not loaded with the antigenic
peptide (on the left). B. Time-dependent acquisition of MHC-II I-Ab by OT2 TCR transgenic T cells
upon incubation with DCs loaded with antigen peptide (ovalbumin 323-339). Quantification of
MHC-II I-Ab uptake by the T cells (right) was performed by flow cytometry after gating on CD4+ T
cells. On the left it is represented the acquisition of I-Ab by OT2 CD4 T cells incubated with DCs
OVA-loaded (+Ag) or unloaded (w/o Ag). Data represent mean ± SEM. Error (n=2) Statistical
analysis: two-tailed unpaired Student’s t test. *p < 0.01. +/+ wildtype AND transgenic T cells; -/-:
Rhog -/- AND transgenic T cells. Each value indicates ± SEM of three datasets. (n=2) Statistical
analysis: two-tailed paired Student’s t test *p < 0.01.
We were able to corroborate the results showed in Fig.1 performing an
experiment in vitro by confocal microscopy. The MHC-II after the acquisition from
DCEKs, appears on the membrane surface of a T cell, randomly distributed in
A
B
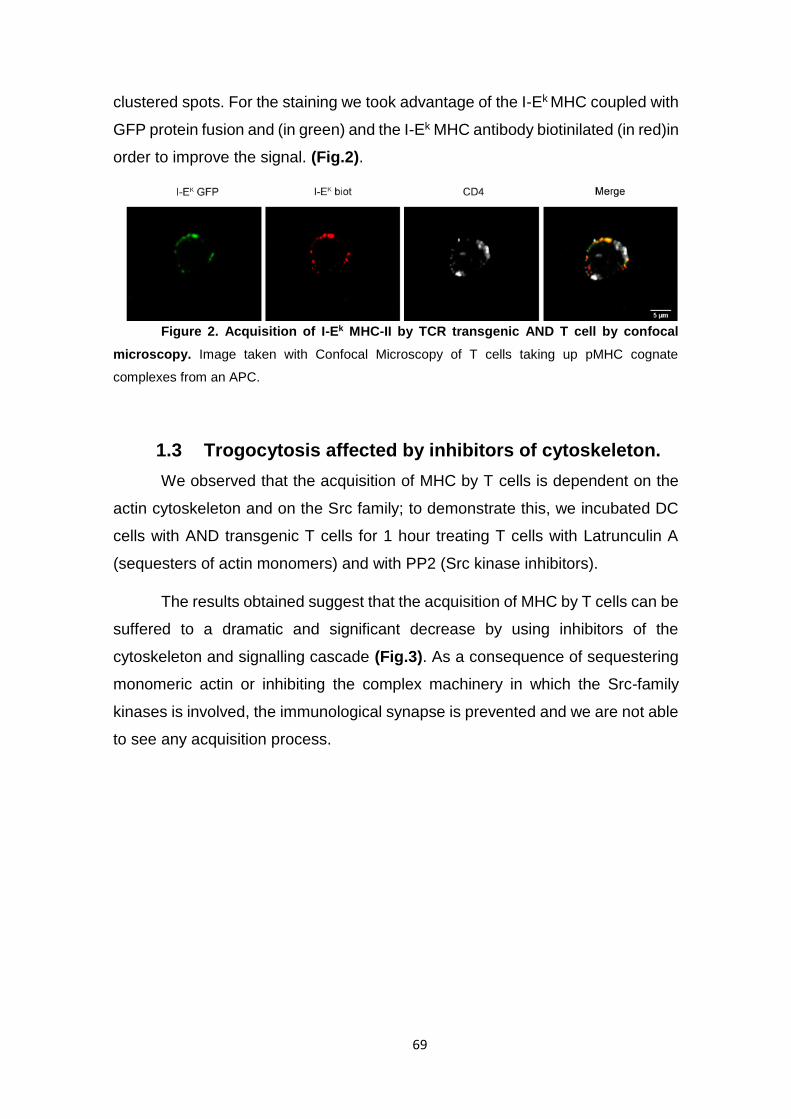
69
clustered spots. For the staining we took advantage of the I-Ek MHC coupled with
GFP protein fusion and (in green) and the I-Ek MHC antibody biotinilated (in red)in
order to improve the signal. (Fig.2).
Figure 2. Acquisition of I-Ek MHC-II by TCR transgenic AND T cell by confocal
microscopy. Image taken with Confocal Microscopy of T cells taking up pMHC cognate
complexes from an APC.
1.3 Trogocytosis affected by inhibitors of cytoskeleton.
We observed that the acquisition of MHC by T cells is dependent on the
actin cytoskeleton and on the Src family; to demonstrate this, we incubated DC
cells with AND transgenic T cells for 1 hour treating T cells with Latrunculin A
(sequesters of actin monomers) and with PP2 (Src kinase inhibitors).
The results obtained suggest that the acquisition of MHC by T cells can be
suffered to a dramatic and significant decrease by using inhibitors of the
cytoskeleton and signalling cascade (Fig.3). As a consequence of sequestering
monomeric actin or inhibiting the complex machinery in which the Src-family
kinases is involved, the immunological synapse is prevented and we are not able
to see any acquisition process.
A
B

70
Figure 3. Acquisition of I-Ek MHC-II from DCs to T cells is actin cytoskeleton and
Src signalling dependent. Two-colour histograms showing the percentage of the acquisition of
MHC-II after gating on CD4+ Vβ3+ cells corresponding in order to the chart shown below. B) Bar
charts show the percentage of CD4+ from AND transgenic mice with bb haplotype incubated for
1h with DCs; CD4+ T cells were previously pre-treated with Latrunculin A at 20μg and with PP2 at
20Μm for 30 min and then incubated with DCs loaded with antigenic peptide specific for AND
transgenic mice. As a control, DCs unloaded were used. Each value indicate ± SEM of three
datasets. (n=2) Statistical analysis: two-tailed unpaired Student’s t test. *p < 0.01.
1.4 Expression of acquired pMHC- peptide OVA on the T
cell’s plasma membrane.
To determine whether T cells do acquire and express not only MHC but
pMHC as well, we incubated H-2kb (MHC-I) –restricted OT1 TCR transgenic T
cells with DCs loaded with the peptide OVA257-264 (SIINFEKL). The H-2kb /OVA
257-264 complex is recognized by the specific antibody 25D1.16. We could observe
that OT1 T cells acquire and express pMHC complexes and more importantly
that this process was RhoG dependent. (Fig.4).

71
Figure 4. Acquisition of H-2kb (MHC-I)/OVA peptide by TCR transgenic OT1 T cells.
Acquisition of Ag/MHC-I complexes by TCR transgenic OT1 T cells quantified at the times
indicated (bottom) upon incubation with DCs loaded with antigen peptide (ovalbumin 257-264). +/+
wildtype AND transgenic T cells; -/-: Rhog -/- AND transgenic T cells. Data represent mean ± SEM.
(n=2) Statistical analysis: two-tailed paired Student’s t test. ****p < 0.0001.
This result shows an important detail of the acquisition process: T cells are
able to acquire not only the H-2kb MHC-I itself but the H-2kb MHC-I coupled with
the specific antigenic peptide OVA.
1.5 Acquisition of co-stimulatory molecule.
When a T cell interacts with an APC, in order for full T cell activation to
occur, there must be both ligation of the TCR by MHC peptide complexes (signal
1) and ligation of CD28 on the T cell by the B7 molecules, CD80 or CD86 on the
APC (signal 2). If signal 1 occurs in the absence of signal 2, T cell anergy or
apoptosis may occur (Chen and Flies 2013). T cells do not express CD80 or
CD86, however, we were also able to witness the transmission of CD80 from DCs
to T cells. The same result was obtained also by confocal microscopy, confirming
the acquisition of CD80 co-stimulatory molecule by its presence on the
membrane surface (Fig.5A).
Furthermore, we were also able to detect the acquisition of CD86, the
second ligand for CD28 that seems indispensable for the activation of naïve T
cells and is expressed on antigen presenting cells by T cells (Fig.5B).

72
This phenomenon occurs in a time-dependent manner from 30 minutes
until 4 hours; in this experiment we could also confirm the RhoG dependence for
CD86 acquisition. We observed that in addition to MHC-peptide complexes,
CD86 is efficiently transferred to the T cells. Thus, this transfer is not limited to
just MHC-peptide but includes other ligands of receptors important for T cell
activation, suggesting a functional relevance.
Figure 5. Acquisition of CD80 and CD86, co-stimulatory molecules, by T
cells. A. by TCR transgenic OT 1 T cells showed a difference when we compare the condition
of DCs OVA-loaded (+Ag) or unloaded (w/o Ag). Data represent mean ± SEM. (n=2). Two-tailed
paired Student’s t test. *p < 0.01. B. Time-dependent acquisition of CD86 by AND TCR transgenic
T cells. On the left it is shown the difference in the acquisition at 24h calculated according to the
mean fluorescence intensity of CD86 antibody. As a control, unloaded DCs were used (Ctrl in
grey). +/+ WT AND transgenic T cells; -/-: Rhog -/- AND transgenic T cells. Each value indicate ±
SEM of three datasets. (n=2) Statistical analysis: two-tailed paired Student’s t test. *p < 0.01.
B
A
CD4 I-Ek MHC CD80

73
1.6 Acquisition of pMHC revealed by Confocal
Microscopy and Electron Microscopy.
Once we demonstrated there is pMHC transfer from the APCs to the T
cell, we aimed to characterize how the process took place by looking at where
the MHC complexes are localised focusing on the intracellular trafficking. In DCs,
unlike in other APCs, formation and transport to the cell surface of MHC-II peptide
complexes is induced by maturation. In immature DCs, most MHC-II are retained
in late endosomal and lysosome compartments whereas in mature DCs, almost
all MHC-II molecules are found at the cell surface(Thery and Amigorena 2001).
Intracellularly, we performed several experiments using DCEKs expressing GFP-
tagged I-Ek molecules and loaded with antigen peptide MCC to present it to
primary AND TCR transgenic CD4+ T cells. We found that acquired I-Ek – GFP
co-localized with CD63, a multivescicular body marker MBV, and with LAMP1 a
lysosomal associated membrane protein marker of late endosome-Lysosomes
(Fig.6).
Figure 6. Acquisition of I-Ek MHC-II co-localize with Lamp1 and CD63. Two set of
images taken with Confocal Microscopy of T cells taking up pMHC cognate complexes from an
APC and co-localizing with LAMP1 and CD63.

74
Taken together all these results, we also looked at acquired surface MHC-
II in the plasma membrane. To this aim, we used ELYRA Superresolution
Microscopy (SIM-Superresolution structured illumination) (Fig.7). Using these
techniques, we were able to confirm our previous data in vitro and we found co-
localization of MHC in green and CD80 in red that merged in yellow clusters. This
technique allowed us to visualize how the acquired molecules are distributed; the
organization of I-Ek MHC-II alone or I-Ek MHC-II/CD80 in clusters could find an
explanation in the capacity of T cells to concentrate the molecules in order to
exert a new role.
Figure 7. Acquisition of I-Ek MHC-II and CD80 by ELYRA super-resolution. On the
left it is shown only the acquisition of the I-Ek MHC-II by ELYRA super-resolution, the green spot
cover randomly all the cell surface giving an image with fine detailed structure. In concentrated
red spots it is shown CD80 that co-localize with I-Ek MHC-II in yellow spots.
It was interesting trying to quantify this MHC acquisition taken the
advantage of the technique by ImageStream X Mark II Imaging Flow Cytometer;
similar to the results obtained with confocal microscopy, we also found positive
spots of co-localization (pMHC-CD80) clusters on the same T cells with a random
distribution (Fig.8).
Taken together, these data confirmed that T cells capture MHC-peptide
complexes directly from APC and display them on their own plasma membrane
as clusters mixed with CD28 ligands.
I-Ek MHC I-Ek MHC
CD80
I-Ek MHC
CD80

75
In addition, to investigate more precisely the specific localization of MHC,
we used Transmission Electron Microscopy (TEM). We used DCEKs expressing
GFP-tagged I-Ek molecules loaded with antigen peptide MCC to present Ag to
primary AND TCR transgenic CD4 (following the same experimental procedure
used for FACS and confocal microscopy experiments). After 2 hours of co-
culture, we sorted the cells selecting only the population of CD4+ GFP+ cells and
we proceeded with a pre-embedding immunogold labelling protocol. The protein
of interest is investigated by immunolabeling with a primary antibody against the
target molecule, followed by a secondary antibody (against the primary antibody)
conjugated with gold nanoparticles. The images below show the expression of I-
Ek black nanoparticles, acquired from DCEKs on the membrane of CD4+ T cells.
Figure 8. Acquisition of I-
Ek MHC-II by using ImageStream
X Mark II Imaging Flow
Cytometer. A. Quantification analysis of the
co-localized I-Ek MHC-II/CD80. B. Cells co-
localizing presented in this order Bright Field
(BF) in grey, CD4+ T cells stained in yellow, I-
Ek MHC-II in green and the co-stimulatory
molecule CD80 in red. The analysis was
performed by using the analytical classifiers in
IDEAS software.
B
A
76
Surprisingly these I-Ek was detected in nanoclusters, localised in two
different sites: retained inside microvesicles bound to the plasma membrane and
as incorporated integral plasma membrane proteins.
Figure 9. Acquisition of I-Ek MHC-II by representative transmission electron
micrographs (TEM). A. CD4+ GFP+ T cells after 2h of incubation with DCEKs were sorted and a
pre-embedding immunogold labelling was performed. The black nanoparticles represent the I-Ek
MHC-II. B. Detail of the I-Ek MHC-II localized on the membrane surface of the CD4+ T cell. C.
Black nanoparticles were also found inside vesicles close to membrane surface (black
arrowheads).
It is still confusing and questionable the nomenclature of the microvesicles
in the literature, for this reason we will not make any attempt in this work to define
if those MHC-clusters outside the cell are exosomes or ectosomes; the most
important thing we should take into account is where we found them. However,
recent studies have shown that in addition to cytokines, T cells can release
exosomes within the synaptic space (Choudhuri et al. 2014) and this could be
interpretated as the expression on the membrane surface of trogocytosed pMHC
that are redirected to the plasma membrane of T cells, presumably after
trafficking through multi-vesicular bodies.
A
5
00nm
B
C
2
00nm

77
1.7 MHC-II acquisition by trogocytosis also occurs in
vivo.
To determine whether this phenomenon could be observed in vivo, we
designed an experimental system by which we could visualize the acquisition and
the expression of MHC molecules in the membrane using AND transgenic WT
and AND transgenic Rhog -/- after immunizing them with MCC peptide specific for
the AND TCR in combination with LPS by footpad injection (Fig.10A).
Figure 10.
Acquisition of I-Ek MHC-
II in vivo. A. Schematic
of the experiment in vivo.
B. Flow cytometry
analysis of the
percentage of the
expression of I-Ek MHC-II
gated on live CD4+ Vβ3+
cells in recipient mice AND
WT and AND Rhog -/-
immunized with MCC
antigenic peptide and LPS
by footpad. On the left, the
quantification. As a control,
non transgenic mice non
immunized were used. In
the panels below, it is shown the mean fluorescence of the CD69 expression. In all panels, each
dots represents one mouse. Data represent mean ± SEM; two-tailed paired Student’s test, *p <
0.01. ns: not significant.
B
A
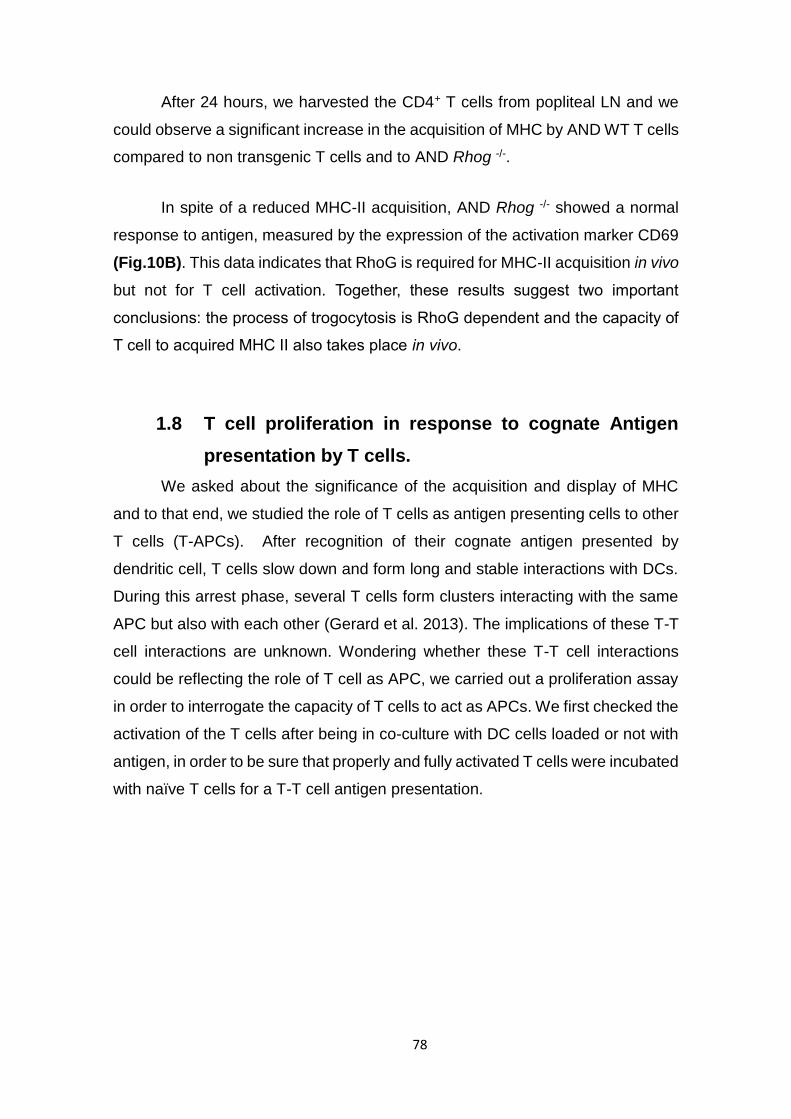
78
After 24 hours, we harvested the CD4+ T cells from popliteal LN and we
could observe a significant increase in the acquisition of MHC by AND WT T cells
compared to non transgenic T cells and to AND Rhog -/-.
In spite of a reduced MHC-II acquisition, AND Rhog -/- showed a normal
response to antigen, measured by the expression of the activation marker CD69
(Fig.10B). This data indicates that RhoG is required for MHC-II acquisition in vivo
but not for T cell activation. Together, these results suggest two important
conclusions: the process of trogocytosis is RhoG dependent and the capacity of
T cell to acquired MHC II also takes place in vivo.
1.8 T cell proliferation in response to cognate Antigen
presentation by T cells.
We asked about the significance of the acquisition and display of MHC
and to that end, we studied the role of T cells as antigen presenting cells to other
T cells (T-APCs). After recognition of their cognate antigen presented by
dendritic cell, T cells slow down and form long and stable interactions with DCs.
During this arrest phase, several T cells form clusters interacting with the same
APC but also with each other (Gerard et al. 2013). The implications of these T-T
cell interactions are unknown. Wondering whether these T-T cell interactions
could be reflecting the role of T cell as APC, we carried out a proliferation assay
in order to interrogate the capacity of T cells to act as APCs. We first checked the
activation of the T cells after being in co-culture with DC cells loaded or not with
antigen, in order to be sure that properly and fully activated T cells were incubated
with naïve T cells for a T-T cell antigen presentation.
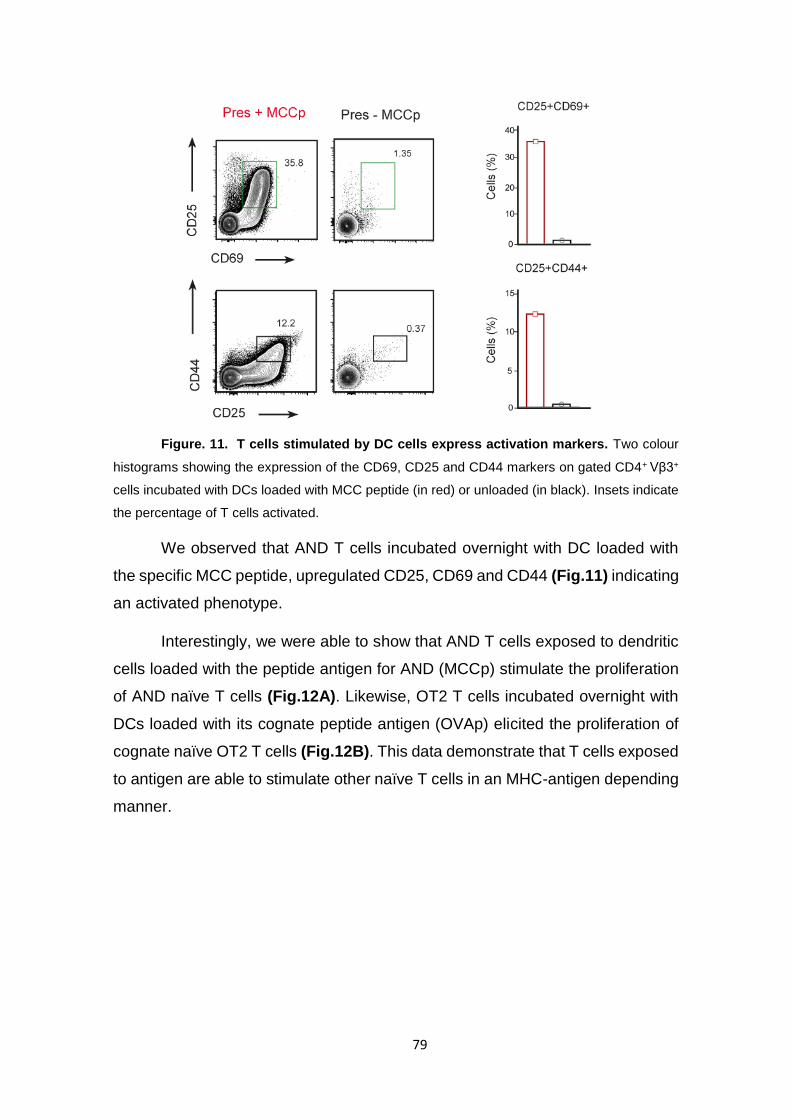
79
Figure. 11. T cells stimulated by DC cells express activation markers. Two colour
histograms showing the expression of the CD69, CD25 and CD44 markers on gated CD4+ Vβ3+
cells incubated with DCs loaded with MCC peptide (in red) or unloaded (in black). Insets indicate
the percentage of T cells activated.
We observed that AND T cells incubated overnight with DC loaded with
the specific MCC peptide, upregulated CD25, CD69 and CD44 (Fig.11) indicating
an activated phenotype.
Interestingly, we were able to show that AND T cells exposed to dendritic
cells loaded with the peptide antigen for AND (MCCp) stimulate the proliferation
of AND naïve T cells (Fig.12A). Likewise, OT2 T cells incubated overnight with
DCs loaded with its cognate peptide antigen (OVAp) elicited the proliferation of
cognate naïve OT2 T cells (Fig.12B). This data demonstrate that T cells exposed
to antigen are able to stimulate other naïve T cells in an MHC-antigen depending
manner.

80
Figure 12. Proliferation assay. Proliferation assay shows the number of cell divisions of
naïve T cells from AND TCR transgenic mice (on the right) and from OT2 TCR transgenic mice
(on the left) incubated for 5 days with activated CD4+ T cells from AND and OT2 transgenic mice
previously incubated with DCs loaded with the MCC and OVA respectively. As a control, DCs
unloaded were used. Data represent mean ± SEM; Error bars. (n=2). Statistical analysis:two-
tailed paired Student’s test, *p < 0.01. **< 0.001
1.9 T cells take up and present bystander antigens.
Interestingly, using two CD4 T cells lines of different antigen specificity
AND and OT2 it was possible to demonstrate that AND exposed to DC loaded
with peptide antigen for AND (MCC peptide) and OT2 (OVA peptide) stimulate
the proliferation of both AND and OT2 cells (Fig.13). These results indicate that
T cells take up and present cognate pMHC complexes but also take and present
bystander pMHC complexes.
B
A
A B
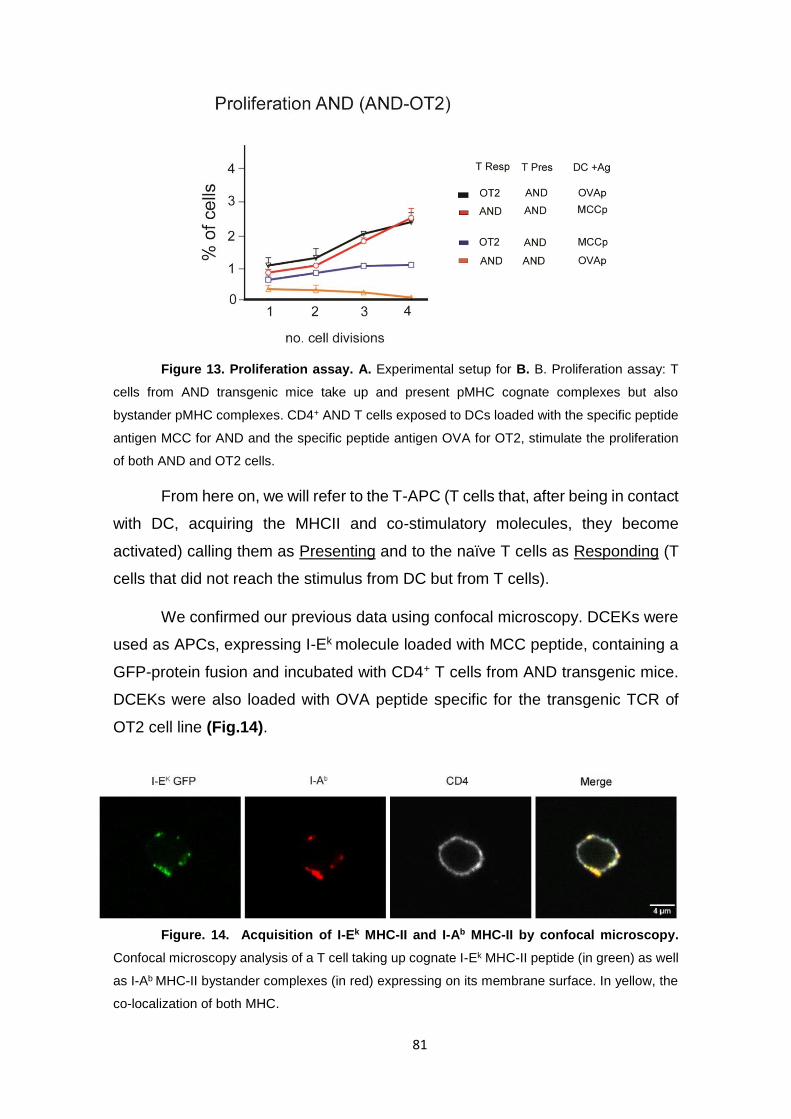
81
Figure 13. Proliferation assay. A. Experimental setup for B. B. Proliferation assay: T
cells from AND transgenic mice take up and present pMHC cognate complexes but also
bystander pMHC complexes. CD4+ AND T cells exposed to DCs loaded with the specific peptide
antigen MCC for AND and the specific peptide antigen OVA for OT2, stimulate the proliferation
of both AND and OT2 cells.
From here on, we will refer to the T-APC (T cells that, after being in contact
with DC, acquiring the MHCII and co-stimulatory molecules, they become
activated) calling them as Presenting and to the naïve T cells as Responding (T
cells that did not reach the stimulus from DC but from T cells).
We confirmed our previous data using confocal microscopy. DCEKs were
used as APCs, expressing I-Ek molecule loaded with MCC peptide, containing a
GFP-protein fusion and incubated with CD4+ T cells from AND transgenic mice.
DCEKs were also loaded with OVA peptide specific for the transgenic TCR of
OT2 cell line (Fig.14).
Figure. 14. Acquisition of I-Ek MHC-II and I-Ab MHC-II by confocal microscopy.
Confocal microscopy analysis of a T cell taking up cognate I-Ek MHC-II peptide (in green) as well
as I-Ab MHC-II bystander complexes (in red) expressing on its membrane surface. In yellow, the
co-localization of both MHC.

82
We next aimed to further study the activation of Presenting cell and
Responding cell in vitro using CD45.2 AND T cells as Presenting previously
incubated with DC overnight, and purified by negative selection. These were co-
cultured with CD45.2+ CD45.1+ from AND TCR transgenic mice crossed with
Ly5.1 congenic mice as the Responding cells for 6 days. To rule out a contribution
to antigen presentation by DC cells that could contaminate the CD4+ T cell
population, we also analysed them using the anti-CD4 and anti-CD11b and anti-
CD11b Abs specific for CD4 T cells and DC markers, respectively, by flow
cytometry.
Afterwards we analysed the proliferation of both cell types and we
observed that the Presenting cells proliferated more than the Responding ones
(Fig.15). On the left, is shown the number of cell divisions and on the right the
proliferation index.
Fig.15. Proliferation Assay with Cell Trace staining.
Cytometry plots show the expression of CD4+ T cells previously incubated with DCs
loaded with the peptide called Presenting; they were cultured for 6 days with CD4+ naïve T cells
called Responding. Both Presenting and Responding were stained with CTV according to protocol
dilution shown in Materials and Methods.
A question that arises from these results is whether T cells could be a new
type of antigen presenting cell. If this were the case, what is its relevance? In the
next chapter, we will investigate more in detail the role of the T-APC in the T-T
cell context with the aim of characterizing their function.
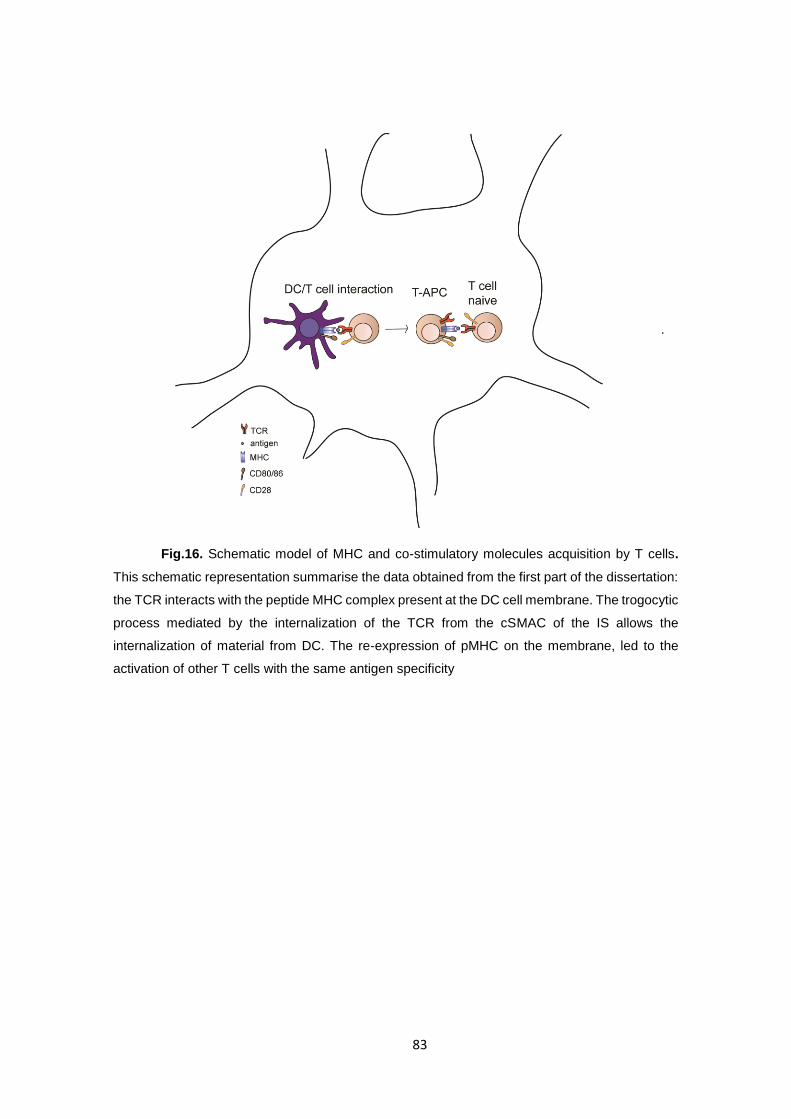
83
.
Fig.16. Schematic model of MHC and co-stimulatory molecules acquisition by T cells.
This schematic representation summarise the data obtained from the first part of the dissertation:
the TCR interacts with the peptide MHC complex present at the DC cell membrane. The trogocytic
process mediated by the internalization of the TCR from the cSMAC of the IS allows the
internalization of material from DC. The re-expression of pMHC on the membrane, led to the
activation of other T cells with the same antigen specificity

84
Part 2

85
T-T cell antigen presentation exerts a role in
Th differentiation.
We wanted to assess the nature of this T-T cell interaction and more
importantly its consequences.
In order to be classified as a professional APC we should see a pattern
that could be perfectly fitting in the so-called “three-signal model”, usually used
to define the APC function required for the activation of T cells. We decided to
investigate whether our T-APC could fit in this profile; signal 1 would represented
by the engagement between the MHC-peptide complex and T cell receptor; while
this is necessary, it is not sufficient because it require signal 2, delivered by
interactions between costimulatory receptors and complementary ligands on T
cells. The first part of the dissertation showed the presence of the two signals,
now we will ask whether also CD4+ T helper could accomplish the third signal
that regards activated APCs that can secrete various cytokines driving the
polarization of T cells into different effector cells (Lin and Lore 2017).
As we previously discussed in the introduction, we know that naive CD4+
T cells are central organizers in immune responses and they are activated after
interaction with antigen-MHC complex. Activated CD4+ T cells can then
differentiate into one of several T helper cell subsets to become a
Th1,Th2,Th17,TFH and Treg. The decision-making process is instructed by the
mixture of cytokines present in the environment and by their specific transcription
factor expression and their immunological function.
2.1 Presenting and Responding T cells show a different
profile in vitro.
After describing T cells as a new subset of APC that could be playing a
role in the immune response, we decided to analyse whether the T-T cell
interaction could modulate the differentiation pattern of both Presenting and
Responding T cells in vitro.
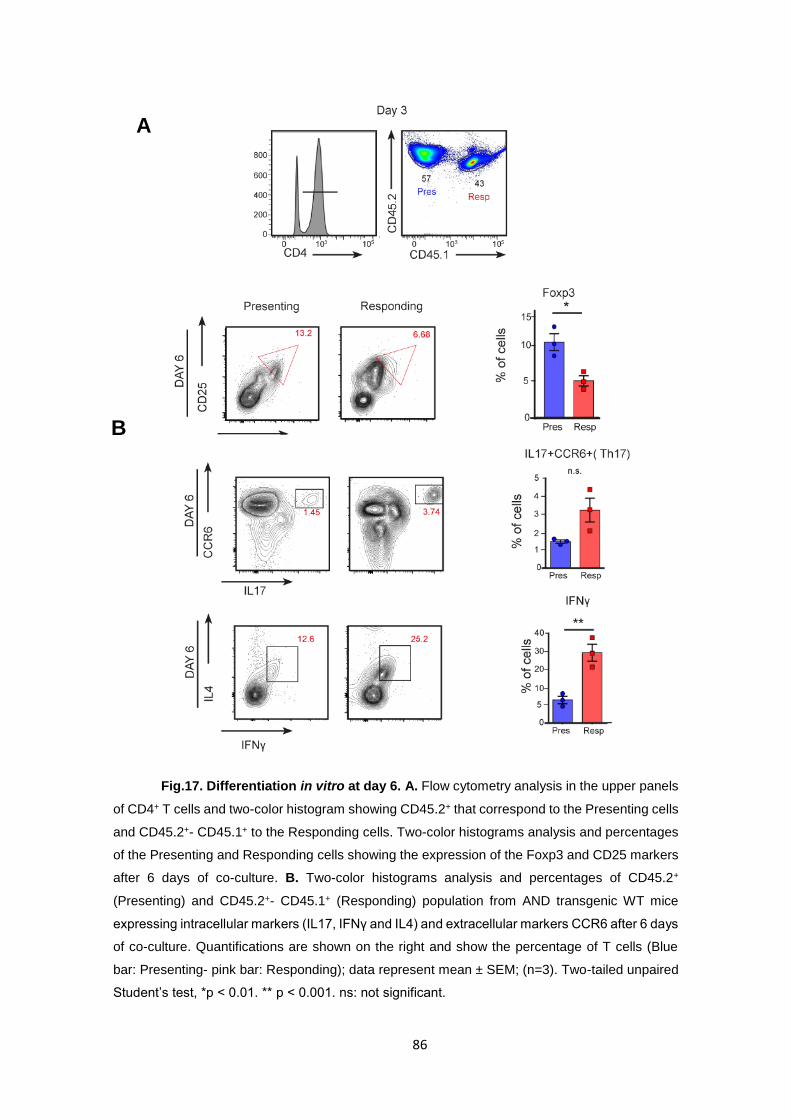
86
Fig.17. Differentiation in vitro at day 6. A. Flow cytometry analysis in the upper panels
of CD4+ T cells and two-color histogram showing CD45.2+ that correspond to the Presenting cells
and CD45.2+- CD45.1+ to the Responding cells. Two-color histograms analysis and percentages
of the Presenting and Responding cells showing the expression of the Foxp3 and CD25 markers
after 6 days of co-culture. B. Two-color histograms analysis and percentages of CD45.2+
(Presenting) and CD45.2+- CD45.1+ (Responding) population from AND transgenic WT mice
expressing intracellular markers (IL17, IFNγ and IL4) and extracellular markers CCR6 after 6 days
of co-culture. Quantifications are shown on the right and show the percentage of T cells (Blue
bar: Presenting- pink bar: Responding); data represent mean ± SEM; (n=3). Two-tailed unpaired
Student’s test, *p < 0.01. ** p < 0.001. ns: not significant.
B
A

87
In order to doing this, we used WT AND T that express the CD45.2 allele
as Presenting cells and WT AND T that express both alleles CD45.1 and 2 as
Responding cells. The Presenting cells were incubated overnight with DC cells,
then T cells were purified by negative selection in order to rule out any possible
contamination from DC; the Presenting T cells were then cultured with the
Responding T cells for 6 days. As a result, both Presenting and Responding cells
were stained for intracellular markers. Surprisingly, we found that the Presenting
T cells were showing an increase in the expression of Foxp3 and CD25 compared
to the Responding T cells (Fig.17). On the contrary, the Responding T cells were
more positive for IL17, CCR6 and also IFNγ. The Transcriptional regulator Foxp3
identified in combination with the extracellular marker CD25 a Regulatory T cell
subset (Tregs) is crucial for the regulation of the immune response (Loser and
Beissert 2012). In addition to self-tolerance, preventing autoimmunity and
inflammatory diseases, Tregs ensure a controlled immune response upon
pathogen encounter. Excessive suppression by Tregs can hamper pathogen
clearance and promote chronic infection (Rakebrandt et al. 2016). Regarding
IL17 producing T cells, we know that IL17A is considered as one of the major pro-
inflammatory cytokine and is central to the innate and adaptive immune
responses. The secretion of IL-17A combined with the expression of the
chemokine receptor CCR6 (important for Th17 cell migration to certain tissue
microenvironments) identify Th17 cells, a T cell subset characterized by its
pathogenic role in many inflammatory disorders. IFNγ is a pro-inflammatory
cytokine that produced by T-helper 1 cells that contribute to allograft rejection and
pathogen clearance.
The results obtained suggest that, our group of cells analysed, Presenting
and Responding, polarize towards two different cellular subsets but how the
differentiation of T-APC and naïve CD4+ T cells towards distinct Th subset is
regulated is still unknown.
A more extensive analysis was performed to check for other markers and
different incubation time points that could confirm and characterise deeper and in
a more distinguishable way the two populations of Presenting and Responding
after 3 days of co-culture (Fig.18). transcription factor, is expressed in CD4 T
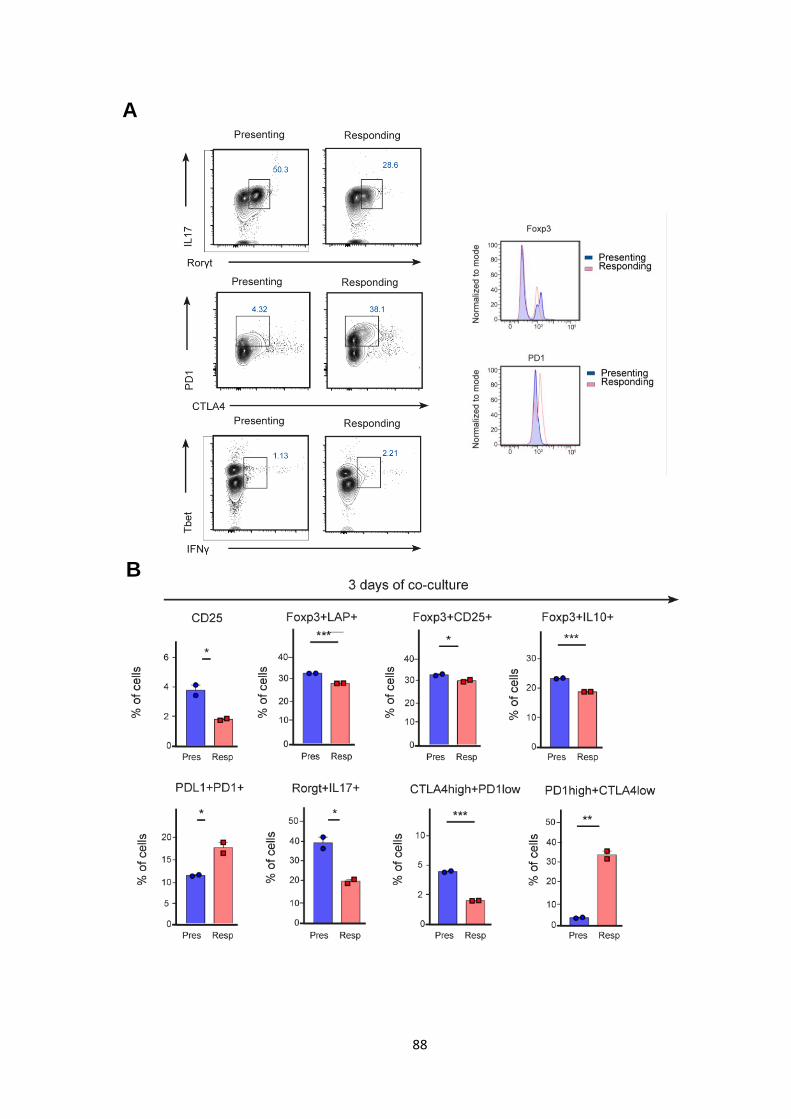
88
A
B
89
Figure 18. Differentiation in vitro at days 3 of co-culture. A. Two-color histogram
showing the expression and the percentages of some intracellular markers as Roryt, IL17, IFNy
and Tbet and some extracellular markers as CTLA4 and PD-1 on gated in CD45.2+ (Presenting)
and CD45.2+- CD45.1+ (Responding) population of CD4+ T alive cells. On the right flow cytometry
analysis of shaded histograms (Presenting) and dashed histograms (Responding) show Foxp3
and PD-1 levels. B. CD4+ T cells from draining lymph nodes of AND transgenic mice CD45.2
(Presenting) and AND transgenic mice crossed with Ly5.1 congenic mice expressing CD45.2+-
CD45.1+ (Responding) were analysed by flow cytometry, following the expression of CD25, CD69,
CD44, CCR6, PD-1 markers. Graphs represent mean ± SEM. (n=2). Student’s t-test * - p < 0.01,
** -p < 0.001, *** -p < 0.0001.
Following the same experimental procedure that we have already
introduced, we obtained purified CD4+ T cells (Presenting and Responding) and
we incubated them for 3 days. In order to characterise the Treg population, both
T cells were tested for CD25, Foxp3 (the transcriptional repressor forkhead box
p3), IL-10 (an anti-inflammatory cytokine, their suppressive function is linked to
the the expression of Foxp3) (Couper et al. 2008), TGF-β1 (LAP- Latency
Associate Peptide, a cytokine with critical function in immune response by
regulating Tregs and Th17) (Pfortner et al., 2006), CTLA-4 (cytotoxic T-
lymphocyte-associated protein 4 that is constitutively expressed in T regulators
but only upregulated in conventional T cells after activation). For the Th17 subset,
we stained the cells for Rorγt (orphan nuclear receptor, the master transcription
factor required for the differentiation of Th17), IL17A (the pro-inflammatory
cytokine mainly secreted by Th17) and CCR6 (essential for the recruitment of
both the pro-inflammatory and anti-inflammatory). The PD-1 (programmed cell
death-1) receptor (also known as CD279) is only expressed on the surface of
activated T lymphocytes and not resting T cells, therefore, it can be used as an
activation marker of T cells (Maleki Vareki et al. 2017). PD-L1 its ligand, in the
literature it is well known for belonging with PD-1 to the family of immune
checkpoint proteins that act as co-inhibitory factors. In this context, they might
identify the T follicular helper cells. T-bet, a T-box lymphocytes committed to Th1
T-cell development and for the Th1 cell-specific expression of IFNγ.
The results obtained confirm that Presenting and Responding show a
different profile identifying two diverse subsets of differentiation .
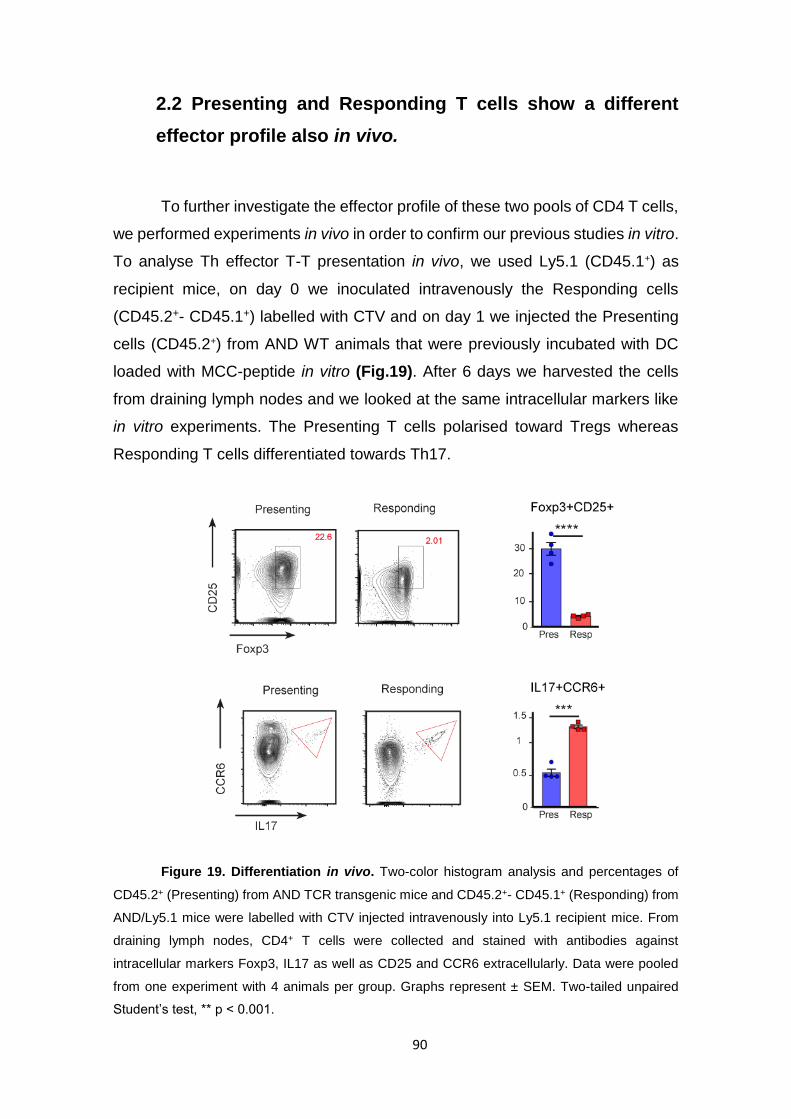
90
2.2 Presenting and Responding T cells show a different
effector profile also in vivo.
To further investigate the effector profile of these two pools of CD4 T cells,
we performed experiments in vivo in order to confirm our previous studies in vitro.
To analyse Th effector T-T presentation in vivo, we used Ly5.1 (CD45.1+) as
recipient mice, on day 0 we inoculated intravenously the Responding cells
(CD45.2+- CD45.1+) labelled with CTV and on day 1 we injected the Presenting
cells (CD45.2+) from AND WT animals that were previously incubated with DC
loaded with MCC-peptide in vitro (Fig.19). After 6 days we harvested the cells
from draining lymph nodes and we looked at the same intracellular markers like
in vitro experiments. The Presenting T cells polarised toward Tregs whereas
Responding T cells differentiated towards Th17.
Figure 19. Differentiation in vivo. Two-color histogram analysis and percentages of
CD45.2+ (Presenting) from AND TCR transgenic mice and CD45.2+- CD45.1+ (Responding) from
AND/Ly5.1 mice were labelled with CTV injected intravenously into Ly5.1 recipient mice. From
draining lymph nodes, CD4+ T cells were collected and stained with antibodies against
intracellular markers Foxp3, IL17 as well as CD25 and CCR6 extracellularly. Data were pooled
from one experiment with 4 animals per group. Graphs represent ± SEM. Two-tailed unpaired
Student’s test, ** p < 0.001.
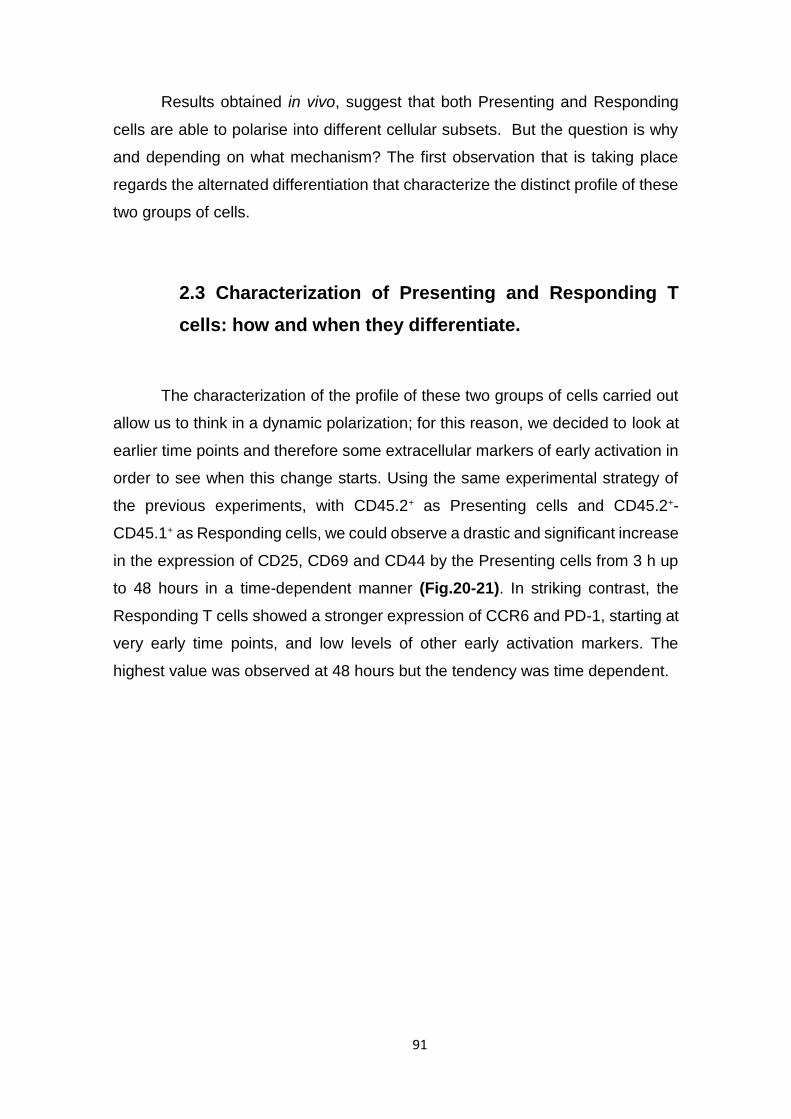
91
Results obtained in vivo, suggest that both Presenting and Responding
cells are able to polarise into different cellular subsets. But the question is why
and depending on what mechanism? The first observation that is taking place
regards the alternated differentiation that characterize the distinct profile of these
two groups of cells.
2.3 Characterization of Presenting and Responding T
cells: how and when they differentiate.
The characterization of the profile of these two groups of cells carried out
allow us to think in a dynamic polarization; for this reason, we decided to look at
earlier time points and therefore some extracellular markers of early activation in
order to see when this change starts. Using the same experimental strategy of
the previous experiments, with CD45.2+ as Presenting cells and CD45.2+-
CD45.1+ as Responding cells, we could observe a drastic and significant increase
in the expression of CD25, CD69 and CD44 by the Presenting cells from 3 h up
to 48 hours in a time-dependent manner (Fig.20-21). In striking contrast, the
Responding T cells showed a stronger expression of CCR6 and PD-1, starting at
very early time points, and low levels of other early activation markers. The
highest value was observed at 48 hours but the tendency was time dependent.
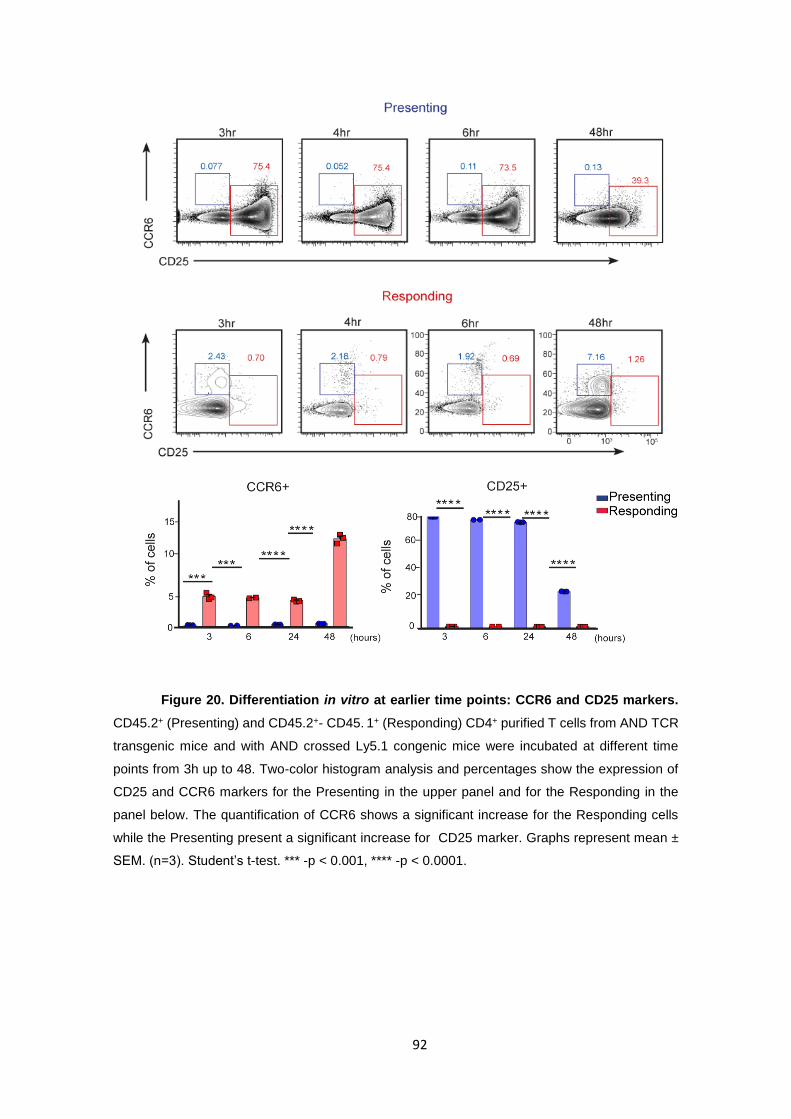
92
Figure 20. Differentiation in vitro at earlier time points: CCR6 and CD25 markers.
CD45.2+ (Presenting) and CD45.2+- CD45. 1+ (Responding) CD4+ purified T cells from AND TCR
transgenic mice and with AND crossed Ly5.1 congenic mice were incubated at different time
points from 3h up to 48. Two-color histogram analysis and percentages show the expression of
CD25 and CCR6 markers for the Presenting in the upper panel and for the Responding in the
panel below. The quantification of CCR6 shows a significant increase for the Responding cells
while the Presenting present a significant increase for CD25 marker. Graphs represent mean ±
SEM. (n=3). Student’s t-test. *** -p < 0.001, **** -p < 0.0001.
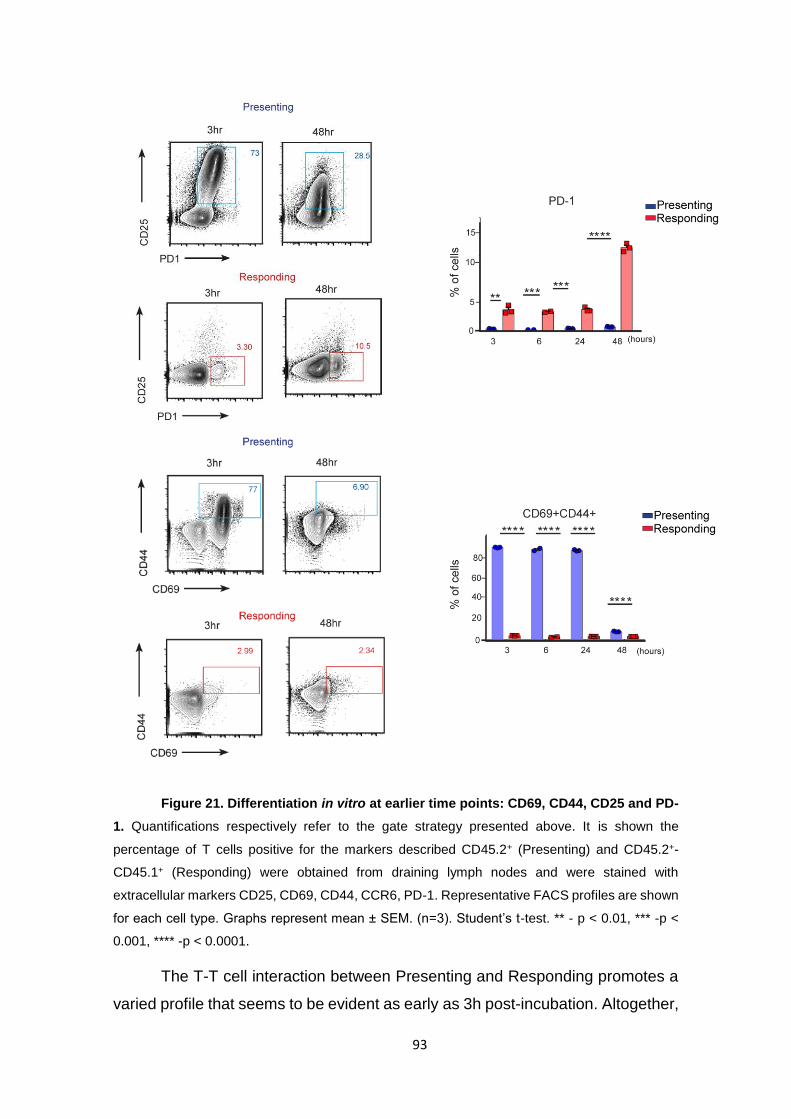
93
Figure 21. Differentiation in vitro at earlier time points: CD69, CD44, CD25 and PD-
1. Quantifications respectively refer to the gate strategy presented above. It is shown the
percentage of T cells positive for the markers described CD45.2+ (Presenting) and CD45.2+-
CD45.1+ (Responding) were obtained from draining lymph nodes and were stained with
extracellular markers CD25, CD69, CD44, CCR6, PD-1. Representative FACS profiles are shown
for each cell type. Graphs represent mean ± SEM. (n=3). Student’s t-test. ** - p < 0.01, *** -p <
0.001, **** -p < 0.0001.
The T-T cell interaction between Presenting and Responding promotes a
varied profile that seems to be evident as early as 3h post-incubation. Altogether,
94
these results constitute a strong evidence that there is a dynamic orientation
produced by the interaction of T-APCs and other T cells.
2.4 Presenting-T naive co-cultures differentially modulate
cytokine release compared to Presenting cells alone
We wondered whether the interaction T-T could dictate this “dichotomy”.
In order to compare the phenotype of the T-APCs previously incubated with DC
stimulated with peptide and the co-culture of the same T-APC (Presenting) +
naïve T cells (Responding), we performed a Cytometric Bead Array (CBA) assay
(Fig.22). The aim was to detect a different profile of cytokines between these two
groups, a diverse expression that could corroborate our hypothesis of a straight
communication between T-T cells.
Figure 22. CBA Assay.CD45.2+ (Presenting) from AND transgenic mice previously
activated by DCs were analysed alone or in combination with CD45.2+- CD45.1+ (Responding)
after 3 days of co-culture for a CBA assay. Seven bead populations with distinct fluorescence
intensities have been coated with capture antibodies specific for IL-2, IL4, IL-6, IFN-γ, TNF, IL-
17A, and IL-10 proteins. Graphs represent mean ± SEM.(n=3). Student’s t-test. * - p < 0.01, ** -p
< 0.001, ns: non significant.
From this experiment, we obtained that TNF, IL2 and IL17A were
significant different between the two populations analysed and this allows us to
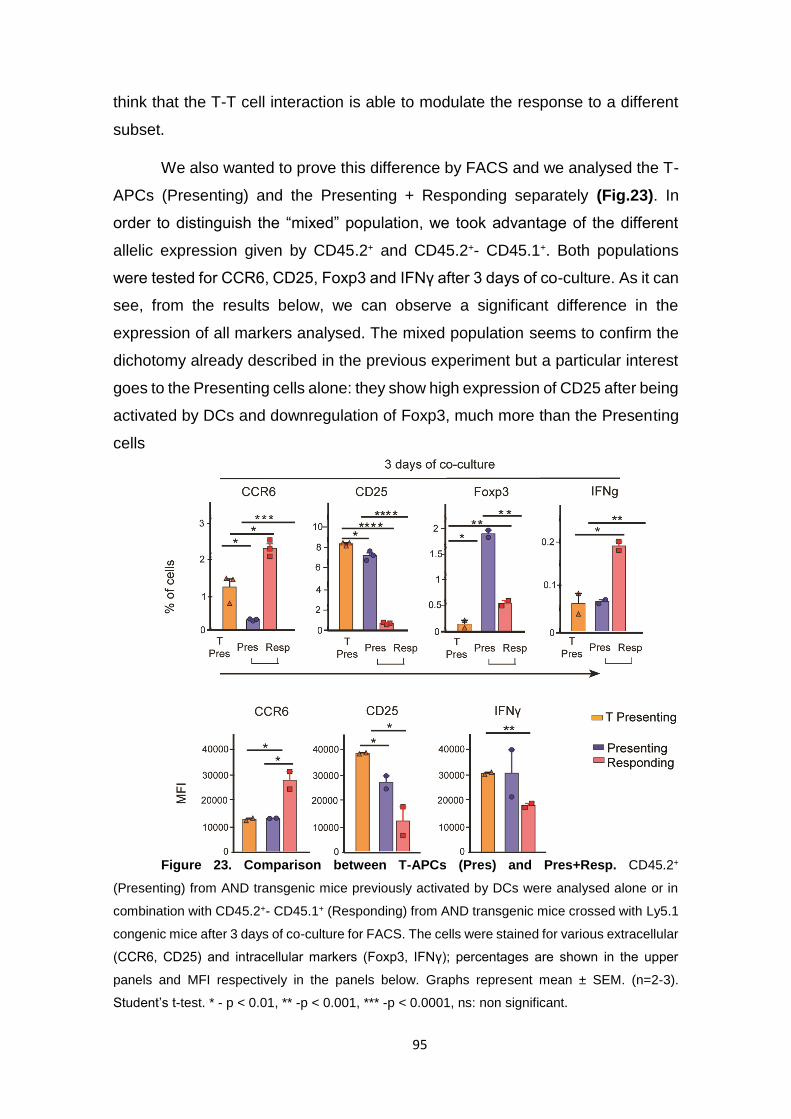
95
think that the T-T cell interaction is able to modulate the response to a different
subset.
We also wanted to prove this difference by FACS and we analysed the T-
APCs (Presenting) and the Presenting + Responding separately (Fig.23). In
order to distinguish the “mixed” population, we took advantage of the different
allelic expression given by CD45.2+ and CD45.2+- CD45.1+. Both populations
were tested for CCR6, CD25, Foxp3 and IFNγ after 3 days of co-culture. As it can
see, from the results below, we can observe a significant difference in the
expression of all markers analysed. The mixed population seems to confirm the
dichotomy already described in the previous experiment but a particular interest
goes to the Presenting cells alone: they show high expression of CD25 after being
activated by DCs and downregulation of Foxp3, much more than the Presenting
cells
Figure 23. Comparison between T-APCs (Pres) and Pres+Resp. CD45.2+
(Presenting) from AND transgenic mice previously activated by DCs were analysed alone or in
combination with CD45.2+- CD45.1+ (Responding) from AND transgenic mice crossed with Ly5.1
congenic mice after 3 days of co-culture for FACS. The cells were stained for various extracellular
(CCR6, CD25) and intracellular markers (Foxp3, IFNγ); percentages are shown in the upper
panels and MFI respectively in the panels below. Graphs represent mean ± SEM. (n=2-3).
Student’s t-test. * - p < 0.01, ** -p < 0.001, *** -p < 0.0001, ns: non significant.

96
This data strongly suggests that every discrepancy we can detect between the
Presenting cells and the mixed population is depending on the nature of T-T cell
interaction and the polarization is generated by the presence of this interaction.
2.5 Transcriptional landscape of Presenting and
Responding T cells.
Taking together all these data, we can witness to a new phenomenon of
polarised second layer of interaction depending firstly on the stimulus given by
DC and secondly by the stimulus acquired by T cells and transmitted to other T
cells with the same antigen specificity.
Looking for general differential expression that could be responsible for
the Th differentiation outcome, we performed a genome-wide analysis with a
microarray chip where we hybridize mRNA isolated from Presenting and
Responding T cells. After 6 days of co-culture, Presenting (CD45.2+) and
Responding T cells (CD45.2+- CD45.1+) were then FACS-sorted and mRNA was
isolated for microarray analysis. We were expecting to confirm some of the genes
from the markers used above but, surprisingly, we found that the general
expression pattern was quite overlapping between the two groups (Fig.24, SAM
plot) however there were a few genes differentially expressed that are highlighted
in the heat-map plot (Fig. 24).

97
Figure 24. Microarray analysis. Significance Analysis of Microarrays (SAM) plot
diagram. Hierarchical clustering (on the left) of transcriptomic profiles showing the comparison of
transcript differentially and not differentially expressed between the two cell groups Presenting (in
blue) and Responding (in red). Data are derived from a single experiment Microarray analysis.
(Genechip Mouse Gene 2.0 ST Array).
Some of these data were consistent with our previous results. The
Presenting T cells showed up regulation of Foxp3, CTLA-4, CD80, Bcl3, Nfk2 (the
most representative genes). The Responding T cells expressed only a handful of
genes not presented by T Presenting cells. One of the few genes was Tob1
(Transducer of Erb-2, 1) which is a member of the Tob/BTG antiproliferative
(APRO) family of proteins that plays important roles in suppressing tumour
development. Tob1 was found to be constitutively expressed in unstimulated
peripheral blood T lymphocytes but strongly down-regulated after both antigen-
specific and unspecific stimulation. Indeed, down-regulation of Tob1 is required
for T cell activation and expansion (Tzachanis et al. 2001). A recent report also
described a higher expression of Tob1 in the IL-17 producing pro-inflammatory
CD4 T helper (Th17) population (Santarlasci et al. 2014) at least in human. This
is consistent with our data and suggest a mechanism that explains why T
responding cells proliferate less (Fig.13). Therefore this analysis seems to
complete the puzzle taking advantage of various technical approaches. The other
98
gene upregulated by the Responding T cells was Pydc3 (pyrin domain-containing
preotein 3), a proteic component of the NLRP3 inflammasome.
In addition, to verify the accuracy of our microarray data, we validated by
qPCR a list of genes known to be implicated in the differentiation of functional Th
subsets at different time points, 3 and 5 days (Fig.25).
It is remarkable to observe the difference in the polarization of some genes
between 3 and 5 days of incubation. We could observe an active fluctuation of
gene expression during that time lapse. The tendency is variable and dynamic.
Interestingly, we found that Tob1 is upregulated by the Responding compared to
the control represented by naïve T cell, while is downregulated in the Presenting.
The same fate holds for Pydc3 which confirms the microarray results as Tob1
did. We also obtained a confirmation with the expression of some master
transcription factors as Foxp3 and Rorγt that showed a significant increase for
Presenting and Responding T cells respectively. Taking together these results,
the question that we should address regards the molecular mechanism that
induces these changes in polarization.

99
Figure 25.
Different mRNA
expression between
Presenting and
Responding: Graph
quantification of fold change
mRNA expression of Tbet,
Foxp3, Rorgt, Gata3, Bcl6.
In the upper line are
represented the master
transcription factors of the Th
subset: Th1,Tregs,Th17,Th2
and Tfh respectively. The
second line shows the
mRNA expression of TGFβ,
IL17, IL13 and the third line
the expression of Pydc3,
Tob-1, Ik2f4 and Nfkb2,
genes obtained by the
microarray analysis.
Presenting, Responding and
the naïve T cells used as a
control, were sorted after 3
and 5 days of co-culture and
used for qPCR analysis. β-
actin and GADPH were used
as normalizer genes.

100
A possible mechanism for the differential fate of T presenting cells vs T
responding cells could be mediated by the expression of Tob1 which could
influence the differentiation towards Th17 thanks to its anti-proliferative role at
very early time points. In this regard, a high proliferative capacity would promote
Treg differentiation whereas a low proliferative capacity would lead to Th17
differentiation. Experiments to confirm this hypothesis are still pending. We
believe that the resulting T-T cell interactions could provide an alternative
platform to the immune synapse based on cytokine exchange. The implications
of these interactions in vivo have not yet been assessed and addressed in the
third section of the Results.
Fig.26.Schematic model of possible Treg vs Th17 differentiation. Taken together,
our results of the second part reveal a previously unexplored role of CD4+ T cells as APCs that
can modulate the polarization of other T naïve cells inducing an alternate profile. After the first
interaction with DC cells, T cells, became activated and when they are incubated with other naïve
cells, they can generate two distinct profile of T helper subsets. This polarization has been
described analysing transcription factors, extracellular markers, intracellular markers and
interleukins released by the co-culture.

101
Part 3
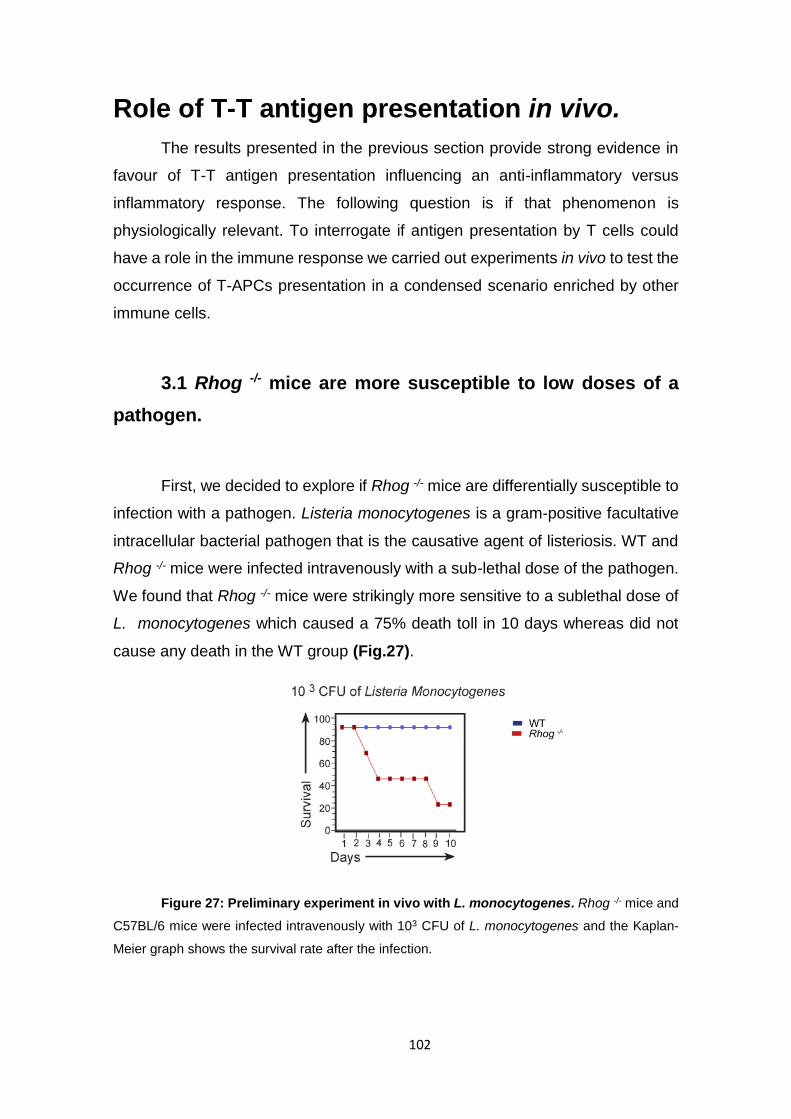
102
Role of T-T antigen presentation in vivo.
The results presented in the previous section provide strong evidence in
favour of T-T antigen presentation influencing an anti-inflammatory versus
inflammatory response. The following question is if that phenomenon is
physiologically relevant. To interrogate if antigen presentation by T cells could
have a role in the immune response we carried out experiments in vivo to test the
occurrence of T-APCs presentation in a condensed scenario enriched by other
immune cells.
3.1 Rhog -/- mice are more susceptible to low doses of a
pathogen.
First, we decided to explore if Rhog -/- mice are differentially susceptible to
infection with a pathogen. Listeria monocytogenes is a gram-positive facultative
intracellular bacterial pathogen that is the causative agent of listeriosis. WT and
Rhog -/- mice were infected intravenously with a sub-lethal dose of the pathogen.
We found that Rhog -/- mice were strikingly more sensitive to a sublethal dose of
L. monocytogenes which caused a 75% death toll in 10 days whereas did not
cause any death in the WT group (Fig.27).
Figure 27: Preliminary experiment in vivo with L. monocytogenes. Rhog -/- mice and
C57BL/6 mice were infected intravenously with 103 CFU of L. monocytogenes and the Kaplan-
Meier graph shows the survival rate after the infection.
103
We hypothesized that the higher sensitivity to infection to L.
monocytogenes of Rhog-/- mice might be due to a deficiency in generating a pro-
inflammatory response because of defective T-T cell antigen presentation.
3.2 Rhog -/- mice develop a less severe disease in the
EAE model.
We next decided to use a model of experimental autoimmune
encephalomyelitis (EAE), the most common animal model for multiple sclerosis
(MS) that is a T cell-mediated autoimmune disease characterized by T-cell and
leucocytes infiltration of the central nervous system (CNS) associated with local
inflammation and more importantly, mediated by Th17 (Robinson et al. 2014).
Since EAE is initiated by immunization with autoantigens presented to MHC class
II-restricted CD4+ Th cells, the model is ideally suited to study Th-cell
differentiation and downstream T-cell mediated signalling in vivo (Fig.28).
Female WT and Rhog -/- mice of 8 weeks were immunized with myelin
oligodendrocyte glycoprotein MOG35-55 peptide and scored according to the
acquisition of neurological symptoms and weight loss (Choi et al. 2015).
Neurological symptoms reached a maximum score of 3 at day 20 post
immunization in WT mice whereas Rhog -/- experienced an early onset of
symptoms and progressive improvement (Fig.28A). These results suggest that
in the absence of RhoG protein, EAE symptoms are less severe perhaps due to
a defective T-T cell antigen presentation that could contribute to a Th17
polarization.
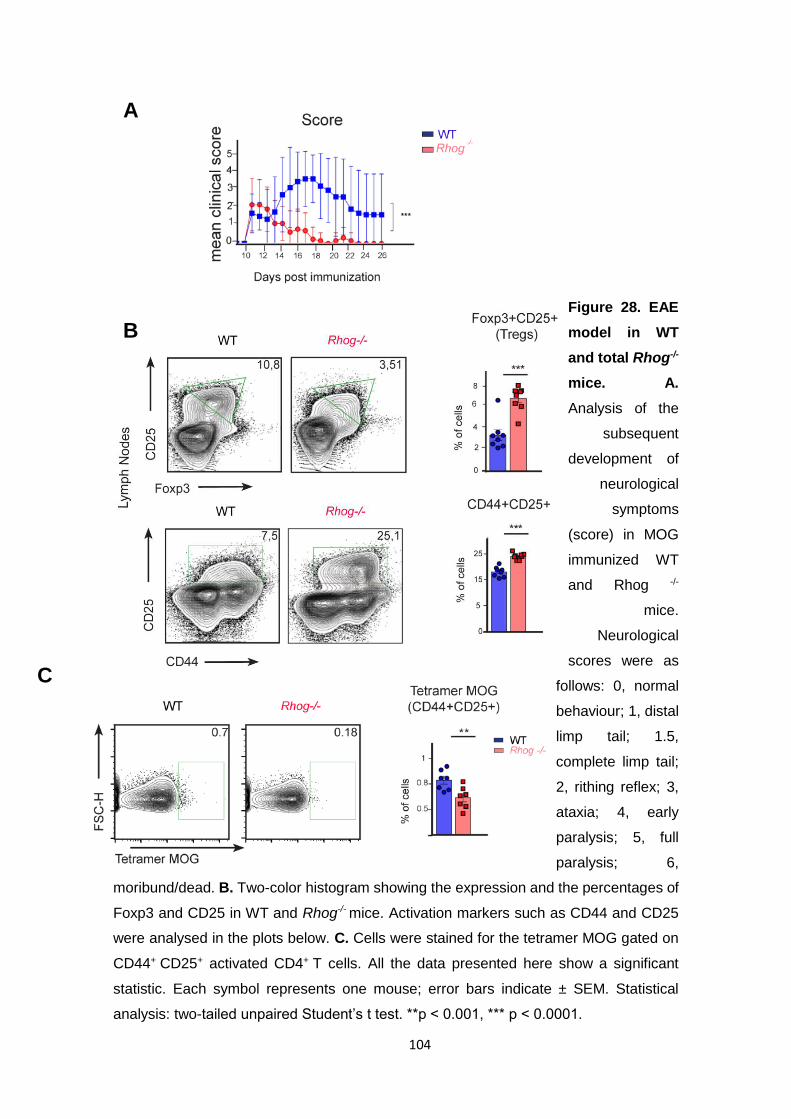
104
Figure 28. EAE
model in WT
and total Rhog-/-
mice. A.
Analysis of the
subsequent
development of
neurological
symptoms
(score) in MOG
immunized WT
and Rhog -/-
mice.
Neurological
scores were as
follows: 0, normal
behaviour; 1, distal
limp tail; 1.5,
complete limp tail;
2, rithing reflex; 3,
ataxia; 4, early
paralysis; 5, full
paralysis; 6,
moribund/dead. B. Two-color histogram showing the expression and the percentages of
Foxp3 and CD25 in WT and Rhog-/- mice. Activation markers such as CD44 and CD25
were analysed in the plots below. C. Cells were stained for the tetramer MOG gated on
CD44+ CD25+ activated CD4+ T cells. All the data presented here show a significant
statistic. Each symbol represents one mouse; error bars indicate ± SEM. Statistical
analysis: two-tailed unpaired Student’s t test. **p < 0.001, *** p < 0.0001.
C
A
B
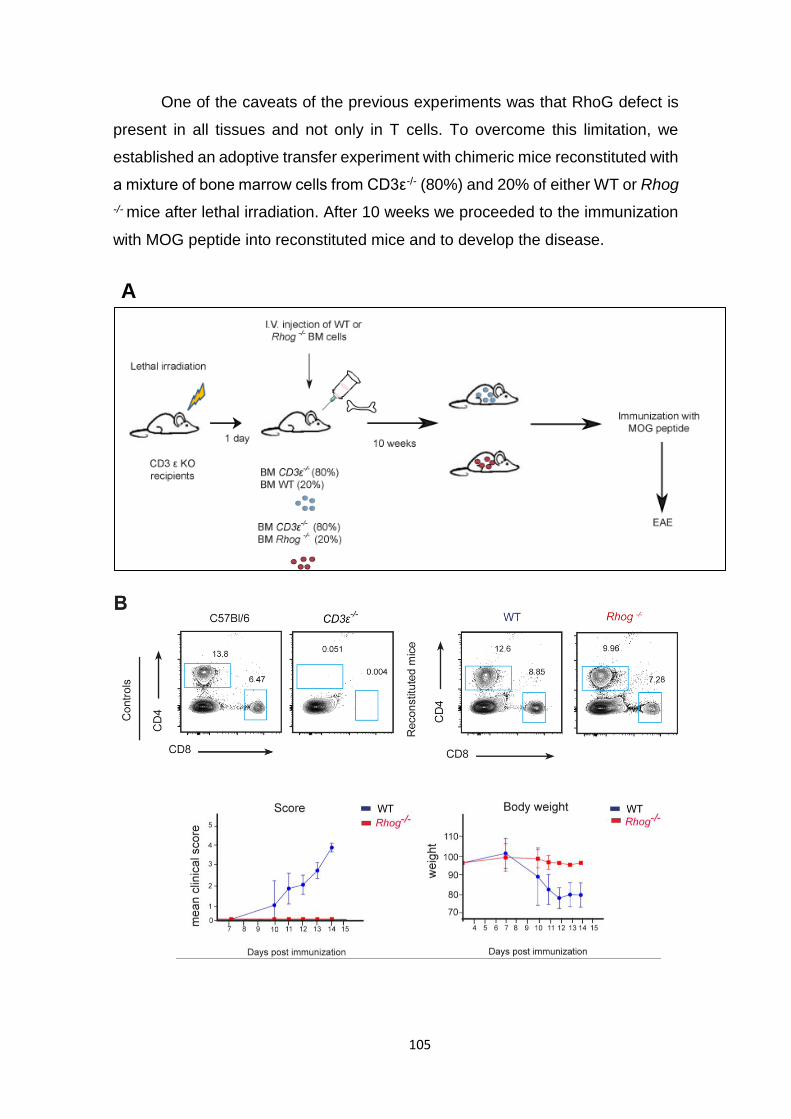
105
One of the caveats of the previous experiments was that RhoG defect is
present in all tissues and not only in T cells. To overcome this limitation, we
established an adoptive transfer experiment with chimeric mice reconstituted with
a mixture of bone marrow cells from CD3ε-/- (80%) and 20% of either WT or Rhog
-/- mice after lethal irradiation. After 10 weeks we proceeded to the immunization
with MOG peptide into reconstituted mice and to develop the disease.
A

106
Figure 29. EAE model in reconstituted mice. A. Experimental setup of the adoptive
transfer of bone-marrow chimera experiment; CD3ε -/- recipient mice were irradiated with 1 Gy
and reconstituted 24h after with the indicated mixture of BM cells B. Two-color histograms
showing the expression of CD4 and CD8 T cell population in an adoptive transfer experiment
where CD4 and CD8 from WT and Rhog -/- mice were transferred into CD3ε -/- the mice after the
reconstitution with bone marrow chimera. On the right, we show the percentage CD4 and CD8 of
the controls C56Bl6 and CD3ε -/-. On the left in the two gates the reconstituted mice express CD4
and CD8 percentage of the controls WT and Rhog -/- in the CD3ε -/-, used as recipients mice. C.
Observation of the body weight and the score 5 weeks after immunization. D. Data are
representative of two independent experiments. Error bars indicate ± SEM. Statistical analysis:
two-tailed unpaired Student’s t test. *p < 0.1, ** p < 0.001.
Similarly to the previous experiment, we observed that mice reconstituted
with RhoG deficient T cells do not develop neurological symptoms, unlike mice
reconstituted in the WT T cells. We noticed that in concordance with no
progression of the disease, Rhog-/- mice express significantly more activated T
cells in draining lymph nodes according to the expression of CD44 and CD25
markers (Fig.29). We next checked for other extracellular markers that could give
us more information about the migration profile towards the draining lymph nodes
7 days post immunization. We stained the cells for CD44 and CD62L, expression
of adhesion molecule that characterise naïve and memory T cells. Naïve T cells
exhibit high levels of CD62L and low expression of CD44, whereas memory T
cells are identified by high CD44 and low CD62L expression (Fig.30).
D
C

107
Figure 30. EAE model: analysis of extracellular markers in secondary lymphoid
organs. A. Cells were harvested from popliteals and cervicals Lymph nodes. The quantification
show the expression of CD44 and CD62L identifying the naïve and memory T cell populations.
B. Quantification of CD44 and CD62L markers in the spleen. Each symbol represents one
mouse; TEM: effector memory T cells; TCM: central memory T cells. Graph represents ± SEM.
Statistical analysis: two-tailed unpaired Student’s t test. *p < 0.1, ** p < 0.001. n.s. not significant.
Our results collectively suggested that mice defective in RhoG protein are
resistant to EAE because their T cells differentiate towards Tregs and more
polarization towards Tregs correlates with less development of the disease as
shown in three independent experiments. Since Rhog -/- mice present a defect in
the process of trogocytosis by T cells (Martinez-Martin et al. 2011), they are also
defective in T-T cell presentation. A diminished T-T cell antigen presentation
gives rise to less polarization towards the Th17 subset and on the contrary more
A
B
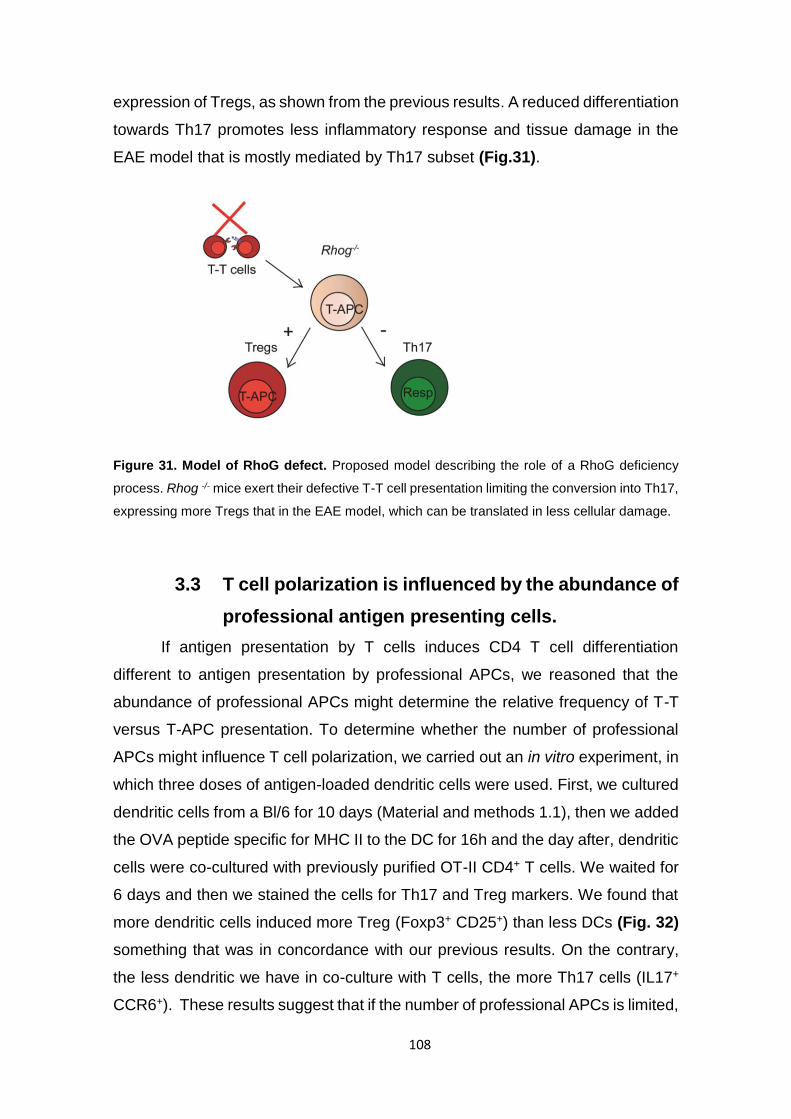
108
expression of Tregs, as shown from the previous results. A reduced differentiation
towards Th17 promotes less inflammatory response and tissue damage in the
EAE model that is mostly mediated by Th17 subset (Fig.31).
Figure 31. Model of RhoG defect. Proposed model describing the role of a RhoG deficiency
process. Rhog -/- mice exert their defective T-T cell presentation limiting the conversion into Th17,
expressing more Tregs that in the EAE model, which can be translated in less cellular damage.
3.3 T cell polarization is influenced by the abundance of
professional antigen presenting cells.
If antigen presentation by T cells induces CD4 T cell differentiation
different to antigen presentation by professional APCs, we reasoned that the
abundance of professional APCs might determine the relative frequency of T-T
versus T-APC presentation. To determine whether the number of professional
APCs might influence T cell polarization, we carried out an in vitro experiment, in
which three doses of antigen-loaded dendritic cells were used. First, we cultured
dendritic cells from a Bl/6 for 10 days (Material and methods 1.1), then we added
the OVA peptide specific for MHC II to the DC for 16h and the day after, dendritic
cells were co-cultured with previously purified OT-II CD4+ T cells. We waited for
6 days and then we stained the cells for Th17 and Treg markers. We found that
more dendritic cells induced more Treg (Foxp3+ CD25+) than less DCs (Fig. 32)
something that was in concordance with our previous results. On the contrary,
the less dendritic we have in co-culture with T cells, the more Th17 cells (IL17+
CCR6+). These results suggest that if the number of professional APCs is limited,
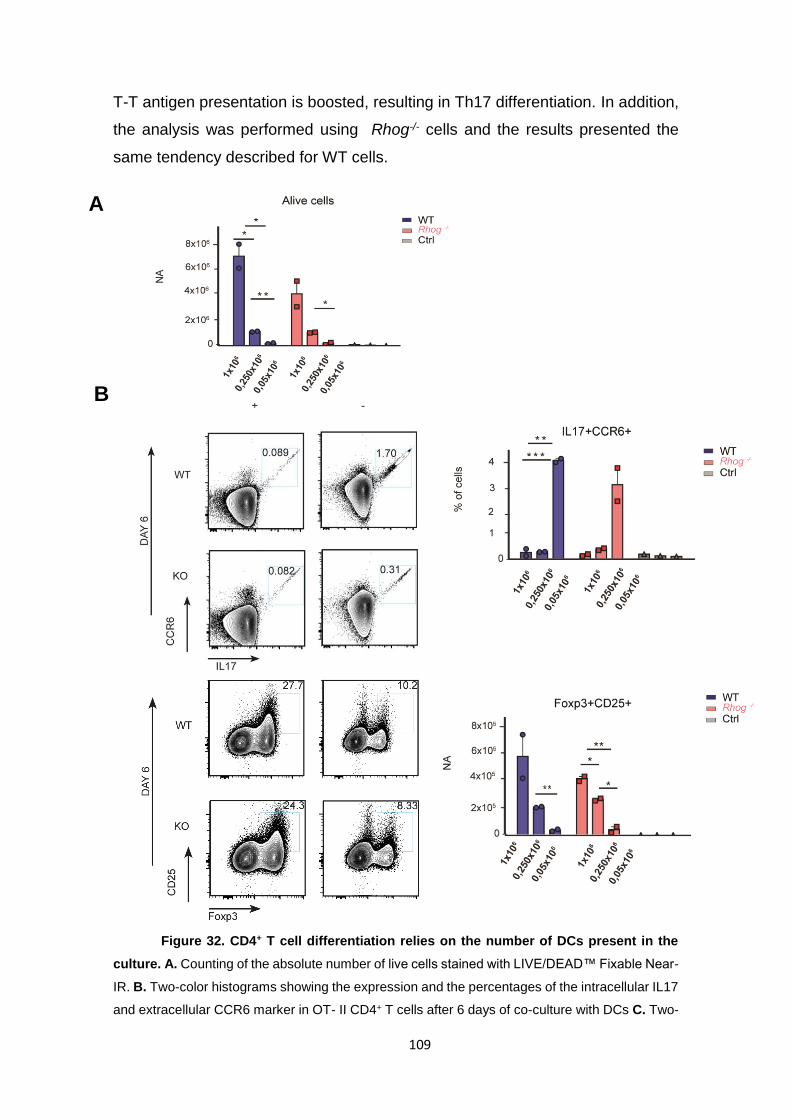
109
T-T antigen presentation is boosted, resulting in Th17 differentiation. In addition,
the analysis was performed using Rhog-/- cells and the results presented the
same tendency described for WT cells.
Figure 32. CD4+ T cell differentiation relies on the number of DCs present in the
culture. A. Counting of the absolute number of live cells stained with LIVE/DEAD™ Fixable Near-
IR. B. Two-color histograms showing the expression and the percentages of the intracellular IL17
and extracellular CCR6 marker in OT- II CD4+ T cells after 6 days of co-culture with DCs C. Two-
B
C
B
A

110
color histograms showing the expression for Foxp3 and CD25 in CD4+ T cells from WT and Rhog-
/-. Graphs represent ± SEM. (n=2). Statistical analysis: 2way ANOVA.
The alternated profile that we were able to observe in the previous
experiments of differentiation takes place also in this context; playing with a
different number of dendritic cells, we are facilitating or reducing the possibility of
interactions with T cells and thereby their differentiation into different T helper
subpopulations.
3.1 T-T cell presentation is influenced by DCs: abundance vs
scarcity: in vivo
We next aimed to support our above data showing that the abundance of
professional APCs determines T cell polarization also in vivo. We used four
groups of mice receiving different number of antigen-loaded dendritic cells. In
vitro differentiated DCs were incubated with the OVA peptide for 16h and injected
subcutaneously into the footpad of recipient mice Ly5.1+ (CD45.1+), followed 18h
later by intravenous transfer of a constant number of OT-II CD4+ T cells previously
purified. We then waited for six days and afterwards we sacrificed the mice
collecting the cells from draining LN (popliteal and inguinal), mixed LN (including
mesenteric and cervical) and spleens and we examined the OT-II CD4+ T cell
differentiation in these immunised mice by flow cytometry (Fig.33 A).
A

111
Figure 33. CD4+ T cell differentiation relies on the number of DCs injected in vivo.
A. Experimental setup for B, C and D. B. Identification of CD45.2+ CD4+ OT- II cells injected in
CD45.1+ recipient mice previously gated in Vα2+ cells, as shown by the flow cytometric plot. C.
B
C

112
Analysis of IL17 and CCR6, markers of Th17 and CD44 in mixed lymph nodes (including axillar,
cervical, mesenteric); D. Analysis of intracellular Foxp3 and IL17 markers of the CD45.2+ OT-II
CD4+ cells isolated from the draining LN ( popliteal and inguinal) after intra-footpad immunization
with different doses of DC cells; on the left there is represented the numbers of the positive cells
and on the right the percentages. C-D. Each symbol represents one mouse; Graphs represent ±
SEM. (n=2-3). Statistical analysis: two-tailed unpaired Student’s t test. *p < 0.1, ** p < 0.001, ***
p < 0.0005, **** p < 0.0001.
Surprisingly, we obtained two important results: we corroborate our
previous results in vitro and we obtained information regarding the cells injected.
Focusing on the population of cells that we injected in a constant number, 5x10⁶
OT-II, we found a very clear “dichotomy” between Foxp3 and IL17. When we
increase the number of DC cells we can observe a higher frequency of Foxp3+ in
the T cell population, which appears to be reduced when we decrease the number
of DCs. On the contrary, when we decrease the number of DCs, we find a much
higher expression of IL17 and CCR6, markers of Th17. An interesting
observation regards the activation of OT-II CD4 T cells that was measured by
staining for CD44 surface expression as CD44 high represents the activated T cell
phenotype. It is also important to note that their activation profile is dependent on
the number of DC.
3.4 Relevance of a T-T cell presentation on the
response to different doses of a pathogen such as
MVA-OVA.
As a confirmation of what has been shown in previous experiments using different
numbers of DCs, we then decided to perform an experiment in vivo with a
pathogen. We used Modified Vaccinia Ankara Virus (MVA) to infect mice
(Verheust et al. 2012). We chose this virus because its replication in infected cells
is limited and therefore, the number of infected cells is directly controlled by the
number of viruses.
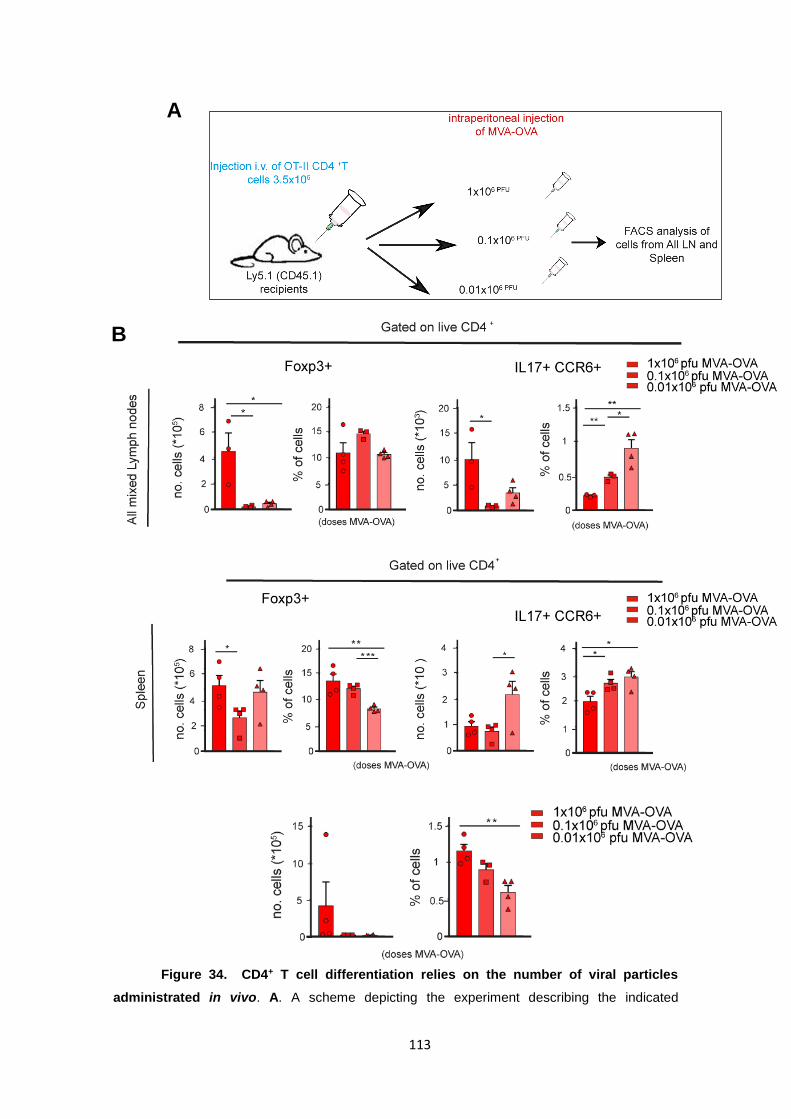
113
Figure 34. CD4+ T cell differentiation relies on the number of viral particles
administrated in vivo. A. A scheme depicting the experiment describing the indicated
A
B
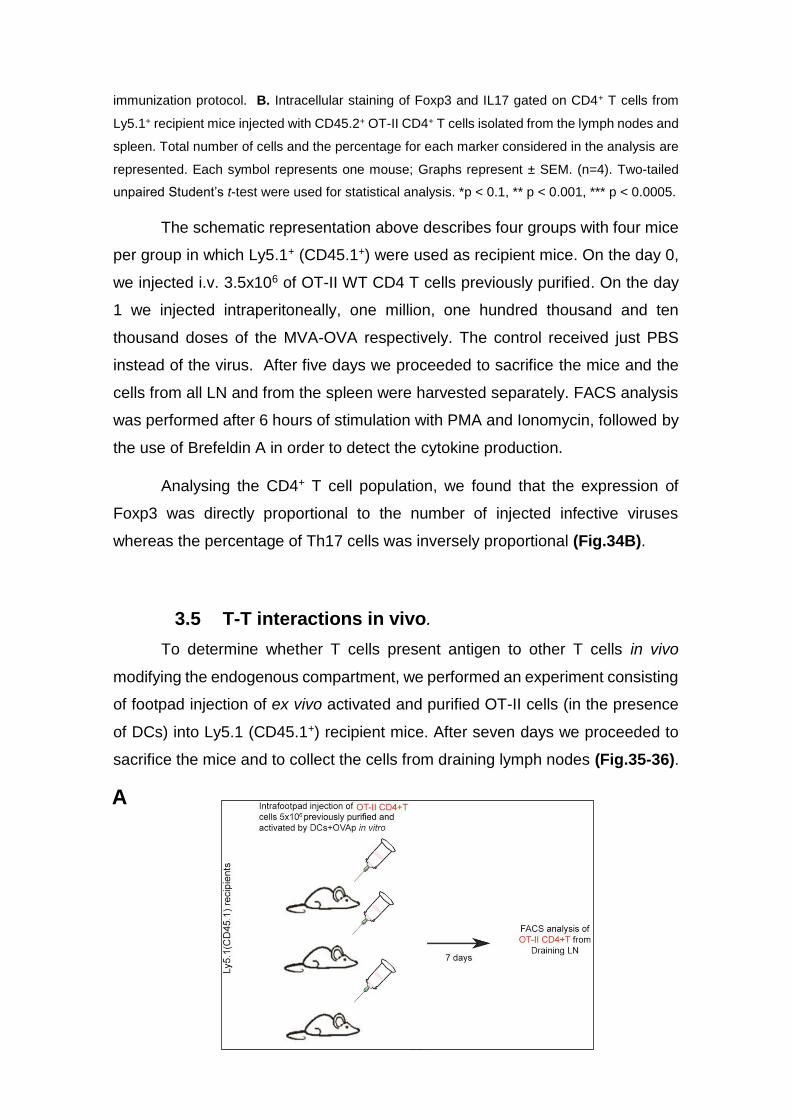
114
immunization protocol. B. Intracellular staining of Foxp3 and IL17 gated on CD4+ T cells from
Ly5.1+ recipient mice injected with CD45.2+ OT-II CD4+ T cells isolated from the lymph nodes and
spleen. Total number of cells and the percentage for each marker considered in the analysis are
represented. Each symbol represents one mouse; Graphs represent ± SEM. (n=4). Two-tailed
unpaired Student’s t-test were used for statistical analysis. *p < 0.1, ** p < 0.001, *** p < 0.0005.
The schematic representation above describes four groups with four mice
per group in which Ly5.1+ (CD45.1+) were used as recipient mice. On the day 0,
we injected i.v. 3.5x10⁶ of OT-II WT CD4 T cells previously purified. On the day
1 we injected intraperitoneally, one million, one hundred thousand and ten
thousand doses of the MVA-OVA respectively. The control received just PBS
instead of the virus. After five days we proceeded to sacrifice the mice and the
cells from all LN and from the spleen were harvested separately. FACS analysis
was performed after 6 hours of stimulation with PMA and Ionomycin, followed by
the use of Brefeldin A in order to detect the cytokine production.
Analysing the CD4+ T cell population, we found that the expression of
Foxp3 was directly proportional to the number of injected infective viruses
whereas the percentage of Th17 cells was inversely proportional (Fig.34B).
3.5 T-T interactions in vivo.
To determine whether T cells present antigen to other T cells in vivo
modifying the endogenous compartment, we performed an experiment consisting
of footpad injection of ex vivo activated and purified OT-II cells (in the presence
of DCs) into Ly5.1 (CD45.1+) recipient mice. After seven days we proceeded to
sacrifice the mice and to collect the cells from draining lymph nodes (Fig.35-36).
A

115
C
B
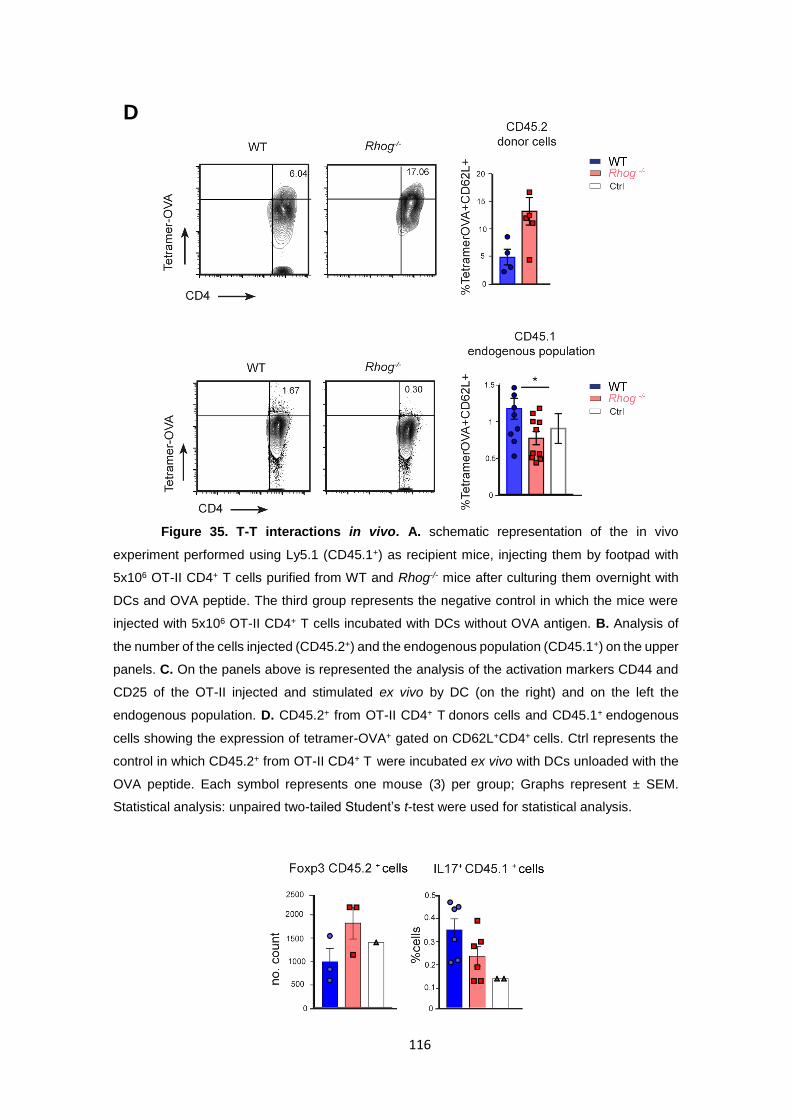
116
Figure 35. T-T interactions in vivo. A. schematic representation of the in vivo
experiment performed using Ly5.1 (CD45.1+) as recipient mice, injecting them by footpad with
5x10⁶ OT-II CD4+ T cells purified from WT and Rhog-/- mice after culturing them overnight with
DCs and OVA peptide. The third group represents the negative control in which the mice were
injected with 5x10⁶ OT-II CD4+ T cells incubated with DCs without OVA antigen. B. Analysis of
the number of the cells injected (CD45.2+) and the endogenous population (CD45.1+) on the upper
panels. C. On the panels above is represented the analysis of the activation markers CD44 and
CD25 of the OT-II injected and stimulated ex vivo by DC (on the right) and on the left the
endogenous population. D. CD45.2+ from OT-II CD4+ T donors cells and CD45.1+ endogenous
cells showing the expression of tetramer-OVA+ gated on CD62L+CD4+ cells. Ctrl represents the
control in which CD45.2+ from OT-II CD4+ T were incubated ex vivo with DCs unloaded with the
OVA peptide. Each symbol represents one mouse (3) per group; Graphs represent ± SEM.
Statistical analysis: unpaired two-tailed Student’s t-test were used for statistical analysis.
D

117
Figure 36. Analysis of intracellular markers.CD45.2+ OT-II cells from Rhog -/- that
correspond to the injected cells are positive for Foxp3; by contrast, the CD45.1+ endogenous
population that received the CD45.2+ OT-II from WT express more IL17.
We took advantage of the tetramer for OVA-MHC II in order to track the
two populations of interest, the one that we administrated into the mice and the
other endogenous population. We analysed separately the two populations of T
cells: the group of CD4+ CD45.2+ we injected by footpad, and CD4+ CD45.1+
belonging to the recipient mice in order to see if the former is able to activate the
latter. Inside those populations we looked at activation markers and we found that
the OT-II cells from Rhog -/- mice were more activated, expressing higher values
of CD25 and CD44 compared to the OT-II WT cells in the case of the donor cells.
Those same activated cells also showed an increase in the expression of the
tetramer (Fig.35D). On the contrary, regarding the endogenous population, the
mice that received OT-II CD4 T cells from WT, showed higher activation levels of
IL-17 (Fig.36). This could suggests that Rhog-/- mice, because of their defective
ability to acquire material from cells by trogocytosis, they are also unable to
generate a T-T cell antigen presentation, generating a bigger population of Tregs
that is probably blocked in a T cell zone of a LN. To support this interpretation,
we can observe an increase in the IL-17 expression in the group of mice that
were transferred with cells from WT and not Rhog -/-.

118
As mentioned before, part of these results are still preliminary with the aim
to explore the best condition or model that would allow us to recreate a
physiological T-T cell antigen presentation. Even if it remains a current object of
investigation, we demonstrated through different ways that a T-T cell
communication by T antigen presentation, occurs also in vivo and this would
provide an interesting insight in the fundamental biological panorama.
Figure 37. Model of the 3rd part. This model summarise all the results that we obtained
in this dissertation. From the first interaction between DC-T cells in which we observed activated
T cells acquiring MHC complexes conjugated with co-stimulatoy molecules. T cells become
antigen presenting cells and interact with other naïve T cells generating a plasticity in the
polarization profile of both group of cells that we called Presenting and Responding. This
alternated orientation drives us to propose the idea that the abundance of antigen presented by
professional APCs determines the outcome of the CD4 T cells. Scarsity of antigen give rise to
frequent T-TAPCs antigen presentation whereas a high abundance of result in a tolerogenic APC-
T cell antigen presentation.

119
DISCUSSION
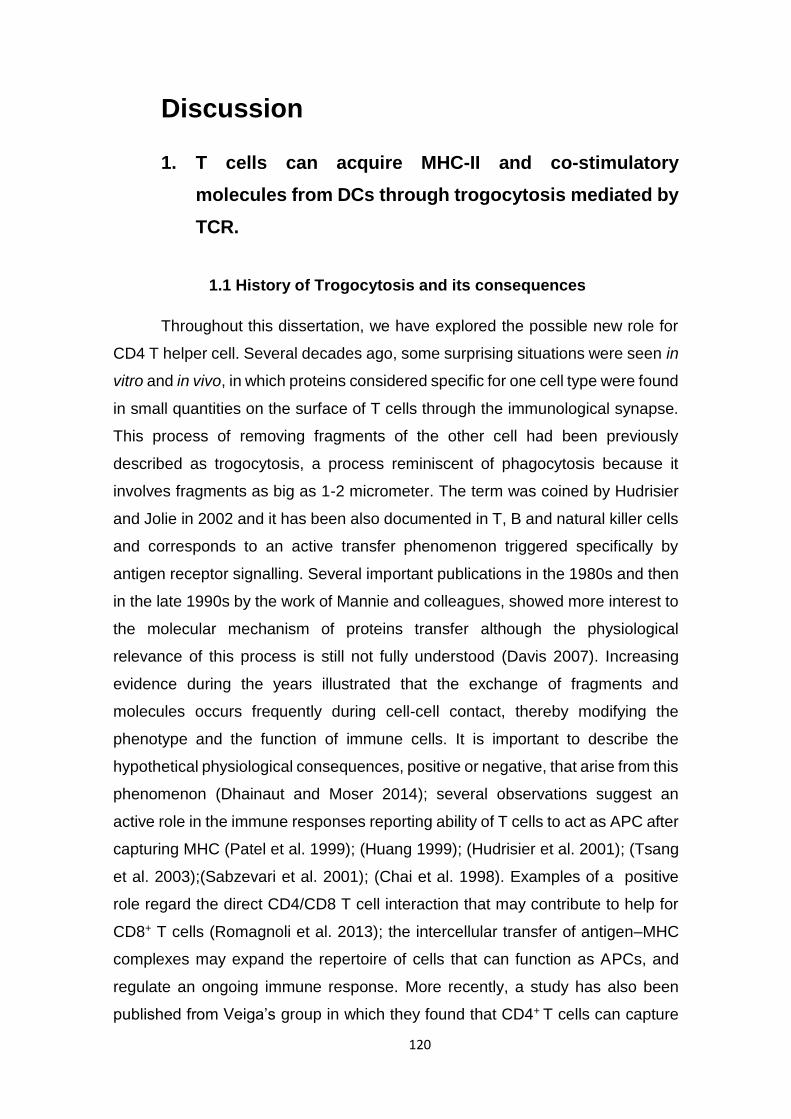
120
Discussion
1. T cells can acquire MHC-II and co-stimulatory
molecules from DCs through trogocytosis mediated by
TCR.
1.1 History of Trogocytosis and its consequences
Throughout this dissertation, we have explored the possible new role for
CD4 T helper cell. Several decades ago, some surprising situations were seen in
vitro and in vivo, in which proteins considered specific for one cell type were found
in small quantities on the surface of T cells through the immunological synapse.
This process of removing fragments of the other cell had been previously
described as trogocytosis, a process reminiscent of phagocytosis because it
involves fragments as big as 1-2 micrometer. The term was coined by Hudrisier
and Jolie in 2002 and it has been also documented in T, B and natural killer cells
and corresponds to an active transfer phenomenon triggered specifically by
antigen receptor signalling. Several important publications in the 1980s and then
in the late 1990s by the work of Mannie and colleagues, showed more interest to
the molecular mechanism of proteins transfer although the physiological
relevance of this process is still not fully understood (Davis 2007). Increasing
evidence during the years illustrated that the exchange of fragments and
molecules occurs frequently during cell-cell contact, thereby modifying the
phenotype and the function of immune cells. It is important to describe the
hypothetical physiological consequences, positive or negative, that arise from this
phenomenon (Dhainaut and Moser 2014); several observations suggest an
active role in the immune responses reporting ability of T cells to act as APC after
capturing MHC (Patel et al. 1999); (Huang 1999); (Hudrisier et al. 2001); (Tsang
et al. 2003);(Sabzevari et al. 2001); (Chai et al. 1998). Examples of a positive
role regard the direct CD4/CD8 T cell interaction that may contribute to help for
CD8+ T cells (Romagnoli et al. 2013); the intercellular transfer of antigen–MHC
complexes may expand the repertoire of cells that can function as APCs, and
regulate an ongoing immune response. More recently, a study has also been
published from Veiga’s group in which they found that CD4+ T cells can capture

121
bacteria efficiently from DC through a process called transphagocytosis, present
the bacterial antigens to CD8+ T cells and generate CD8+ T cells memory
expressed lower PD-1 levels (Cruz-Adalia et al. 2018). Conversely, intercellular
transfer may downregulate immune responses. There is some evidence that the
presence of APC-derived peptide/MHC complexes on T cells may render them
susceptible to fratricide lysis and other reports that reveal correlation between
anergy induction and T cell-mediated APC activity (Tsang et al. 2003), (Patel et
al. 1999), (Mannie et al. 1996).
1.2 Molecular mechanism of acquisition.
Previous works in our laboratory by Martinez-Martin et al. showed that the
mechanism of TCR internalization at the immunological synapse was coupled to
the TCR-triggered acquisition of membrane fragments from APC (Martinez-
Martin et al. 2011). It has been also described that two Ras family GTPases,
TC21 and RhoG, co-localize with the TCR at the immune system mediating the
internalization of the TCR (Delgado et al. 2009). We extensively took advantage
of the Ras protein RhoG that present a defect in phagocytosis, and we used it as
a precious tool to determine the relevance of pMHC acquisition by T cells on the
overall response in vitro and in vivo.
The goal of the first section of the results was to determine the role of
trogocytosis plays in CD4 + T cell activation, sustained signalling, proliferation of
the Presenting cells. A murine fibroblast cell line expressing an I-Ek molecule
loaded with an antigenic peptide (moth cytochrome C88-103) and containing a
GFP-protein fusion, was used as surrogate APCs and for T cells a peptide-
specific TCR transgenic mouse was used. The GFP-tagged MHC:peptide on the
APCs allows for the monitoring of trogocytosis by the presence of GFP on the
surface of the T cells. Trogocytosis can be also be monitored by antibody
staining, because murine T cells do not express MHC class II in contrast with
human T cells. Using a combination of high-resolution microscopy and flow
cytometry, it was observed that the “trogocytosed” material is retained on the
surface of the T cell. The first aim was to characterize the pathway of the MHC
acquisition once T cells had express it on their membrane surface and the

122
functional meaning of this phenomenon. Rhog-/- mice, deficient in the trogocytic
process were used as negative controls to evaluate the importance of antigen
presentation by T cells in the immune response.
Confirming previous studies, we were able to prove the acquisition of MHC-II and
co-stimulatory molecules by various cell lines of T cells with different antigen
specificity from DCs. Interestingly, the acquisition of the costimulatory molecules
(CD80 and CD86) by T cells reinforce the idea of the conversion into a T cell with
antigen presentation abilities.
Illustration.1 Model of MHC acquisition by T cells.
1.3 Role of the acquisition of MHC complex by T cells.
While trying to understand the purpose and consequences of trogocytosis,
an outstanding result obtained by electron microscopy was unveiled; as shown in
the first part of the result, we found gold particle complexed with protein-A
associated to peptide-MHC complexes clearly expressed by CD4+ T cells on the
membrane surface and inside extracellular vesicles (EV). The presence of the
MHC in these EV is a matter of controversy due to the fact that we do not know
where these vesicles they come from, whether they arise from professional APCs
or they already shed by T cells after processed it (this should take no more than
2 hours). EV comprise at least two classes: microvesicles, which bud directly from
the plasma membrane, and exosomes, which are secreted as a consequence of
the fusion of multivesicular endosomes (MVEs) with the plasma membrane
(Lindenbergh and Stoorvogel 2018). We know from the literature exosomes have
diameters ranging 30-150 nm and are on average smaller than microvesicles
(100 nm to > 1 µn) but their overlapping size distributions and the absence of
123
discriminatory molecular markers generate confusion when we should define
them. An interesting model for supramolecular domain organization at the IS was
proposed by the study of Dustin’s group and could find a reasonable explanation
in our results. They described the presence of accumulated TCRs located on the
surface of extracellular microvesicles that bud at the immunological synapse
centre. This shedding constitutes a novel mechanism for TCR downregulation,
following engagement by MHC peptides, that act in parallel with receptor
internalization (Choudhuri et al. 2014, Dustin and Choudhuri 2016). Sharing
these findings, other immune cells known to accumulate immunoreceptors at the
synapse centre, may also release them in microvesicles for intercellular
communication. In our experiments, the gold particles that correspond to the
MHC complexes were surprinsingly observed at the plasma membrane level and
inside microvesicles of a T cell. They could be defined as exosomes as they are
membrane vesicles that form within late endocytic compartments, which are
called multivesicular bodies (MVB) secreted upon fusion of these compartments
with the plasma membrane (Thery et al. 2002).; this could corroborate the idea
of a beneficial meaning of this phenomenon of trogocytosis.
In 1996, it was reported that human B cell-derived EVs could effectively
present MHC-II peptide complexes to CD4 T cells in vitro (Raposo et al. 1996).
Later, Thery and coworkers found that injecting mice with pMHC-II bearing EVs
also induced in vivo effects, resulting in the activation of antigen-specific naïve
CD4 T cells (Thery, 2001). Zitvogel and coworkers proposed that murine bone-
marrow derived DCs secreted EVs carrying MHC-I, MHC-II and T cell
costimulatory molecules (Zitvogel et al. 1998). In this regard, it has been
proposed a model in which apparently, two populations of EVs are released by
DC- activated CD4 T cells, with the first (presumably microvesicles) being
transferred by DCs before T cell activation and the second (presumably
exosomes) being transferred in response to T cell activation (Busch et al. 2008).
Our data could be perfectly fit with this model, considering that T cells, like the
professional APCs they interact with, release EVs in order to stimulate other cells.

124
2. Another layer of activation of T-T cell interaction
We wondered about the functional capabilities of T cells to present the
MHC-II in a non conventional way compared to the classical APCs. Zhou et al.
showed that CD4+ T cells could present trogocytosed Ag to naïve T cells, causing
increase in CD25 and proliferation of the naïve T cells (Zhou et al. 2011). In
contrast, Helf et al. showed that T-T presentation led to inhibition of
effectory/memory T cells inhibitory for memory CD4 T cells but not for naïve T
cells (Helft et al. 2008). Recently, the universe of APCs, seemingly so well
established, has been changing and new cell type are proposed to express MHC-
II molecules and have antigen-presenting function. A number of hemotopoietic
cell types have been suggested to present antigens on MHC-II to CD4+ T cells,
including mast cells (Kambayashi et al. 2009), basophils (Yoshimoto et al. 2009),
eosinophils (Shi 2004), neutrophils (Abi Abdallah et al. 2011), innate lymphoid
cells (ILCs)(Hepworth et al. 2013) and also non-hematopoietic cell types (Dubrot
et al. 2014), such as endothelials cells and lymph node stromal cells (LNSCs)
(Kambayashi and Laufer 2014).
The second part of the dissertation is focused on new studies of T-T
differentiation trying to expand the role of trogocytosis in T cell function. Our
experiments proved that the interaction between Presenting and the Responding
(T cell-APCs and naïve T cells) is a new kind of interaction by T cell antigen
presentation that is not overlapping the conventional and most renowned antigen
presentation by dendritic cells. To simplify we can divide the experimental
procedure that we settled in two parts trying to mimic a T-cell mediated immune
response: the former one is characterized by the classical antigen recognition
between dendritic cells loaded with the specific antigen and purified CD4+ T cells;
the latter one is represented by the previous CD4+ T cells activated by DC and
naïve T cells. As a consequence of this interaction, we observed an unexpected
orientation into two differentiate effector subsets. Namely, that CD4 T cells that
have been activated by antigen presented by other T cells preferably become
Th17 whereas the antigen presenting T cells become regulatory T cells (Treg).
The findings concerning to a different orientation by Presenting and
Responding cells, has driven us to propose the idea that the abundance of
antigen presented by professional APCs determines the outcome of the CD4 T
125
cell response. A scarcity of antigen would give rise to frequent T-T antigen
presentation and a pro-inflammatory response, whereas a high abundance of
antigen-loaded professionals APCs would result in a tolerogenic APC-T cell
antigen presentation (Illustration 2).
How does the differentiation of naïve CD4 T cells towards distinct Th
subsets is regulated? It has become clear that the interplay of the critical master
regulators and of the stimuli that control their activation, is at the centre of these
differentiation decisions. CD4+ T cells are the key to both protection and
pathogenesis and inappropriate dysregulated CD4+ T-cell responses have been
characterized in many chronic inflammatory diseases of chronic inflammation
(Wu et al. 2016). We already know that the strength of the interaction, which
results from several ligand/receptor interaction, seems to determine the amount
of membrane fragments transferred. But there is another aspect that is eventually
dependent on stochastic events in the polarization process. Role of TCR signal
strength + Cytokine environment= deterministic or stochastic in the polarization
process?
The distinct profile that we were able to observe can be originated through
several layers of communication: a formation of a new immunological synapse
between T cells. In this stage of interaction, T cells communicate with each other
modifying their profile in order to activate an adaptive immune response in a
controlled microenvironment. A new secretion of cytokines that are considered
as “molecular words” (Alberto Mantovani, vaccines and immunity) depending on
first layer of activation between DC-T and on the second between T-T cells. In
conclusion, T cell differentiation can be driven mainly by cytokines and these can
be directed into both DCs-T cell, T cell-DCs and T-T cell synapses. Before us,
the group of Matthew Krummel described the role of T cell-T cell synapses in the
generation of protective CD8+ T cell memory supporting the idea that the
differentiation of CD8 T cells require not only T cell-APC interactions but also T-
T cell synapses, promoting synapctic cytokine exchange (Gerard et al. 2013). by
another group it has also been shown that T cells capture peptide- MHC
complexes and mediate antigen-specific signalling to other CD8+ T cells (Huang
126
et al. 1999). Similarly, antigen-specific CD4+ T cell- CD4+ T cell interactions may
regulate expansion after upregulation of MHC class II expression in CD4+ T cells
(Helft et al. 2008). In this work they proposed a model where the T-T cell
interaction leads to inhibition of the Antigen-experienced T cells, whereas the
normal interaction of naïve cells with the professional APCs leads to proliferation.
The group of Veiga explore the therapeutic potential of tpCD4+ T cells
(transphagocytic CD4+ T cells that kill internalized bacteria in lysosomes) that can
act as APCs presenting the antigenic peptide to CD8+ T cells with the aim to
generate a cytotoxic and memory response. A new role recapitulated by
conventional CD4+ T cells can change the paradigm of adaptive immune
response cells (Cruz-Adalia et al. 2018).
Our hypothesis could be corroborated by this model in which the main
characters are restricted to the subsets of CD4 helper cells. We proposed a
similar one focusing on CD4+ T cells activated by DCs cells, that are able to
interact with other CD4+ T naïve inducing a cellular polarization. We asked why
these interactions should happen in the secondary lymphoid organs during an
infection. There might be several biologic advantages. First, a spatial condition.
The cells of the immune system are continually on the move! Naïve t cells in
search of specific antigens and every DC that touches 5000 T cells an hour to
scan repertoire. It is like a frenetic scanning that finds a fit between TCR and DC
in an interaction long-lived described as IS. Dendritic cells are strategically
located at the common site of entry of microbes and in several tissues that can
be colonised by foreign antigens. When they recognized antigens through
receptors, they migrate preferentially to the T zones of LN, where T cells naïve
circulate in search for their cognate antigen. Here, the antigen presentation
occurs. Taking into account that the frequency of cognate APCs in the pool of
presenting cells in the lymph node is extremely low and there is no external
information to help the T cell locate the cognate APC, we believe that CD4 T cells
activated by DCs could have a role in presenting cognate antigens, likely
determined by the microenvironment that the cells are expose to. CD4+ T cells
can scan a greater number of DCs per unit of time to successfully detect their
cognate antigen in lymph nodes compared with CD8 T cells.
127
Second, a “sequence of conformational changes” of the material during
the acquisition process. Our running hypothesis is that in the early response to
an infection the number of directly infected professional APCs and professional
APCs that have taken the antigen are low. Therefore, if the T cells that initially
contact the professional APC displaying the pathogen’s antigen have the
possibility not only of becoming themselves activated and of differentiating into
an effector T cell, but also of presenting the same limited amount of antigen to
other T cells that did not reach the professional APC, this would be a way of
activating more antigen-specific T cells early during infection that it would be
physically possible if all T cells had to be directly activated by professional APCs.
Another advantage of a T cell APC is that during the encounter with an antigen-
loaded professional APC T cells have to scan the surface of the APC in search
for appropriate pMHC complexes and that requires time and a lot of energy.
These complexes accumulate and concentrate at the APC side of the IS in order
to provide a sustained signal that activates the T cell. By contrast, T cells that
have already acquired pMHC complexes from the professional APC by
trogocytosis can re-express the pMHC complexes, together with other acquired
molecules like CD80 and CD86, in an already-formed cluster, as presented in the
first part of the results. In this regard, an energetic concern arises: how do T cells
generate the force needed to tear off the APC-membrane patch containing
pMHC? The force required to pull a protein and surrounding lipids from a
membrane is on the same order of magnitude as the force needed to break a
high-affinity protein-protein interaction (Bell 1978). Therefore, coming back to the
origin of the story, trogocytosis could be also energetically beneficial for the T
cell, given that the acquired lipids could be recycled or metabolized. This might
increase the capacity of the T cell to proliferate and stimulate other naïve T cell
with the same antigen specificity.

128
2.1 Molecular mechanism
An other important topic regards the molecular mechanism that support
this differentiated profile; the key driver could be TOB1 (transducer of ERBB2-1).
It has been found from the our microarray results, that one of the most
differentially expressed gene in that signature, overexpressed by the Responding
cells and downregulated in the Presenting cells compared to the naïve CD4 T
cells, was TOB1. Remarkably this signature changes dramatically between 3 and
5 days. Furthermore, in a recent report was described a higher expression of
Tob1 in the IL-17 producing pro-inflammatory Th17 (Baranzini 2014), that could
confirm our hypothesis.
2.2 T cell -T cell antigen presentation in vivo.
The third part of the dissertation describe the T cell- T cell antigen
presentation in vivo. Taking advantage of mice models in which we facilitate the
communication between Presenting and Responding cells using congenic
markers (CD45.1 and CD45.2), two questions arise from our work: do T cells
present antigen to T cells in vivo? And how could be relevant the T-T cell
presentation in the response to different doses of a pathogen?
We performed the same experimental procedure as we did before with
DCs, but in this case immunizing the mice with different doses of MVA-OVA,
considered as a vector vaccine whose target is DC. The results unveiled the
same scenario of what we previously showed with different number of DCs and
we demonstrated that the dose of the antigen somehow determines T cell fate.
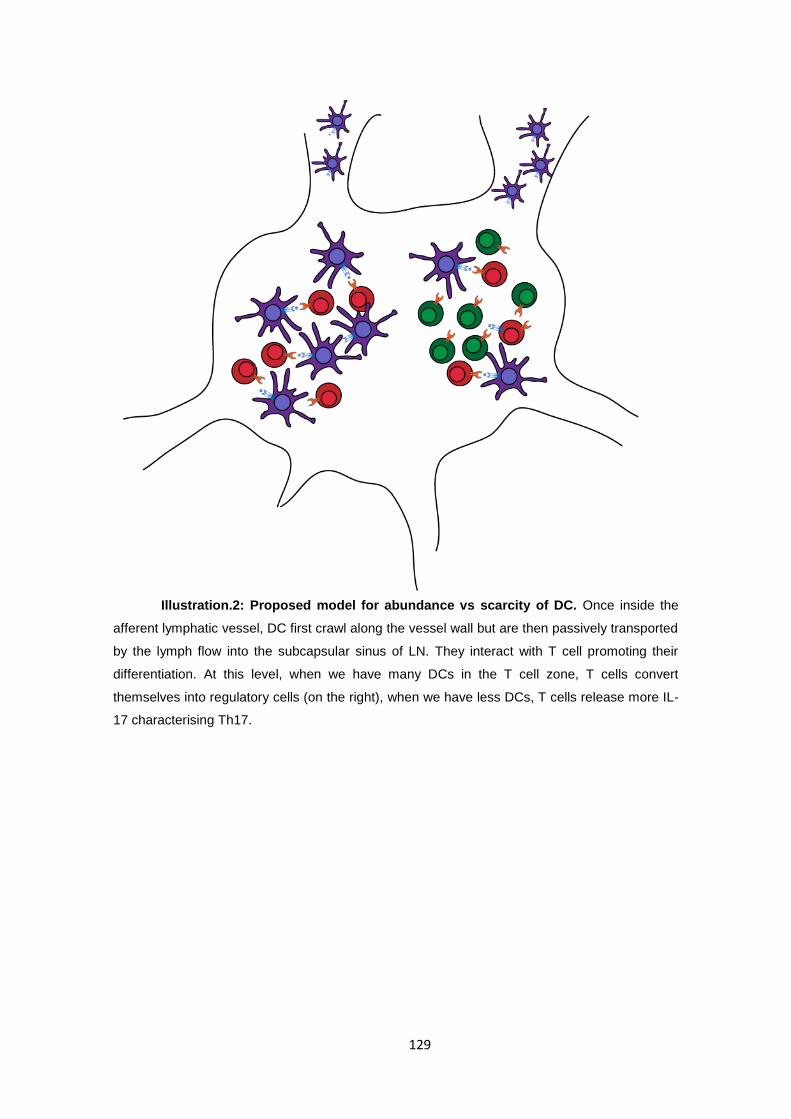
129
Illustration.2: Proposed model for abundance vs scarcity of DC. Once inside the
afferent lymphatic vessel, DC first crawl along the vessel wall but are then passively transported
by the lymph flow into the subcapsular sinus of LN. They interact with T cell promoting their
differentiation. At this level, when we have many DCs in the T cell zone, T cells convert
themselves into regulatory cells (on the right), when we have less DCs, T cells release more IL-
17 characterising Th17.

130
Illustration.3: Proposed model for T cell- T cell interaction. A-1. Dendritic cells are
strategically located at the common site of entry of microbes; when they recognized antigens,
they migrate preferentially to the T zones of LN through afferent vessel. 2. Once the DCs reach
the T cell area recognize naïve T cells and form an IS where they perform the antigen
presentation. 3. T cells acquire the peptide-MHC complexes and they express them on the
membrane surface by trogocytosis. 4. CD4+ T cells activated are able to stimulate other naïve T
cells and differentiate towards two subpopulations of T helper cells. B. Focus on the antigen
presentation between a mature DC and a CD4 T cell that can recognizes the antigen presented
by MHC class II restricted through a specific TCR. An active T cell present a co-stimulatory
molecule on its membrane.
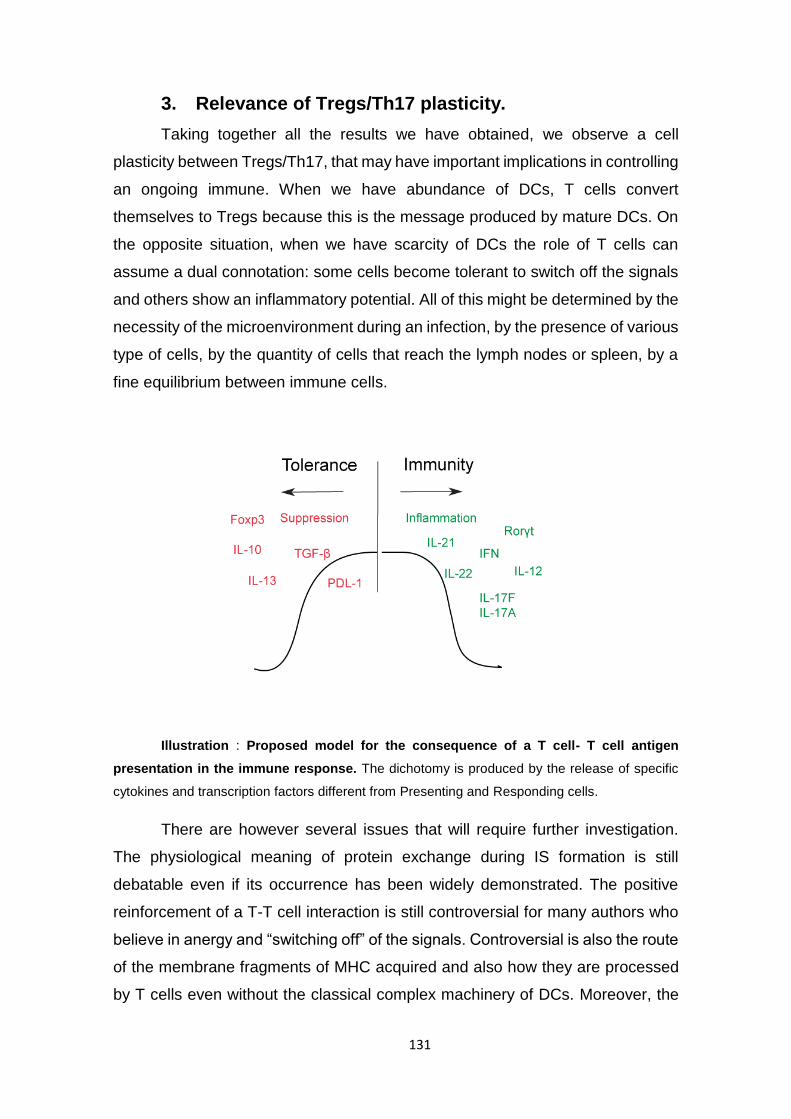
131
3. Relevance of Tregs/Th17 plasticity.
Taking together all the results we have obtained, we observe a cell
plasticity between Tregs/Th17, that may have important implications in controlling
an ongoing immune. When we have abundance of DCs, T cells convert
themselves to Tregs because this is the message produced by mature DCs. On
the opposite situation, when we have scarcity of DCs the role of T cells can
assume a dual connotation: some cells become tolerant to switch off the signals
and others show an inflammatory potential. All of this might be determined by the
necessity of the microenvironment during an infection, by the presence of various
type of cells, by the quantity of cells that reach the lymph nodes or spleen, by a
fine equilibrium between immune cells.
Illustration : Proposed model for the consequence of a T cell- T cell antigen
presentation in the immune response. The dichotomy is produced by the release of specific
cytokines and transcription factors different from Presenting and Responding cells.
There are however several issues that will require further investigation.
The physiological meaning of protein exchange during IS formation is still
debatable even if its occurrence has been widely demonstrated. The positive
reinforcement of a T-T cell interaction is still controversial for many authors who
believe in anergy and “switching off” of the signals. Controversial is also the route
of the membrane fragments of MHC acquired and also how they are processed
by T cells even without the classical complex machinery of DCs. Moreover, the
132
most relevant limitation depends on the impossibility of study the in vivo
microenvironment that is enriched of immune cells that can modify the
interactions.
In summary, the data presented in this dissertation suggest a new role for
CD4 helper cells and expand the knowledge of the CD4 functions that contribute
to the adaptive immune response. We propose a new scenario in which the
antigen-presenting abilities of T-APCs could have a role in the secondary immune
responses. A breakthrough for CD4 T cells that can convert themselves into
subpopulations depending on the dynamic nature of their interaction. Two
different layers of activation have been described: DC – T cells and T cell - T cell.
Our hypothesis could also explain the reason because a T cell went through this
process that is energetically expensive: because it unveils a role in the immune
regulation. We suggest that the acquisition of antigen/ MHC complexes is not a
passive and random “absorption” of materials from professional APCs, by the
contrast it may be a specific purposeful event regulating the balance between
immunity and tolerance.
.

133
CONCLUSIONS
134
Conclusions
As a result of the entire work presented in this thesis, we can establish the
the following conclusions:
T cells acquire MHC- I/II and co-stimulatory molecules by
Trogocytosis
1. T cells acquire MHC molecules from APCs and display them on the plasma
membrane.
2. T cells acquire also co-stimulatory molecules from that we found in clusters
with pMHC.
3. T cells can also acquire bystander pMHC and present it to naïve T cells of
the bystander specificity.
4. T cells take up pMHC from professional APCs and present it to naive T
cells of the same antigen specificity.
5. pMHC acquisition require RhoG.
T-T cell antigen presentation exerts a role in Th differentiation.
6. T Presenting cells (Tpres) proliferate more compared to the Responding
(Tresp)
7. T Presenting cells differentiate preferably towards regulatory T cells.
8. T Responding cells are less proliferative than T Presenting cells.
9. T Responding cells differentiate preferably towards pro-inflammatory
effector T cells.
10. The anti-proliferative Tob1 gene could have a role in mediating the pro-
inflammatory differentiation of T Responding cells based on a dynamic and
alternated change between pro-differentiation vs. pro-proliferative stimuli.
Role of T-T antigen presentation in vivo.
11. Rhog -/- mice show less severe symptoms in the EAE model and higher
expression of Tregs compared to the WT; in concordance with the results
135
12. Rhog -/- mice are more sensitive to a low dosis of Listeria monocytogenes,
presumably because they do not elicit a pro-inflammatory response due to
a defective T-T cell presentation.
13. The number of professional APCs expressing antigens determines CD4
T cell differentiation.

136
CONCLUSIONES

137
Conclusiones
Como resultado de todo el trabajo presentado en esta tesis, podemos establecer
las siguientes conclusiones:
Las células T adquieren MHC-I / II y moléculas coestimuladoras
por Trogocytosis
1. Las células T adquieren moléculas de MHC de APC y las muestran en la
membrana plasmática.
2. Las células T también adquieren moléculas coestimuladoras de las que
encontramos en grupos con pMHC.
3. Las células T también pueden adquirir al espectador pMHC y presentarlo a las
células T vírgenes de la especificidad del espectador.
4. Las células T toman pMHC de APCs profesionales y lo presentan a células T
ingenuas de la misma especificidad de antígeno.
5. La adquisición de pMHC requiere RhoG.
La presentación del antígeno de células T-T ejerce un papel en
la diferenciación Th.
6. T Las células presentadoras (Tpres) proliferan más en comparación con el
Respondedor (Tresp)
7. Las células presentadoras de T se diferencian preferiblemente hacia células T
reguladoras.
8. Las células que responden T son menos proliferativas que las células que
presentan T.
9. Las células que responden T se diferencian preferiblemente hacia las células
T efectoras proinflamatorias.
10. El gen antiproliferativo Tob1 podría tener un papel en la mediación de la
diferenciación proinflamatoria de las células T Responding en base a un cambio
dinámico y alternado entre la pro-diferenciación frente a los estímulos pro-
proliferativos.
138
Papel de la presentación del antígeno T-T in vivo.
11. Rhog - / - ratones muestran síntomas menos graves en el modelo EAE y una
mayor expresión de Tregs en comparación con el WT; en concordancia con los
resultados
12. Los ratones Rhog - / - son más sensibles a una dosis baja de Listeria
monocytogenes, presumiblemente porque no provocan una respuesta
proinflamatoria debido a una presentación defectuosa de células T-T.
13. El número de APCs profesionales que expresan antígenos determina la
diferenciación de células T CD4.

139
REFERENCES
140
"<J Immunol-2015-Monks-4061-5.pdf>."
Abi Abdallah, D. S., C. E. Egan, B. A. Butcher and E. Y. Denkers (2011). "Mouse neutrophils are professional antigen-presenting cells programmed to instruct Th1 and Th17 T-cell differentiation." Int Immunol 23(5): 317-326.
Alabed, Y. Z., E. Grados-Munro, G. B. Ferraro, S. H. Hsieh and A. E. Fournier (2006). "Neuronal responses to myelin are mediated by rho kinase." J Neurochem 96(6): 1616-1625.
Allenspach, E. J., P. Cullinan, J. Tong, Q. Tang, A. G. Tesciuba, J. L. Cannon, S. M. Takahashi, R. Morgan, J. K. Burkhardt and A. I. Sperling (2001). "ERM-dependent movement of CD43 defines a novel protein complex distal to the immunological synapse." Immunity 15(5): 739-750.
Arnold, P. Y. and M. D. Mannie (1999). "Vesicles bearing MHC class II molecules mediate transfer of antigen from antigen-presenting cells to CD4+ T cells." Eur J Immunol 29(4): 1363-1373.
Banchereau, J. and R. M. Steinman (1998). "Dendritic cells and the control of immunity." Nature 392(6673): 245-252.
Baranzini, S. E. (2014). "The role of antiproliferative gene Tob1 in the immune system." Clin Exp Neuroimmunol 5(2): 132-136.
Barnden, M. J., J. Allison, W. R. Heath and F. R. Carbone (1998). "Defective TCR expression in transgenic mice constructed using cDNA-based alpha- and beta-chain genes under the control of heterologous regulatory elements." Immunol Cell Biol 76(1): 34-40.
Batista, F. D., D. Iber and M. S. Neuberger (2001). "B cells acquire antigen from target cells after synapse formation." Nature 411(6836): 489-494.
Bell, G. I. (1978). "Models for the specific adhesion of cells to cells." Science 200(4342): 618-627.
Bellanger, J. M., C. Astier, C. Sardet, Y. Ohta, T. P. Stossel and A. Debant (2000). "The Rac1- and RhoG-specific GEF domain of Trio targets filamin to remodel cytoskeletal actin." Nat Cell Biol 2(12): 888-892.
Bilate, A. M. and J. J. Lafaille (2012). "Induced CD4+Foxp3+ regulatory T cells in immune tolerance." Annu Rev Immunol 30: 733-758.
Bonecchi, R., G. Bianchi, P. P. Bordignon, D. D'Ambrosio, R. Lang, A. Borsatti, S. Sozzani, P. Allavena, P. A. Gray, A. Mantovani and F. Sinigaglia (1998). "Differential expression of chemokine receptors and chemotactic responsiveness of type 1 T helper cells (Th1s) and Th2s." J Exp Med 187(1): 129-134.

141
Bourne, H. R., D. A. Sanders and F. McCormick (1990). "The GTPase superfamily: a conserved switch for diverse cell functions." Nature 348(6297): 125-132.
Bunnell, S. C., A. L. Singer, D. I. Hong, B. H. Jacque, M. S. Jordan, M. C. Seminario, V. A. Barr, G. A. Koretzky and L. E. Samelson (2006). "Persistence of cooperatively stabilized signaling clusters drives T-cell activation." Mol Cell Biol 26(19): 7155-7166.
Busch, A., T. Quast, S. Keller, W. Kolanus, P. Knolle, P. Altevogt and A. Limmer (2008). "Transfer of T cell surface molecules to dendritic cells upon CD4+ T cell priming involves two distinct mechanisms." J Immunol 181(6): 3965-3973.
Bustelo, X. R., V. Sauzeau and I. M. Berenjeno (2007). "GTP-binding proteins of the Rho/Rac family: regulation, effectors and functions in vivo." Bioessays 29(4): 356-370.
Cahalan, M. D. and I. Parker (2006). "Imaging the choreography of lymphocyte trafficking and the immune response." Curr Opin Immunol 18(4): 476-482.
Campi, G., R. Varma and M. L. Dustin (2005). "Actin and agonist MHC-peptide complex-dependent T cell receptor microclusters as scaffolds for signaling." J Exp Med 202(8): 1031-1036.
Carlin, L. M., K. Eleme, F. E. McCann and D. M. Davis (2001). "Intercellular transfer and supramolecular organization of human leukocyte antigen C at inhibitory natural killer cell immune synapses." J Exp Med 194(10): 1507-1517.
Chai, J. G., I. Bartok, D. Scott, J. Dyson and R. Lechler (1998). "T:T antigen presentation by activated murine CD8+ T cells induces anergy and apoptosis." J Immunol 160(8): 3655-3665.
Chen, L. and D. B. Flies (2013). "Molecular mechanisms of T cell co-stimulation and co-inhibition." Nat Rev Immunol 13(4): 227-242.
Choi, B. Y., J. H. Kim, A. R. Kho, I. Y. Kim, S. H. Lee, B. E. Lee, E. Choi, M. Sohn, M. Stevenson, T. N. Chung, T. M. Kauppinen and S. W. Suh (2015). "Inhibition of NADPH oxidase activation reduces EAE-induced white matter damage in mice." J Neuroinflammation 12: 104.
Choudhuri, K., J. Llodra, E. W. Roth, J. Tsai, S. Gordo, K. W. Wucherpfennig, L. C. Kam, D. L. Stokes and M. L. Dustin (2014). "Polarized release of T-cell-receptor-enriched microvesicles at the immunological synapse." Nature 507(7490): 118-123.
Cimmino, L., G. A. Martins, J. Liao, E. Magnusdottir, G. Grunig, R. K. Perez and K. L. Calame (2008). "Blimp-1 attenuates Th1 differentiation by repression of ifng, tbx21, and bcl6 gene expression." J Immunol 181(4): 2338-2347.
142
Cote-Sierra, J., G. Foucras, L. Guo, L. Chiodetti, H. A. Young, J. Hu-Li, J. Zhu and W. E. Paul (2004). "Interleukin 2 plays a central role in Th2 differentiation." Proc Natl Acad Sci U S A 101(11): 3880-3885.
Couper, K. N., D. G. Blount, M. S. Wilson, J. C. Hafalla, Y. Belkaid, M. Kamanaka, R. A. Flavell, J. B. de Souza and E. M. Riley (2008). "IL-10 from CD4CD25Foxp3CD127 adaptive regulatory T cells modulates parasite clearance and pathology during malaria infection." PLoS Pathog 4(2): e1000004.
Crotty, S. (2014). "T follicular helper cell differentiation, function, and roles in disease." Immunity 41(4): 529-542.
Cruz-Adalia, A., G. Ramirez-Santiago, J. Osuna-Perez, M. Torres-Torresano, V. Zorita, A. Martinez-Riano, V. Boccasavia, A. Borroto, G. Martinez Del Hoyo, J. M. Gonzalez-Granado, B. Alarcon, F. Sanchez-Madrid and E. Veiga (2018). "Author Correction: Conventional CD4(+) T cells present bacterial antigens to induce cytotoxic and memory CD8(+) T cell responses." Nat Commun 9(1): 495.
Cua, D. J., J. Sherlock, Y. Chen, C. A. Murphy, B. Joyce, B. Seymour, L. Lucian, W. To, S. Kwan, T. Churakova, S. Zurawski, M. Wiekowski, S. A. Lira, D. Gorman, R. A. Kastelein and J. D. Sedgwick (2003). "Interleukin-23 rather than interleukin-12 is the critical cytokine for autoimmune inflammation of the brain." Nature 421(6924): 744-748.
Darnell, J. E., Jr., I. M. Kerr and G. R. Stark (1994). "Jak-STAT pathways and transcriptional activation in response to IFNs and other extracellular signaling proteins." Science 264(5164): 1415-1421.
Davis, D. M. (2007). "Intercellular transfer of cell-surface proteins is common and can affect many stages of an immune response." Nat Rev Immunol 7(3): 238-243.
Davis, D. M. and M. L. Dustin (2004). "What is the importance of the immunological synapse?" Trends Immunol 25(6): 323-327.
deBakker, C. D., L. B. Haney, J. M. Kinchen, C. Grimsley, M. Lu, D. Klingele, P. K. Hsu, B. K. Chou, L. C. Cheng, A. Blangy, J. Sondek, M. O. Hengartner, Y. C. Wu and K. S. Ravichandran (2004). "Phagocytosis of apoptotic cells is regulated by a UNC-73/TRIO-MIG-2/RhoG signaling module and armadillo repeats of CED-12/ELMO." Curr Biol 14(24): 2208-2216.
Debant, A., C. Serra-Pages, K. Seipel, S. O'Brien, M. Tang, S. H. Park and M. Streuli (1996). "The multidomain protein Trio binds the LAR transmembrane tyrosine phosphatase, contains a protein kinase domain, and has separate rac-specific and rho-specific guanine nucleotide exchange factor domains." Proc Natl Acad Sci U S A 93(11): 5466-5471.
143
DeJarnette, J. B., C. L. Sommers, K. Huang, K. J. Woodside, R. Emmons, K. Katz, E. W. Shores and P. E. Love (1998). "Specific requirement for CD3epsilon in T cell development." Proc Natl Acad Sci U S A 95(25): 14909-14914.
del Rio, M. L., G. Bernhardt, J. I. Rodriguez-Barbosa and R. Forster (2010). "Development and functional specialization of CD103+ dendritic cells." Immunol Rev 234(1): 268-281.
Delgado, P., B. Cubelos, E. Calleja, N. Martinez-Martin, A. Cipres, I. Merida, C. Bellas, X. R. Bustelo and B. Alarcon (2009). "Essential function for the GTPase TC21 in homeostatic antigen receptor signaling." Nat Immunol 10(8): 880-888.
Delon, J., K. Kaibuchi and R. N. Germain (2001). "Exclusion of CD43 from the immunological synapse is mediated by phosphorylation-regulated relocation of the cytoskeletal adaptor moesin." Immunity 15(5): 691-701.
Depoil, D., S. Fleire, B. L. Treanor, M. Weber, N. E. Harwood, K. L. Marchbank, V. L. Tybulewicz and F. D. Batista (2008). "CD19 is essential for B cell activation by promoting B cell receptor-antigen microcluster formation in response to membrane-bound ligand." Nat Immunol 9(1): 63-72.
Dhainaut, M. and M. Moser (2014). "Regulation of immune reactivity by intercellular transfer." Front Immunol 5: 112.
Dopfer, E. P., S. Minguet and W. W. Schamel (2011). "A new vampire saga: the molecular mechanism of T cell trogocytosis." Immunity 35(2): 151-153.
Dubrot, J., F. V. Duraes, L. Potin, F. Capotosti, D. Brighouse, T. Suter, S. LeibundGut-Landmann, N. Garbi, W. Reith, M. A. Swartz and S. Hugues (2014). "Lymph node stromal cells acquire peptide-MHCII complexes from dendritic cells and induce antigen-specific CD4(+) T cell tolerance." J Exp Med 211(6): 1153-1166.
Dustin, M. L. (2009). "The cellular context of T cell signaling." Immunity 30(4): 482-492.
Dustin, M. L., S. K. Bromley, Z. Kan, D. A. Peterson and E. R. Unanue (1997). "Antigen receptor engagement delivers a stop signal to migrating T lymphocytes." Proc Natl Acad Sci U S A 94(8): 3909-3913.
Dustin, M. L. and K. Choudhuri (2016). "Signaling and Polarized Communication Across the T Cell Immunological Synapse." Annu Rev Cell Dev Biol 32: 303-325.
Elfenbein, A., J. M. Rhodes, J. Meller, M. A. Schwartz, M. Matsuda and M. Simons (2009). "Suppression of RhoG activity is mediated by a syndecan 4-synectin-RhoGDI1 complex and is reversed by PKCalpha in a Rac1 activation pathway." J Cell Biol 186(1): 75-83.

144
Espinosa, E., J. Tabiasco, D. Hudrisier and J. J. Fournie (2002). "Synaptic transfer by human gamma delta T cells stimulated with soluble or cellular antigens." J Immunol 168(12): 6336-6343.
Fleire, S. J., J. P. Goldman, Y. R. Carrasco, M. Weber, D. Bray and F. D. Batista (2006). "B cell ligand discrimination through a spreading and contraction response." Science 312(5774): 738-741.
Fontenot, J. D., M. A. Gavin and A. Y. Rudensky (2003). "Foxp3 programs the development and function of CD4+CD25+ regulatory T cells." Nat Immunol 4(4): 330-336.
Fooksman, D. R., S. R. Shaikh, S. Boyle and M. Edidin (2009). "Cutting edge: phosphatidylinositol 4,5-bisphosphate concentration at the APC side of the immunological synapse is required for effector T cell function." J Immunol 182(9): 5179-5182.
Freiberg, B. A., H. Kupfer, W. Maslanik, J. Delli, J. Kappler, D. M. Zaller and A. Kupfer (2002). "Staging and resetting T cell activation in SMACs." Nat Immunol 3(10): 911-917.
Gadina, M., D. Hilton, J. A. Johnston, A. Morinobu, A. Lighvani, Y. J. Zhou, R. Visconti and J. J. O'Shea (2001). "Signaling by type I and II cytokine receptors: ten years after." Curr Opin Immunol 13(3): 363-373.
Gauthier-Rouviere, C., E. Vignal, M. Meriane, P. Roux, P. Montcourier and P. Fort (1998). "RhoG GTPase controls a pathway that independently activates Rac1 and Cdc42Hs." Mol Biol Cell 9(6): 1379-1394.
Gerard, A., O. Khan, P. Beemiller, E. Oswald, J. Hu, M. Matloubian and M. F. Krummel (2013). "Secondary T cell-T cell synaptic interactions drive the differentiation of protective CD8+ T cells." Nat Immunol 14(4): 356-363.
Goitre, L., E. Trapani, L. Trabalzini and S. F. Retta (2014). "The Ras superfamily of small GTPases: the unlocked secrets." Methods Mol Biol 1120: 1-18.
Gottschalk, R. A., E. Corse and J. P. Allison (2010). "TCR ligand density and affinity determine peripheral induction of Foxp3 in vivo." J Exp Med 207(8): 1701-1711.
Grakoui, A., S. K. Bromley, C. Sumen, M. M. Davis, A. S. Shaw, P. M. Allen and M. L. Dustin (1999). "The immunological synapse: a molecular machine controlling T cell activation." Science 285(5425): 221-227.
Granucci, F., I. Zanoni, S. Feau and P. Ricciardi-Castagnoli (2003). "Dendritic cell regulation of immune responses: a new role for interleukin 2 at the intersection of innate and adaptive immunity." EMBO J 22(11): 2546-2551.

145
Gumienny, T. L., E. Brugnera, A. C. Tosello-Trampont, J. M. Kinchen, L. B. Haney, K. Nishiwaki, S. F. Walk, M. E. Nemergut, I. G. Macara, R. Francis, T. Schedl, Y. Qin, L. Van Aelst, M. O. Hengartner and K. S. Ravichandran (2001). "CED-12/ELMO, a novel member of the CrkII/Dock180/Rac pathway, is required for phagocytosis and cell migration." Cell 107(1): 27-41.
Heasman, S. J. and A. J. Ridley (2008). "Mammalian Rho GTPases: new insights into their functions from in vivo studies." Nat Rev Mol Cell Biol 9(9): 690-701.
Helft, J., A. Jacquet, N. T. Joncker, I. Grandjean, G. Dorothee, A. Kissenpfennig, B. Malissen, P. Matzinger and O. Lantz (2008). "Antigen-specific T-T interactions regulate CD4 T-cell expansion." Blood 112(4): 1249-1258.
Hepworth, M. R., L. A. Monticelli, T. C. Fung, C. G. Ziegler, S. Grunberg, R. Sinha, A. R. Mantegazza, H. L. Ma, A. Crawford, J. M. Angelosanto, E. J. Wherry, P. A. Koni, F. D. Bushman, C. O. Elson, G. Eberl, D. Artis and G. F. Sonnenberg (2013). "Innate lymphoid cells regulate CD4+ T-cell responses to intestinal commensal bacteria." Nature 498(7452): 113-117.
Herrera, O. B., D. Golshayan, R. Tibbott, F. Salcido Ochoa, M. J. James, F. M. Marelli-Berg and R. I. Lechler (2004). "A novel pathway of alloantigen presentation by dendritic cells." J Immunol 173(8): 4828-4837.
Ho, E. and L. Dagnino (2012). "Epidermal growth factor induction of front-rear polarity and migration in keratinocytes is mediated by integrin-linked kinase and ELMO2." Mol Biol Cell 23(3): 492-502.
Ho, I. C., D. Lo and L. H. Glimcher (1998). "c-maf promotes T helper cell type 2 (Th2) and attenuates Th1 differentiation by both interleukin 4-dependent and -independent mechanisms." J Exp Med 188(10): 1859-1866.
Hogquist, K. A., S. C. Jameson, W. R. Heath, J. L. Howard, M. J. Bevan and F. R. Carbone (1994). "T cell receptor antagonist peptides induce positive selection." Cell 76(1): 17-27.
Hori, S., T. Nomura and S. Sakaguchi (2003). "Control of regulatory T cell development by the transcription factor Foxp3." Science 299(5609): 1057-1061.
Hu, W. and C. Pasare (2013). "Location, location, location: tissue-specific regulation of immune responses." J Leukoc Biol 94(3): 409-421.
Huang, J. (1999). "TCR-Mediated Internalization of Peptide-MHC Complexes Acquired by T Cells." Science 286(5441): 952-954.

146
Huang, J. F., Y. Yang, H. Sepulveda, W. Shi, I. Hwang, P. A. Peterson, M. R. Jackson, J. Sprent and Z. Cai (1999). "TCR-Mediated internalization of peptide-MHC complexes acquired by T cells." Science 286(5441): 952-954.
Hudrisier, D., J. Riond, H. Mazarguil, J. E. Gairin and E. Joly (2001). "Cutting edge: CTLs rapidly capture membrane fragments from target cells in a TCR signaling-dependent manner." J Immunol 166(6): 3645-3649.
Hugues, S., L. Fetler, L. Bonifaz, J. Helft, F. Amblard and S. Amigorena (2004). "Distinct T cell dynamics in lymph nodes during the induction of tolerance and immunity." Nat Immunol 5(12): 1235-1242.
Huppa, J. B. and M. M. Davis (2003). "T-cell-antigen recognition and the immunological synapse." Nat Rev Immunol 3(12): 973-983.
Inaba, K., M. Inaba, N. Romani, H. Aya, M. Deguchi, S. Ikehara, S. Muramatsu and R. M. Steinman (1992). "Generation of large numbers of dendritic cells from mouse bone marrow cultures supplemented with granulocyte/macrophage colony-stimulating factor." J Exp Med 176(6): 1693-1702.
Inaba, K., S. Turley, F. Yamaide, T. Iyoda, K. Mahnke, M. Inaba, M. Pack, M. Subklewe, B. Sauter, D. Sheff, M. Albert, N. Bhardwaj, I. Mellman and R. M. Steinman (1998). "Efficient presentation of phagocytosed cellular fragments on the major histocompatibility complex class II products of dendritic cells." J Exp Med 188(11): 2163-2173.
Ivanov, II, B. S. McKenzie, L. Zhou, C. E. Tadokoro, A. Lepelley, J. J. Lafaille, D. J. Cua and D. R. Littman (2006). "The orphan nuclear receptor RORgammat directs the differentiation program of proinflammatory IL-17+ T helper cells." Cell 126(6): 1121-1133.
Joly, E. and D. Hudrisier (2003). "What is trogocytosis and what is its purpose?" Nat Immunol 4(9): 815.
Josefowicz, S. Z. and A. Rudensky (2009). "Control of regulatory T cell lineage commitment and maintenance." Immunity 30(5): 616-625.
Kambayashi, T., E. J. Allenspach, J. T. Chang, T. Zou, J. E. Shoag, S. L. Reiner, A. J. Caton and G. A. Koretzky (2009). "Inducible MHC class II expression by mast cells supports effector and regulatory T cell activation." J Immunol 182(8): 4686-4695.
Kambayashi, T. and T. M. Laufer (2014). "Atypical MHC class II-expressing antigen-presenting cells: can anything replace a dendritic cell?" Nat Rev Immunol 14(11): 719-730.

147
Katoh, H., K. Hiramoto and M. Negishi (2006). "Activation of Rac1 by RhoG regulates cell migration." J Cell Sci 119(Pt 1): 56-65.
Katoh, H. and M. Negishi (2003). "RhoG activates Rac1 by direct interaction with the Dock180-binding protein Elmo." Nature 424(6947): 461-464.
Katoh, H., H. Yasui, Y. Yamaguchi, J. Aoki, H. Fujita, K. Mori and M. Negishi (2000). "Small GTPase RhoG is a key regulator for neurite outgrowth in PC12 cells." Mol Cell Biol 20(19): 7378-7387.
Kayne, R. D., D. Burton and J. L. Atlee, 3rd (1989). "Case conference 4--1989. A 4-year-old, 17-kg boy with panhypopituitarism, cryptorchidism, developmental delay, and second-degree heart block." J Cardiothorac Anesth 3(4): 497-503.
Khattri, R., T. Cox, S. A. Yasayko and F. Ramsdell (2003). "An essential role for Scurfin in CD4+CD25+ T regulatory cells." Nat Immunol 4(4): 337-342.
Kim, J. Y., M. H. Oh, L. P. Bernard, I. G. Macara and H. Zhang (2011). "The RhoG/ELMO1/Dock180 signaling module is required for spine morphogenesis in hippocampal neurons." J Biol Chem 286(43): 37615-37624.
Kretschmer, K., I. Apostolou, D. Hawiger, K. Khazaie, M. C. Nussenzweig and H. von Boehmer (2005). "Inducing and expanding regulatory T cell populations by foreign antigen." Nat Immunol 6(12): 1219-1227.
Kroenke, M. A., D. Eto, M. Locci, M. Cho, T. Davidson, E. K. Haddad and S. Crotty (2012). "Bcl6 and Maf cooperate to instruct human follicular helper CD4 T cell differentiation." J Immunol 188(8): 3734-3744.
Langrish, C. L., Y. Chen, W. M. Blumenschein, J. Mattson, B. Basham, J. D. Sedgwick, T. McClanahan, R. A. Kastelein and D. J. Cua (2005). "IL-23 drives a pathogenic T cell population that induces autoimmune inflammation." J Exp Med 201(2): 233-240.
Lasserre, R. and A. Alcover (2010). "Cytoskeletal cross-talk in the control of T cell antigen receptor signaling." FEBS Lett 584(24): 4845-4850.
Lighvani, A. A., D. M. Frucht, D. Jankovic, H. Yamane, J. Aliberti, B. D. Hissong, B. V. Nguyen, M. Gadina, A. Sher, W. E. Paul and J. J. O'Shea (2001). "T-bet is rapidly induced by interferon-gamma in lymphoid and myeloid cells." Proc Natl Acad Sci U S A 98(26): 15137-15142.
Lin, A. and K. Lore (2017). "Granulocytes: New Members of the Antigen-Presenting Cell Family." Front Immunol 8: 1781.
148
Lin, M. H., F. C. Chou, L. T. Yeh, S. H. Fu, H. Y. Chiou, K. I. Lin, D. M. Chang and H. K. Sytwu (2013). "B lymphocyte-induced maturation protein 1 (BLIMP-1) attenuates autoimmune diabetes in NOD mice by suppressing Th1 and Th17 cells." Diabetologia 56(1): 136-146.
Lindenbergh, M. F. S. and W. Stoorvogel (2018). "Antigen Presentation by Extracellular Vesicles from Professional Antigen-Presenting Cells." Annu Rev Immunol 36: 435-459.
Loetscher, M., P. Loetscher, N. Brass, E. Meese and B. Moser (1998). "Lymphocyte-specific chemokine receptor CXCR3: regulation, chemokine binding and gene localization." Eur J Immunol 28(11): 3696-3705.
Loetscher, P., M. Uguccioni, L. Bordoli, M. Baggiolini, B. Moser, C. Chizzolini and J. M. Dayer (1998). "CCR5 is characteristic of Th1 lymphocytes." Nature 391(6665): 344-345.
Loser, K. and S. Beissert (2012). "Regulatory T cells: banned cells for decades." J Invest Dermatol 132(3 Pt 2): 864-871.
Maleki Vareki, S., C. Garrigos and I. Duran (2017). "Biomarkers of response to PD-1/PD-L1 inhibition." Crit Rev Oncol Hematol 116: 116-124.
Mangan, P. R., L. E. Harrington, D. B. O'Quinn, W. S. Helms, D. C. Bullard, C. O. Elson, R. D. Hatton, S. M. Wahl, T. R. Schoeb and C. T. Weaver (2006). "Transforming growth factor-beta induces development of the T(H)17 lineage." Nature 441(7090): 231-234.
Mannie, M. D., S. K. Rendall, P. Y. Arnold, J. P. Nardella and G. A. White (1996). "Anergy-associated T cell antigen presentation. A mechanism of infectious tolerance in experimental autoimmune encephalomyelitis." J Immunol 157(3): 1062-1070.
Martinez-Martin, N., E. Fernandez-Arenas, S. Cemerski, P. Delgado, M. Turner, J. Heuser, D. J. Irvine, B. Huang, X. R. Bustelo, A. Shaw and B. Alarcon (2011). "T cell receptor internalization from the immunological synapse is mediated by TC21 and RhoG GTPase-dependent phagocytosis." Immunity 35(2): 208-222.
Matzinger, P. (2002). "An innate sense of danger." Ann N Y Acad Sci 961: 341-342.
Mayor, S. and R. E. Pagano (2007). "Pathways of clathrin-independent endocytosis." Nat Rev Mol Cell Biol 8(8): 603-612.
McCarthy, C., D. Shepherd, S. Fleire, V. S. Stronge, M. Koch, P. A. Illarionov, G. Bossi, M. Salio, G. Denkberg, F. Reddington, A. Tarlton, B. G. Reddy, R. R. Schmidt, Y. Reiter, G. M. Griffiths, P. A. van der Merwe, G. S. Besra, E. Y. Jones, F. D. Batista and V. Cerundolo (2007). "The length of lipids bound to human CD1d molecules modulates the affinity of NKT cell TCR and the threshold of NKT cell activation." J Exp Med 204(5): 1131-1144.
149
Mempel, T. R., S. E. Henrickson and U. H. Von Andrian (2004). "T-cell priming by dendritic cells in lymph nodes occurs in three distinct phases." Nature 427(6970): 154-159.
Mogensen, T. H. (2009). "Pathogen recognition and inflammatory signaling in innate immune defenses." Clin Microbiol Rev 22(2): 240-273, Table of Contents.
Monks, C. R., B. A. Freiberg, H. Kupfer, N. Sciaky and A. Kupfer (1998). "Three-dimensional segregation of supramolecular activation clusters in T cells." Nature 395(6697): 82-86.
Monks, C. R., B. A. Freiberg, H. Kupfer, N. Sciaky and A. Kupfer (2015). "Pillars article: Three-dimensional segregation of supramolecular activation clusters in T cells. Nature. 1998. 395: 82-86." J Immunol 194(9): 4061-4065.
Nakaya, M., M. Tanaka, Y. Okabe, R. Hanayama and S. Nagata (2006). "Opposite effects of rho family GTPases on engulfment of apoptotic cells by macrophages." J Biol Chem 281(13): 8836-8842.
Norcross, M. A. (1984). "A synaptic basis for T-lymphocyte activation." Ann Immunol (Paris) 135D(2): 113-134.
Nurieva, R. I., Y. Chung, G. J. Martinez, X. O. Yang, S. Tanaka, T. D. Matskevitch, Y. H. Wang and C. Dong (2009). "Bcl6 mediates the development of T follicular helper cells." Science 325(5943): 1001-1005.
Onodera, A., M. Yamashita, Y. Endo, M. Kuwahara, S. Tofukuji, H. Hosokawa, A. Kanai, Y. Suzuki and T. Nakayama (2010). "STAT6-mediated displacement of polycomb by trithorax complex establishes long-term maintenance of GATA3 expression in T helper type 2 cells." J Exp Med 207(11): 2493-2506.
Oppmann, B., R. Lesley, B. Blom, J. C. Timans, Y. Xu, B. Hunte, F. Vega, N. Yu, J. Wang, K. Singh, F. Zonin, E. Vaisberg, T. Churakova, M. Liu, D. Gorman, J. Wagner, S. Zurawski, Y. Liu, J. S. Abrams, K. W. Moore, D. Rennick, R. de Waal-Malefyt, C. Hannum, J. F. Bazan and R. A. Kastelein (2000). "Novel p19 protein engages IL-12p40 to form a cytokine, IL-23, with biological activities similar as well as distinct from IL-12." Immunity 13(5): 715-725.
Orange, J. S. (2008). "Formation and function of the lytic NK-cell immunological synapse." Nat Rev Immunol 8(9): 713-725.
Patel, D. M., P. Y. Arnold, G. A. White, J. P. Nardella and M. D. Mannie (1999). "Class II MHC/peptide complexes are released from APC and are acquired by T cell responders during specific antigen recognition." J Immunol 163(10): 5201-5210.

150
Paul, W. E., M. Brown, P. Hornbeck, J. Mizuguchi, J. Ohara, E. Rabin, C. Snapper and W. Tsang (1987). "Regulation of B-lymphocyte activation, proliferation, and differentiation." Ann N Y Acad Sci 505: 82-89.
Paul, W. E. and R. A. Seder (1994). "Lymphocyte responses and cytokines." Cell 76(2): 241-251.
Pham, T., P. Mero and J. W. Booth (2011). "Dynamics of macrophage trogocytosis of rituximab-coated B cells." PLoS One 6(1): e14498.
Prieto-Sanchez, R. M., I. M. Berenjeno and X. R. Bustelo (2006). "Involvement of the Rho/Rac family member RhoG in caveolar endocytosis." Oncogene 25(21): 2961-2973.
Rakebrandt, N., K. Littringer and N. Joller (2016). "Regulatory T cells: balancing protection versus pathology." Swiss Med Wkly 146: w14343.
Raposo, G., H. W. Nijman, W. Stoorvogel, R. Liejendekker, C. V. Harding, C. J. Melief and H. J. Geuze (1996). "B lymphocytes secrete antigen-presenting vesicles." J Exp Med 183(3): 1161-1172.
Rengarajan, J., K. A. Mowen, K. D. McBride, E. D. Smith, H. Singh and L. H. Glimcher (2002). "Interferon regulatory factor 4 (IRF4) interacts with NFATc2 to modulate interleukin 4 gene expression." J Exp Med 195(8): 1003-1012.
Revy, P., M. Sospedra, B. Barbour and A. Trautmann (2001). "Functional antigen-independent synapses formed between T cells and dendritic cells." Nat Immunol 2(10): 925-931.
Robinson, A. P., J. M. Rodgers, G. E. Goings and S. D. Miller (2014). "Characterization of oligodendroglial populations in mouse demyelinating disease using flow cytometry: clues for MS pathogenesis." PLoS One 9(9): e107649.
Romagnoli, P. A., M. F. Premenko-Lanier, G. D. Loria and J. D. Altman (2013). "CD8 T cell memory recall is enhanced by novel direct interactions with CD4 T cells enabled by MHC class II transferred from APCs." PLoS One 8(2): e56999.
Roumier, A., J. C. Olivo-Marin, M. Arpin, F. Michel, M. Martin, P. Mangeat, O. Acuto, A. Dautry-Varsat and A. Alcover (2001). "The membrane-microfilament linker ezrin is involved in the formation of the immunological synapse and in T cell activation." Immunity 15(5): 715-728.
Sabzevari, H., J. Kantor, A. Jaigirdar, Y. Tagaya, M. Naramura, J. Hodge, J. Bernon and J. Schlom (2001). "Acquisition of CD80 (B7-1) by T cells." J Immunol 166(4): 2505-2513.

151
Sallusto, F., D. Lenig, C. R. Mackay and A. Lanzavecchia (1998). "Flexible programs of chemokine receptor expression on human polarized T helper 1 and 2 lymphocytes." J Exp Med 187(6): 875-883.
Santarlasci, V., L. Maggi, A. Mazzoni, M. Capone, V. Querci, M. C. Rossi, L. Beltrame, D. Cavalieri, R. De Palma, F. Liotta, L. Cosmi, E. Maggi, S. Romagnani and F. Annunziato (2014). "IL-4-induced gene 1 maintains high Tob1 expression that contributes to TCR unresponsiveness in human T helper 17 cells." Eur J Immunol 44(3): 654-661.
Scheicher, C., M. Mehlig, R. Zecher and K. Reske (1992). "Dendritic cells from mouse bone marrow: in vitro differentiation using low doses of recombinant granulocyte-macrophage colony-stimulating factor." J Immunol Methods 154(2): 253-264.
Shi, H. Z. (2004). "Eosinophils function as antigen-presenting cells." J Leukoc Biol 76(3): 520-527.
Stoll, S., J. Delon, T. M. Brotz and R. N. Germain (2002). "Dynamic imaging of T cell-dendritic cell interactions in lymph nodes." Science 296(5574): 1873-1876.
Szabo, S. J., A. S. Dighe, U. Gubler and K. M. Murphy (1997). "Regulation of the interleukin (IL)-12R beta 2 subunit expression in developing T helper 1 (Th1) and Th2 cells." J Exp Med 185(5): 817-824.
Szabo, S. J., S. T. Kim, G. L. Costa, X. Zhang, C. G. Fathman and L. H. Glimcher (2000). "A novel transcription factor, T-bet, directs Th1 lineage commitment." Cell 100(6): 655-669.
Takeda, K., T. Tanaka, W. Shi, M. Matsumoto, M. Minami, S. Kashiwamura, K. Nakanishi, N. Yoshida, T. Kishimoto and S. Akira (1996). "Essential role of Stat6 in IL-4 signalling." Nature 380(6575): 627-630.
Thery, C. and S. Amigorena (2001). "The cell biology of antigen presentation in dendritic cells." Curr Opin Immunol 13(1): 45-51.
Thery, C., L. Zitvogel and S. Amigorena (2002). "Exosomes: composition, biogenesis and function." Nat Rev Immunol 2(8): 569-579.
Tsang, J. Y., J. G. Chai and R. Lechler (2003). "Antigen presentation by mouse CD4+ T cells involving acquired MHC class II:peptide complexes: another mechanism to limit clonal expansion?" Blood 101(7): 2704-2710.
Tzachanis, D., G. J. Freeman, N. Hirano, A. A. van Puijenbroek, M. W. Delfs, A. Berezovskaya, L. M. Nadler and V. A. Boussiotis (2001). "Tob is a negative regulator of activation that is expressed in anergic and quiescent T cells." Nat Immunol 2(12): 1174-1182.
152
Vanherberghen, B., K. Andersson, L. M. Carlin, E. N. Nolte-'t Hoen, G. S. Williams, P. Hoglund and D. M. Davis (2004). "Human and murine inhibitory natural killer cell receptors transfer from natural killer cells to target cells." Proc Natl Acad Sci U S A 101(48): 16873-16878.
Veldhoen, M., R. J. Hocking, C. J. Atkins, R. M. Locksley and B. Stockinger (2006). "TGFbeta in the context of an inflammatory cytokine milieu supports de novo differentiation of IL-17-producing T cells." Immunity 24(2): 179-189.
Verheust, C., M. Goossens, K. Pauwels and D. Breyer (2012). "Biosafety aspects of modified vaccinia virus Ankara (MVA)-based vectors used for gene therapy or vaccination." Vaccine 30(16): 2623-2632.
Vigorito, E., S. Bell, B. J. Hebeis, H. Reynolds, S. McAdam, P. C. Emson, A. McKenzie and M. Turner (2004). "Immunological function in mice lacking the Rac-related GTPase RhoG." Mol Cell Biol 24(2): 719-729.
Vincent, S., P. Jeanteur and P. Fort (1992). "Growth-regulated expression of rhoG, a new member of the ras homolog gene family." Mol Cell Biol 12(7): 3138-3148.
Wennerberg, K. and C. J. Der (2004). "Rho-family GTPases: it's not only Rac and Rho (and I like it)." J Cell Sci 117(Pt 8): 1301-1312.
Wu, W., F. Chen, Z. Liu and Y. Cong (2016). "Microbiota-specific Th17 Cells: Yin and Yang in Regulation of Inflammatory Bowel Disease." Inflamm Bowel Dis 22(6): 1473-1482.
Yokosuka, T., W. Kobayashi, K. Sakata-Sogawa, M. Takamatsu, A. Hashimoto-Tane, M. L. Dustin, M. Tokunaga and T. Saito (2008). "Spatiotemporal regulation of T cell costimulation by TCR-CD28 microclusters and protein kinase C theta translocation." Immunity 29(4): 589-601.
Yokosuka, T. and T. Saito (2005). "[Structure and function of TCR]." Nihon Rinsho 63 Suppl 4: 315-320.
Yoshimoto, T., K. Yasuda, H. Tanaka, M. Nakahira, Y. Imai, Y. Fujimori and K. Nakanishi (2009). "Basophils contribute to T(H)2-IgE responses in vivo via IL-4 production and presentation of peptide-MHC class II complexes to CD4+ T cells." Nat Immunol 10(7): 706-712.
Zheng, W. and R. A. Flavell (1997). "The transcription factor GATA-3 is necessary and sufficient for Th2 cytokine gene expression in CD4 T cells." Cell 89(4): 587-596.
Zhou, G., Z. C. Ding, J. Fu and H. I. Levitsky (2011). "Presentation of acquired peptide-MHC class II ligands by CD4+ regulatory T cells or helper cells differentially regulates antigen-specific CD4+ T cell response." J Immunol 186(4): 2148-2155.

153
Zhu, J., L. Guo, B. Min, C. J. Watson, J. Hu-Li, H. A. Young, P. N. Tsichlis and W. E. Paul (2002). "Growth factor independent-1 induced by IL-4 regulates Th2 cell proliferation." Immunity 16(5): 733-744.
Zhu, J., D. Jankovic, A. Grinberg, L. Guo and W. E. Paul (2006). "Gfi-1 plays an important role in IL-2-mediated Th2 cell expansion." Proc Natl Acad Sci U S A 103(48): 18214-18219.
Zhu, J., H. Yamane and W. E. Paul (2010). "Differentiation of effector CD4 T cell populations (*)." Annu Rev Immunol 28: 445-489.
Zinkernagel, R. M. and P. C. Doherty (1997). "The discovery of MHC restriction." Immunol Today 18(1): 14-17.
Zitvogel, L., A. Regnault, A. Lozier, J. Wolfers, C. Flament, D. Tenza, P. Ricciardi-Castagnoli, G. Raposo and S. Amigorena (1998). "Eradication of established murine tumors using a novel cell-free vaccine: dendritic cell-derived exosomes." Nat Med 4(5): 594-600.
Copyright © 2022 FDOKUMEN